1. Introduction
Artificial intelligence (AI) is revolutionizing the field of dentistry, offering new tools that can automate diagnostic processes, streamline clinical workflows, and enhance patient outcomes [
1]. Over the past decade, AI-driven applications have made significant progress, particularly in the realm of image analysis, where tasks such as segmentation, classification, and anomaly detection have traditionally required manual input from dental professionals [
2,
3]. These AI technologies, especially machine learning (ML) and its subset deep learning (DL), are now capable of identifying intricate patterns within dental radiographs, providing faster and more accurate assessments of dental conditions. As a result, AI applications have the potential to significantly reduce human error, improve the efficiency of dental diagnostics, and contribute to personalized, preventive, and predictive dentistry [
4]. In addition, AI can be integrated into 2D or 3D image processing workflows for segmentation of hard tissues and other structures, uni- or multi-modal registration, image enhancement and tomographic reconstruction [
5,
6]. Despite these advancements, however, the adoption of AI in routine clinical practice has been relatively slow, hindered by challenges such as data limitations, ethical concerns, and the lack of transparency in AI models [
3].
A crucial barrier to the implementation of AI in dental radiography is the scarcity of high-quality annotated data, which is essential for training robust AI models. Dental radiographs, such as panoramic radiographs, contain complex anatomical structures that require precise annotation, and collecting and curating large-scale datasets is both time-consuming and resource-intensive [
7]. Moreover, the ethical implications of using AI-generated data in healthcare are significant and must be carefully considered [
3]. Issues related to data privacy, patient consent, and data sharing between institutions complicate the availability of large datasets for training AI models in dentistry [
2]. In recent years, generative adversarial networks (GANs)[
8] have emerged as a powerful solution to overcome data limitations. GANs consist of two competing neural networks: a generator, which creates synthetic images, and a discriminator, which evaluates their authenticity. Through an iterative process, the generator improves its ability to produce realistic images that are increasingly indistinguishable from real data. GANs, by generating diverse synthetic yet realistic data, could supplement existing datasets and address the data scarcity and patient privacy problem in medical and dental fields. The ability to generate realistic synthetic data can also be useful in clinical education, as this data can be tailored to reflect a wide range of anatomical variations and pathologies. This customization would enable a more individualized teaching approach, allowing to target certain weaknesses or focus areas in an automated and student-specific manner.
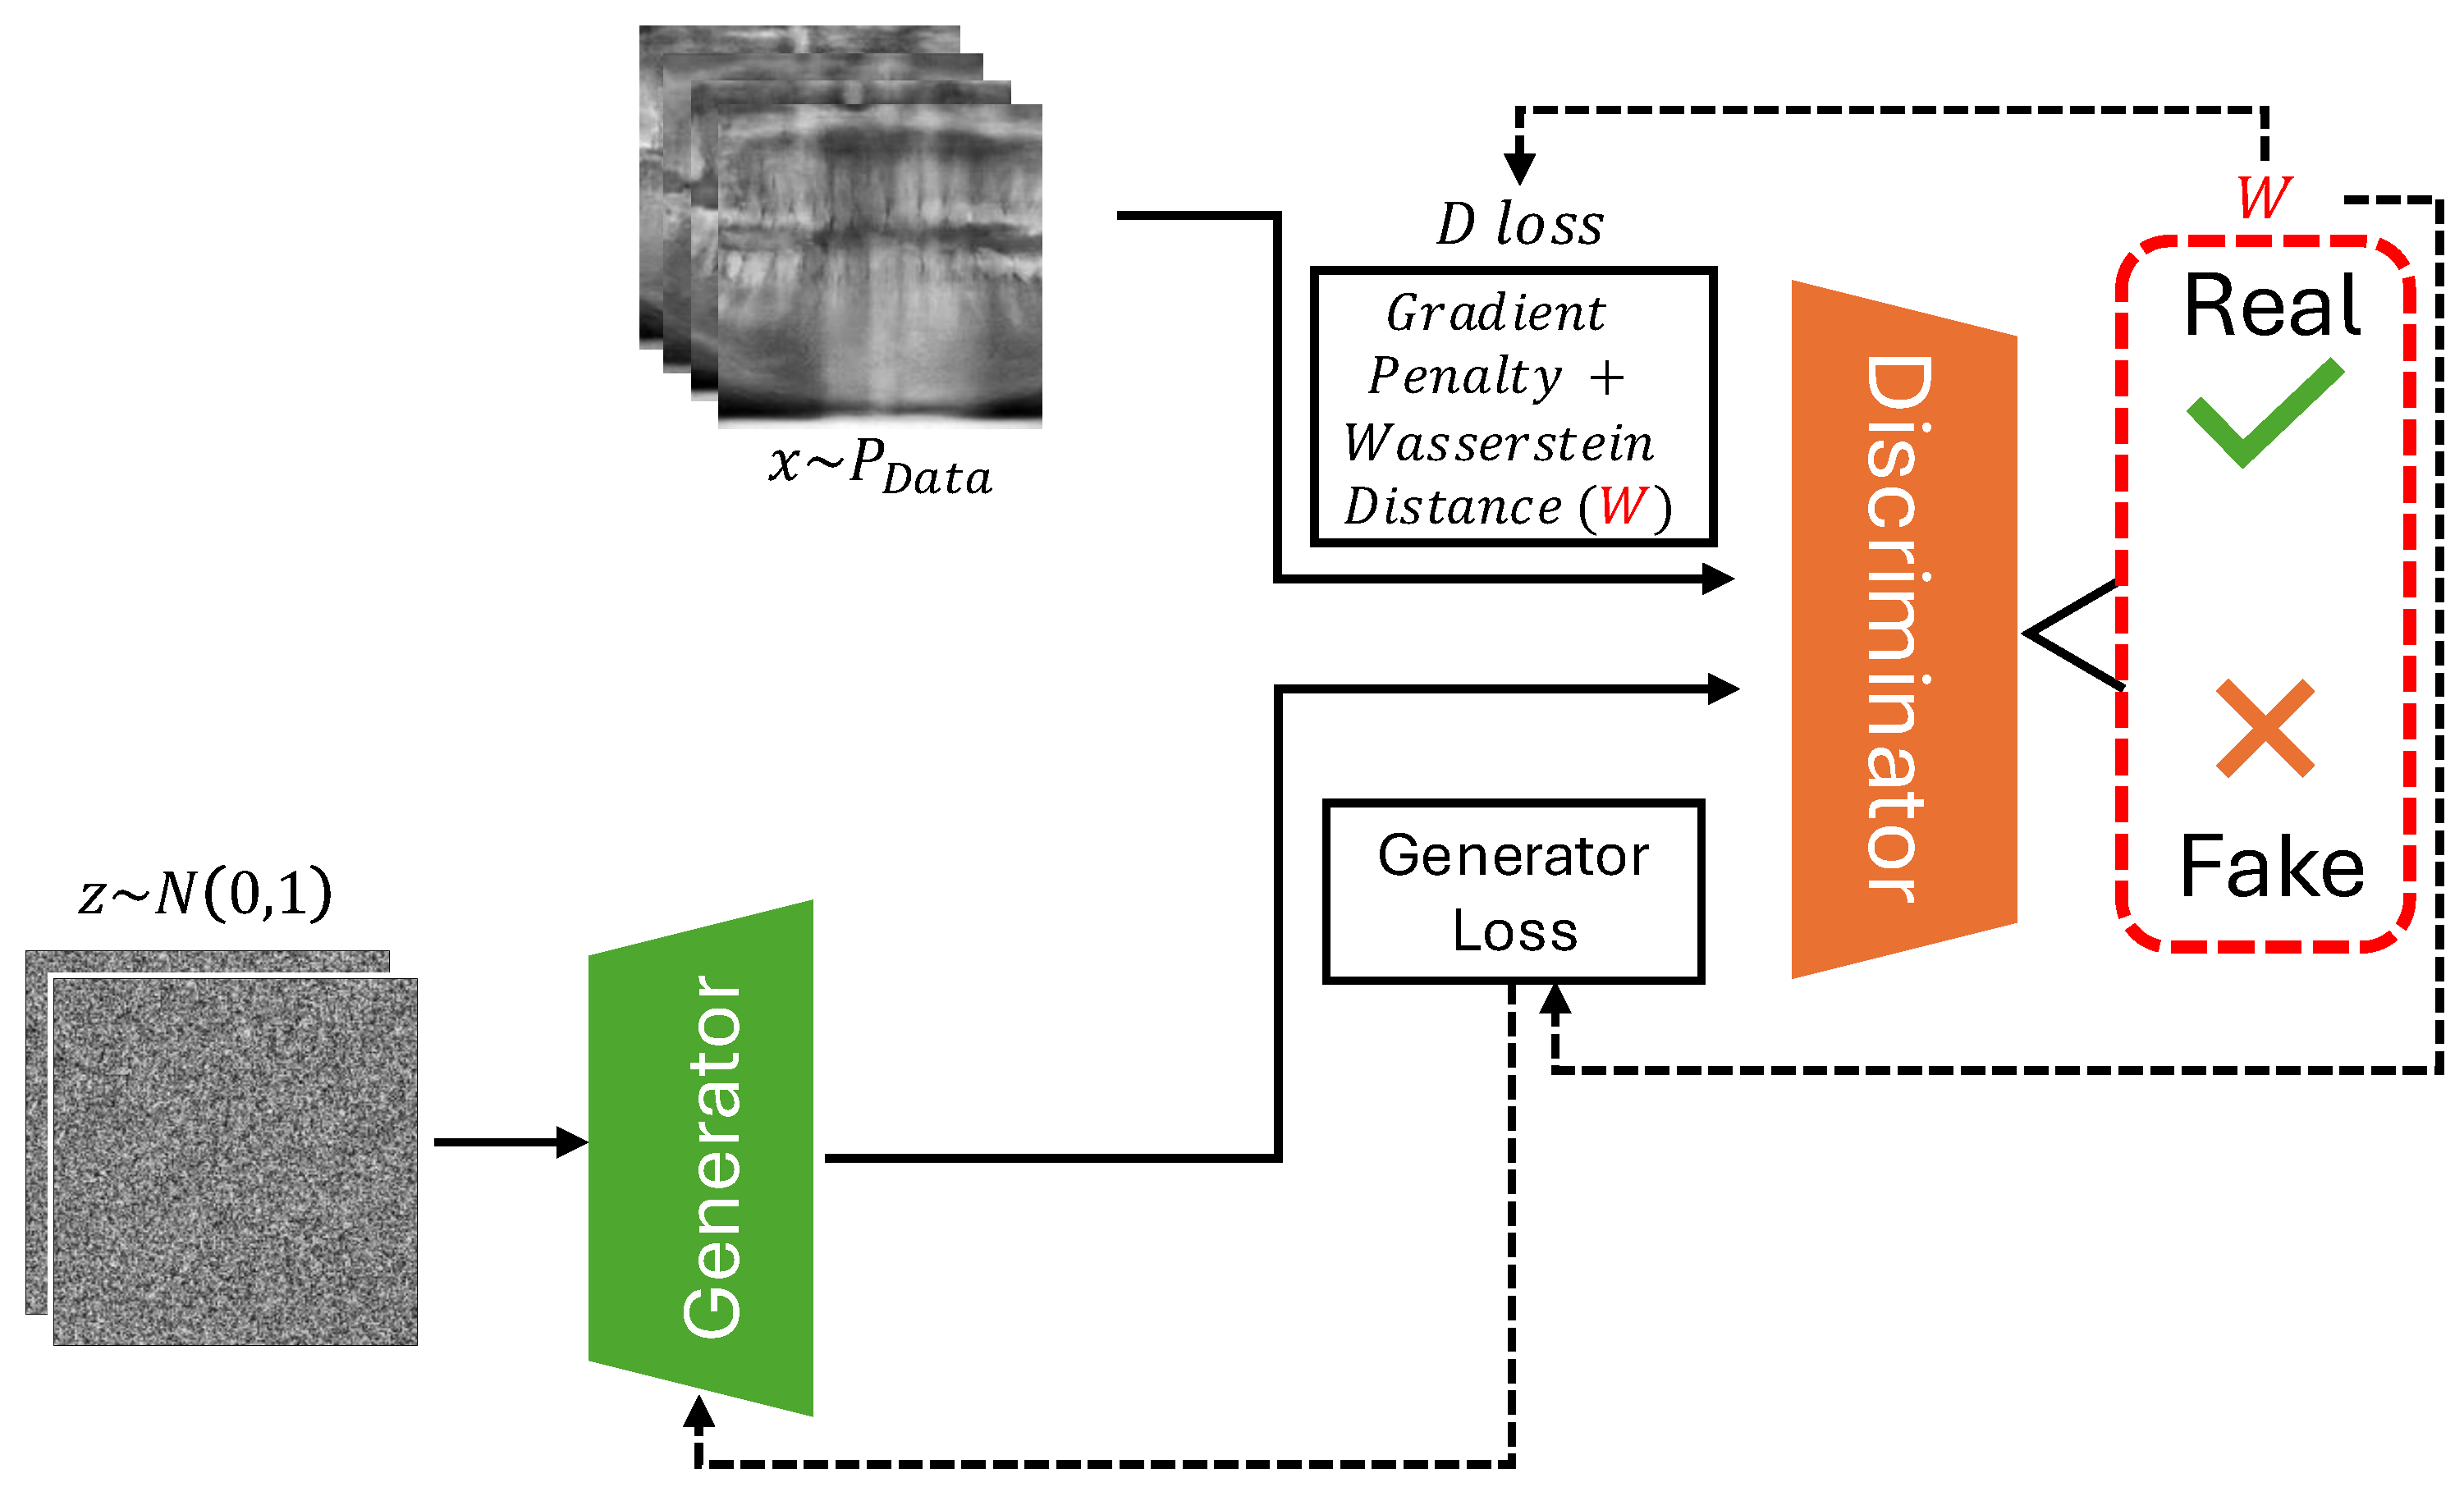
In this study, we utilize a Deep Convolutional GAN (DCGAN) architecture, enhanced by the Wasserstein Loss with Gradient Penalty (WGAN-GP), to generate synthetic panoramic radiographs (
Figure 1). The Wasserstein GAN (WGAN) introduces stability to the GAN training process by addressing common issues such as mode collapse and training instability, making it particularly well-suited for generating high-quality medical images [
9]. Panoramic radiographs were selected as a use case, as they are commonly used in dentistry for the diagnosis of dental and maxillofacial conditions. Furthermore, they are relatively standardized in terms of anatomical depiction, showing the entire dentoalveolar region centralized on the image, along with adjacent structures such as the maxillary sinus and temporomandibular joint. Previous work involving DL and panoramic radiographs has focused on automatic segmentation and detection models, which have been used to interpret panoramic X-rays for various clinical purposes [
10,
11,
12,
13]. Most of these studies involve datasets that are limited in size, showing the potential of making these models more performant and generalizable through the addition of synthetic data.
In the following sections we provide related work, methods, results and discussions. We finally conclude the paper with results including generated images and evaluation plots.
2. Related Work
GANs have been extensively studied for generating high-quality synthetic data across various fields, including medical imaging and dentistry. However, GANs suffer from instability during training, frequently encountering issues such as mode collapse and vanishing gradients. To address these shortcomings, WGAN was proposed [
9], which introduced a more robust training objective by using the Wasserstein distance (also known as Earth Mover’s Distance) as a measure of how different the generated data distribution is from the real data distribution.
2.1. Wasserstein GAN with Gradient Penalty (WGAN-GP)
One of the key improvements to WGAN was introduced by Gulrajani et al. [
14]. While the original WGAN used weight clipping to enforce the Lipschitz continuity condition (required for the Wasserstein distance), this method introduced new problems, such as poor optimization performance. WGAN-GP solves this by applying a gradient penalty to the discriminator’s loss function, ensuring that the gradients of the discriminator are close to 1 around the real and generated data points, which is necessary for proper training stability. The WGAN-GP loss function is defined as:
where
x is sampled from the real data distribution
,
is sampled from the generated data distribution
, and
is sampled from a uniform distribution along straight lines between points in
and
. The third term,
, enforces the gradient penalty, with
controlling the strength of the penalty.
This gradient penalty replaces weight clipping and ensures that the discriminator remains within the 1-Lipschitz constraint, which is crucial for measuring the Wasserstein distance effectively. By using the gradient penalty, WGAN-GP improves training stability and convergence, allowing it to generate higher-quality images more consistently than other GANs.
2.2. Relevance of WGAN-GP to Our Work and Comparison with Other GANs
In this study, we have selected WGAN-GP due to its robustness in training and ability to manage high-dimensional, complex image data, such as dental panoramic radiographs. Dental X-rays contain intricate structures that necessitate the generation of highly detailed and accurate images. The stability of WGAN-GP allows the generator to learn to produce such detailed features without suffering from common issues associated with traditional GAN architectures, including mode collapse and poor gradient flow. The incorporation of a gradient penalty helps mitigate the problems of vanishing or exploding gradients, which are detrimental to the fine details needed in medical imaging. Furthermore, WGAN-GP excels in generating high-resolution images, stabilizing the training process and making it particularly suited for medical applications like dental radiography, where realism and accuracy are critical. In contrast, traditional GANs and even WGANs with weight clipping often struggle to produce stable gradients, especially in datasets with high variability, such as our dental X-ray dataset. Various other GAN variants, like LSGAN [
15], utilize a least-squares loss function to reduce the vanishing gradient problem but fail to effectively address mode collapse. Similarly, DCGANs [
16] introduce convolutional layers for enhanced image generation yet still face instability in complex tasks like generating panoramic dental X-rays. WGAN-GP, however, not only addresses the vanishing gradient and mode collapse issues but also ensures higher fidelity in the generated images through the use of Wasserstein distance and gradient penalty. These improvements are especially crucial in the context of dental radiography, where image quality is paramount. Other architectures, such as Progressive GANs [
17], may enhance image quality further but often require more computational resources and longer training times.
3. Methods
Data: The dataset consisted of 2322 dental panoramic radiographs from the MICCAI-DENTEX (Dental Enumeration and Diagnosis on Panoramic X-rays) Challenge [
18]. The dataset is made available under a CC BY-SA 4.0 License. It consist of images from various panoramic radiography machines (from different manufacturers), varying in image quality and resolution. A custom transformation pipeline was implemented to preprocess the X-ray images before they were fed into the model. This involved a custom cropping function focusing on the bottom-center part of each image, representing the dentoalveolar region. In other words, the focus of this exploratory study was to generate partial panoramic radiographs containing teeth and adjacent bone structures, but not the temporomandibular joint, maxillary sinus, or other anatomical regions found on a full-sized panoramic radiograph. After cropping, the cropped images were resized, and converted to 8 bit grayscale with normalized pixel values, which helps in stabilizing the training process.
Architecture: The WGAN-GP was implemented to address the challenges of training stability and image quality in our project. The core of the WGAN-GP architecture is based on the Wasserstein distance
, which is defined as:
where
denotes the set of all joint distributions with specified marginals
(real data distribution) and
(generated data distribution). A key aspect of our implementation is the gradient penalty, which is computed as:
where
D is the critic network, and
is the interpolated image between real and generated samples. This penalty encourages the gradients of the critic to have a norm close to 1, thereby stabilizing training.
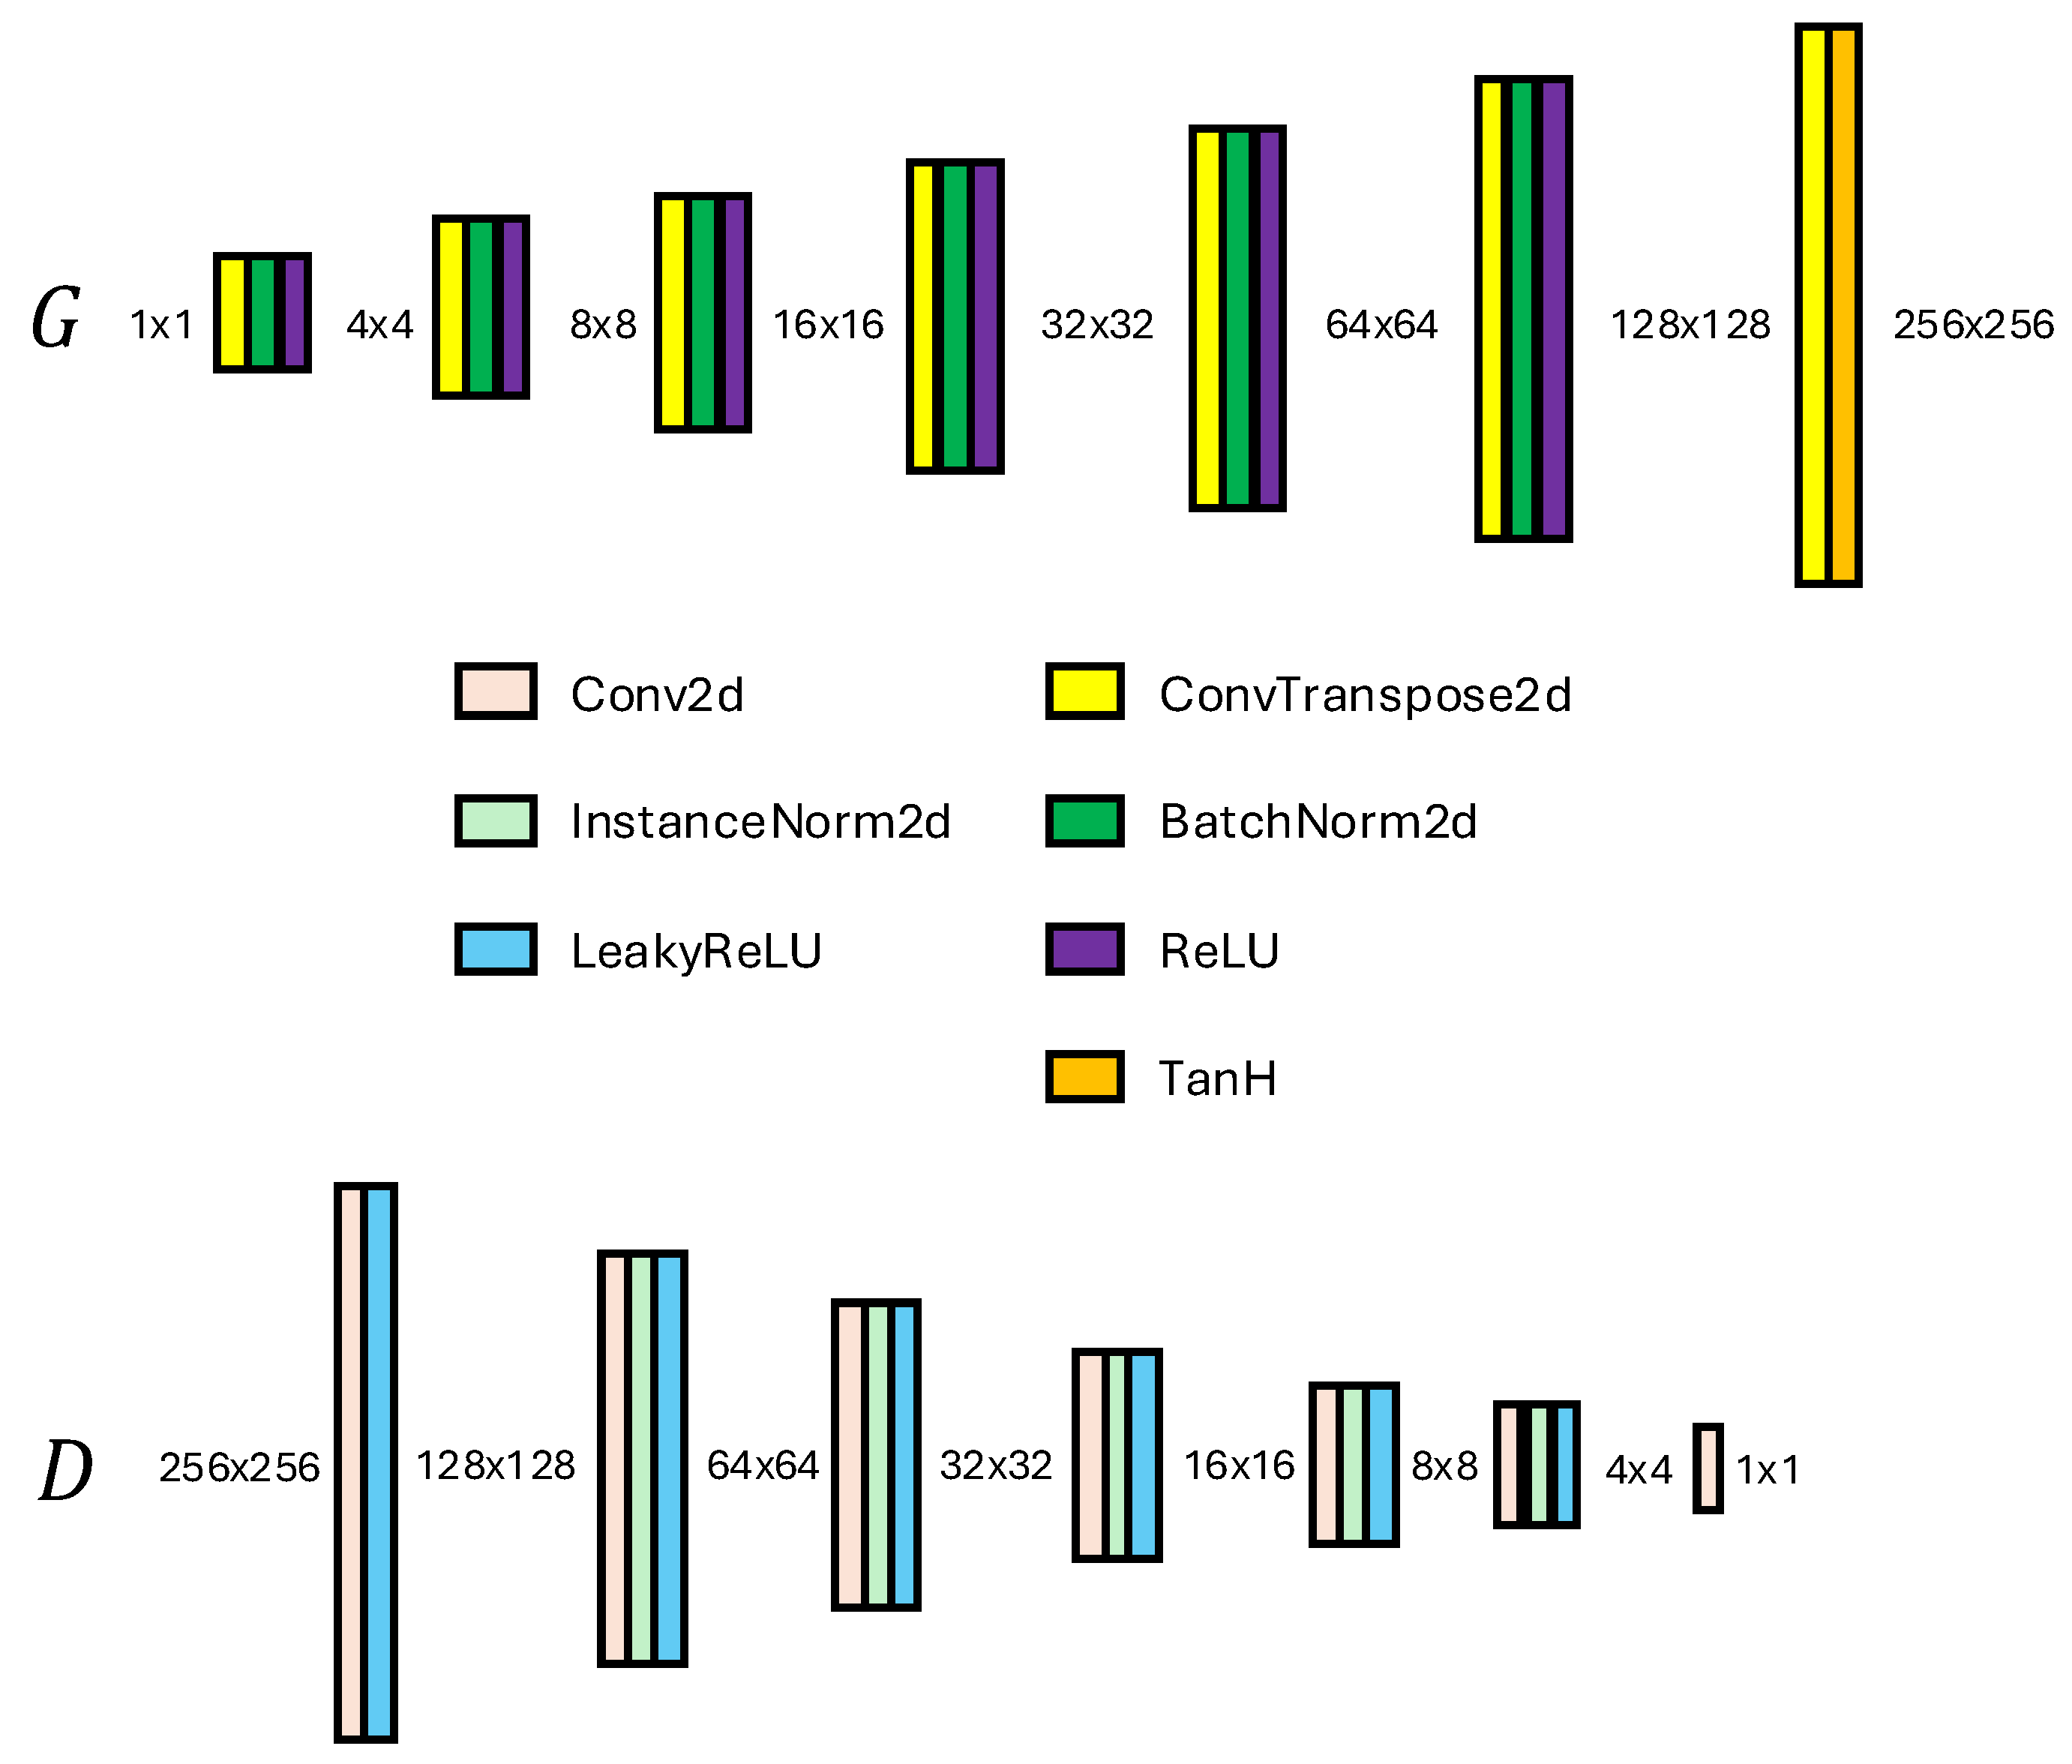
The architecture of both the generator and discriminator is crucial for achieving high-quality image generation. The Discriminator is implemented as a convolutional neural network consisting of several layers, where each layer applies convolutional operations followed by activation functions and normalization. Specifically, the network progressively reduces the spatial dimensions of the input image
to produce a single scalar output representing the critic’s score
:
where Disc denotes the sequential layers of the Discriminator. The Generator, on the other hand, is designed to upsample a noise vector
into a high-resolution image
using transposed convolutional layers. The final output is generated using the following operation:
culminating in a tanh activation function to produce images in the range of
. The implemented Generator and Discriminator networks are shown in
Figure 2. The use of batch normalization and ReLU activations contributes to the stability and quality of the generated images, ensuring that the generator effectively learns to replicate the complex structures found in dental radiographs.
Implementation: We implement four different models using the same overall architecture shown above. One essential difference between the models is found in the use of denoising prior to training. Model 1 was trained on the original dataset without any denoising applied, while Models 2, 3, and 4 were trained using images denoised with anisotropic diffusion (AD) [
19]. The denoising level applied to Models 2-4 follows the default implementation of AD for FIJI [
20]. The training set for Models 2-4 was also narrowed down to 1800 images by manually screening the initial dataset for images of poor quality. Furthermore, the number of critic iterations was varied in an attempt to optimize the balance between generator and discriminator performance. Finally, the number of epochs was varied. The configuration for the models is outlined in
Table 1.
Expert evaluation: For each of the four models, 25 generated radiographs were evaluated by a dentist with 9 years of experience, including a Master’s Degree in Oral Rehabilitation and a specialty course in Dentomaxillofacial Radiology. The evaluation was performed on an interleaved pooled dataset of 100 generated images, in batches of 20 images per session to avoid fatigue. A specific scoring system was developed for this study, using a five-point scale for twelve criteria, ranging from overall realism to specific anatomical features. The criteria were:
Overall Realism.
Clarity and Sharpness.
Tooth Anatomy: The depiction of crowns and roots.
Jaw and Bone Structure: depiction of the cortical bone and trabecular bone.
Alignment and Symmetry of teeth and jaws, focusing on the bone shape and the visualization of the occlusal space.
Absence of Artifacts that detract from the realism.
Other Landmarks: visualization of the mandibular canal and hard palate.
Each criterion was assessed in terms of its representation vis-à-vis real-world panoramic radiographs. The scoring system was defined from 1 to 5, where 1 indicates a poor or highly unrealistic generation, and 5 signifies excellent or highly realistic qualities. Prior to the observation, the expert got familiar with the scoring system by applying it to a separate set of 10 generated images.
4. Results
The overall distribution of expert scores is shown in
Table 2. Model 1 showed the highest average score for four criteria, whereas Model 2 showed the highest score for eight criteria (including one tied score with Model 4). A statistical evaluation of the scores is presented in
Appendix A.
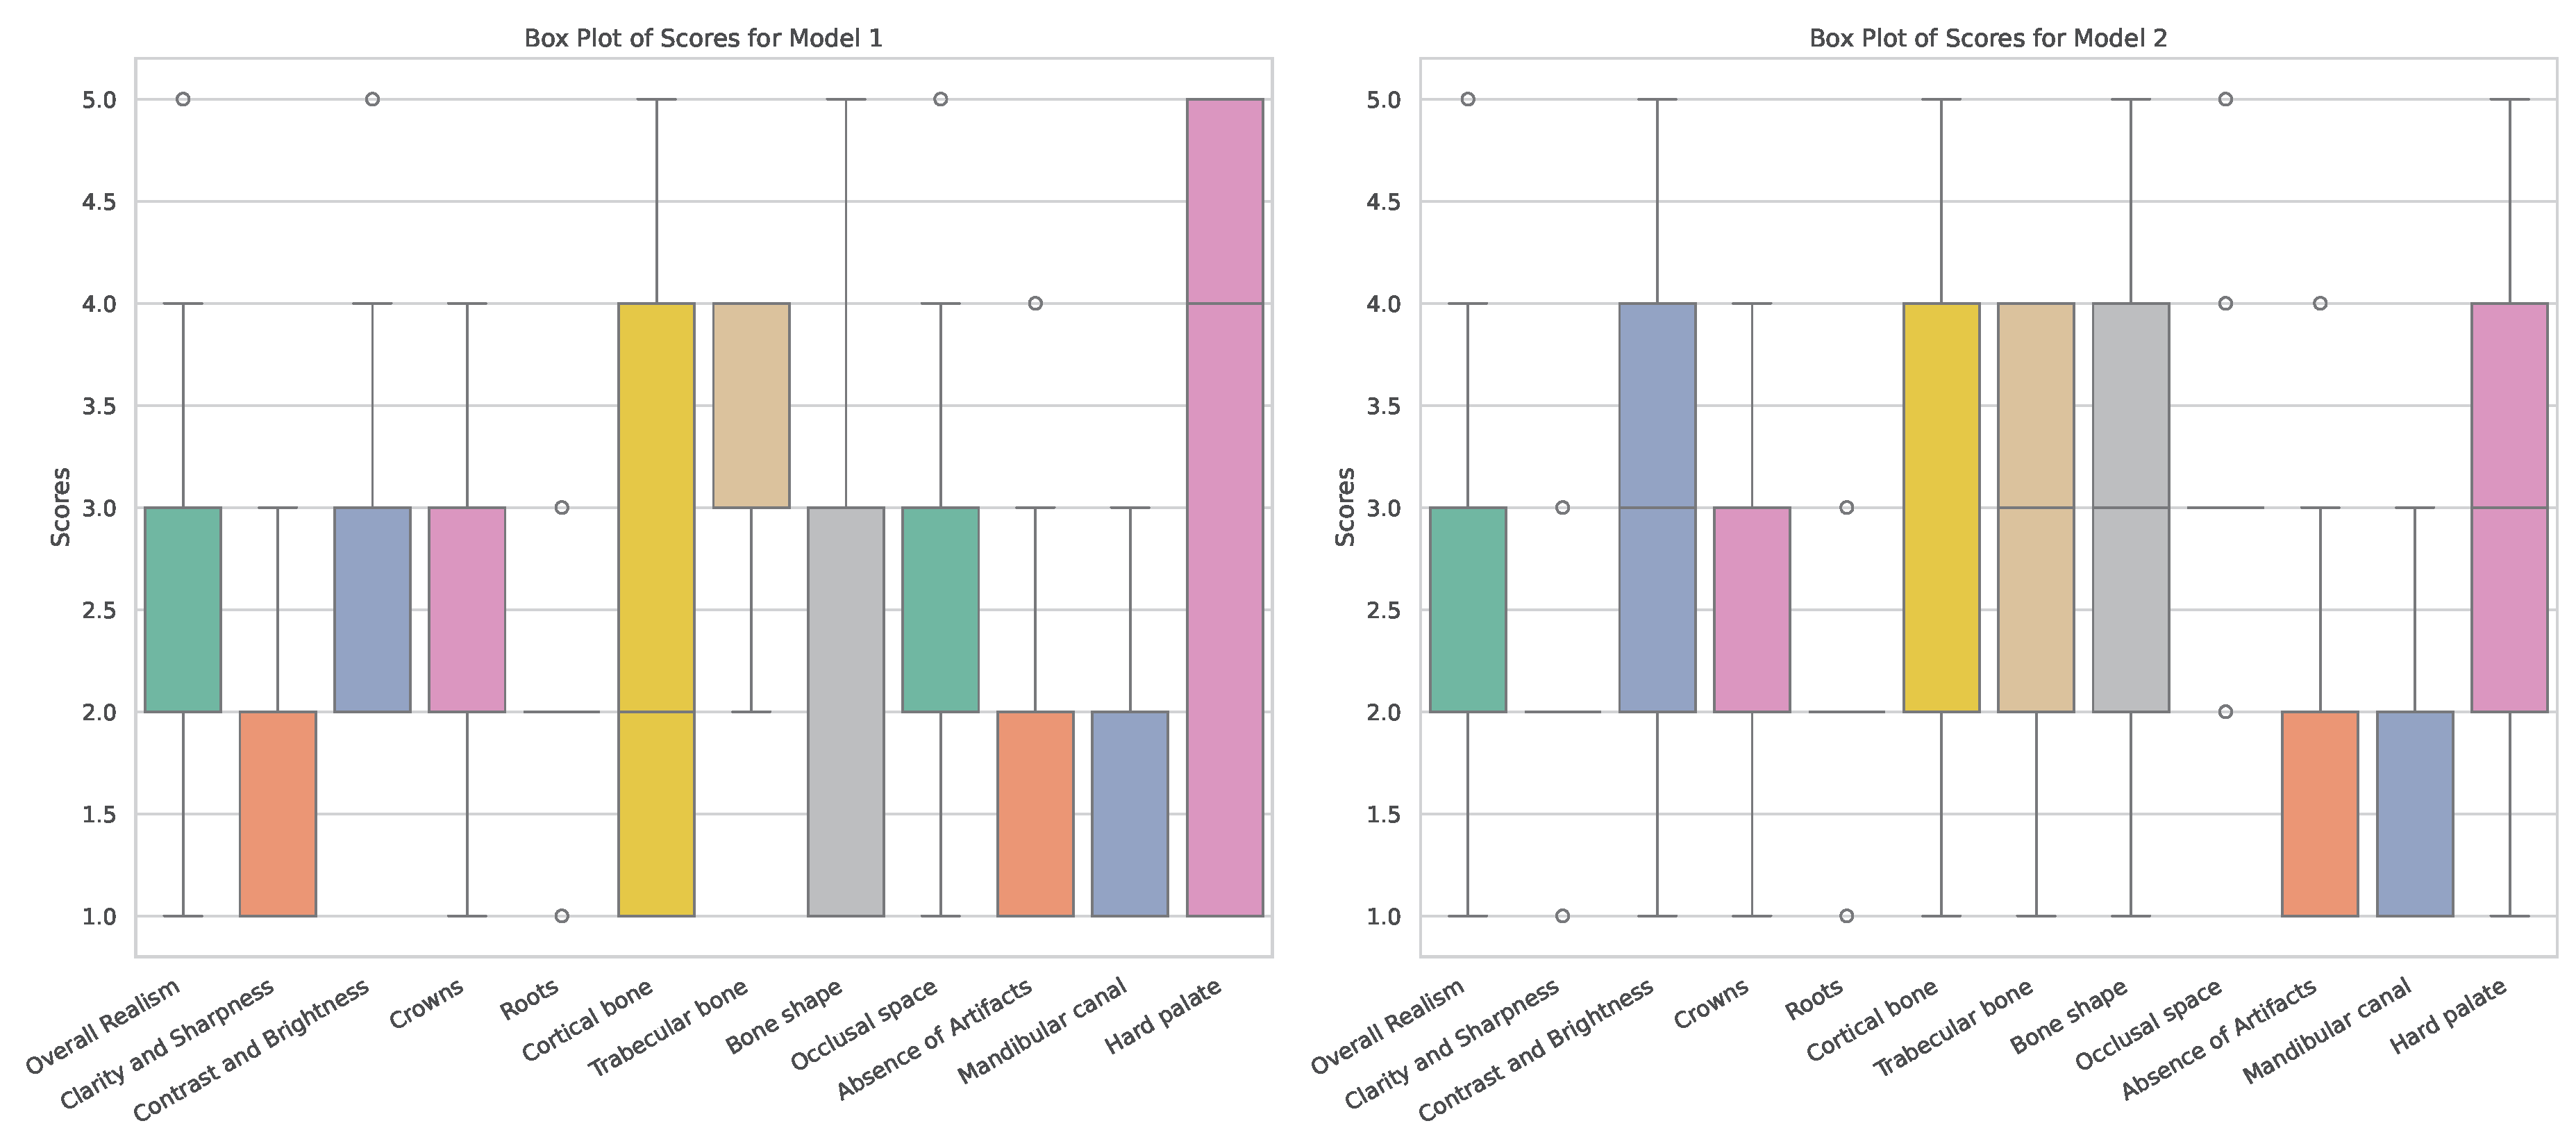
Based on these findings, the scores for Model 1 and 2 are presented in more detail. As stated earlier, the main difference between these models is whether they were trained on original radiographs (Model 1) or denoised ones (Model 2). Boxplots showing the distribution of expert scores are shown in
Figure 3. It can be seen that, for most metrics, scores ranged between 1 and 5; the most notable exceptions were
Clarity and Sharpness,
Roots and
Absense of Artifacts (for which scores did not surpass 3). Furthermore, differences in the width of score distributions can be observed for various criteria, showing more consistent outputs for one of the models (for better or worse).
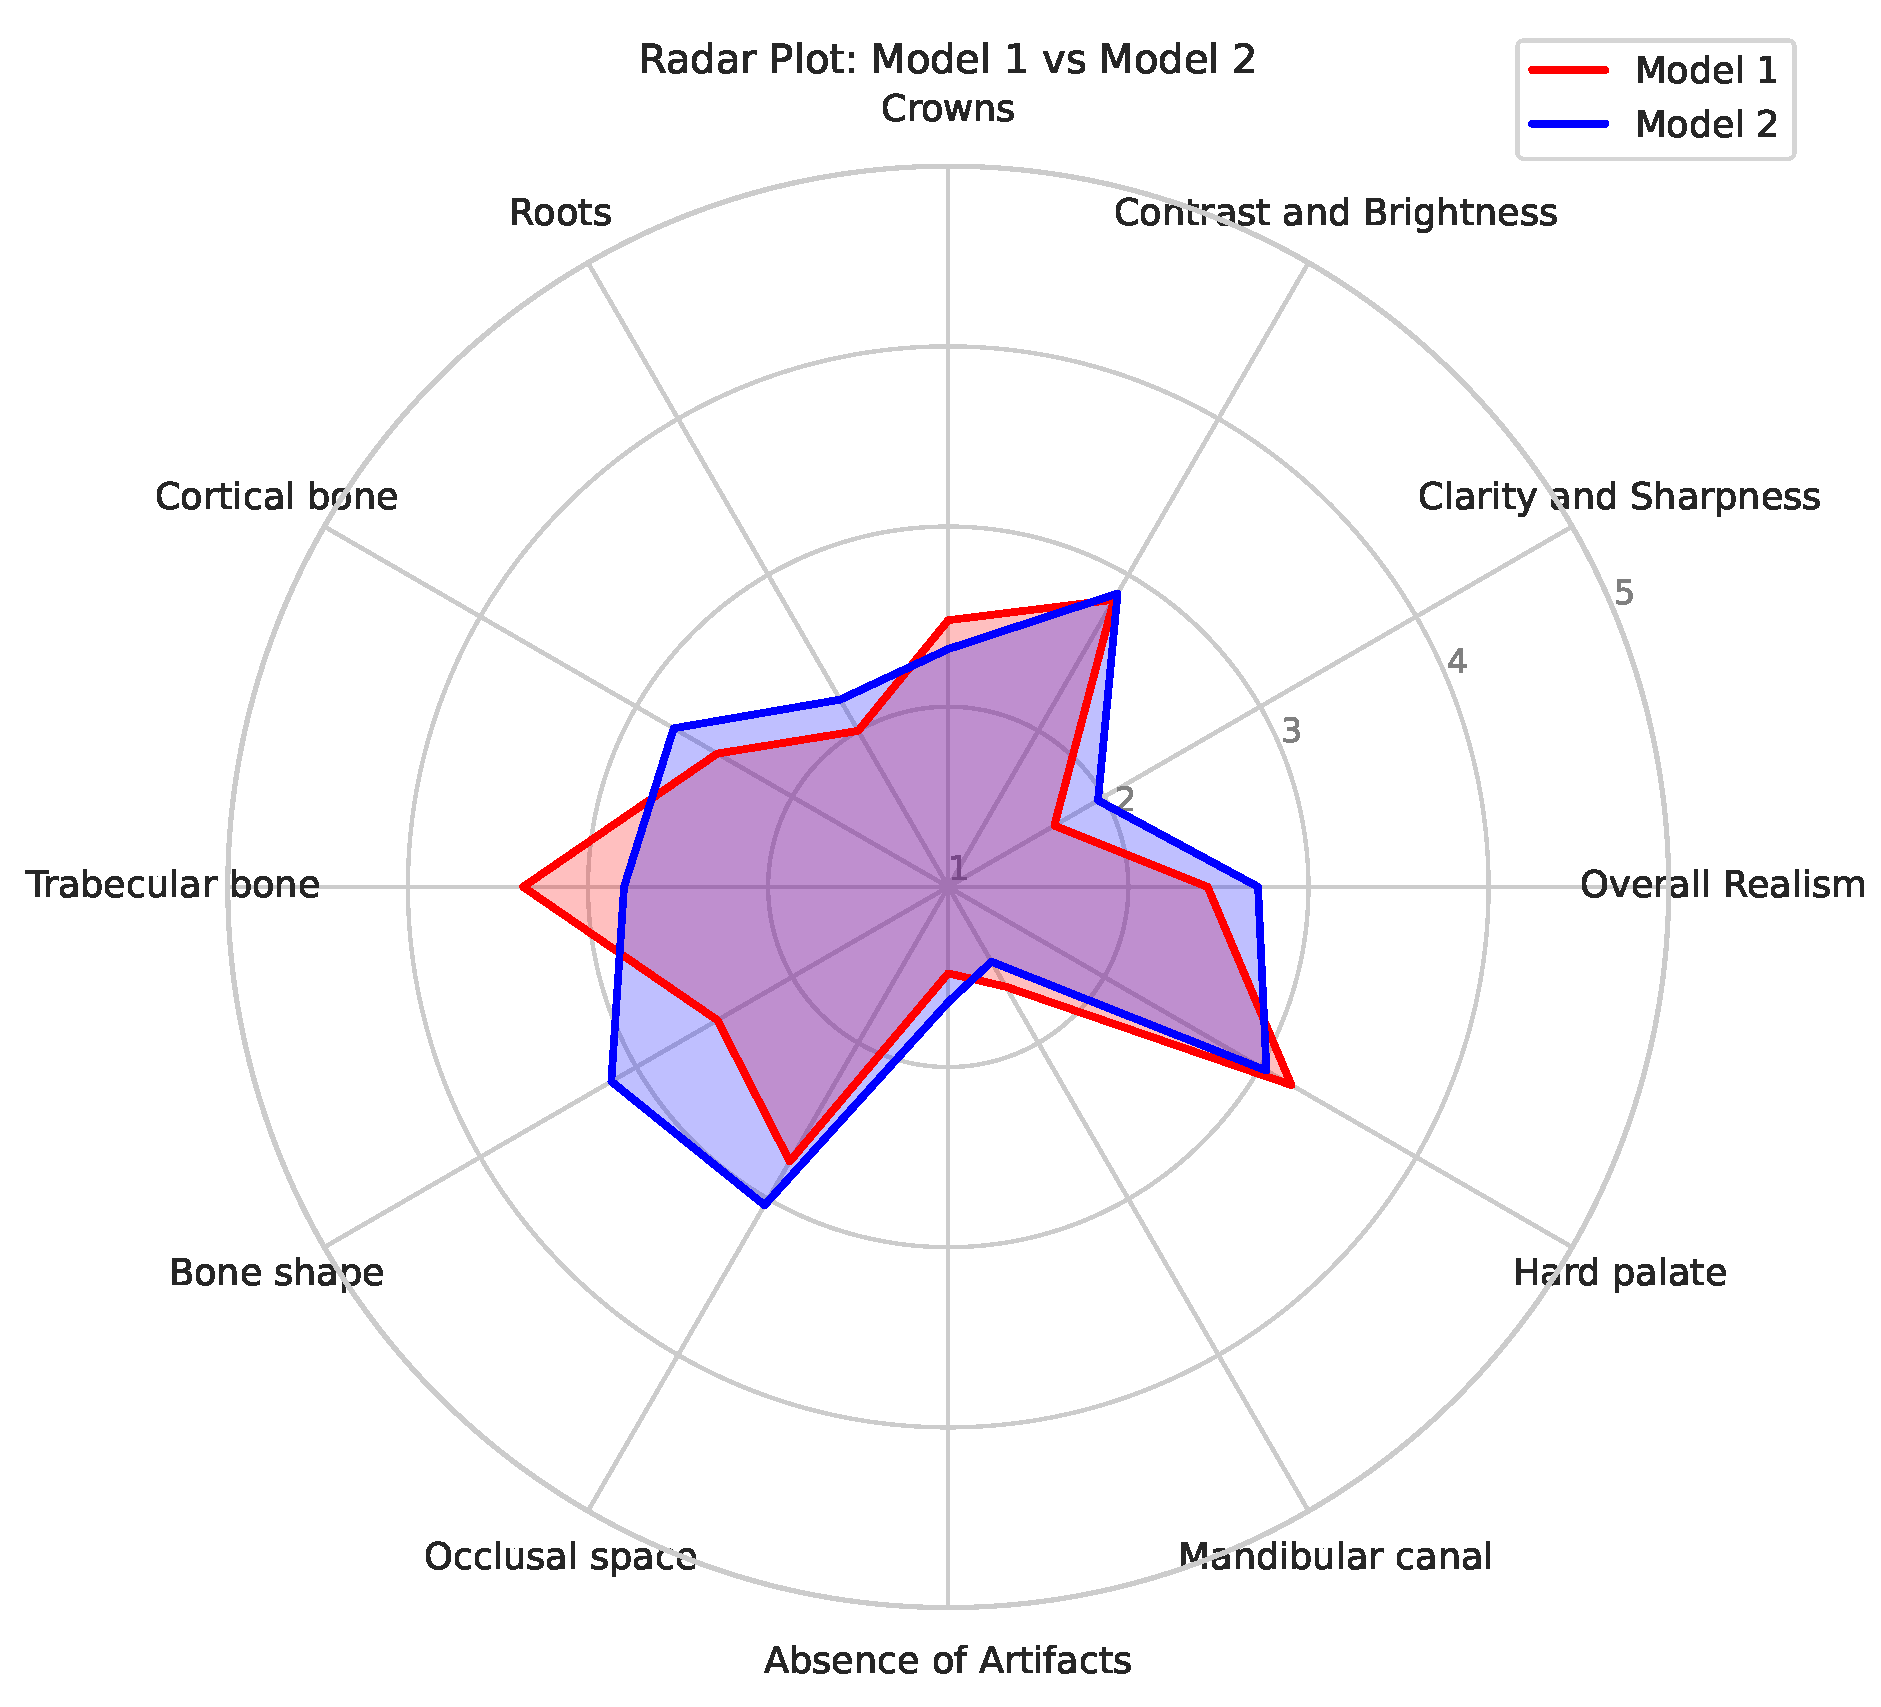
Figure 4 shows a radar plot of the average scores for the two models, allowing for a convenient comparison of their relative performance. It can be seen that Model 1 mainly outperformed Model 2 for
Trabecular bone; this is likely related to the denoising used for the input data of Model 2, causing some degree blurring of small structures such as trabeculae. On the other hand, Model 2 showed higher scores for
Bone shape in particular, and for
Cortical bone,
Clarity and Sharpness,
Occlusal space and
Overall Realism to some extent; this indicates that the absense of noise allowed for a improved generation of larger structures as well as representing the typical image quality of a panoramic radiograph (somewhat) better.
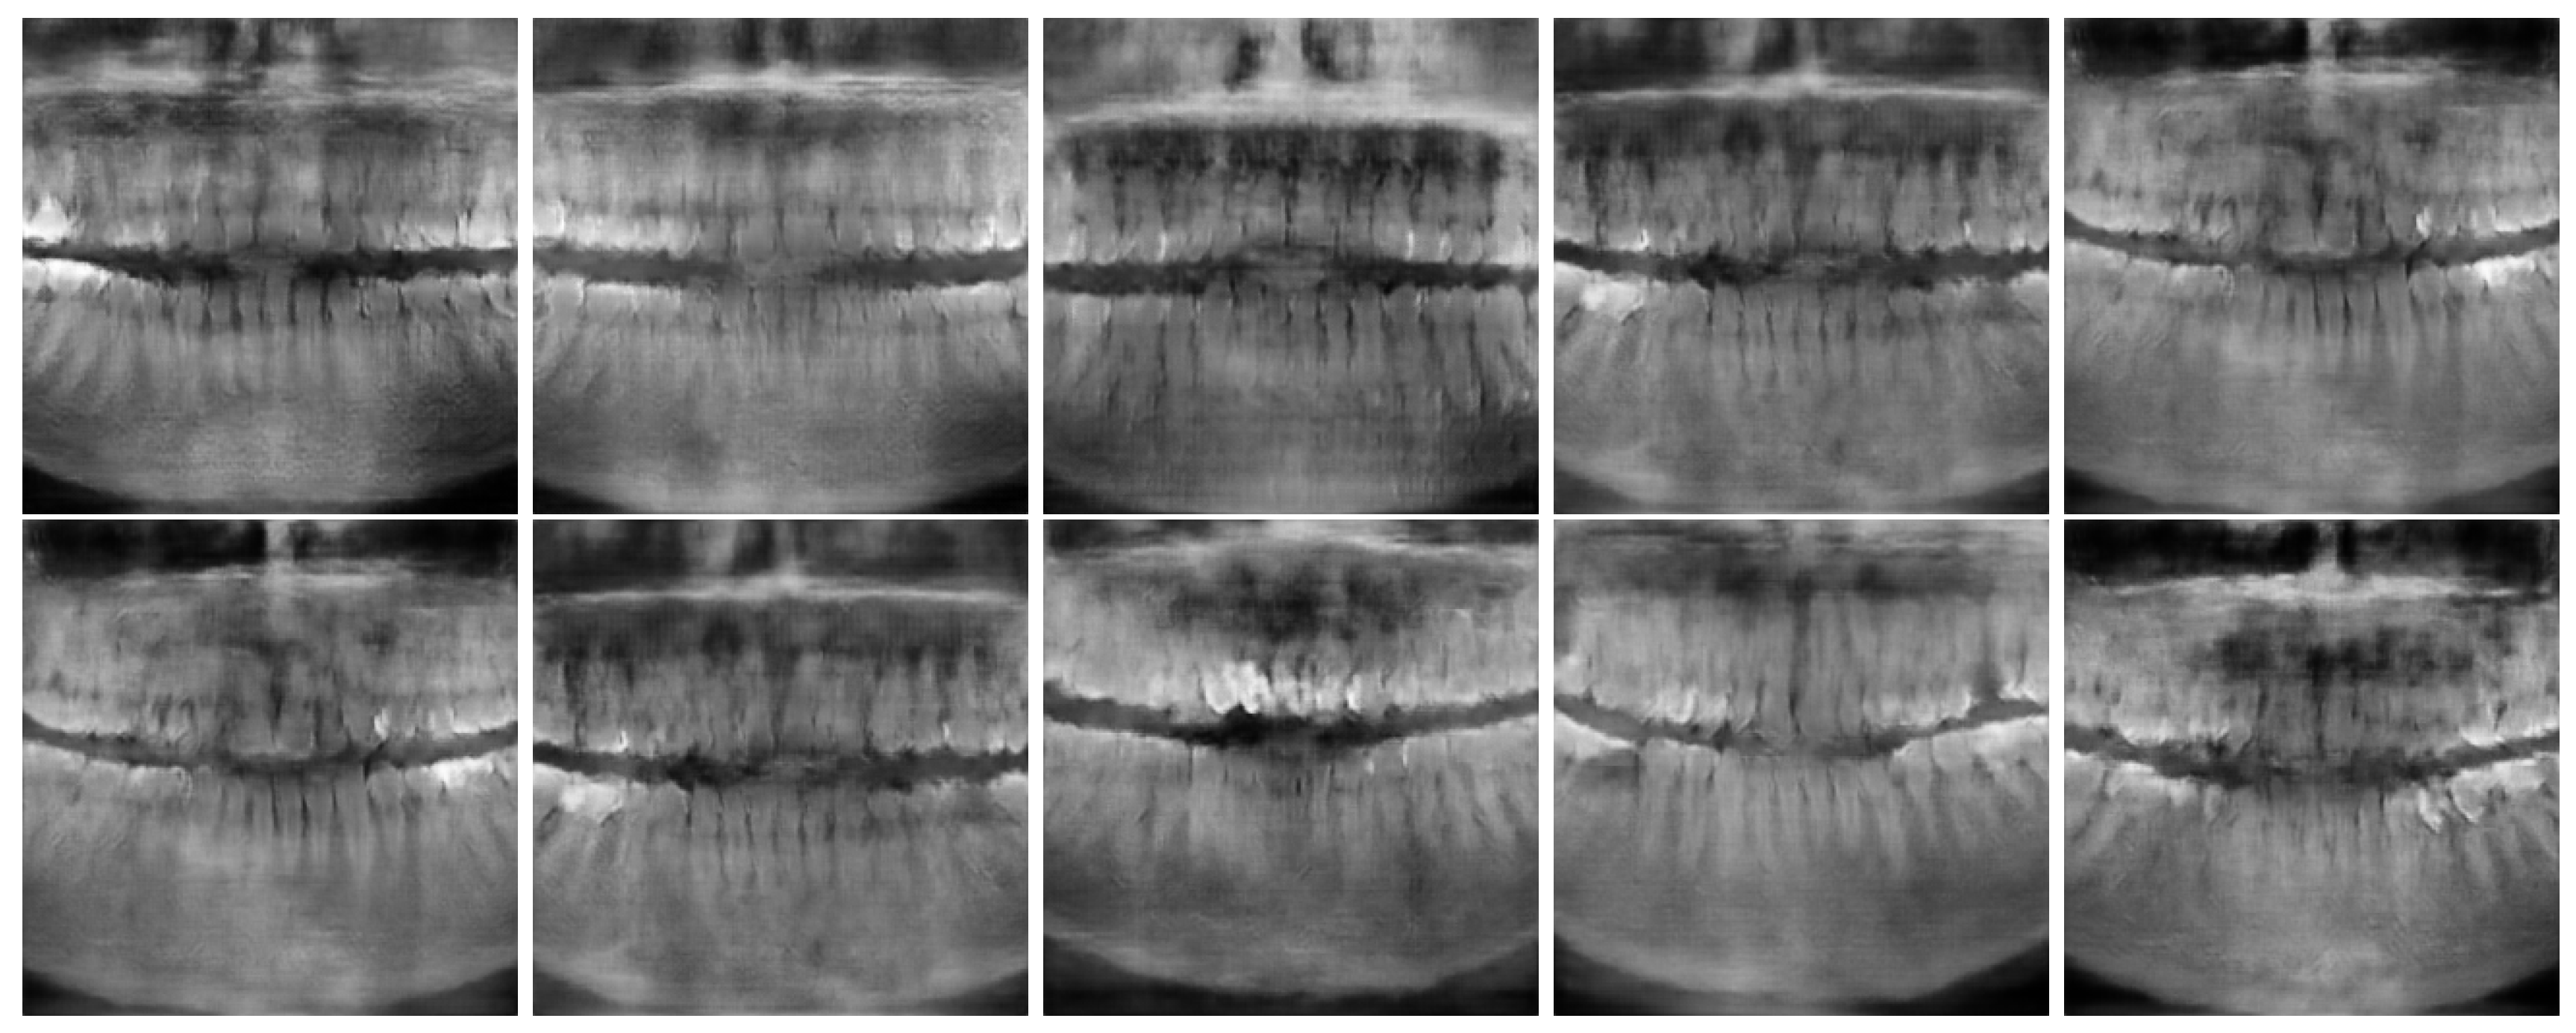
Figure 5 and
Figure 6 show the best and worst generated images, respectively, as determined by the average score for all twelve criteria. The best images show a reasonable depiction of both overall morphology and certain details, although not at the level of contemporary real-world panoramic radiographs. The worst images display various issues, including a poor overall image quality and manifestations of extra rows of tooth crowns.
5. Discussion
In this exploratory study, the potential of GANs to generate synthetic dental panoramic radiographs was investigated by implementing a DCGAN with Wasserstein Loss and Gradient Penalty (WGAN-GP). The ultimate aim is to produce synthetic images that could support predictive modeling and educational purposes, in order to address the critical issue of data scarcity in dental research and teaching. Although the generated images did not meet the standards of realism and clarity for real-life implementation quite yet, the project’s findings emphasize the importance of GANs as a viable tool for enhancing the availability of medical imaging data. This study can be considered as an initial endeavour that is likely to lead to further advancements in this field of research.
Using a dedicated scoring system for synthetic panoramic radiographs, the overall evaluation showed that the images achieved varied levels of realism, with many exhibiting acceptable clarity and anatomical details, but also indicating certain areas for improvement. Scores were assigned based on the specific features visible in each image. The results highlight both the strengths and limitations of the model’s ability to generate images that closely resemble true panoramic radiographs. At this stage, an observation approach in which a clinical expert acts as discriminator who judges whether images are real or fake was not yet considered, as this would require a significant improvement in generated image quality.
These findings suggest that further optimization of the GAN architecture and training methodology is necessary to achieve higher fidelity in synthetic image generation. This likely includes a substantial increase in training sample size, potentially requiring a multicenter approach. Particular focus should be on the fact that panoramic radiographs from different manufacturers exhibit varying image quality. While variations in brightness and contrast can be normalized to some extent, differences in sharpness and noise cannot be overlooked. Furthermore, the anatomical coverage for panoramic radiographs from different manufacturers varies to some extent; while all of these images cover, and are centered on, the dentoalveolar region, the lateral and cranial extent of the radiograph varies. This was not relevant for the current study, as the input data was cropped to the dentoalveolar region, but it will come into play when full-size panoramic radiographs would be generated.
Future work should also focus on approaches towards synthetic radiography that are less naive i.e. using pre-labeled data. For example, a panoramic radiograph can be segmented into teeth (with each tooth being numbered, and restorations being marked), bone(s), mandibular canal, maxillary sinus, etc. This would split up the generation into a number of separate tasks, possibly allowing for template-based image-to-image generation or even a text-to-image generation. Either approach would also allow for a degree of customization, including the insertion of various types of pathosis (e.g. caries, periapical lesions, root fractures, periodontal bone loss). Once this stage is reached, synthetic radiography can be implemented into personalized dental training as well as predictive model development. At this point, the ethical considerations surrounding the use of synthetic data in clinical settings become crucial, as this data should not introduce biases or compromise diagnostic (or other) accuracy. Once synthetic radiography reaches a level in which it can be integrated into the development of AI tools for diagnosis, segmentation or other tasks, further work will be needed to evaluate the optimal balance between synthetic and real data for training as well as benchmarking.
6. Conclusion
The use of a WGAN-GP for generating synthetic panoramic radiographs showed promise. The most likely bottleneck for model performance within this study was the training sample size; furthermore, the use of training data that is anatomically (and pathologically) labelled should be considered in future work.
Acknowledgments
RP acknowledges financial support by the Independent Research Fund Denmark, Project "Synthetic Dental Radiography using Generative Artificial Intelligence", grant ID 10.46540/3165-00237B.
Appendix A
Appendix A.1. Dunn’s Test
Dunn’s post hoc test was performed on the expert evaluation scores of the four Models, following significant results from the Kruskal-Wallis test. The p-values obtained from Dunn’s test are summarized in
Table A1:
Table A1.
Dunn’s Test Results (p-values) comparing Models 1-4. Values below 0.05 indicate a statistically significant difference in expert scores between models.
Table A1.
Dunn’s Test Results (p-values) comparing Models 1-4. Values below 0.05 indicate a statistically significant difference in expert scores between models.
| |
Model 1 |
Model 2 |
Model 3 |
Model 4 |
| Model 1 |
1.00000000 |
0.85579467 |
0.00003986 |
0.08296606 |
| Model 2 |
0.85579467 |
1.00000000 |
0.00000001 |
0.00051443 |
| Model 3 |
0.00003986 |
0.00000001 |
1.00000000 |
0.24624982 |
| Model 4 |
0.08296606 |
0.00051443 |
0.24624982 |
1.00000000 |
From the statistical evaluation, significant differences were observed between:
Model 1 and Model 3 (p = 0.00003986)
Model 2 and Model 3 (p = 0.00000001)
Model 2 and Model 4 (p = 0.00051443)
No significant differences were found between Model 1 and Model 2, Model 1 and Model 4, or Model 3 and Model 4.
References
- Pauwels, R. A brief introduction to concepts and applications of artificial intelligence in dental imaging. Oral radiology 2021, 37, 153–160. [Google Scholar] [CrossRef] [PubMed]
- Schwendicke, F.a.; Samek, W.; Krois, J. Artificial intelligence in dentistry: chances and challenges. Journal of dental research 2020, 99, 769–774. [Google Scholar] [CrossRef] [PubMed]
- Mörch, C.; Atsu, S.; Cai, W.; Li, X.; Madathil, S.; Liu, X.; Mai, V.; Tamimi, F.; Dilhac, M.; Ducret, M. Artificial intelligence and ethics in dentistry: a scoping review. Journal of dental research 2021, 100, 1452–1460. [Google Scholar] [CrossRef] [PubMed]
- Topol, E.J. High-performance medicine: the convergence of human and artificial intelligence. Nature medicine 2019, 25, 44–56. [Google Scholar] [CrossRef] [PubMed]
- Pauwels, R.; Iosifidis, A. Deep Learning in Image Processing: Part 1—Types of Neural Networks, Image Segmentation. In Artificial Intelligence in Dentistry; Springer, 2024; pp. 283–316. [Google Scholar]
- Pauwels, R.; Iosifidis, A. Deep Learning in Image Processing: Part 2—Image Enhancement, Reconstruction and Registration. In Artificial Intelligence in Dentistry; Springer, 2024; pp. 317–351. [Google Scholar]
- Hosny, A.; Parmar, C.; Quackenbush, J.; Schwartz, L.H.; Aerts, H.J. Artificial intelligence in radiology. Nature Reviews Cancer 2018, 18, 500–510. [Google Scholar] [CrossRef] [PubMed]
- Goodfellow, I.; Pouget-Abadie, J.; Mirza, M.; Xu, B.; Warde-Farley, D.; Ozair, S.; Courville, A.; Bengio, Y. Generative adversarial nets. Advances in neural information processing systems 2014, 27. [Google Scholar]
- Arjovsky, M.; Chintala, S.; Bottou, L. Wasserstein generative adversarial networks. In Proceedings of the International conference on machine learning. PMLR; 2017; pp. 214–223. [Google Scholar]
- Hamamci, I.E.; Er, S.; Simsar, E.; Sekuboyina, A.; Gundogar, M.; Stadlinger, B.; Mehl, A.; Menze, B. Diffusion-based hierarchical multi-label object detection to analyze panoramic dental x-rays. In Proceedings of the International Conference on Medical Image Computing and Computer-Assisted Intervention; Springer, 2023; pp. 389–399. [Google Scholar]
- Abdi, A.H.; Kasaei, S.; Mehdizadeh, M. Automatic segmentation of mandible in panoramic x-ray. Journal of Medical Imaging 2015, 2, 044003–044003. [Google Scholar] [CrossRef] [PubMed]
- Silva, G.; Oliveira, L.; Pithon, M. Automatic segmenting teeth in X-ray images: Trends, a novel data set, benchmarking and future perspectives. Expert Systems with Applications 2018, 107, 15–31. [Google Scholar] [CrossRef]
- Turosz, N.; Checinski, K.; Checinski, M.; Brzozowska, A.; Nowak, Z.; Sikora, M. Applications of artificial intelligence in the analysis of dental panoramic radiographs: an overview of systematic reviews. Dentomaxillofacial Radiology 2023, 52, 20230284. [Google Scholar] [CrossRef] [PubMed]
- Gulrajani, I.; Ahmed, F.; Arjovsky, M.; Dumoulin, V.; Courville, A.C. Improved training of wasserstein gans. Advances in neural information processing systems 2017, 30. [Google Scholar]
- Mao, X.; Li, Q.; Xie, H.; Lau, R.Y.; Wang, Z.; Paul Smolley, S. Least squares generative adversarial networks. In Proceedings of the IEEE international conference on computer vision; 2017; pp. 2794–2802. [Google Scholar]
- Radford, A. Unsupervised representation learning with deep convolutional generative adversarial networks. arXiv preprint, 2015; arXiv:1511.06434. [Google Scholar]
- Karras, T. Progressive Growing of GANs for Improved Quality, Stability, and Variation. arXiv preprint, 2017; arXiv:1710.10196. [Google Scholar]
- Hamamci, I.E.; Er, S.; Simsar, E.; Yuksel, A.E.; Gultekin, S.; Ozdemir, S.D.; Yang, K.; Li, H.B.; Pati, S.; Stadlinger, B.; et al. DENTEX: An Abnormal Tooth Detection with Dental Enumeration and Diagnosis Benchmark for Panoramic X-rays. arXiv preprint, 2023; arXiv:2305.19112. [Google Scholar]
- Tschumperlé, D.; Deriche, R. Vector-valued image regularization with PDEs: A common framework for different applications. IEEE transactions on pattern analysis and machine intelligence 2005, 27, 506–517. [Google Scholar] [CrossRef] [PubMed]
- Schindelin, J.; Arganda-Carreras, I.; Frise, E.; Kaynig, V.; Longair, M.; Pietzsch, T.; Preibisch, S.; Rueden, C.; Saalfeld, S.; Schmid, B.; et al. Fiji: an open-source platform for biological-image analysis. Nat. Methods 2012, 9, 676–682. [Google Scholar] [CrossRef] [PubMed]
Figure 1.
An overview of WGAN-GP. The generator receives input noise and produces samples, which are compared against real data from the dataset in the discriminator. The figure illustrates the calculation of Critic loss (D loss) by real, fake and gradient penalty terms, along with generator loss (G loss). The gradient penalty term, is highlighted alongside the Wasserstein distance in a separate box.
Figure 2.
Generator (G) and Discriminator (D) Networks used in methods
Figure 2.
Generator (G) and Discriminator (D) Networks used in methods
Figure 3.
Box plots of observer scores for Models 1 and 2
Figure 3.
Box plots of observer scores for Models 1 and 2
Figure 4.
Radar plot for models 1 (red) and 2 (blue).
Figure 4.
Radar plot for models 1 (red) and 2 (blue).
Figure 5.
Best Images generated using model 1 (top row) and 2 (bottom row).
Figure 5.
Best Images generated using model 1 (top row) and 2 (bottom row).
Figure 6.
Worst images among all model variants, showing poor overall anatomical depiction and severe artifacts.
Figure 6.
Worst images among all model variants, showing poor overall anatomical depiction and severe artifacts.
Table 1.
Experimental configuration for Models 1 through 4, including input dimensions (W=Width, H=Height), critic iterations, number of training epochs, and use of denoising
Table 1.
Experimental configuration for Models 1 through 4, including input dimensions (W=Width, H=Height), critic iterations, number of training epochs, and use of denoising
| M |
(W,H) |
Critic |
Epochs |
Denoise |
| M1 |
|
2 |
550 |
No |
| M2 |
|
1 |
150 |
Yes |
| M3 |
|
4 |
250 |
Yes |
| M4 |
|
5 |
100 |
Yes |
Table 2.
Expert evaluation scores, ranging from 1 to 5. The model with the highest average score for each criterion in bold. Models 1 and/or 2 show the best average performance for most dental and image quality attributes. Abbreviations: M = Model, OR = Overall Realism, CS = Clarity and Sharpness, CB = Contrast and Brightness, CR = Crowns, RT = Roots, CTB = Cortical Bone, TB = Trabecular Bone, BS = Bone Shape, OS = Occlusal Space, AA = Absence of Artifacts, MC = Mandibular Canal, HP = Hard Palate.
| M |
OR |
CS |
CB |
CR |
RT |
CTB |
TB |
BS |
OS |
AA |
MC |
HP |
| M1 |
2.44 |
1.68 |
2.84 |
2.48 |
2.00 |
2.48 |
3.36 |
2.48 |
2.76 |
1.48 |
1.64 |
3.20 |
| M2 |
2.72 |
1.96 |
2.88 |
2.32 |
2.20 |
2.76 |
2.80 |
3.16 |
3.04 |
1.64 |
1.48 |
3.04 |
| M3 |
1.88 |
1.52 |
2.40 |
2.04 |
1.96 |
1.72 |
1.80 |
2.56 |
2.24 |
1.12 |
1.60 |
3.04 |
| M4 |
2.32 |
1.76 |
2.60 |
2.40 |
2.20 |
2.00 |
1.96 |
2.56 |
2.64 |
1.44 |
1.20 |
3.04 |
|
Disclaimer/Publisher’s Note: The statements, opinions and data contained in all publications are solely those of the individual author(s) and contributor(s) and not of MDPI and/or the editor(s). MDPI and/or the editor(s) disclaim responsibility for any injury to people or property resulting from any ideas, methods, instructions or products referred to in the content. |
© 2024 by the authors. Licensee MDPI, Basel, Switzerland. This article is an open access article distributed under the terms and conditions of the Creative Commons Attribution (CC BY) license (http://creativecommons.org/licenses/by/4.0/).
