Preprint
Article

A Case Study of 3D Scanning Techniques in Civil Engineering

Altmetrics

Downloads

106

Views

51

Comments

0

A peer-reviewed article of this preprint also exists.

Submitted:

30 October 2024

Posted:

31 October 2024

You are already at the latest version

Alerts
Abstract

This paper reviews the measurement challenges associated with 3D scanning techniques in civil engineering. It explores the practical aspects of scanning buildings and complex surfaces through various case studies. The paper details the conventional use of Terrestrial Laser Scanning (TLS) for reconstructing the technical documentation of a hall. It then describes an unconventional application of this technique for measuring an ETICS (External Thermal Insulation Composite System) wall, aiming to detect microdeformations caused by environmental factors controlled within a climatic chamber. The measurements of the insulated wall were subsequently repeated using a metrological grade laser scanner. Numerical data was analyzed with inspection engineering methods. This approach yielded qualitative and quantitative results. Although the qualitative results were consistent, the quantitative data revealed some inconsistencies. To address discrepancies in the quantitative data, a comparative analysis was performed, which highlighted critical findings and areas of divergence.

Keywords: 
Subject: Engineering  -   Civil Engineering

1. Introduction

The development of a design and the subsequent prototype of a product or a full-scale facility is an essential part of the implementation of new technologies [1,2]. Design is a complex and time-consuming process because, in the initial stages of development, various design concepts and optimisation options are considered [3,4]. Modern design methods are supported by numerical techniques at virtually every stage of development. Prototyping most often involves optimising selected product parameters [5]. In the simplest case, these are unidirectional design-and-execute activities. In more advanced models, multithreaded optimisation couplings are implemented, such as those found in the digital shadow or digital twin models, are implemented [6] in which a classification of the digital twin (DT) level of integration was made, an implementation of these methods [7] and the potential for industrial applications [8]. In such models, the accuracy of reproduction of the test object plays an important role. Essential to the prototyping process is the integration of different imaging techniques to achieve the appropriate scan accuracy [9]. 3D scanning technology is rapidly developing in virtually every field of technology and science. These include the identification and main applications of 3D scanning from an industrial perspective [10,11] implementation of these solutions in the construction industry [12] as well as applications beyond civil engineering issues [13,14,15,16]. Most applications are in precision mechanics for prototyping and production control. An example of such an application is the methodology for the precise characterisation of the geometric quality of gears [17]. Another example is the use of three-dimensional laser scanning to assess the wear of the wheel and rail profile in rail transport [18]. 3D scanning systems are also employed in the mass production quality control process during the manufacture of castings and forgings, without the need to prepare the surface in direct contact with the objects [19]. It is very often used to scan large cubic objects and engineering and technical infrastructure. An example of such an application is the quality control process in a residential building [20], and the larger scale building of 3D models used for control during tectonic activity [21], as well as the deformation of structures such as bridges and tunnels, and ground deformation in landslides and unstable rock masses[22]. It is extremely important to use 3D scanning methods in the support of supporting laboratory research. This approach was presented by the authors of the publication [23]. An innovative method was presented for the detection of geometric imerfections in objects made of carbon fibre reinforced polymer (CFRP). This made it possible to predict the geometry of the models and develop a method to reduce deflection. An even more original approach using 3D scanning methods is proposed in the publication [24]. The authors used a scanning technique to inspect corroded bridge components and then developed an original way of numerical modelling such components. In addition to the surface observation techniques mentioned above, more complex ones used for volumetric imaging, such as, for example, computed tomography used in diagnostics of the microstructure of the microstructure of the material microstructure [25,26] and the mechanical behaviour of materials at high temperatures [27]. These techniques are primarily employed for non-invasive observation of material structure and volumetric defects. Due to the complexity of the technology, they are not used for mapping the surface of an object. For rapid surface mapping, simpler devices are employed, namely optical scanners that predominantly utilise structured light or laser beams. Scanning refers to the optical capture of information [28] on the geometry of physical objects, in which artificially generated external light sources are used. The acquired information is digitally stored in the form of a point cloud, which represents data on the spatial location of the test object. After the generation of the point cloud, post-processing occurs, which involves cleaning artefacts (random errors) and the meshing process, that is, combining with a triangular STL mesh [29]. Currently, the most widely used scanning techniques use different types of projection units [30]. There are active units, i.e., laser scanners,, structured light scanners, and passive scanners which use natural light reflected from the object or radiation in the infrared band. Several surface image acquisition techniques are currently used in measurement practice [31], photogrammetry [32], time-of-flight (TOF) [33,34] interferometry, laser triangulation (LT) [35], and structured light scanner (SLS) [36]. Photogrammetry is based on the processing of images [37,38]. The technique is used to measure large objects and surveying observations. The results of this technology are orthoimages, 2D and 3D reconstruction, and classification of objects for mapping and visualisation. The TOF technique is based on measuring the flight of the total time of the laser beam from the source to the object and after the reflection of the beam on the scanner [39]. On the basis of this, the distance between the object and the projector is calculated. This technique is used to measure large objects and is usually point-based. Measurement by laser triangulation involves projecting a laser beam on the object under study (LT) [40]. With the distance between the laser and the camera and the angle between the laser beam and the image plane of the camera known, it is possible to determine the distance of the measurement point from the camera lens. The LT technique is adapted to scan small and medium objects (such as vehicle details and mechanical parts). This type of exposure most often uses red or blue laser lines. In addition to the LT technique itself, the limiting parameters, such as data acquisition accuracy or measurement uncertainty limit [41]. The latest devices (for example, the FreeScan Trio [42]) use sets of dozens of lines, greatly speeds up the scanning process. The SLS technique [43,44] uses a measurement triangulation method in which the stripe patterns displayed on the measurement surface lend themselves to projection. The principle of stripe exposure is known as Mori`e patterns [45,46]. The measurement covers the entire exposure area at the same time, allowing good image stability. The SLS technique is usually used to measure small parts and machine parts. Some combination of scanning techniques is the Terrestrial Laser Scanner (TLS) system [47,48,49]. This system can use TOF and laser range Finder (LRF) techniques [50,51]. A scanner is usually built with two basic modules. The first is a projector that generates a beam of light, and the second is a head equipped with a set of sensitive cameras that track changes in the intensity of light reflected from the object being scanned. For scanning large objects such as buildings and engineering structures [20], passive scanners [21], Terrestrial Laser Scanner (TLS), are used due to their efficiency and relatively good imaging accuracy. Scans are performed in several or dozens of measurement zones so that neighbouring scanning zones share common imaging areas within their range. The scanning time from a single observation point depends on the set imaging accuracy and ranges from several to tens of minutes. Devices using laser lines are used to image small parts and details. The type of laser light is important in terms of measurement accuracy and the quality of the images obtained [52]. In this category, there are two types: red laser and blue laser [53]. Red laser light is used in the early development of scanning. This type of laser operates close to the infrared spectrum at a wavelength of approximately 670 nm. The red laser is commonly used in industrial automation, typically on inspection lines during production. The disadvantage of the red laser is its low accuracy when mapping shiny surfaces; however, its advantages include speed and intensity of illumination, which facilitate the observation of fast-moving objects. Blue lasers are used in modern measuring equipment for laboratory and production applications. This type of laser operates at approximately 405 nm within the visible-light spectrum, close to the ultraviolet spectrum. The blue laser is much better suited to measure transparent or translucent materials, reflective or mirror surfaces, as well as organic surfaces such as wood [54].This technique allows images of three-dimensional objects with complex structures and small dimensions. Reference points in the form of markers affixed to the surface are necessary to perform a pop-up scan. Another advantage is the possibility of using manually controlled scanners, which significantly enhances the mobility of such devices. Structured light scanners utilise a digital projector. The exposure process is more demanding than that of a laser scanner. This type of equipment is used to register individual images, which are then assembled together. When scanning shiny surfaces (for example, steel), it is necessary to use special antireflection sprays [55]. This preparation allows for the application of a thin layer with a thickness on the order of tens of micrometres, thereby protecting the reflective surface. The best results are achieved by using specially stabilised tripods. Structured light scanning has the advantage of providing texture and colour mapping of the test object. In contrast, 3D scanning is used solely to acquire a digital image of the test object, which has no useful function beyond graphical visualisation. In addition to the precision of image acquisition due to the exposure technique and the precision of the devices themselves, disturbance of the measurement environment, such as the intensity of natural light during measurements, may also be important [56]. This type of environmental disturbance is minimised under laboratory conditions but still occurs in in situ measurements. After the point cloud is obtained, another process associated with post-processing follows. In further analysis, point-cloud or STL mesh can be used in various ways. The main task is to obtain CAD-type geometry. Reverse engineering is used for this purpose [57], coupled with scanning [58], inspection [59,60] and control techniques [61]. The concept of reverse engineering is to recreate a model based on an existing pattern without access to detailed technical documentation. In the case of scanning, this pattern is represented by a point cloud. Reconstruction is typically performed using dedicated graphics software and aims to achieve a match as closely as possible to the original pattern [62]. The quality of this matching is assessed using inspection software, which measures the deviation of the reconstructed model in relation to the reference model. The final result of the technique described above is the attainment of a fully scalable model suitable for numerical calculations.
This paper takes a review-based approach and includes a case study focused on the analysis of a civil engineering structure. It presents examples of the application of two distinct scanning techniques within their respective dedicated ranges and explores the potential for the unconventional use of the TLS (Terrestrial Laser Scanning) scanner in conducting high-precision measurements of large surfaces. Both 3D scanning techniques are evaluated with regard to their qualitative and quantitative measurement accuracy.
The primary objective of this paper is to compare these scanning methods through selected examples and investigate the validity of their potential interchangeability. The analysis seeks to provide information on whether different scanning techniques can serve as alternatives to each other, offering a deeper understanding of their respective advantages and limitations in the context of civil engineering applications.

2. Test Objects and Test Methods.

2.1. Industrial Hall

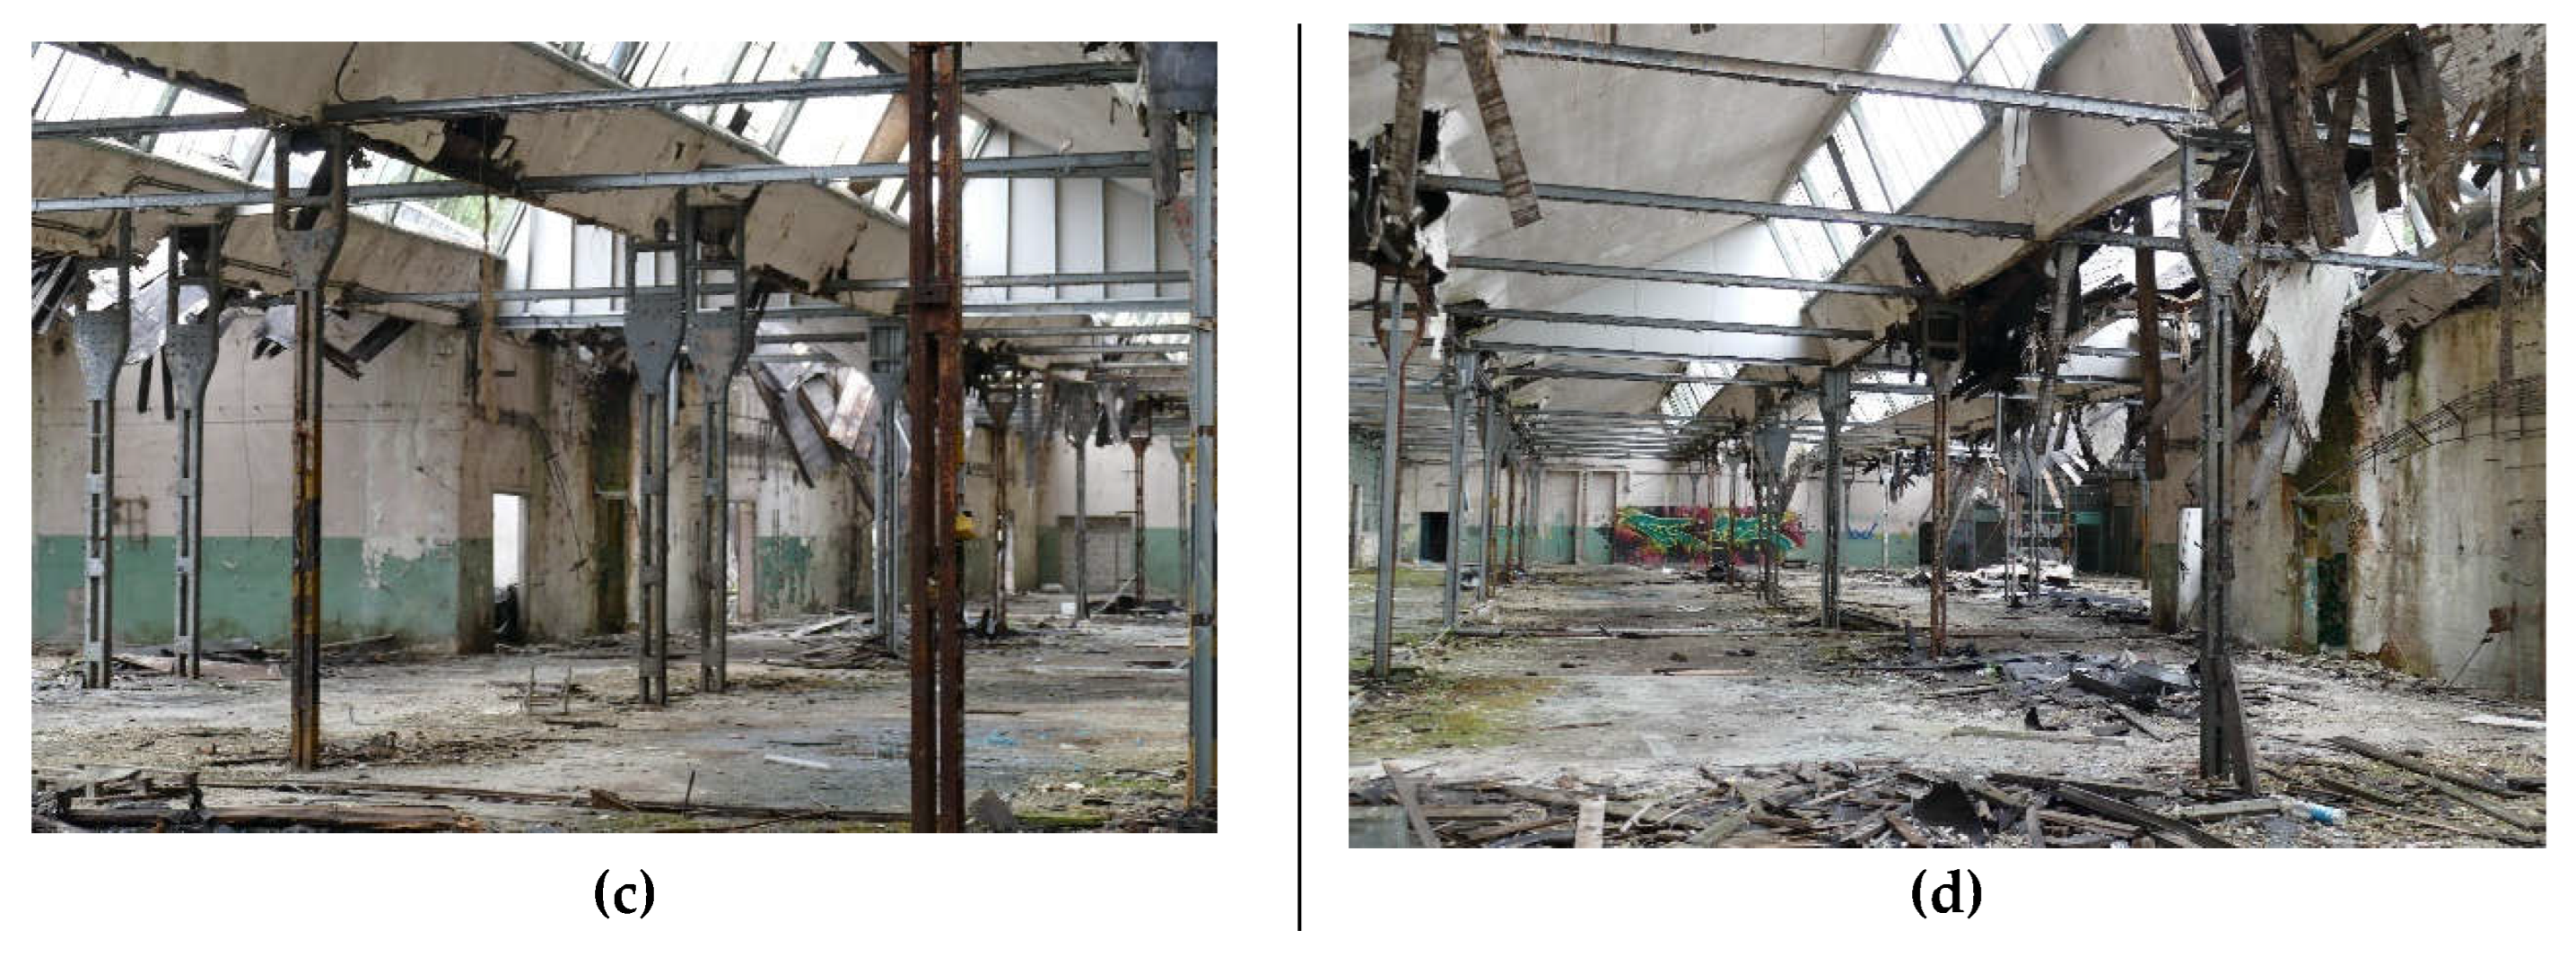
The test facility is an industrial hall from the previous century that is currently out of use. The main part of the facility is a six-aisle, partially basement hall. The roof of the hall is painted and features various spans ranging from 5.4 to approximately 6.4 m. The spacing of the steel columns supporting the roof structure is approximately 6.5 m. The roof was in a state of significant deterioration, with numerous cavities. It is supported by solid brick masonry walls and two branched columns made of steel channels. The columns are constructed from C140 channels spaced approximately 100 mm apart, connected by battens and gusset plates. Photographs of the current state of the facility are shown in Figure 1. Figure 1 (a) and Figure 2 (b) show a photograph of the roof of the building taken from a drone. Photographs illustrate the extent of the damage. Figure 2 (b) and (c) show the interior of the building including the technical condition of the superstructure and the damage to the roof as seen from the inside. The facility does not have technical documentation. The purpose of the analyses is to reconstruct the object's basic technical documentation by reverse engineering and digitising the object's damage. 3D imaging was performed with a FaroFocus volume scanner [63,64]. The scanner has a range of 0.6 to 70 m and a resolution of up to 165 megapixels. The scanner enables image acquisition in the form of a point cloud. In addition, an integrated colour camera allows colour overlay of scanned surfaces [65]. The scanning speed is 2 million points per second. The scanner's field of view is 360o horizontally and 300o vertically. The basic parameters of the Faro Focus 3D [66], TLC scanner are summarised in Table 1.
The reading accuracy and autocalibration error analysis compared to similar devices of this type are presented in [67]. Finally, it was found that the random noise from reading the coordinates of the point cloud does not contribute significant errors when scanning at short distances. The usefulness of the FaroFocus system was even confirmed in the article [68]. This paper compares individual systems (Terrestrial Laser Scanner (TLS), Mobile Mapping System (MMS) and Unmanned Aerial Vehicle (UAV) and considers the possibility of compiling them. In the realised example, one Faro Focus scanning device was used. The image was exiled from the outside and inside of the object from a total of 55 observation positions. After taking individual scans, individual images were combined into a 3D image using dedicated Faro Scene software [69]. Furthermore, ReCap Pro reverse engineering software [70] and AutoCad software to reproduce the drawing documentation.

2.2. Industrial Hall

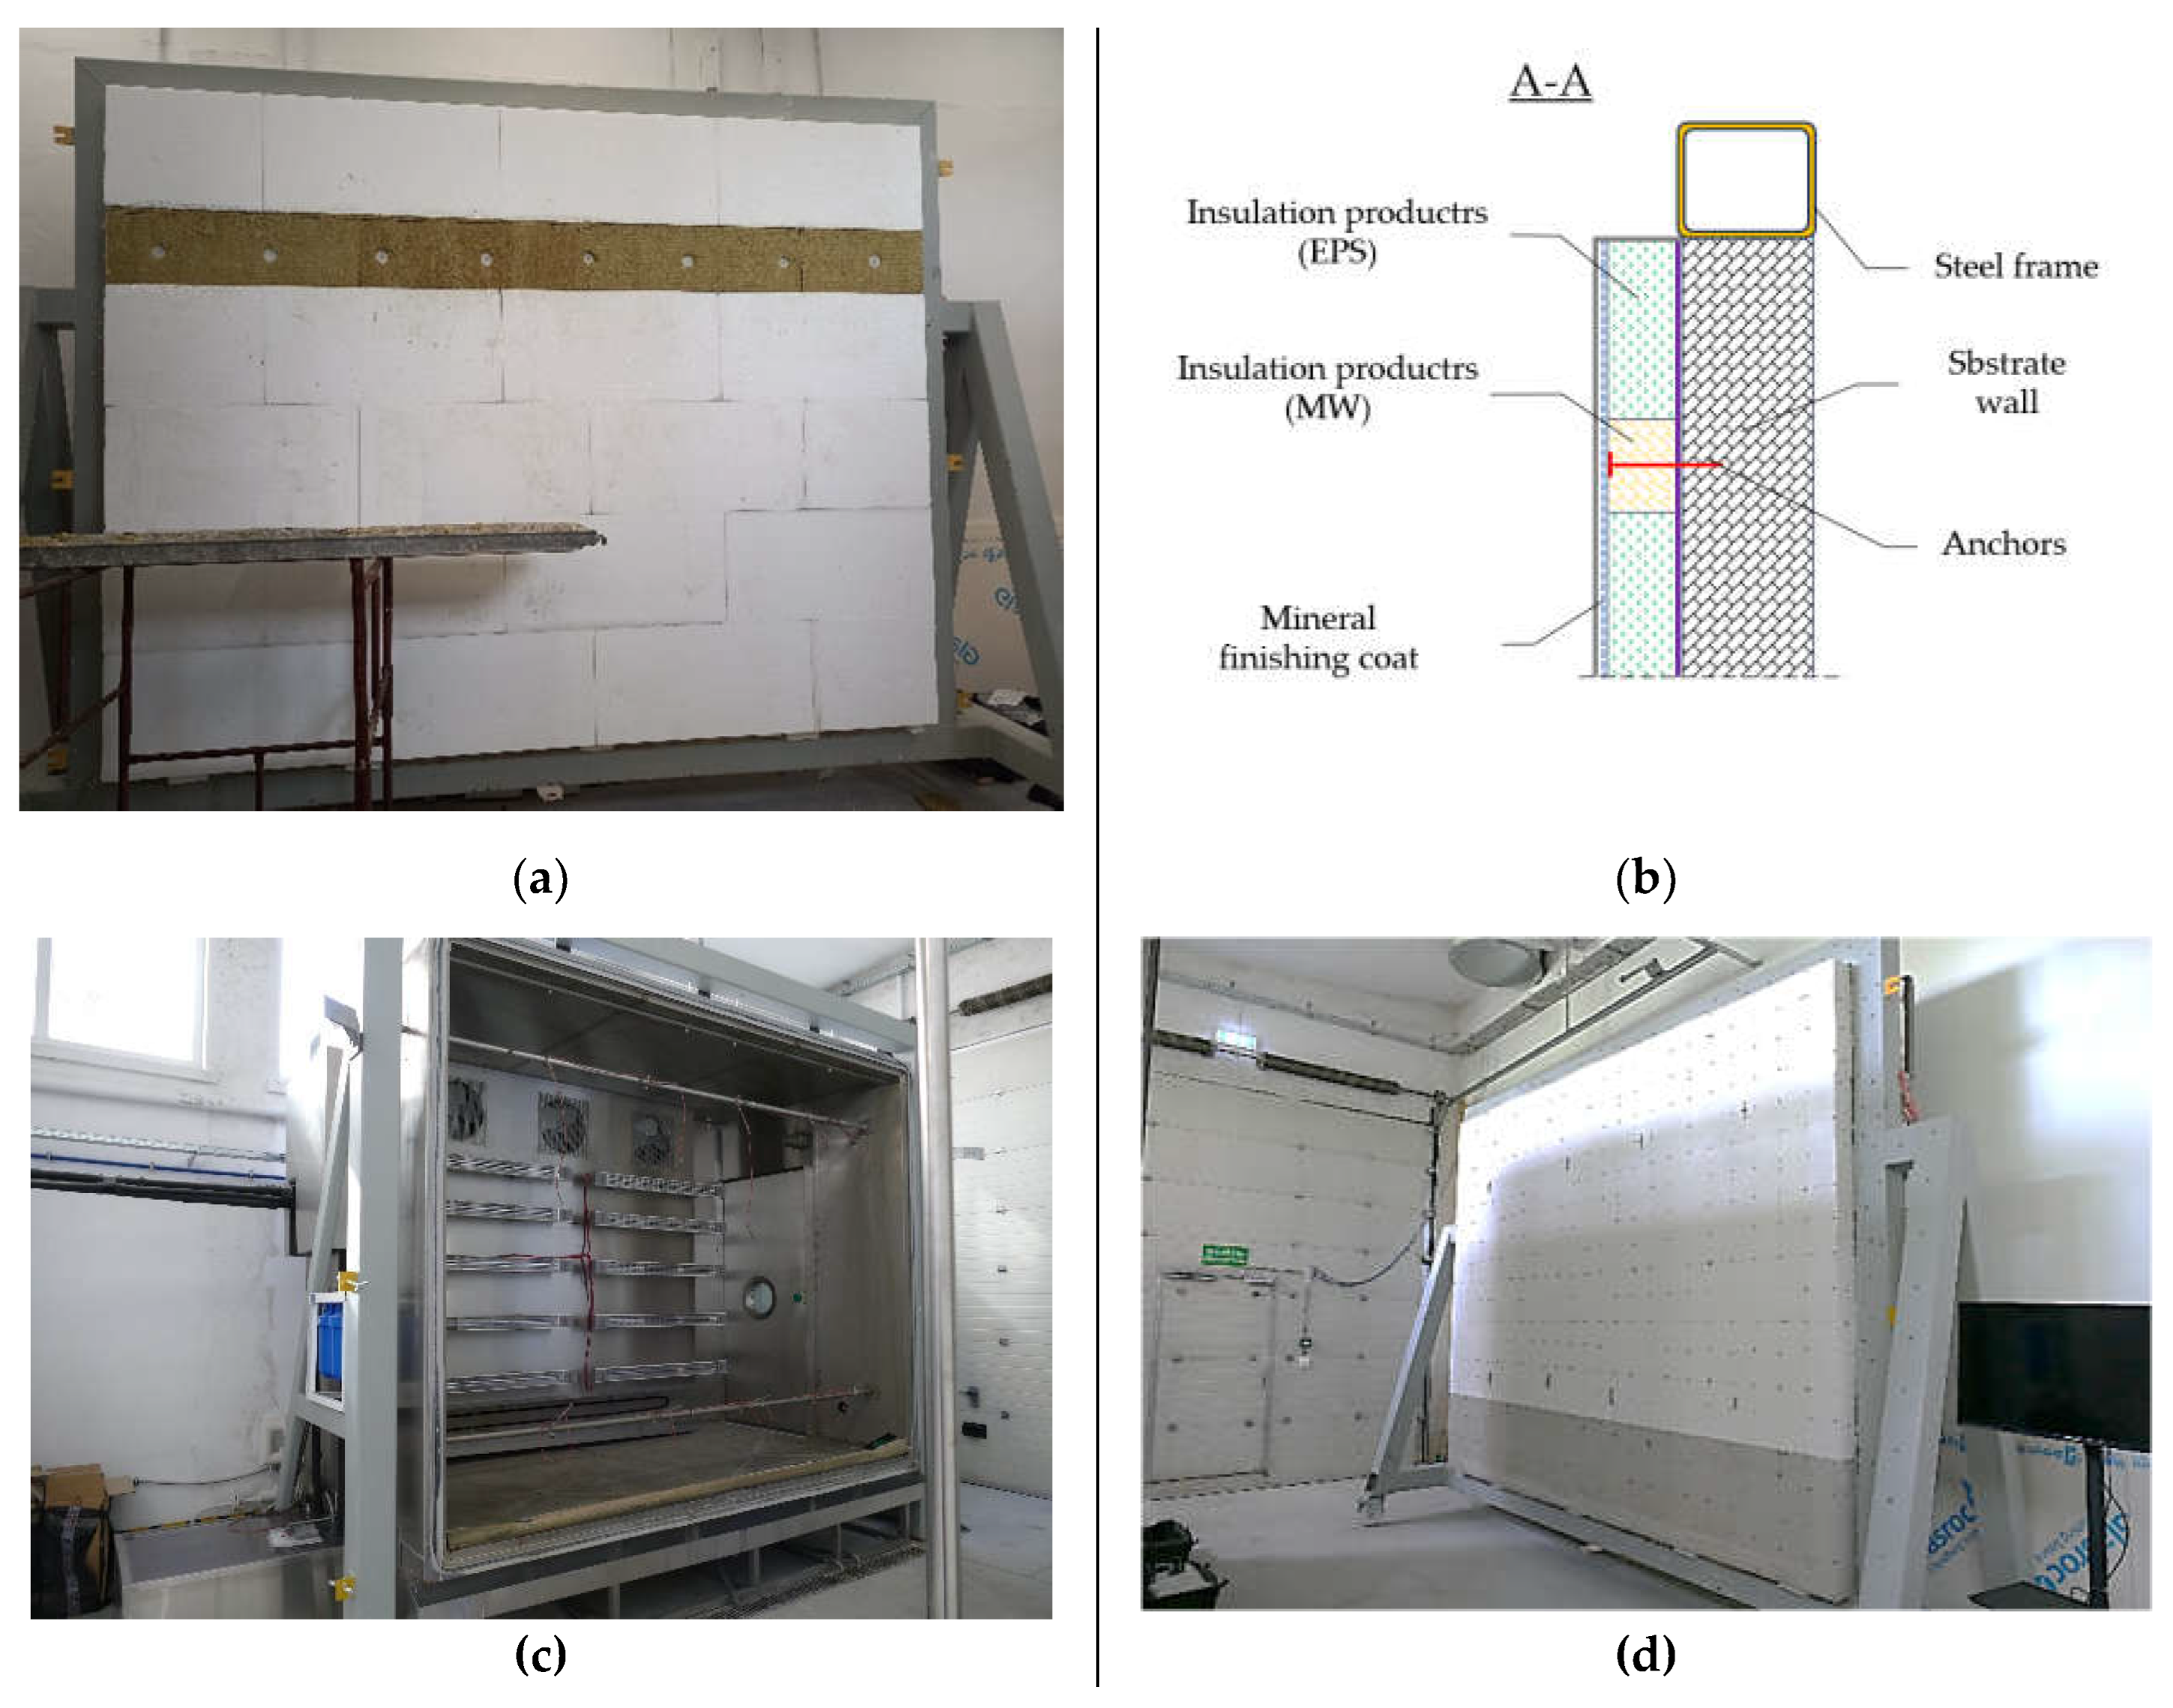
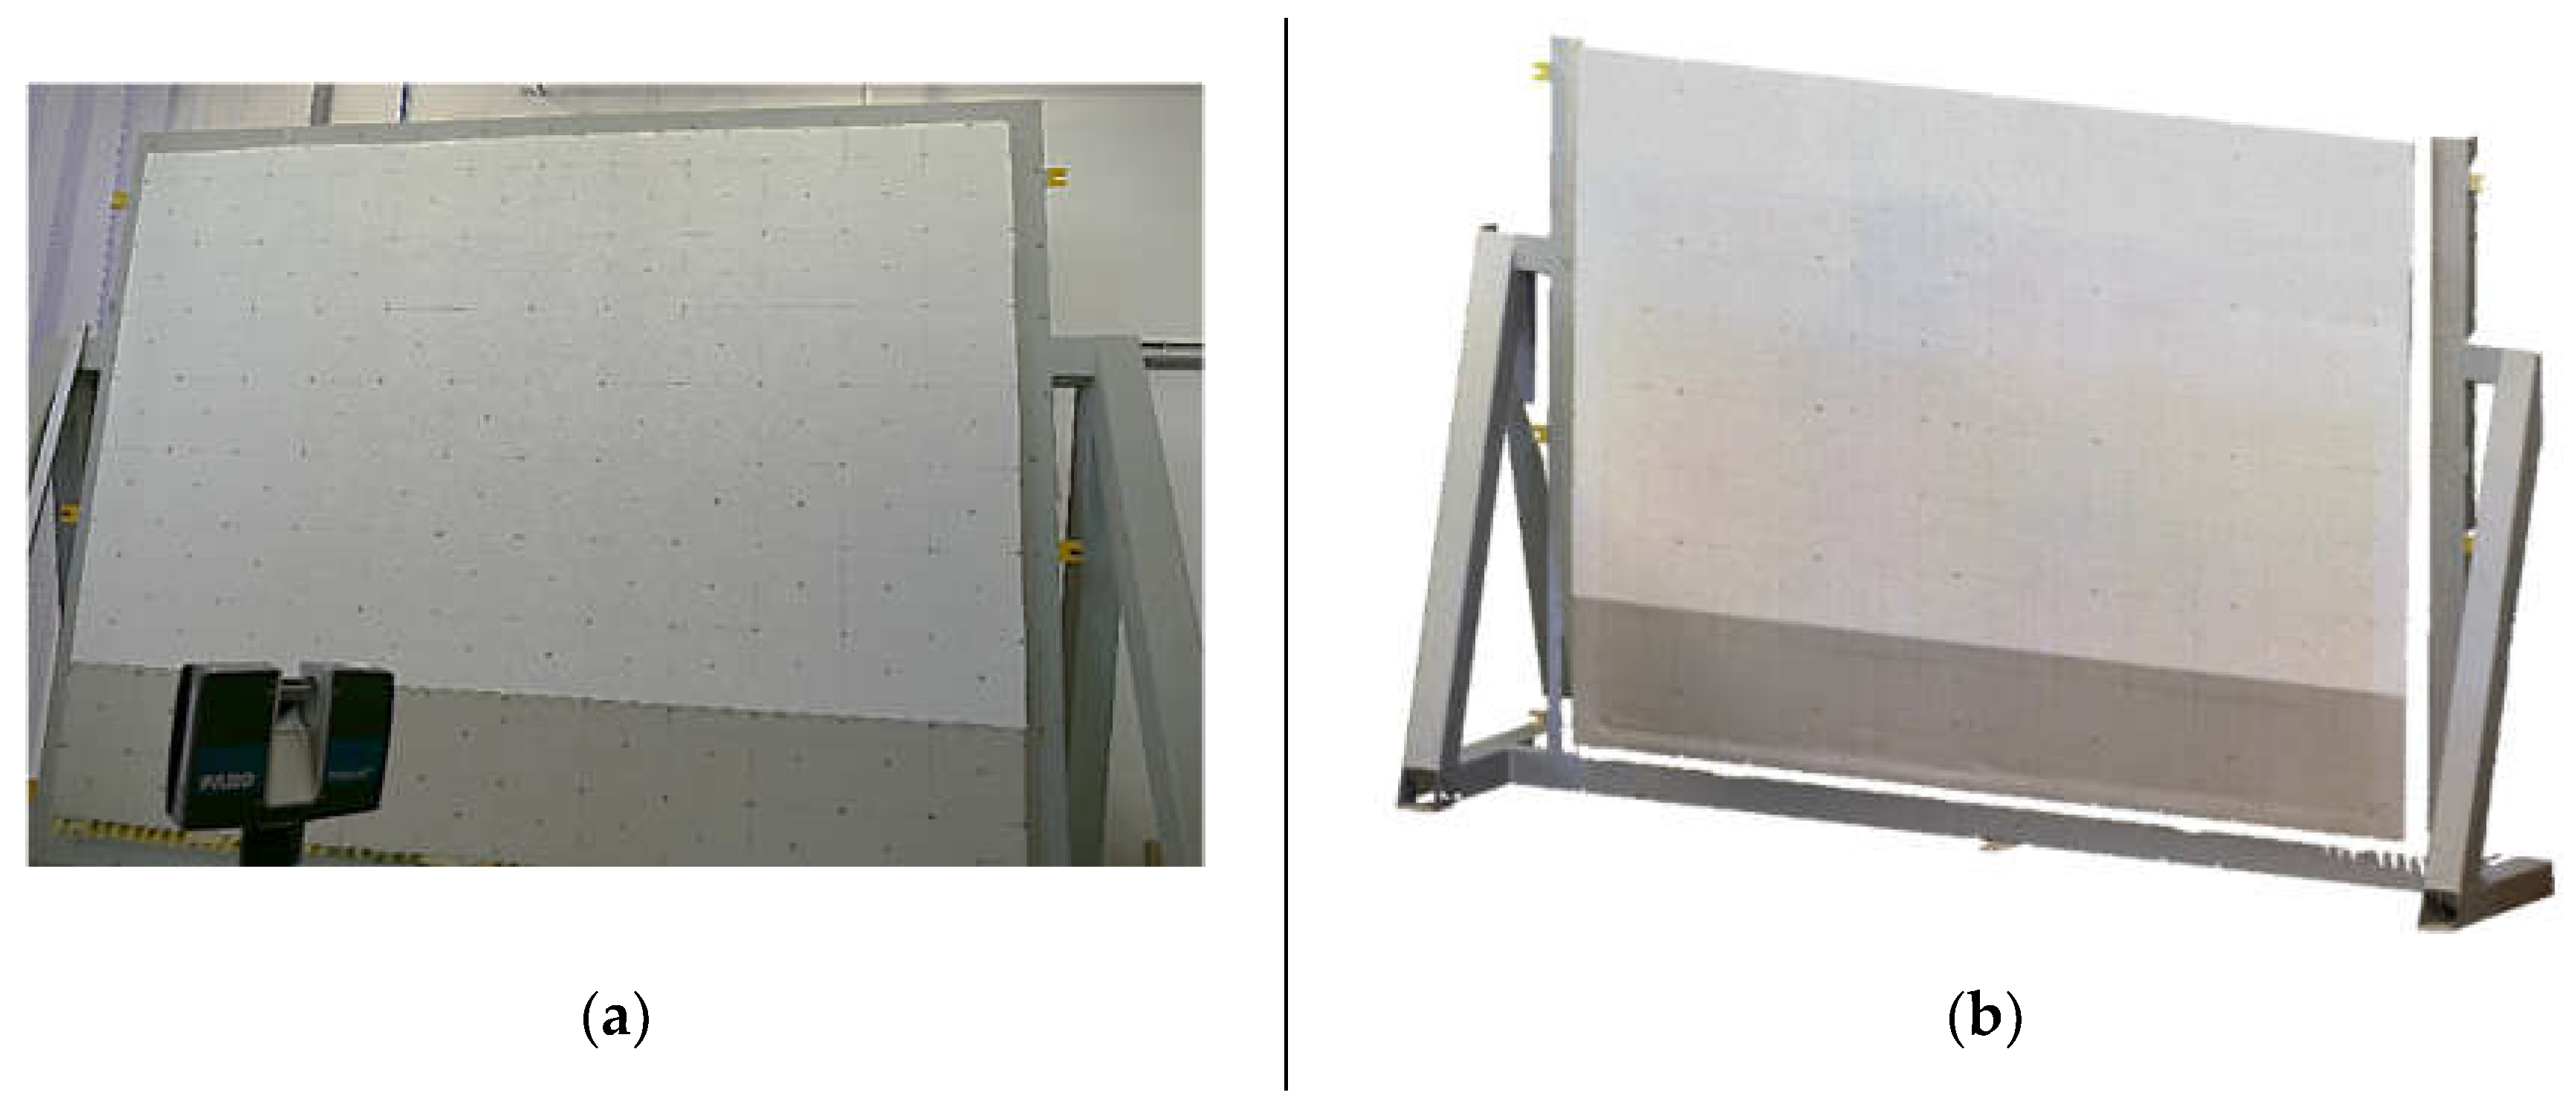
The large area object is a wall with insulation from External Thermal Insulation Composite Systems (ETICS) [71,72]. The object, measuring 3.6 m x 2.8 m, was tested under laboratory conditions using a climate chamber. The EITCS insulation is mounted on a masonry wall made of aerated concrete blocks embedded in a rigid steel frame. The thermal insulation layer is made of expanded polystyrene (EPS) with a fire-retardant strip made of mineral wool (MW) [73]. The test model along with the test stand is shown in Figure 2. Figure 2 (a) shows a test object with a visible insulation layer (before applying the finishing coat). The dark band is the mineral wool, and the remaining surface is covered with polystyrene. Figure 2 (b) illustrates a cross section of the test object with a detailed description of the constituent layers. Figure 2 (c) shows a view of the test chamber and Figure 2 (d) shows the complete test object before positioning in the test chamber. Finally, the test object is delivered to the chamber and fixed with special clamps. The whole constitutes a sealed system with the possibility of introducing climatic influences (temperature, rain, freezing). The range of thermal and humidity exposures included exposure cycles according to EN 16383 [74].The set of impacts includes three cycles: heating and wetting (HW), heating and cooling (HC), and wetting, freezing, and thawing (WFT). The purpose of the analysis is to evaluate the extent of the deformation and to measure the displacement of the outer layer of the ETICS wall due to environmental loads after it has undergone all impact cycles. Measurements were carried out in two variants. The first was a measurement taken after the wall was installed, but before the climatic impact (reference scan), and the last measurement was taken after all cycles of climatic impact had passed (operational scan). Reference and operational imaging was performed with the FreeScan UEPro 3D laser scanner [75] in photogrammetry mode. The basic parameters of the scanner are summarised in Table 2.

3. Results

3.1. Industrial Hall

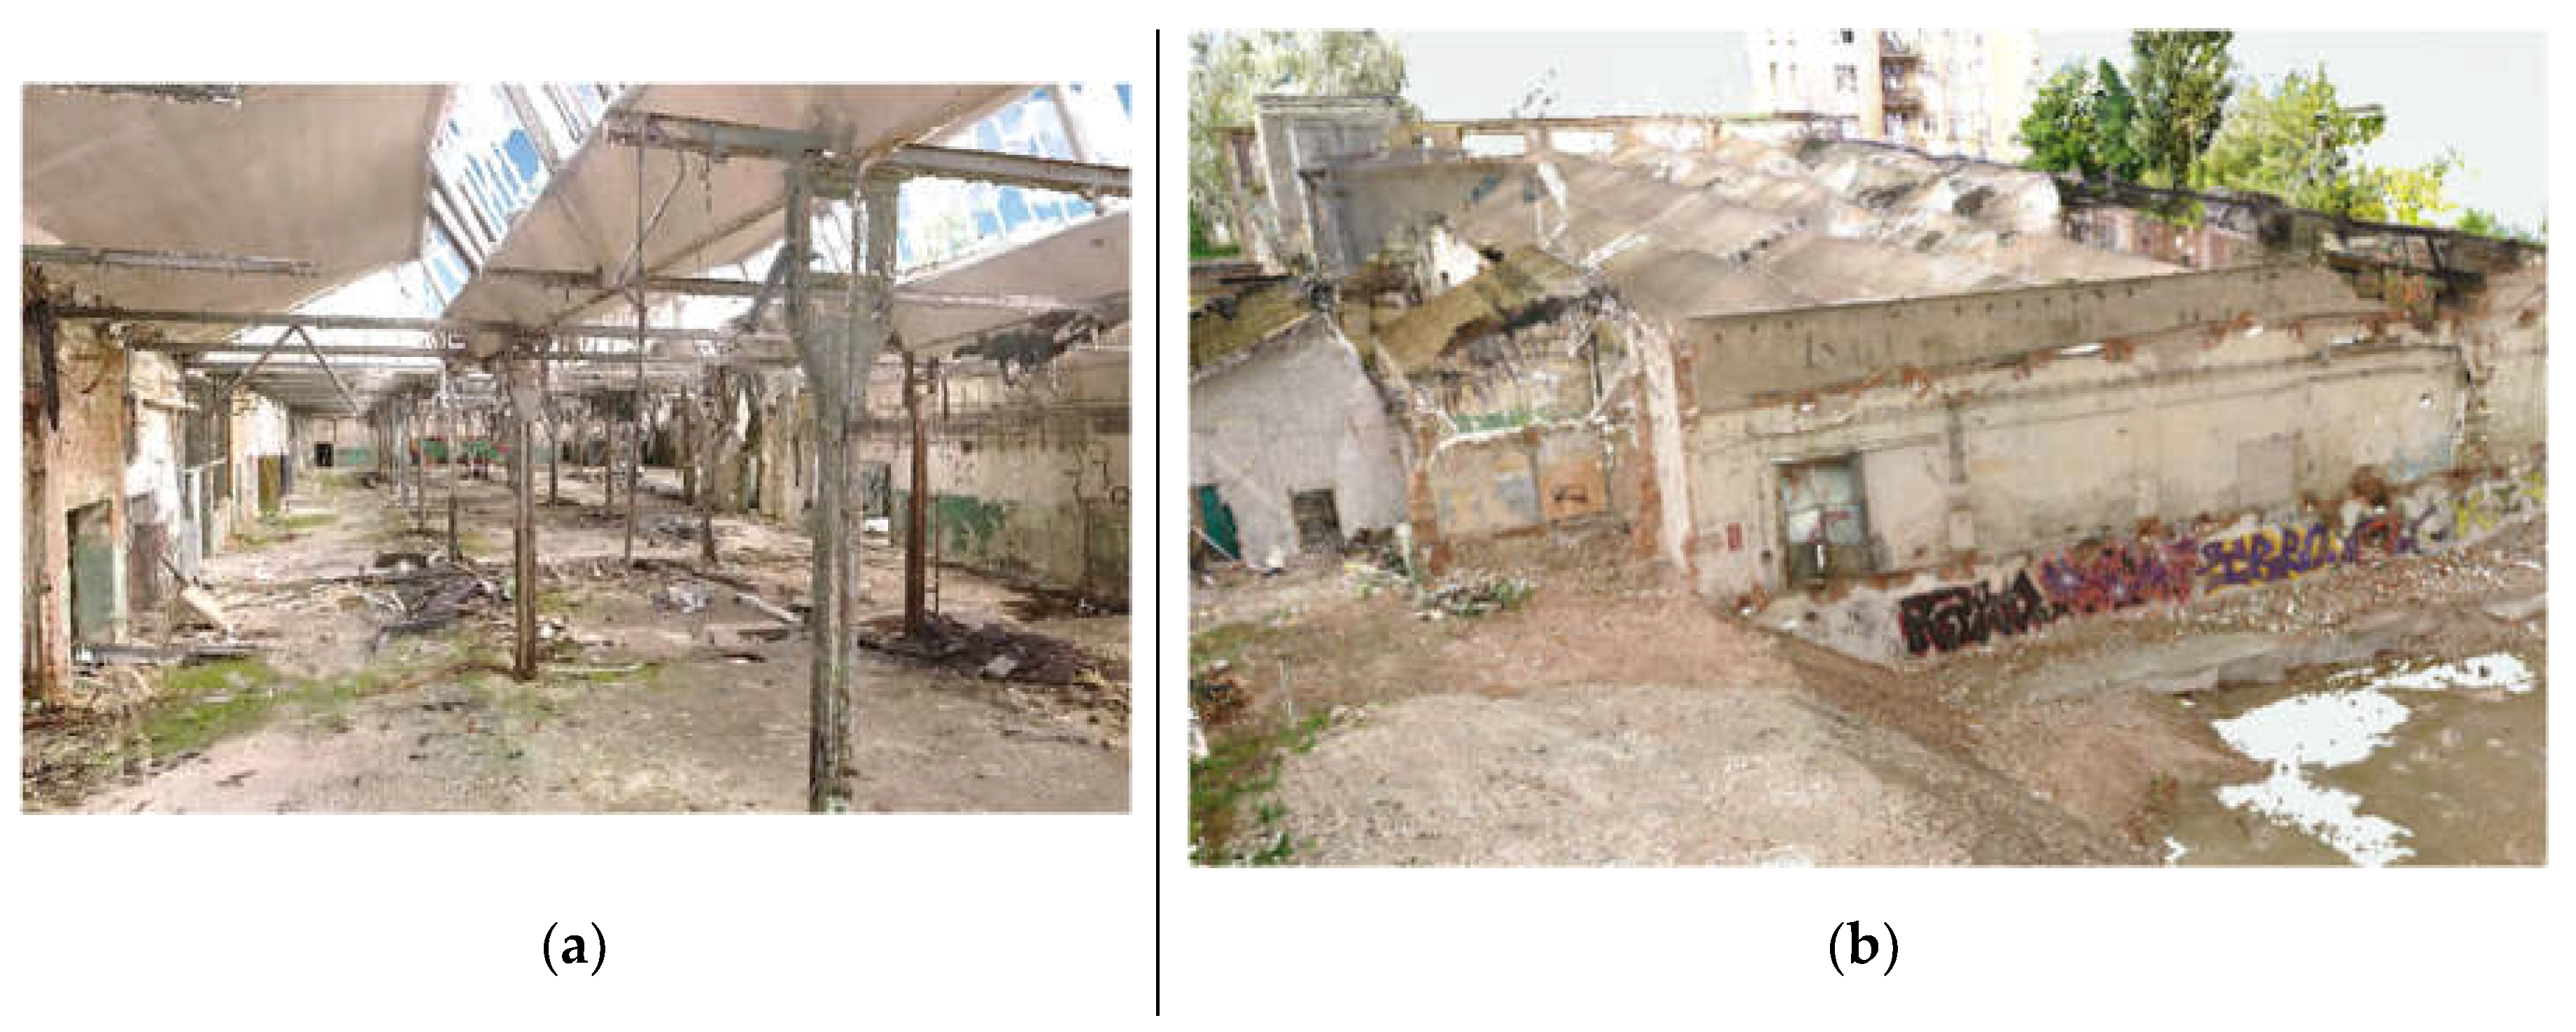
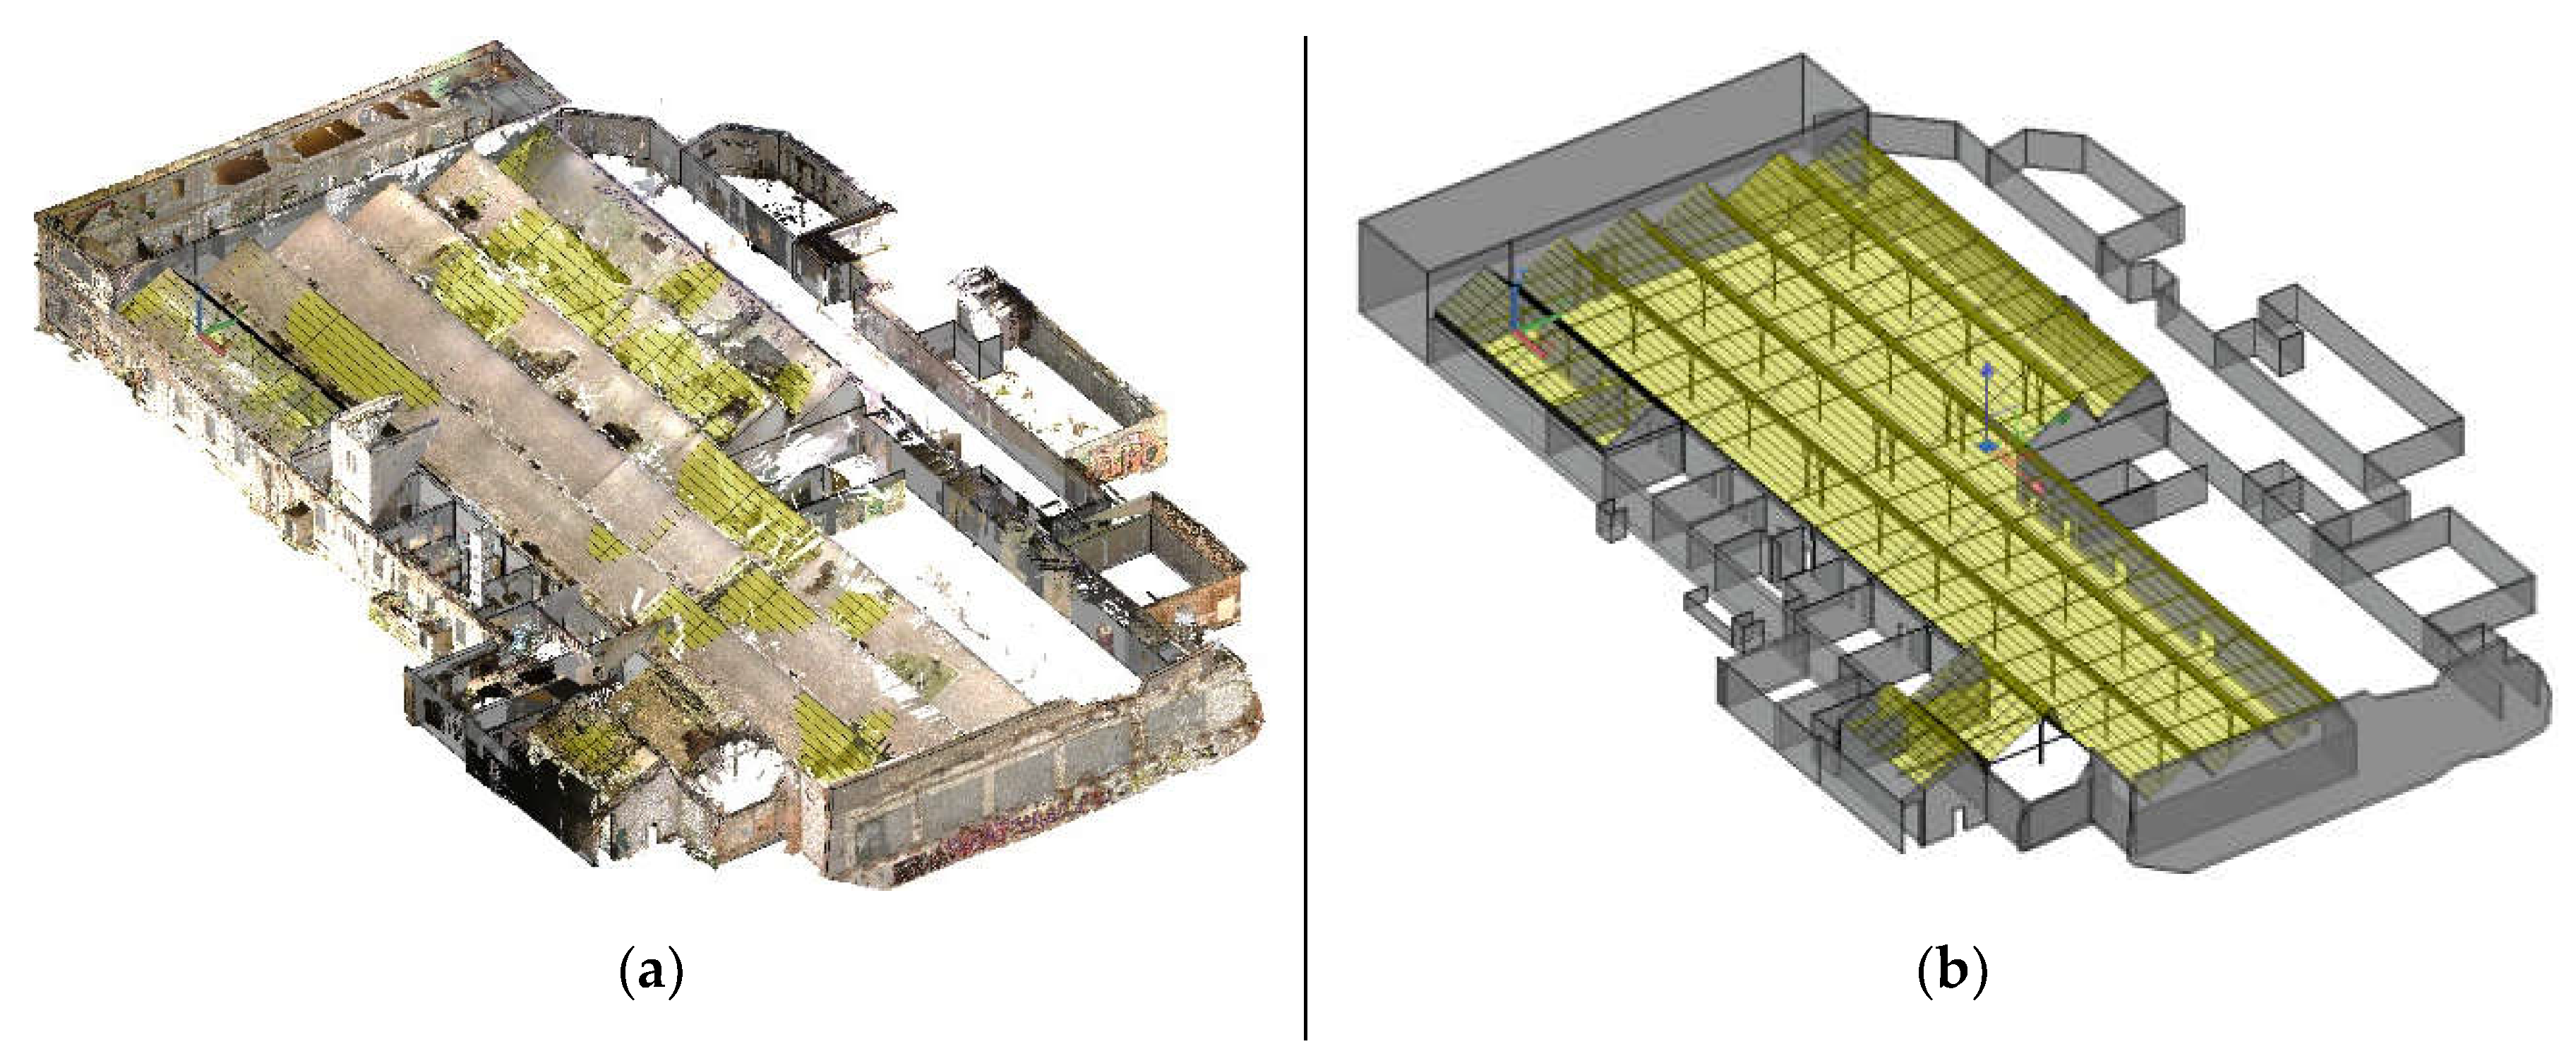
Based on the 3D image of the object, a post-press was performed using the reverse engineering method. This task involves the creation of three-dimensional models based on laser scans. For this task, the Faro Scene was first used [76,77]. In this software, individual images were combined and then the 3D point cloud image was implemented in Autodesk ReCap Pro [78], and Autodesk Revit [79]. Ultimately, a three-dimensional CAD model is obtained [80] inserted into the point cloud. Figure 3a) shows the 3D scan outline along with the solid in CAD format and the 3D model of the object after point cloud removal (Figure 3b). The drawing contains the external outline of the solid with all details and the internal location of the structural elements. This three-dimensional CAD model serves as a foundation for creating various technical drawings, such as projections, sections, and more.
The 3D scan is fully scalable and can be used for damage inventory, providing detailed information about the size, shape, location of structural fragments, and other relevant characteristics. The CAD drawing (Figure 4) generated from the 3D scan can serve as a basis for recreating the technical documentation [81]. This approach to documentation allows for more meticulous building maintenance and, in certain cases, facilitates the restoration of architectural details.

3.2. Faro Focus TLS Scanner for External Wall Insulated

For large objects, terrestrial laser scanning (TLS) is generally sufficient for reconstructing building documentation. However, practical applications may require redundant scanning. In the context of scanning insulated walls, the resolution and quality are crucial. Given that TLS scanning is typically conducted in situ for observing insulated walls on large objects, such as multi-family buildings, the resolution and accuracy of the scan should align with the object's characteristics as described in Section 3.1. For this specific application, the Faro Focus scanner was configured with a resolution of 1/4 and a quality setting of 4x. Figure 5 illustrates the wall scanning process and the resulting point cloud.
Due to laboratory space constraints, scans were captured from three positions at an approximate distance of 3 metres from the test object. Two scanning sessions were conducted: a reference scan before the climate chamber testing (as described in Section 2.2) and a second scan after the climate testing. In total, the combined scans comprised 777,645 nodes. The two scans were superimposed and compared using Geomagic Control X (v.2023.3) inspection software.

3.3. External Insulated Wall FreeScan UEPro Laser Scanner

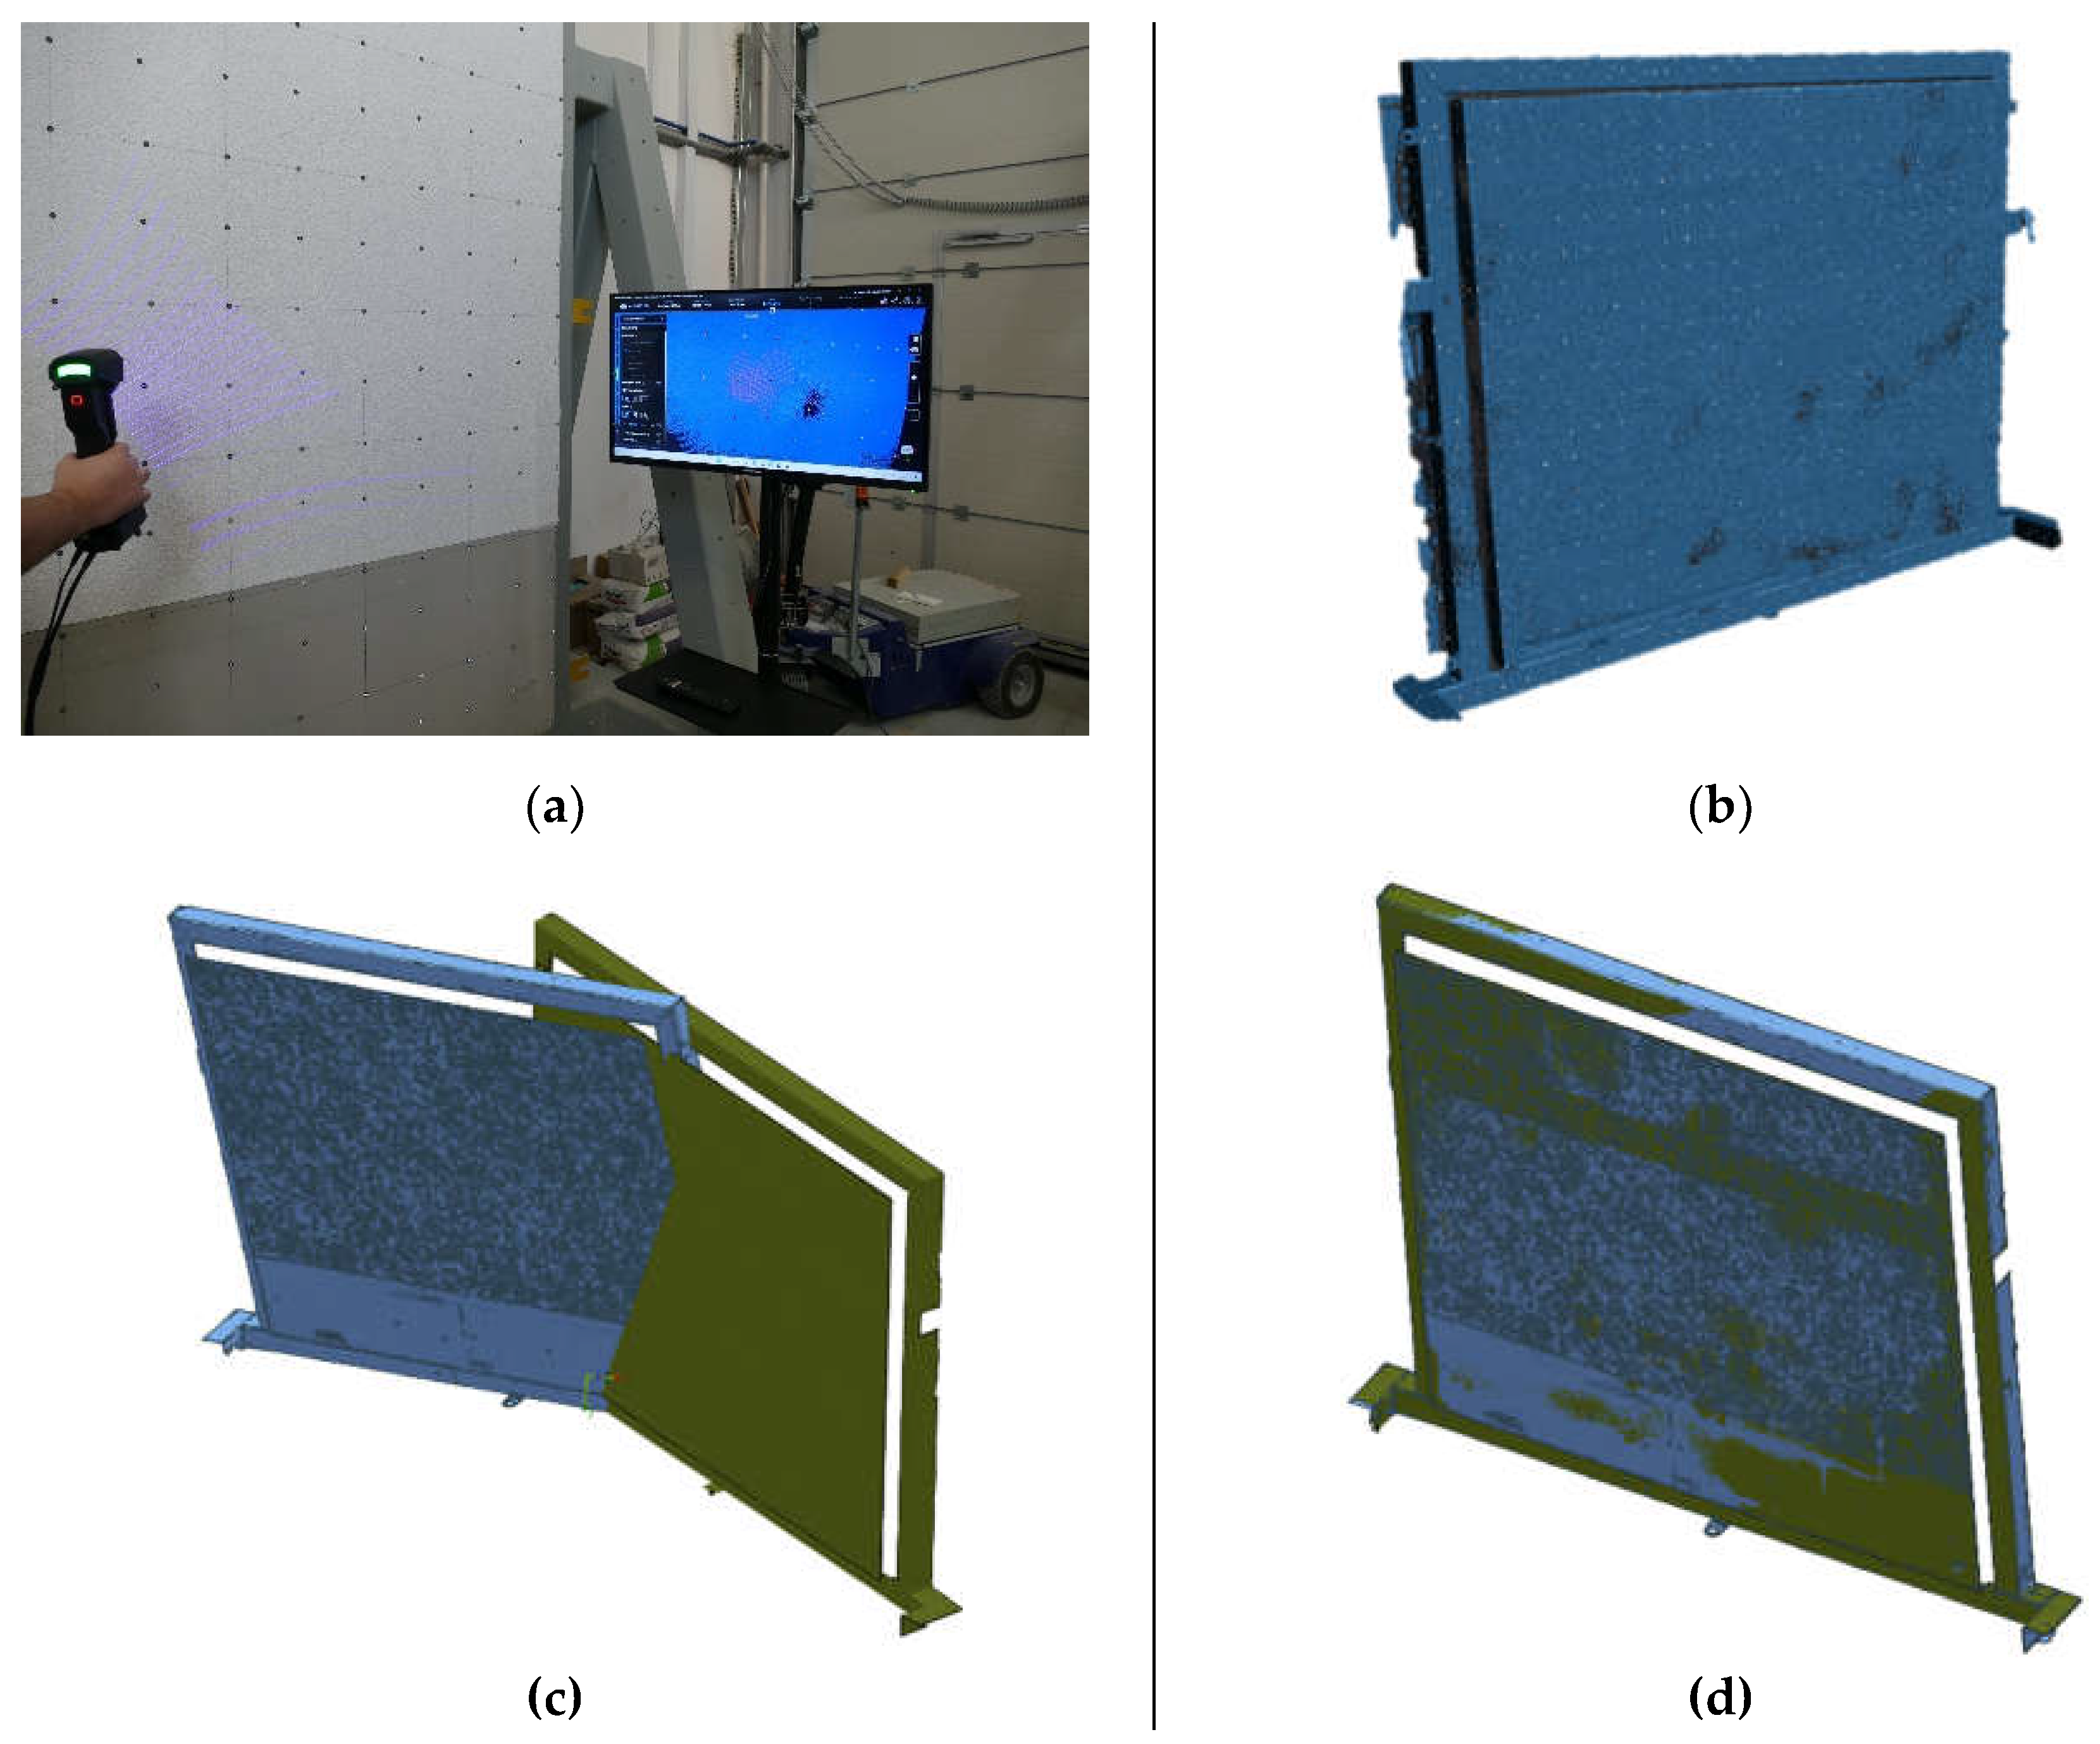
The first set of measurements was performed with a FreeScan UEPro laser scanner. Scanning required several changes in working position. The post-processing was then performed using Geomagic Control X. control software. The process of acquiring and assembling images of a large surface object is shown in Figure 6. Exposure of the test object (Figure 6 a) results in a point cloud (Figure 6b) that represents the scanned surface. After removing artefacts and optimising the points, an STL mesh is created. Identical operations are performed on objects before and after climate impact. Figure 6 (c) shows both models before and Figure 6 (d) after assembly. The common reference surface of both models was a steel perimeter frame. The frame was painted with matte grey paint, which did not prevent the reflection of laser light. In addition, they will stick reference markers on the surface of the frame for accurate positioning of the frame shape. The single model scan contained 4,994,811 nodes.
Exposure of the test object (Figure 6a) resulted in a point cloud (Figure 6b) representing the scanned surface. Following the removal of artefacts and the optimisation of the point cloud, an STL mesh was generated. These identical procedures were applied to the object both before and after exposure to climatic impacts. Figure 6(c) illustrates both models before assembly, while Figure 6(d) shows them after assembly. A steel perimeter frame served as the common reference surface for both models. When the models, an inspection analysis was performed. The results of the analysis are presented in Section 3.4.

3.4. Comparison of FreeScan UEPro and Faro Focus Scans

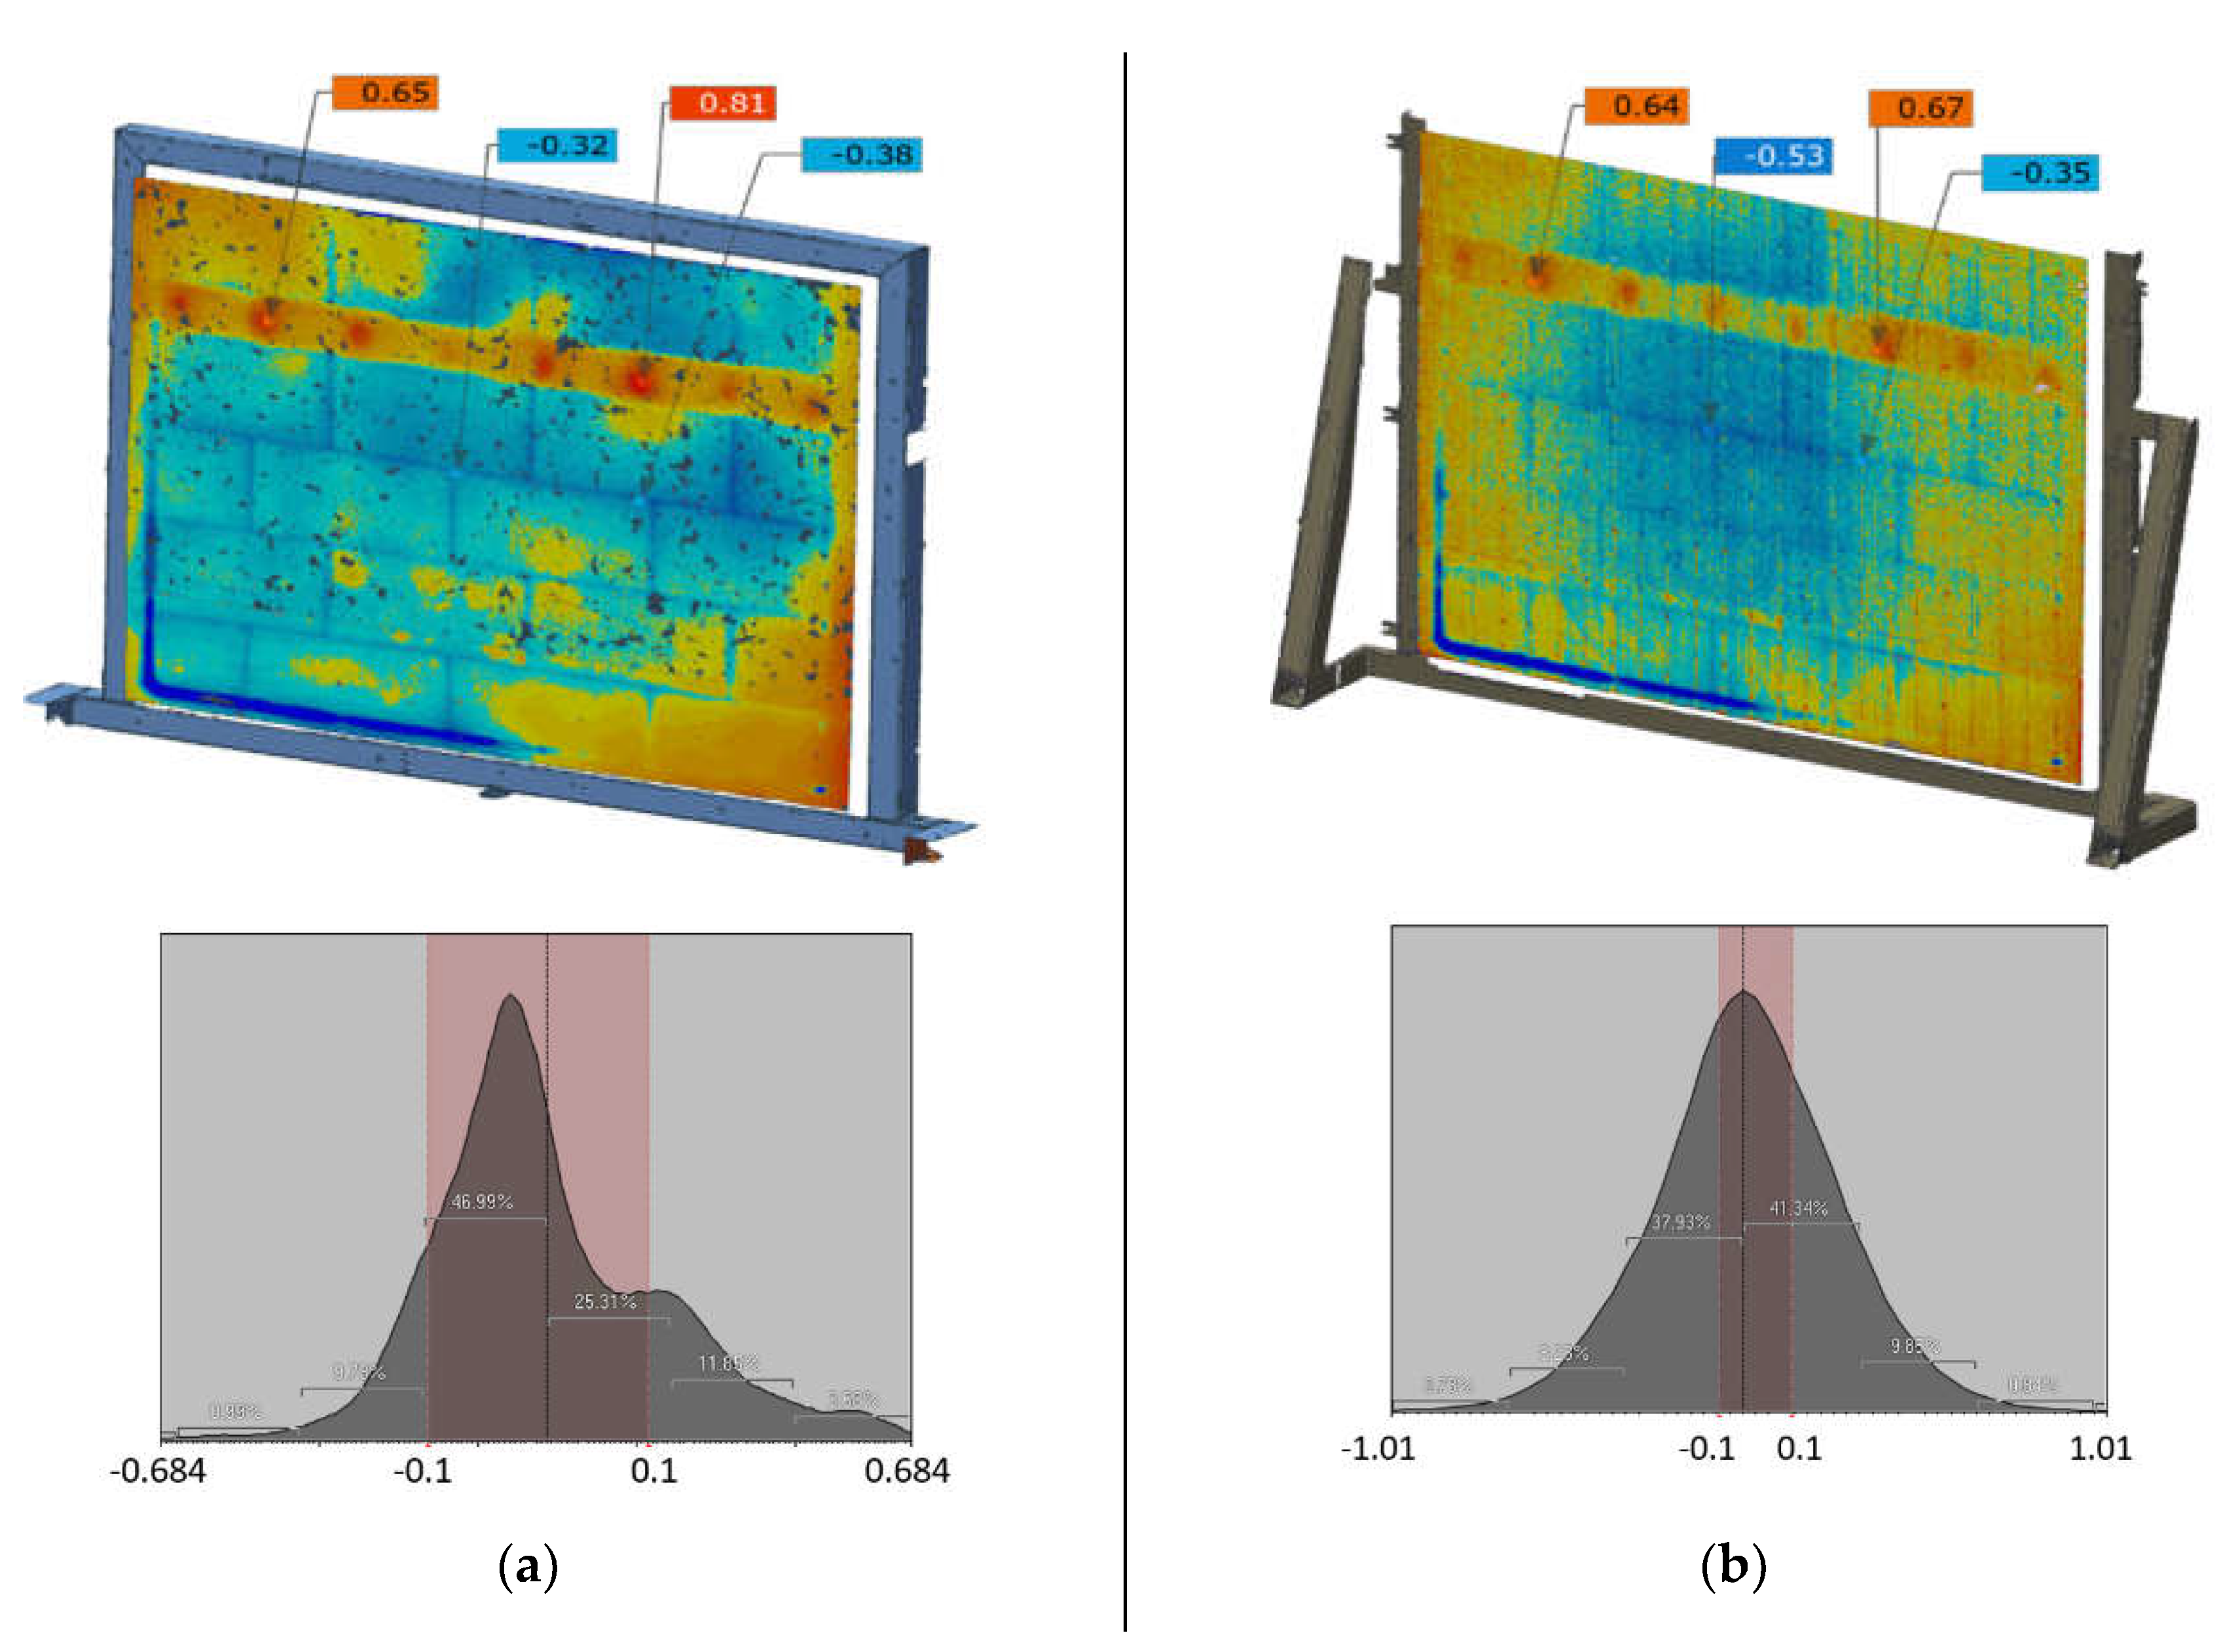
Figure 7 presents the inspection results for two distinct laser scanners: FreeScan UEPro and Faro Focus. The results are displayed both qualitatively, using a colour deformation map, and quantitatively, in the form of deformation values at specific points on the wall surface. These points represent the locations of maximum and minimum deflections within the region of greatest deformation.
Table 3 summarises the statistics of the measurement parameters in relation to the deformation map.
Figure 7(a) shows the measurement results with the FreeScan UEPro. In Figure 7(b) with the FaroFocus scanner, the deformation map obtained with both sets of measurements looks similar.
The deformation maps are the histograms of the measurements, which illustrate the frequency of a random variable within specified intervals. In this instance, the histograms depict the deformation of the operational model relative to the reference model, measured in a direction normal to the reference surface, or in the fitting plane. The red-lined boxes indicate the tolerance interval of ±0.1 mm, which was initially adopted as an analysis criterion. Table 1 and Table 2 summarise the measurement statistics. Table 1 presents the statistics for the entire deformation map, while Table 2 focusses on the selected reference points A, B, C, and D. The number of nodes refers to the number of nodes extracted from the point cloud and used for statistical calculations. For the deformation map, the point cloud encompasses the entire model area. In contrast, for the reference points, only the nodes located within a 3 mm diameter sphere surrounding the respective reference point are considered. Both scanners detected local geometry perturbations at the same location. A horizontal strip of convexity is visible in the upper part of the model (red zone), and a local indentation is visible in the lower left corner (blue zone). The protrusion occurred when a different insulating material was used, while the indentation was caused by the excessive pressure of the sample against the climate chamber. Interestingly, both scanners detected the outlines of the insulation boards that are hidden under the foundation coat. The extreme deformation values shown on the scales of the two sets differ from each other by up to 45%. In addition, four measurement points on the surface of the model were selected for qualitative testing. Two describe the largest convexity and two describe the largest concavity. Comparison of these results indicates agreement on the direction of deformation (concavity, indentation). Discrepancies in the four test points of the FaroFocus model with respect to the FreeScan UEPro model range from 12% to 73%. This is only a sample of test data and is not an evaluation of the performance of the scans tested. The analysis methodology, the test procedure, and the detailed measurement results are presented in [82,83].

4. Discussion

3D scanning is an imaging technique that makes it possible to digitise virtually any object with very high accuracy. The resulting digital copies can be used for a variety of purposes. In civil engineering, 3D scanning is used most frequently to scan large objects. This type of image is used to digitise buildings and engineering structures [22,84]. The example of volumetric scanning concerns an industrial hall in poor condition. When digitising large objects, several problems have already reached the stage of imaging technology and data processing. The most important problem was recognised in the publication [85]and relates to the quality of the data obtained and the way it is processed. From the authors' experience gained during this task, it is clear that maintaining uniform scanning conditions plays an important role in acquiring useful images, especially for in situ work and long-term measurements. Changing environmental conditions, such as temperature and lighting during scanning [56] at different intervals, can cause excessive errors [57] Another troublesome problem is the quality of numerical data acquired during scanning and processed in post-processing. It turns out that scanning surfaces of different textures, dimensions, and transparency (for example, a brick wall and window glass) generates divergent quality point clouds. Thus, it is difficult to apply a uniform noise removal algorithm. In this case, it seems simplest to remove the troublesome quality areas of the point cloud just to preserve the relatively good data quality of the main part of the model. However, the accuracy of the point cloud of the Faro Focus scanner is sufficient to reproduce the drawing documentation of the object to an accuracy of approximately ± 3 mm, as presented in Section 3.1.
Another problem concerns the possibility of using TLS (Faro Focus) techniques to make precise measurements of small deformations of large areas of an object. An example of such a task is the analysis of the influence of the environment on the deformation of the outer insulation layer of multi-story buildings that are undergoing diagnosis or renovation [86]. Precise measurements of this type are problematic for two reasons. The first is the technical accessibility of the surface to be surveyed. Buildings with ETICS external insulation are customaril multistory structures, so access to the surface of the object is limited by the need for precision laser scanners. This type of scanner requires exposure at a short working distance of up to 0.3 m. Maintaining this condition requires the construction of expensive and time-consuming scaffolding. The easiest way is to use a TLC scanner and observe the object from the ground surface. The second reason is the measurement accuracy associated with the device used. To date, testing of large ETICS wall surfaces has only been carried out under laboratory conditions [83]. An abbreviated description of these studies is presented in Section 2.2. The concept of the comparing the quality of scans obtained with different devices is presented in Section 3.4. The results of scanning with FaroFocus and FreeScan UEPro are compared there. These scanners are completely different from each other in terms of image acquisition methods and measurement accuracy. Two assessment methods were adopted: qualitative and quantitative. The qualitative method involved evaluating the deformation of the entire observation area and was usually presented in the form of colour deformation maps. The quantitative method consisted of assessing deformation at selected points, analogous to point sensors. The results of the qualitative method showed agreement in terms of the distribution of the examined model deformation map (Figure 7). The colour-coded deformation images in both scanners were very similar. A horizontal protrusion strip (red) was visible at the mineral wool installation site (description in Section 2.2). The technical defect created when the sample was installed was clearly visible (dark blue L-shaped band in the lower left corner). The surface concavity in the centre of the sample was also recognisable (blue), and even the place where the polystyrene boards were joined (horizontal and vertical lines in dark blue) could be seen. Note that the scan made with a laser (FreeScan UEPro) was much more accurate. The measurement histograms below the deformation maps (Figure 7) were configured differently. This indicated that FreeScan UEPro represented a non-uniform distribution, meaning that the point cloud was precisely aligned with the deformed surface. The Faro Focus histogram was almost symmetric with respect to the mean, indicating that the point cloud spread smoothly regardless of the surface. The predetermined tolerance range of ± 0.1 mm (red area on the histogram) covered a wider area with the FreeScan UEPro scanner. Here were the most valuable data for analysis. Table 3 contains the metrics of both qualitative measurements. The differences in the number of nodes were significant. The FreeScan UEPro scanner generated almost 5 million nodes, while Faro Focus generated more than six times fewer. The RMS and variance parameters were also more precise for FreeScan UEPro. The quantitative comparison for the reference points was divergent (Table 4). The number of nodes adopted for the calculation of statistics at the reference points of the two scanners differed significantly. The FreeScan UEPro scanner had between 10 and 21 nodes available for calculation in the 3mm sphere, while the Faro Focus scanner had a maximum of 2. This was due to the density of point clouds per unit area. The consequence of changing the point cloud density was, of course, a loss of measurement accuracy. If the FreeScan UEPro scan was considered as a reference, the loss of measurement accuracy of the Faro Focus ranged from 12% to 73%. In principle, this was not a disadvantage of the Faro Focus because the device differed significantly in accuracy parameters compared to the FreeScan UEPro. Due to such a large discrepancy in results, quantitative evaluation seemed problematic. In this case, it seemed reasonable to combine two different devices in one test. Such an approach was considered in the publication [68].

5. Conclusions

This paper explores two distinct case studies that involve different scanning techniques, each tailored to specific applications depending on the object under investigation and the scanning devices employed. While the cases are analysed separately, they share a common feature: the unconventional use of the Faro Focus scanner. This approach seeks to assess the suitability of the Faro Focus for both quantitative and qualitative measurements of large surface deformations, a domain traditionally reserved for high-precision, metrological-grade laser scanners. However, the technical challenges posed by the diagnostics of complex objects require innovative approaches to measurement methodologies.
The issue of differentiating measurement accuracy based on the type of equipment used remains a critical topic in the field of measurement science. An example illustrating this approach is found in [9], where the authors discuss various technical solutions for performing measurements under controlled conditions. The current study, independent of prior research, also addresses the importance of solving measurement challenges. The primary objective of this paper is to compare the image acquisition capabilities of different devices, which has practical significance for the advancement of measurement techniques. Specifically, it enables both quantitative and qualitative comparisons of the analysis results when observing a common test object, namely, a large-scale model of an ETICS (External Thermal Insulation Composite System) insulation wall.
At the heart of this research is the examination of the similarities and differences between the scanning techniques used. The findings confirm the hypothesis that different 3D scanning technologies produce consistent qualitative results, particularly in the identification of surface deformations. This information is crucial in determining the effectiveness of each method in the preliminary diagnosis of surface irregularities. However, significant discrepancies were observed in the quantitative data obtained from the different scanning techniques, indicating the need for further investigation.
However, these variations do not disqualify the Faro Focus scanner compared to the more precise FreeScan UE Pro scanner. Instead, the results suggest that, while the Faro Focus scanner may face challenges in achieving the highest level of accuracy for certain applications, it remains a valuable tool for qualitative assessment. Its use of Terrestrial Laser Scanning (TLS) can effectively identify areas with significant deformation, streamlining the process of detecting problematic regions. Nevertheless, for more detailed and accurate quantitative analysis, structured light scanning (SLS) technologies should be preferred.
It is important to note that the results presented in this article were obtained under controlled laboratory conditions and at short distances. The authors acknowledge the limitations associated with these conditions and, as such, the findings should be considered preliminary. This study marks the beginning of a broader research effort, with ongoing work focused on conducting similar measurements under real-world (in situ) conditions. Future publications will expand upon the findings presented here and offer deeper insights into the application of these techniques in field settings.

Author Contributions

conceptualization, A.P, J.S. and A.M.; methodology, A.P, A.M.; software, A.P.; validation, A.P., formal analysis, A.P.; investigation, A,P, A.M and I.S; resources, A.P, A.M, J.S and I.S.; data curation, A.P, A.M writing—original draft preparation, A.P, J.S.; writing—review and editing, A.P.; visualization, A.P, A.M.; supervision, A.P.; project administration, A.P, J.S. All authors have read and agreed to the published version of the manuscript.

Funding

this research was funded by the Ministry of Education and Science as part of the projects: NZK-119/2024 and NZK-117/2024.

Institutional Review Board Statement

not applicable.

Informed Consent Statement

not applicable.

Data Availability Statement

the data presented in this study are available on request from the corresponding author (due to privacy).

Conflicts of Interest

the authors declare no conflicts of interest. The funders had no role in the study’s design; in the collection, analyses, or interpretation of data; in the writing of the manuscript; or in the decision to publish the results.

References

  1. Relich, M. Product Development: State of the Art and Challenges. In; Springer, Cham, 2021; pp. 1–26.
  2. Amigo, C.R.; Iritani, D.R.; Rozenfeld, H.; Ometto, A. Product Development Process Modeling: State of the Art and Classification. Lect. Notes Prod. Eng. 2013, Part F1158, 169–179. [CrossRef]
  3. Kolfschoten, G.; De Vreede, G.J. A Design Approach for Collaboration Processes: A Multimethod Design Science Study in Collaboration Engineering. J. Manag. Inf. Syst. 2009, 26, 225–256. [CrossRef]
  4. Wynn, D.C.; Clarkson, P.J. Process Models in Design and Development. Res. Eng. Des. 2018, 29, 161–202. [CrossRef]
  5. Stănăşel, I.; Buidoş, T.; Crăciun, D. Rapid Prototyping Technology and 3d Scanning Verification. Case Study. 2017.
  6. Kritzinger, W.; Karner, M.; Traar, G.; Henjes, J.; Sihn, W. Digital Twin in Manufacturing: A Categorical Literature Review and Classification. IFAC-PapersOnLine 2018, 51, 1016–1022. [CrossRef]
  7. Botín-Sanabria, D.M.; Mihaita, S.; Peimbert-García, R.E.; Ramírez-Moreno, M.A.; Ramírez-Mendoza, R.A.; Lozoya-Santos, J. de J. Digital Twin Technology Challenges and Applications: A Comprehensive Review. Remote Sens. 2022, 14, 1–25. [CrossRef]
  8. Yu, W.; Patros, P.; Young, B.; Klinac, E.; Walmsley, T.G. Energy Digital Twin Technology for Industrial Energy Management: Classification, Challenges and Future. Renew. Sustain. Energy Rev. 2022, 161, 112407. [CrossRef]
  9. Lipowiecki, I.; Rządkowski, W.; Zapał, W.; Kowalik, M. Combining the Technology of Long-Range Laser 3D Scanners and Structured Light Handheld 3D Scanners to Digitize Large-Sized Objects. Adv. Sci. Technol. Res. J. 2023, 17, 196–205. [CrossRef]
  10. Javaid, M.; Haleem, A.; Pratap Singh, R.; Suman, R. Industrial Perspectives of 3D Scanning: Features, Roles and It’s Analytical Applications. Sensors Int. 2021, 2, 100114. [CrossRef]
  11. Daneshmand, M.; Helmi, A.; Avots, E.; Noroozi, F.; Alisinanoglu, F.; Arslan, H.S. 3D Scanning : A Comprehensive Survey. Comput. Vis. Pattern Recognit. 2018. [CrossRef]
  12. Mihić, M.; Sigmund, Z.; Završki, I.; Butković, L.L. An Analysis of Potential Uses, Limitations and Barriers to Implementation of 3D Scan Data for Construction Management-Related Use - Are the Industry and the Technical Solutions Mature Enough for Adoption? Buildings 2023, 13. [CrossRef]
  13. Marshall, G.F.; Stutz, G.E. Handbook of Optical and Laser Scanning; CRC Press: Boca Raton, 2018; ISBN 9781315218243.
  14. De Luca, D.; Del Giudice, M.; Grasso, N.; Matrone, F.; Osello, A.; Piras, M. Handheld Volumetric Scanner for 3D Printed Integrations of Historical Elements: Comprasion and Resilts. Int. Arch. Photogramm. Remote Sens. Spat. Inf. Sci. - ISPRS Arch. 2019, 42, 381–388. [CrossRef]
  15. Nagy, Z.; Kelemen, A.; Sánduly, A. 3D Scanning Applications in Structural Design. In Proceedings of the IABSE Symposium Prague, 2022: Challenges for Existing and Oncoming Structures - Report; 2022; pp. 1079–1086.
  16. van Brügge, L.; Çetin, K.M.; Koeberle, S.J.; Thiele, M.; Sturm, F.; Hornung, M. Application of 3D-Scanning for Structural and Geometric Assessment of Aerospace Structures. CEAS Aeronaut. J. 2023, 14, 455–467. [CrossRef]
  17. Urbas, U.; Hrga, T.; Povh, J.; Vukašinović, N. Novel Alignment Method for Optical 3D Gear Metrology of Spur Gears with a Plain Borehole. Measurement 2022, 192, 110839. [CrossRef]
  18. Butini, E.; Marini, L.; Meli, E.; Rindi, A.; Valigi, M.; Logozzo, S. Development and Validation of Wear Models by Using Innovative Three-Dimensional Laser Scanners. Adv. Mech. Eng. 2019, 11, 168781401987040. [CrossRef]
  19. Salah, Y. Ben; Weiguo, L.; Sellami, L.; Hamida, A. Ben; Ailing, T. New and Optimal Set up for 3D-Based Stereovision System for Manufacturing Inspection in 4.0 Industry. In Proceedings of the International Conference on Advanced Technologies for Signal and Image Processing, ATSIP 2022; IEEE, May 24 2022; pp. 1–6.
  20. Peansupap, V.; May, A.M. Development of a System for Measuring Surface Slope with Point Cloud Data. In Lecture Notes in Civil Engineering; Springer Science and Business Media Deutschland GmbH, 2024; Vol. 369, pp. 507–516 ISBN 9789819940486.
  21. Tran, H.H.; Vu, H.Q.; Van Tran, A. Application of FARO Focus 3D S350 Terrestrial Laser Scanner in Building 3D Models of Potential Areas of Landslides and Rocks—Case Study in Ha Giang Province, Vietnam. In Proceedings of the Lecture Notes in Civil Engineering; Springer Science and Business Media Deutschland GmbH, 2024; Vol. 344 LNCE, pp. 703–710.
  22. Shen, N.; Wang, B.; Ma, H.; Zhao, X.; Zhou, Y.; Zhang, Z.; Xu, J. A Review of Terrestrial Laser Scanning (TLS)-Based Technologies for Deformation Monitoring in Engineering. Meas. J. Int. Meas. Confed. 2023, 223, 113684. [CrossRef]
  23. Feng, P.; Zou, Y.; Hu, L.; Liu, T.Q. Use of 3D Laser Scanning on Evaluating Reduction of Initial Geometric Imperfection of Steel Column with Pre-Stressed CFRP. Eng. Struct. 2019, 198, 109527. [CrossRef]
  24. Tzortzinis, G.; Ai, C.; Breña, S.F.; Gerasimidis, S. Using 3D Laser Scanning for Estimating the Capacity of Corroded Steel Bridge Girders: Experiments, Computations and Analytical Solutions. Eng. Struct. 2022, 265, 114407. [CrossRef]
  25. Withers, P.J.; Bouman, C.; Carmignato, S.; Cnudde, V.; Grimaldi, D.; Hagen, C.K.; Maire, E.; Manley, M.; Du Plessis, A.; Stock, S.R. X-Ray Computed Tomography. Nat. Rev. Methods Prim. 2021, 1. [CrossRef]
  26. Maire, E.; Withers, P.J. Quantitative X-Ray Tomography. Int. Mater. Rev. 2014, 59, 1–43. [CrossRef]
  27. Buffiere, J.Y.; Maire, E.; Adrien, J.; Masse, J.P.; Boller, E. In Situ Experiments with X Ray Tomography: An Attractive Tool for Experimental Mechanics. Exp. Mech. 2010, 50, 289–305. [CrossRef]
  28. Flugge, J.; Wendt, K.; Danzebrink, H.; Abou-zeid, A. Optical Methods for Dimensional Metrology in Production Engineering. CIRP Ann. - Manuf. Technol. 2002, 51, 685–699.
  29. Szilvási-Nagy, M.; Mátyási, G. Analysis of STL Files. Math. Comput. Model. 2003, 38, 945–960. [CrossRef]
  30. Haleem, A.; Javaid, M.; Singh, R.P.; Rab, S.; Suman, R.; Kumar, L.; Khan, I.H. Exploring the Potential of 3D Scanning in Industry 4.0: An Overview. Int. J. Cogn. Comput. Eng. 2022, 3, 161–171. [CrossRef]
  31. Bell, T.; Li, B.; Zhang, S. Structured Light Techniques and Applications. Wiley Encycl. Electr. Electron. Eng. 2016, 1–24. [CrossRef]
  32. Schenk, T. Introduction to Photogrammetry; 2005; ISBN 9781609181765.
  33. Lopez Paredes, A.; Song, Q.; Conde, M.H. Performance Evaluation of State-of-the-Art High-Resolution Time-of-Flight Cameras. IEEE Sens. J. 2023, 23, 13711–13727. [CrossRef]
  34. Baqersad, J.; Poozesh, P.; Niezrecki, C.; Avitabile, P. Photogrammetry and Optical Methods in Structural Dynamics – A Review. Mech. Syst. Signal Process. 2017, 86, 17–34. [CrossRef]
  35. Ding, D.; Ding, W.; Huang, R.; Fu, Y.; Xu, F. Research Progress of Laser Triangulation On-Machine Measurement Technology for Complex Surface: A Review. Meas. J. Int. Meas. Confed. 2023, 216, 113001. [CrossRef]
  36. Georgopoulos, A.; Ioannidis, C.; Valanis, A. Assessing the Performance of a Structured Light Scanner. In Proceedings of the International Archives of the Photogrammetry, Remote Sensing and Spatial Information Sciences - ISPRS Archives; 2010; Vol. 38.
  37. Ke, T.; Zhang, Z.X.; Huang, S. The Scanning Photogrammetry. Int. Arch. Photogramm. Remote Sens. Spat. Inf. Sci. 2012, XXXIX-B5, 345–349. [CrossRef]
  38. Huang, S.; Zhang, Z.; Ke, T.; Tang, M.; Xu, X. Scanning Photogrammetry for Measuring Large Targets in Close Range. Remote Sens. 2015, 7, 10042–10077. [CrossRef]
  39. Kolb, A.; Barth, E.; Koch, R.; Larsen, R. Time-of-Flight Cameras in Computer Graphics. Comput. Graph. Forum 2010, 29, 141–159. [CrossRef]
  40. Malhotra, A.; Gupta, K.; Kant, K. Laser Triangulation for 3D Profiling of Target. Int. J. Comput. Appl. 2011, 35, 975–8887.
  41. Dorsch, R.G.; Häusler, G.; Herrmann, J.M. Laser Triangulation: Fundamental Uncertainty in Distance Measurement. Appl. Opt. 1994, 33, 1306. [CrossRef]
  42. SHINING 3D Tech Co. Ltd. FreeScan Trio User Manual; Hangzhou, China, 2024;
  43. Freeman Gebler, O.; Goudswaard, M.; Hicks, B.; Jones, D.; Nassehi, A.; Snider, C.; Yon, J. A Comparison of Structured Light Scanning and Photogrammetry for the Digitisation of Physical Prototypes. Proc. Des. Soc. 2021, 1, 11–20. [CrossRef]
  44. Dipanda, A.; Woo, S. Towards a Real-Time 3D Shape Reconstruction Using a Structured Light System. Pattern Recognit. 2005, 38, 1632–1650. [CrossRef]
  45. Sen, A.K. Moire Patterns. Comput. Graph. 2000, 24, 471–475. [CrossRef]
  46. Durelli, A.J. The Moiré Method-a Review - Discussion. Exp. Mech. 1983, 23, 446–449. [CrossRef]
  47. Muralikrishnan, B. Performance Evaluation of Terrestrial Laser Scanners - A Review. Meas. Sci. Technol. 2021, 32, 072001.
  48. Aryan, A.; Bosché, F.; Tang, P. Planning for Terrestrial Laser Scanning in Construction: A Review. Autom. Constr. 2021, 125. [CrossRef]
  49. Wu, C.; Yuan, Y.; Tang, Y.; Tian, B. Application of Terrestrial Laser Scanning (Tls) in the Architecture, Engineering and Construction (Aec) Industry; 2022; Vol. 22; ISBN 8604118470.
  50. Qingquan, L.; Bijun, L.; Jing, C. Research on Laser Range Scanning and Its Application. Geo-Spatial Inf. Sci. 2001, 4, 37–42. [CrossRef]
  51. Hillier, N.; Ryde, J.; Widzyk-Capehart, E. Comparison of Scanning Laser Range-Finders and Millimetre-Wave Radar for Creating a Digital Terrain Map. 16th Annu. Conf. Mechatronics Mach. Vis. Pract. 2010, M2VIP 2010 2010, 69–84. [CrossRef]
  52. Ao, S.; Gelman, L. Advances in Electrical Engineering and Computational Science; 2009; Vol. 39 LNEE; ISBN 9789048123100.
  53. Dawda, A.; Nguyen, M. Comparison of Red versus Blue Laser Light for Accurate 3D Measurement of Highly Specular Surfaces in Ambient Lighting Conditions. In Proceedings of the Communications in Computer and Information Science; Springer Science and Business Media Deutschland GmbH, 2021; Vol. 1386 CCIS, pp. 300–312.
  54. Wedgbrow, G. Plant & Works Engineering. Tonbridge, England 2022, pp. 32–33.
  55. Franke, J.; Koutecký, T.; Koutný, D. Comparison of Sublimation 3D Scanning Sprays in Terms of Their Effect on the Resulting 3D Scan, Thickness, and Sublimation Time. Materials (Basel). 2023, 16. [CrossRef]
  56. Blanco, D.; Fernandez, P.; Cuesta, E.; Suarez, C.M.; Beltran, N. Selection of Ambient Light for Laser Digitizing of Quasi-Lambertian Surfaces. Lect. Notes Electr. Eng. 2009, 39 LNEE, 447–457. [CrossRef]
  57. Helle, R.H.; Lemu, H.G. A Case Study on Use of 3D Scanning for Reverse Engineering and Quality Control. Mater. Today Proc. 2021, 45, 5255–5262. [CrossRef]
  58. Yao, A.W.L. Applications of 3D Scanning and Reverse Engineering Techniques for Quality Control of Quick Response Products. Int. J. Adv. Manuf. Technol. 2005, 26, 1284–1288. [CrossRef]
  59. Yilmaz, B.; Marques, V.R.; Donmez, M.B.; Cuellar, A.R.; Lu, W.E.; Abou-Ayash, S.; Çakmak, G. Influence of 3D Analysis Software on Measured Deviations of CAD-CAM Resin Crowns from Virtual Design File: An in-Vitro Study. J. Dent. 2022, 118. [CrossRef]
  60. Taraben, J.; Morgenthal, G. Automated Linking of 3D Inspection Data for Damage Analysis. In Proceedings of the Bridge Maintenance, Safety, Management, Life-Cycle Sustainability and Innovations - Proceedings of the 10th International Conference on Bridge Maintenance, Safety and Management, IABMAS 2020; CRC Press/Balkema, April 19 2021; pp. 3714–3720.
  61. Stałowska, P.; Suchocki, C.; Rutkowska, M. Crack Detection in Building Walls Based on Geometric and Radiometric Point Cloud Information. Autom. Constr. 2022, 134. [CrossRef]
  62. Li, N.; Wang, Y.; Geng, W.; Li, Z. Enhancing Extraction of Two-Dimensional Engineering Drawings from Three-Dimensional Data of Existing Buildings. J. Build. Eng. 2023, 76, 107235. [CrossRef]
  63. Stanley, T. Assessment of the FARO 3D Focus Laser Scanner for Forest Inventory A Dissertation Submitted By, University of Southern Queensland, 2013.
  64. Kersten, T.P.; Lindstaedt, M. Geometric Accuracy Investigations of Terrestrial Laser Scanner Systems in the Laboratory and in the Field. Appl. Geomatics 2022, 14, 421–434. [CrossRef]
  65. Pervolarakis, Z.; Zidianakis, E.; Katzourakis, A.; Evdaimon, T.; Partarakis, N.; Zabulis, X.; Stephanidis, C. Three-Dimensional Digitization of Archaeological Sites—The Use Case of the Palace of Knossos. Heritage 2023, 6, 904–927. [CrossRef]
  66. FARO Technologies Inc. Faro Focus Laser Scanner User Manual; Worldwide, 2011;
  67. Chow, J.C.K.; Lichti, D.D.; Teskey, W.F.; Key, C. Accuracy Assessment of the FARO Focus 3D and Leica HDS6100 Panoramic- Type Terrestrial Laser Scanners through Point-Based and Plane-Based User Self-Calibration. In Proceedings of the Proceedings of the FIG Working Week: Knowing to Manage the Territory, Protect the Environment, Evaluate the Cultural Heritage; 2012; Vol. 610, pp. 6–10.
  68. Chiabrando, F.; Sammartano, G.; Spanò, A.; Spreafico, A. Hybrid 3D Models: When Geomatics Innovations Meet Extensive Built Heritage Complexes. ISPRS Int. J. Geo-Information 2019, 8. [CrossRef]
  69. Rocha, G.; Mateus, L.; Fernández, J.; Ferreira, V. A Scan-to-Bim Methodology Applied to Heritage Buildings. Heritage 2020, 3, 47–65. [CrossRef]
  70. Parras, D.; Cavas-Martínez, F.; Nieto, J.; Cañavate, F.J.F.; Fernández-Pacheco, D.G. Reconstruction by Low Cost Software Based on Photogrammetry as a Reverse Engineering Process. In Proceedings of the Lecture Notes in Computer Science (including subseries Lecture Notes in Artificial Intelligence and Lecture Notes in Bioinformatics); Springer Verlag, 2018; Vol. 10909 LNCS, pp. 145–154.
  71. Michalak, J. External Thermal Insulation Composite Systems (ETICS) from Industry and Academia Perspective. Sustain. 2021, 13. [CrossRef]
  72. Fernandes, C.; De Brito, J.; Cruz, C.O. Architectural Integration of ETICS in Building Rehabilitation. J. Build. Eng. 2016, 5, 178–184. [CrossRef]
  73. Dong, Y.; Kong, J.; Mousavi, S.; Rismanchi, B.; Yap, P.S. Wall Insulation Materials in Different Climate Zones: A Review on Challenges and Opportunities of Available Alternatives. Thermo 2023, 3, 38–65.
  74. European Committee for Standardization EN 16383:2016 - Thermal Insulation Products for Building Applications. Determination of the Hygrothermal Behaviour of External Thermal Insulation Composite Systems with Renders (ETICS); Brussel, Belgium, 2016;
  75. SHINING 3D Tech Co. Ltd. FreeScan UE Pro User Manual; Shining 3D Offices: Hangzhou, China, 2023;
  76. Le, Q.; Liscio, E. A Comparative Study between FARO Scene and FARO Zone 3D for Area of Origin Analysis. Forensic Sci. Int. 2019, 301, 166–173. [CrossRef]
  77. Dhruwa, L.; Garg, P.K. Generation of 3-D Large-Scale Maps Using LiDAR Point Cloud Data. In Proceedings of the International Archives of the Photogrammetry, Remote Sensing and Spatial Information Sciences - ISPRS Archives; International Society for Photogrammetry and Remote Sensing, December 14 2023; Vol. 48, pp. 1–5.
  78. Dhruwa, L.; Garg, P.K. Positional Accuracy Assessment of Features Using Lidar Point Cloud. In Proceedings of the International Archives of the Photogrammetry, Remote Sensing and Spatial Information Sciences - ISPRS Archives; International Society for Photogrammetry and Remote Sensing, September 5 2023; Vol. 48, pp. 77–80.
  79. Marzouk, M.; El-Bendary, N. Facility Management of Gas Turbine Power Plants Using 3D Laser Scanning. HBRC J. 2022, 18, 73–83. [CrossRef]
  80. Regassa Hunde, B.; Debebe Woldeyohannes, A. Future Prospects of Computer-Aided Design (CAD) – A Review from the Perspective of Artificial Intelligence (AI), Extended Reality, and 3D Printing. Results Eng. 2022, 14, 100478. [CrossRef]
  81. Szer, J.; Jeruzal, J.; Szer, I.; Filipowicz, P. Periodic Inspections of Buildings -Recommendations, Requirements and Problems; Monography.; Lodz University of Technology: Lodz, Poland, 2020; ISBN 978-83-66287-43-3.
  82. Sudoł, E.; Piekarczuk, A.; Kozikowska, E.; Mazurek, A. Resistance of External Thermal Insulation Systems with Fire Barriers to Long-Lasting Weathering. 2024.
  83. Piekarczuk, A.; Sudoł, E.; Mazurek, A. Measurement Analysis of Large-Area Elements of External Thermal Insulation Composite Systems Using 3D Scanning Techniques. Meas. J. Int. Meas. Confed. 2024, 233. [CrossRef]
  84. Wang, J.; Yi, T.; Liang, X.; Ueda, T. Application of 3D Laser Scanning Technology Using Laser Radar System to Error Analysis in the Curtain Wall Construction. Remote Sens. 2023, 15. [CrossRef]
  85. Almukhtar, A.; Saeed, Z.O.; Abanda, H.; Tah, J.H.M. Reality Capture of Buildings Using 3D Laser Scanners. CivilEng 2021, 2, 214–235. [CrossRef]
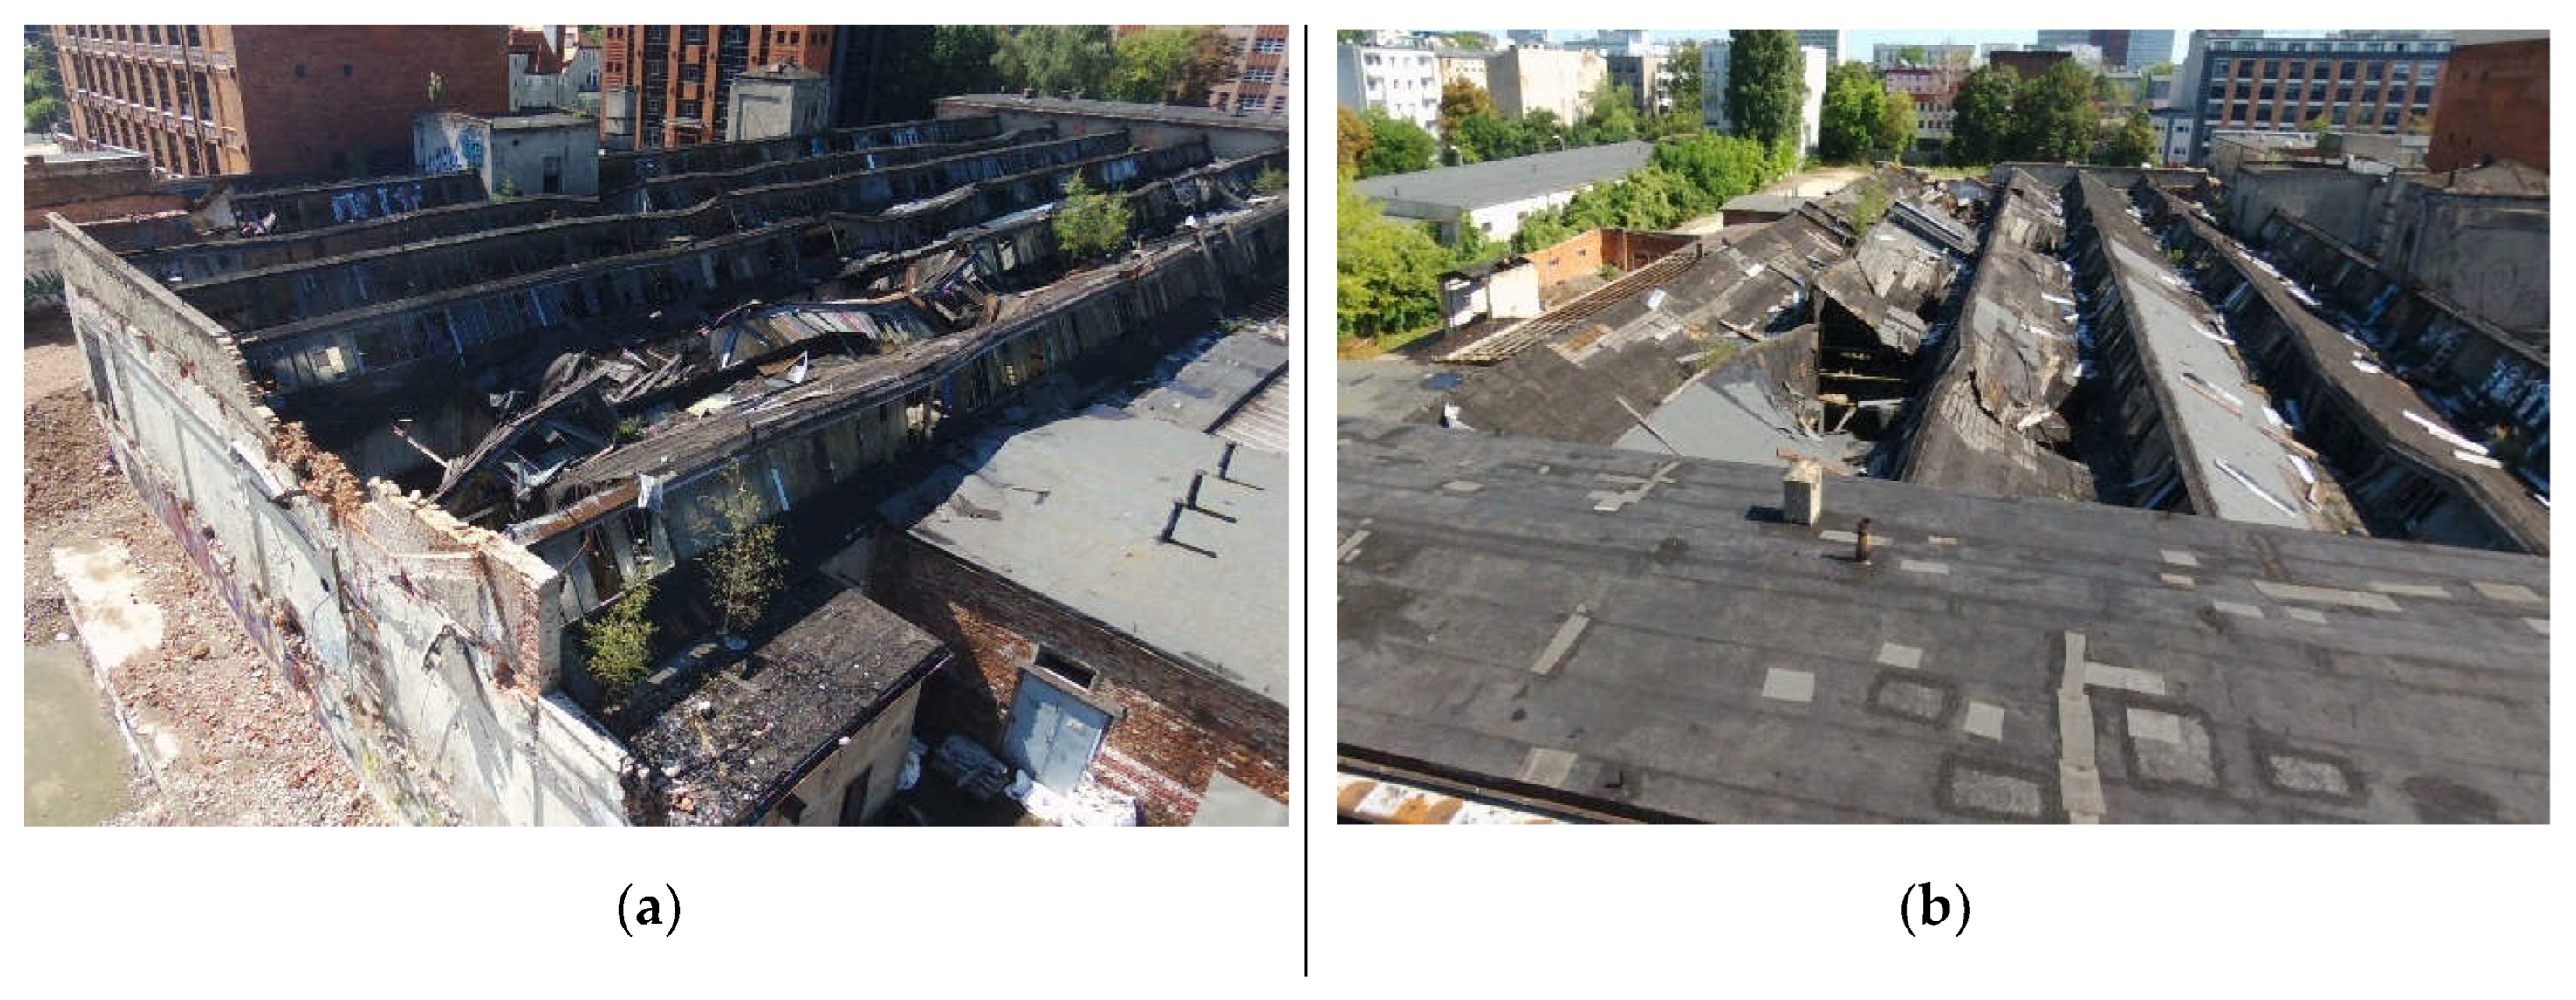
Figure 1. Photograph of the facility, (a), (b) exterior view, (c), (d) interior view.
Preprints 137984 g001aPreprints 137984 g001b
Figure 2. ETICS wall test object, (a) insulation layer, (b) description of layers, (c) climate chamber, (d) object before testing.
Preprints 137984 g002
Figure 3. 3D scan of the facility, (a) interior of the hall, (b) hall from the outside.
Preprints 137984 g003
Figure 4. Image of a cubic object, (a) 3D scan, (b) CAD model.
Preprints 137984 g004
Figure 5. Isolation wall scanning, (a) scanning process, (b) STL image of the point cloud.
Preprints 137984 g005
Figure 6. 3D image acquisition process, (a) scanning, (b) point cloud, (c) image assembly) and (d) result of image assembly.
Preprints 137984 g006
Figure 6. Results of the inspection analysis, (a) measurement results with the FreeScan UEPro scanner, and (b) measurement results with the Faro Focus scanner.
Preprints 137984 g007
Table 1. Basic technical parameters of the Faro Focus scanner.
Distance Measurement Error Angular Precision Position Accuracy
Laser Class
± 1 mm 19 sec 10 m: 2 mm / 25 m : 3.5mm Class 1 wavelength 1550 nm
Table 2. Basic technical parameters of the FreeScan UEPro scanner.
Scan Mode Light Source Volumetric Accuracy Scan Accuracy Scan Speed
Multiple Lines Scan, Single Line Scan 26 laser lines, single laser line 0.02+0.03 mm/m (standard mode) Up to 0.02 mm 1,850,000 points/s
Fine Scan 7 parallel laser lines 0.02+0.015 mm/m (built-in photogrammetry mode)
Table 3. Measurement statistics of the deformation map.
Name Type of Scanner
FreeScan UEPro FaroFocus
Number of nodes 4,994,811 777,645
Min. [mm] -1.2248 -5.6247
Max. [mm] 1.2247 3.6395
Avg. [mm] 0.0141 -0.0359
RMS [mm] 0.2239 0.3278
Std. Dev. [mm] 0.2234 0.3258
Var. [mm] 0.0499 0.1062
Table 4. Summarises the measurement statistics for the single reference points labelled A, B, C, and D (Figure 7).
Name Type of scanner
FreeScan UEPro FaroFocus
Reference point A B C D A B C D
Number of nodes 19 12 21 10 2 1 2 1
Min. [mm] 0.5898 0.7875 -0.3570 -0.4146 0.5493 0.671 -0.5679 -0.2925
Max. [mm] 0.6968 0.8328 -0.2257 -0.3591 0.5693 0.671 -0.4679 -0.2925
avg. [mm] 0.6354 0.8100 -0.2997 -0.3839 0.5593 0.671 -0.5179 -0.2925
RMS [mm] 0.6363 0.8102 0.3028 0.3844 0.5594 0.671 0.5203 0.2925
Std. Dev. [mm] 0.0322 0.0157 0.0429 0.0199 0.01 0 0.05 0
Var. [mm] 0.001 0.0002 0.0018 0.0004 0.0001 0 0.0025 0
Disclaimer/Publisher’s Note: The statements, opinions and data contained in all publications are solely those of the individual author(s) and contributor(s) and not of MDPI and/or the editor(s). MDPI and/or the editor(s) disclaim responsibility for any injury to people or property resulting from any ideas, methods, instructions or products referred to in the content.
Copyright: This open access article is published under a Creative Commons CC BY 4.0 license, which permit the free download, distribution, and reuse, provided that the author and preprint are cited in any reuse.
Prerpints.org logo

Preprints.org is a free preprint server supported by MDPI in Basel, Switzerland.

Subscribe

© 2024 MDPI (Basel, Switzerland) unless otherwise stated