Submitted:
29 October 2024
Posted:
31 October 2024
You are already at the latest version
Abstract
Keywords:
1. Introduction
1.1. Attitudes & Remembering
1.2. Metamemory
1.3. Overview
2. Materials and Methods
2.1. Participants
2.2. Materials
2.3. Procedure
3. Results
3.1. ANOVAs to Compare Memory and Metamemory Outcomes Across Conditions (These Analyses Are Not Related to Study Hypotheses But Are Included for Demonstrating the Validity of Our Data)
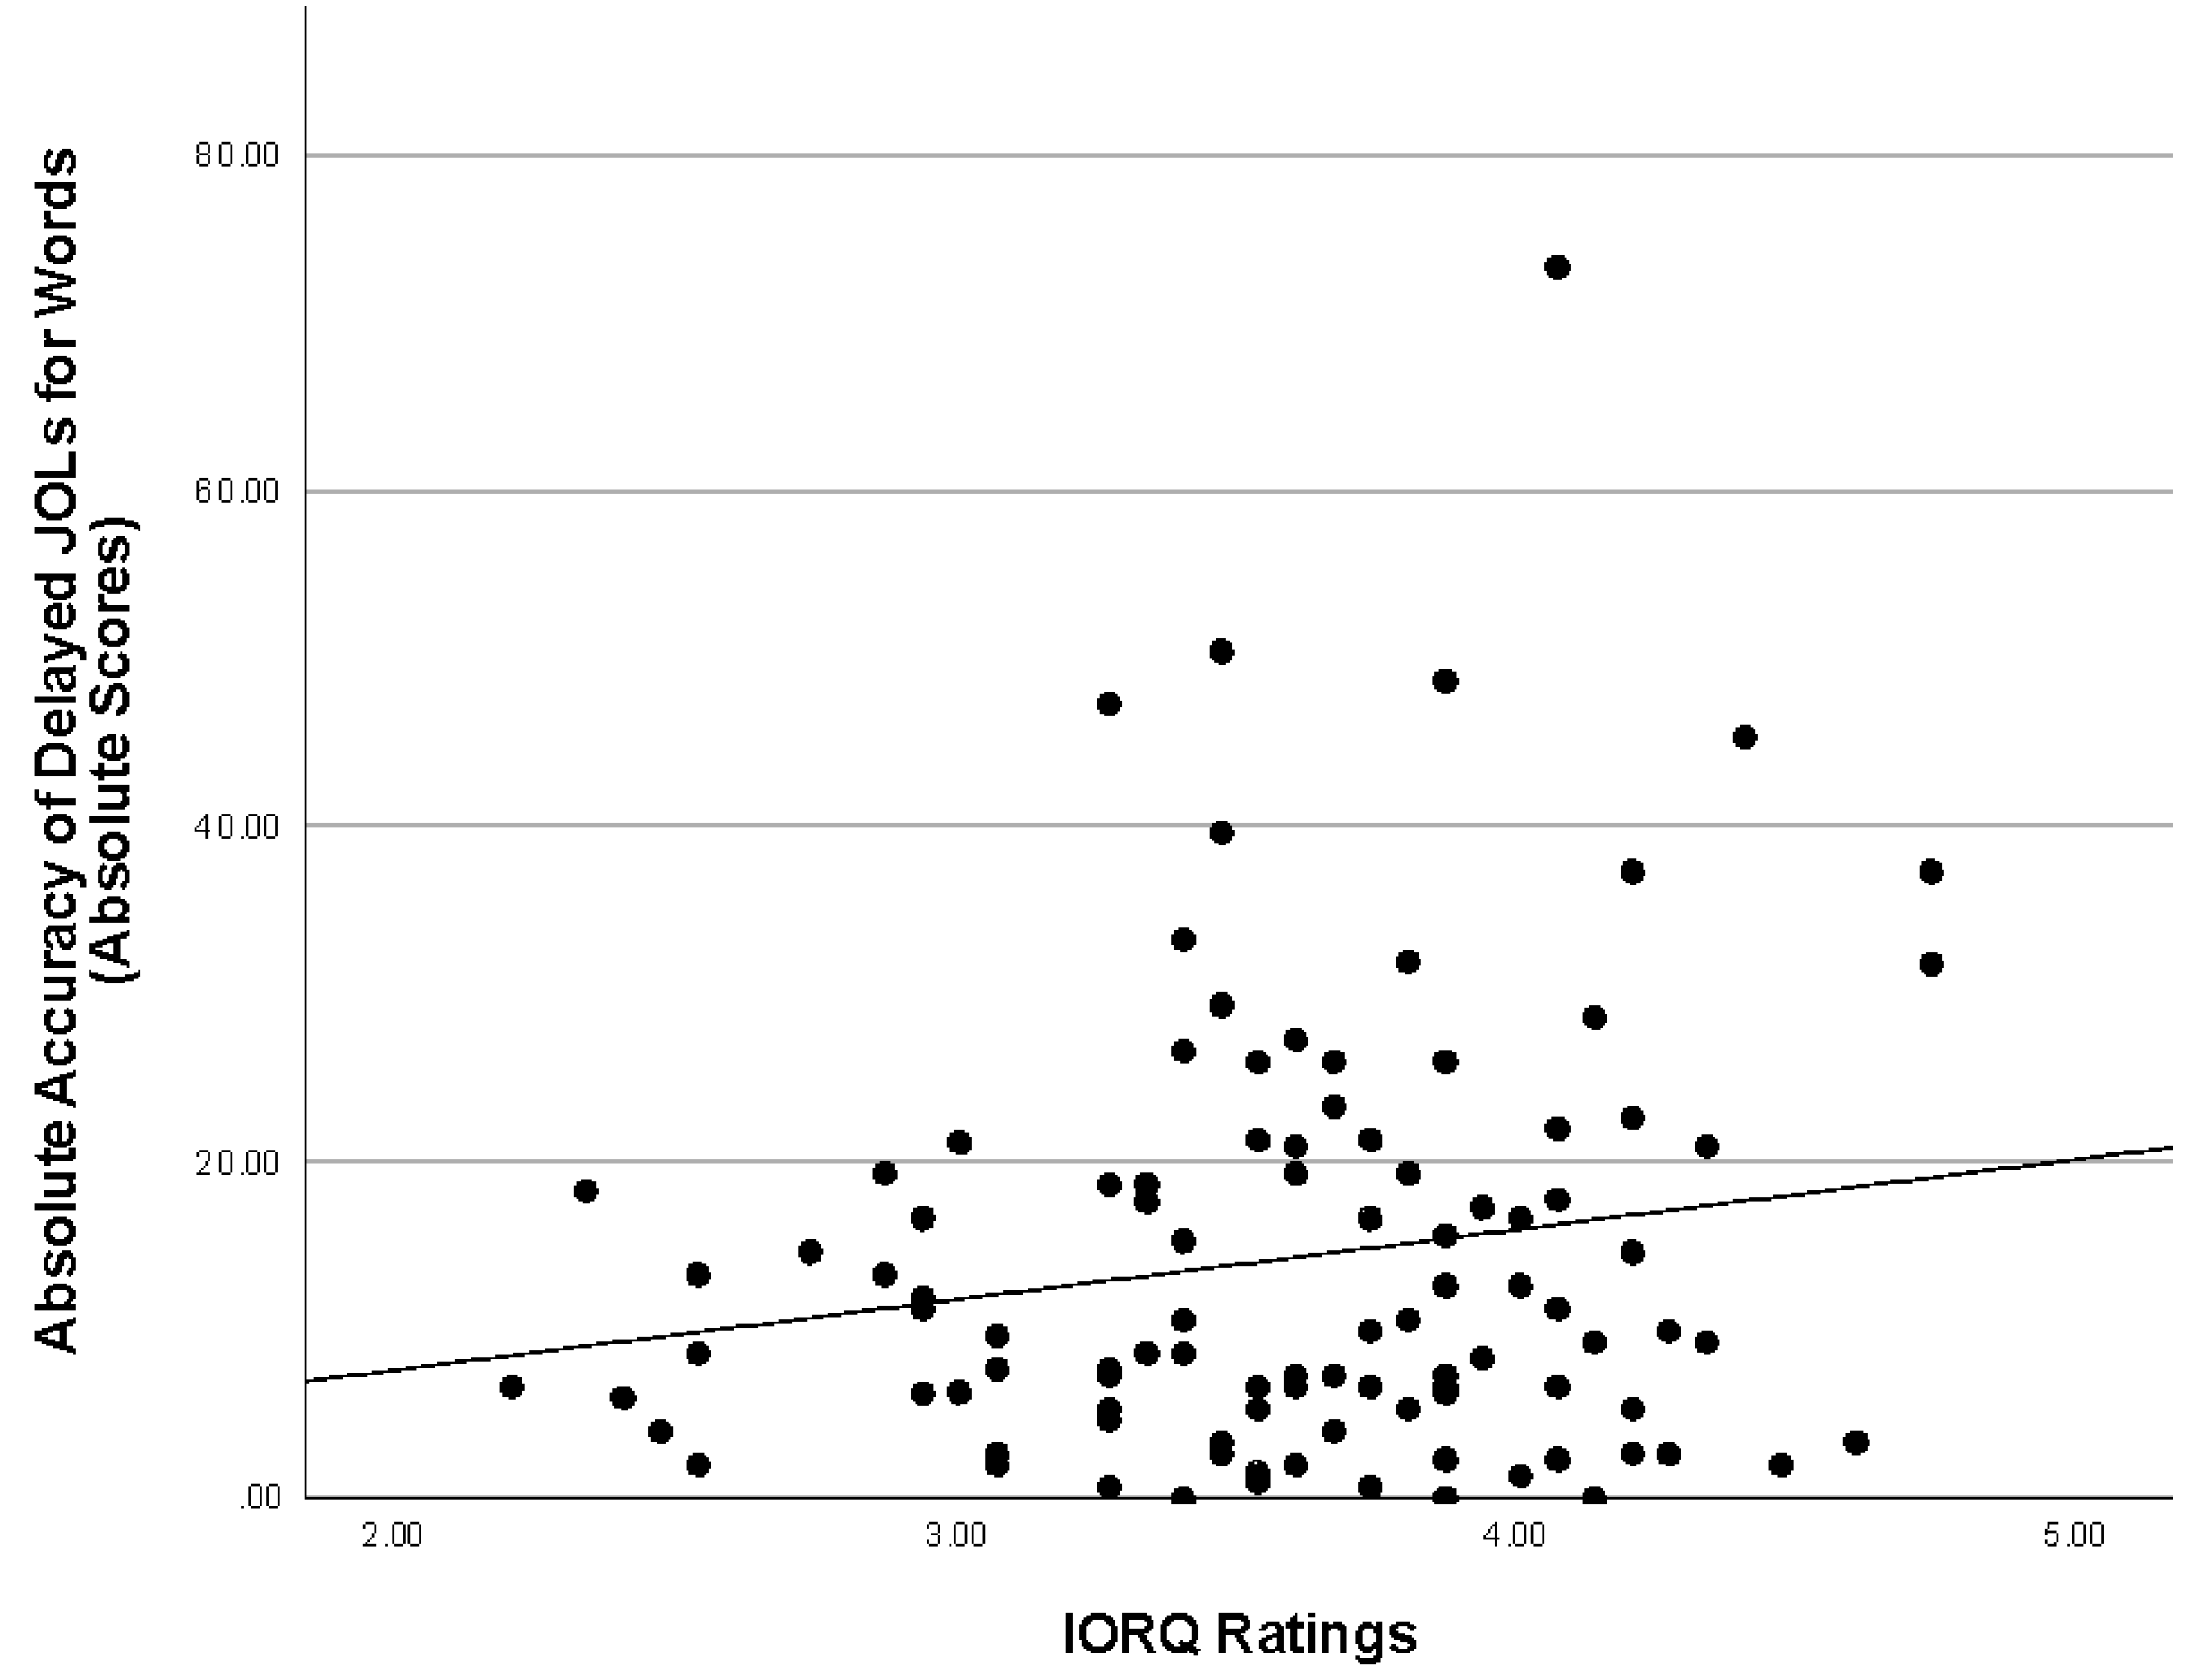
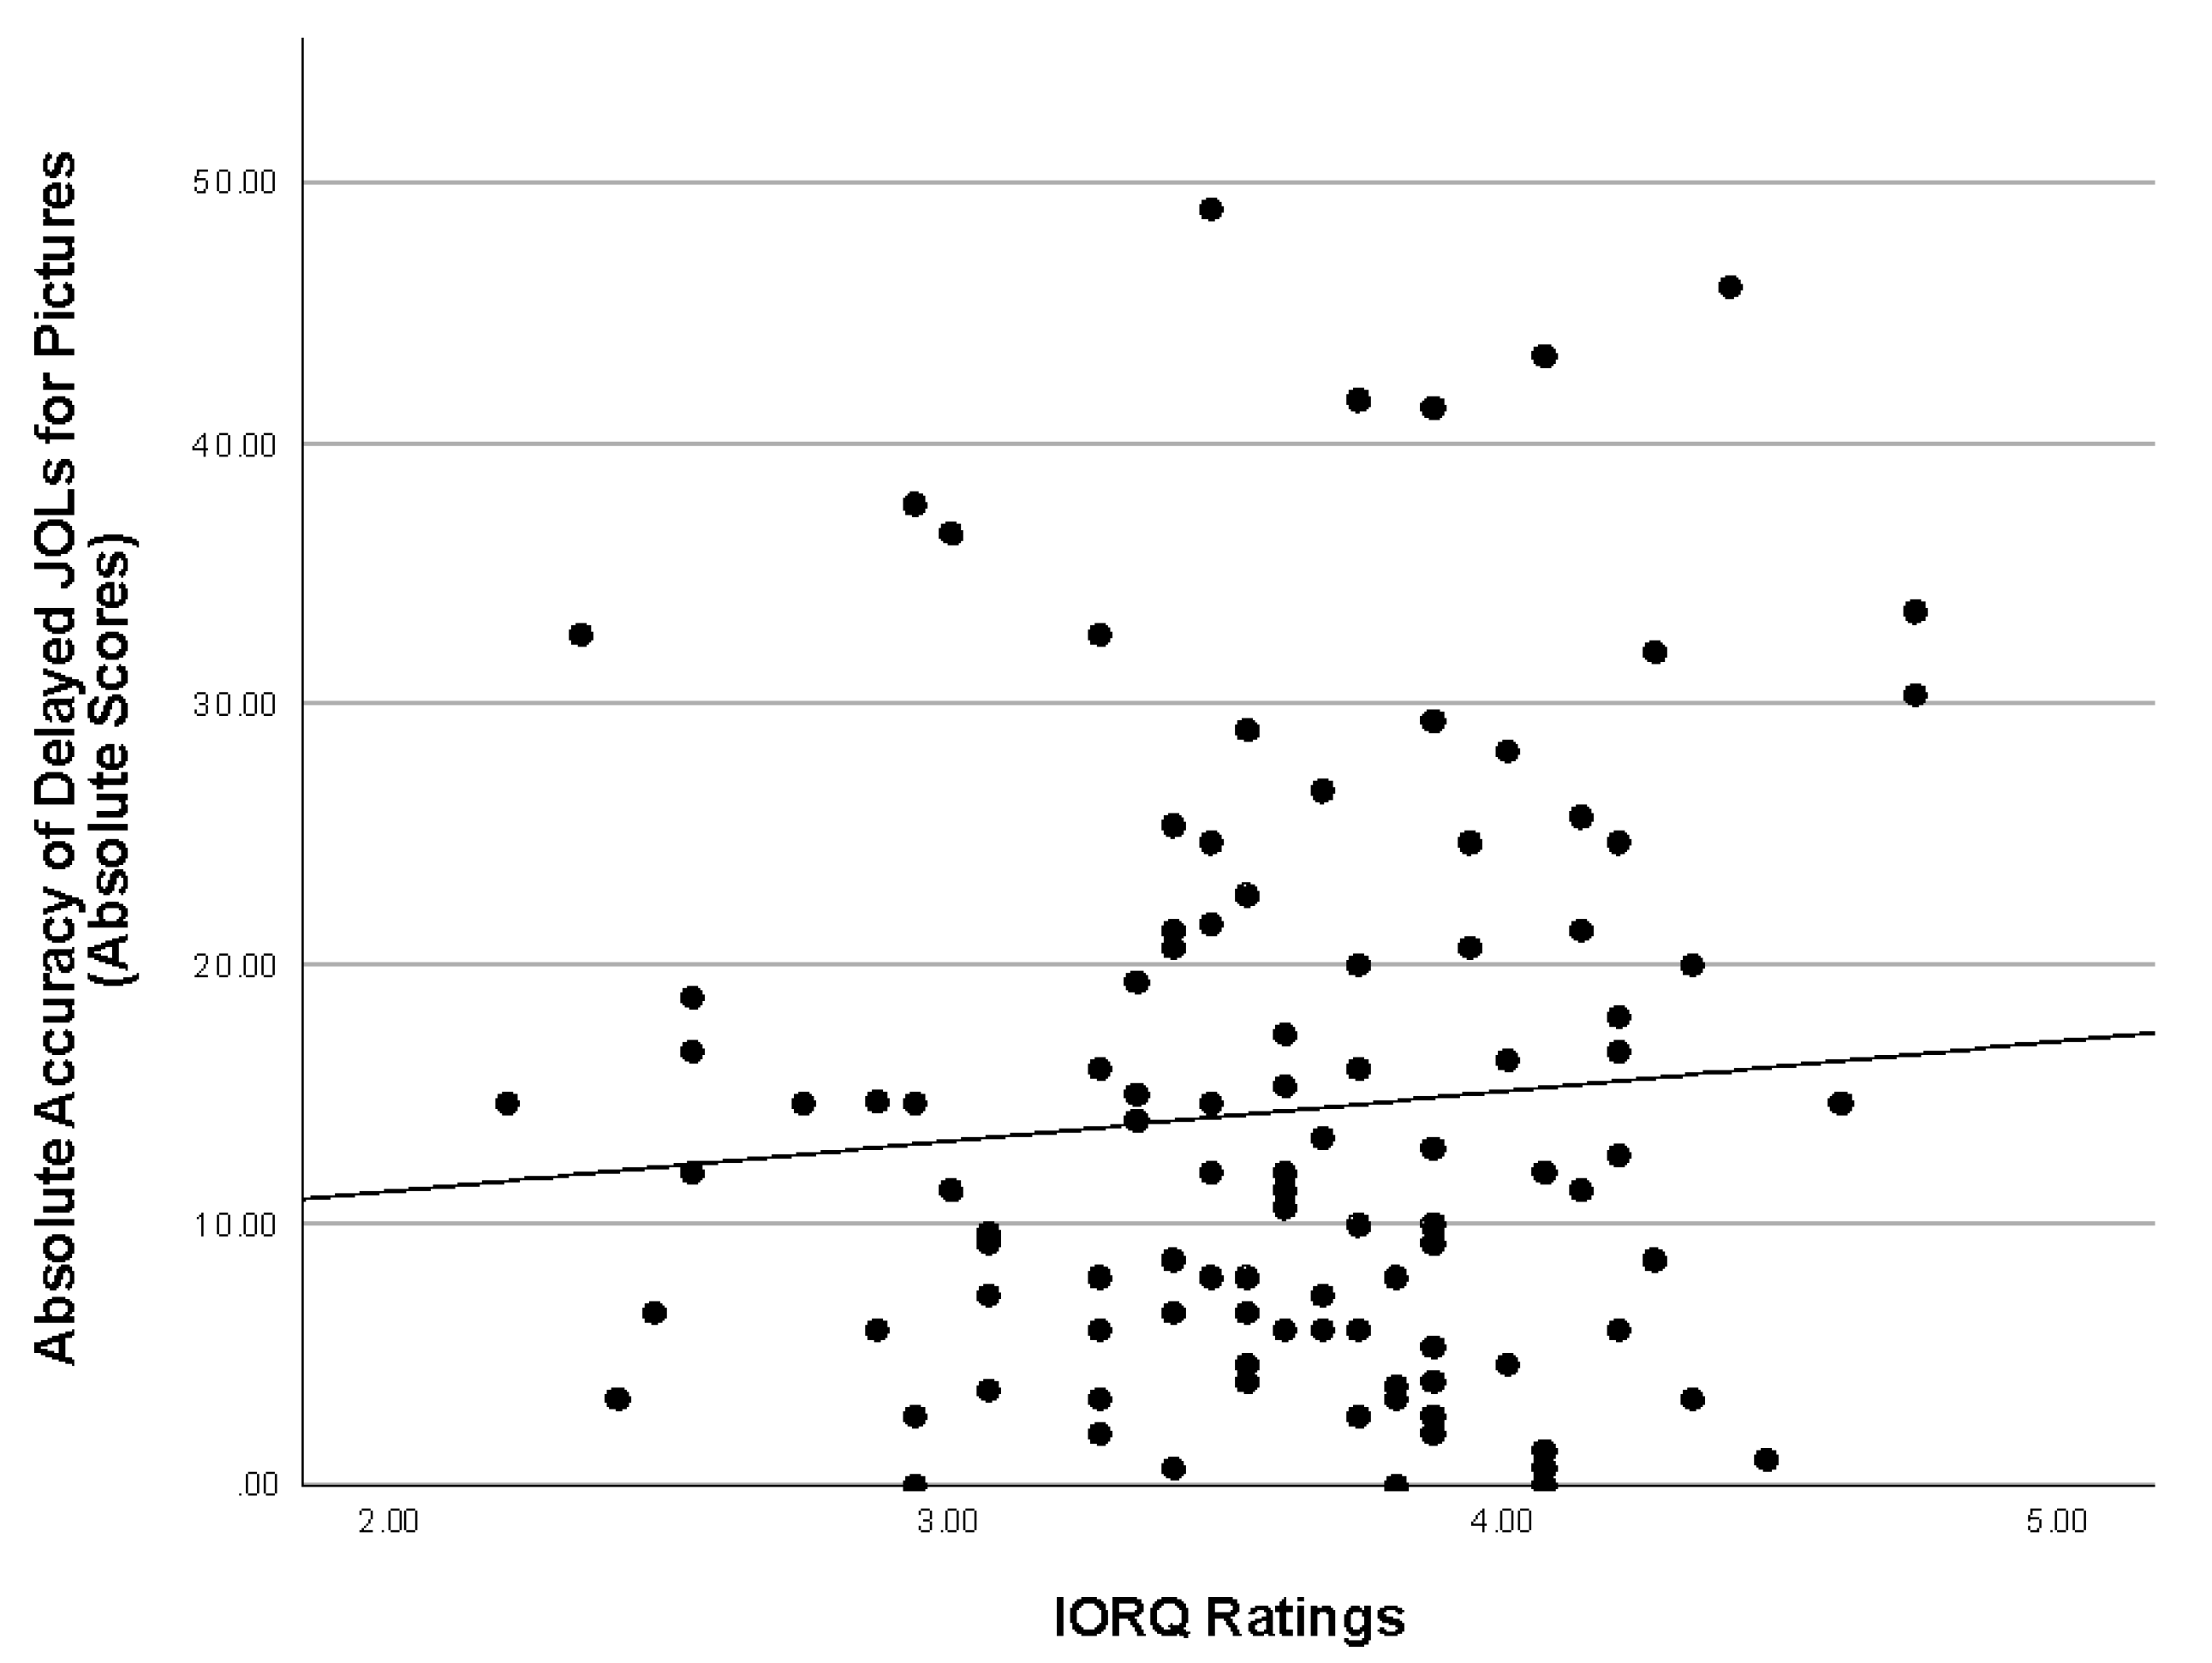
3.2. Correlations Between IORQ and Memory and Metamemory Outcomes
3.3. Mental Workload Results
4. Discussion
Supplementary Materials
Author Contributions
Funding
Institutional Review Board Statement
Informed Consent Statement
Data Availability Statement
Conflicts of Interest
Appendix A
- Telephone numbers of your friends and family
- Driving directions to go places
- Lyrics of your favorite songs
- Birthdays of your friends and family
- Shopping list
- Names of your classmates
- Assignment due dates and test dates
- Student identification number
- Basic math knowledge/rules (examples: multiplications, fractions, simple algebra)
- Information in the textbook that was not mentioned in the lecture
- Names of people you work with
- Important future dates (e.g., appointments, meetings)
- Street address of your work
- Your work schedule
- Safety rules at your workplace
- Remembering isn’t important (1 = Strongly Disagree, 5 Strongly Agree)
References
- Yates, F. A. Architecture and the art of memory. Architectural Design 1968, 38, 573. [Google Scholar]
- Ericsson, K. A. , & Kintsch, W. Long-term working memory. Psychological Review 1995, 102, 211–245. [Google Scholar] [CrossRef] [PubMed]
- Finley, J. R. , Naaz, F., & Goh, F. W. (2018). Memory and technology. Springer. [CrossRef]
- Marsh, E. J. , & Rajaram, S. The digital expansion of the mind: Implications of internet usage for memory and cognition. Journal of Applied Research in Memory and Cognition 2019, 8, 1–14. [Google Scholar] [CrossRef]
- Siler, J. , Hamilton, K. A., & Benjamin, A. S. Did you look that up? How retrieving from smartphones affects memory for source. Applied Cognitive Psychology 2022, 1–10. [Google Scholar] [CrossRef]
- Sparrow, B. , Liu, J., & Wegner, D. M. Google effects on memory: Cognitive consequences of having information at our fingertips. Science 2011, 333, 476–478. [Google Scholar] [CrossRef]
- Schooler, J. N. , & Storm, B. C. Saved information is remembered less well than deleted information, if the saving process is perceived as reliable. Memory 2021, 29, 1101–1110. [Google Scholar] [CrossRef] [PubMed]
- Gong, C. , & Yang, Y. Google effects on memory: a meta-analytical review of the media effects of intensive Internet search behavior. Frontiers in Public Health 2024, 12, 1332030. [Google Scholar]
- Nelson, T. O. , & Narens, L. (1990). Metamemory: A Theoretical Framework and New Findings. In Psychology of Learning and Motivation (Vol. 26, Issue C, pp. 125–173). Elsevier Science & Technology. [CrossRef]
- Nelson, T. O. , & Narens, L. (1994). Why investigate metacognition? In J. Metcalfe & A. P. Shimamura (Eds.), Metacognition: Knowing about knowing (pp. 1–25). The MIT Press.
- Nelson, T. O. , & Dunlosky, J. When people's judgments of learning (JOLs) are extremely accurate at predicting subsequent recall: The "delayed-JOL effect." Psychological Science 1991, 2, 267–270. [Google Scholar] [CrossRef]
- Dunlosky, J. , & Nelson, T.O. Importance of the kind of cue for judgments of learning (JOL) and the delayed-JOL effect. Memory & Cognition 1992, 20, 374–380. [Google Scholar] [CrossRef]
- Begg, I. , Duft, S., Lalonde, P., Melnick, R., & Sanvito, J. Memory predictions are based on ease of processing. Journal of Memory and Language 1989, 28, 610–632. [Google Scholar] [CrossRef]
- Kelemen, W. L. , & Weaver, C. A. III. Enhanced memory at delays: Why do judgments of learning improve over time? Journal of Experimental Psychology: Learning, Memory, and Cognition 1997, 23, 1394–1409. [Google Scholar] [CrossRef]
- Dunlosky, J. , & Nelson, T. O. Similarity between the cue for judgments of learning (JOL) and the cue for test is not the primary determinant of JOL accuracy. Journal of Memory and Language 1997, 36, 34–49. [Google Scholar] [CrossRef]
- Metcalfe, J. , & Finn, B. Evidence that judgments of learning are causally related to study choice. Psychonomic Bulletin & Review 2008, 15, 174–179. [Google Scholar] [CrossRef]
- Senkova, O. , & Otani, H. Making judgments of learning enhances memory by inducing item-specific processing. Memory & Cognition 2021, 49, 955–967. [Google Scholar] [CrossRef]
- Rhodes, M. G. , & Tauber, S. K. The influence of delaying judgments of learning on metacognitive accuracy: a meta-analytic review. Psychological bulletin 2011, 137, 131–148. [Google Scholar] [CrossRef]
- Eakin, D. K. , & Moss, J. M. (2019). The methodology of metamemory and metacomprehension. In H. Otani & B.L. Schwartz (Eds.), Handbook of research methods in human memory. New York: Routledge.
- Hart, S. G. , & Staveland, L. E. (1988). Development of NASA-TLX (Task Load Index): Results of empirical and theoretical research. In P. A. Hancock & N. Meshkati (Eds.), Human mental workload (pp. 139–183). North-Holland. [CrossRef]
- Knoll, A. R. , Otani, H., Skeel, R. L., & Van Horn, K. R. Learning style, judgements of learning, and learning of verbal and visual information. British journal of psychology 2017, 108, 544–563. [Google Scholar] [CrossRef]
- Johnson, A., & Proctor, R. W. (2004). Attention: Theory and practice. Sage Publications, Inc. [CrossRef]
- Kirby, J. R. , Moore, P. J., & Schofield, N. J. Verbal and visual learning styles. Contemporary Educational Psychology 1988, 13, 169–184. [Google Scholar] [CrossRef]
- Rubio, S. , Díaz, E., Martín, J., & Puente, J. M. Evaluation of subjective mental workload: A comparison of SWAT, NASA-TLX, and workload profile methods. Applied Psychology: An International Review 2004, 53, 61–86. [Google Scholar] [CrossRef]
- Snodgrass, J. G. , & Vanderwart, M. A standardized set of 260 pictures: Norms for name agreement, image agreement, familiarity, and visual complexity. Journal of Experimental Psychology: Human Learning and Memory 1980, 6, 174–215. [Google Scholar] [CrossRef]
- Paivio, A. , & Csapo, K. Picture superiority in free recall: Imagery or dual coding? Cognitive Psychology 1973, 5, 176–206. [Google Scholar] [CrossRef]
- Franks, A. , Otani, H. , & Roupe, G. T. (A)symmetries in memory and directed forgetting of political stimuli. Experimental Psychology 2023, 70, 68–80. [Google Scholar] [CrossRef]
- Wicker, A. W. (1969///Oct 1969 - Dec). Attitudes versus actions: The relationship of verbal and overt behavioral responses to attitude objects. Journal of Social Issues, 25, 41-78. [CrossRef]
- Ajzen, I. , Fishbein, M., Lohmann, S., & Albarracin, D. (2019). The Influence of Attitudes on Behavior. In D. Albarracin & B. T. Johnson (Eds.), The handbook of attitudes. essay, Routledge.
- Metcalfe, J. (2000). Metamemory. In E. Tulving & F. I. M. Craik (Eds.), The Oxford handbook of memory (pp. 197-211), Oxford; Oxford University Press.
- Burke, D. M. , MacKay, D. G., Worthley, J. S., & Wade, E. On the tip of the tongue: What causes word finding failures in young and older adults? Journal of Memory and Language 1991, 30, 542–579. [Google Scholar] [CrossRef]
- Koriat, A. Monitoring one’s own knowledge during study: A cue-utilization approach to judgments of learning. Journal of Experimental Psychology: General 1997, 124, 349–370. [Google Scholar] [CrossRef]
- McDonough, I. M. , & Gallo, D. A. Illusory expectations can affect retrieval-monitoring accuracy. Journal of Experimental Psychology. Learning, Memory, and Cognition 2012, 38, 391–404. [Google Scholar] [CrossRef]
- Knoll, A. R. , Otani, H., Skeel, R. L., & Van Horn, K. R. Learning style, judgements of learning, and learning of verbal and visual information. British journal of psychology 2017, 108, 544–563. [Google Scholar]


| Words | Pictures | |||
| Immediate | Delayed | Immediate | Delayed | |
| Recall | ||||
| M | 4.56 | 3.87 | 5.31 | 4.66 |
| SD | 3.64 | 3.46 | 3.85 | 3.65 |
| JOL Ratings | ||||
| M | 54.28 | 33.57 | 56.85 | 39.58 |
| SD | 22.53 | 19.08 | 20.36 | 20.13 |
| JOL Relative Accuracy (Gamma) | ||||
| M | 0.37 | 0.83 | 0.38 | 0.84 |
| SD | 0.47 | 0.38 | 0.39 | 0.26 |
| JOL Absolute Accuracy (Absolute Value) | ||||
| M | 23.88 | 8.71 | 22.63 | 8.37 |
| SD | 36.48 | 17.34 | 35.01 | 16.22 |
| Words | Pictures | ||
| Global JOL Ratings | |||
| M | 8.81 | 9.28 | |
| SD | 5.04 | 5.74 | |
| Global JOL Accuracy | |||
| M | 4.74 | 5.10 | |
| SD | 4.03 | 3.95 | |
| RCJ | |||
| M | 2.18 | 2.40 | |
| SD | 0.78 | 0.86 |
Disclaimer/Publisher’s Note: The statements, opinions and data contained in all publications are solely those of the individual author(s) and contributor(s) and not of MDPI and/or the editor(s). MDPI and/or the editor(s) disclaim responsibility for any injury to people or property resulting from any ideas, methods, instructions or products referred to in the content. |
© 2024 by the authors. Licensee MDPI, Basel, Switzerland. This article is an open access article distributed under the terms and conditions of the Creative Commons Attribution (CC BY) license (http://creativecommons.org/licenses/by/4.0/).


