Preprint
Article

Numerical Analysis of the Structural Alternatives of a Double Bottom Floor of a Panamax Class Container Ship

Altmetrics

Downloads

41

Views

21

Comments

0

A peer-reviewed article of this preprint also exists.

Submitted:

30 October 2024

Posted:

31 October 2024

You are already at the latest version

Alerts
Abstract
To reduce weight and simplify maintenance, ship structures frequently include openings and cut-outs. While these features offer practical advantages, they can weaken the structural integrity of key components. This study explores the effects of these geometric discontinuities on the double-bottom floor plates of a Panamax-class container ship under axial and transverse loads. Through numerical simulations and experimental testing, we analyzed different cut-out configurations and stiffening strategies to assess their impact on stress distribution, plate thickness and fatigue behavior. The results reveal that side cut-outs significantly increase stress, particularly under transverse loads, while central openings have less impact. Additionally, increasing plate thickness consistently reduces stress levels across all models, improving structural durability. Fatigue analysis shows that certain stiffening configurations, particularly those with longitudinal stiffeners in the bottom plates, enhance fatigue life. These findings offer critical design insights for optimizing hull structures, balancing weight reduction with strength improvement. The study provides valuable recommendations for reducing stress concentrations and extending the fatigue life of ship components, contributing to more efficient and safer ship designs.
Keywords: 
Subject: Engineering  -   Marine Engineering

1. Introduction

Currently, it is estimated that nearly 90% of global goods are moved via maritime transport, with around 60% of those being shipped in containers. This highlights the crucial role that container vessels play in both the maritime logistics chain and the global economy. These ships are specifically designed to enhance the efficiency of loading and unloading processes at ports. However, they are particularly vulnerable to bending and torsional stresses. Container vessels feature double bottoms and are framed longitudinally, making this section especially critical when assessing structural integrity [1]. A key component of the double bottom structure is the transverse elements, often referred to as floors.
Inspection ports, pipe tunnels, weight-reduction cutouts, and apertures that let regular stiffeners from the bottom and double bottom pass through are features that set these constructions apart. Due to the significant concentrations of stress in this location, a mix of these characteristics impacts the structural capability of the floor [2]. The floor can be treated as reinforced panels or perforated plates for structural analysis, where the buckling strength of the plates is decreased by the cutouts and perforations. The buckling design process needs to take this reduction into consideration. This kind of construction has been extensively studied from a variety of angles. Wang et al. [3] used both linear and nonlinear FEM models to examine how geometrical parameters affected buckling and ultimate strength. Additionally, they suggested a simplified method that accounts for reduction factors. Liu et al. [4] provided valuable insights into the effects of small and large apertures on the ultimate strength of longitudinal and transverse girders under lateral and uniaxial stresses on deck panels by experimental and computational study. Apertures’ geometry is crucial for structural assessments. This is illustrated in the study by Saad-Eldeen et al. [5], which examined how the ultimate strength of steel plates that had undergone compressive testing after being stiffened and unstiffened was affected by variations in opening size, shape, steel composition, and structural configurations. Similarly, Yanli et al. [6] investigated the effects of size, opening position and form on bending plate buckling strength.
Using a variety of high-strength steels, Saad-Eldeen et al. [7] extended their research by adding a new variable and examining the effects of various morphologies—circular and elongated circular openings—under uniaxial compression. Given the vulnerability of these structures, adequate reinforcement is essential to maintain structural integrity throughout their service life. As a result, significant research has been directed at this issue. For instance, Kim et al. [8] developed a formula for this design approach after investigating the best reinforcement strategies to improve perforated plates’ buckling and ultimate strength. Another important consideration when examining these structures is corrosion;
The efficiency of recovering the structural capability of a corroded double bottom side girder plate was examined by Chichi and Garbatov [9]. This manhole-shaped side girder was subjected to both the irregular, intermittent corrosion-degrading effects and uniaxial compressive loads. Similar to this, Cui and Wang [10] used both numerical and experimental approaches to examine the ultimate compressive strength of common stiffened plates with perforations, with a focus on the impacts of corrosion phenomenon. Saad-Eldeen et al. [11] assessed the ultimate strength of steel plates having large, elongated circular holes under uniaxial compressive pressures through experimental testing. They looked at energy dissipation, resilience, toughness, force-displacement, strength-strain, and collapse modes. Other odd geometries have also been studied for their structural implications. For example, the residual structural capability of steel plates having significant centered ellipsoidal holes, both without and with locking cracks, was examined experimentally by Saad-Eldeen et al. [12].
The behavior of unstiffened plates with rectangular apertures under various variables, such as plate slenderness, opening area ratio, and opening location, was investigated by Yu and Lee [13]. The collapse behavior and post-peak response of stiffened plates with square holes and angle sections under axial and out-of-plane stresses were investigated by Kumar et al. [14]. Research on apertures also focuses on other materials. The mechanical properties of typical composite structures with open holes were examined by Li et al. [15]. Initial defects are an important factor to take into account while assessing a construction. In their assessment of the final compressive strength for similarly stiffened panels made of steel and aluminium, Doan et al. [16] looked at the effects of the heat-affected zone, early flaws, boundary conditions and the presence of apertures on the web of longitudinal girders.
In structural analysis, defining the boundary conditions is essential. Using finite element (FE) models, Xu et al. [17] investigated how boundary conditions and model geometry affected the expected collapse response of stiffened panels. The most popular method for evaluating these openings’ performance is finite element analysis (FEA). Through a series of experimental and computational experiments including both mechanical tests and non-linear FEA, Kim et al. [18] assessed the buckled state and final yield strength of plates and stiffened panels with holes under axial compressive loads. Similarly, using non-linear FEA techniques, Cui and Wang [19] investigated the ultimate strength of longitudinal girders having apertures in the double bottom region, subjected to longitudinal compression. In order to replicate the major forces resulting from either horizontal or vertical bending moments in vessel hull girders, Paik [20] examined the ultimate strength properties of steel plates with a single circular hole under axial compressive loads along the short edges. This was achieved by altering the plate’s thickness and aspect ratio as well as the hole size using ANSYS software.
In order to determine the optimal design in terms of fatigue strength, Silva-Campillo et al. [21] examined the effects of curvature radius in various cut-out shapes in the transverse web frame for longitudinal stiffener transit from the perspective of optimal analysis. Andersen [22] introduced a novel fatigue-strength cut-out design that uses finite element-based optimization of shapes to lower stress and provide a new ideal cut-out form. In another study, Silva-Campillo et al. [23] evaluated the impact of all cut-outs placed for the installation of longitudinal stiffeners in the major transverse structure of the torsion box while optimizing the local structural weight using a nonlinear multi-variable optimization tool.
This study examines the structural strength of a perforated plate—which represents the double bottom floor of a container ship—under various combinations of geometric characteristics, stiffening methods, and load conditions. The structure of the paper is as follows: In this study, the structural performance of a perforated plate—which represents the double-bottom floor of a container ship—under various load situations, stiffening techniques, and geometric configurations is assessed. The structure of the paper is as follows: The theoretical underpinnings of linear eigenvalue analysis for buckling are presented in Section 2. The case study is covered in Section 3, together with geometric configurations and an explanation of the testing arrangement. The finite element method and the validation procedure, which compares the simulation results to experimental data, are described in Section 4. Based on the analysis of different geometric characteristics and load scenarios, Section 5 presents the results pertaining to stress patterns of distribution, buckling strength, and fatigue life. Finally, Section 6 wraps up the research with conclusions derived from the data.

2. Linear Eigenvalue Analysis for Buckling

According to one definition, linear tensile buckling is an eigenvalue issue, in which the eigenvectors show the associated buckling modes and the eigenvalues reflect the loads that result in buckling [24].
K λ i S Ψ i = 0
In the given equation, [S] symbolizes the stress stiffness matrix, [K] represents the stiffness matrix and λi denotes the ith eigenvalue, which is utilized to scale the applied loads. The following formula describes how the plate, both buckling and intact, will react to uniaxial compression [24].
4 w x 4 + 2 4 w x 2 y 2 + 4 w y 4 = 12 1 ν 2 E t 3 N x 2 w x 2
In the earlier equation, ν signifies Poisson’s ratio, NX refers to the in-plane force, t represents the thickness of the plate, E denotes Young’s modulus and w describes the vertical displacement in the z-axis of a point positioned on the (x, y) plane. For a plate that is simply supported along all edges, this displacement can be estimated as [24]:
w = m = 1 n = 1 A m n sin m π x a sin n π y b
In this context, mmm and nnn represent the number of half-waves along the x and y axes, where the x-axis is aligned with the plate’s longer edge and the y-axis is perpendicular to it. Meanwhile, a and b indicate the plate’s dimensions in these respective directions. Based on the boundary conditions, a nontrivial solution is derived [24]:
A m n π 4 m 2 a 2 + n 2 b 2 2 N x D m 2 π 2 a 2 = 0
where N x = k π 2 D b 2 , D = E t 3 12 1 ν 2 is the stiffness of the plate, k = m α + α m 2 is the factor that accounts for buckling, and α = a b represents the aspect relation. In the case of uniaxial compression, the critical buckling stress under elastic conditions is given by a well-known formula [25].
σ b u c k = k π 2 E 12 ( 1 ν 2 ) t b 2
The critical buckling strength is assessed using the Johnson-Ostenfeld formula [25], which incorporates both elastic conditions and a plasticity correction for buckling strength.
σ c r = σ b u c k σ y 1 σ y 4 σ b u c k for   σ c r = σ b u c k σ y 1 σ y 4 σ b u c k
Here, σ y represents the yield stress, σ c r indicates the critical buckling stress, and p r is a factor that reflects influence to plasticity phenomenos, generally ranging from 0.5 to 0.6. Shear loads can cause in-plane compressive stress, which can result in buckling. This in-plane compressive stress works at a 45-degree angle to the shear axis in pure shear situations [26].
τ c r = k π 2 E 12 ( 1 ν 2 ) t b 2 with   k = 5.34 + 4 α 2 k = 5.34 α 2 + 4 for   α > 1 α 1
The following analytical method is offered to elucidate the elastic buckling behavior of a simply supported plate under different applied stress components [25].
σ x σ x u c 1 + β σ x σ x u σ y σ y u + σ y σ y u c 2 + τ τ u c 3 = 1
Here, σ x u , σ y u and τ u represent the ultimate strengths under axial loads, while σ x , σ y and τ indicate the axial stresses in the x-direction, y-direction and edge shear, respectively. The coefficients c1, c2 , c3 and δ are factors that depend on the load and boundary conditions. For biaxial compressive loading, Equation (8) simplifies to
σ x σ x u 2 + σ y σ y u 2 = 1
Paik [26] offers a different formulation to characterize the biaxial compression of the plate.
m 2 a 2 σ x + n 2 b 2 σ y π 2 D t m 2 a 2 + n 2 b 2 2 = 0

3. Case study

3.1. Description

The container ship selected is based on the B-178 vessel built in Stocznia Szczecińska Nowa (Szcecin shipyard) located in Poland with the following general arrangement (Figure 1).
Table 1 provides the main particulars of the vessel.
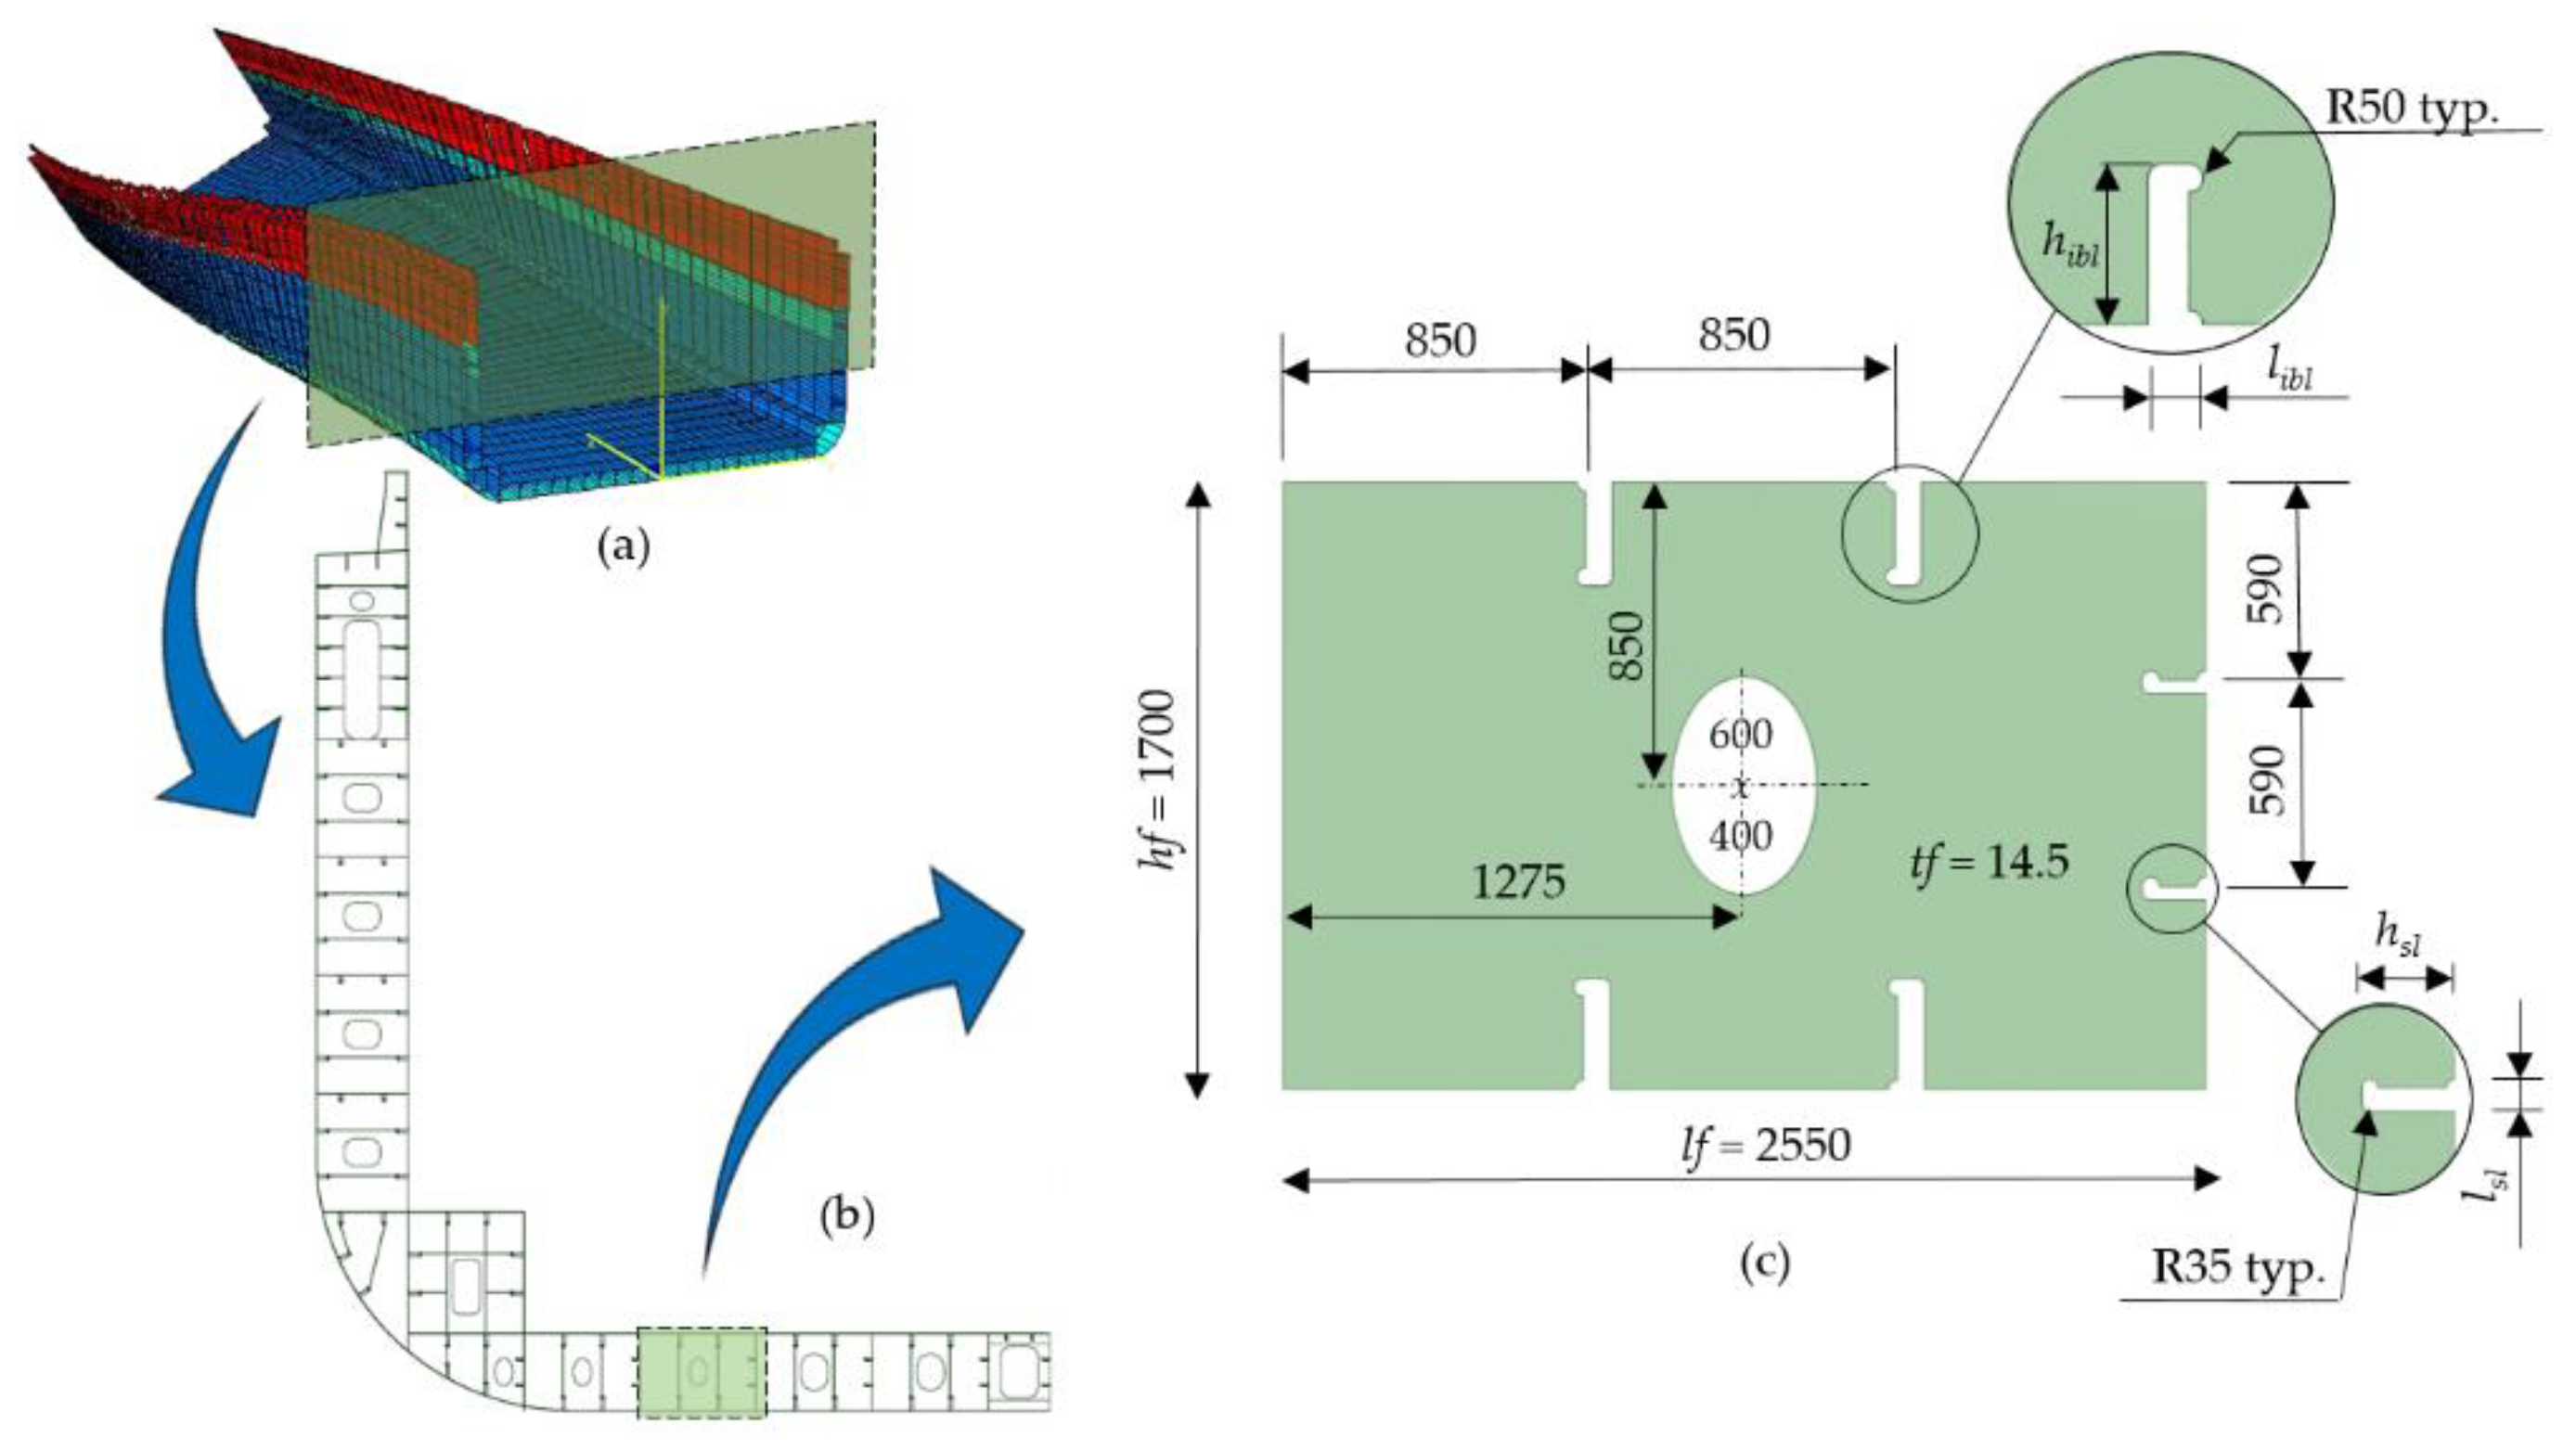
The spacing between frames is set at 800 mm, and double bottom floors are incorporated every four frames, each with a height of 1700 mm. This design ensures adequate space for the ballast tanks and facilitates access during fabrication, inspection, and repairs. The placement of the longitudinal side girders aligns with the spacing of the containers stored in the hold above, with a distance of 2550 mm, corresponding to three stiffener spacings. Additionally, an elliptical opening measuring 600 mm by 400 mm is located in the central part of the web floor (Figure 2).
A standard hull steel of grade A is selected, featuring a Young’s modulus of 206 GPa and a Poisson’s ratio of 0.3. The material has a yield stress of 235 MPa and a density of 7.85 t/m³. Four different cut-out geometries, with sizes (hibl, libl, hsl and lsl) determined by the surrounding longitudinal stiffener (bulb profile), are defined in the double bottom floor and the same openings but for the flat bar type side girder profile (Figure 3).
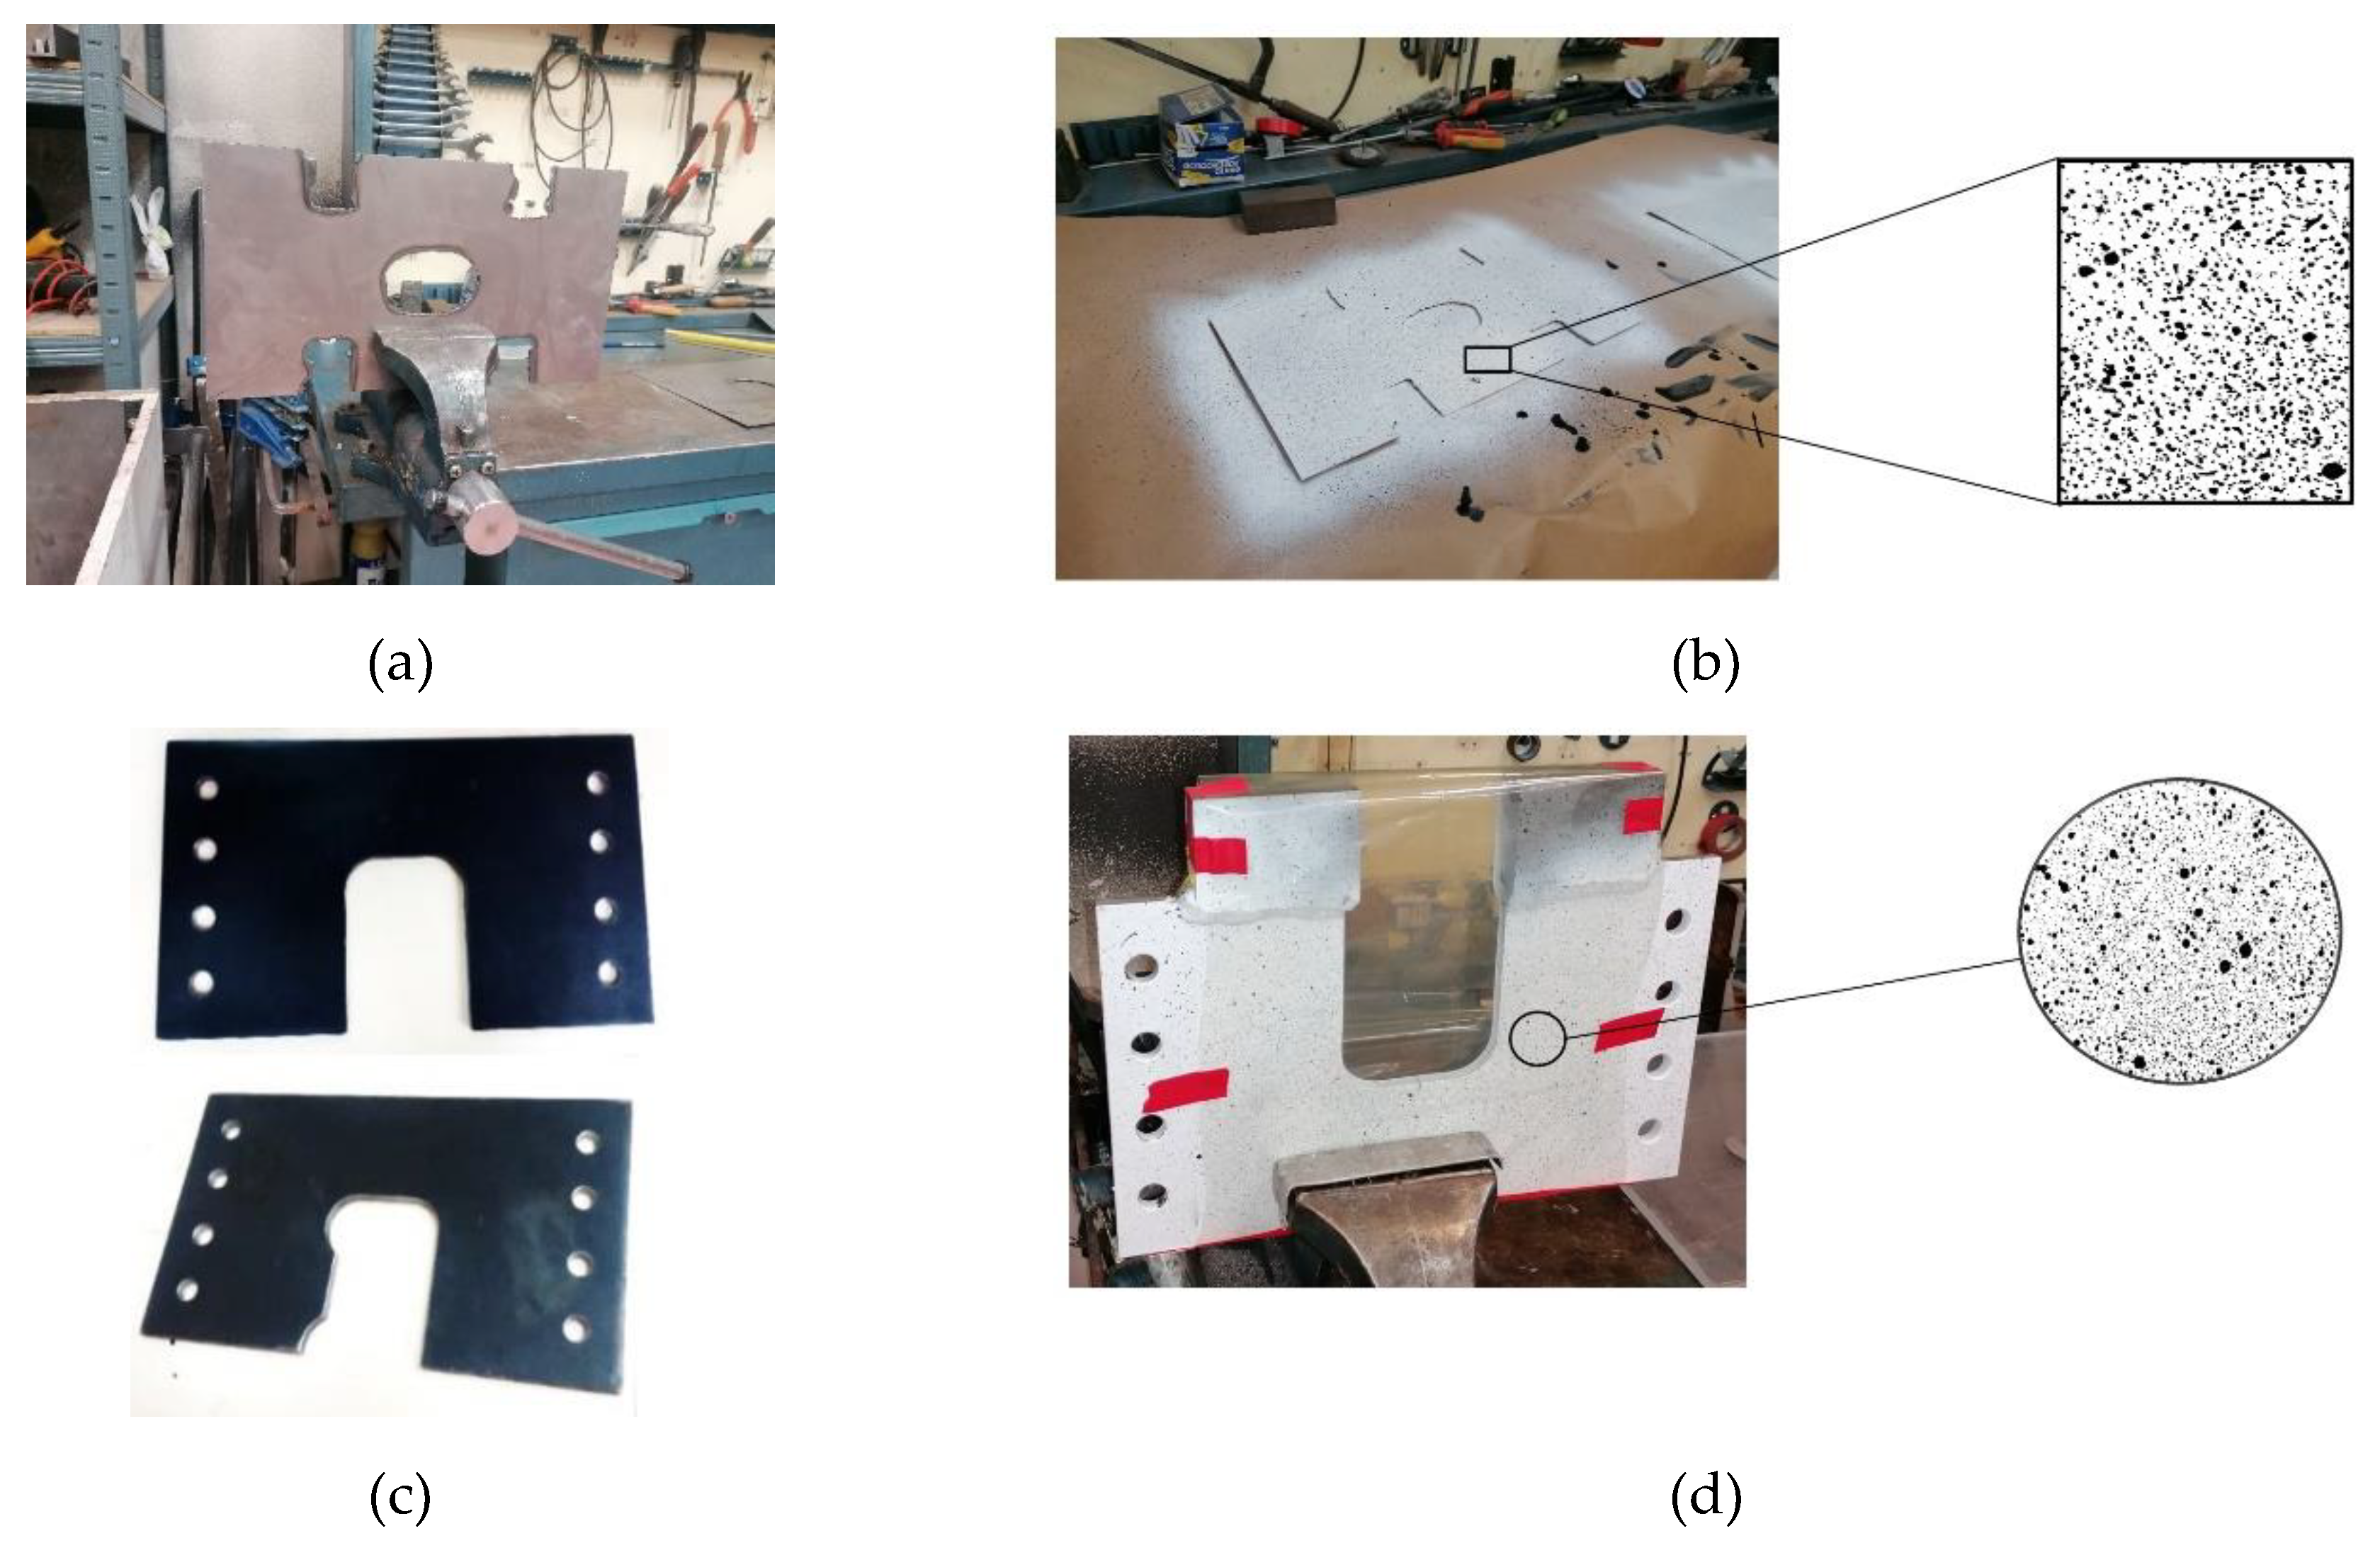
Two geometries for the cut-outs and one geometry for the double bottom floor plate are part of the experimentation process. The sample’ surfaces are prepped prior to testing. This surface treatment involves acetone washing, white paint application and black paint spraying, on the previously painted white coat, to create a random mesh pattern. The digital image correlation method is used to calculate stresses and displacements based on this pattern in order to validate the numerical results (Figure 4).

3.2. Loading Scenarios and Boundary Conditions

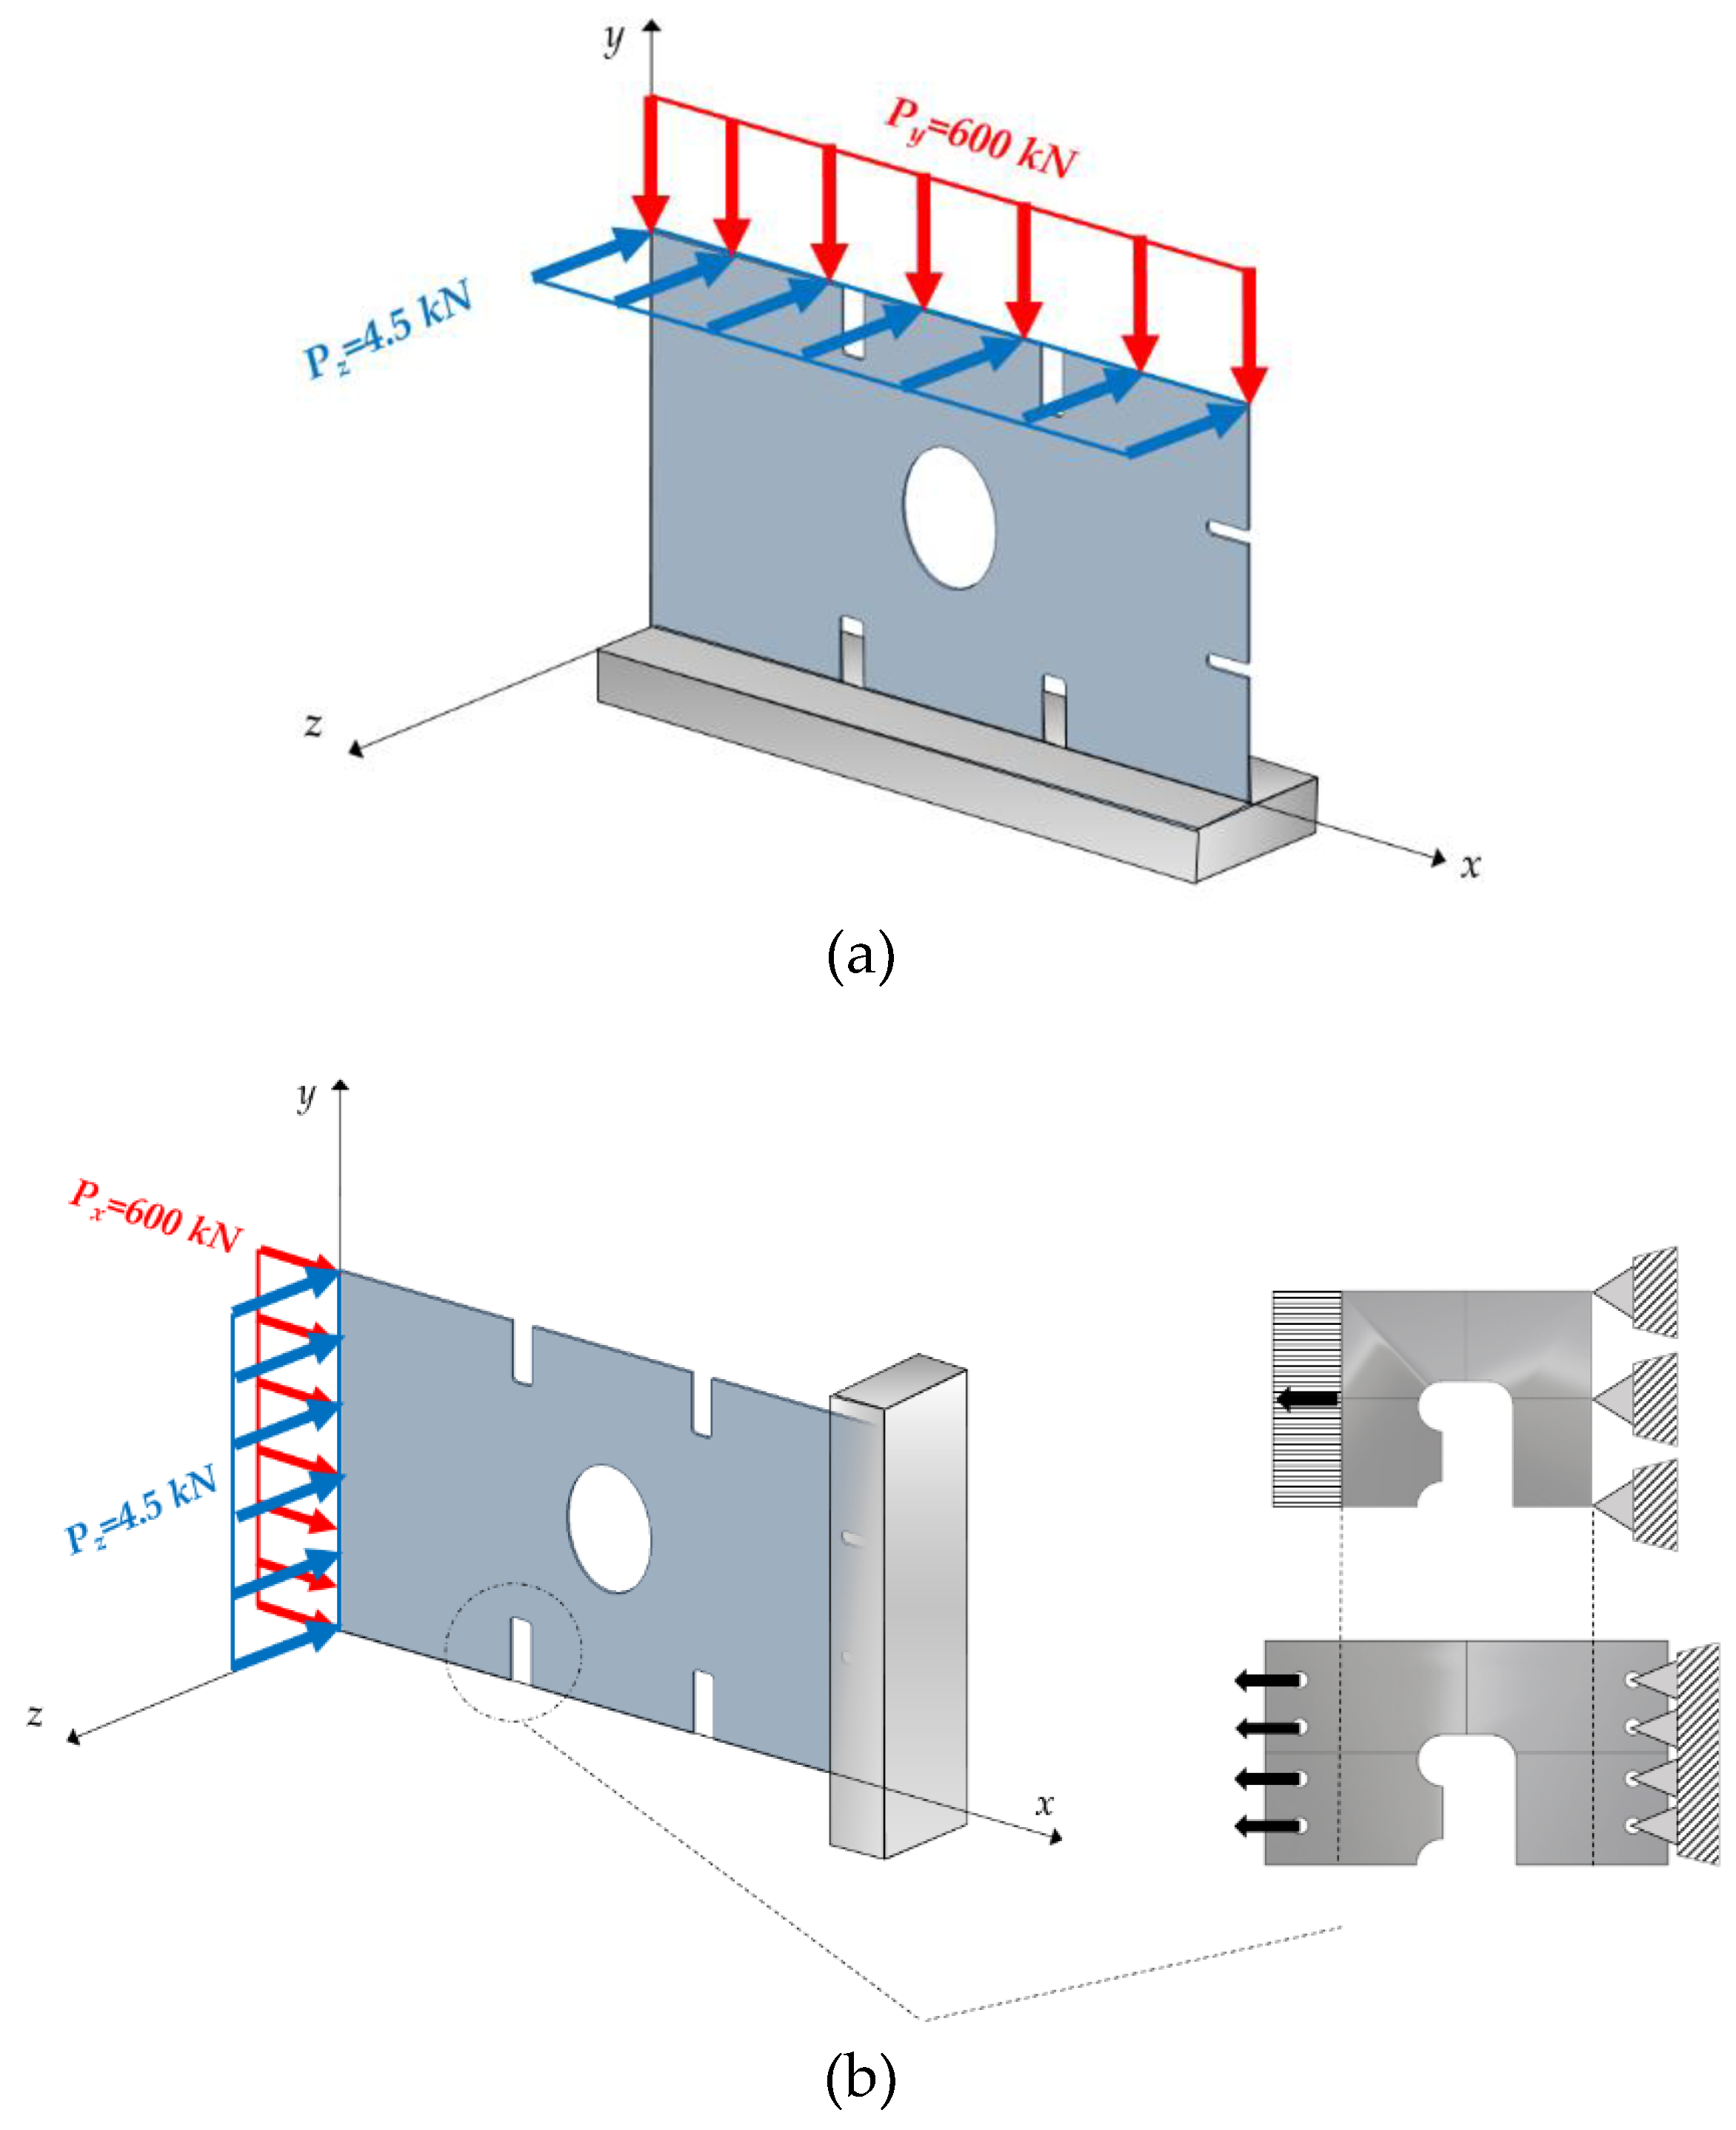
Based on the most relevant loading conditions in double bottoms of container ships, two loading scenarios are established: on the one hand, a compressive and axial load is considered with a test value of 600 kN, and on the other hand, a load oriented perpendicular to the plate, derived from hull girder loads, with a standard value of 4.5 kN. For the boundary conditions, a conservative criterion is set which establishes a support that restricts all movements on one of the edges and allows displacement on the rest of the edges, following the same principles and criteria that Saad-Eldeen et al. [11] and Xu et al. [28]. To cover the full spectrum of possibilities, loading scenarios and boundary conditions are considered in the two possible directions and configurations (longitudinal and transverse) to capture the structural behaviour whatever the loading direction. Additionally, adhering to a conservative approach, the cut-out is examined under the most unfavorable loading direction. This creates a common single edge notch tension (SENT) stress condition on the experimental material by applying it at four different sites, which represents the least favorable scenario that yields the most conservative results. Considering the characteristics of the testing machine, it is advisable to calibrate the specimens (Figure 5).
To establish the degree of influence of the four selected cut-out geometries on the structural behavior of the double bottom floor, seventy-two different combinations of plate thickness (14.5, 18 and 22mm, respectively), cut-out geometry (cut-out no.1, no. 2, no. 3 and no. 4) and the scantling and number of longitudinal stiffeners present in the bottom, double bottom and side girder for different model of double bottom floor (Table 2).
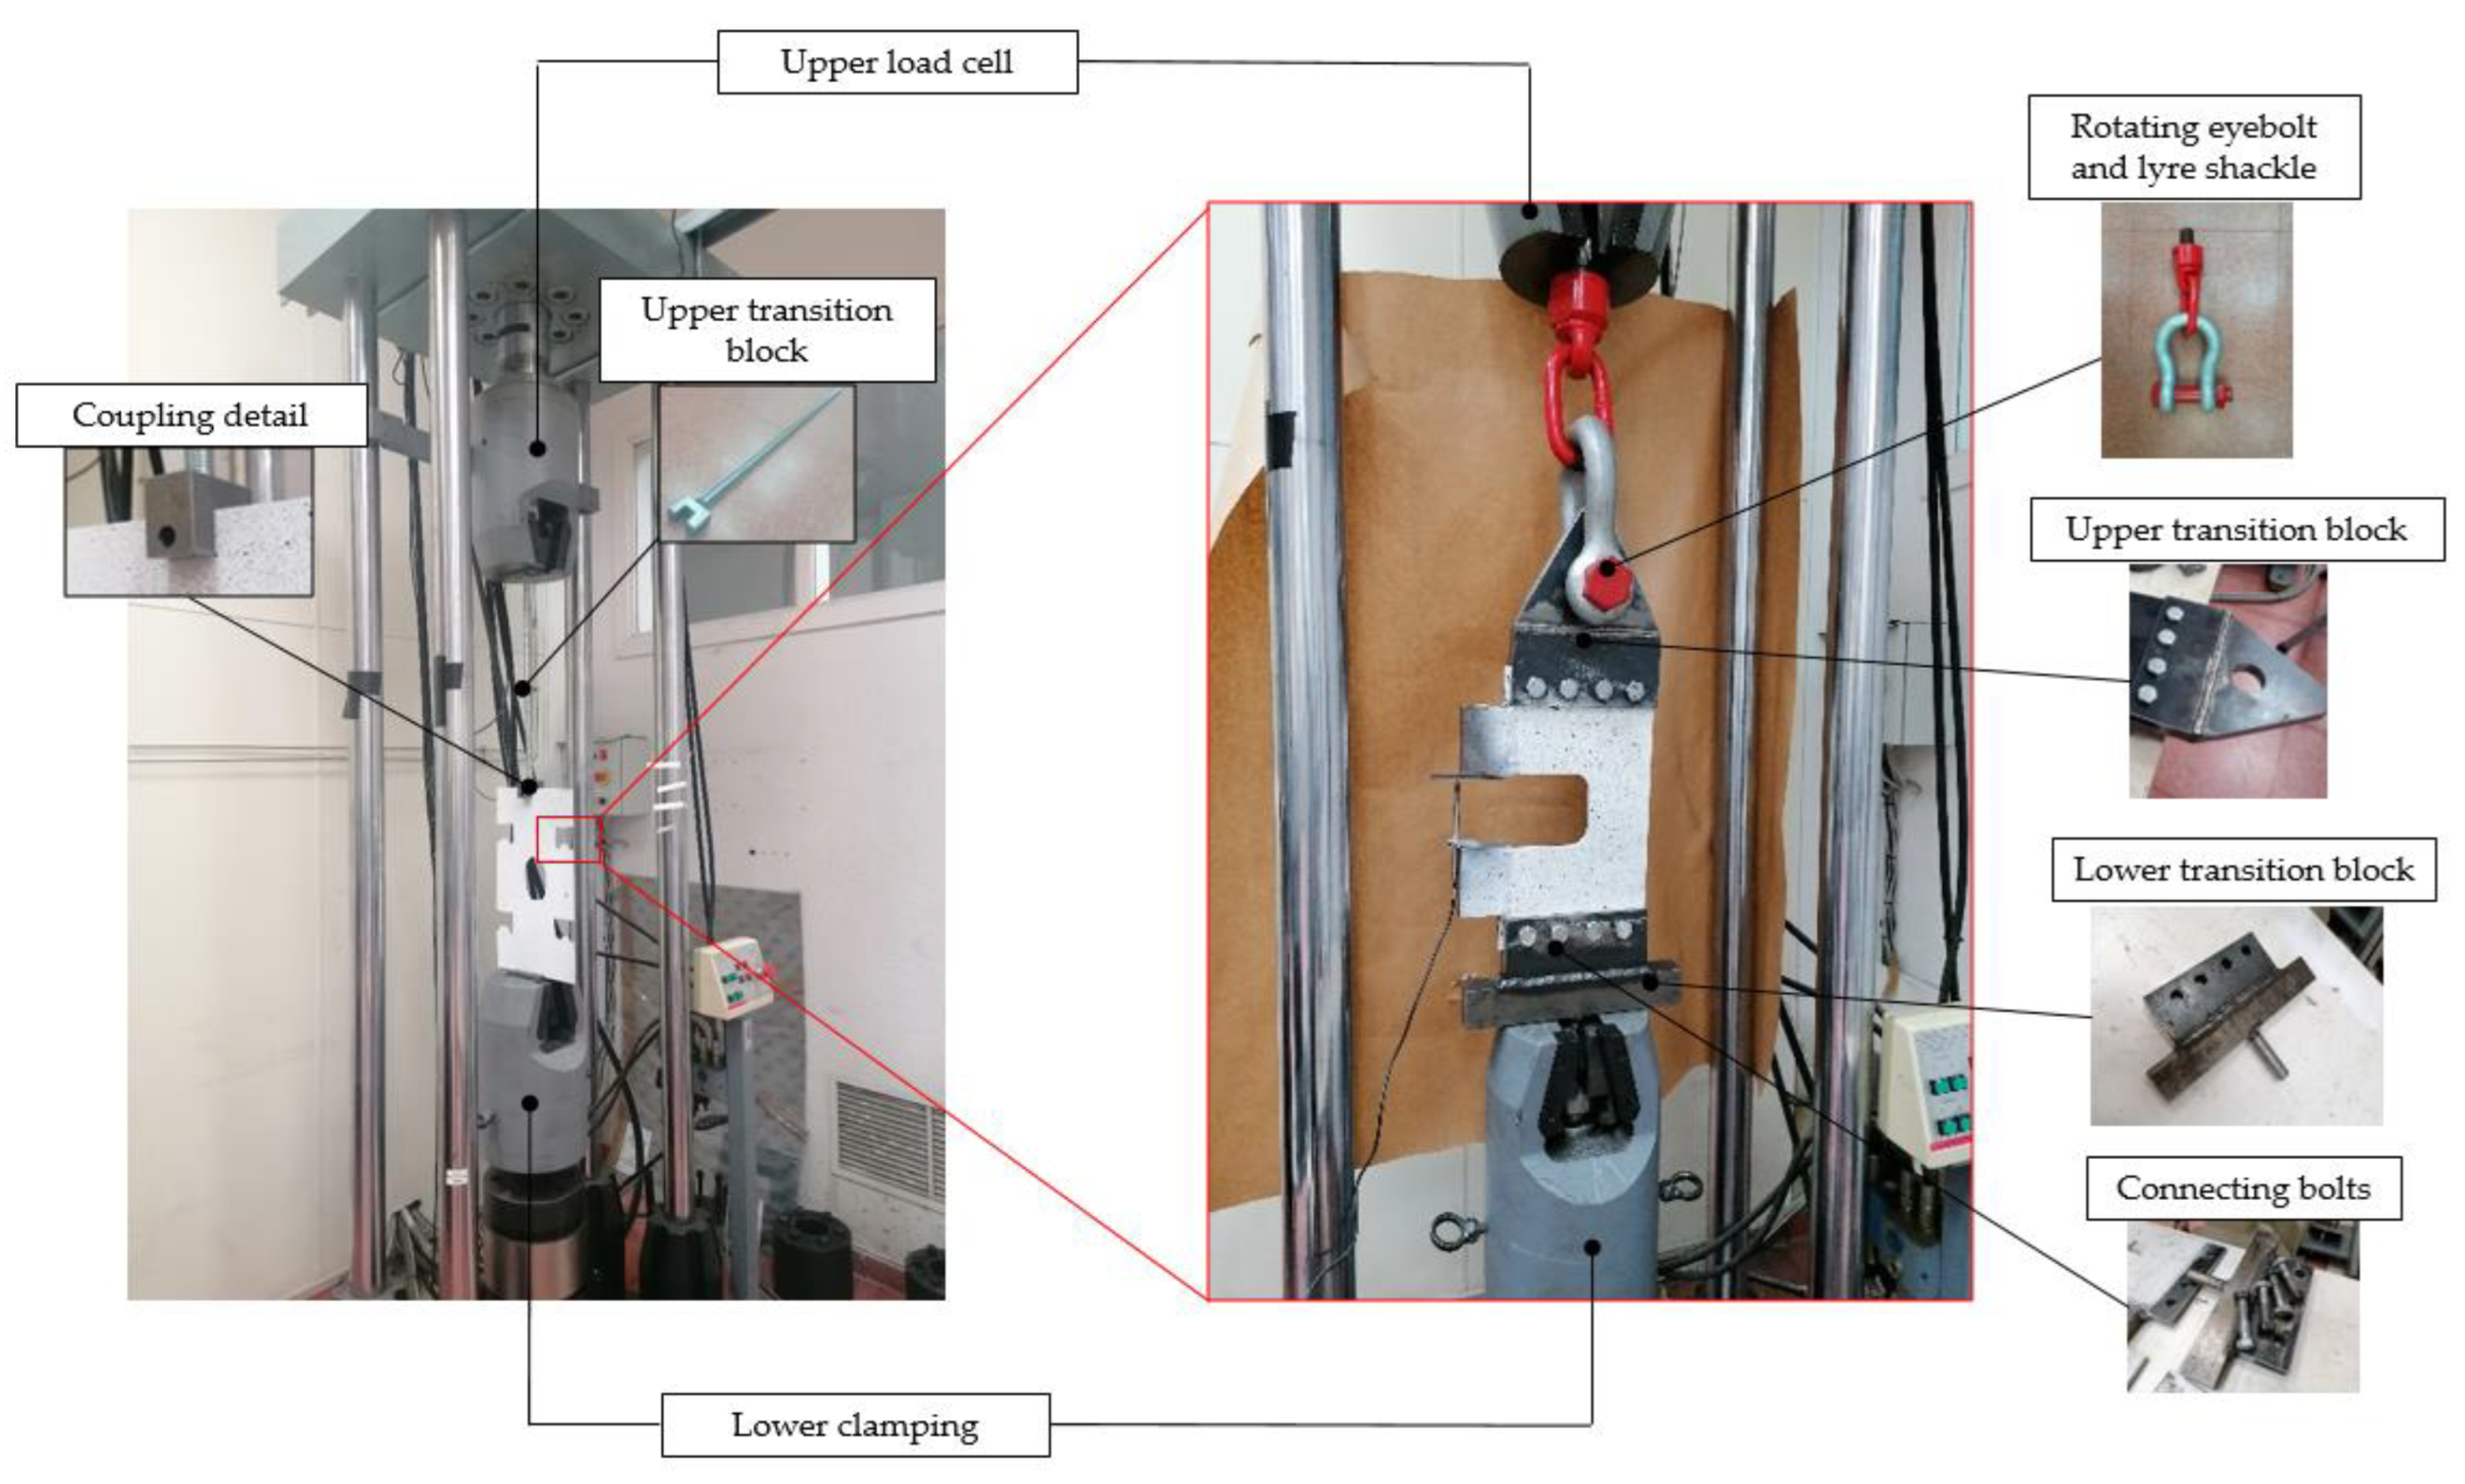
For the experimental evaluation of the floor plate, a two-phase modeling approach has been developed, combining two different center openings according to their orientation and geometric characteristics. In the first step, the specimen is fastened to the testing machine using a top transition piece in order to conduct a thorough examination of the double bottom floor plate. This block is securely connected at the lower clamp and has an U-like component threaded on a cylindrical element to mimic the design load (Figure 6). In the second step, attention is focused on one of the apertures, specifically the longitudinal stiffener cut-out. Test specimens related to this cut-out geometry are positioned in the fatigue machine using two connection pieces (upper and lower). The loading scenarios and boundary conditions are established by these coupling blocks. The top transition piece is made up of two welded parts to compensate for potential machine and weld misalignments: a trapezoidal unit with a circular aperture to connect the lyre shackle and a rotating eyebolt, and a U shape that replicates the design load using bolts tested to generate a double shear force. The bottom transition block similarly consists of two welded sections with a parallelepiped element and is secured to the specimen with four bolts to give sufficient rigidity (Figure 6).
Until the predefined requirements are satisfied and testing starts, the force is applied to the samples in a gradually increasing manner at an average velocity of 0.5 kN/s. Following the recommendations made by Branco et al. [29], the frequency of the stress that is applied for the test specimen is set to 5 Hz.

4. Methodology

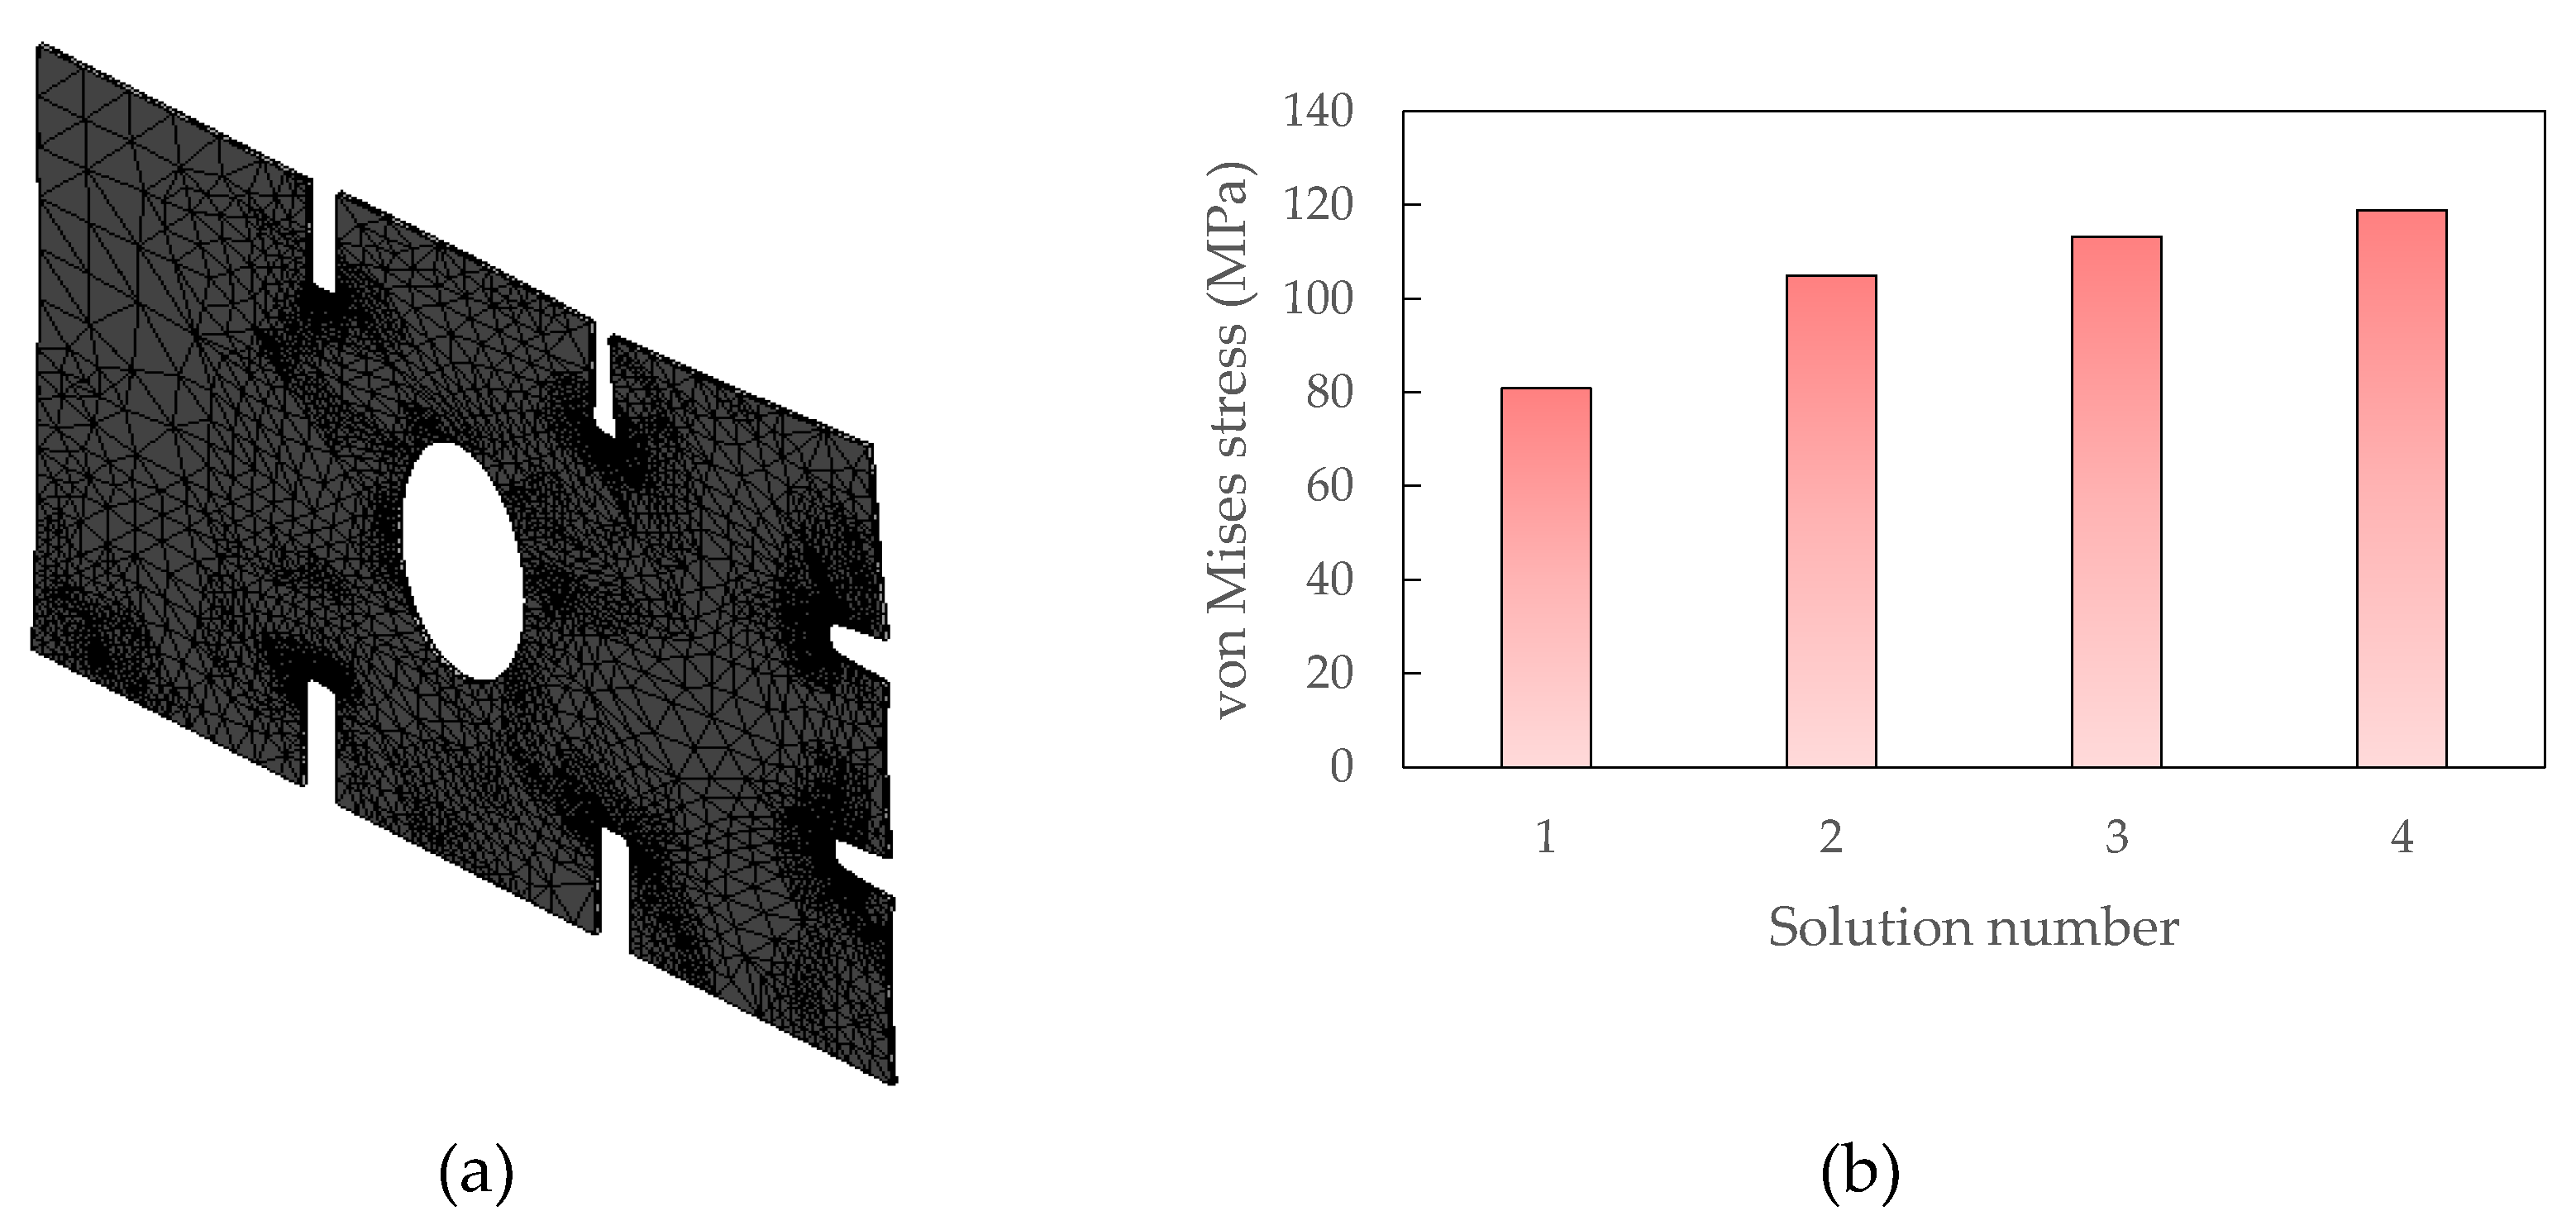
A model of linear elastic material, based on the notion of minor displacement, is assumed for the analysis. Buckling strength is assessed using ANSYS® Workbench 2024, which provides various 3D solid and tetrahedral finite elements to examine stress distribution across the thickness. The method proposed by Kim et al. [8] is employed to determine an appropriate fine mesh size, allowing for a seamless transition across different sections of the model. A mesh convergence procedure was implemented by repeatedly adjusting the solution count until the change in von Mises stress between consecutive values was comparable to the finite element reliability criteria mentioned by Patil and Jeyakarthikeyan [30]. With a typical element edge measurement of 47.765 mm, the mesh speed of convergence as a function of element and node count is shown in Figure 7 and Table 3. At lower processing levels, a feasible solution was obtained with 116065 nodes and 74110 elements, yielding a 4.8% deviance.
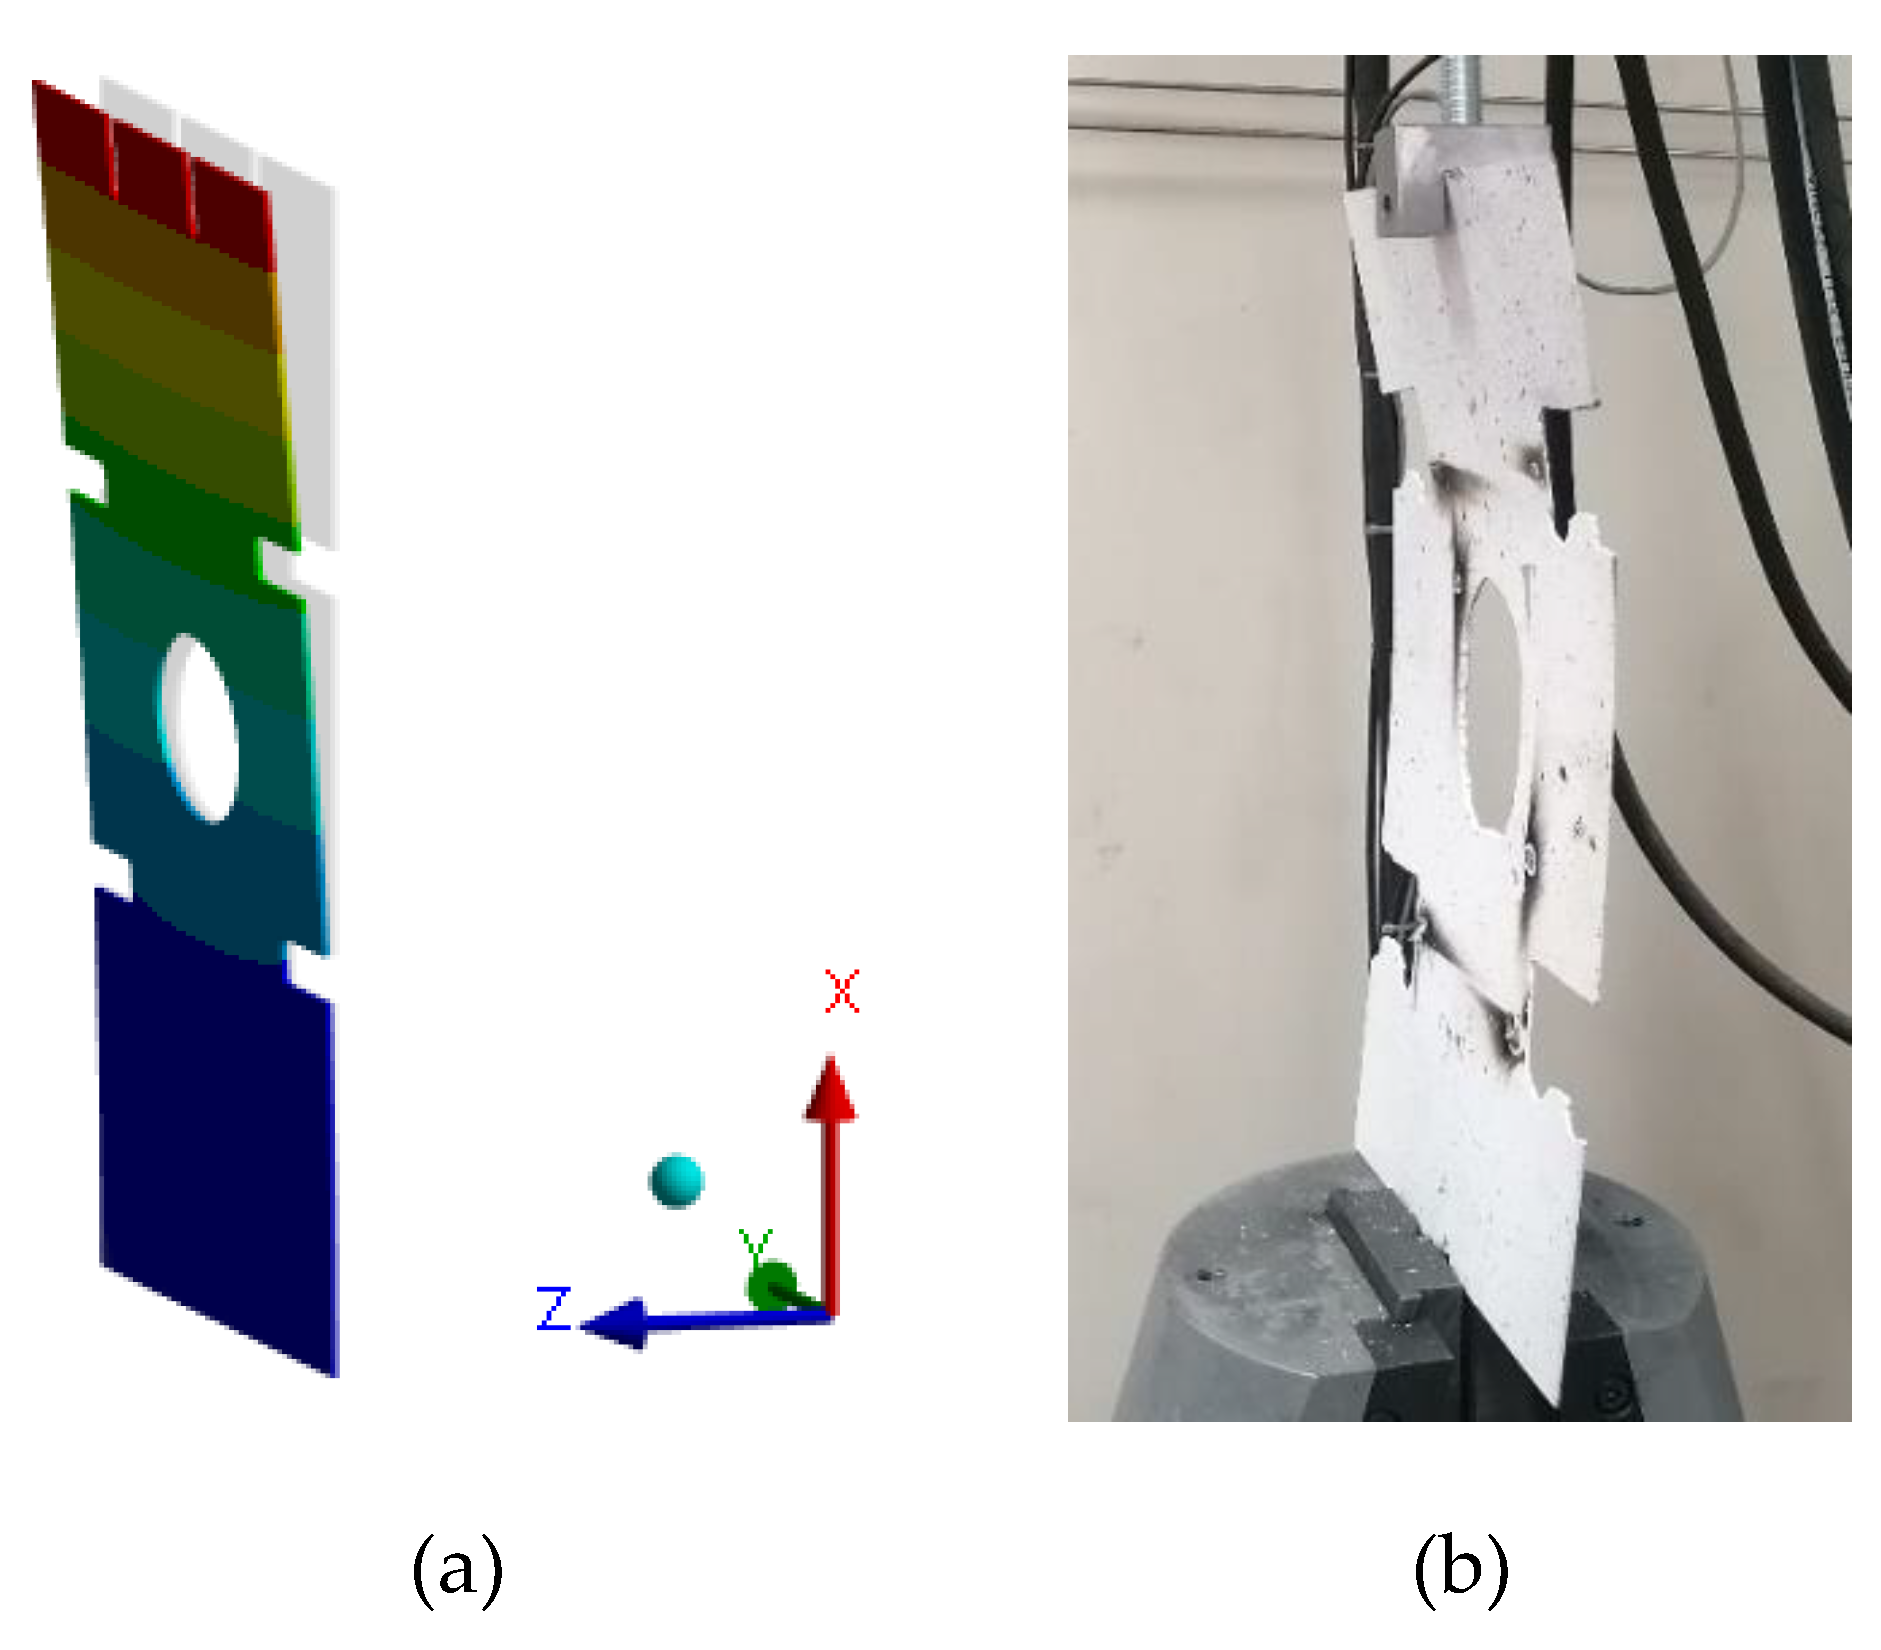
The numerical model is validated in two phases; on the one hand, by a global approach establishing a modification of maximum displacement of 4.2% of the free end of the cantilevered double bottom floor (Figure 8).
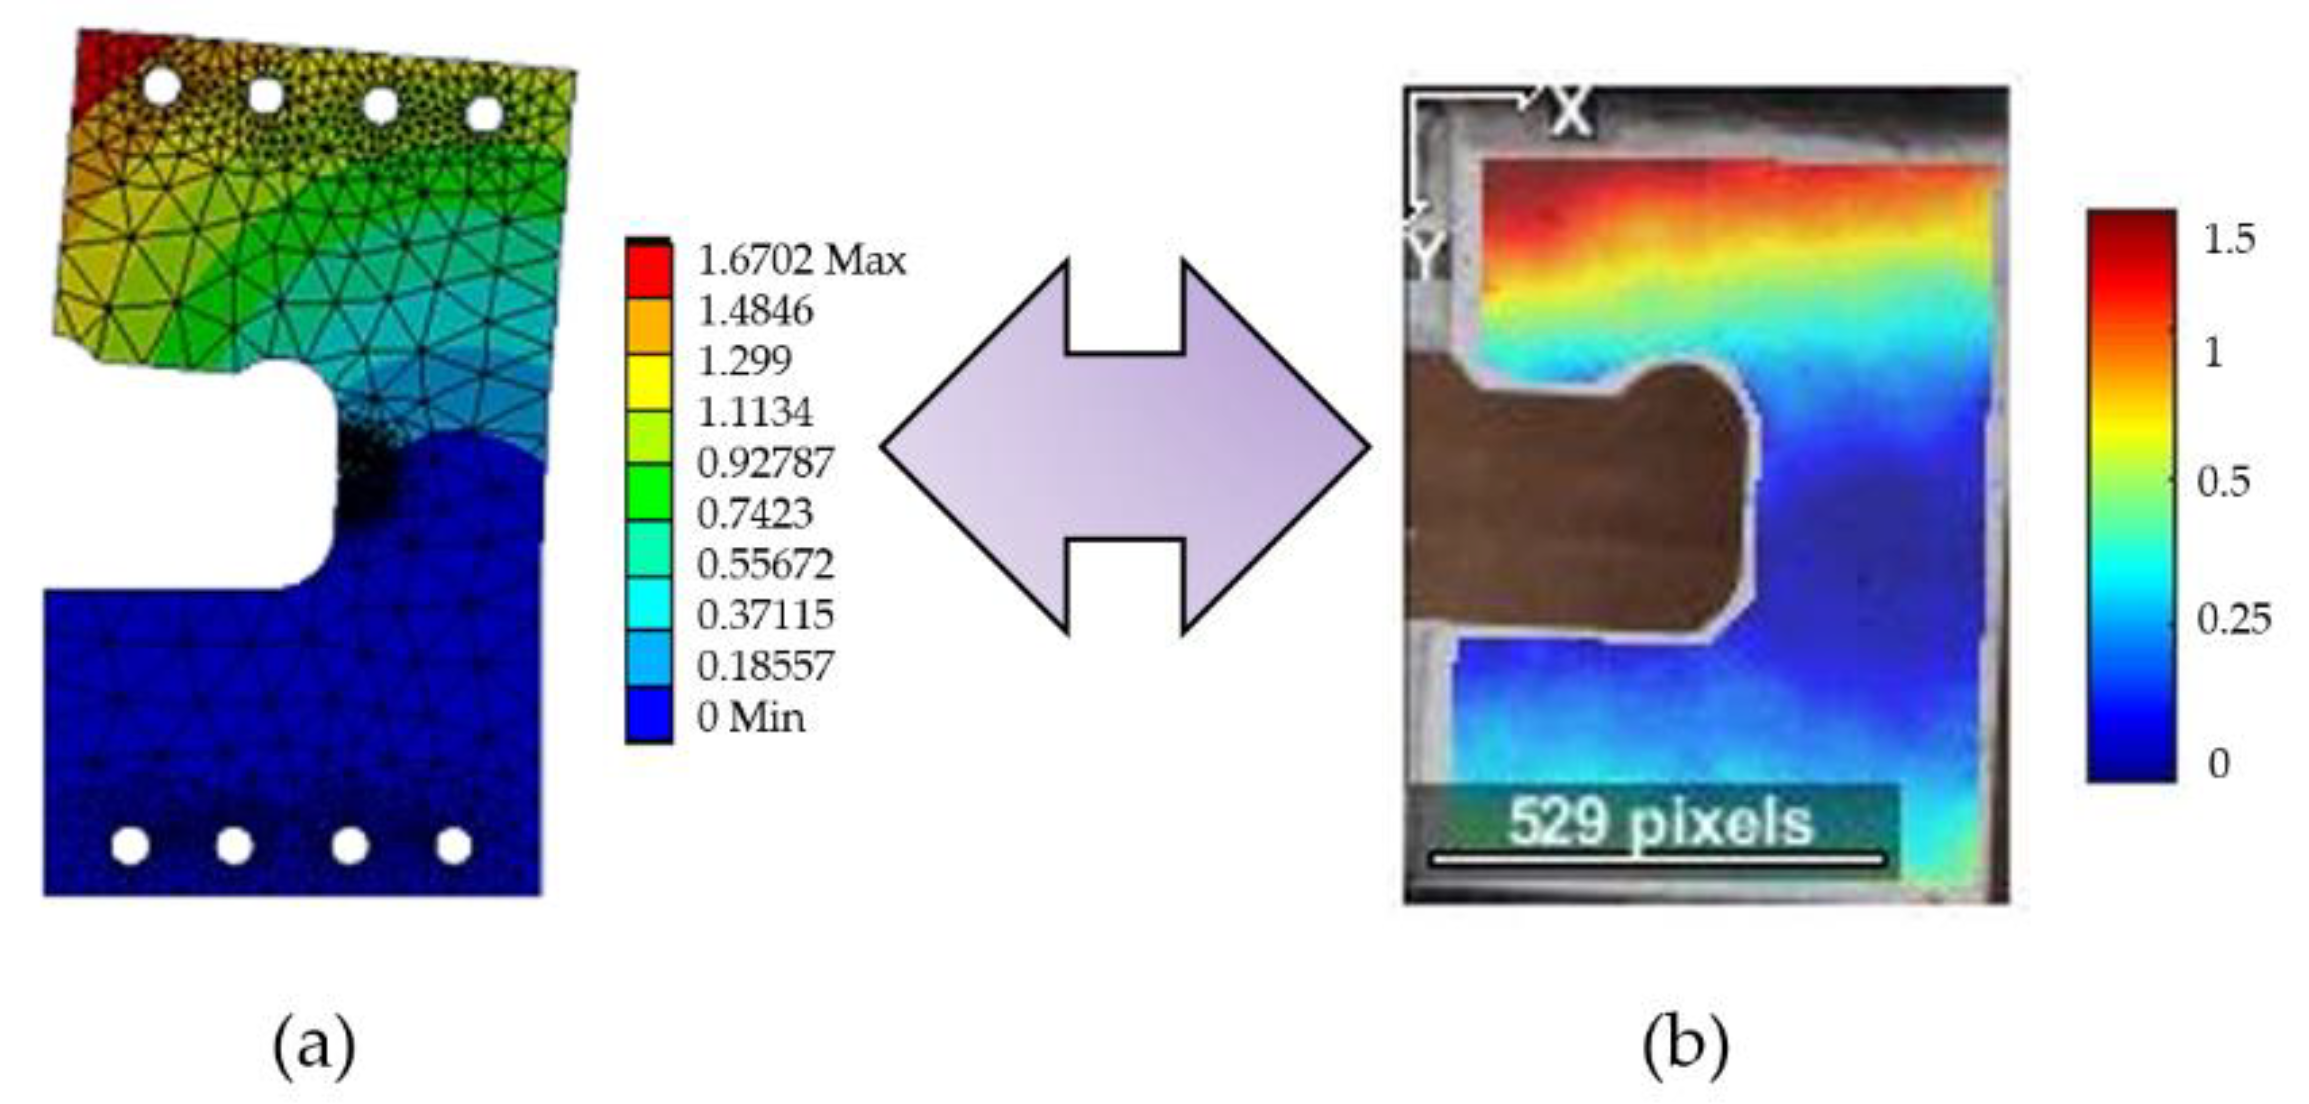
Following the methodology outlined by Kumar et al. [32], the second stage of validating the numerical model entails comparing numerical (FEM) and experimental results by correlating them using digital image correlation (DIC) with the 2D MATLAB® software Ncorr® [31]. Under the given standard load circumstances, the maximum displacement varies by 7.1% (Figure 9).

5. Results and Discussion

5.1. Impact of the Central Opening and Side Contour Cut-Outs

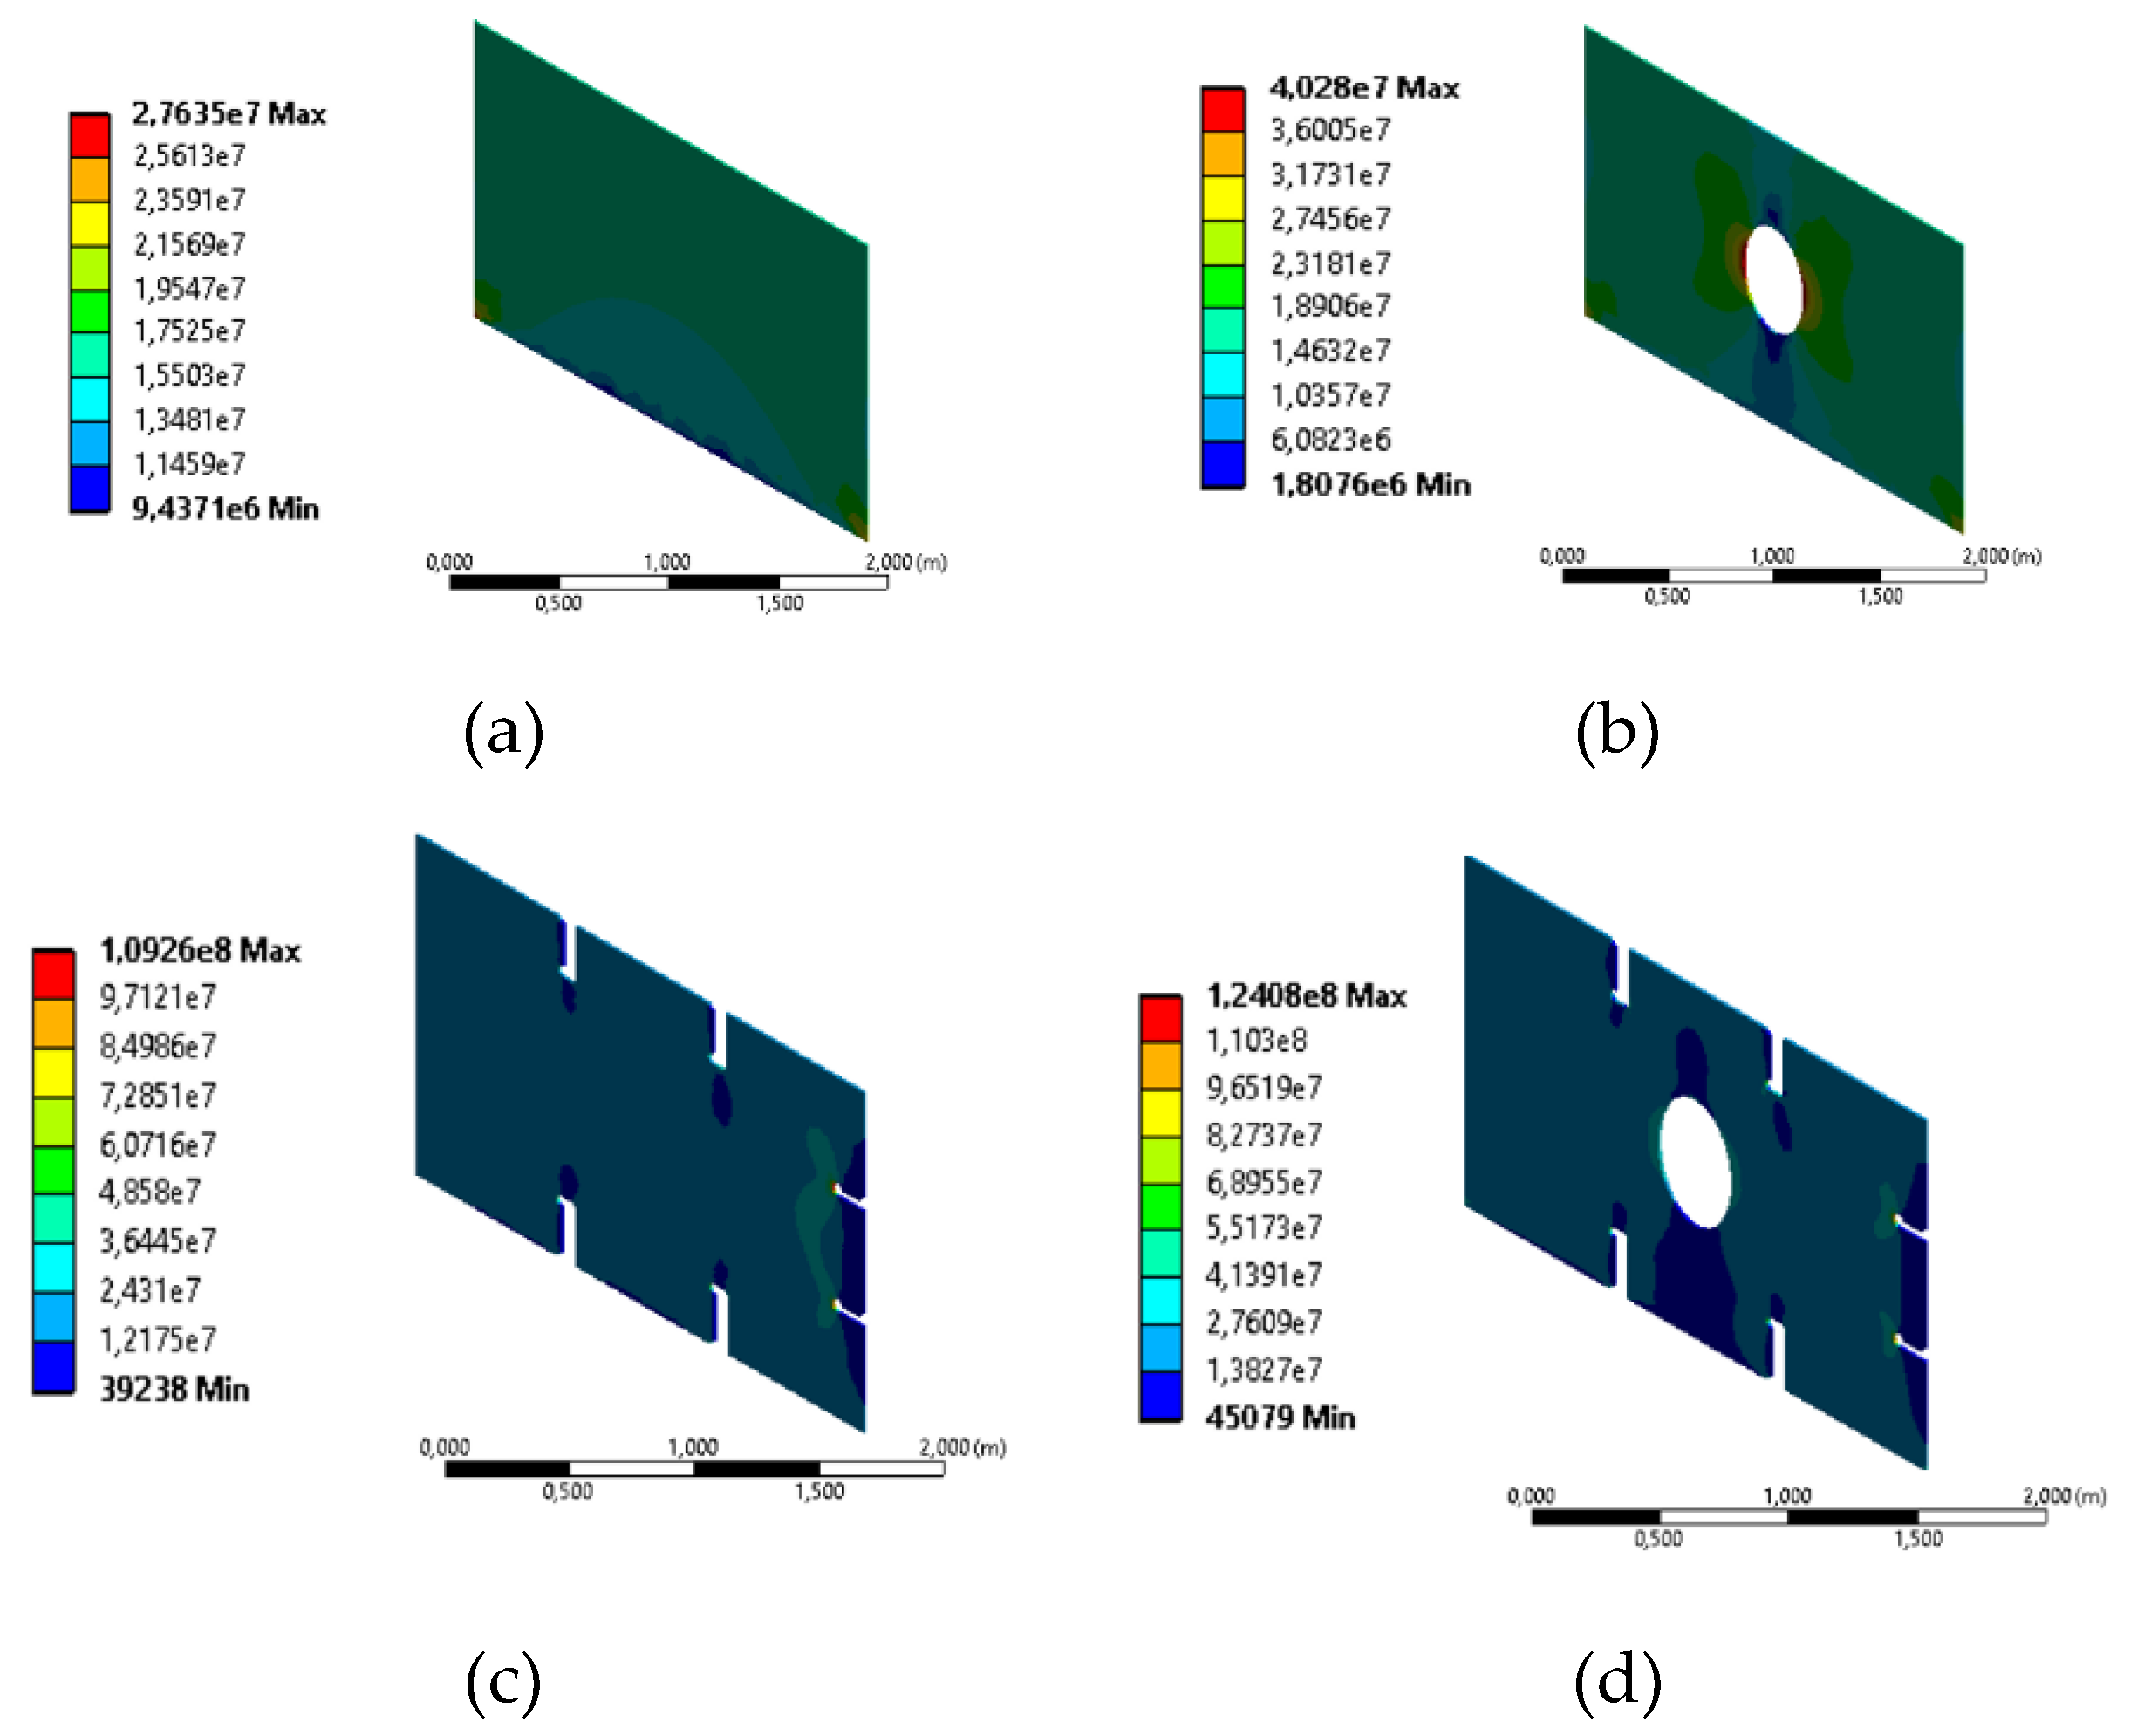
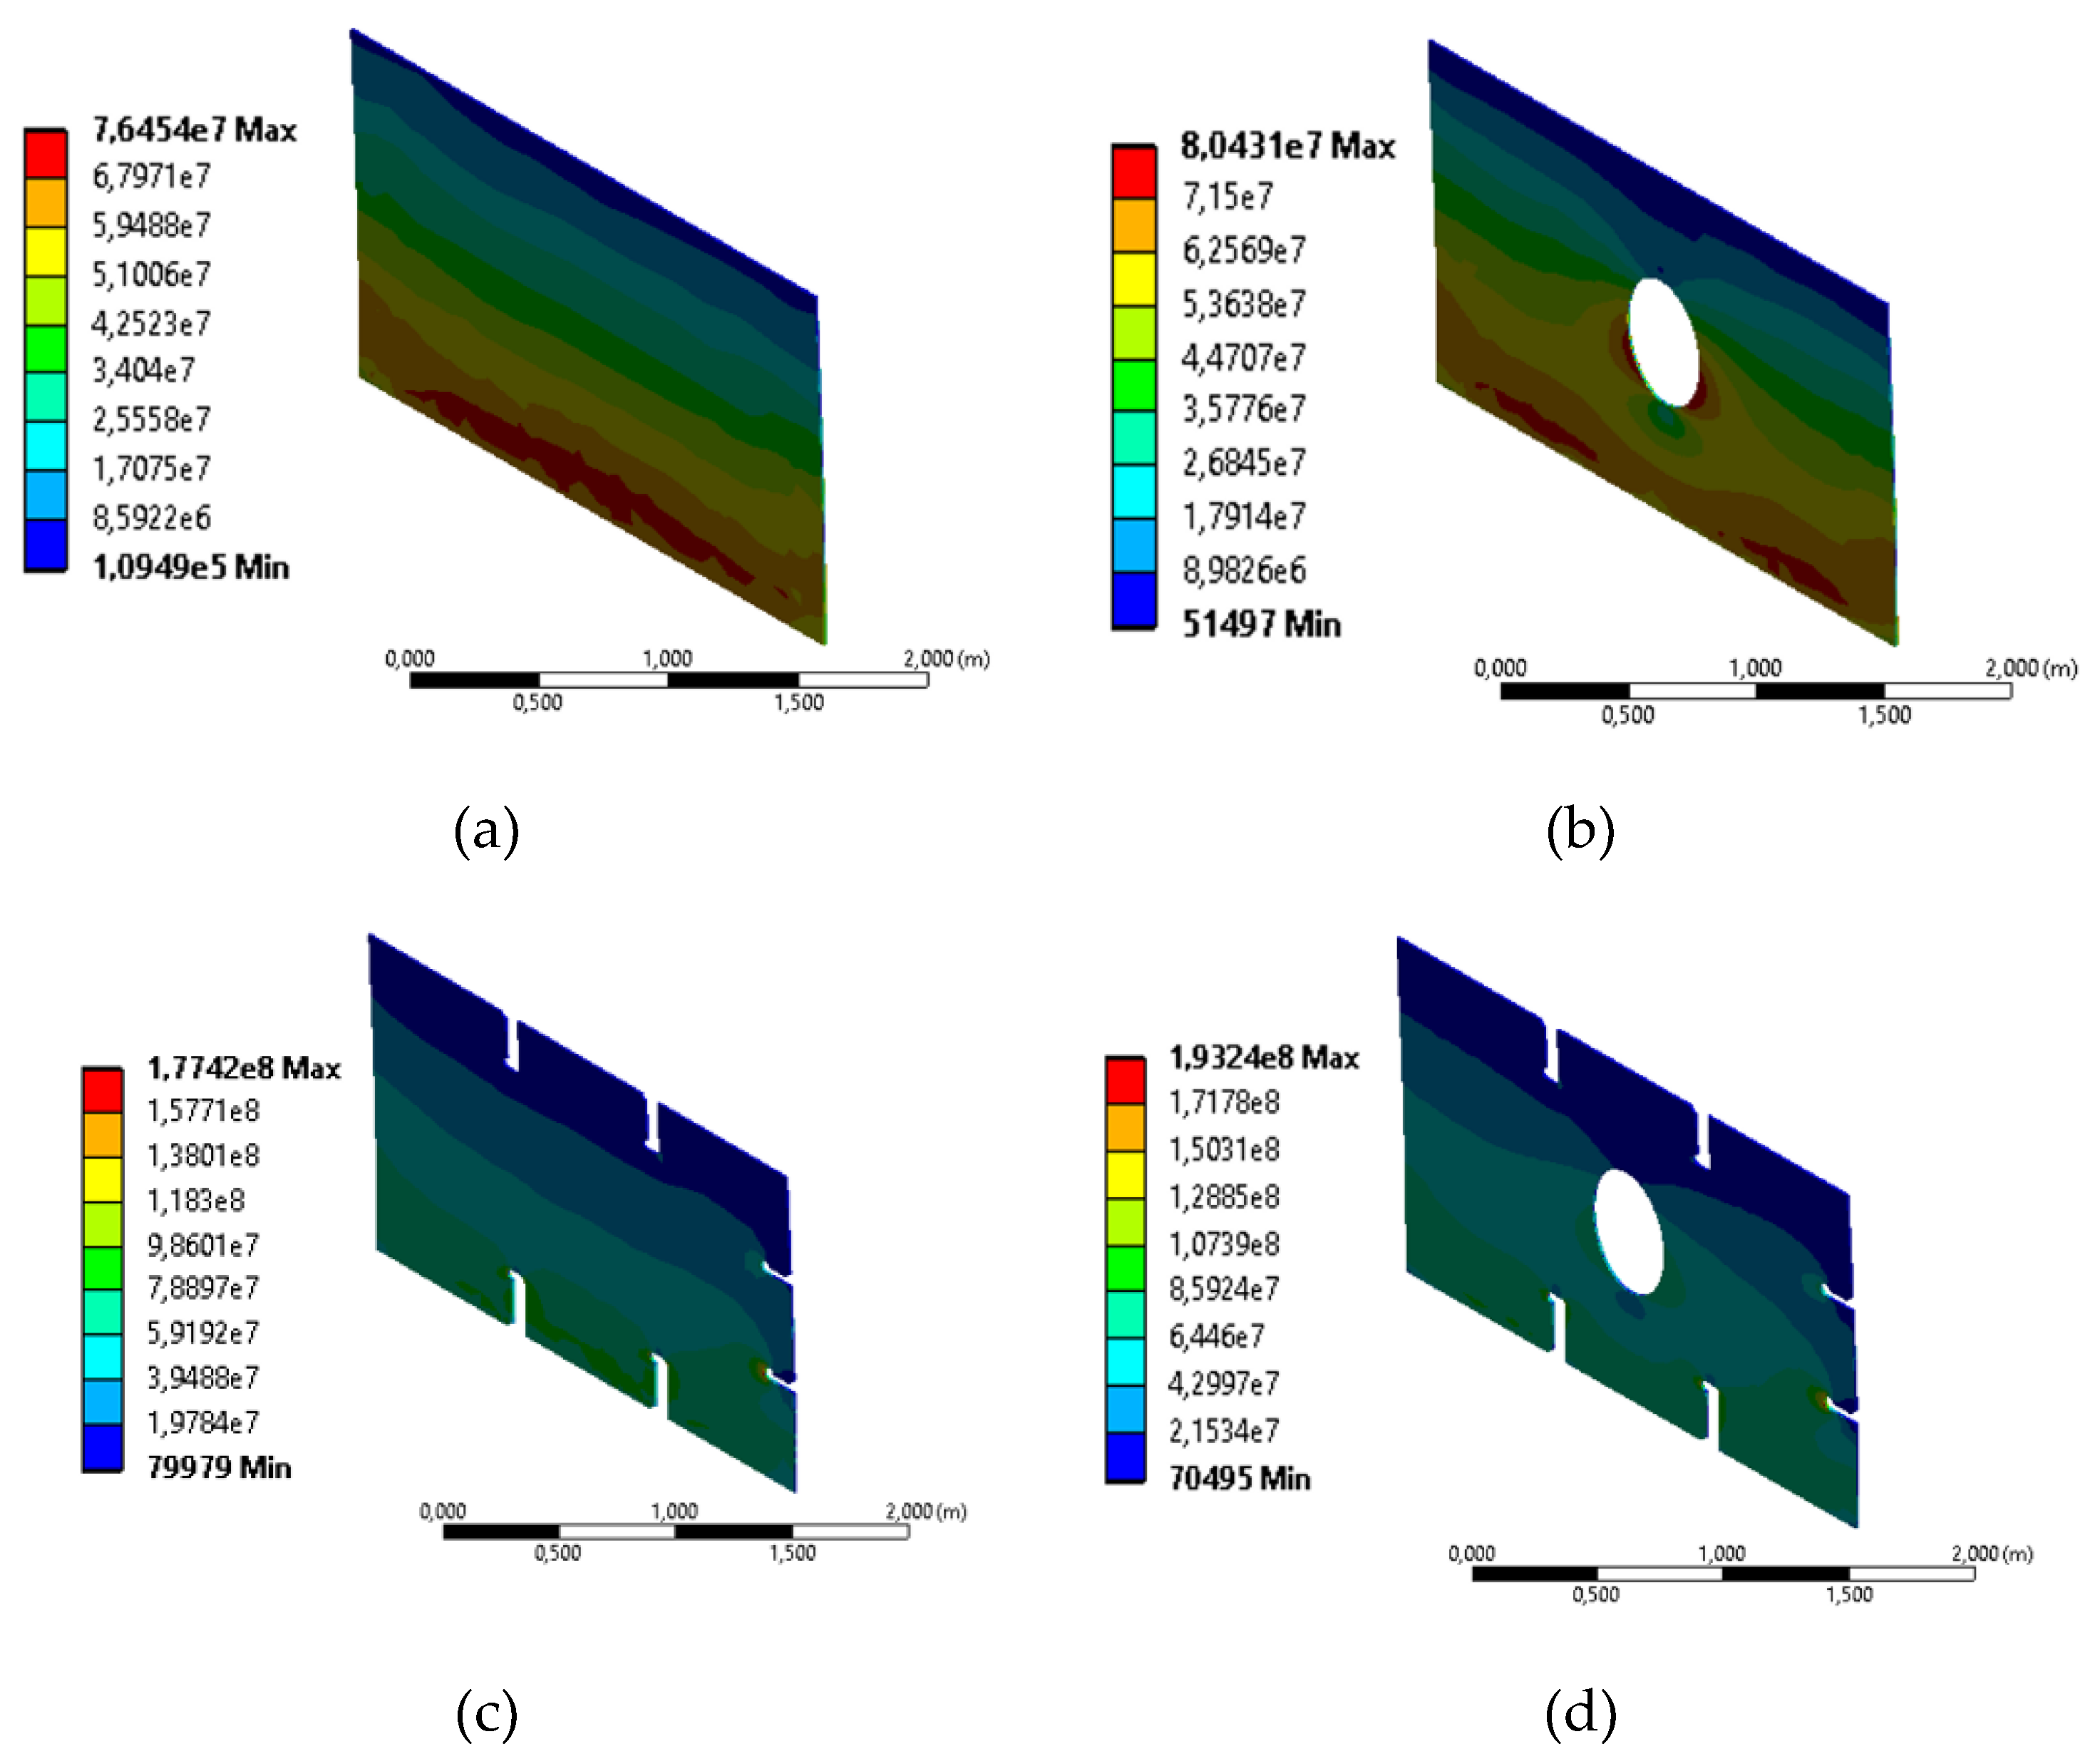
Figure 10 shows the von Mises stress distribution of the double bottom floor in the presence of the different geometric discontinuities, for the case of 14.5 mm thickness and axial load.
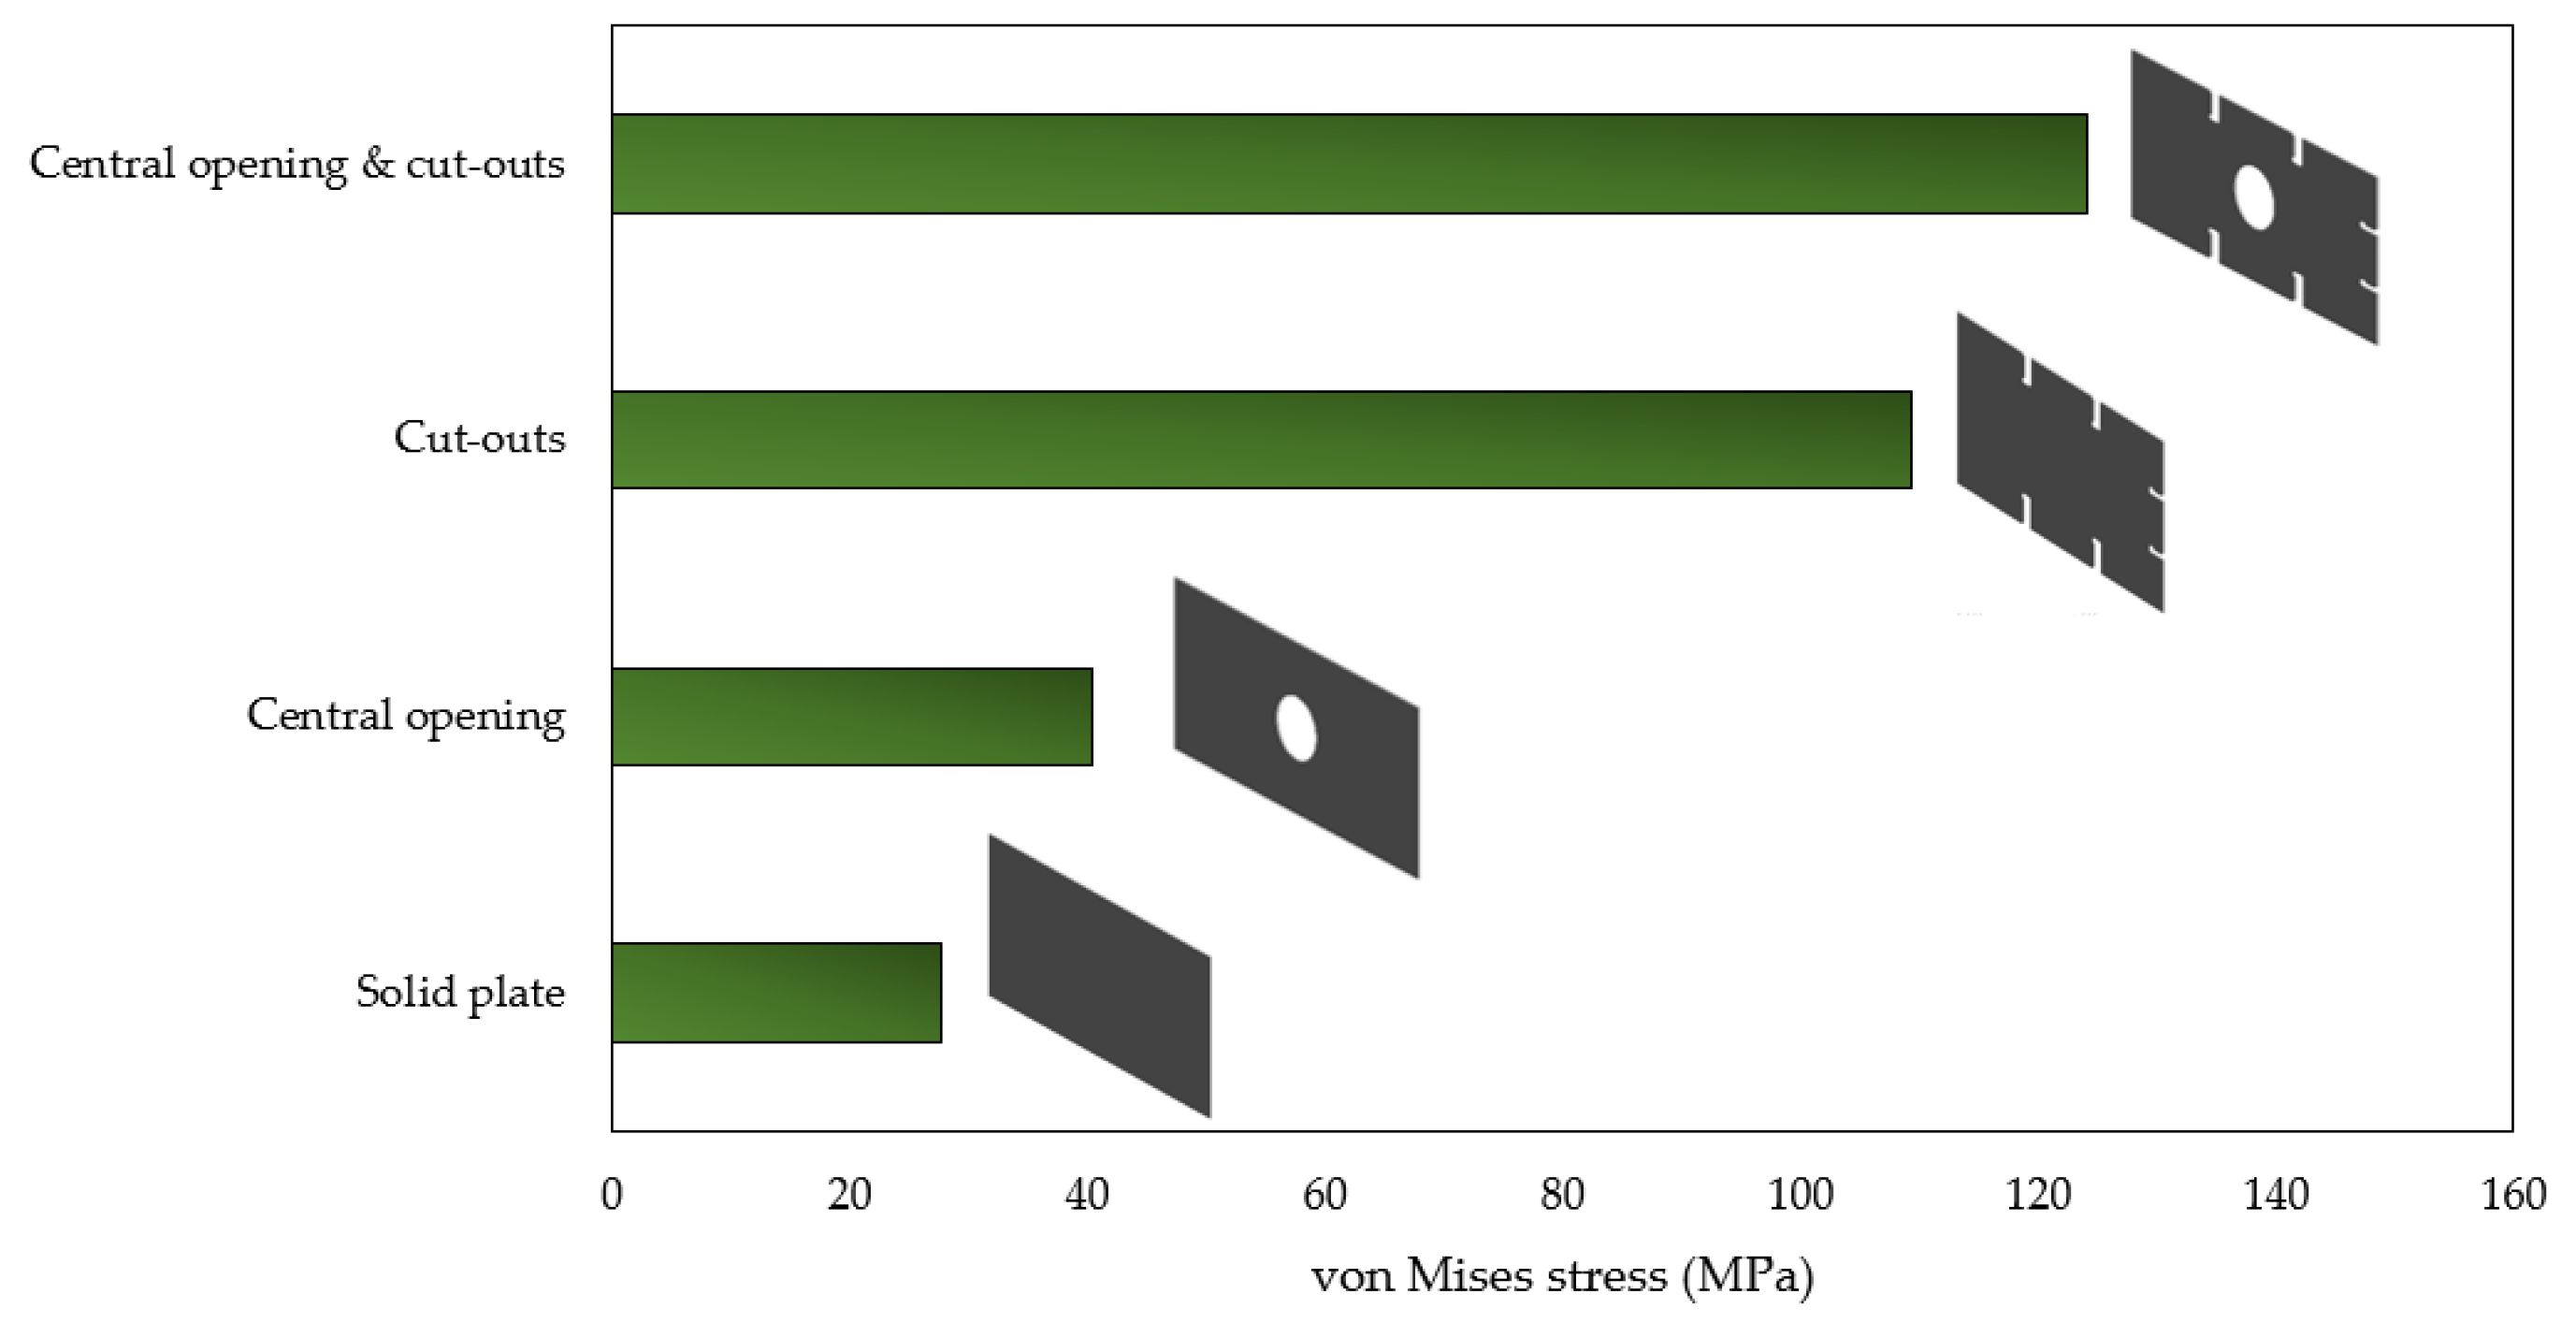
The double bottom floor, under axial loading scenario and different geometrical conditions, shows a very significant variation of the stress distribution that represents the great influence of the openings present in the structural behavior of the same with respect to the initial condition of solid plate, in terms of the increase of the maximum von Mises stress of 31.4%, 74.7% and 77.7% with respect to the condition of plate with central opening, plate with cut-outs and plate with central opening and cut-outs, respectively. A great influence of the presence of the cut-outs with respect to the central opening is observed, since there is a minimum difference of 3% of stress increase when all the geometrical discontinuities (central opening and cut-outs) or only the cut-outs are present. (Figure 11).
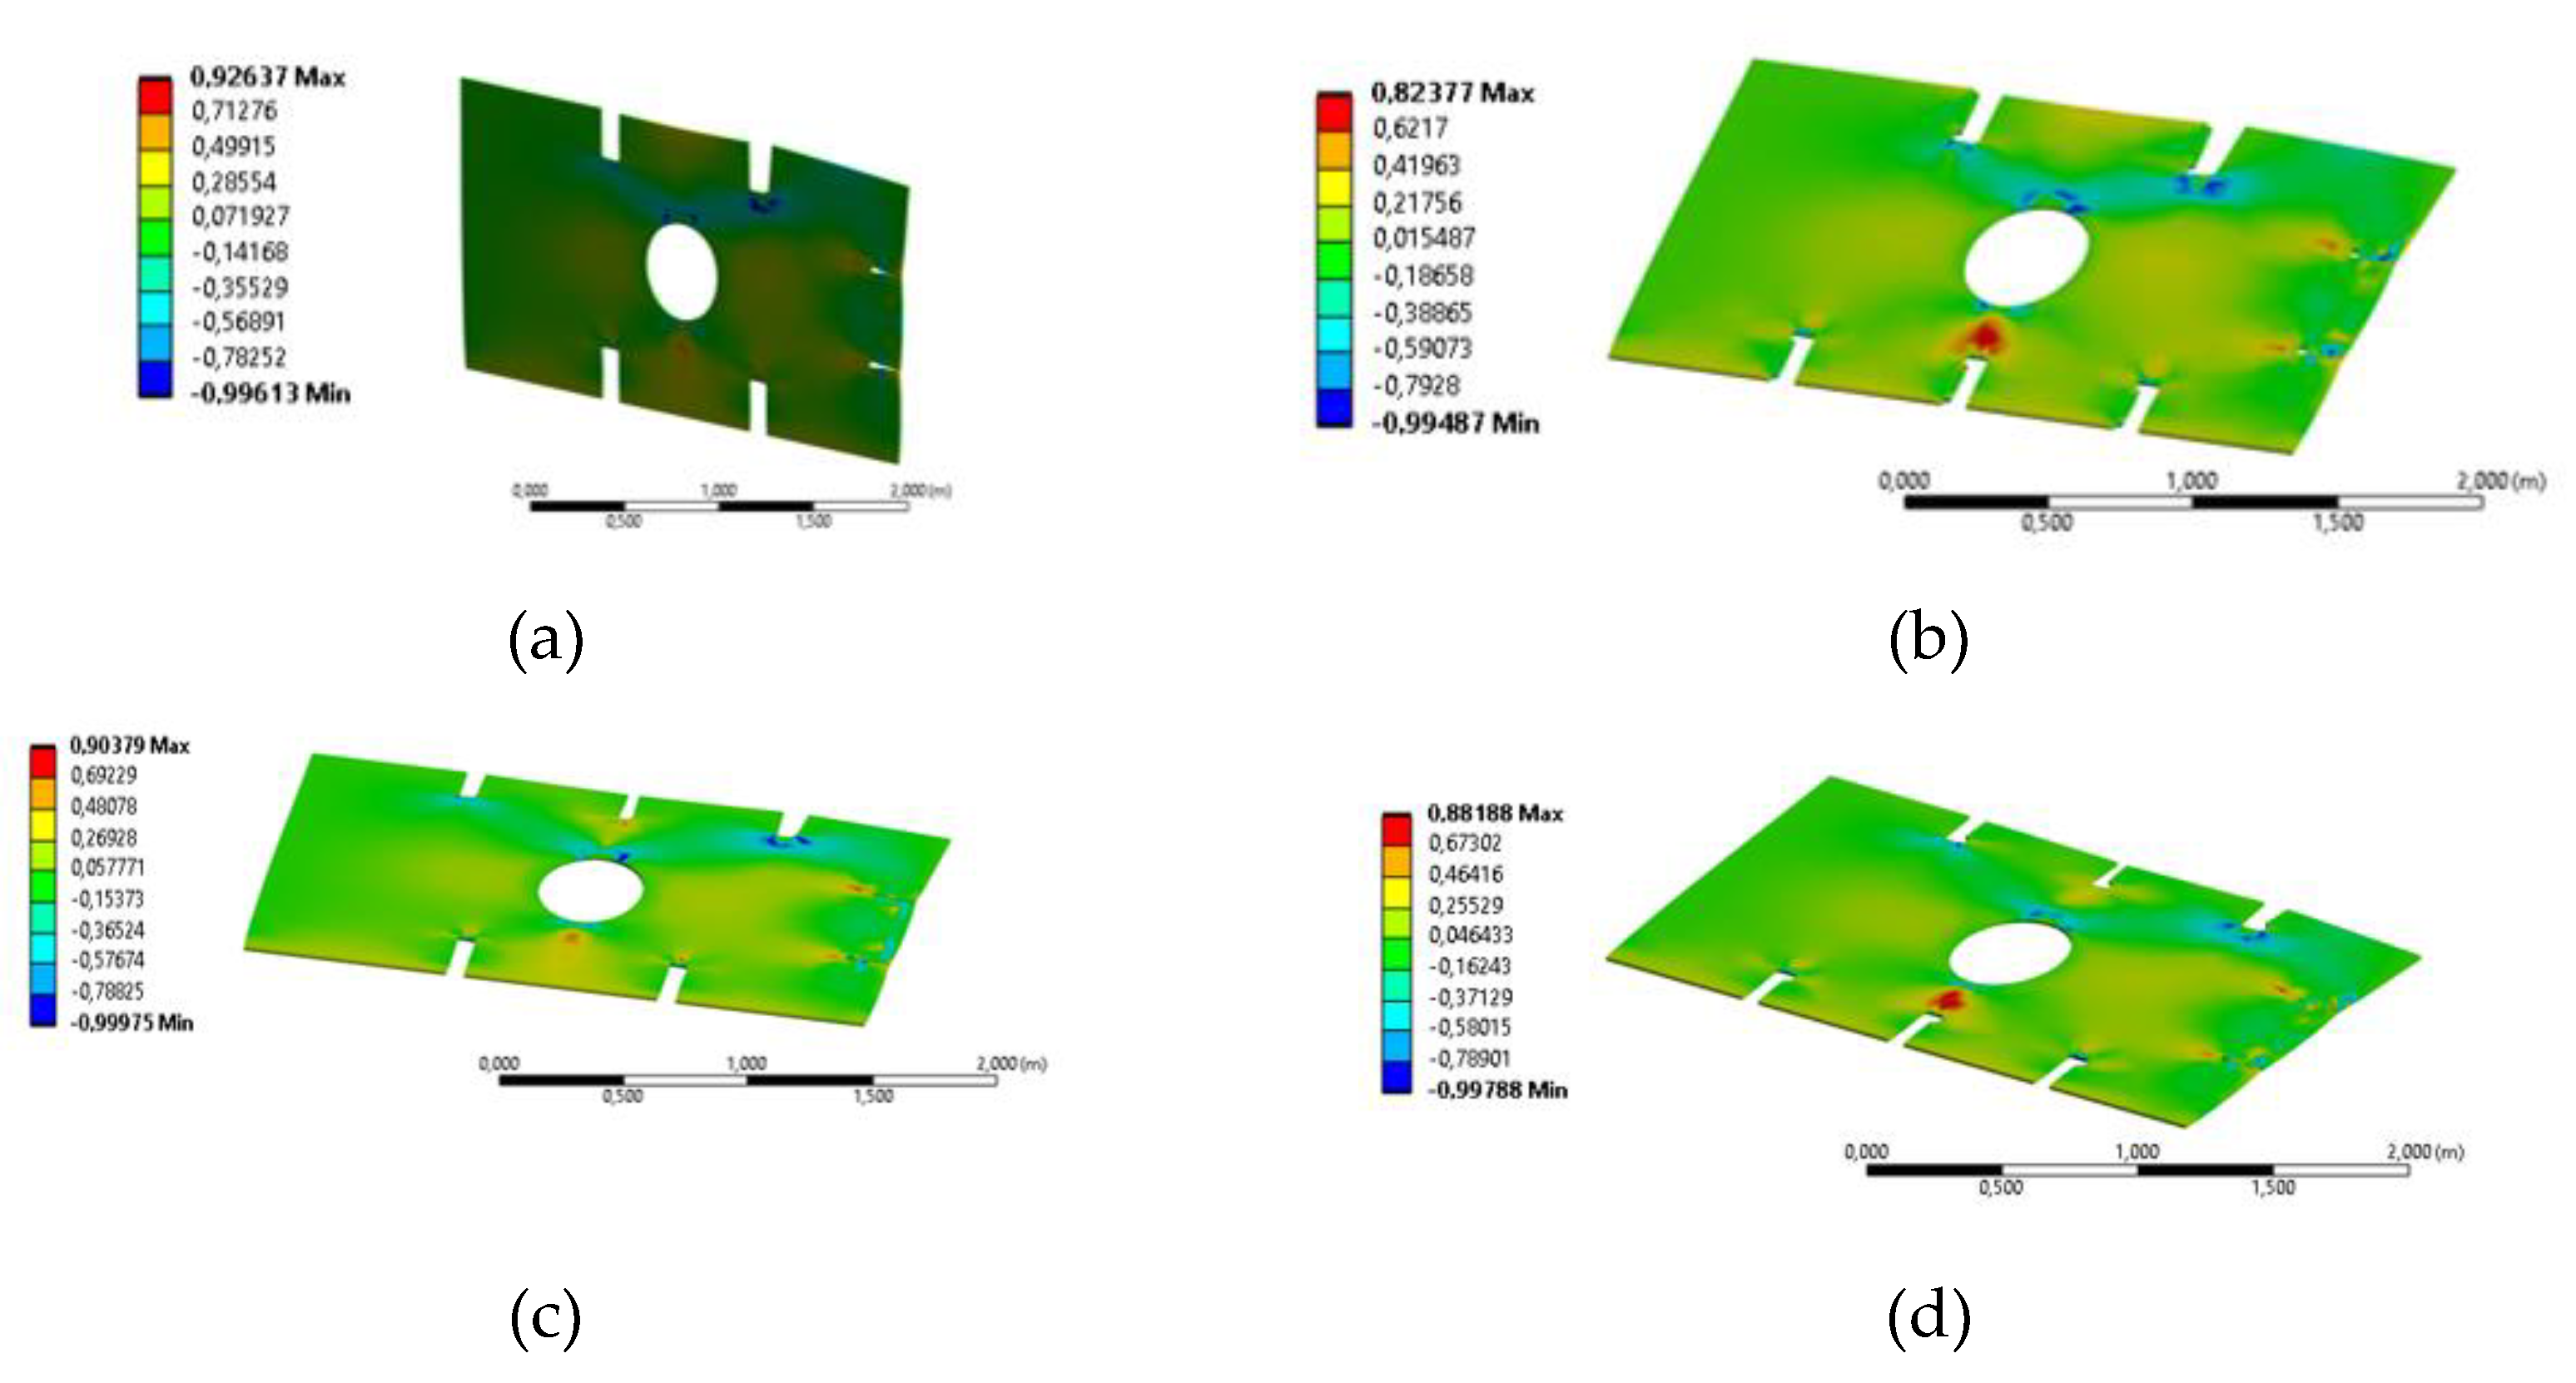
Figure 12 shows the stress distribution of the double bottom floor in the presence of the different geometric discontinuities, for the case of 14.5 mm thickness and transverse loading.
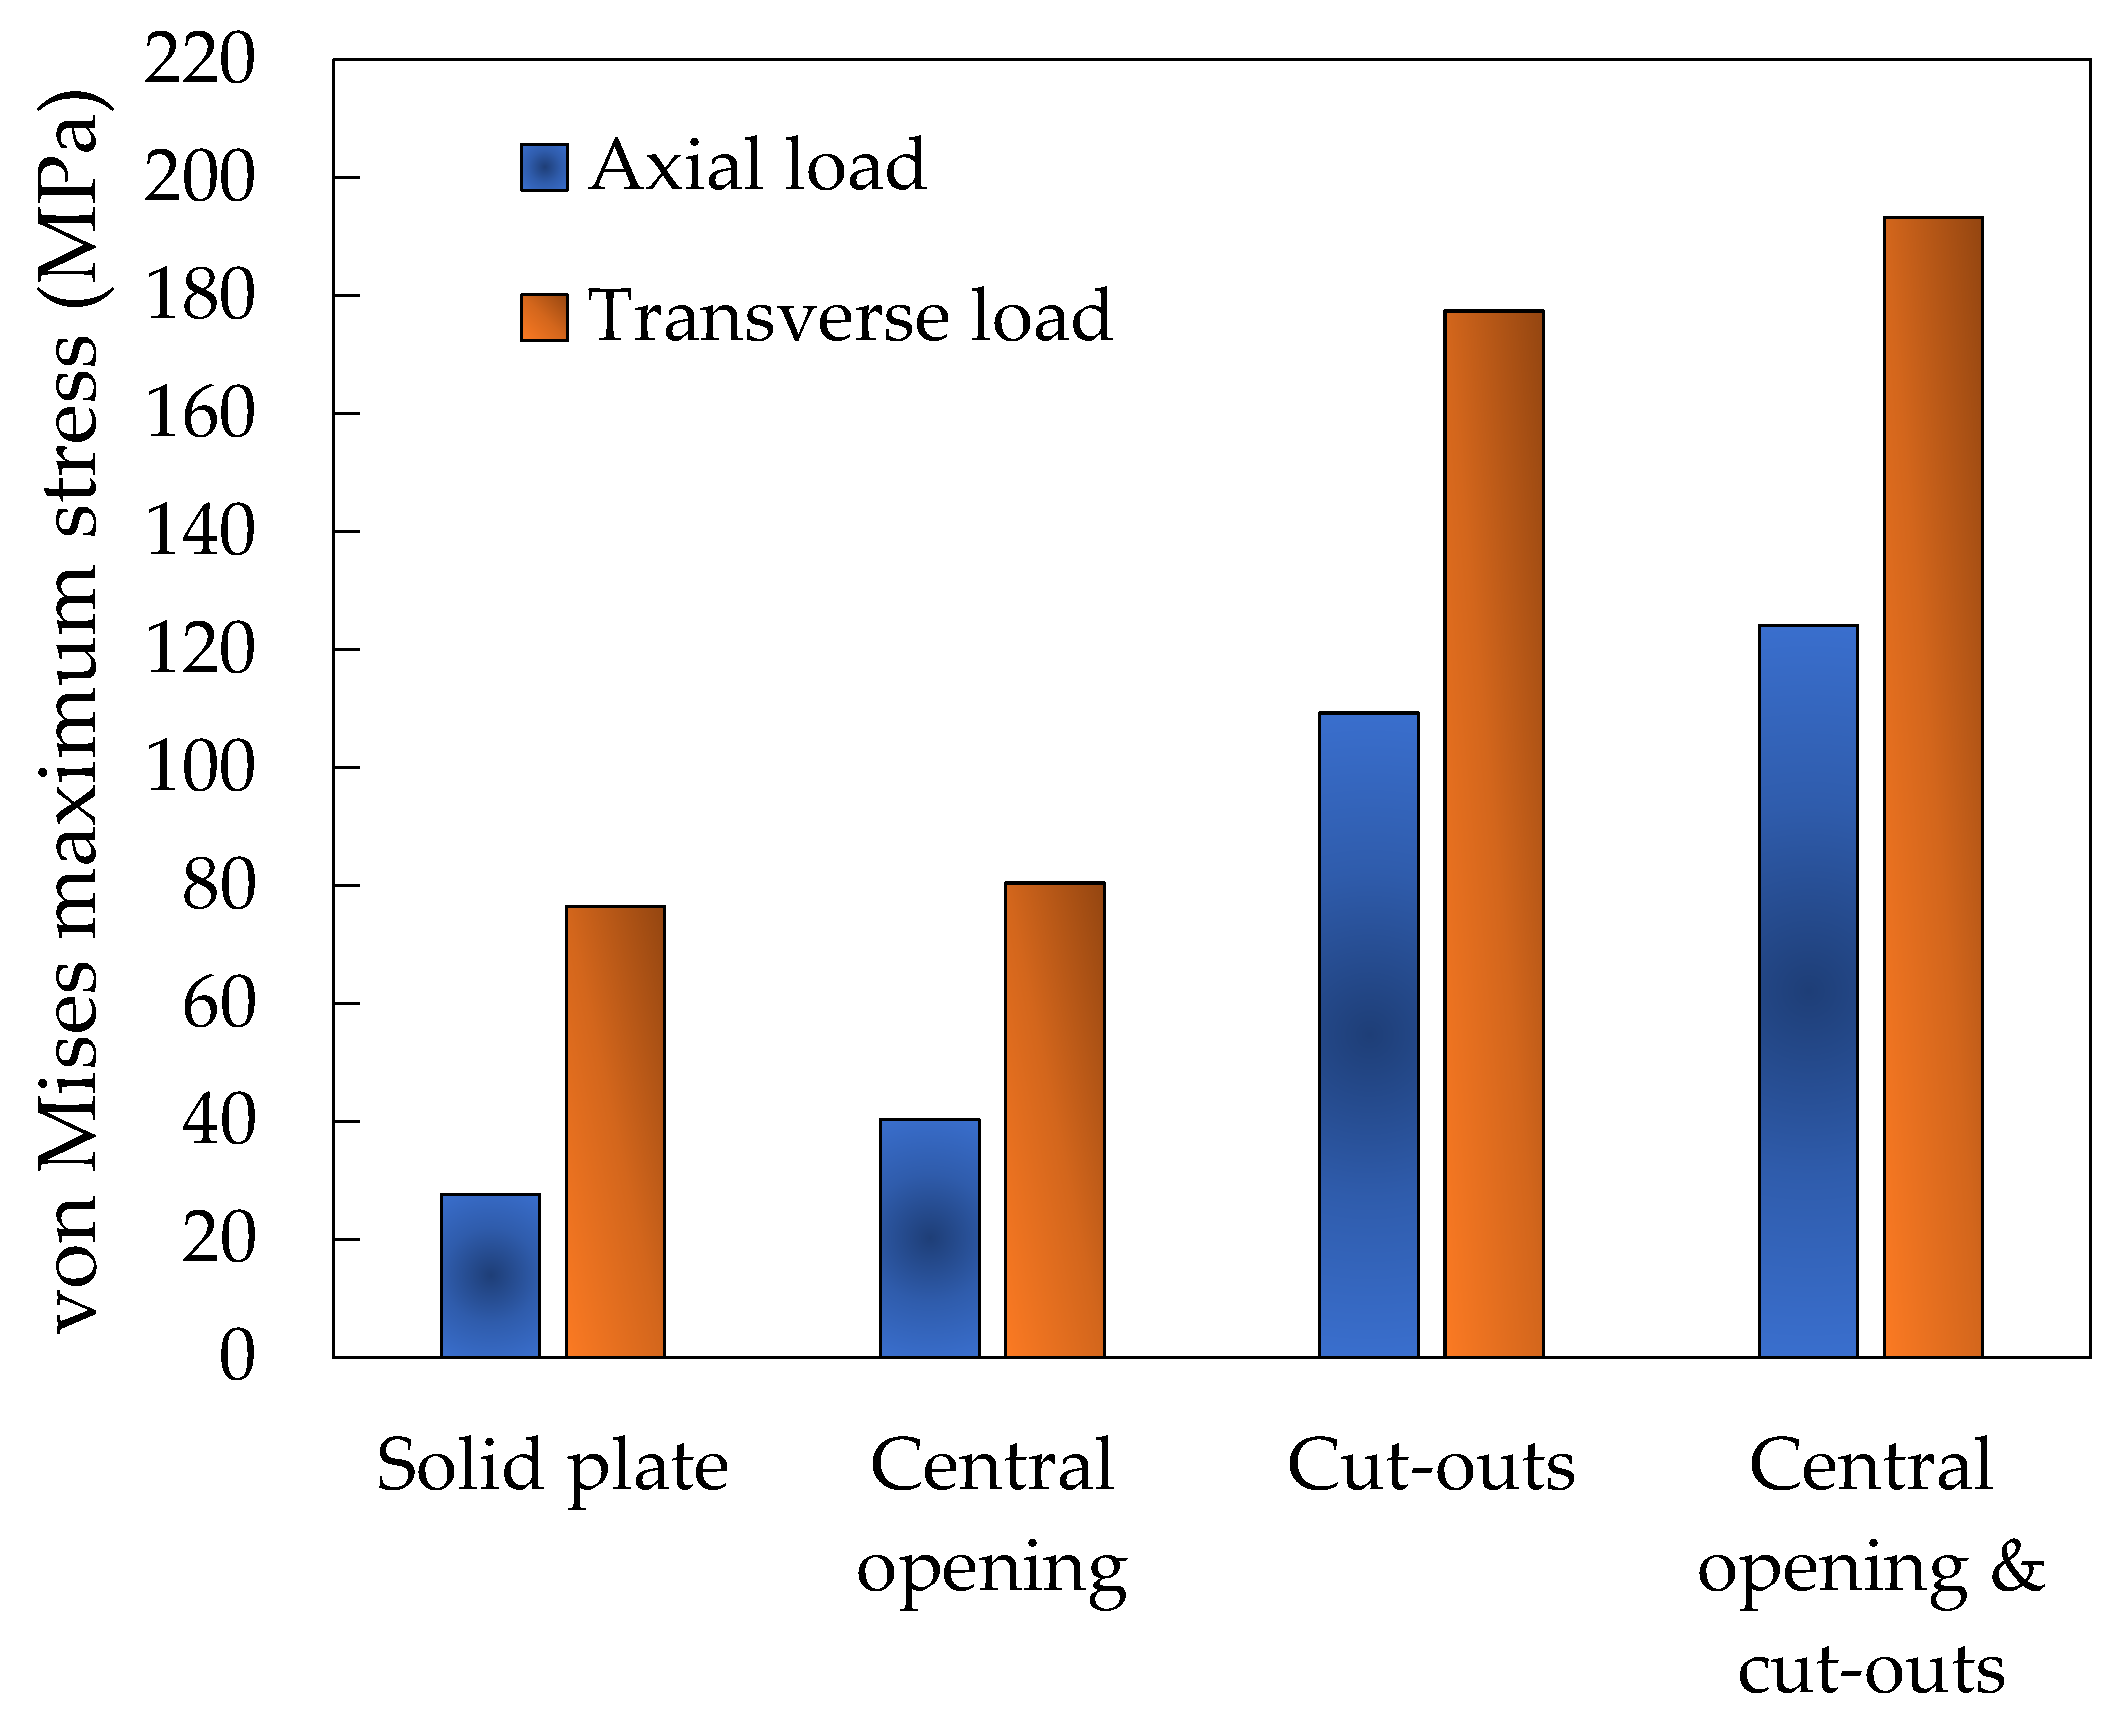
The double bottom floor exhibits variations in stress distribution under transverse loading conditions and different geometric configurations, highlighting the impact of the openings on its structural behavior compared to the original solid plate. This results in increases in the maximum von Mises stress of 4.9%, 56.9% and 60.4% for the plate with a central opening, the plate with cut-outs, and the plate with both a central opening and cut-outs, respectively. A notable rise in the maximum von Mises stress is evident when the loading scenario involves a transverse load as opposed to an axial load, with differences in maximum stress of 63.8%, 49.9%, 38.4% and 35.78% observed for the solid plate, plate with a central opening, plate with cut-outs, and plate with both features, respectively. Additionally, as the stress levels increase, the gap between the two loading conditions diminishes (Figure 13).
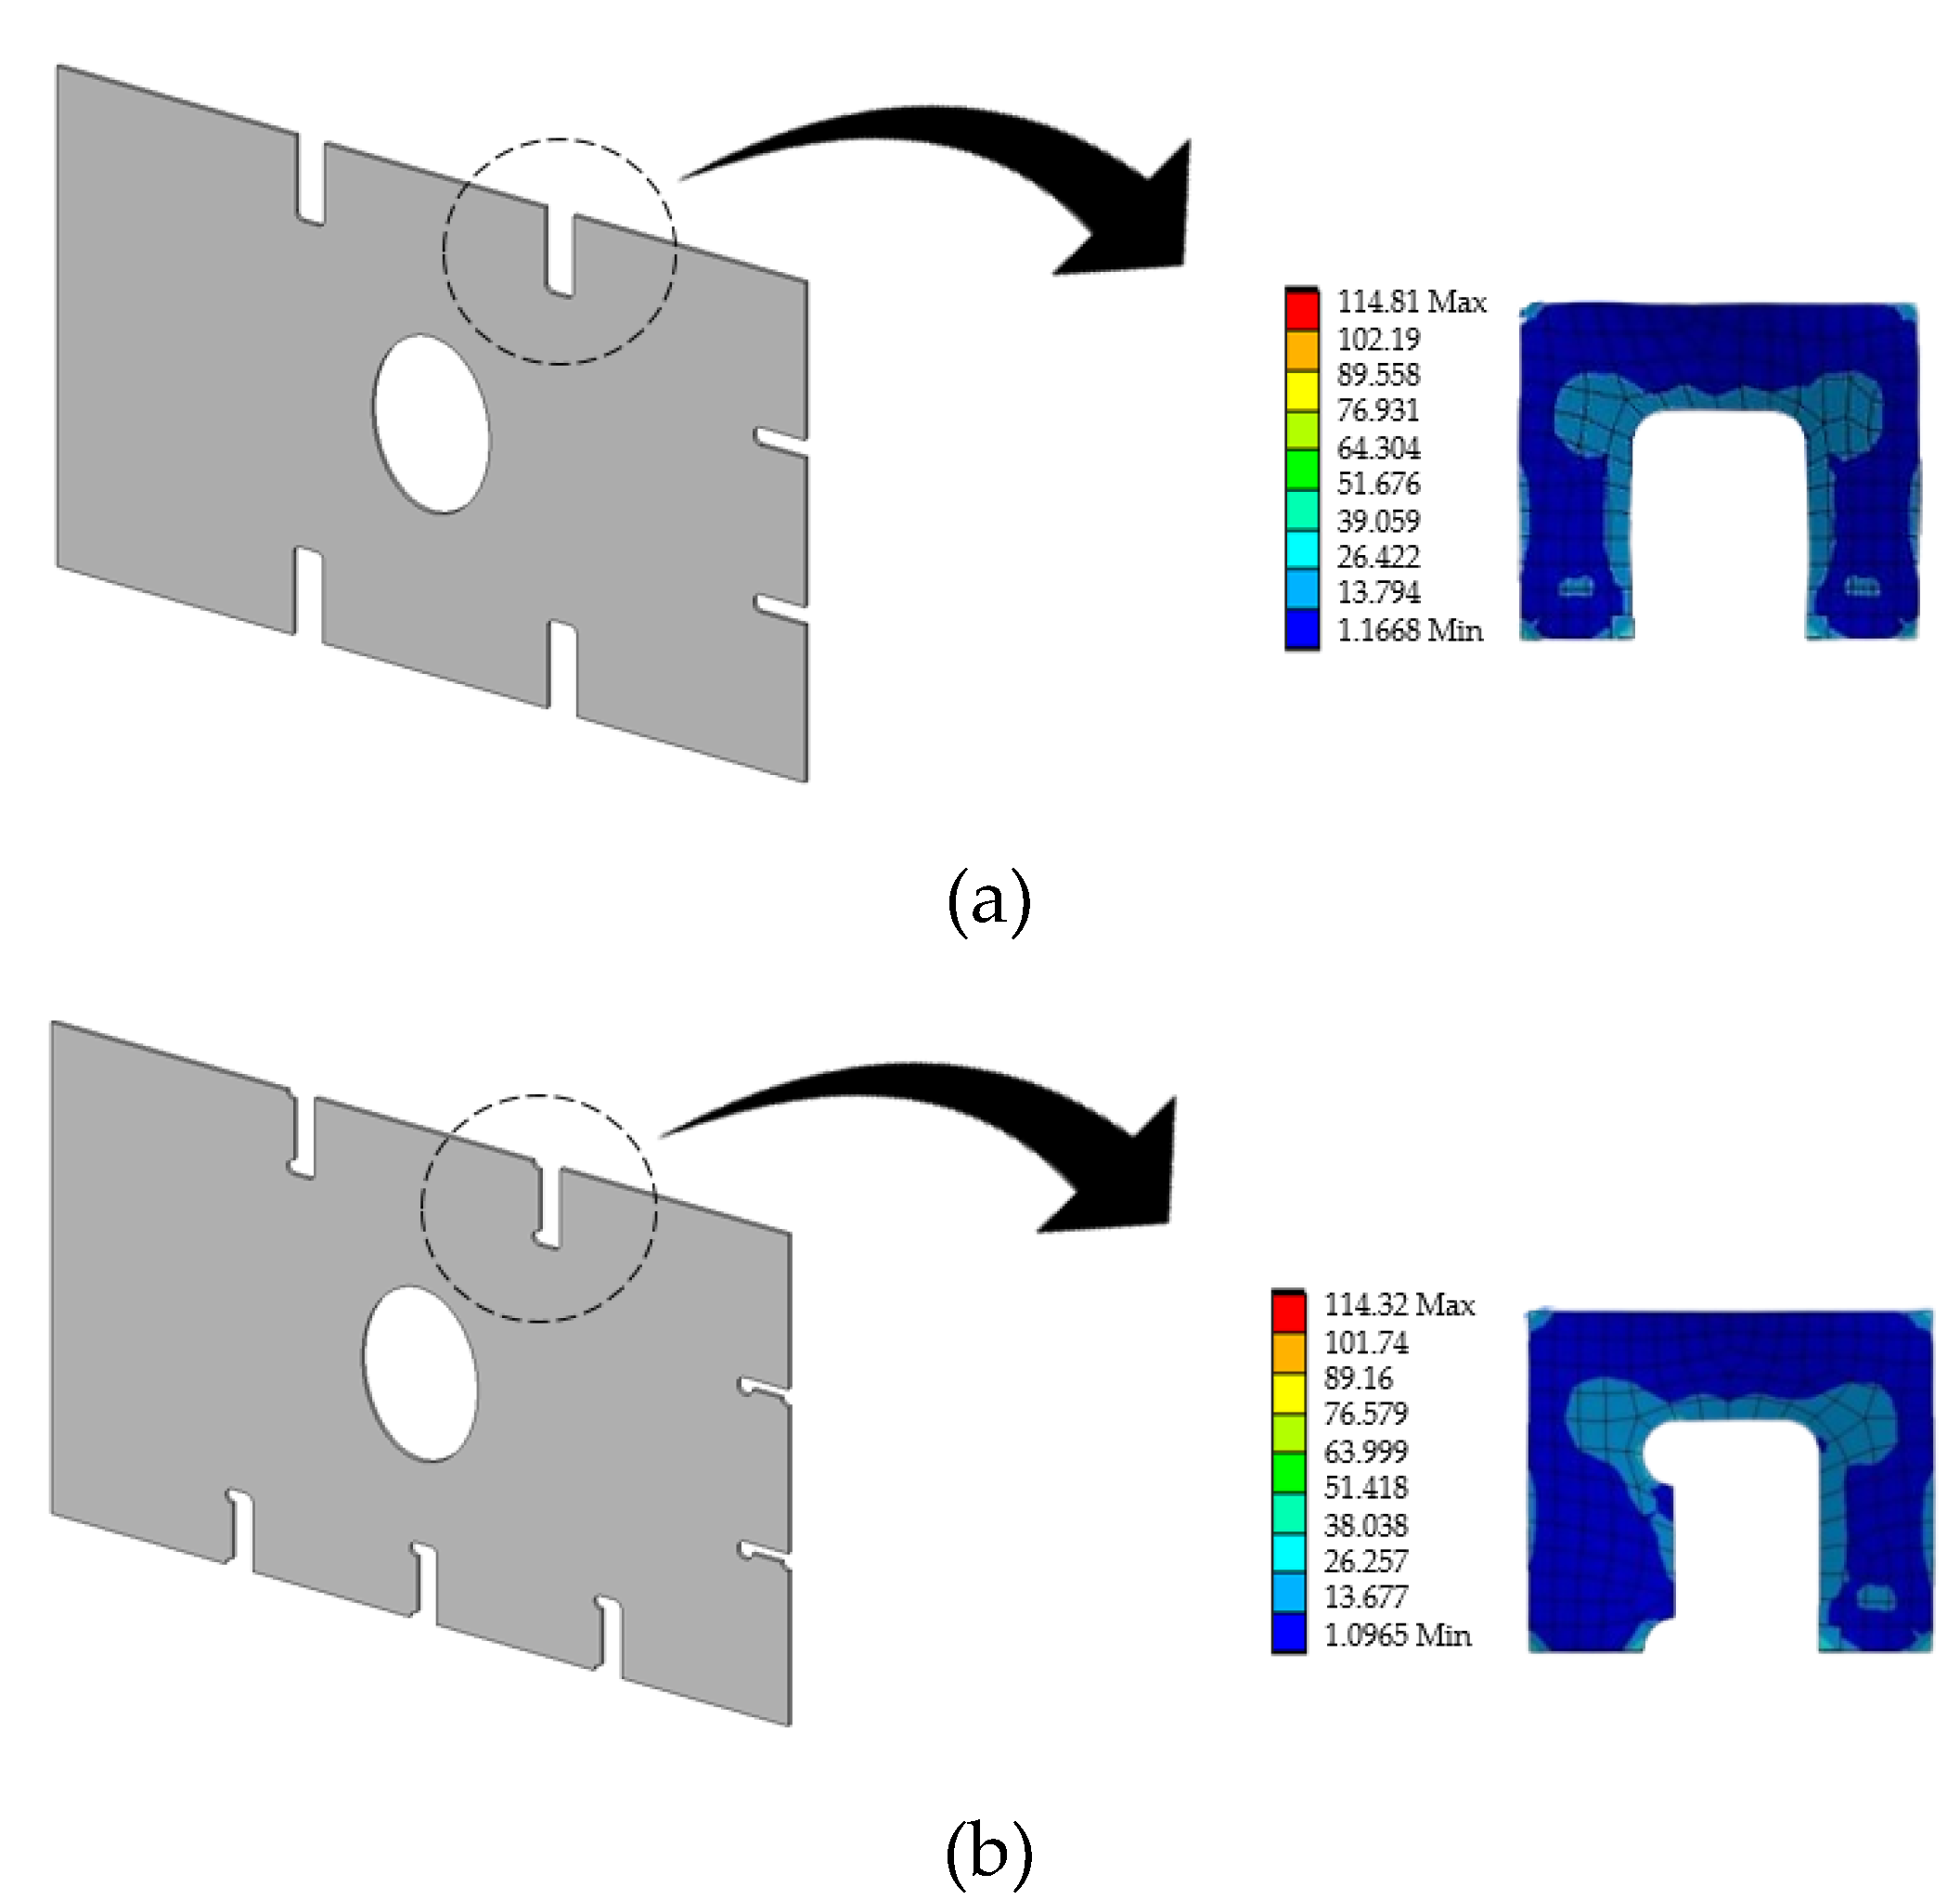
A more unfavorable and at the same time more conservative load scenario is established for the transverse load case. A common pattern is observed in the structural behavior regardless of the load scenario selected; A great influence of the presence of the cut-outs with respect to the central opening is observed, since there is a minimum difference of 5.8% of stress increase when all the geometrical discontinuities (central opening and cut-outs) or only the cut-outs are present. Figure 14 shows the difference, in terms of von Mises stress distribution, between cut-out no. 1 and no. 2 present in the double bottom, for the same SENT type loading condition, with an improvement in von Mises maximum stress of 0.43% of cut-out no. 2 over cut-out no. 1.

5.2. Effect of Plate Dimensions

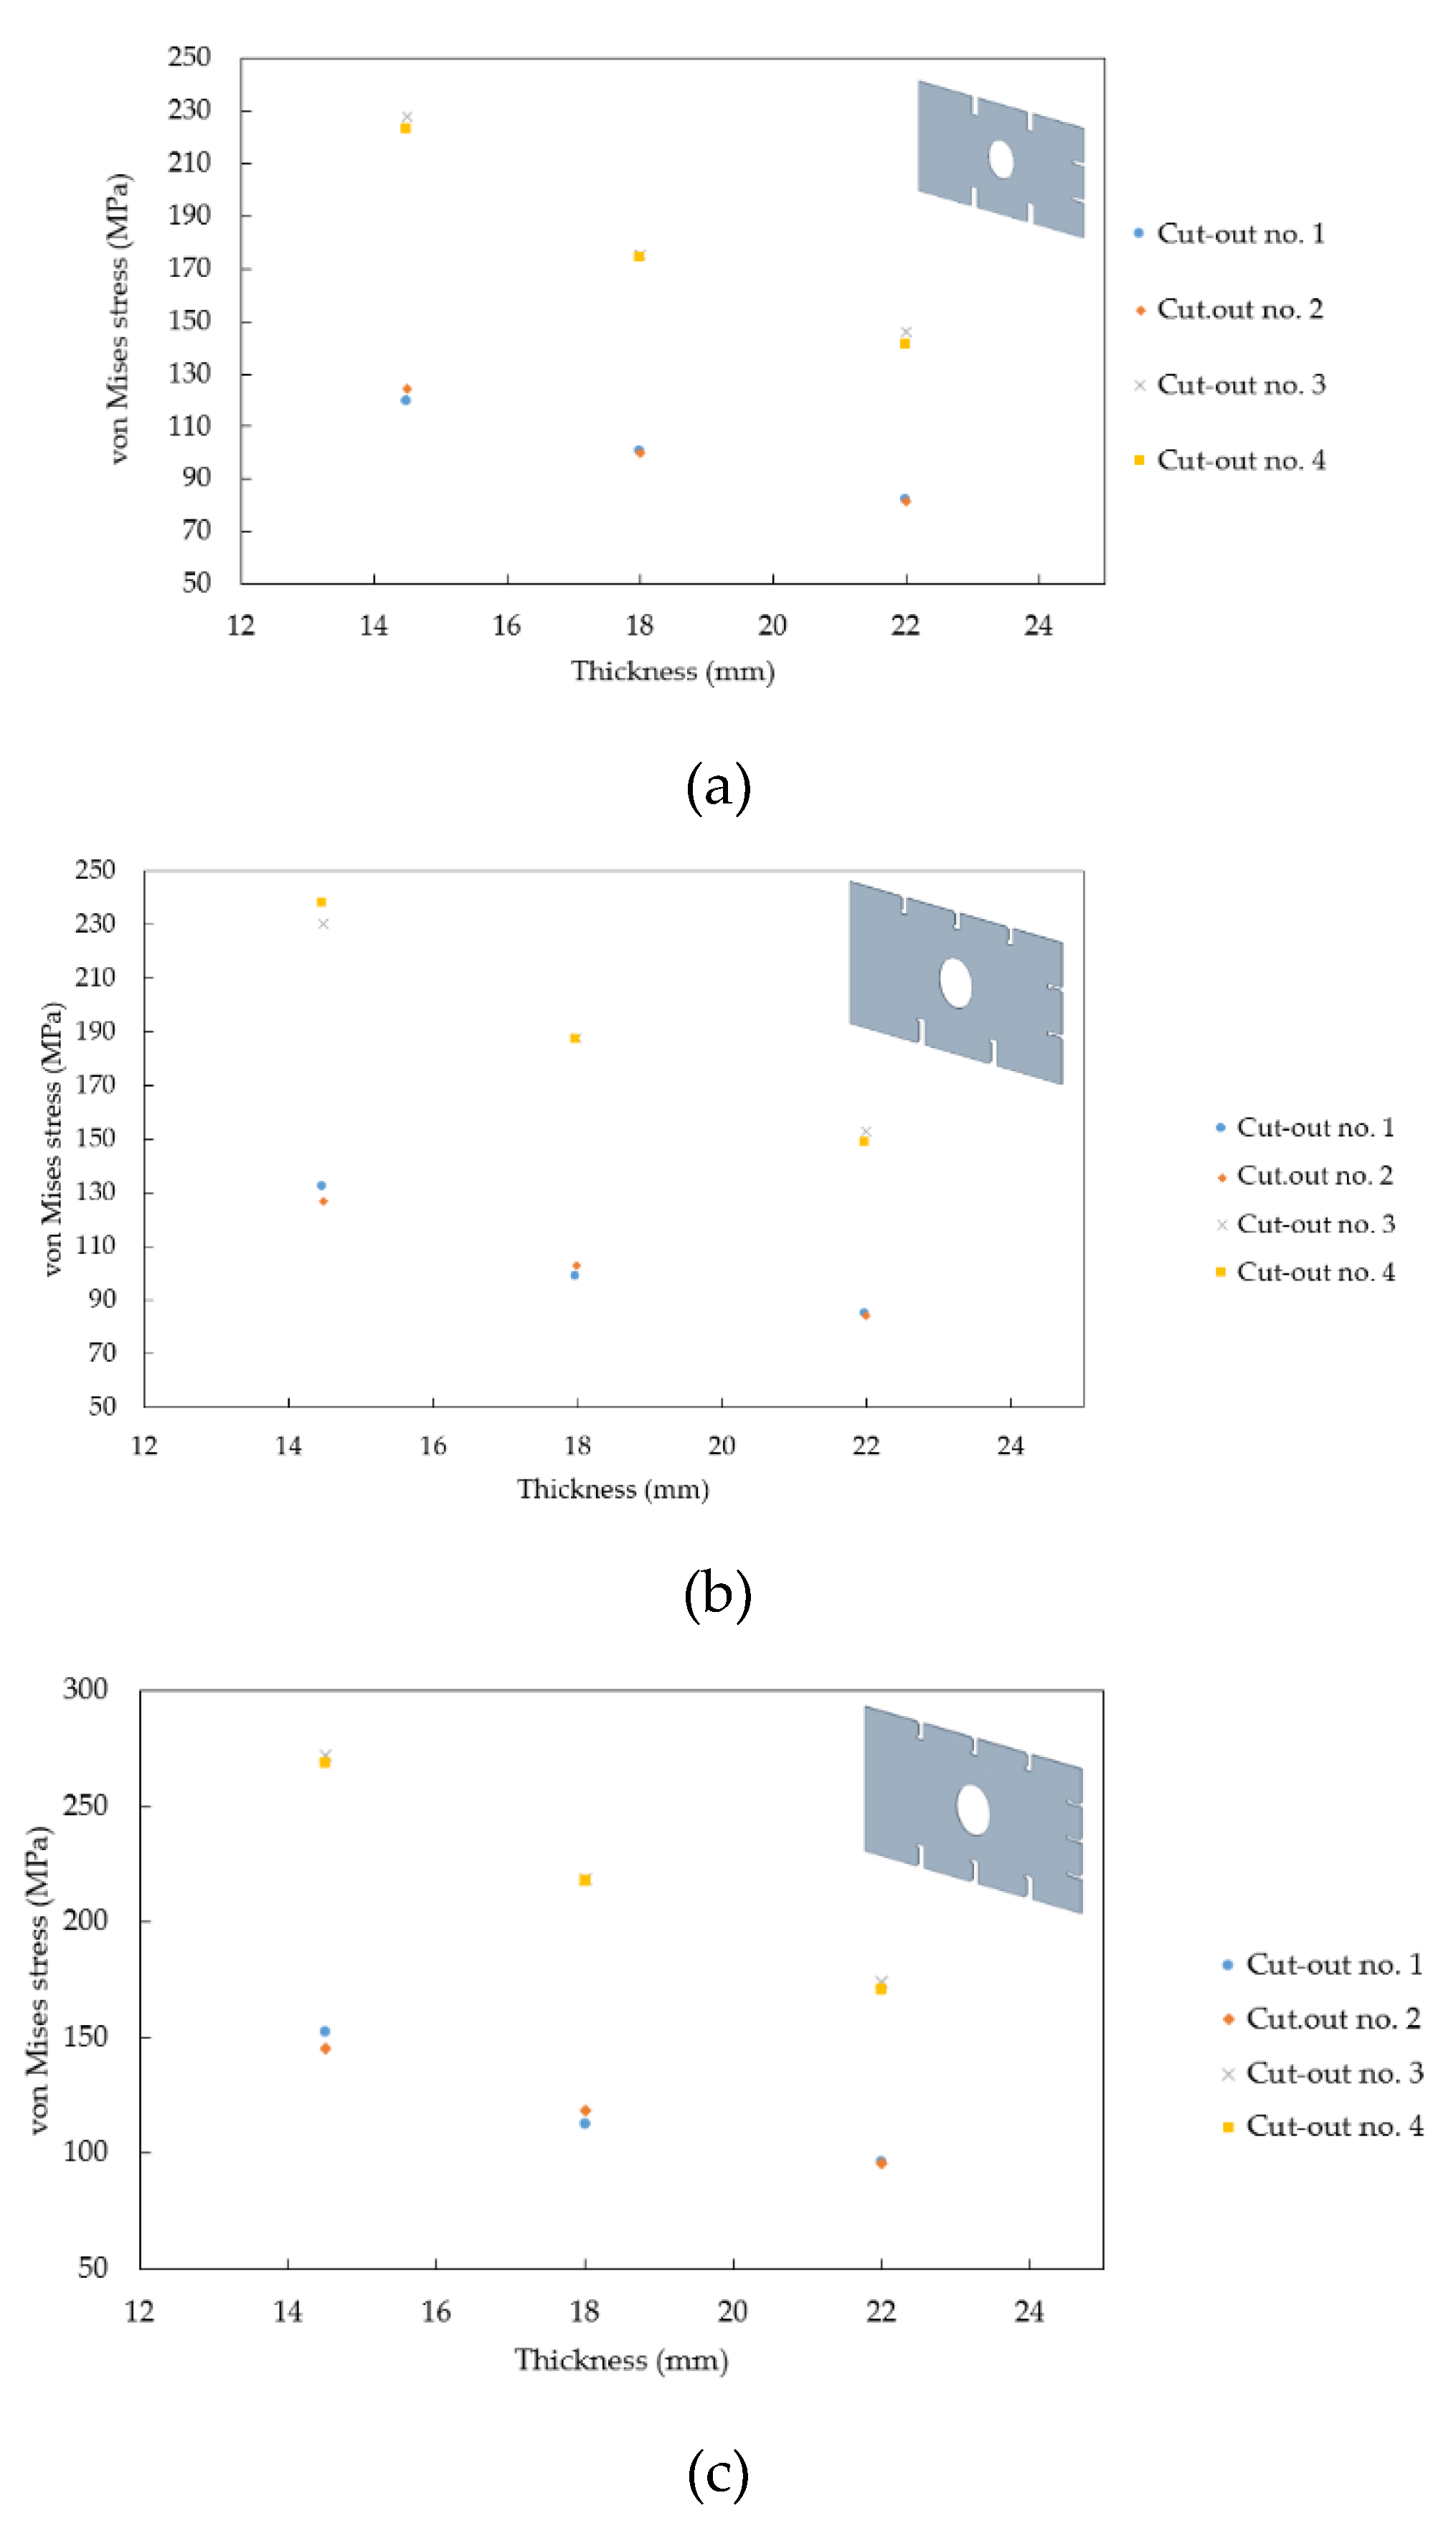
One of the determining factors that allow modifying the structural behavior is the thickness of the double bottom floor. In accordance with this approach, the study of the influence of the thickness is established for each of the six different models, by means of three modifications of the thickness for each cut-out geometry established above. Figure 15 shows the particular case of models 1, 3 and 6, for different cut-outs (1, 2, 3 and 4) and different thickness values (14.5, 18 and 22) in millimeters, under axial load as loading scenario.
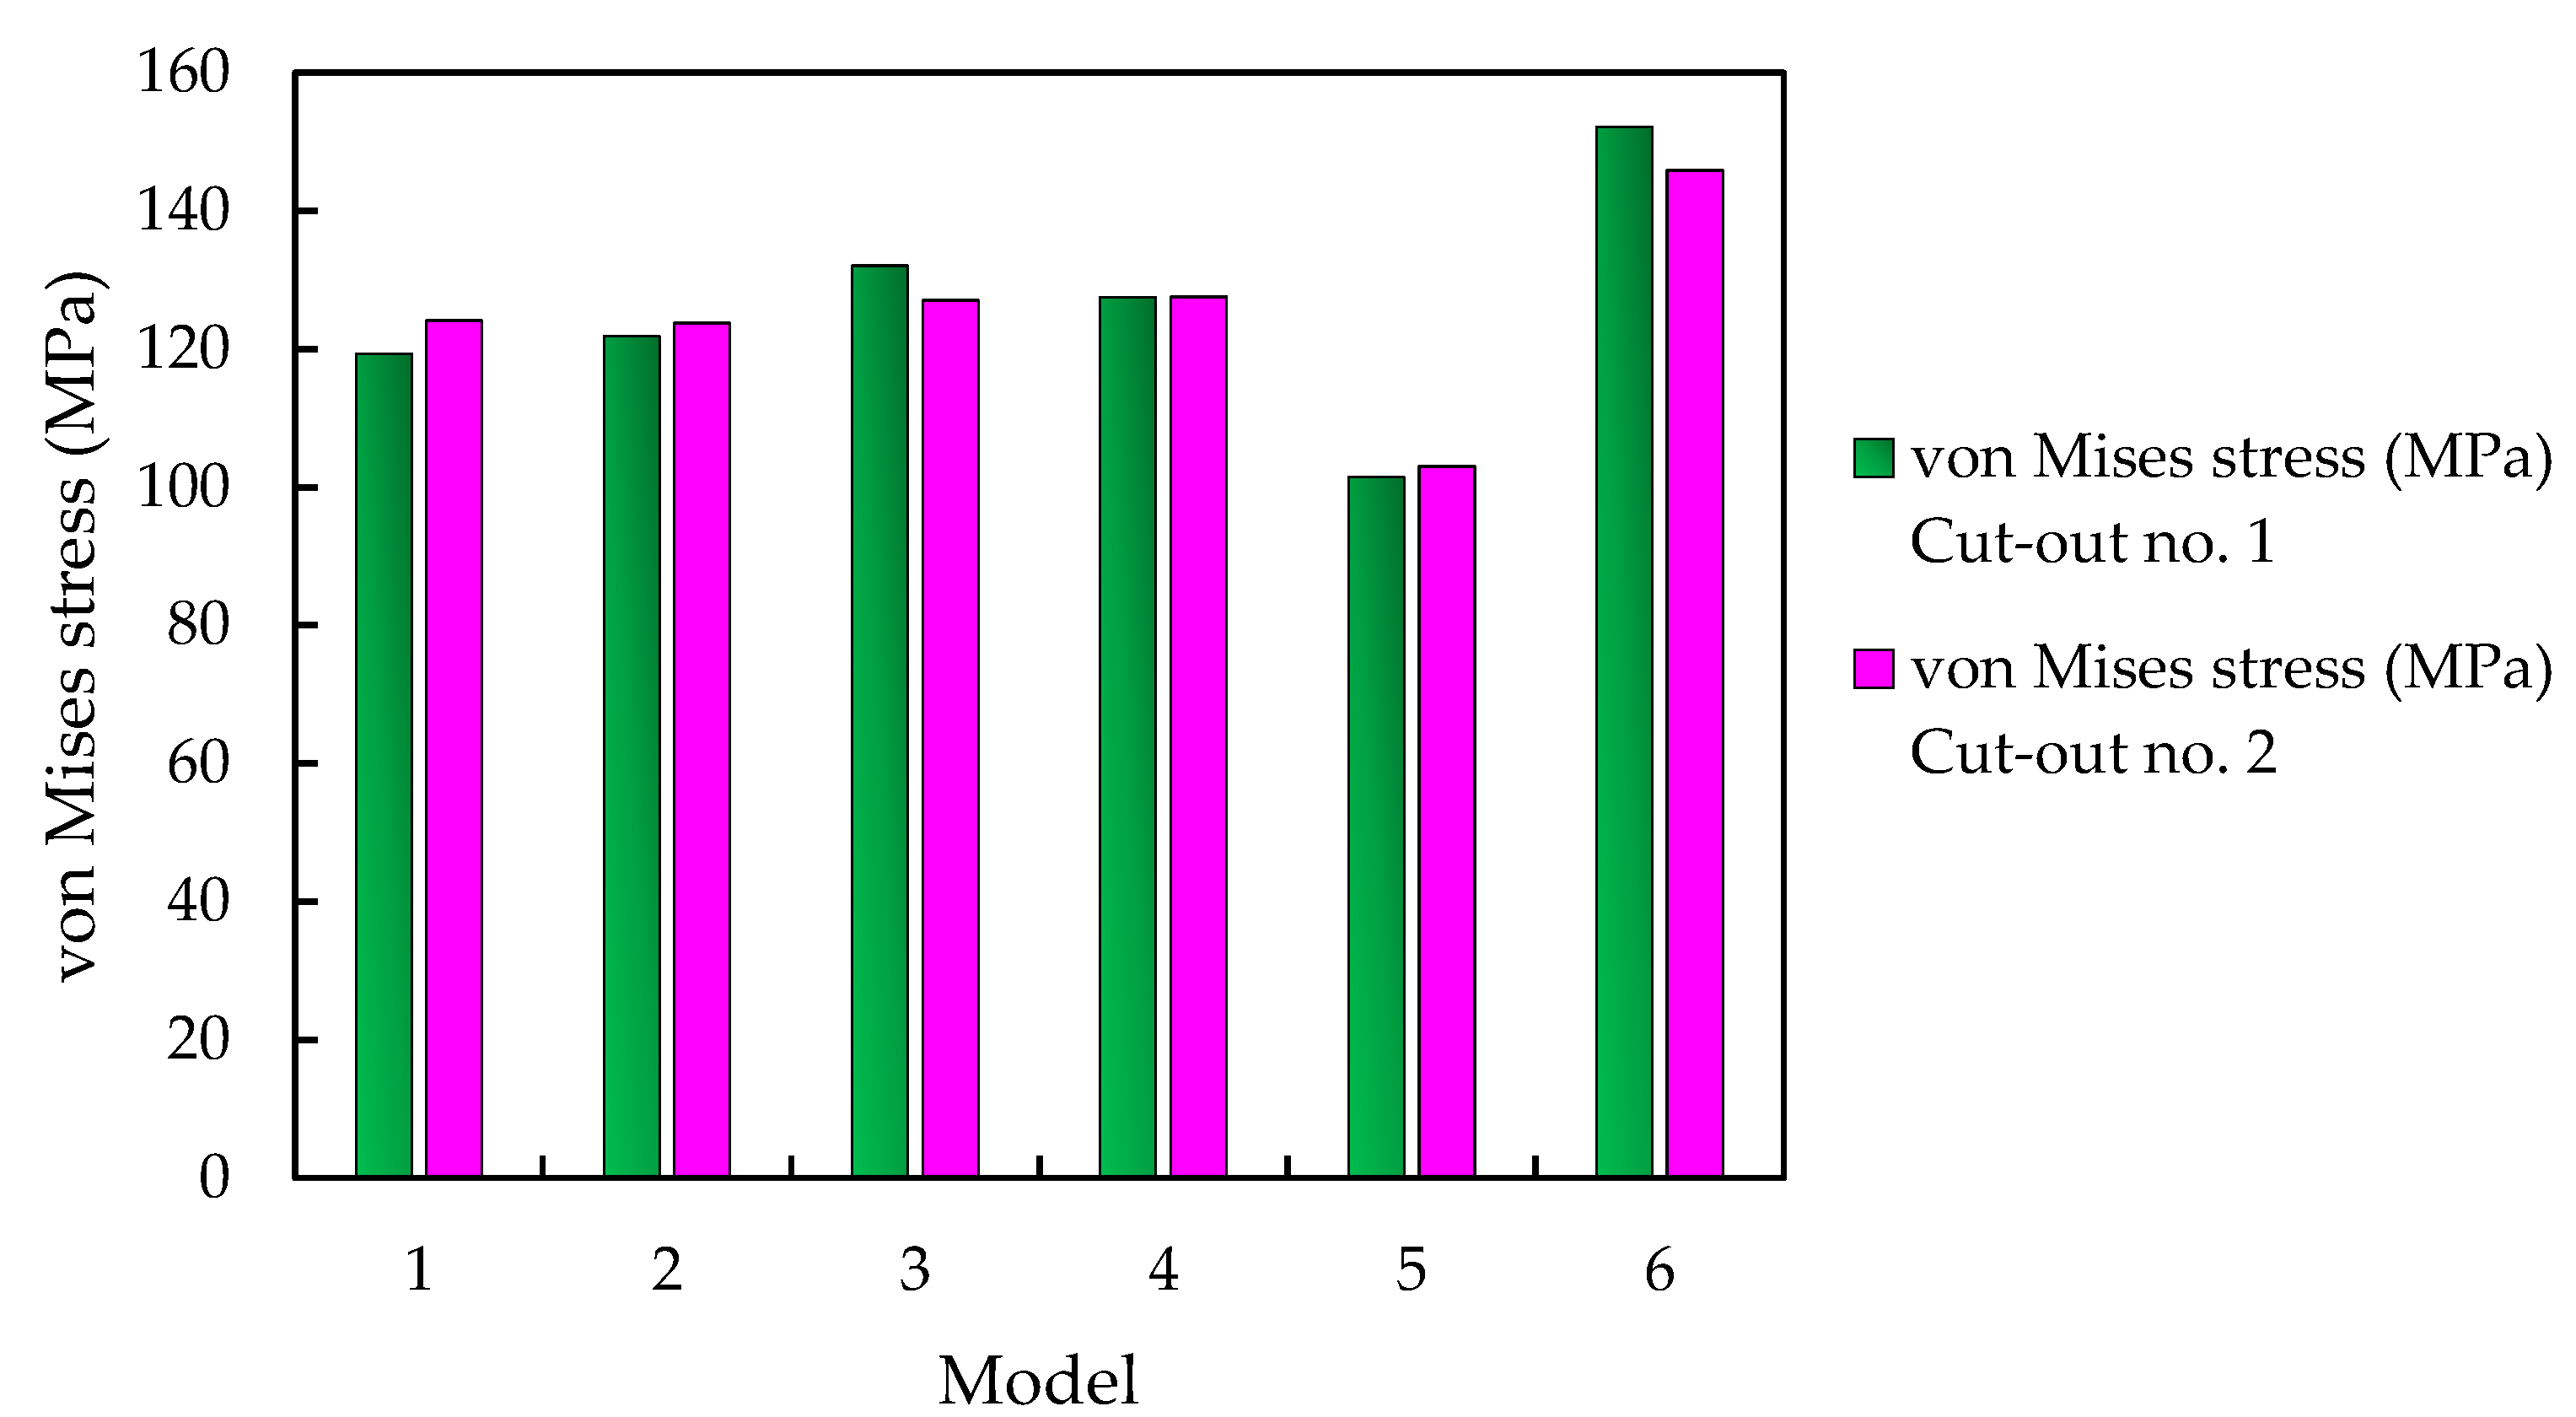
A common behavior is observed, whatever the model tested; the trend of the maximum von Mises stress decreases linearly with sequential increases in the thickness of the double bottom floor, a behavior that can be extrapolated to determine the necessary increase in thickness to decrease the desired amount of von Mises stress. Regardless of the model, a clear improvement, translated into a lower stress level, is observed for cut-outs no. 1 and no. 2 with respect to cut-outs no. 3 and 4. The geometries relative to the double bottom floor with the cut-outs no. 1 and no. 2 present the biggest difference for the smallest thickness (14.5mm) and of value 3.86, 3.76 and 4.16%, for the case of model no. 1, model no. 3 and model no. 6, respectively. Figure 16 shows the stress distribution as a function of the models at equal thickness (14.5mm) and an axial loading scenario, for the case of cut-out no. 1 and cut-out no. 2.

5.3. Fatigue Behavior

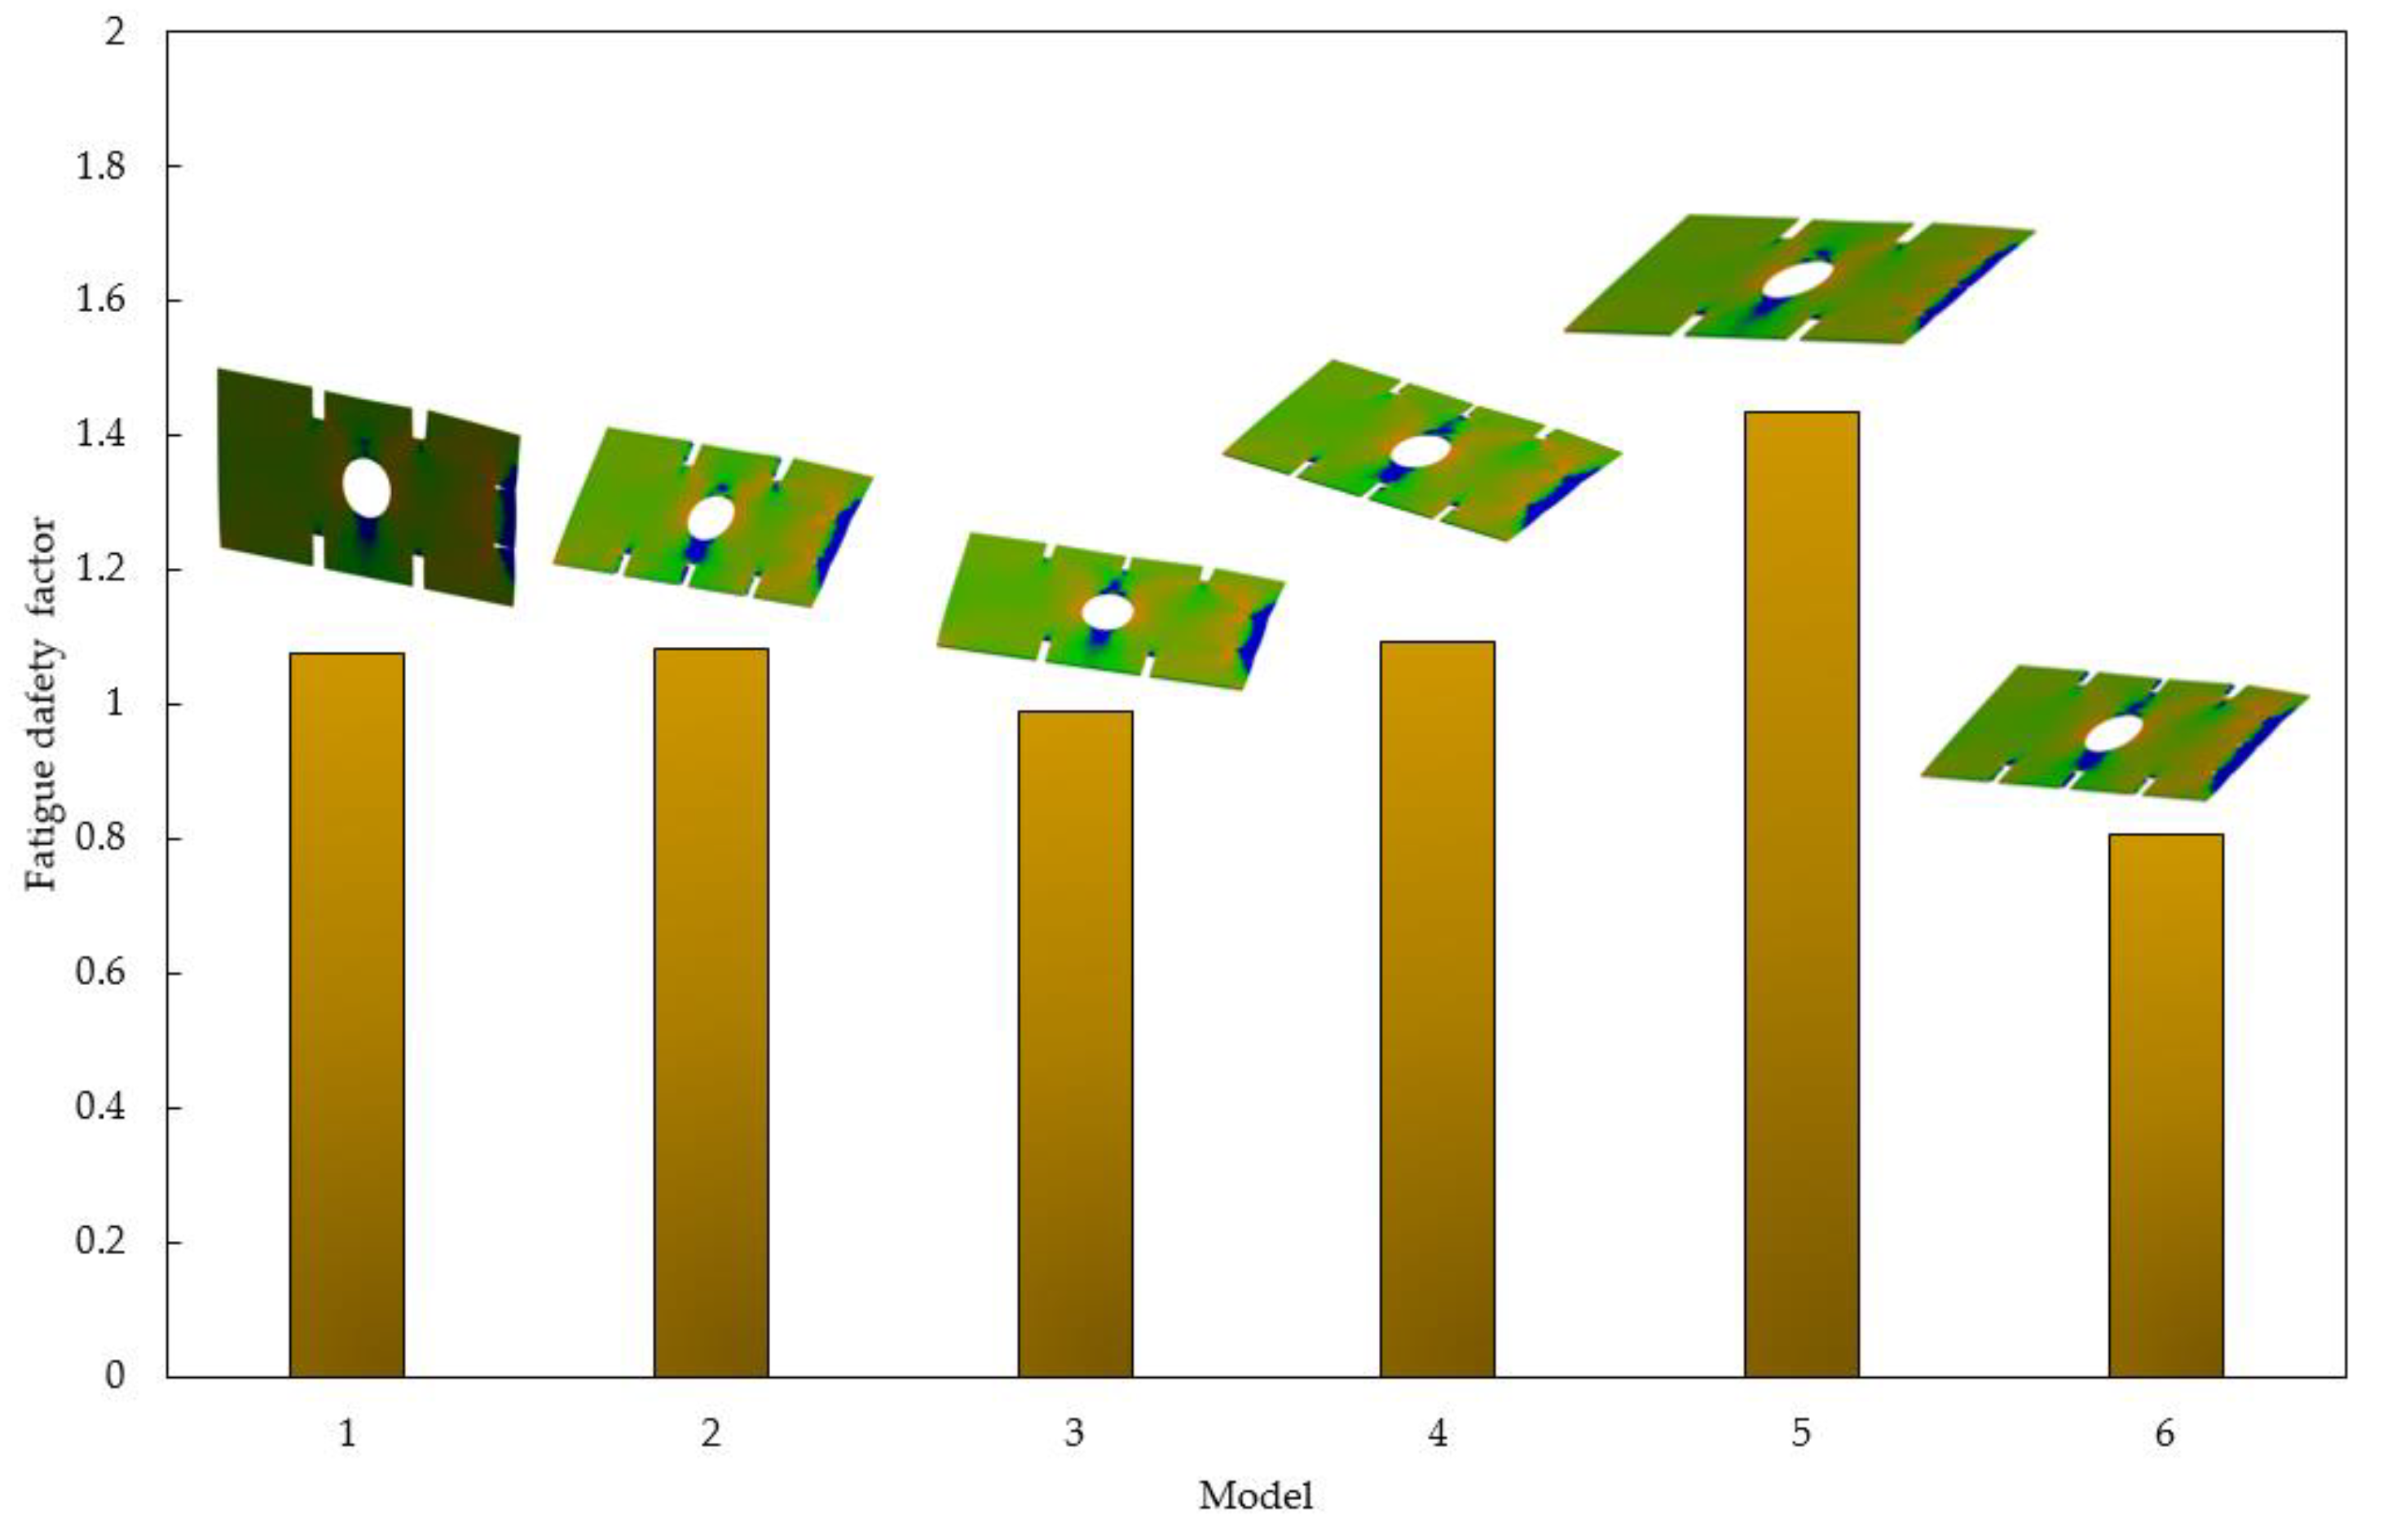
The fatigue safety factor (FSF) is represented as a contour plot showing the safety factor relative to fatigue failure over a specified design life (typically 1·10⁹ cycles) [33,34]. Figure 17 shows the minimum FSF for different combinations between models and cut-out geometries.
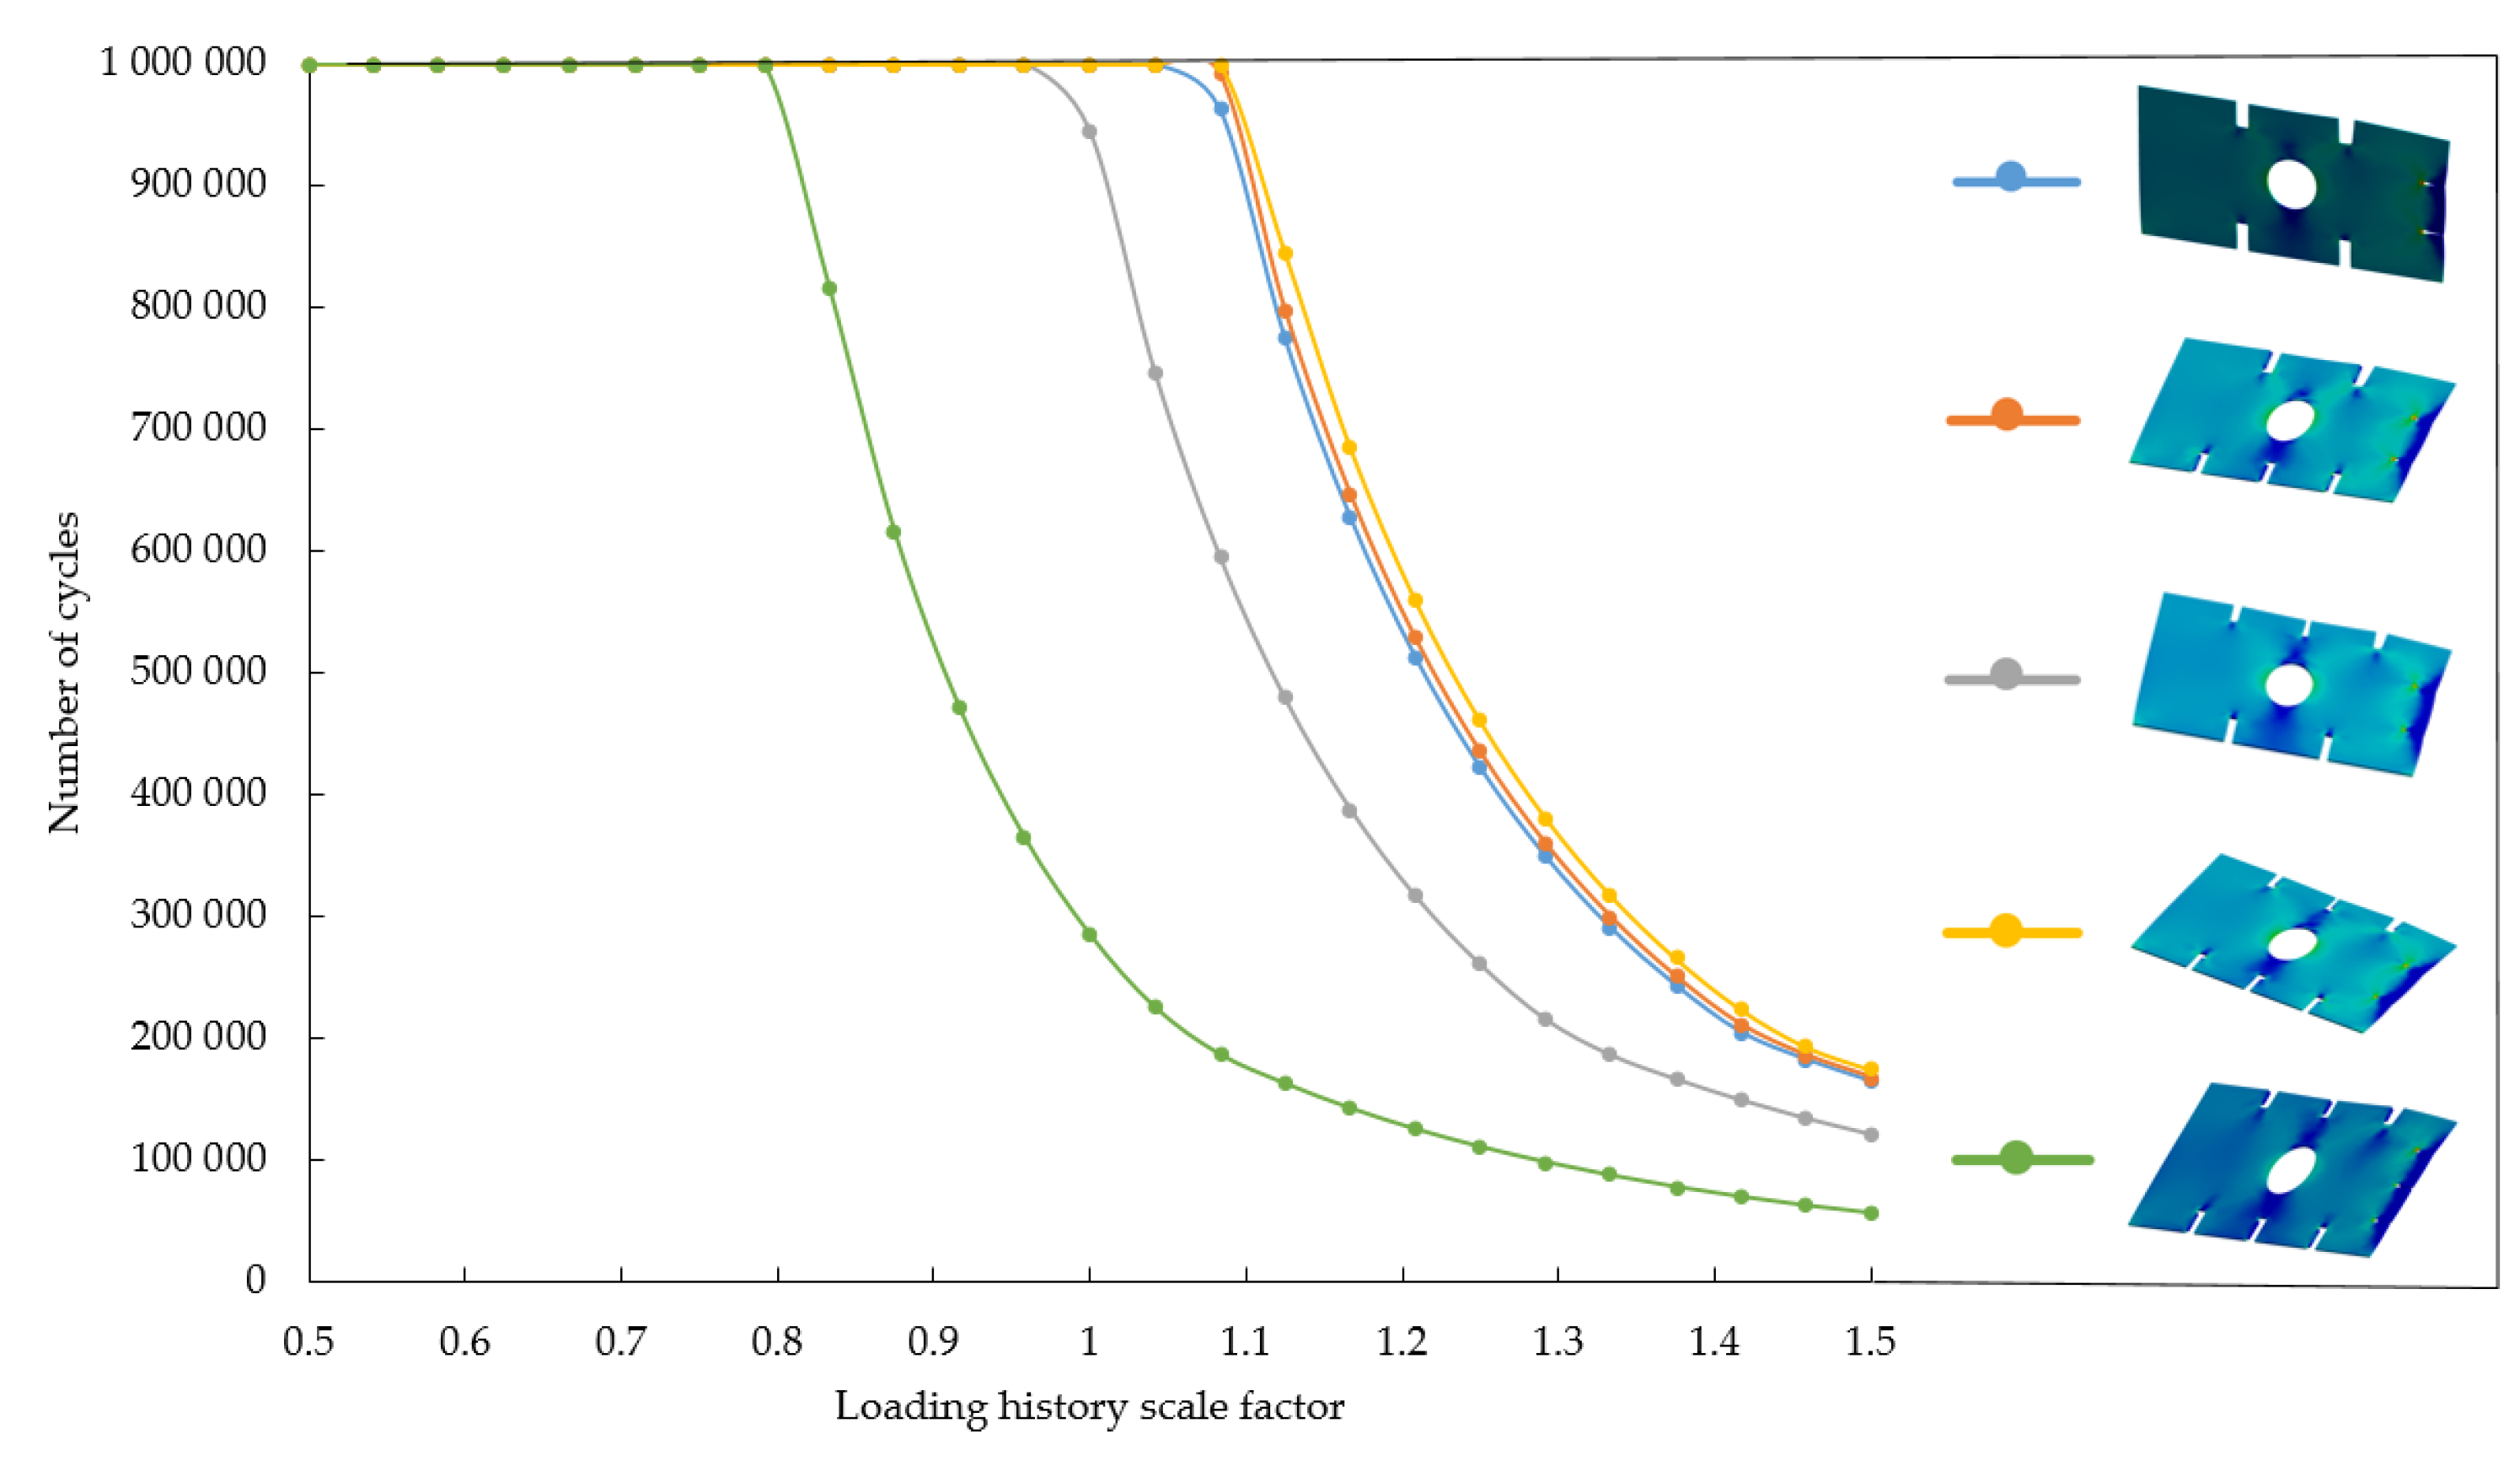
According to obtained results, it is observed that a configuration of two longitudinal stiffeners in bottom and inner bottom with three longitudinal stiffeners on the side girder presents the most high minimum fatigue safety factor, which results in less influence of the side girder cut-outs compared to the bottom and inner bottom cut-outs. A comparison between the different models indicates that cut out no.1 presents the most beneficial results in 50% of the analyses situations. Particularly in the first of the arrangements with two longitudinales in bottom, doble bottom and side, the greatest increase in the fatigue safety factor is 17.6% which occurs between the use of cut out nº1 and nº3. To account for potential scenarios that create load scenarios different from the original, fatigue sensitivity curves are calculated to aid in structural design. These curves are represented as graphs formed by connecting points that show the remaining life for various stress range values, expressed through a loading history scale factor. The effect of the scale factor on the increase or decrease of the stress range, relative to the initial load, is examined in relation to fatigue life. For each combination of model and cut-out geometry, 25 evenly spaced stress range variations are considered, starting from the initial value (with a scale factor of one) and extending to ±50% of this value, resulting in a total of 150 numerical tests (Figure 18)
The collective points of the fatigue sensitivity curves suggest a potential extrapolation of the results by fitting the point cloud from each tested sub-model to a shared hyperbolic curve. Sensitivity, in terms of changes in fatigue life, generally shows an inverse relationship with the applied scale factor, regardless of the cut-out geometry and model of double bottom floor selected. Fatigue life experiences a significant decline as the scale factor increases.
Biaxiality indication (BI) is defined as the ratio of the smaller principal stress to the larger principal stress, excluding the principal stress closest to zero from consideration [35]. A BI value of 0 indicates uniaxial stress, –1 represents pure shear and 1 corresponds to a purely biaxial stress state. Figure 19. shows the distribution of BI for different cases.
It is observed that regardless of the model and cut-out selected, the predominant state in the double bottom floor is the uniaxial state, followed by a pure shear state located in the upper part of the central opening and in the cut-outs near the side girder, which also present a pure shear state. The pure biaxial state presents a stable behavior in the different models with a marked tendency to remain in the lower part of the central opening which is located in the vicinity of the high zone of the central cut-out in models no. 2, no. 4 and no. 6.

6. Conclusions

This research has advanced the understanding of how geometric discontinuities—such as central openings and cut-outs—affect the structural integrity of perforated plates in the double-bottom floor of Panamax-class container ships. By conducting detailed numerical and experimental analyses, we have achieved a clearer picture of the stress distribution and fatigue behavior of these plates under various load scenarios, addressing the key problem of balancing weight reduction with maintaining structural strength. Our findings offer significant implications for both the design and maintenance of ship structures.
The results highlight the critical role that geometric discontinuities play in weakening the structural strength of the plates, emphasizing the importance of careful design to mitigate stress concentration areas. In particular, it was found that the presence of side cut-outs has a more detrimental effect on stress distribution compared to central openings, a finding that holds under both axial and transverse loading conditions. This emphasizes the need for caution when incorporating these features, as they introduce vulnerabilities that may compromise the structural performance. Furthermore, our fatigue analysis underscores the importance of stiffening configurations, showing that certain stiffening arrangements, especially those with longitudinal stiffeners in the bottom and inner bottom, can significantly enhance the fatigue life of the structure.
One of the most important outcomes of this study is the identification of stress trends in relation to plate thickness. We observed a consistent reduction in von Mises stress with increased plate thickness across all models and cut-out configurations. This insight provides a clear design strategy for improving the structural resilience of ship floors by adjusting thickness to mitigate stress and prolong fatigue life. Additionally, the study confirms that cut-out geometries no. 1 and no. 2 offer better performance under load, providing a viable alternative to less effective cut-out shapes. The practical implications of these findings are substantial, offering shipbuilders new avenues for optimizing hull designs without compromising safety or performance.
Future research should focus on extending these analyses to more complex loading scenarios, including wave-induced stresses and multi-axial load conditions. Additionally, more detailed studies on fatigue under varying operational conditions could provide further insight into the long-term durability of these design alternatives. Finally, further exploration into the application of topology optimization techniques could lead to even more efficient structural designs that balance weight reduction with enhanced performance. This continued research will be crucial for advancing shipbuilding practices, ensuring safer and more efficient ships in the future. Overall, this study contributes valuable knowledge to the field of naval engineering, offering both immediate practical benefits for ship design and a foundation for future innovations in the structural design of container ships.

Author Contributions

Conceptualization, A.S-C., M.F-M. and M.A.H-S.; methodology, A.S-C. M.F-M.; software, A.S-C; validation, M.A.H-S.; formal analysis, A.S-C., M.F-M. and M.A.H-S.; investigation, A.S-C. and M.F-M.; resources, A.S-C; data curation, M.F-M. and M.A.H-S.; writing—original draft preparation, A.S-C, M.F-M. and M.A.H-S.; writing—review and editing, M.F-M. and M.A.H-S.; visualization, A.S-C.; supervision, M.F-M. and M.A.H-S.; project administration, A.S-C., M.F-M. and M.A.H-S.;

Funding

This research received no external funding.

Institutional Review Board Statement

Not applicable

Informed Consent Statement

Not applicable.

Data Availability Statement

All data are presented in the paper.

Acknowledgments

The authors would like to acknowledge the support received by the Universidad Politécnica de Madrid.

Conflicts of Interest

The authors declare no conflict of interest.

References

  1. Kawasaki, Y.; Okada, T.; Kobayakawa, H.; Amaya, I.; Miyashita, T.; Nagashima, T.; Neki, I. A study of forced vibration of double bottom structure due to whipping on an ultra large container ship. ASME 36th International Conference on Ocean, Offshore and Arctic Engineering. 2017. OMAE2017-61149. [CrossRef]
  2. Bureau Veritas Rules. Structural rules for container ships. NR625 DT R04 E. 2021.
  3. Wang, G.; Sun, H.; Peng, H.; Uemori, R. Buckling and ultimate strength of plates with openings. Ships and Offshore Struct. 2009. 4:1, 43-53. [CrossRef]
  4. Liu, B.; Gao, L.; Ao, L.; Wu, W. Experimental and numerical analysis of ultimate compressive strength of stiffened panel with openings. Ocean Eng. 2021, 220, 108453. [Google Scholar] [CrossRef]
  5. Saad-Eldeen, S.; Garbatov, Y.; Guedes Soares, C. Structural capacity of plates and stiffened panels of different materials with opening. Ocean Eng. 2018, 167, 45–54. [Google Scholar] [CrossRef]
  6. Yanli, G.; Xiaoqing, S.; Xiao, L.; Xingyou, Y.; Zhifan, X.; Bin, X.; Jianyi, S. Elastic buckling of thin plate with circular holes in bending. E3S Web of Conferences. 2019, 136, 04043. [Google Scholar] [CrossRef]
  7. Saad-Eldeen, S.; Garbatov, Y.; Guedes Soares, C. Experimental compressive strength analyses of high tensile steel thin-walled stiffened panels with a large lightening opening. Thin-Walled Struct. 2017. 113, 61-68. [CrossRef]
  8. Kim, J.; Jeom, J.; Park, J.; Seo, H.; Ahn, H.; Lee, J. Effect of reinforcement on buckling and ultimate strength of perforated plates. Int. J. Mech. Sci. 2015, 92, 194–205. [Google Scholar] [CrossRef]
  9. Chichi, D.; Garbatov, Y. Retrofitting analysis of tanker ship hull structure subjected to corrosion. Brodogradnja. 2019, 70(2), 87–109. [Google Scholar] [CrossRef]
  10. Cui, J.; Wang, S. An experimental and numerical investigation on ultimate strength of stiffened plates with opening and perforation corrosion. Ocean Eng. 2020, 205, 107282. [Google Scholar] [CrossRef]
  11. Saad-Eldeen, S.; Garbatov, Y.; Guedes Soares, C. Experimental strength assessment of thin steel plates with a central elongated circular opening. J. Constructional Steel Research. 2016, 118, 135–144. [Google Scholar] [CrossRef]
  12. Saad-Eldeen, S.; Garbatov, Y.; Guedes Soares, C. Experimental investigation on the residual strength of thin steel plates with a central elliptic opening and locked cracks. Ocean Eng. 2016, 115, 19–29. [Google Scholar] [CrossRef]
  13. Yu, C.; Lee, J. Ultimate strength of simply supported plate with opening under uniaxial compression. Int J Nav Archit Ocean Eng. 2012, 4, 423–436. [Google Scholar] [CrossRef]
  14. Kumar, M.; Alagusundaramoorthy, P.; Sundaravadiveu, R. Ultimate strength of stiffened plates with a square opening under axial and out-of-plane loads. Eng. Struct. 2009, 31, 2568–2579. [Google Scholar] [CrossRef]
  15. Li, X.; Zhu, Z.; Li, Y.; Chen, Q.; Zhang, X. Mechanical behaviour of composite ship structures with open-hole. IOP Conf. Series: Materials Science and Engineering. 2020. 892, 012033. [CrossRef]
  16. Doan, V.; Liu, B.; Garbatov, Y.; Wu, W.; Guedes Soares, C. Strength assessment of aluminium and steel stiffened panels with openings on longitudinal girders. Ocean Eng. 2020, 200, 107047. [Google Scholar] [CrossRef]
  17. Xu, M.; Yanagihara, D.; Fujikubo, M.; Guedes Soares, C. Influence of boundary conditions on the collapse behaviour of stiffened panels under combined loads. Marine Struct. 2013, 34, 205–225. [Google Scholar] [CrossRef]
  18. Kim, U.; Choe, I.; Paik, J.; Buckling and ultimate strength of perforated plate panels under axial compression: Experimental and numerical investigations with design formulations. Ships and Offshore Struc. 2009. 4:4, 337-361. [CrossRef]
  19. Cui, J.; Wang, D. A study of ultimate strengths of typical longitudinals girders with openings in container ships. Proceedings of the ASME, 37th International Conference on Ocean, Offshore and Arctic Engineering. 2018. OMAE2018-77820. [CrossRef]
  20. Paik, J. K. Ultimate strength of steel plates with a single circular hole under axial compressive loading along short edges. Ships and Offshore Struct. 2007. 2:4, 355-360. [CrossRef]
  21. Silva-Campillo, A.; Suárez-Bermejo, J. C.; Herreros-Sierra, M. A. Design recommendations for container ship side-shell structure under fatigue strength assessment. Ocean Engineering. 2022, 245, 110655. [Google Scholar] [CrossRef]
  22. Andersen, M. R. Fatigue Crack Initiation and Growth in Ship Structures. Thesis. Department of Naval Architecture and Offshore Engineering. Technical University of Denmark. 1998. [Google Scholar]
  23. Silva-Campillo, A; Suárez-Bermejo, J. C.; Herreros-Sierra, M. A.; de Vicente, M. Design methodology in transverse webs of the torsional box structure in an ultra large container ship. International Journal of Naval Architecture and Ocean Engineering. 2021. 13, 772-785. [CrossRef]
  24. Timoshenko, S. P.; Gere, J. M.; Prager, W. Theory of Elastic Stability. McGraw-Hill Book Co. Second Edition. 1962.
  25. Paik, J. K.; Thayamballi, A. K. Ship-Shaped Offshore Installations. Design, Building, and Operation. Cambridge University Press, United States of America. 2007.
  26. Paik, J. K. Ultimate limit state analysis and design of plated structures. Wiley. 2018. [Google Scholar]
  27. https://www.facebook.com/photo/?fbid=1753760247970599&set=a.1737574946255796.1073741889.780066968673270 (accessed on 05/10/2024).
  28. Xu, M. C.; Song, Z. J.; Pan, J. Study on the similarity methods for the assessment of ultimate strength of stiffened panels under axial load based on tests and numerical simulations. Ocean Engineering. 2021, 219, 108294. [Google Scholar] [CrossRef]
  29. Branco, R.; Antunes, F.; Martins Ferreira, J.; Silva, J. Determination of Paris law constants with a reverse engineering technique. Engineering Failure Analysis. 2009, 16, 631–638. [Google Scholar] [CrossRef]
  30. Patil, H.; Jeyakarthikeyan, P. V. Mesh convergence study and estimation of discretization error of hub in clutch disc with integration of ANSYS. IOP Conference Series, Material Science Engineering. 2018. 402, 012065. [CrossRef]
  31. Blaber, J.; Adair, B.; Antoniou, A. Ncorr: Open-Source 2D Digital Image Correlation Matlab Software. Experimental Mechanic. 2015, 55, 1105–1122. [Google Scholar] [CrossRef]
  32. Kumar, S.; Aravind, H.; Hossiney, N. Digital image correlation (DIC) for measuring strain in brick masonry specimen using Ncorr open source 2D MATLAB program. Results in Engineering. 2019, 4, 1000061. [Google Scholar] [CrossRef]
  33. Vidhya, M. S.; Christina, K. V. M. Fatigue Life, Fatigue Damage, Fatigue Factor of Safety, Fatigue Sensitivity, Biaxiality Indication and Equivalent Stress of a Radial Connecting Rod. International Research Journal of Engineering and Technology. 2020, 7(9), 1499–1502. [Google Scholar]
  34. Wasmi, H. R.; Abdullah, M. Q.; Jassim, O. A. Testing and Estimation Fatigue Life of a Flange Connection used in Power Plant by ANSYS. International Journal of Current Engineering and Technology. 2006, 6(4), 1302–1306. [Google Scholar]
  35. Bhanage, A.; Padmanabhan, K. Design for fatigue and simulation of glass fibre/epoxy composite automobile leaf spring. ARPN Journal of Engineering and Applied Sciences. 2014, 9(3), 196. [Google Scholar]
Figure 1. (a) B-178 vessel [27], (b) general arrangement.
Preprints 138024 g001
Figure 2. (a) Container ship torsion model, (b) midship section, (c) double bottom floor (dimensions in mm).
Preprints 138024 g002
Figure 3. Geometries for cut-outs (measurements in mm) (a) Cut-out no. 1, (b) cut-out no. 2, (c) cut-out no.3, (d) cut-out no. 4.
Preprints 138024 g003
Figure 4. Getting test specimens ready. (a) Cutting and modeling of the double bottom floor geometry, (b) surface preparation of the double bottom floor, (c) cutting and modeling of the cut-out no. 1 and no. 2 geometry, (d) surface preparation of the cut-out no. 2.
Preprints 138024 g004
Figure 5. Loading scenarios and boundary conditions. (a) Initial configuration, (b) configuration adapted to the testing machine with isolate model of the cut-out.
Preprints 138024 g005
Figure 6. Experimental setup. (a) Double bottom floor, (b) cut-out.
Preprints 138024 g006
Figure 7. (a) Mesh pattern for the solution number four, (b) convergence process.
Preprints 138024 g007
Figure 8. Difference between numerical and experimental regime. (a) Finite element analysis, (b) experimental test.
Preprints 138024 g008
Figure 9. Comparison in maximum displacement (in mm). (a) DIC technique, (b) FEM technique.
Preprints 138024 g009
Figure 10. Von Mises stress distribution (Pa) with 14.5mm thickness and axial load. (a) Solid plate, (b) plate with central opening, (c) plate with cut-outs, (d) plate with central opening and cut-outs.
Preprints 138024 g010
Figure 11. Difference, in terms of maximum von Mises stress (MPa), between geometrical discontinuities.
Preprints 138024 g011
Figure 12. Von Mises stress distribution (Pa) with 14.5mm thickness and transverse load. (a) Solid plate, (b) plate with central opening, (c) plate with cut-outs, (d) plate with central opening and cut-outs.
Preprints 138024 g012
Figure 13. Difference of maximum von Mises stress between axial load and transverse load at different geometrical discontinuities.
Preprints 138024 g013
Figure 14. Distribution of Von Mises stress (MPa). (a) Cut-out no. 1, (b) cut-out no. 2.
Preprints 138024 g014
Figure 15. Von Mises maximum stress at modification of thickness. (a) Model no. 1, (b) model no. 3, (c) model no. 6.
Preprints 138024 g015
Figure 16. Von Mises maximum stress of different models at equal thickness (14.5mm) and an axial loading scenario.
Preprints 138024 g016
Figure 17. Minimun fatigue safety factor FSF. (a) Model no. 1 with cut-out no. 1, (b) model no. 2 with cut-out no. 2, (c) model no. 3 with cut-out no. 3, (d) model no. 4 with cut-out no. 4, (e) model no. 5 with cut-out no. 1, (f) model no. 6 with cut-out no. 2.
Preprints 138024 g017
Figure 18. Fatigue sensitivity curves. Blue line – Model no. 1 with cut-out no. 1, orange line – model no. 2 with cut-out no. 2, grey line – model no. 3 with cut-out no. 3, yellow line – model no. 4 with cut-out no. 4 and green line – model no. 6 with cut-out no. 2.
Preprints 138024 g018
Figure 19. Biaxility indication. (a) Model no. 1 with cut-out no. 1, (b) model no. 2 with cut-out no. 2, (c) model no. 3 with cut-out no. 3, (d) model no. 4 with cut-out no. 4, (e) model no. 5 with cut-out no. 1, (f) model no. 6 with cut-out no. 2.
Preprints 138024 g019aPreprints 138024 g019b
Table 1. Main particulars.
Variables Unit Value
Length between perpendiculars (Lbp) m 169.7
Breadth (B) m 32.24
Depth to main deck (D) m 18.7
Draught (T) m 12.15
Maximum service speed (V) kn 22.5
Table 2. Structural combinations for different cut-out geometries, scantlings and number of longitudinal stiffeners and transverse plate thicknesses (dimensions in mm). (a) Model no. 1, (b) model no. 2, (c) model no. 3, (d) model no. 4, (e) model no. 5 and (f) model no. 6.
Preprints 138024 i001 Bottom:  HP. 280⨯11
Inner bottom: HP. 260⨯11
Side girder: FB. 150⨯12
Preprints 138024 i002 Bottom:  HP. 240⨯10
Inner bottom: HP. 260⨯11
Side girder:  FB. 150⨯12
Preprints 138024 i003 Bottom:  HP. 280⨯11
Inner bottom: HP. 180⨯11
Side girder:  FB. 150⨯12
(a) (b) (c)
Preprints 138024 i004 Bottom:  HP. 240⨯10
Inner bottom: HP. 180⨯11
Side girder:  FB. 150⨯12
Preprints 138024 i005 Bottom:   HP. 280⨯11
Inner bottom:  HP. 260⨯11
Side girder:  FB. 100⨯12
Preprints 138024 i006 Bottom:   HP. 240⨯10
Inner bottom:  HP. 180⨯10
Side girder:  FB. 150⨯9
(d) (e) (f)
Table 3. Iteration procedure for mesh convergence.
σ V M (MPa) Change (%) Elements Nodes
1 80.84 - 362 2939
2 104.98 25.9 10981 19757
3 113.16 7.5 29344 48369
4 118.83 4.8 74110 116065
Disclaimer/Publisher’s Note: The statements, opinions and data contained in all publications are solely those of the individual author(s) and contributor(s) and not of MDPI and/or the editor(s). MDPI and/or the editor(s) disclaim responsibility for any injury to people or property resulting from any ideas, methods, instructions or products referred to in the content.
Copyright: This open access article is published under a Creative Commons CC BY 4.0 license, which permit the free download, distribution, and reuse, provided that the author and preprint are cited in any reuse.
Prerpints.org logo

Preprints.org is a free preprint server supported by MDPI in Basel, Switzerland.

Subscribe

© 2024 MDPI (Basel, Switzerland) unless otherwise stated