
Submitted:
30 October 2024
Posted:
31 October 2024
You are already at the latest version
Abstract
The analysis of suspended particle size distribution in produced water for hydraulic fracturing and for water injection operations is vital for the effective development of tight reservoir formations like the Middle Bakken. Several reservoir engineering studies and industry guidelines recommend that particle sizes fall between 1/7th and 1/3rd of the square root of the formation permeability measured in millidarcies, to avoid pore throat clogging and subsequent formation damage. In the tight Bakken formation, with an average permeability of 0.04 millidarcies, the ideal particle size range for total suspended solids should fall within the 0.03 to 0.06 microns range. This study evaluates whether produced water used for hydraulic fracturing and enhanced oil recovery in the Middle Bakken meets this recommendation, as there are no established regulations in North Dakota addressing this issue. Using laser diffraction, particle size distribution was measured in treated and untreated produced water samples. The results show that current treatment methods do not reduce particle sizes to the recommended range. Treated water had particle diameters ranging from 8.5 to 40 μm, while untreated water had diameters ranging from 8.2 to 10 μm. None of the samples met the particle size requirements for safe use in hydraulic fracturing and water injection. This study highlights the inadequacy of current water recycling practices and offers empirical evidence that may guide future regulations on produced water reuse hydraulic fracturing and water injection in the Bakken.
Keywords:
suspended particles
; laser diffraction
; particle size distribution
1. Introduction
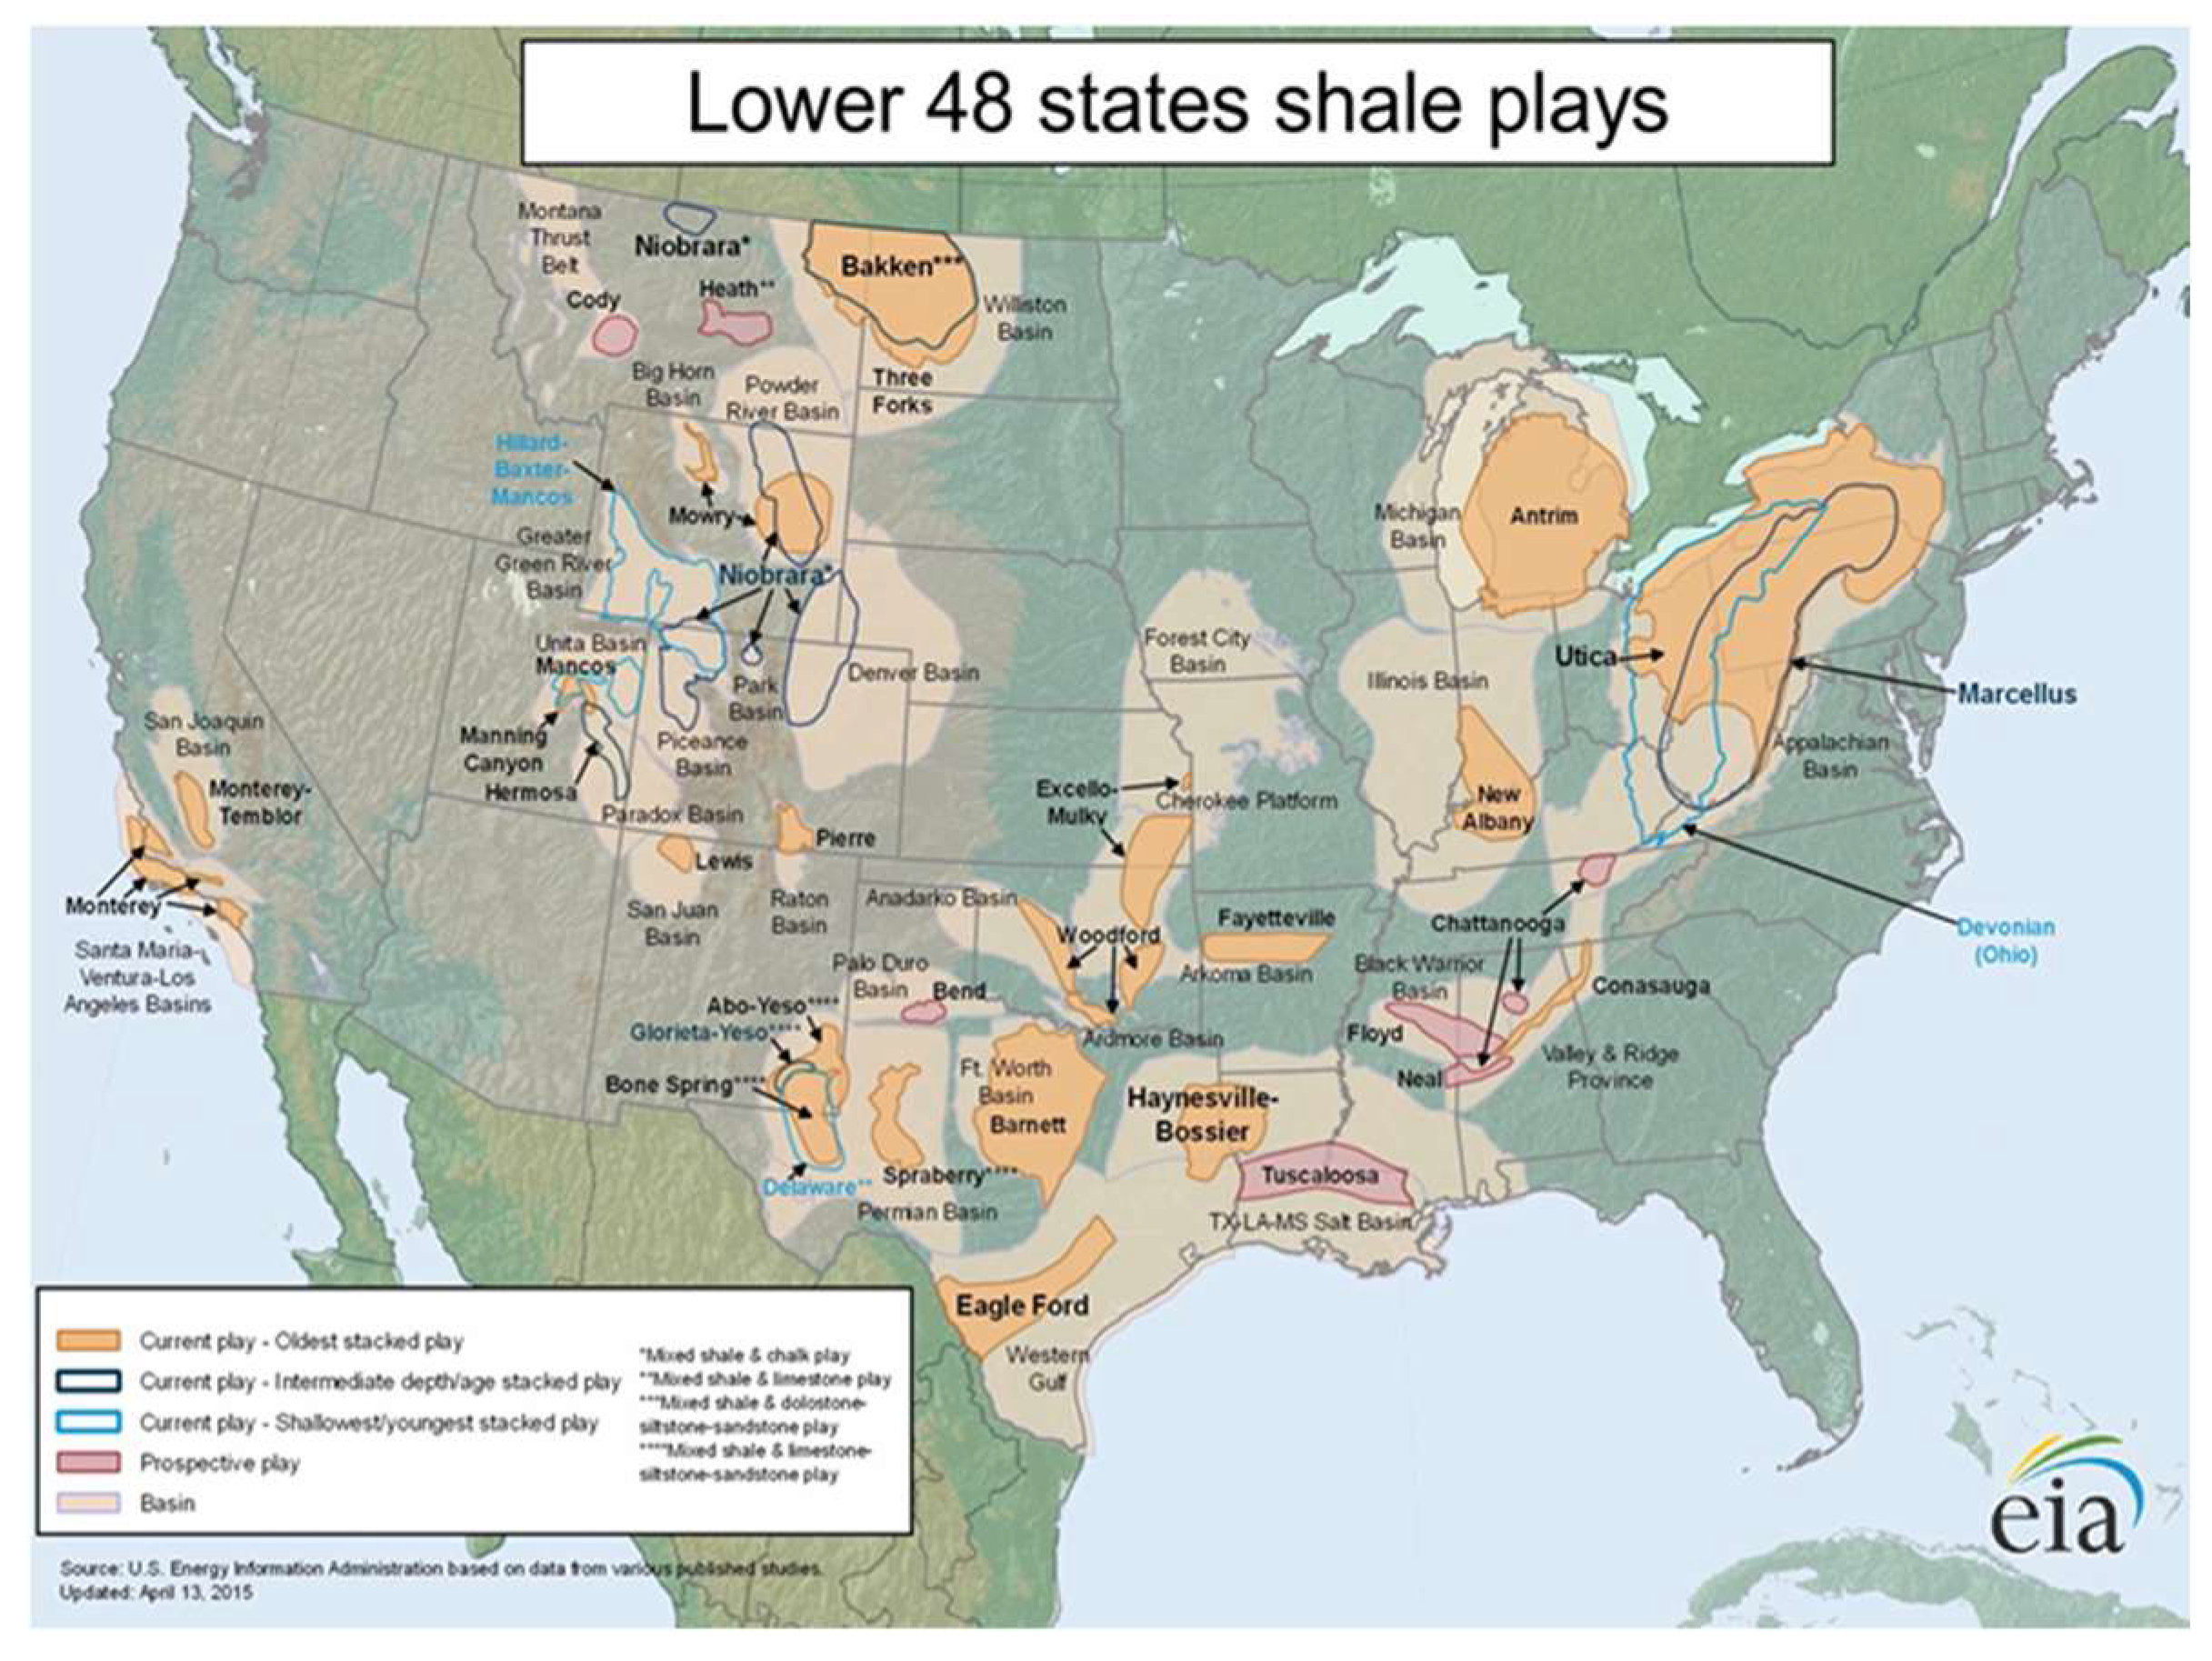
Hydraulic fracturing, commonly known as fracking, has transformed the oil and gas industry, allowing the extraction of hydrocarbons from formations that were previously considered uneconomical. The Bakken Formation, one of the largest shale oil reserves located in the Williston Basin in North America, has been a major beneficiary of this technological advancement.
Figure 1.
Map of U.S. shale gas and shale oil plays (EIA, 2015c).
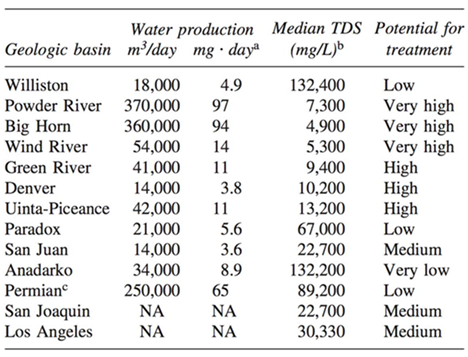
However, hydraulic fracturing and water injection operations require vast quantities of water, raising concerns about the sustainability and environmental impact of water use. The table below provides an idea of the vast quantities of water generated during hydraulic fracturing.

Table 1.
Produced water generation for major geologic basins (Benko, 2008).
As mentioned above, a key byproduct of fracking is produced water, which contains various contaminants, including total suspended solids (TSS). TSS refers to particles larger than 2 microns, comprising both organic and inorganic matter (APHA, 1992). High TSS levels pose significant challenges for the reuse and disposal of produced water, particularly in hydraulic fracturing and injection operations (Goswami et al., 2023; Samuel et al., 2022). As water treatment becomes increasingly vital to the oil industry, ensuring the quality of treated water is crucial to maintaining safe injectivity and operational efficiency, while minimizing reservoir damage and environmental risks (Olajire, 2020; Dos Santos et al., 2014; Veil et al., 2004; Jiang et al., 2021).
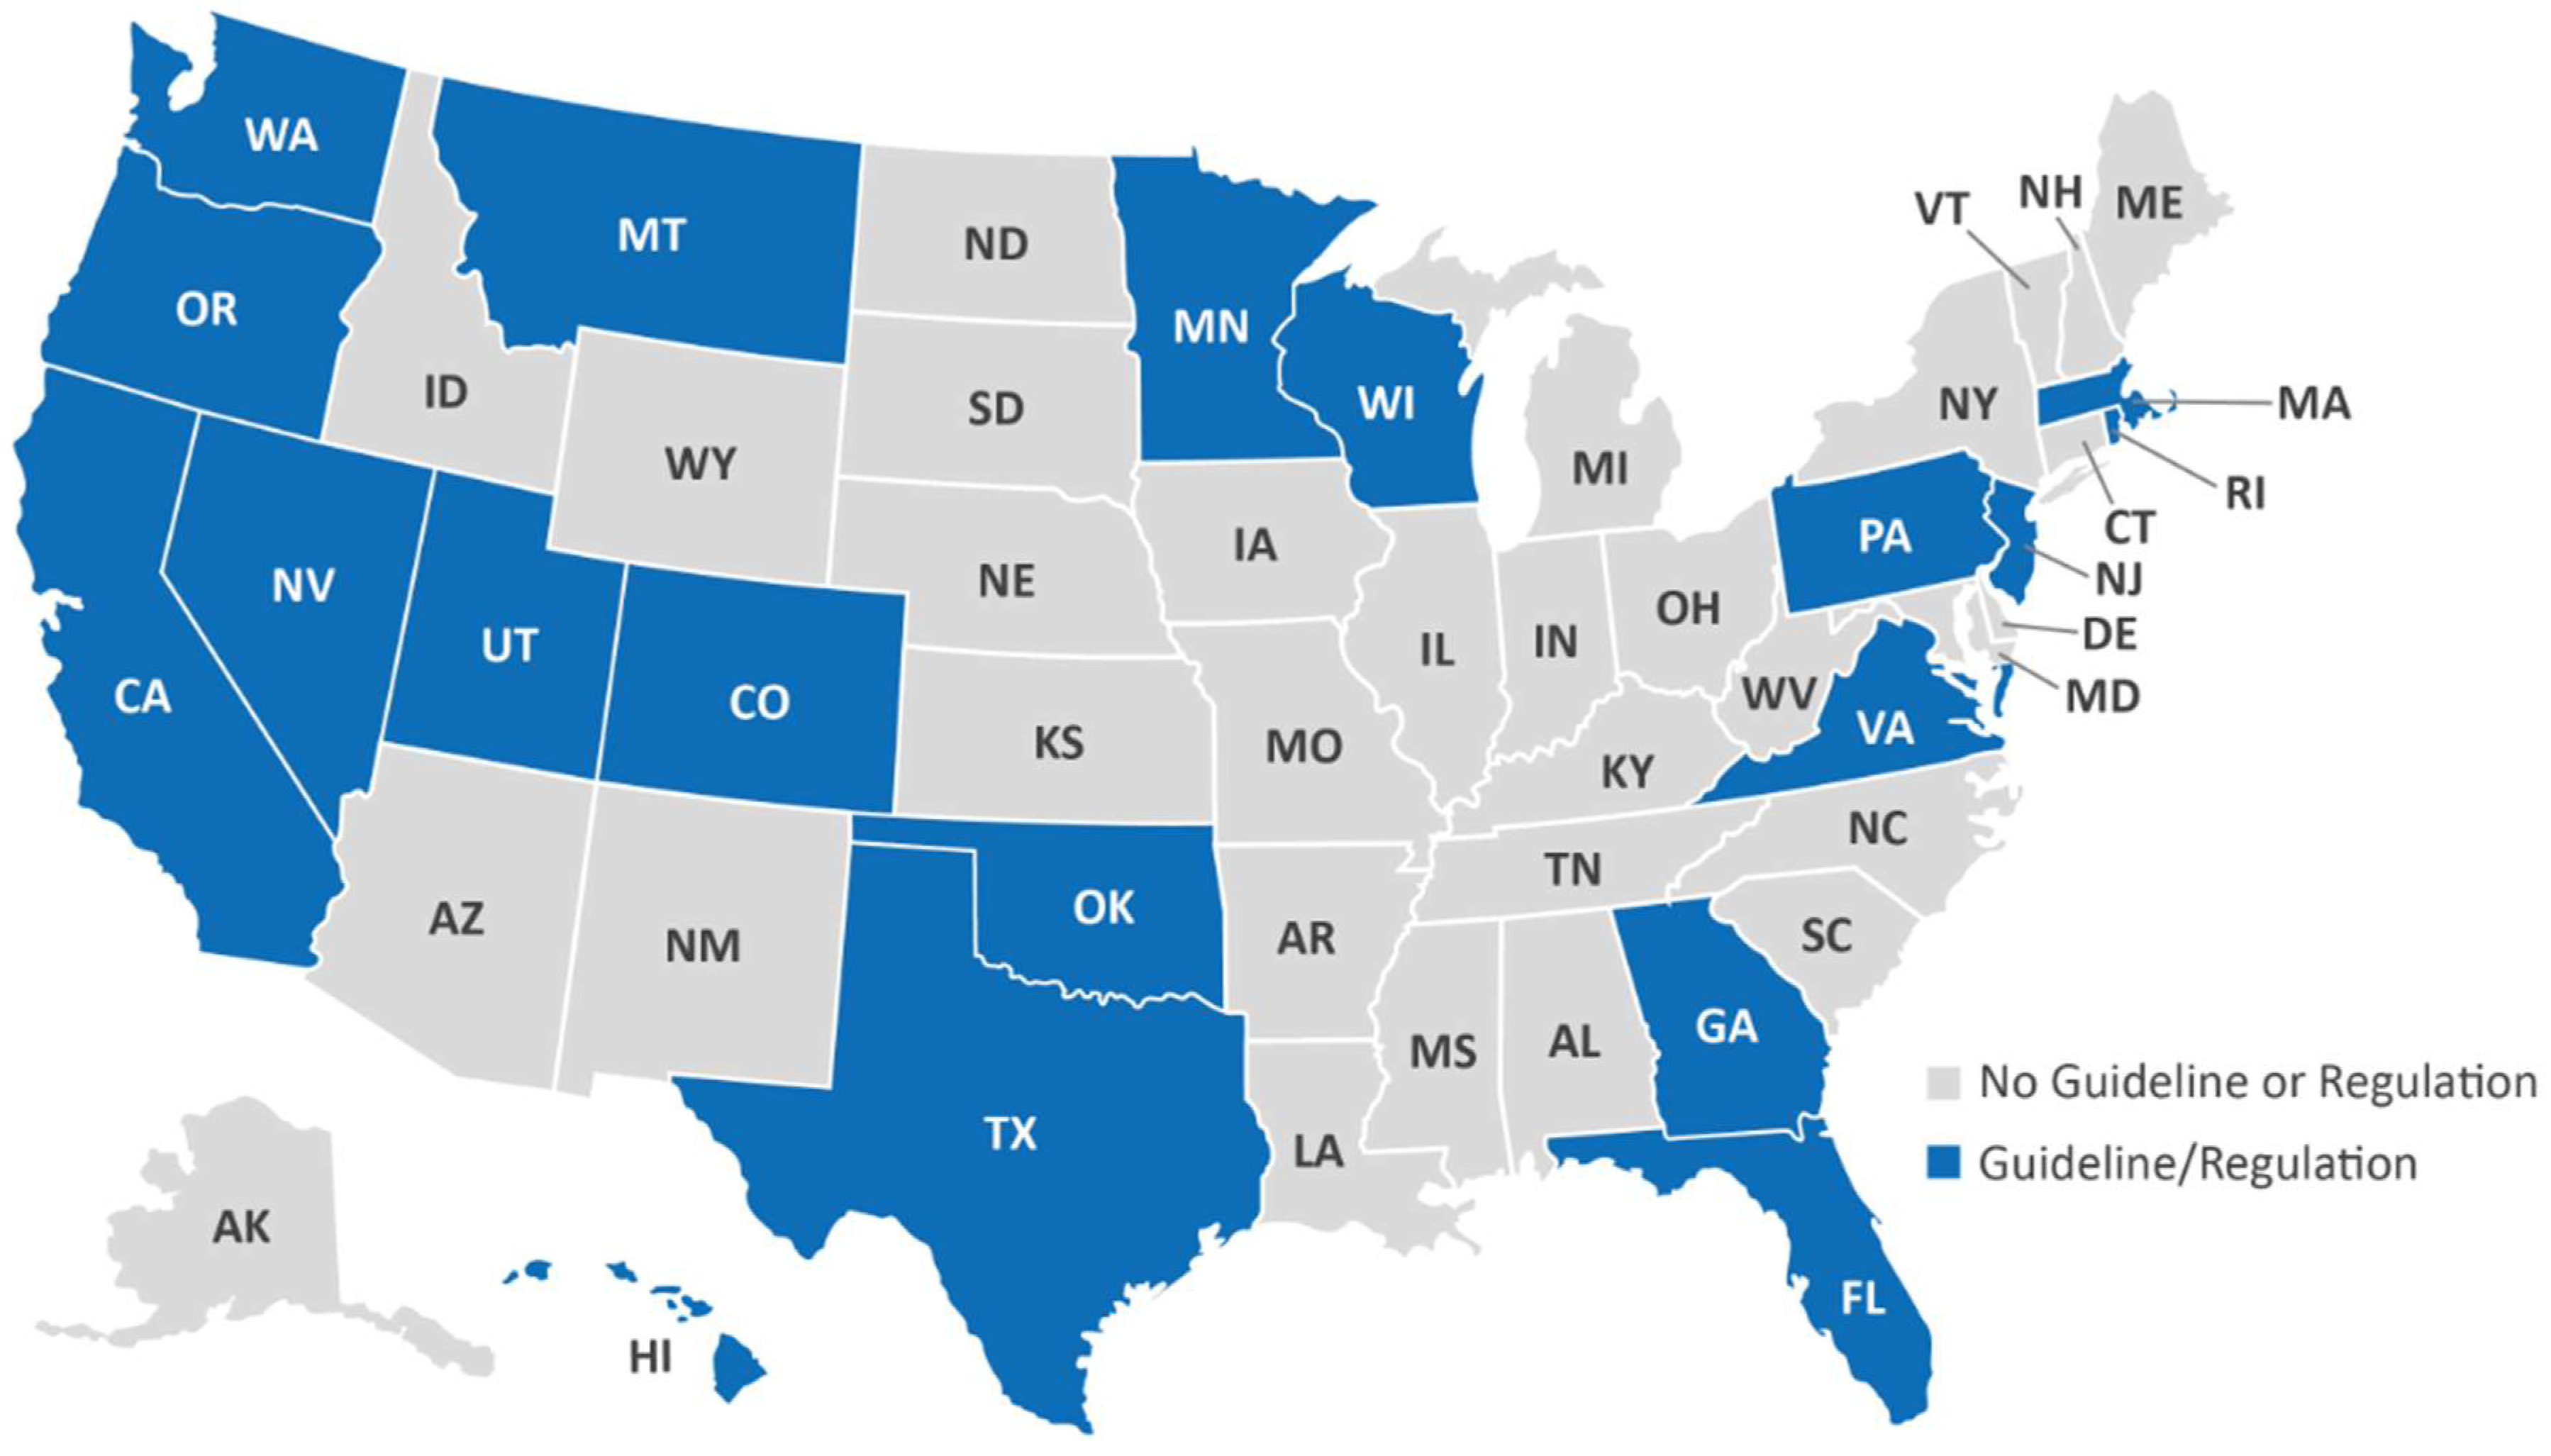
The removal of TSS from produced water is inherently difficult and remains an area of ongoing research (Shubo Deng et al., 2005; Guo et al., 2006). Produced water from the Bakken Formation is particularly challenging due to its high salinity and diverse composition, including significant levels of TSS (Wang et al., 2019). Studies have identified that high levels of micron-sized suspended particles can clog micron-sized pores in reservoir rocks (Hu and Huang, 2017), impair proppant transport during hydraulic fracturing, and cause wear on pumps and pipelines. Despite extensive research on produced water quality in other basins (Benko and Drewes, 2008; Alley et al., 2011; Barbot et al., 2013), there has been limited investigation into the size characteristics of suspended solids in treated and untreated produced water from the Bakken. While some states have elaborated produced water reuse guidelines for industrial application, in North Dakota, none exists. This study also serves as a contribution in anticipation of potential regulations regarding the reuse of produced water in the Bakken.
Figure 2.
States that have or do not have regulations for the reuse of produced water for industrial applications (Source: EPA).
Figure 2.
States that have or do not have regulations for the reuse of produced water for industrial applications (Source: EPA).
There is ongoing debate within the industry about the best strategies for treating produced water, particularly regarding the control of TSS levels. While some studies suggest that TSS levels must be maintained below 2 microns to prevent operational issues like plugging, others argue that treatment requirements should be tailored to specific reservoir characteristics (Patton, 1986). The Bakken Formation offers unique challenges, but also opportunities for improved water management in hydraulic fracturing and water injection, especially considering limited freshwater resources, transportation costs, and environmental considerations (Kurz, 2016).
This study aims to evaluate the effectiveness of produced water treatment techniques in reducing TSS levels in the Bakken Formation, with the goal of determining whether treated or untreated produced water is suitable for hydraulic fracturing and water injection operations. By analyzing the particle size distribution of TSS in various water samples, this research will provide valuable insights into the performance of current water treatment practices and their adequacy for preventing clogging in the Bakken’s reservoir rock matrix and fractures. The findings will contribute to the development of specific standards for reusing produced water in the Bakken and inform future water treatment strategies.
2. Materials and Methods
2.1. Sample Collection
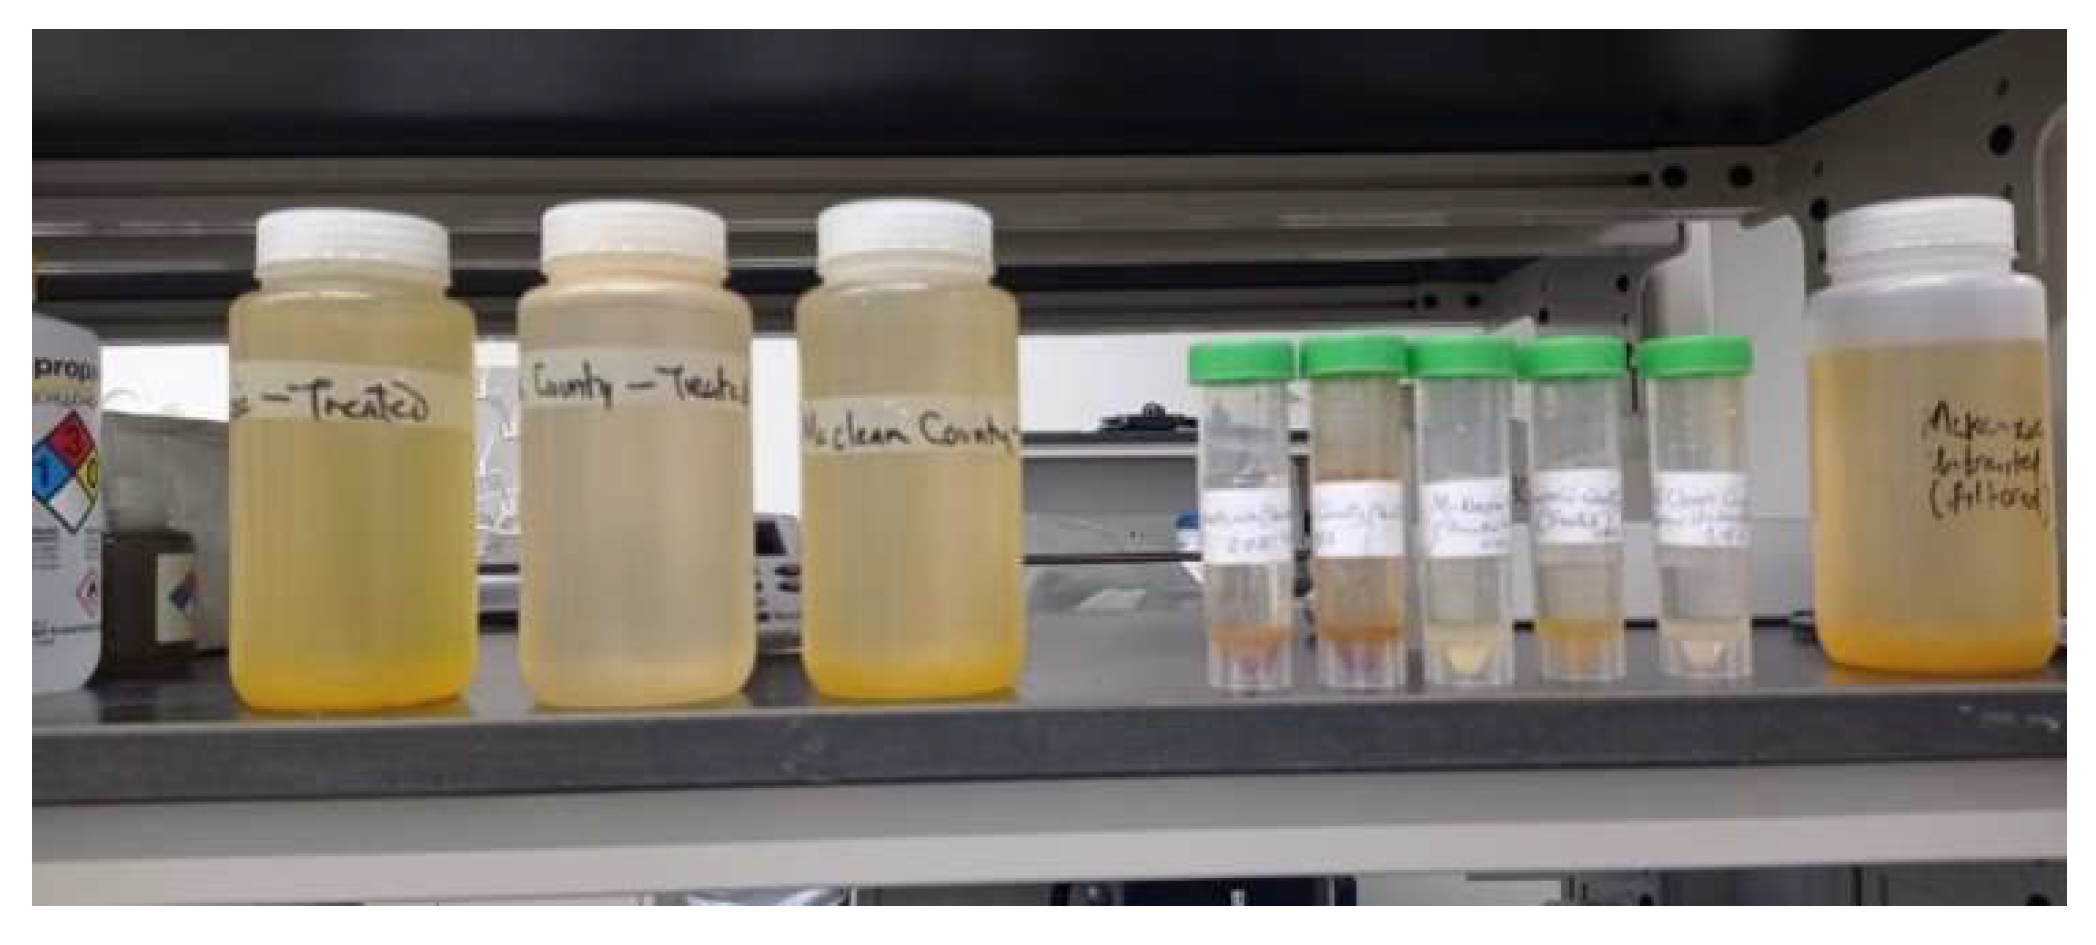
Water samples were collected from various hydraulic fracturing sites across the Bakken Formation of North Dakota. Both treated and untreated produced water used for hydraulic fracturing and water injection were sampled to ensure a comprehensive analysis of the total suspended solids (TSS).Samples were collected in clean, high-density polyethylene containers and transported to the laboratory under controlled conditions to prevent contamination. Treated and untreated produced water samples were obtained from Williams County, McClean County, and McKenzie Counties in the Williston Basin.
Figure 3.
Produced Water samples from Counties in Williston Basin.
2.2. Particle Size Distribution Analysis
The particle size distribution (PSD) of suspended solids in the water samples was determined using laser diffraction, a widely recognized technique for measuring the size of particles in a homogenous suspension. Before analysis, the samples were homogenized to ensure that all the particles were suspended in the produced water samples.
2.2.1. Principle and Tool Description
The governing principle in laser diffraction is that the diffraction pattern produced by a group of particles suspending in a liquid is directly related to the size distribution of the particles. When a laser beam is shone through a sample containing suspended particles, the particles scatter the light in all directions. The diffraction pattern produced by this scattering is a series of bright and dark bands, known as fringes. These resulting fringes are caused by constructive and destructive interference of the scattered light waves. The spacing of the fringes is related to the size of the particles. Larger particles produce wider spacing between the fringes and small particles produce a comparatively narrower spacing between the fringes. Upon analysis of this diffraction pattern, the size distribution of the particles in the sample is determined.
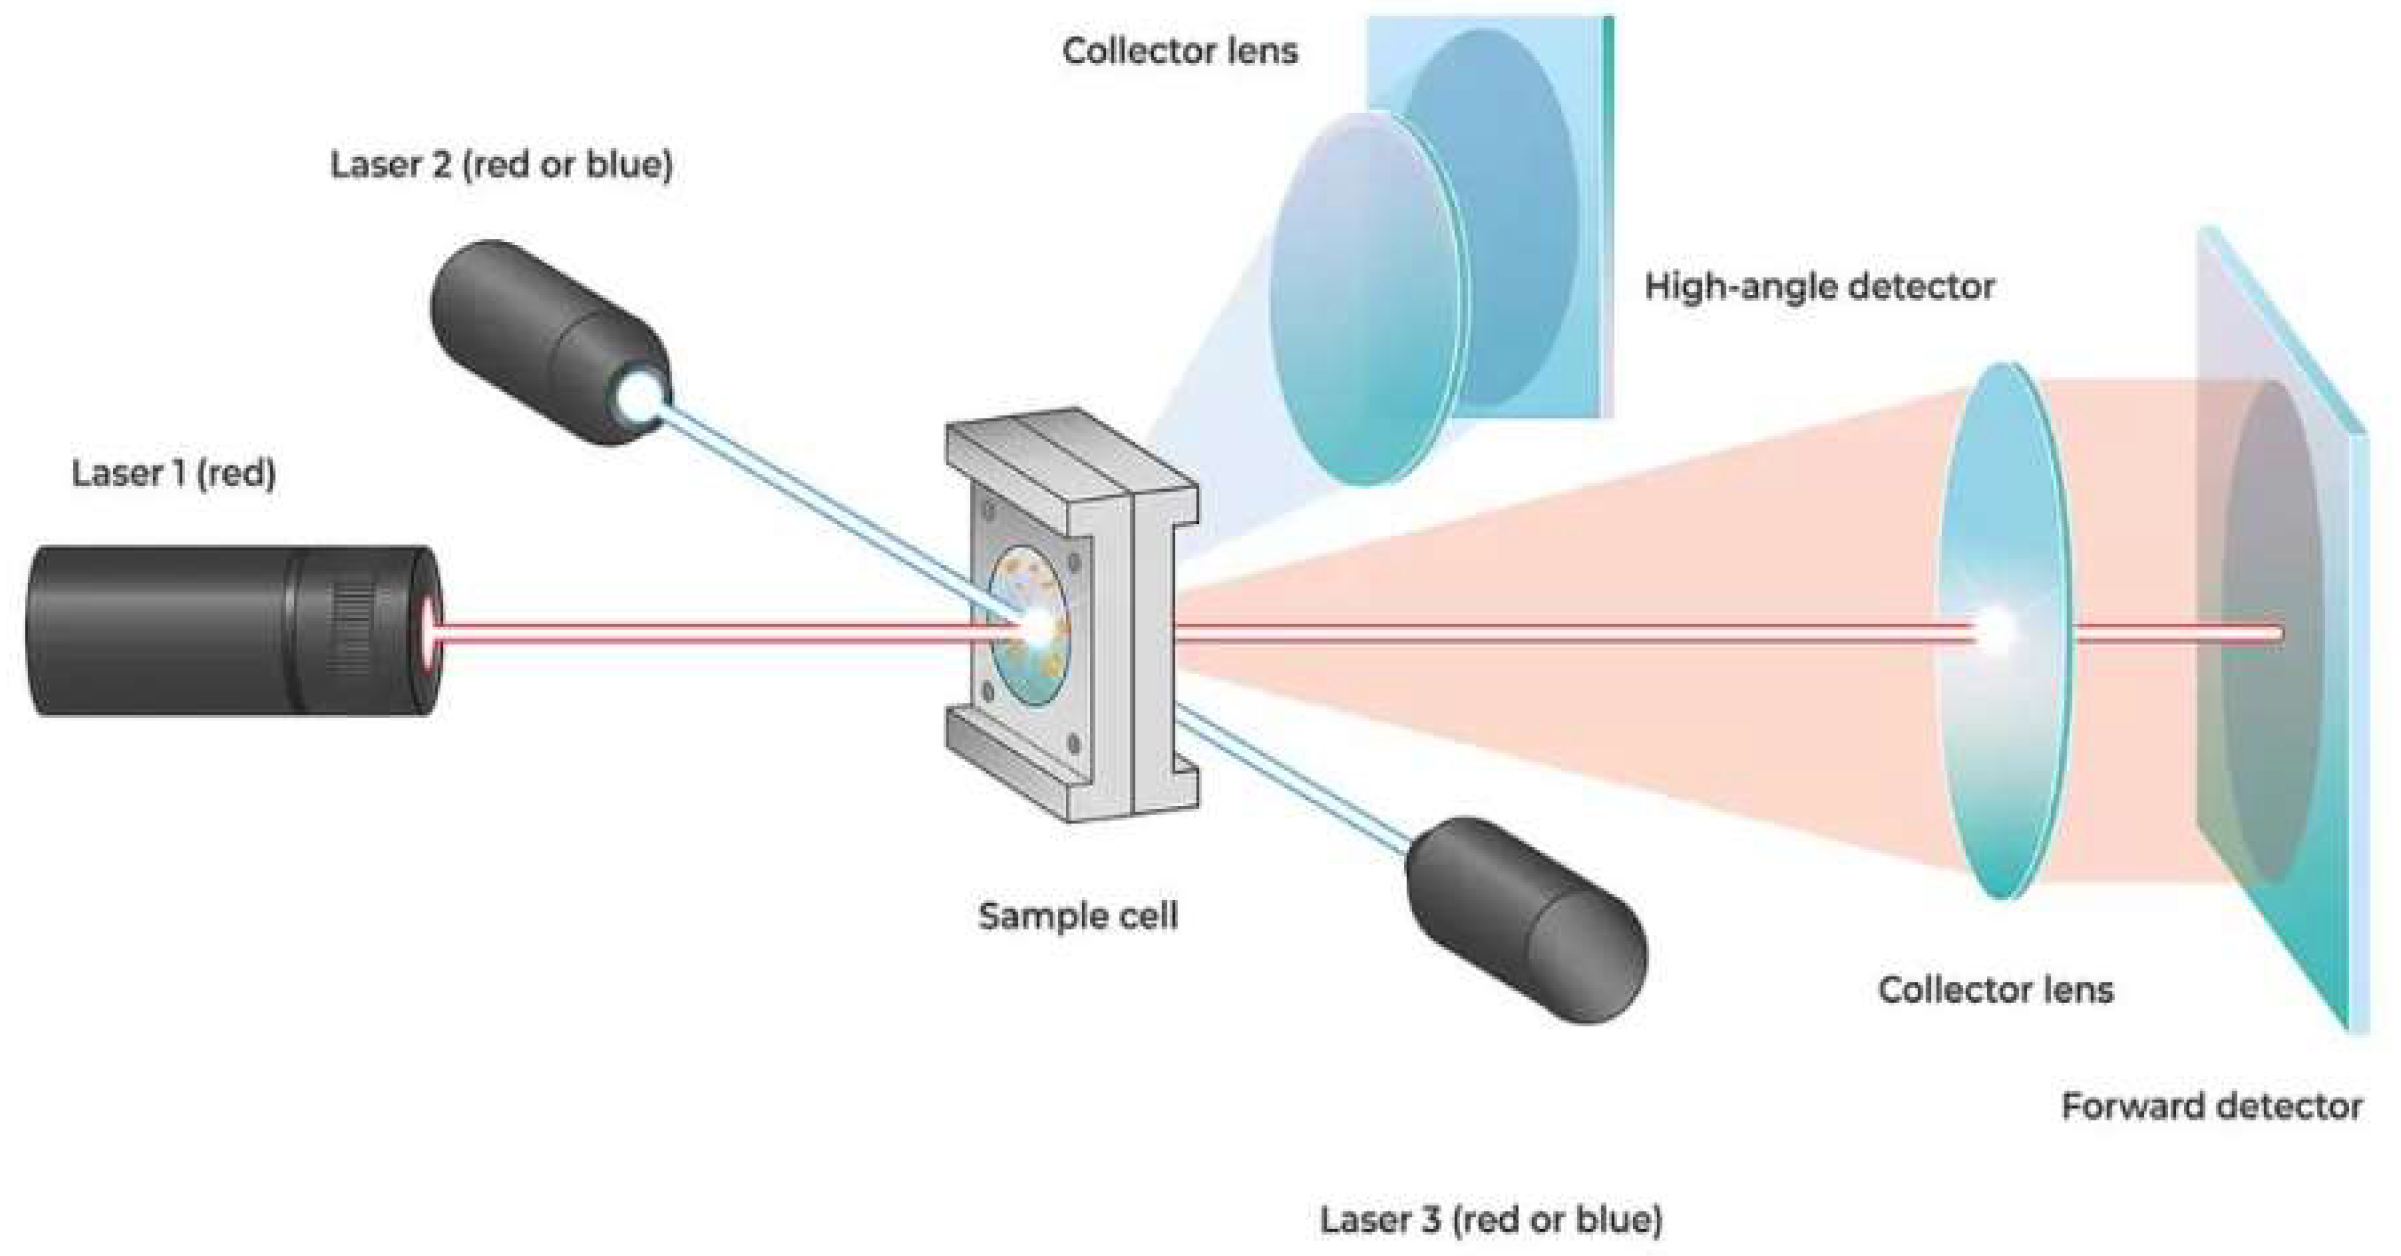
For this investigation, the Microtrac BlueWave laser diffraction particle size analyzer was used to determine the particle sizes of the suspended particles in each of the produced water samples and their corresponding size distributions. The instrument was chosen primarily due to its extensive measurement range, versatility, and ability to process a high number of samples and for its good reproducibility of the results obtained as required by the ISO 13320-2020 standard for measurement of particle size by Laser Diffraction. A schematic diagram showing the optical layout of the instrument used for all the measurements in this investigation is shown in Figure 9.
Bluewave, as already mentioned, is a particle characterization tool that uses the light diffracted by suspended particles to derive their size distribution. The BlueWave is capable of particle size measurements ranging from 5nm to 2800 microns.
The system suspends the particles in a liquid and circulates the suspension through an optical cell. In this optical cell, lasers of three different wavelengths strike the sample. The light produced by these lasers is diffracted by an ensemble of particles in the water sample, and a diffraction pattern is produced. The maxima and minima of the combined diffraction patterns of these particle ensembles are then recorded by detectors. An inversion algorithm is used to separate the pattern created by each particle in the ensemble, and the system software calculates the particle size distribution based on these diffraction patterns.
Figure 4.
BlueWave Laser Diffraction particle Analyzer (Courtesy : Microtrac).
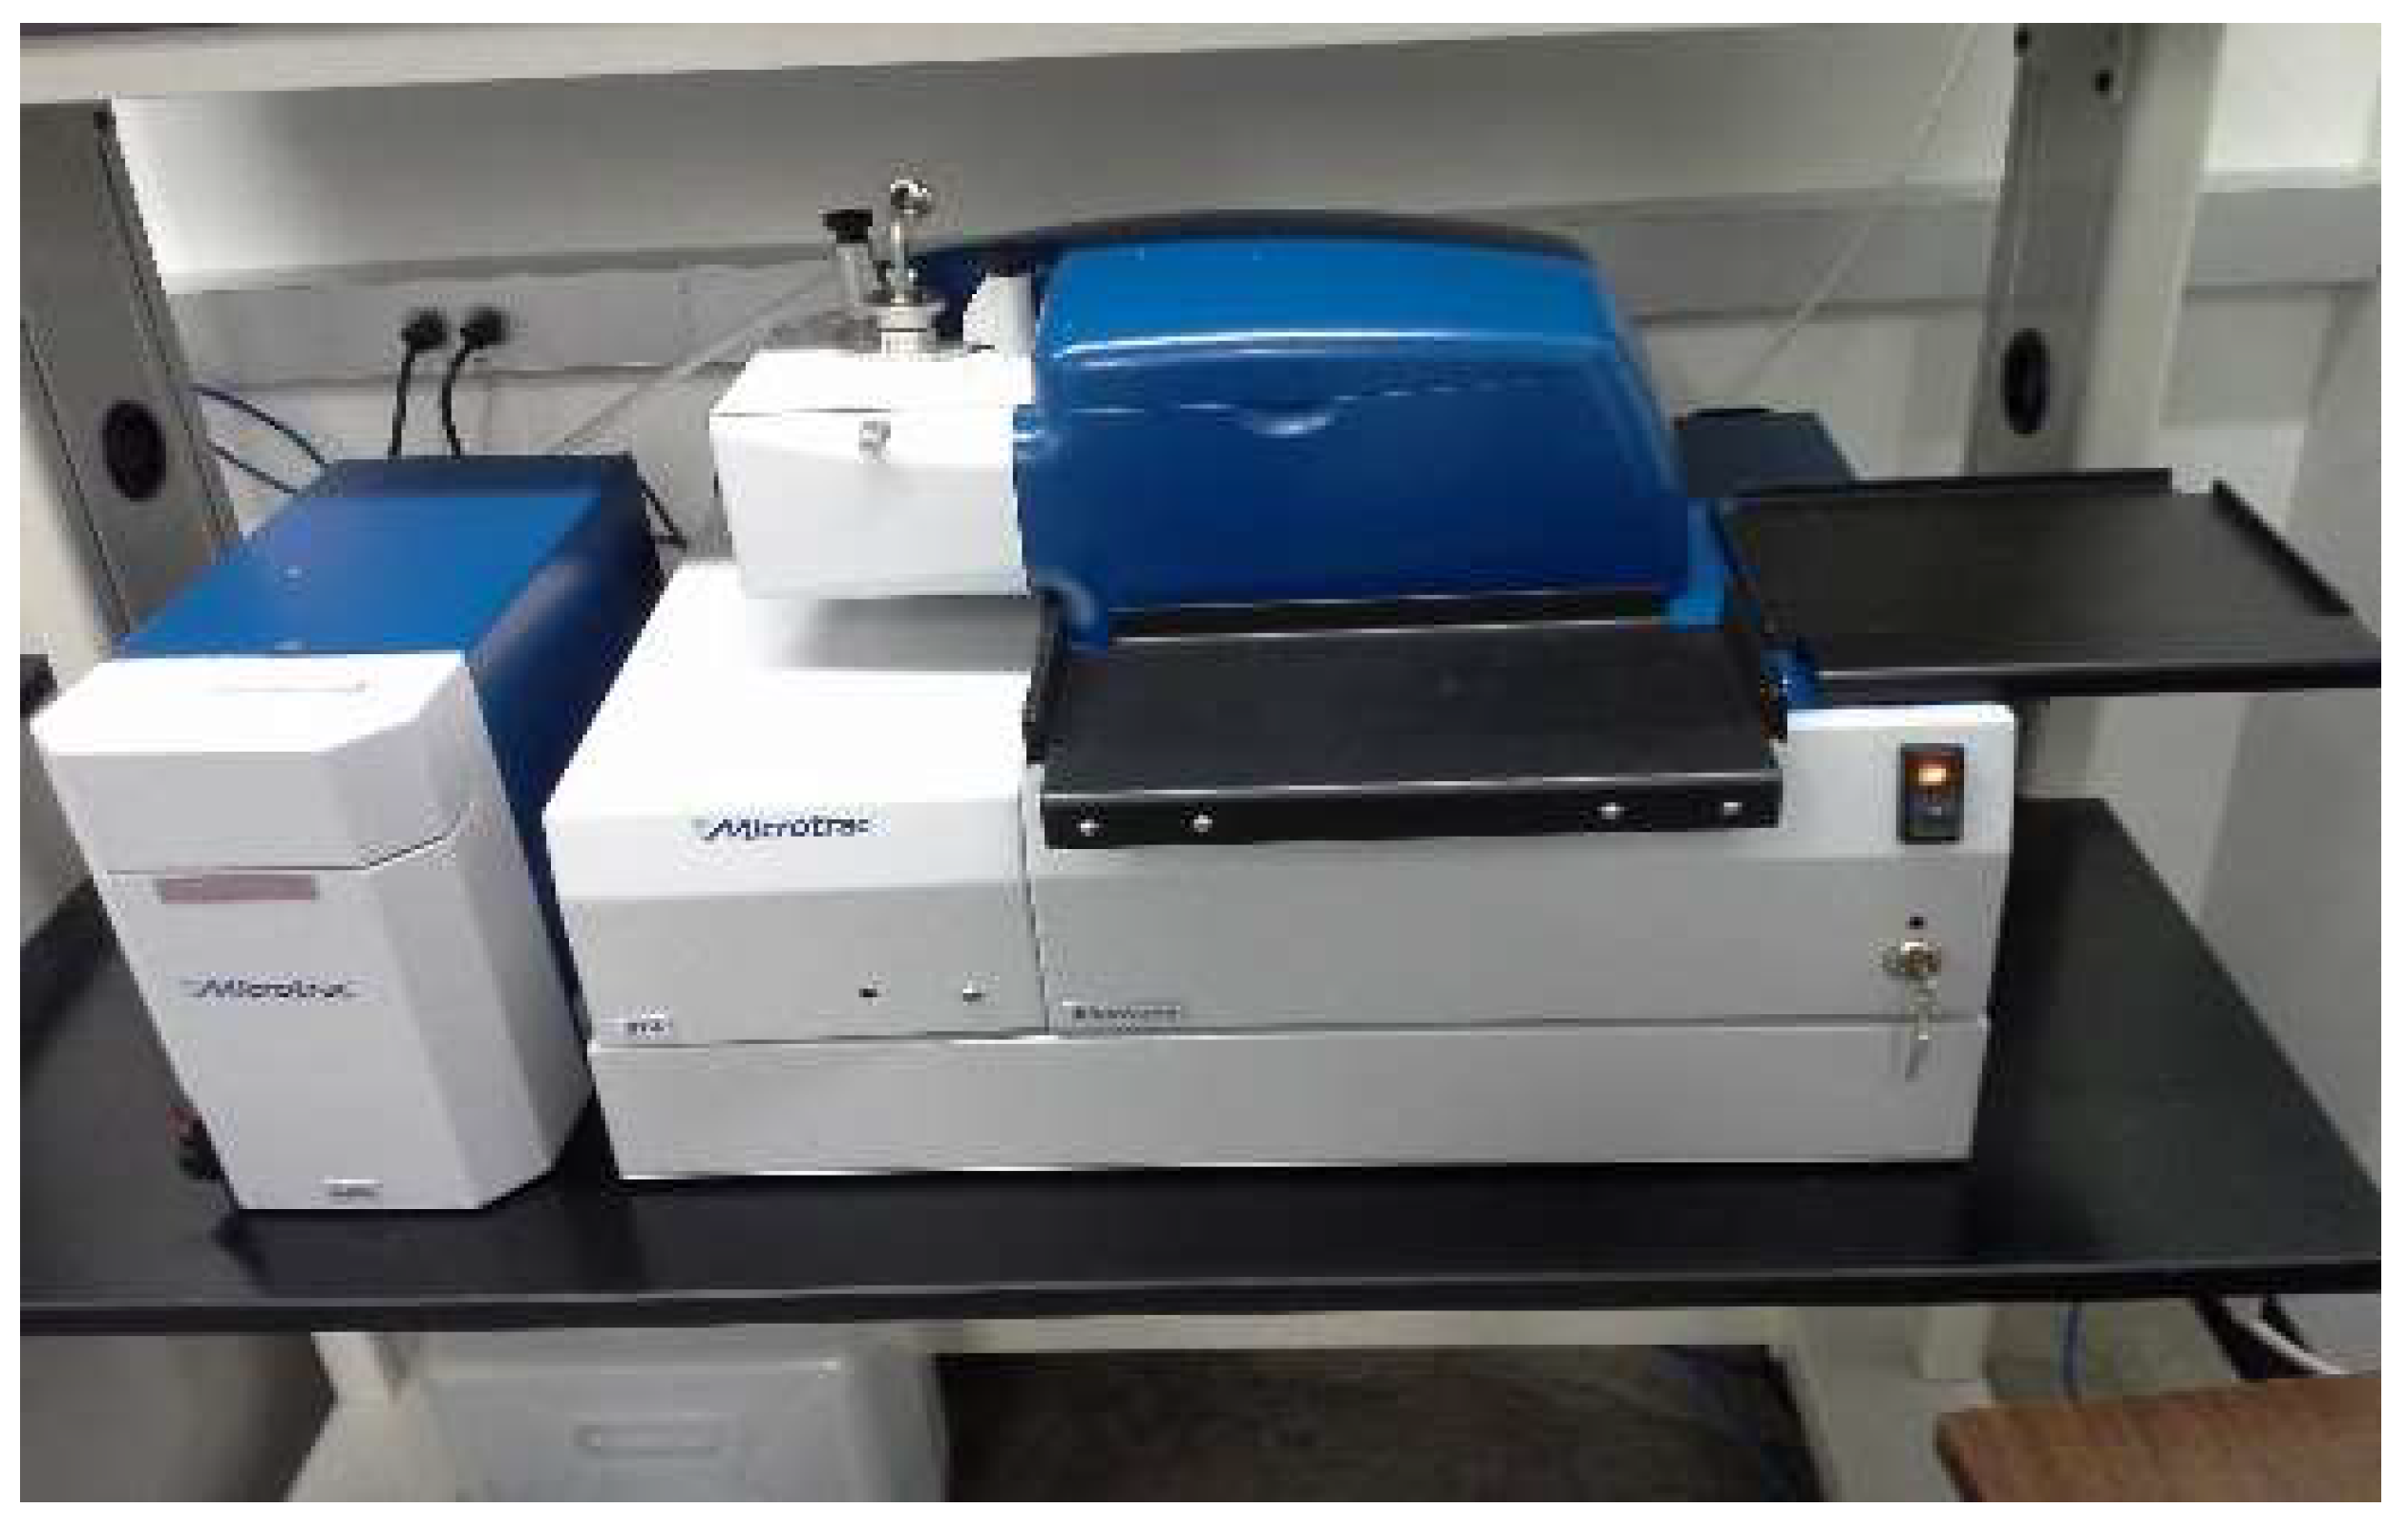
Figure 5.
(Microtrac MRB, www.microtrac.com/products/particle-size-shape-analysis/laser-diffraction).
Figure 5.
(Microtrac MRB, www.microtrac.com/products/particle-size-shape-analysis/laser-diffraction).
2.3. Experimental Procedure
The instrument was set up for measurements according to the standard operating procedure (SOP) in Table 1 in compliance with the ISO 13320-2020 particle size measurement standard in step 1, and the measurements were taken in steps 2,3 and 4
- Step 1.
This involved setting up BlueWave Laser Diffraction particle Analyzer using its standard operating procedure(Table 1).
Table 1.
Standard operating procedure settings( distilled water as circulating fluid).
| Instrument Settings | Parameter |
|---|---|
| Measurement time per sample | 15 seconds |
| Flow rate of circulating fluid | 70mls/min |
| Number of Rinses of sample chamber before new measurement | 4 |
| Number of times measurement is taken | 3 |
- Step 2
In compliance with ISO 13320-2020 standard methodology, the sample chamber was rinsed four times, and the instrument was set into circulation mode. A representative portion of the produced water was agitated to ensure homogeneity and dispensed into the instrument's sample chamber in a dropwise manner until the particle sensor detected a signal, indicating that the measurement process could commence.
- Step 3
Following detection of this signal, the "measure" command in the operation software panel was pushed, causing the instrument to measure the particle sizes and plot the size distribution. In accordance with standard operating procedure in Table 1 above, the measurement of particle size distribution was automatically repeated three times by the instrument, and the average particle size distribution was subsequently determined in volume mode and plotted.
- Step 4
We then engaged the analyzer into the rinse mode and the already analyzed sample was drained out of the instrument and the sample chamber rinsed four times as specified in the Standard Operating Procedure (SOP) in Table 1. We then introduced the next produced water sample into the instrument and the same procedure in step 2 above is repeated to obtain the particle size distribution for all the produced water samples.
3. Results
Figure 6a.
McClean Untreated Produced Water particle size distribution.
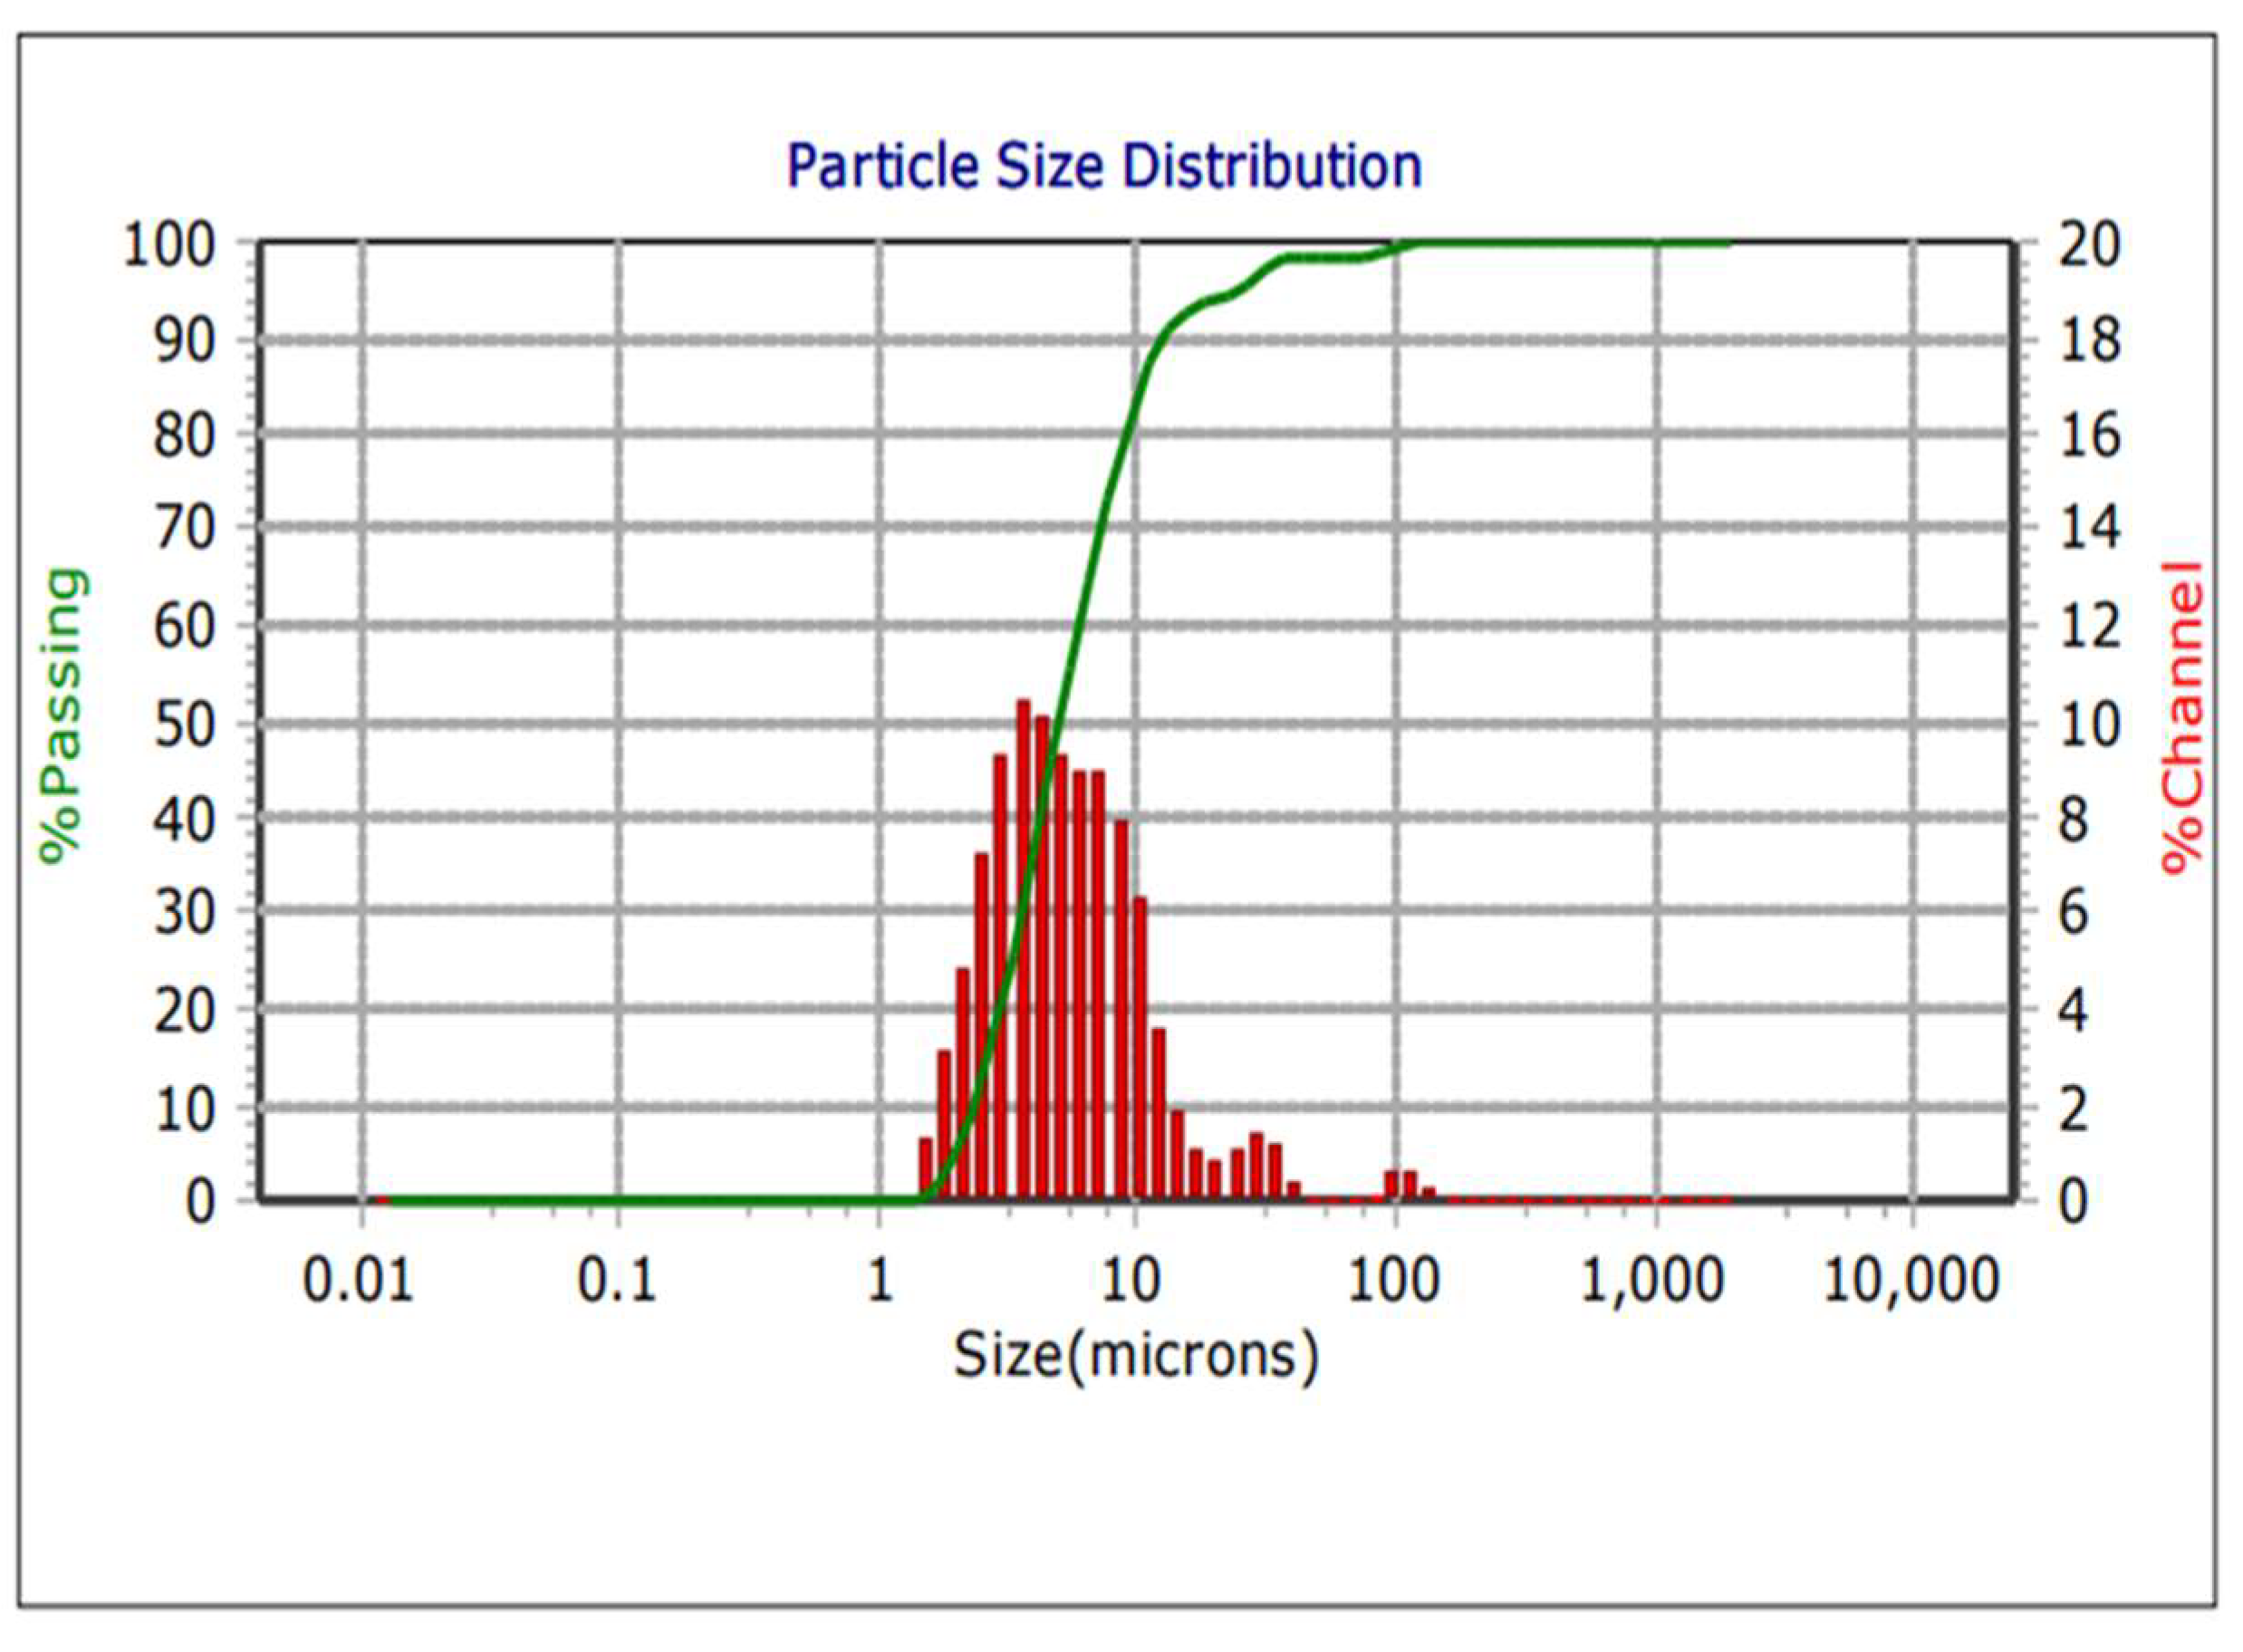
Figure 6b.
McClean Treated Produced Water particle size distribution.
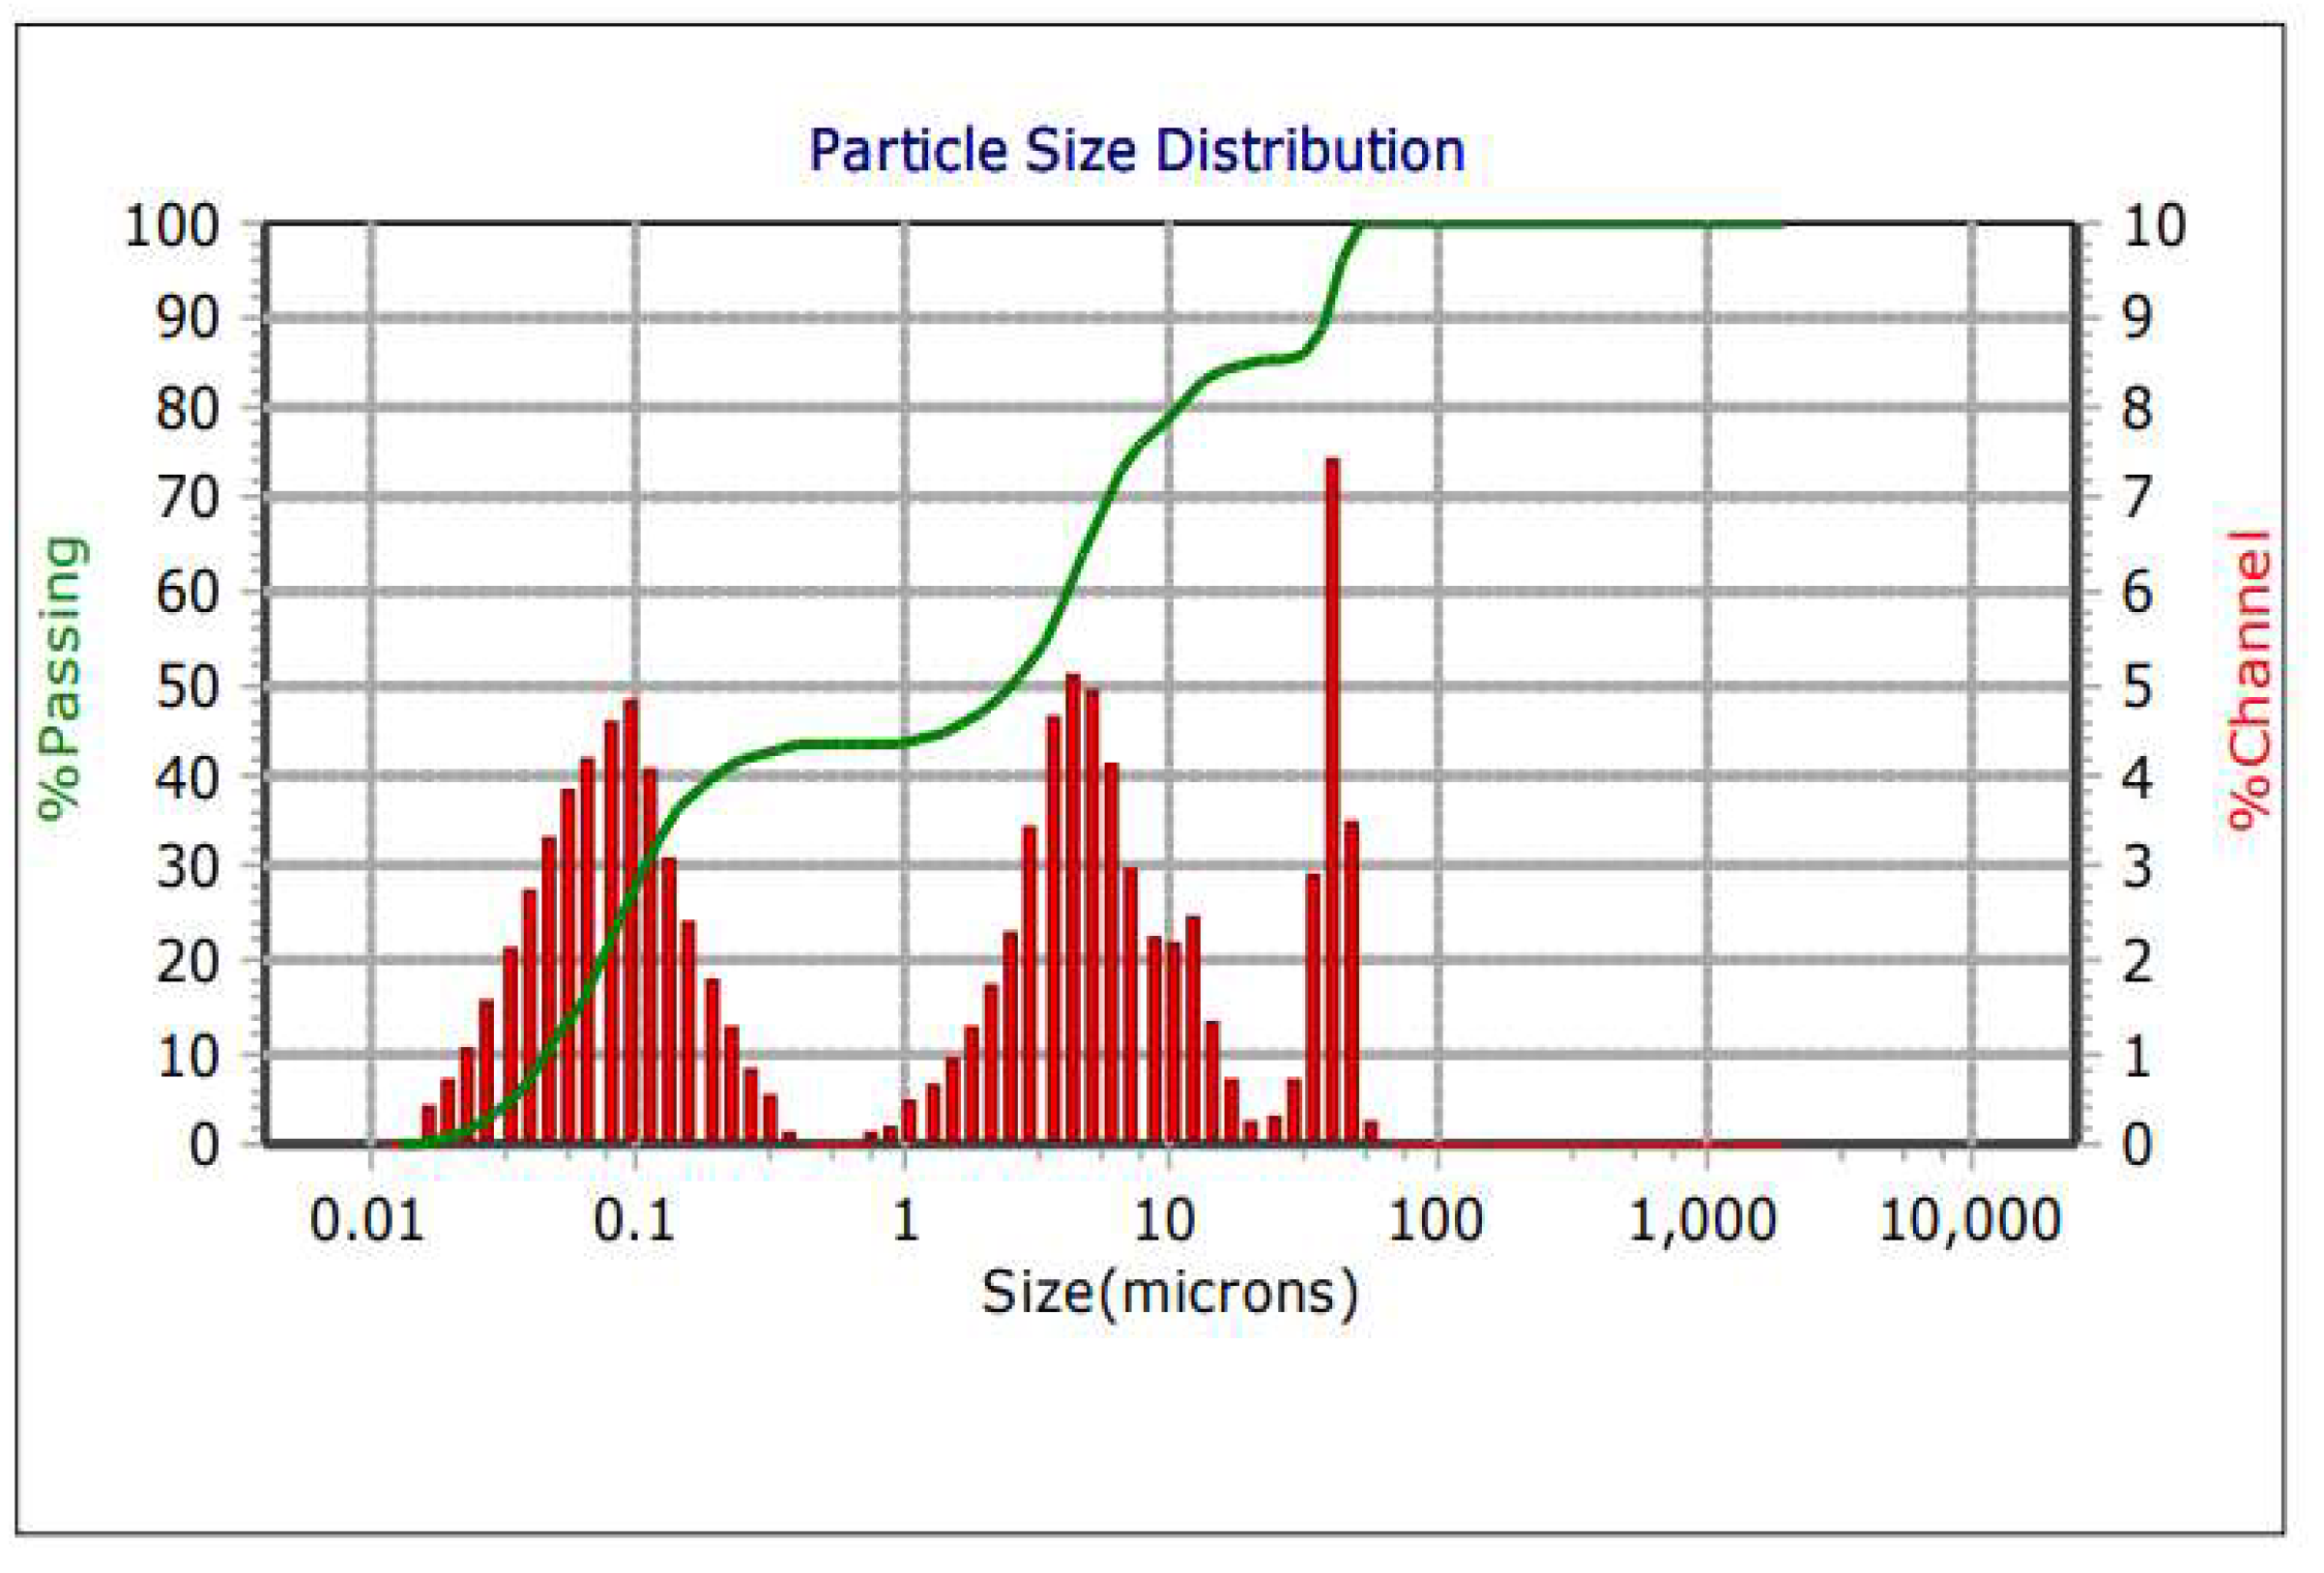
Figure 7a.
McKenzie untreated Produced Water particle size distribution.
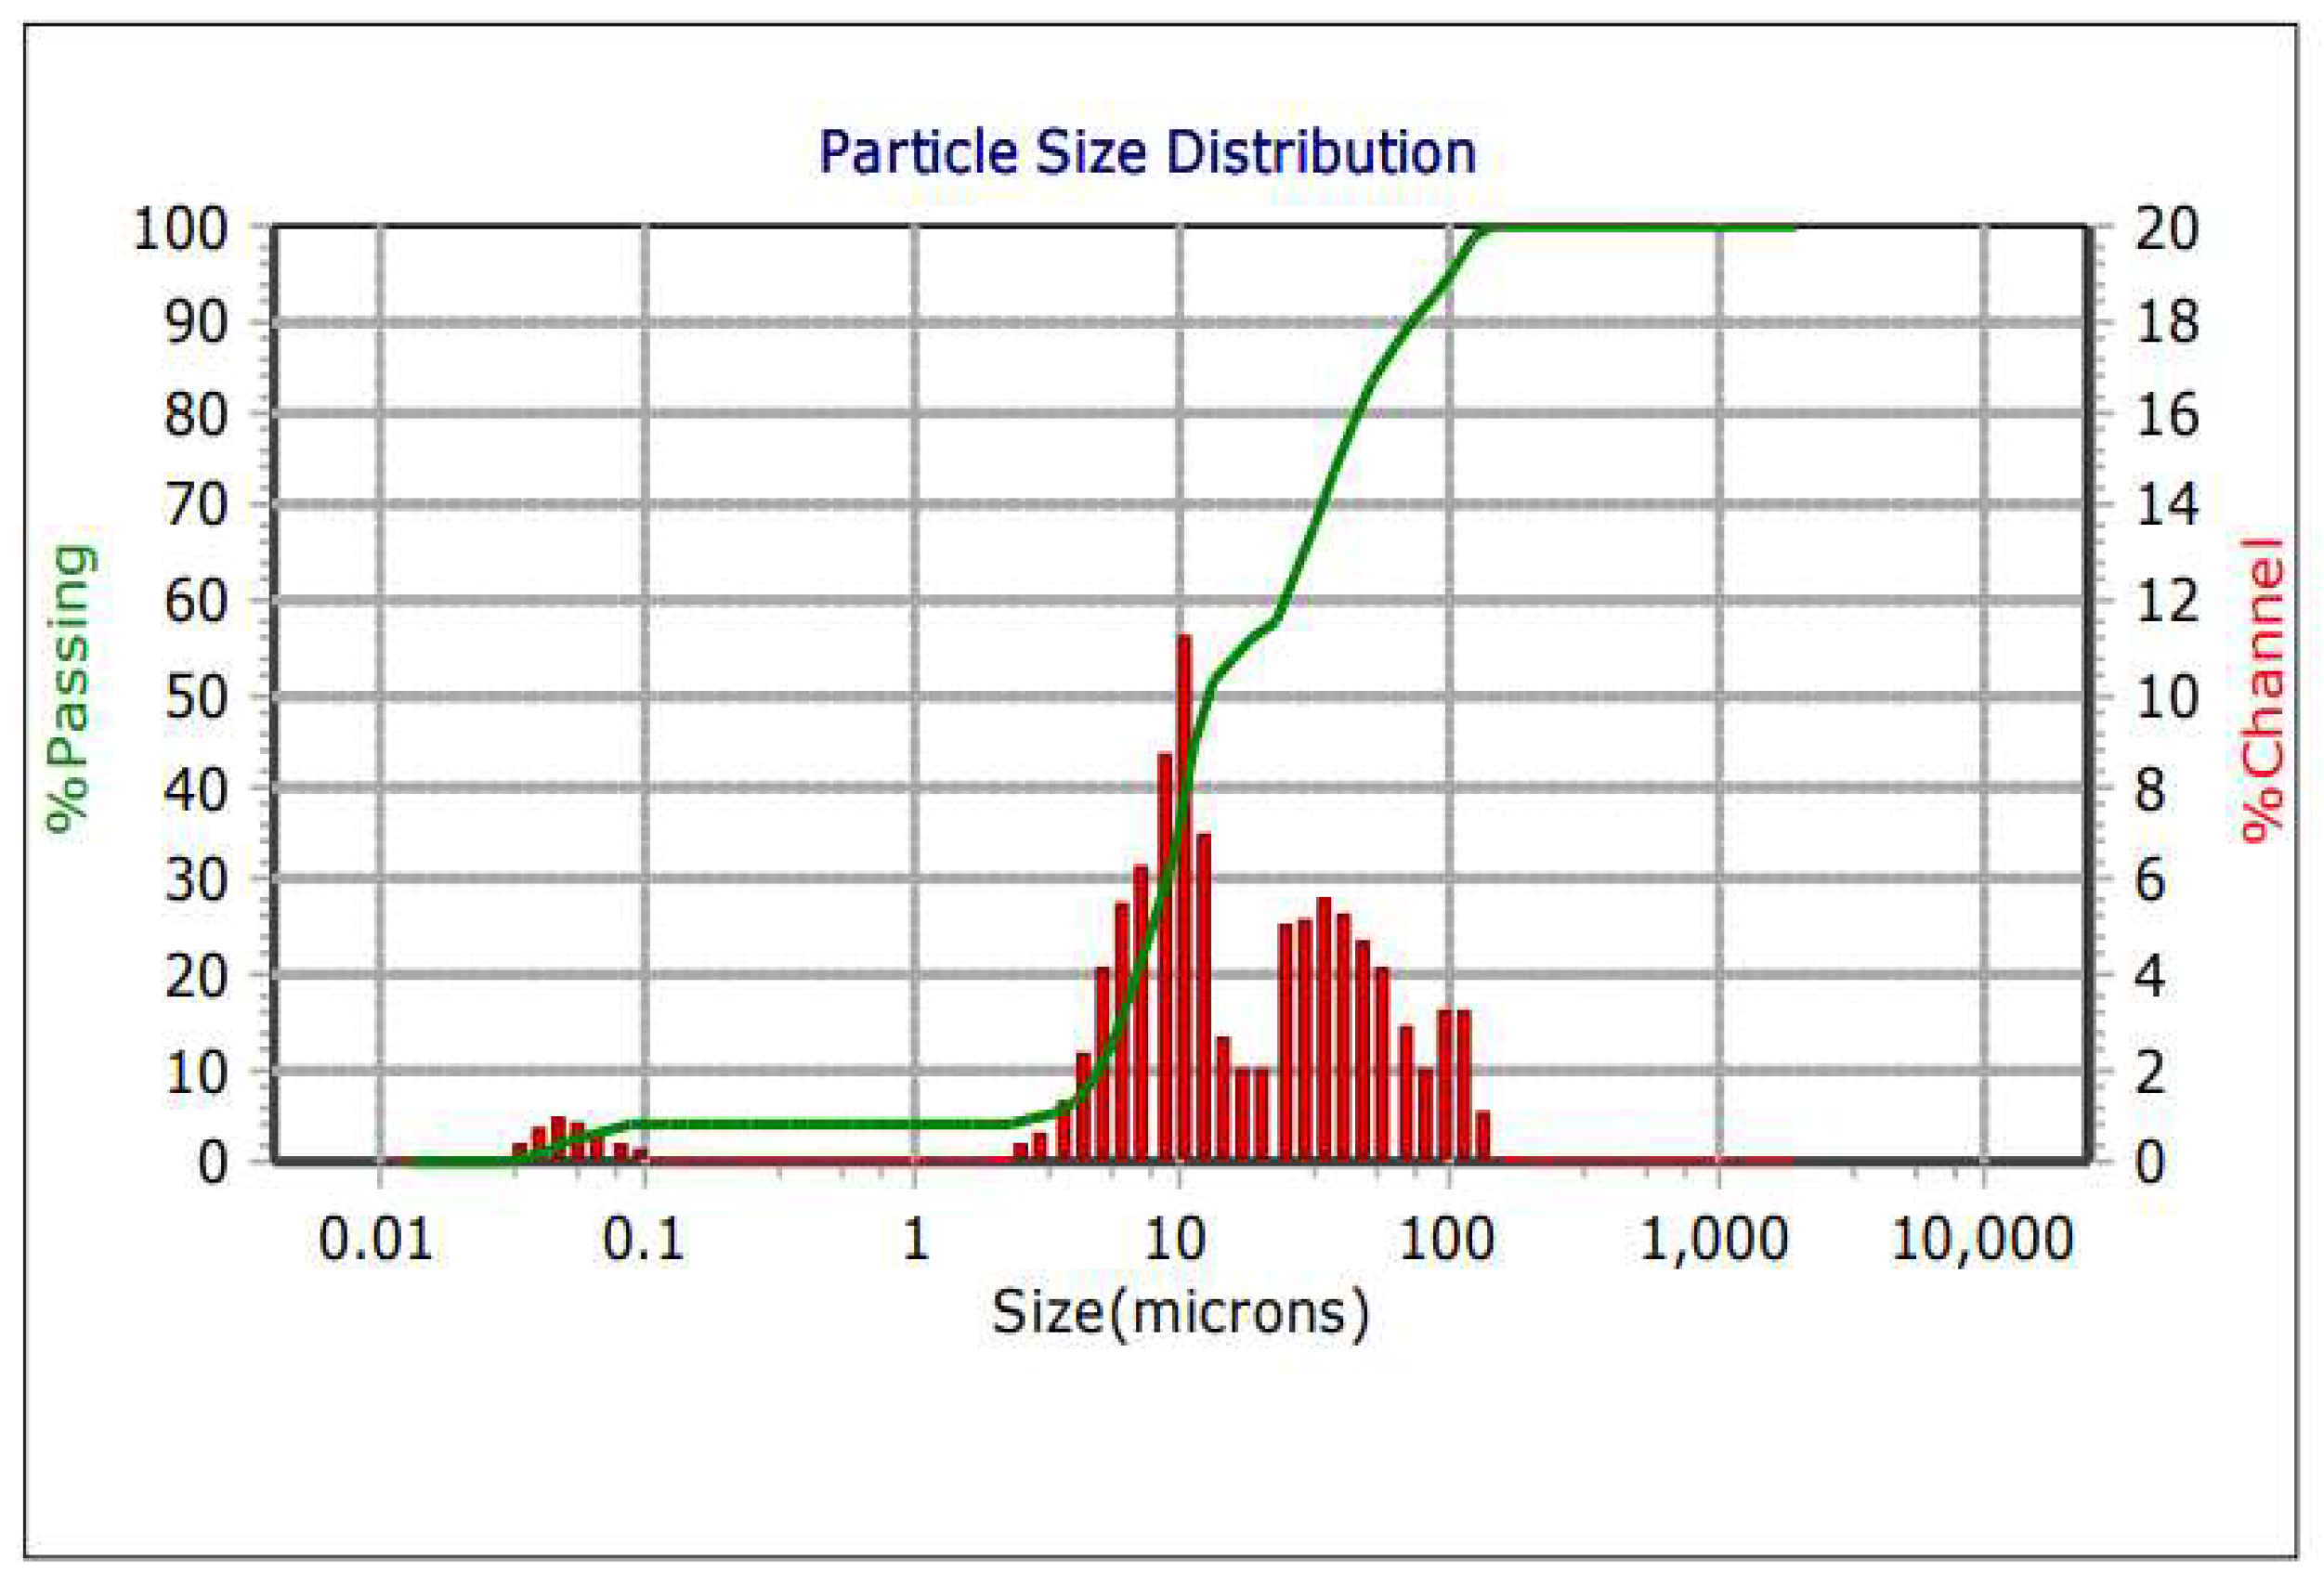
Figure 7b.
McKenzie treated Produced Water particle size distribution.
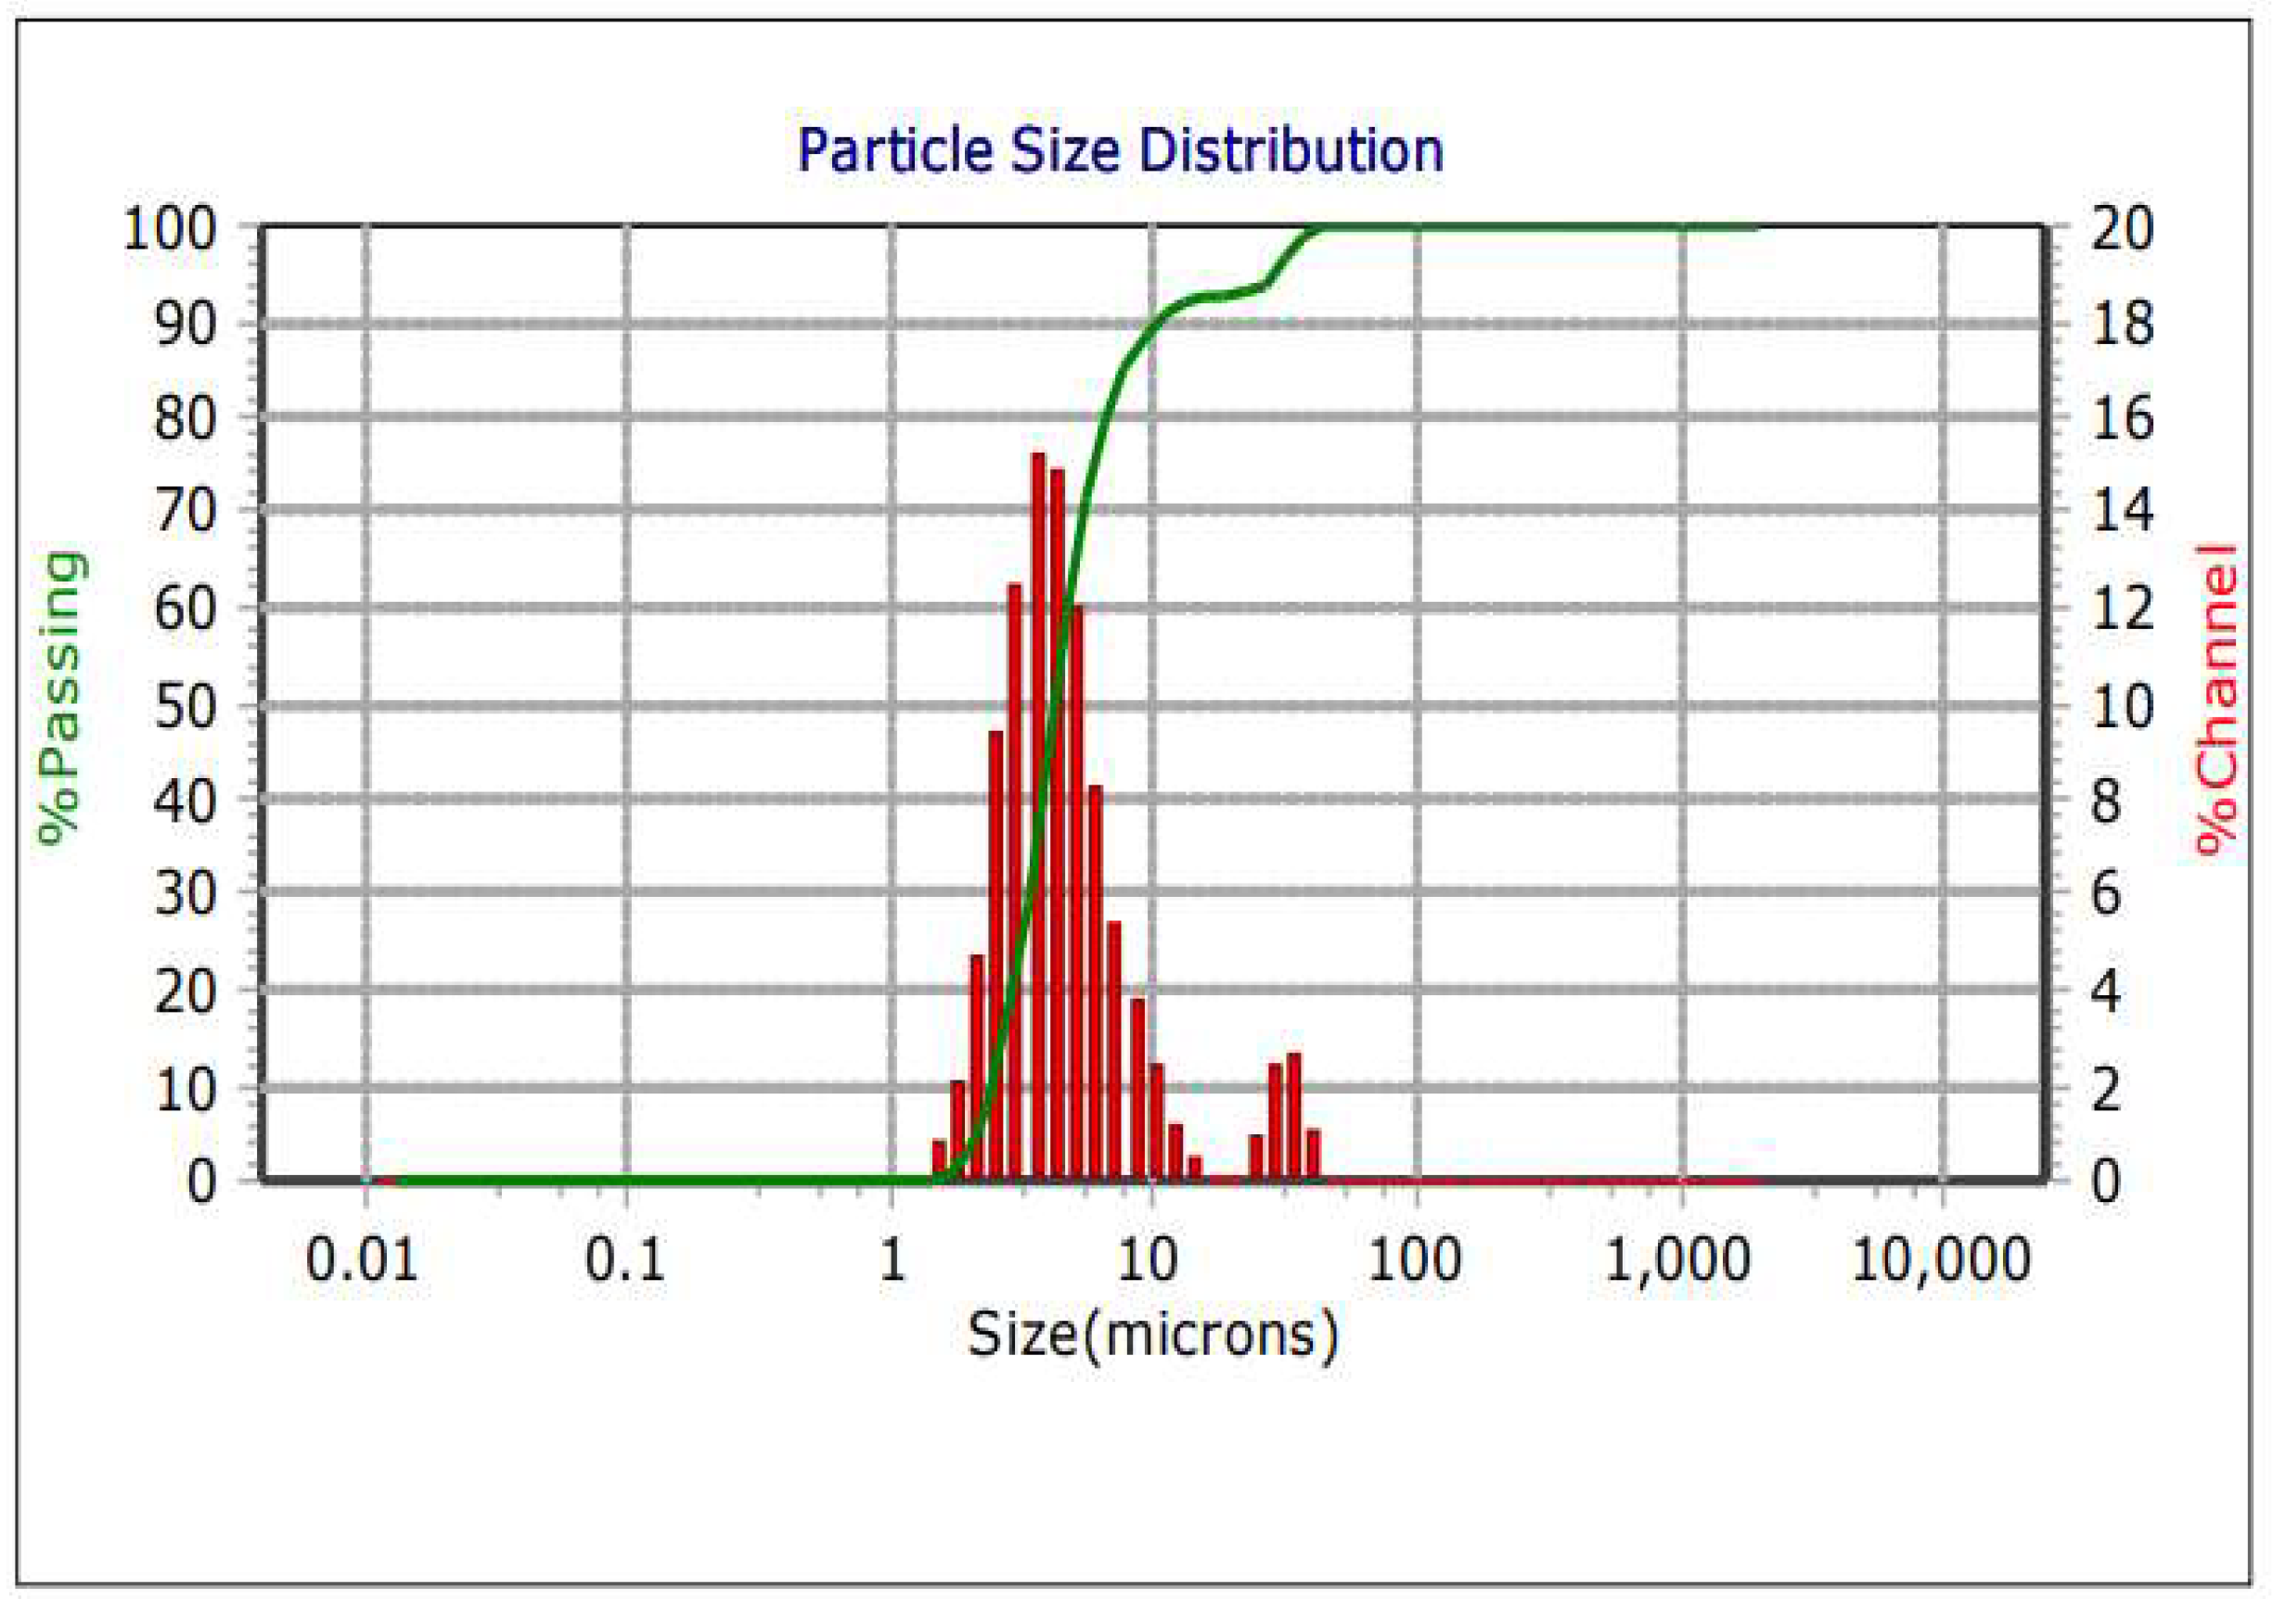
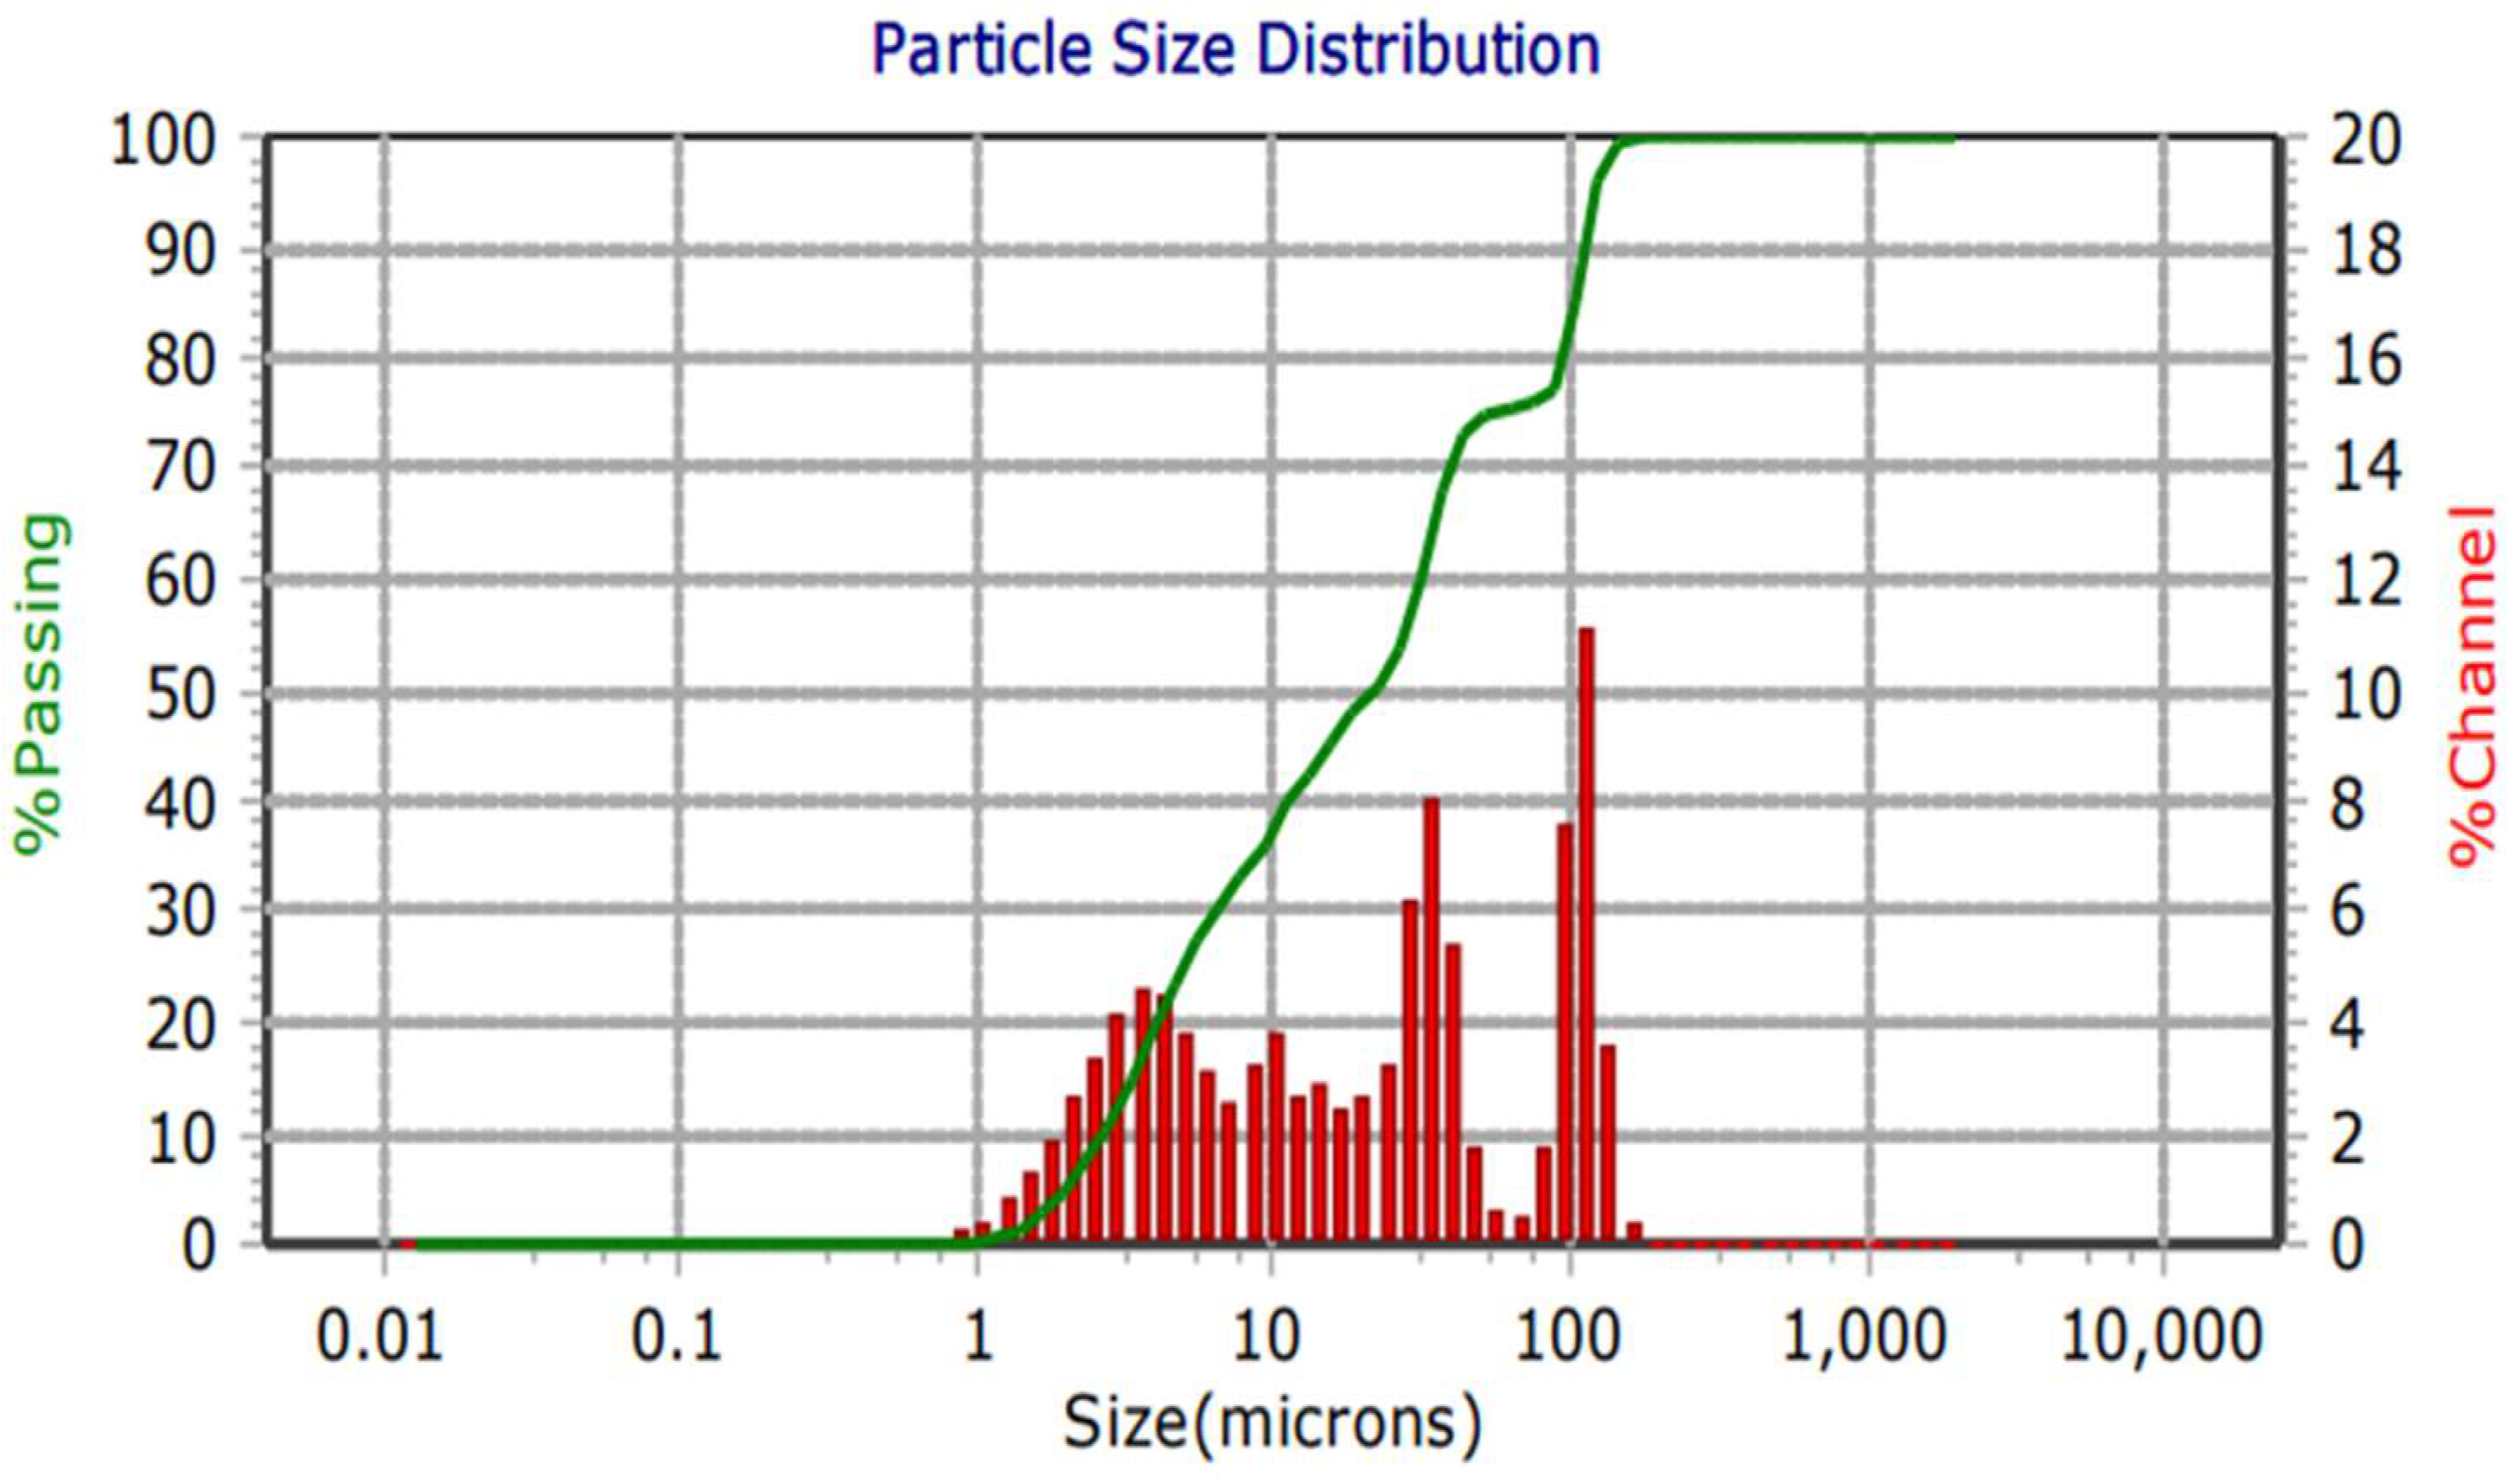
Figure 8a.
Williams untreated Produced Water particle size distribution.
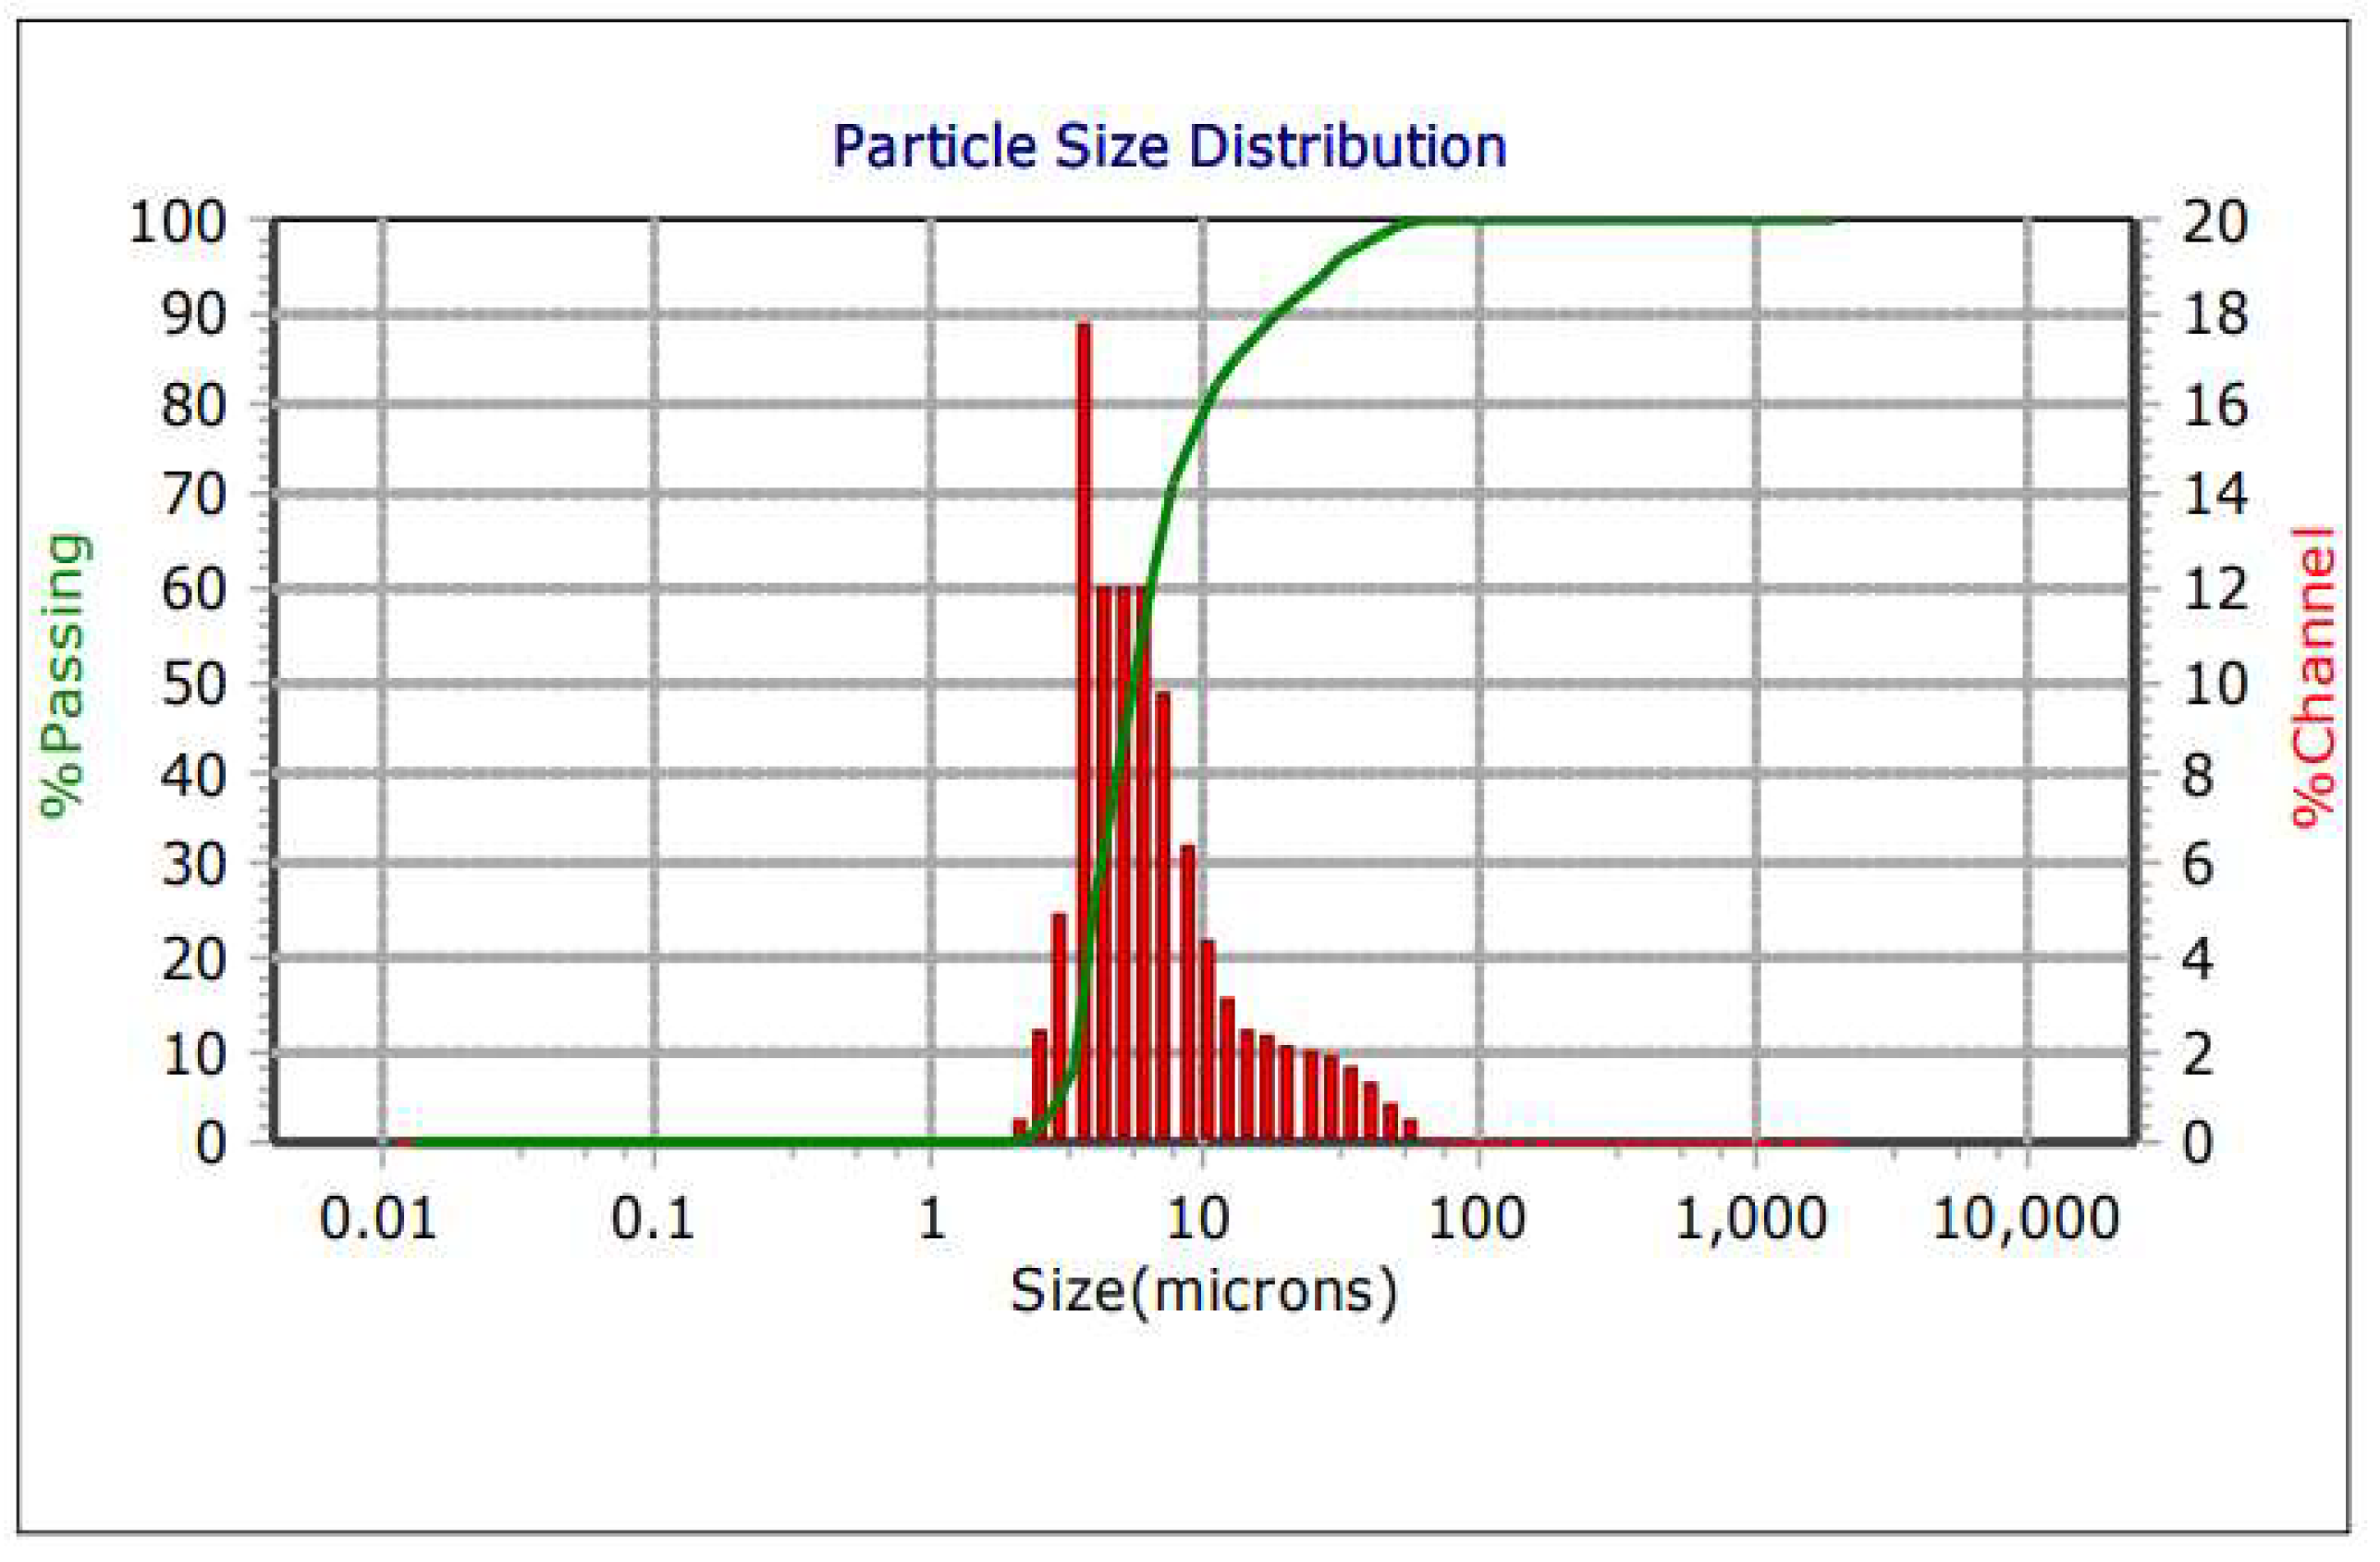
Figure 8b.
Williams County treated Produced Water particle size distribution.
4. Discussion
The findings of this study reveal significant non-compliance with industry standards for particle size distribution in both treated and untreated produced water samples from the Bakken Formation. Across Williams, McKenzie, and McClean counties, the particle sizes in produced water far exceeded the recommended range of 0.03 to 0.06 microns, raising concerns about the potential for formation damage during hydraulic fracturing and enhanced oil recovery (EOR) operations. The critical role of particle size in mitigating formation damage highlights the importance of addressing these deficiencies in water treatment practices.
A key observation was the inadequacy of current treatment methods in reducing particle sizes to meet industry standards. Treated water samples exhibited mean particle sizes significantly larger than the required range, with diameters averaging 40 μm in Williams County, 8.5 μm in McKenzie County, and 10 μm in McClean County. These values are far beyond the 0.03 to 0.06-micron range necessary to prevent the clogging of pore throats and the formation of internal and external filter cakes. This inadequacy suggests that existing water treatment technologies, such as filtration or chemical treatment, are ineffective in processing produced water to the level required for safe hydraulic fracturing and water injection operations.
Interestingly, untreated produced water in McKenzie and McClean counties exhibited slightly smaller particle sizes compared to treated water. While the untreated water showed marginal improvements in mean particle diameter, the values remained in the 8.2 μm to 10 μm range—far above the 2-micron size suggested by some industry bodies. This trend suggests that, in some cases, the treatment processes themselves may introduce inefficiencies or even contaminants that exacerbate the problem of oversized particles, instead of improving water quality. Therefore, a deeper investigation into the specific treatment methods used in these counties and elsewhere is warranted to identify potential shortcomings.
Given the variations in particle size distribution, a one-size-fits-all approach to water treatment may therefore not be appropriate. Recommendations for acceptable particle sizes in produced water should be tailored to the specific permeability of the reservoir in question ,for example the 0.03 to 0.06-micron range in the counties studied in the Bakken. For formations with low permeability, such as the Middle Bakken, even small variations in particle size can lead to severe formation damage. In this context, the 0.03 to 0.06-micron standard might be appropriate for tight formations, but less stringent requirements might apply to more permeable formations. Developing permeability-dependent regulations could help optimize water treatment processes and reduce the risk of formation damage in a more targeted manner.
The persistent presence of large particles in both treated and untreated water poses a serious risk of formation damage. Particles larger than the recommended range can clog pore throats, creating internal filter cakes within the reservoir and external filter cakes on rock surfaces. This can significantly reduce the permeability of the rock, hindering fluid flow and impairing both hydraulic fracturing and water injection efficiency. Such damage may lead to reduced oil recovery rates and increased operational costs, as remediation efforts will be required to restore well productivity. Therefore, it is crucial to address particle size distribution as a primary concern in water management strategies.
The study highlights the urgent need for advanced water treatment technologies that can effectively reduce particle sizes to meet the industry standards required for safe fracking and EOR. Current methods, while commonly used, are clearly insufficient for producing the high-quality water needed in operations within the Bakken. Technological improvements should focus on optimizing filtration processes and introducing new techniques capable of removing micron- and submicron-sized particles. Emerging technologies, such as membrane filtration, nanofiltration, or advanced sedimentation techniques, could offer promising solutions for achieving the required particle size distribution.
5. Conclusions
This study underscores the inadequacies of current produced water treatment technologies in meeting industry standards for particle size distribution. Both treated and untreated water samples from the Bakken Formation present a high risk of formation damage due to the presence of oversized particles, necessitating immediate improvements in water management practices. By tailoring water treatment strategies to the specific permeability of the reservoir and adopting more advanced filtration technologies, the industry can reduce the risk of formation damage and enhance the efficiency of hydraulic fracturing and water injection operations in the Bakken. Future research should focus on the development of new treatment or an improvement of current technologies and the establishment of reservoir-specific particle size standards to ensure the long-term sustainability of oil production in unconventional formations like the Bakken.
Author Contributions
Conceptualization, Claudius Epie Njie.; methodology, Claudius Epie Njie..; validation, Dr Kegang Ling.; Md Jakaria.; investigation, Claudius Epie Njie.; resources, UND petroleum engineering department.; data curation, Md Jakaria; writing—original draft preparation, , Claudius Epie Njie .; writing—review and editing, Claudius Epie Njie.; visualization, Md Jakaria.; supervision, Dr Kegang Ling.; project administration, Dr Kegang Ling .; funding acquisition, NDIC. All authors have read and agreed to the published version of the manuscript.
Funding
This research was funded by North Dakota Industrial Commission.
Data Availability Statement
The data generated from experiments in this work can be provided upon request.
Acknowledgments
We acknowledge the contribution of Dr. James Marti of the University of Minnesota for providing access to the Laser diffraction equipment used in this work.
Conflicts of Interest
The authors declare no conflicts of interest.
References
- Goswami, M., Patowary, R., Patowary, K., Sarma, H. P., Rabha, S., Devi, B., ... & Devi, A. (2023). Environmentally friendly treatment of petroleum hydrocarbon contaminated formation water: mechanisms and consequences for degradation and adsorption. Water Resources and Industry, 30, 100224.
- Samuel, O., Othman, M. H. D., Kamaludin, R., Sinsamphanh, O., Abdullah, H., Puteh, M. H., ... & Mamah, S. C. (2022). Oilfield-produced water treatment using conventional and membrane-based technologies for beneficial reuse: A critical review. Journal of Environmental Management, 308, 114556. [CrossRef]
- Jiang, W., Lin, L., Xu, X., Cheng, X., Zhang, Y., Hall, R., & Xu, P. (2021). A critical review of analytical methods for comprehensive characterization of produced water. Water, 13(2), 183. [CrossRef]
- Veil, J. A., Puder, M. G., & Elcock, D. (2004). A white paper describing produced water from production of crude oil, natural gas, and coal bed methane (No. ANL/EA/RP-112631). Argonne National Lab., IL (US)..
- Olajire, A. A. (2020). Recent advances on the treatment technology of oil and gas produced water for sustainable energy industry-mechanistic aspects and process chemistry perspectives. Chemical Engineering Journal Advances, 4, 100049. [CrossRef]
- Dos Santos, E. V., Bezerra Rocha, J. H., de Araújo, D. M., de Moura, D. C., & Martínez-Huitle, C. A. (2014). Decontamination of produced water containing petroleum hydrocarbons by electrochemical methods: a minireview. Environmental Science and Pollution Research, 21, 8432-8441. [CrossRef]
- Shubo Deng, Gang Yu, Zhanpeng Jiang, Ruiquan Zhang, Yen Peng Ting, Destabilization of oil droplets in produced water from ASP flooding, Colloids and Surfaces A: Physicochemical and Engineering Aspects, Volume 252, Issues 2–3, 2005. [CrossRef]
- Guo, J., Liu, Q., Li, M., Wu, Z., & Christy, A. A. (2006). The effect of alkali on crude oil/water interfacial properties and the stability of crude oil emulsions. Colloids and Surfaces A: Physicochemical and Engineering Aspects, 273(1-3), 213-218. [CrossRef]
- Deng, S., Bai, R., Chen, J. P., Jiang, Z., Yu, G., Zhou, F., & Chen, Z. (2002). Produced water from polymer flooding process in crude oil extraction: characterization and treatment by a novel crossflow oil–water separator. Separation and Purification Technology, 29(3), 207-216. [CrossRef]
- APHA. 1992. Standard methods for the examination of water and wastewater. 18th ed. American Public Health Association, Washington, DC.
- Levine, A. D., Tchobanoglous, G., & Asano, T. (1991). Size distributions of particulate contaminants in wastewater and their impact on treatability. Water Research, 25(8), 911 922. [CrossRef]
- Benko, K. L., & Drewes, J. E. (2008). Produced water in the Western United States: geographical distribution, occurrence, and composition. Environmental Engineering Science, 25(2), 239-246. [CrossRef]
- X. Hu and S. Huang, Physics of Petroleum Reservoirs, Springer, 2017.
- Benko, K. L., & Drewes, J. E. (2008). Produced water in the Western United States: geographical distribution, occurrence, and composition. Environmental Engineering Science, 25(2), 239-246. [CrossRef]
- Barbot, E., Vidic, N. S., Gregory, K. B., & Vidic, R. D. (2013). Spatial and temporal correlation of water quality parameters of produced waters from Devonian-age shale following hydraulic fracturing. Environmental science & technology, 47(6), 2562-2569. [CrossRef]
- Alley, B., Beebe, A., Rodgers, J., & Castle, J. W. (2011). Chemical and physical characterization of produced waters from conventional and unconventional fossil fuel resources. Chemosphere, 85(1), 74-82. [CrossRef]
- X. Hu and S. Huang, Physics of Petroleum Reservoirs, Springer, 2017.
- Patton, C.C.: Applied Water Technology, Campbell Petroleum Series, Norman, OK (1986).
- Bethany Kurz, SUMMARY OF THE BAKKEN WATER ASSESSMENT REPORT. Energy Development and Transmission Committee Meeting Bismarck, North Dakota, 2016.
- Wang, H., Lu, L., Chen, X., Bian, Y., & Ren, Z. J. (2019). Geochemical and microbial characterizations of flowback and produced water in three shale oil and gas plays in the. [CrossRef]
- https://www.epa.gov/waterreuse/maps-states-water-reuse-regulations-or-guidelines.
Disclaimer/Publisher’s Note: The statements, opinions and data contained in all publications are solely those of the individual author(s) and contributor(s) and not of MDPI and/or the editor(s). MDPI and/or the editor(s) disclaim responsibility for any injury to people or property resulting from any ideas, methods, instructions or products referred to in the content. |
© 2024 by the authors. Licensee MDPI, Basel, Switzerland. This article is an open access article distributed under the terms and conditions of the Creative Commons Attribution (CC BY) license (http://creativecommons.org/licenses/by/4.0/).
Copyright: This open access article is published under a Creative Commons CC BY 4.0 license, which permit the free download, distribution, and reuse, provided that the author and preprint are cited in any reuse.


