Preprint
Article

Peripheral Hemodynamics Estimation Using Photoplethysmography Method

Altmetrics

Downloads

43

Views

22

Comments

0

Submitted:

30 October 2024

Posted:

31 October 2024

You are already at the latest version

Alerts
Abstract
Diseases such as diabetes are known to reduce blood circulation in the capillaries and arterioles; however, there are no devices that can easily measure this on a daily basis. In this study, we developed a tool for measuring finger photoplethysmograms using green-light and near-infrared LEDs. We then conducted photoplethysmography on 25 diabetic inpatients/outpatients as well as 21 adult males and females who had not been diagnosed or treated for diabetes, hypertension, or cardiovascular disease (as a control group). In the diabetic patients, the inverse full width at half maximum velocity plethysmogram (1/FWHMVPG) tended to be smaller compared to the control group, and the delay in the green light a-wave peak relative to the near-infrared light a-wave peak in the acceleration plethysmogram was significantly increased. The results suggest that peripheral hemodynamics could be easily estimated at home using a photoplethysmography device mounted on a ring-wearable device.
Keywords: 
Subject: Engineering  -   Electrical and Electronic Engineering

1. Introduction

Blood flow transports nutrients, hormones, metabolic waste products, O2, and CO2 throughout the body and plays various other roles, including controlling body temperature, pH, and osmotic pressure.
Stagnation of blood flow in small blood vessels can be caused by many factors, including a lack of exercise, high-fat/high-calorie diet, smoking, fatigue, lack of sleep, and cold environments; diseases such as diabetes are also a cause. Moreover, neuropathy, retinopathy, nephropathy, and foot lesions are serious complications of diabetes [1], so assessing arterial function is important because it is associated with various diseases and treatments [2,3], several methods of which have been used so far [4,5]. However, while useful for treating inpatients, these methods are not suitable for monitoring outpatients at home owing to their invasiveness, the need for expensive equipment, and limitations in daily life. For example, video microscopy [6,7] and ultrasound microvessel imaging [8] are difficult for patients to wear and require skilled operators to analyze the acquired images. Consequently, the application of deep learning has been studied to address such problems [9]. Other methods include noncontact imaging [10,11] (which cannot be performed without resting in the area where the camera is installed), angiography [12,13] (which is highly invasive), and laser Doppler flowmetry (LDF) (which does not distinguish between blood flow in the arterioles and venules [6] and provides only relative indices of microvascular perfusion, so it is often used in conjunction with the vasoreactivity test [14]).
Based on the circulatory dynamics of blood in large arteries, devices that can easily acquire a patient’s heart rate or blood pressure, etc., have been widely used. If a technology that can easily measure the hemodynamics of arterioles and capillaries could be developed, it would be convenient for use at home. Photoplethysmography (PPG) is a long-standing technology that uses the high absorbance of hemoglobin in the blood to detect changes in the blood volume by measuring changes in the amount of light transmitted or reflected through the skin; moreover, it is noninvasive and inexpensive, and attempts have been made to use it for diagnosis [15,16].
In this study, we developed a simple method to estimate the hemodynamics of arterioles and capillaries using photoplethysmography. We found clear differences in two features—that is, the 1/FWHMVPG and the time delay between the green-light a-wave peak and the near-infrared a-wave peak—between patients with diabetes and healthy subjects, for whom it could be assumed that there would be differences in microvascular hemodynamics.

2. Materials and Methods

Because the photoplethysmography sensor noise increases when the device does not adhere to the skin, we manufactured a measurement tool that could adhere to the finger. The measurement tool was used to obtain photoplethysmograms from the subjects under multiple measurement conditions with varying peripheral hemodynamics. The wrist blood pressure was also measured under each condition. We also developed a program to calculate the plurality of feature values from the photoplethysmogram, the acquired photoplethysmogram being processed using this program.
The experimental method was as follows:
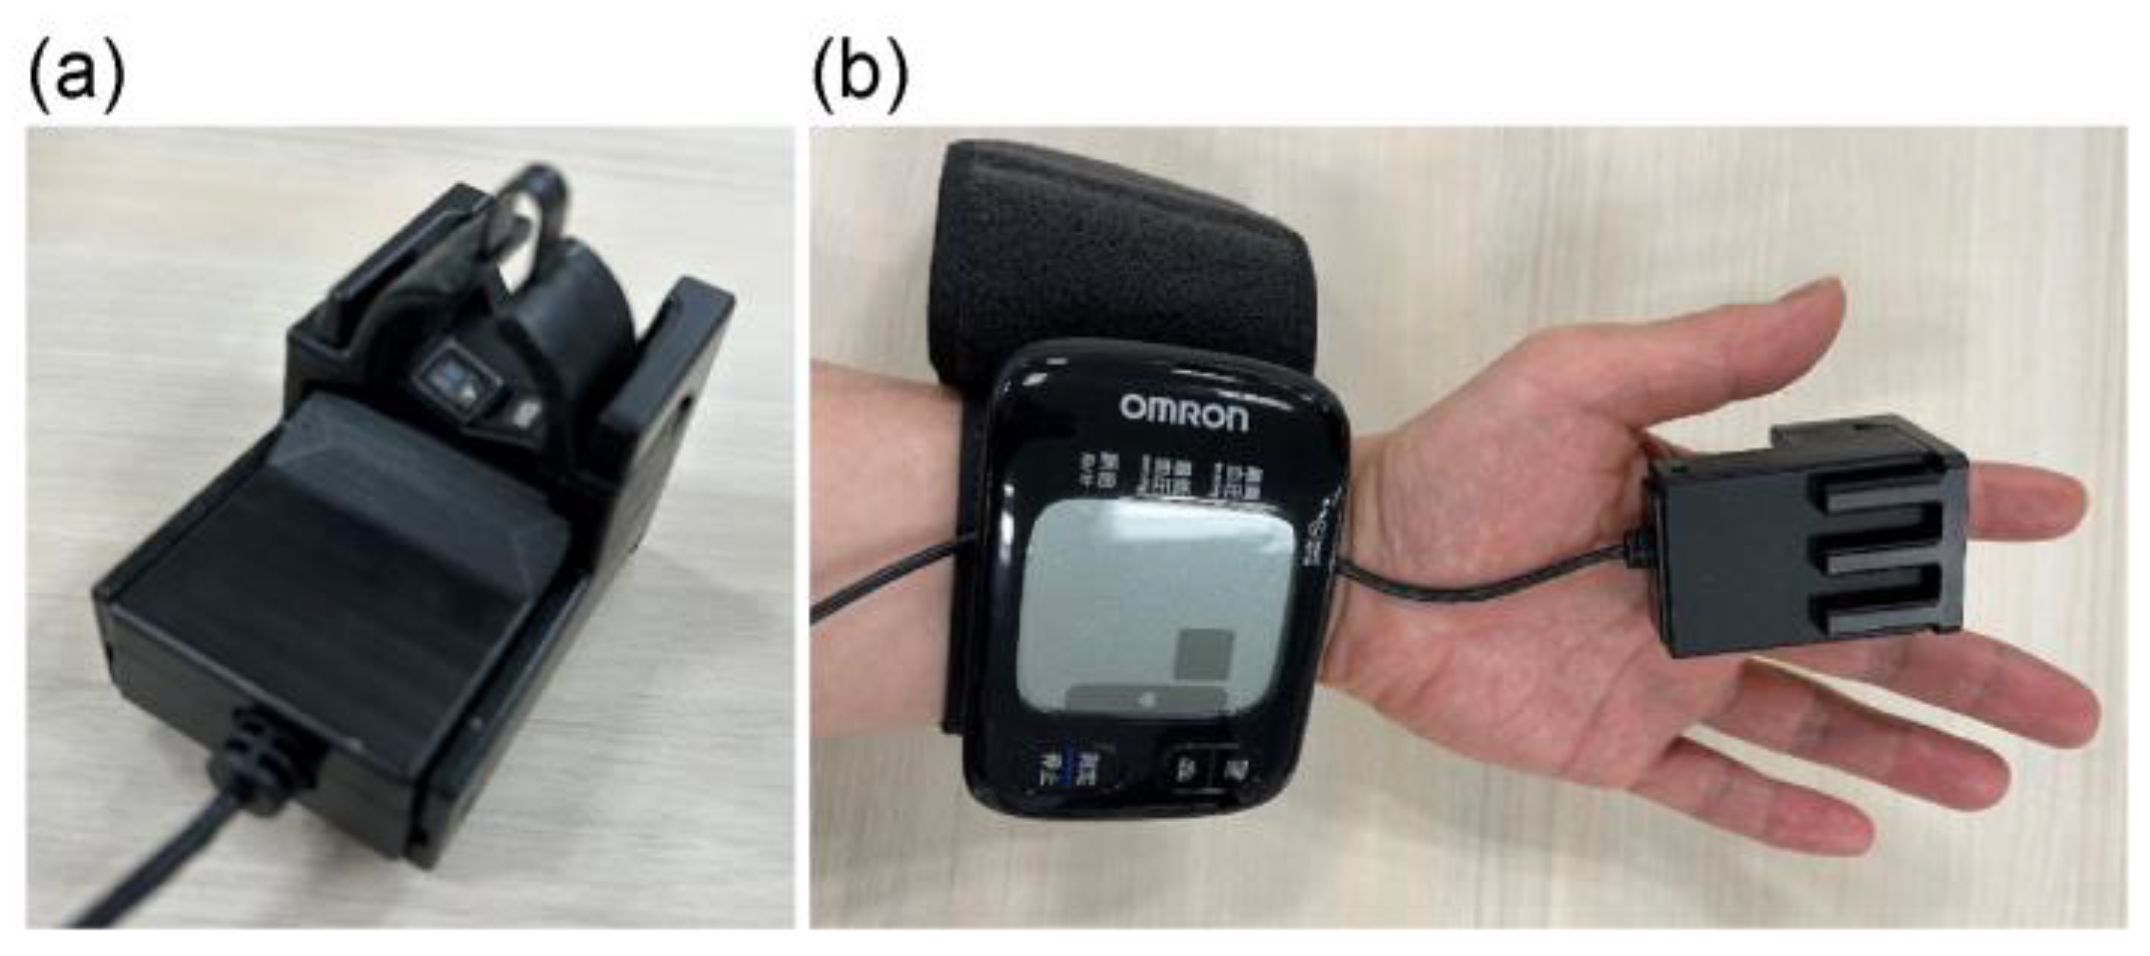
Assuming a ring-shaped device, we fabricated a finger-wearable measuring tool equipped with a photoplethysmography sensor at the base of the finger (Figure 1). To ensure that the photoplethysmography sensor adhered to fingers of different thicknesses, the sensor was pressed onto the finger using elastic silicone rubber. The photoplethysmography sensor was equipped with three LEDs as light sources, and photoplethysmograms were measured at three wavelengths—that is, green: ~525 nm, red: ~660 nm, and near-infrared: ~940 nm. A red LED was integrated to enable the calculation of oxygen saturation levels. The tool was equipped with a photodiode (PD) as a light receiver, and the three LEDs sequentially emitted in a time-division manner to irradiate the skin of the finger; the reflected/scattered light was received by the PD and AD-converted for analysis. The LED-PD distance was approximately 2 mm for green light and 10 mm for red and near-infrared light.
A wrist-cuff blood pressure monitor (OMRON HEM-6233T) was attached to the left wrist, and the proposed measurement tool was attached to the index finger of the left hand. Subsequently, in a resting seated position, the left hand (to which the measurement tool was attached) was held at navel, chest, and forehead heights, where photoplethysmograms and blood pressure measurements were taken (Figure 2). Subjects who had difficulty raising their left hand to their forehead underwent the same measurement using the right hand. Blood flow in the finger was blocked by the cuff, so photoplethysmograms could not be measured if simultaneous measurements were taken; consequently, the blood pressure was measured after the photoplethysmogram measurement had been completed.
The left elbow was then cooled using a cooling agent, while the left hand was held at chest height. Photoplethysmogram and blood pressure measurements were taken after cooling for at least five minutes. First-order (velocity plethysmogram) and second-order (acceleration plethysmogram) differentiations were obtained from the three measured photoplethysmograms, and each was divided into beats using the program developed in this study.
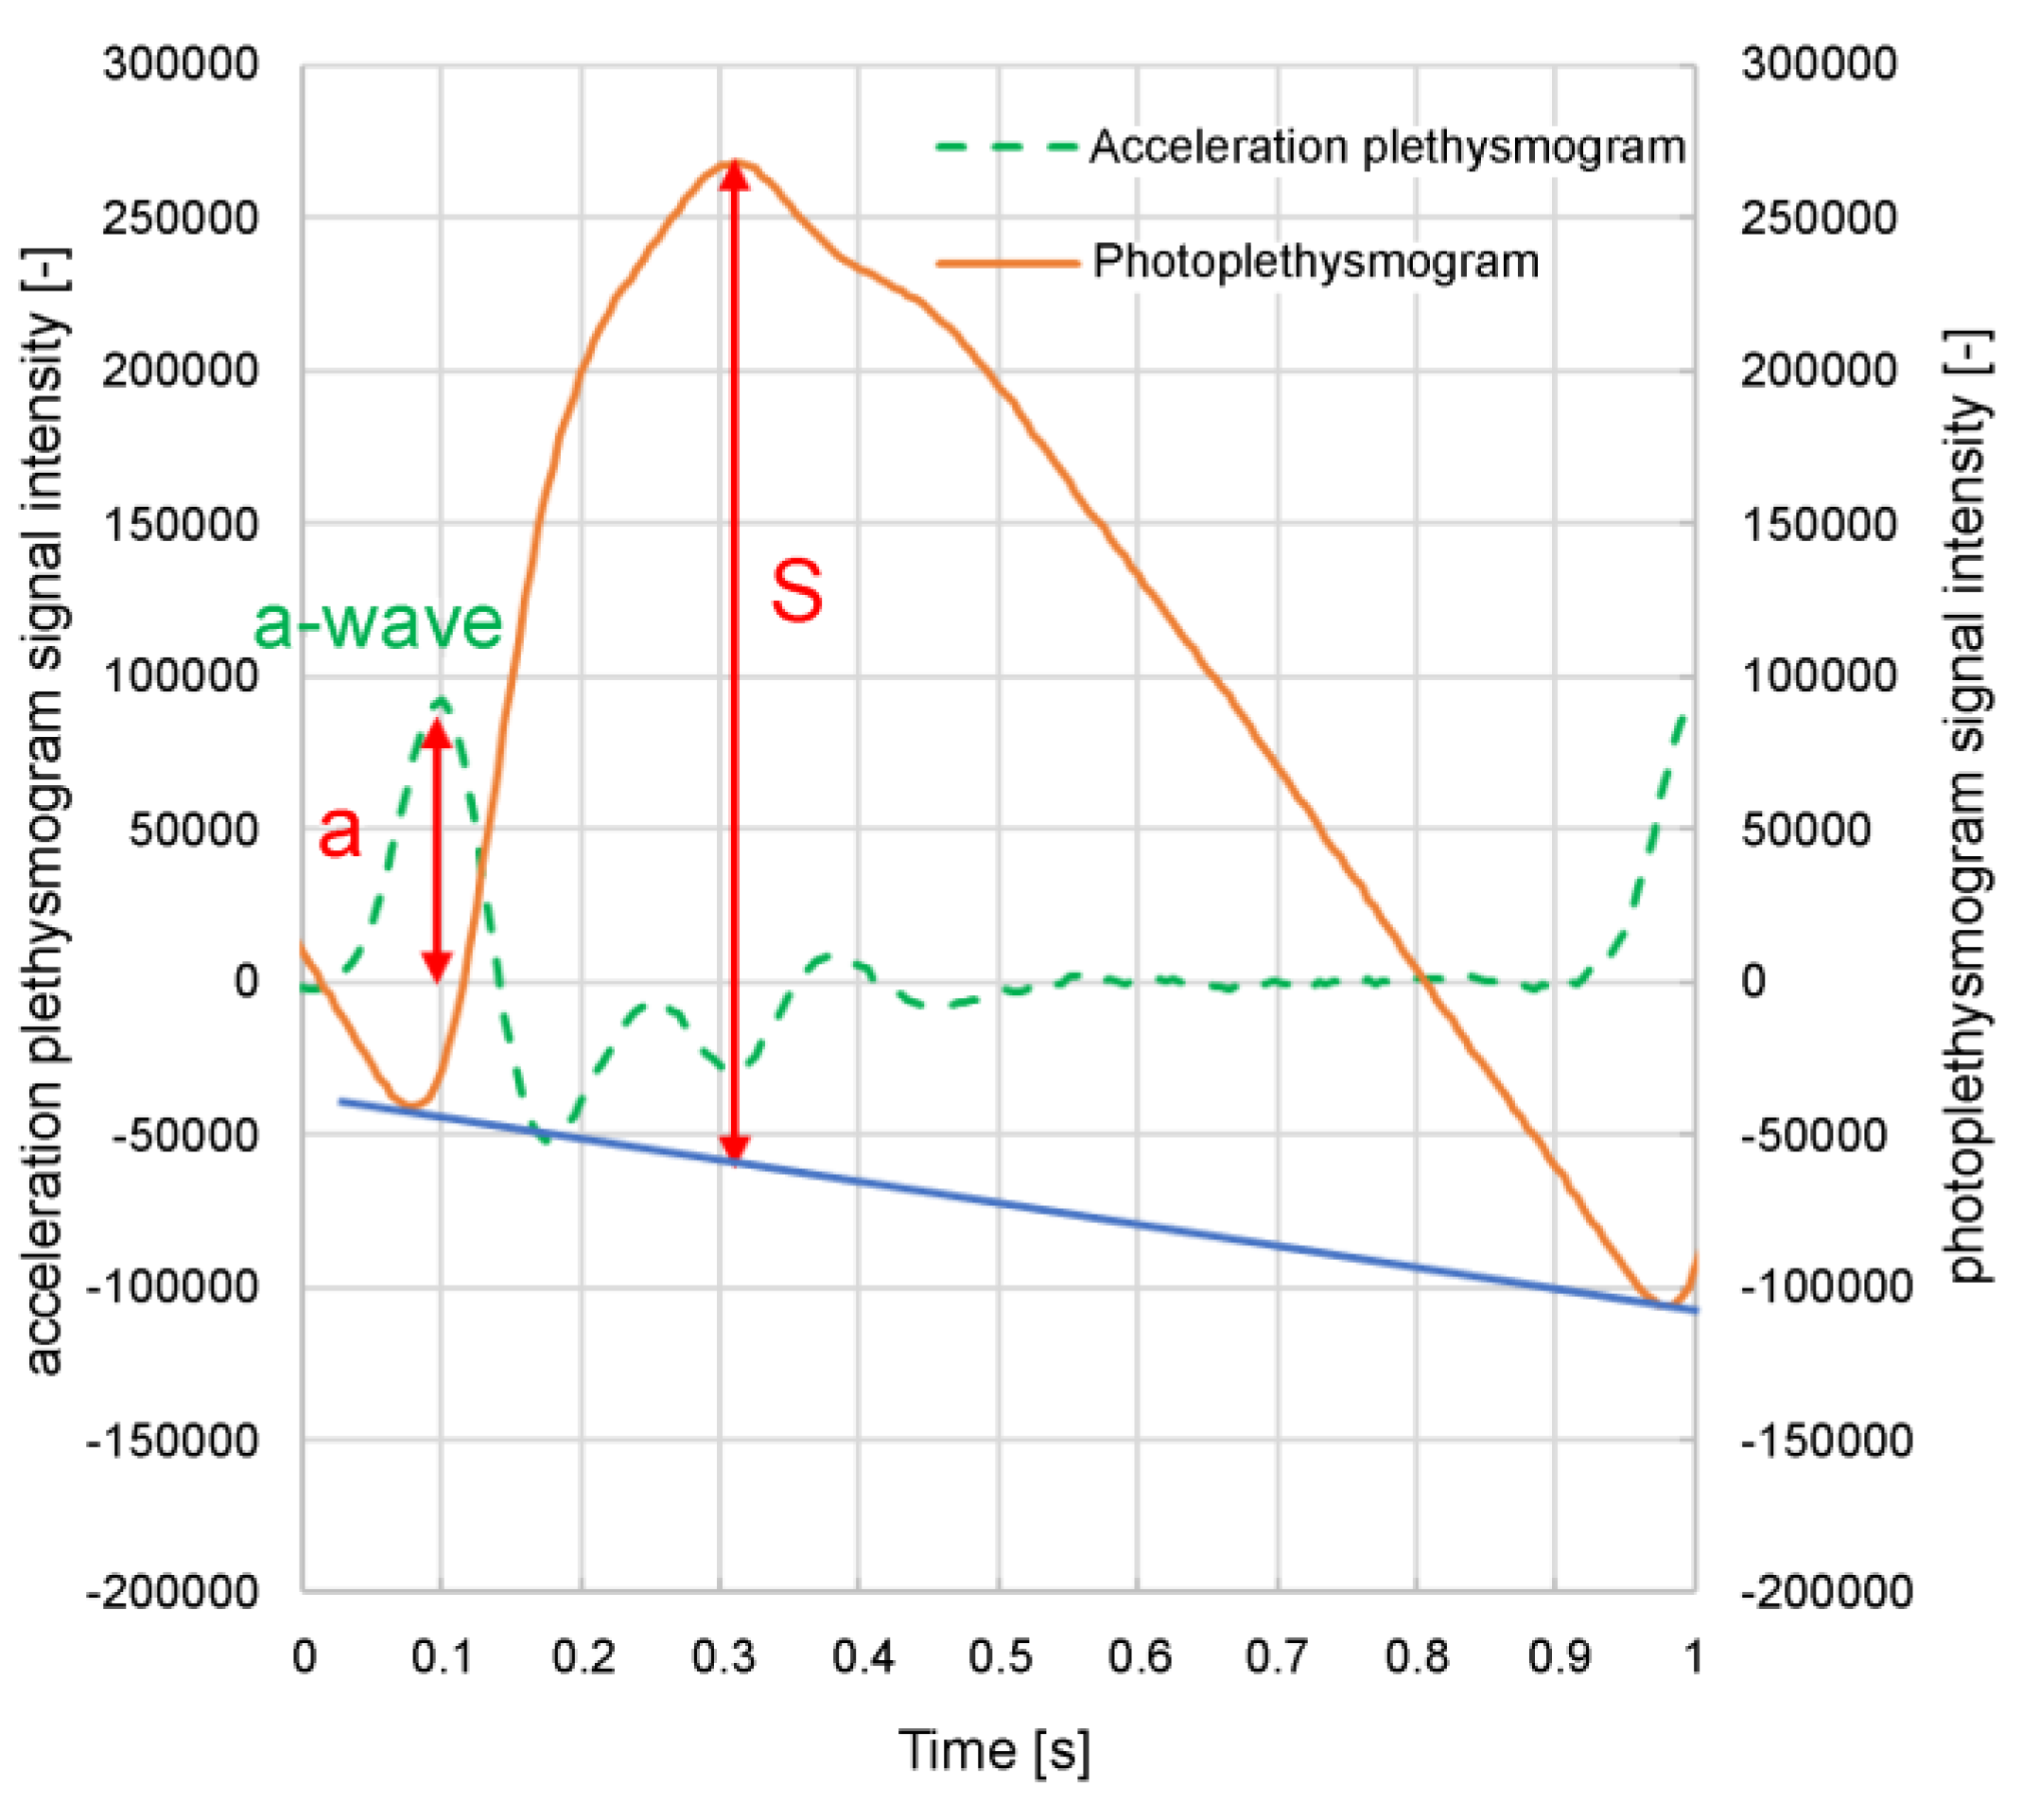
Figure 3 shows the photoplethysmogram height (S) and acceleration plethysmogram a-wave peak height (a), the solid line representing the photoplethysmogram, and the dashed line representing the acceleration plethysmogram. As shown in Figure 3, the minimum points of the photoplethysmogram are connected by straight lines, and the height of the maximum point after conducting slope correction, such that the slope of the straight line is zero, is set as the photoplethysmogram height (S).
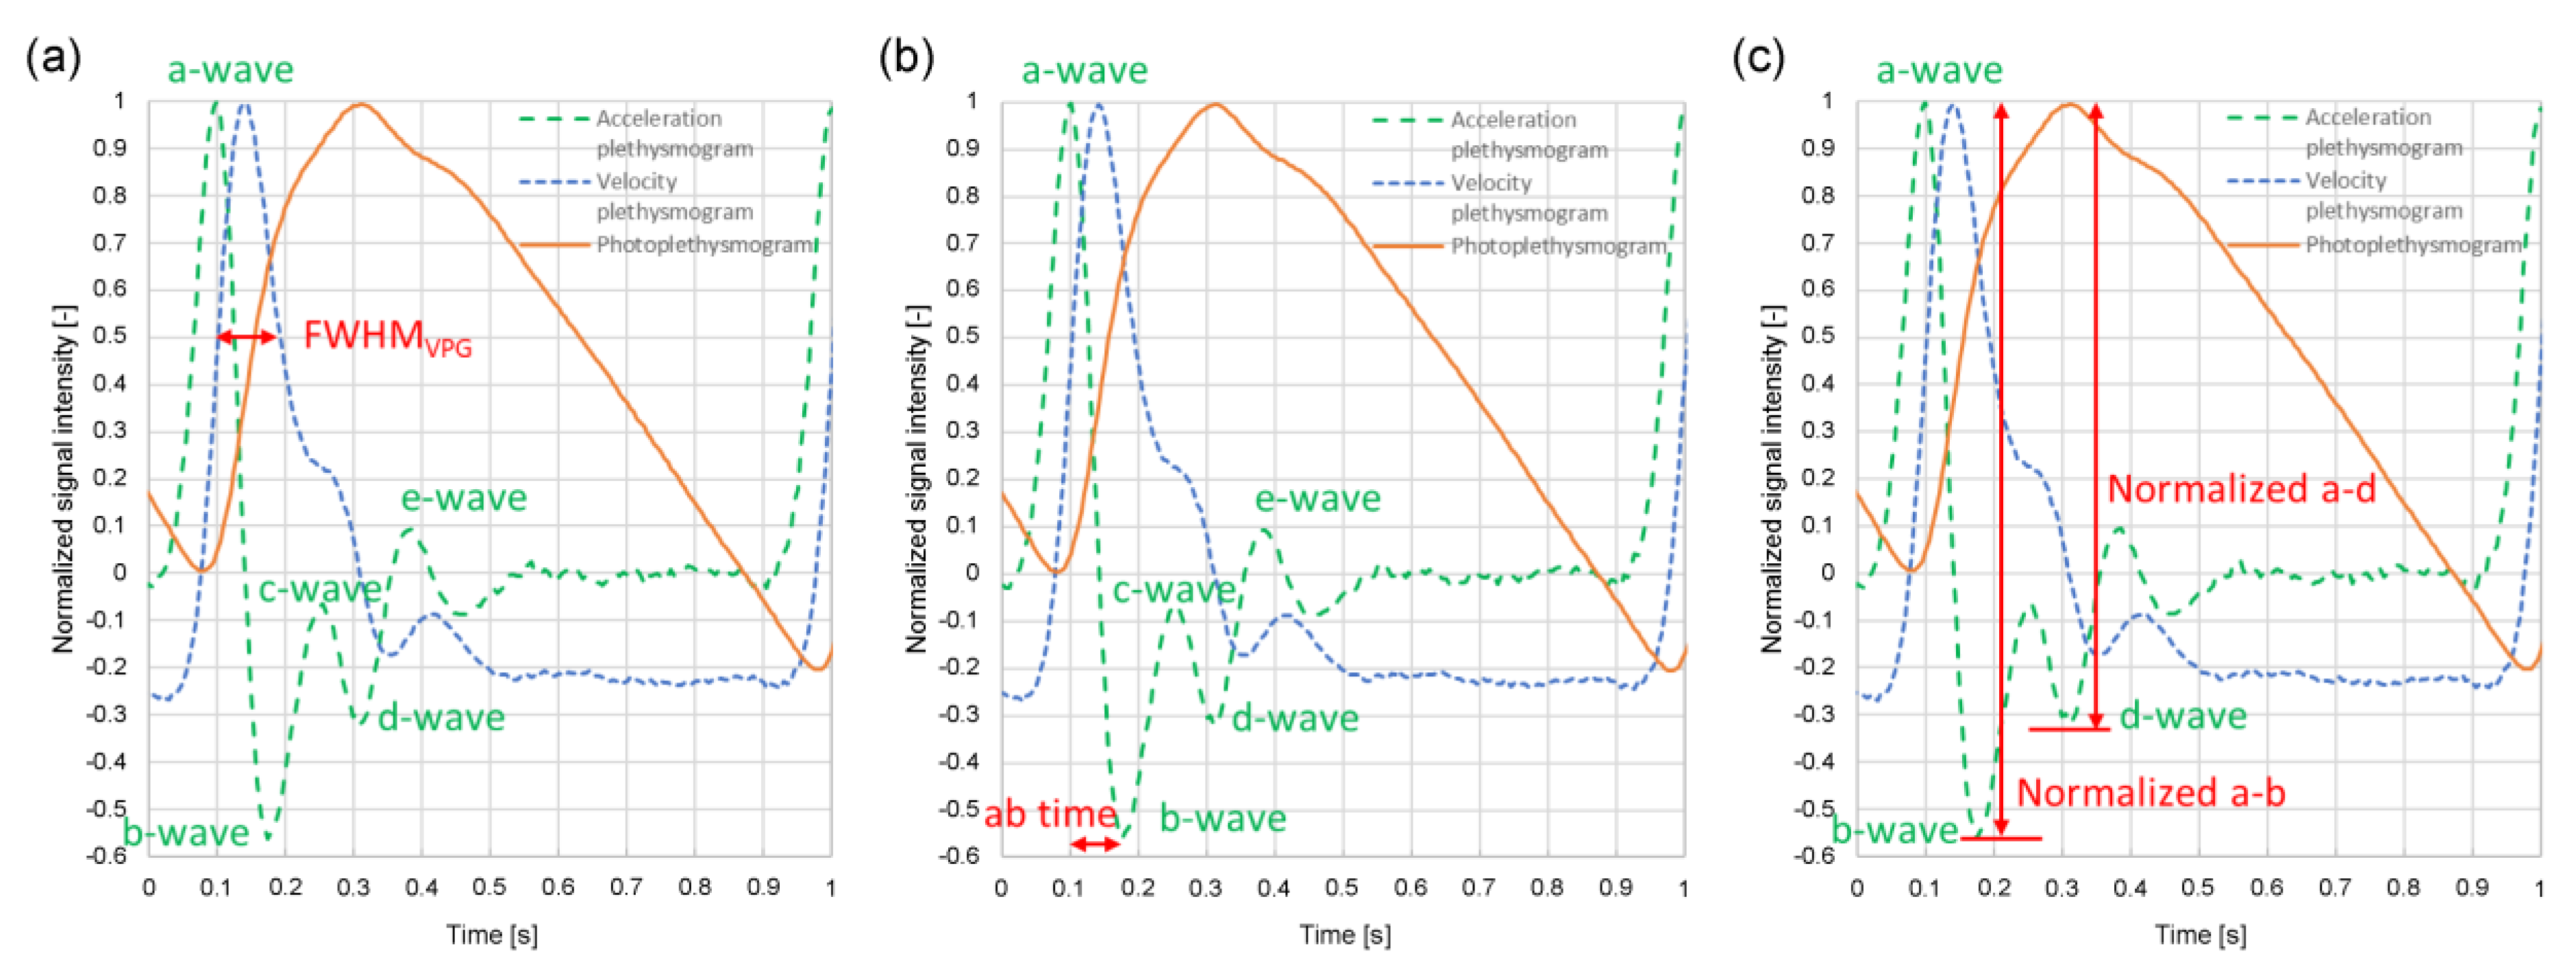
Figure 4 shows the feature values of the velocity and acceleration plethysmograms. The photoplethysmograms are shown as a solid line, the velocity plethysmograms as a dotted line, and the acceleration plethysmograms as a dashed line. Here, we refer to the half-width of the maximum peak of the velocity plethysmogram as the FWHMVPG. The acceleration plethysmogram is generally called an a-wave, b-wave, c-wave, d-wave, or e-wave; the a-, c-, and e-waves are positive peaks, whereas the b- and d-waves are negative peaks. The difference between the a-wave and b-wave peak times is called the ab time. The signal intensity at the peak apex of the a-wave to e-wave can be set as a-e, the difference between the a-wave and b-wave can be set as a-b, and the difference between the a-wave and d-wave can be set as a-d. Figure 4 shows the photoplethysmogram, velocity plethysmogram, and acceleration plethysmogram normalized such that the maximum peak is 1. The normalized values are referred to as normalized a-b and normalized a-d.

2.1. Delay Time of Green a-Wave Peak from Near-Infrared a-Wave Peak

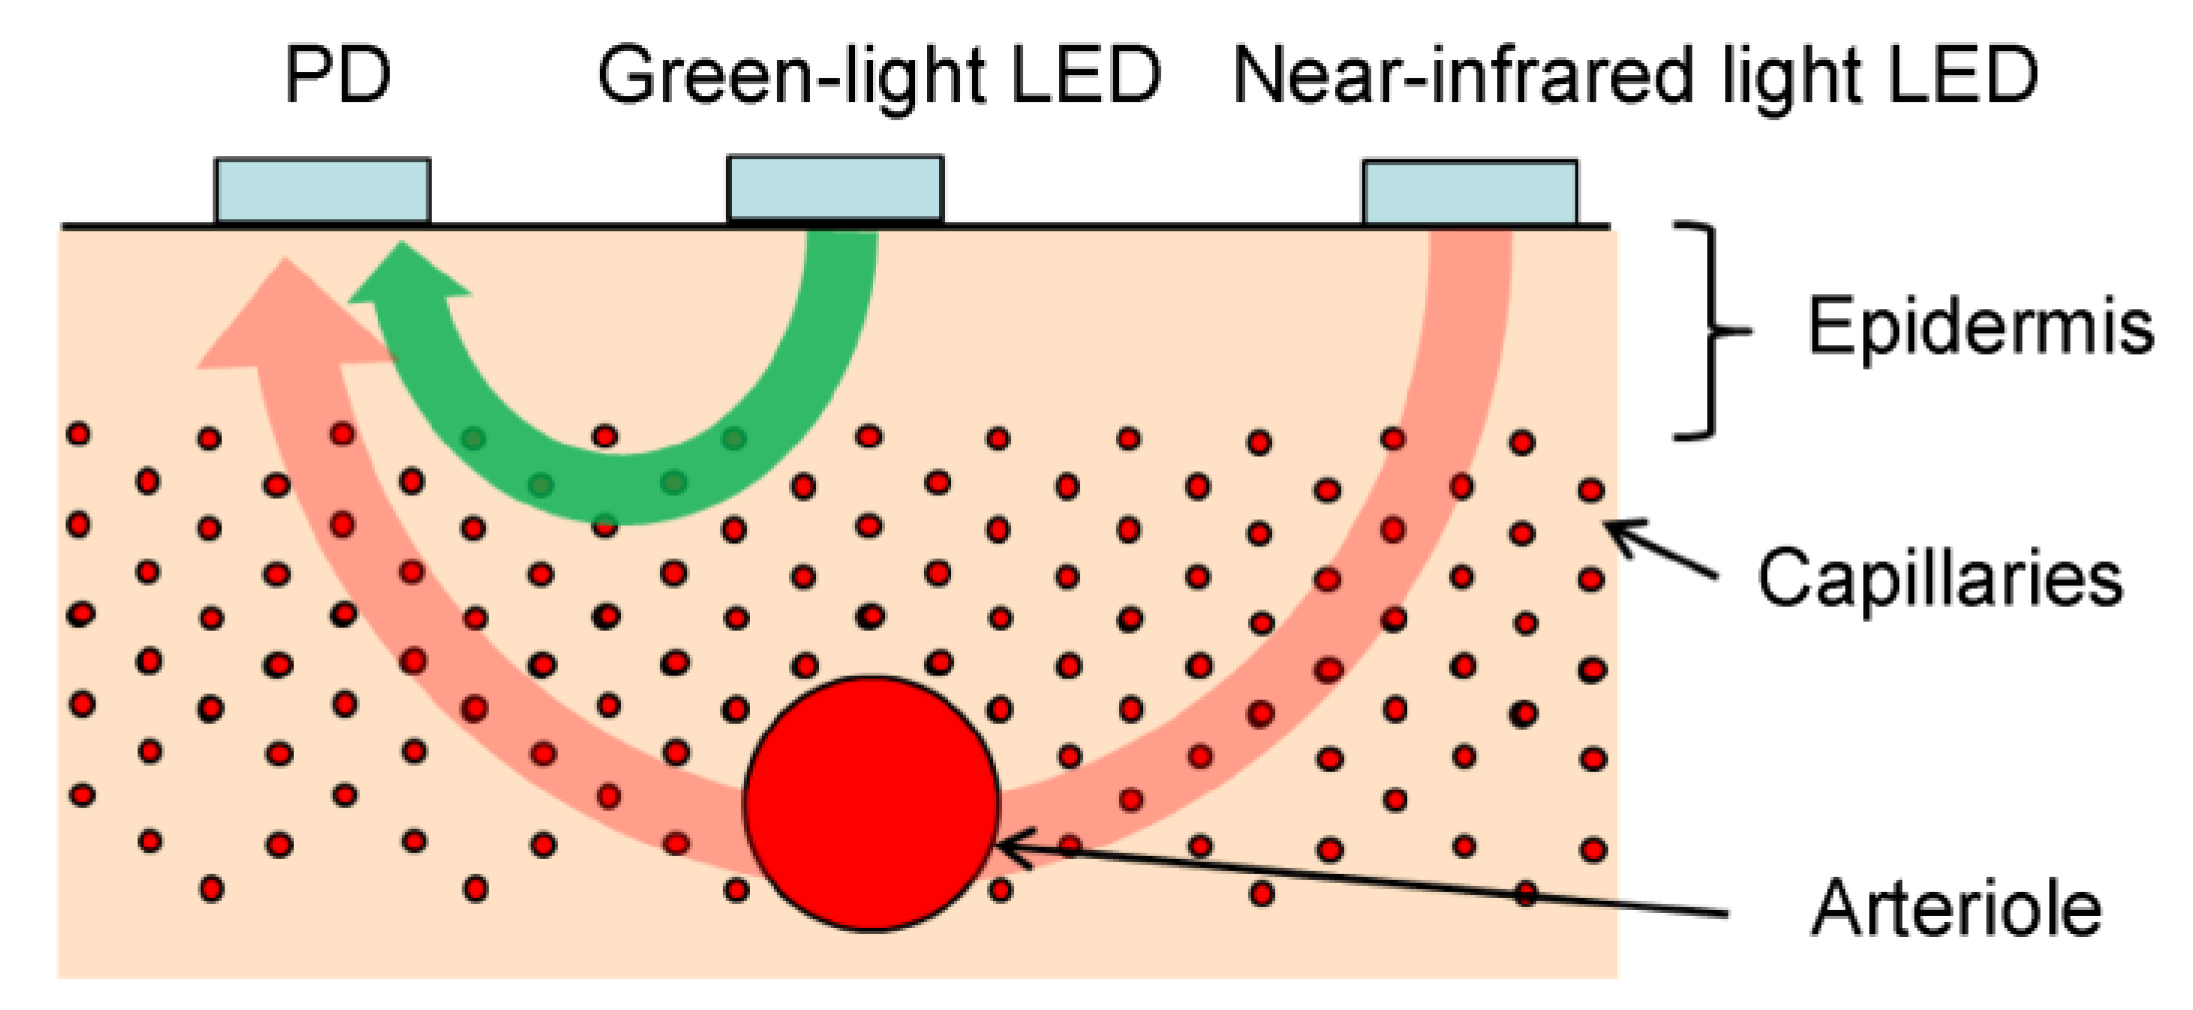
The photoplethysmograms of the near-infrared light and green light measured at the same measurement point were second-order differentiated, and their a-wave peak times were compared. The results showed that a delay occurred in the green a-wave peak relative to the near-infrared a-wave peak. It could be speculated that green light was strongly absorbed by the body, and the LED-PD distance was short (at approximately 2 mm); therefore, the information contained in the green light photoplethysmogram was mainly that of capillaries in the superficial skin area, whereas near-infrared light was relatively weakly absorbed by the body, reaching the deep skin area; therefore, the information contained included arterioles in addition to capillaries. The proposed design was such that by increasing the LED-PD distance to approximately 10 mm for near-infrared light, it would be difficult for information in superficial regions to reach the PD, and the ratio of information in deep regions would increase. In other words, the time delay between the green light a-wave peak and the near-infrared light a-wave peak corresponds to the time required for the pulse wave to reach the superficial region of the skin.
Figure 5 shows the optical paths of the green and near-infrared light received by the PD. Skin tissue is a light scatterer, and the LED light incident on the skin spreads in all directions as it is scattered within the skin. The arrows in Figure 5 do not represent the light emitted from the LED but rather the penetration depth of the light received by the PD.
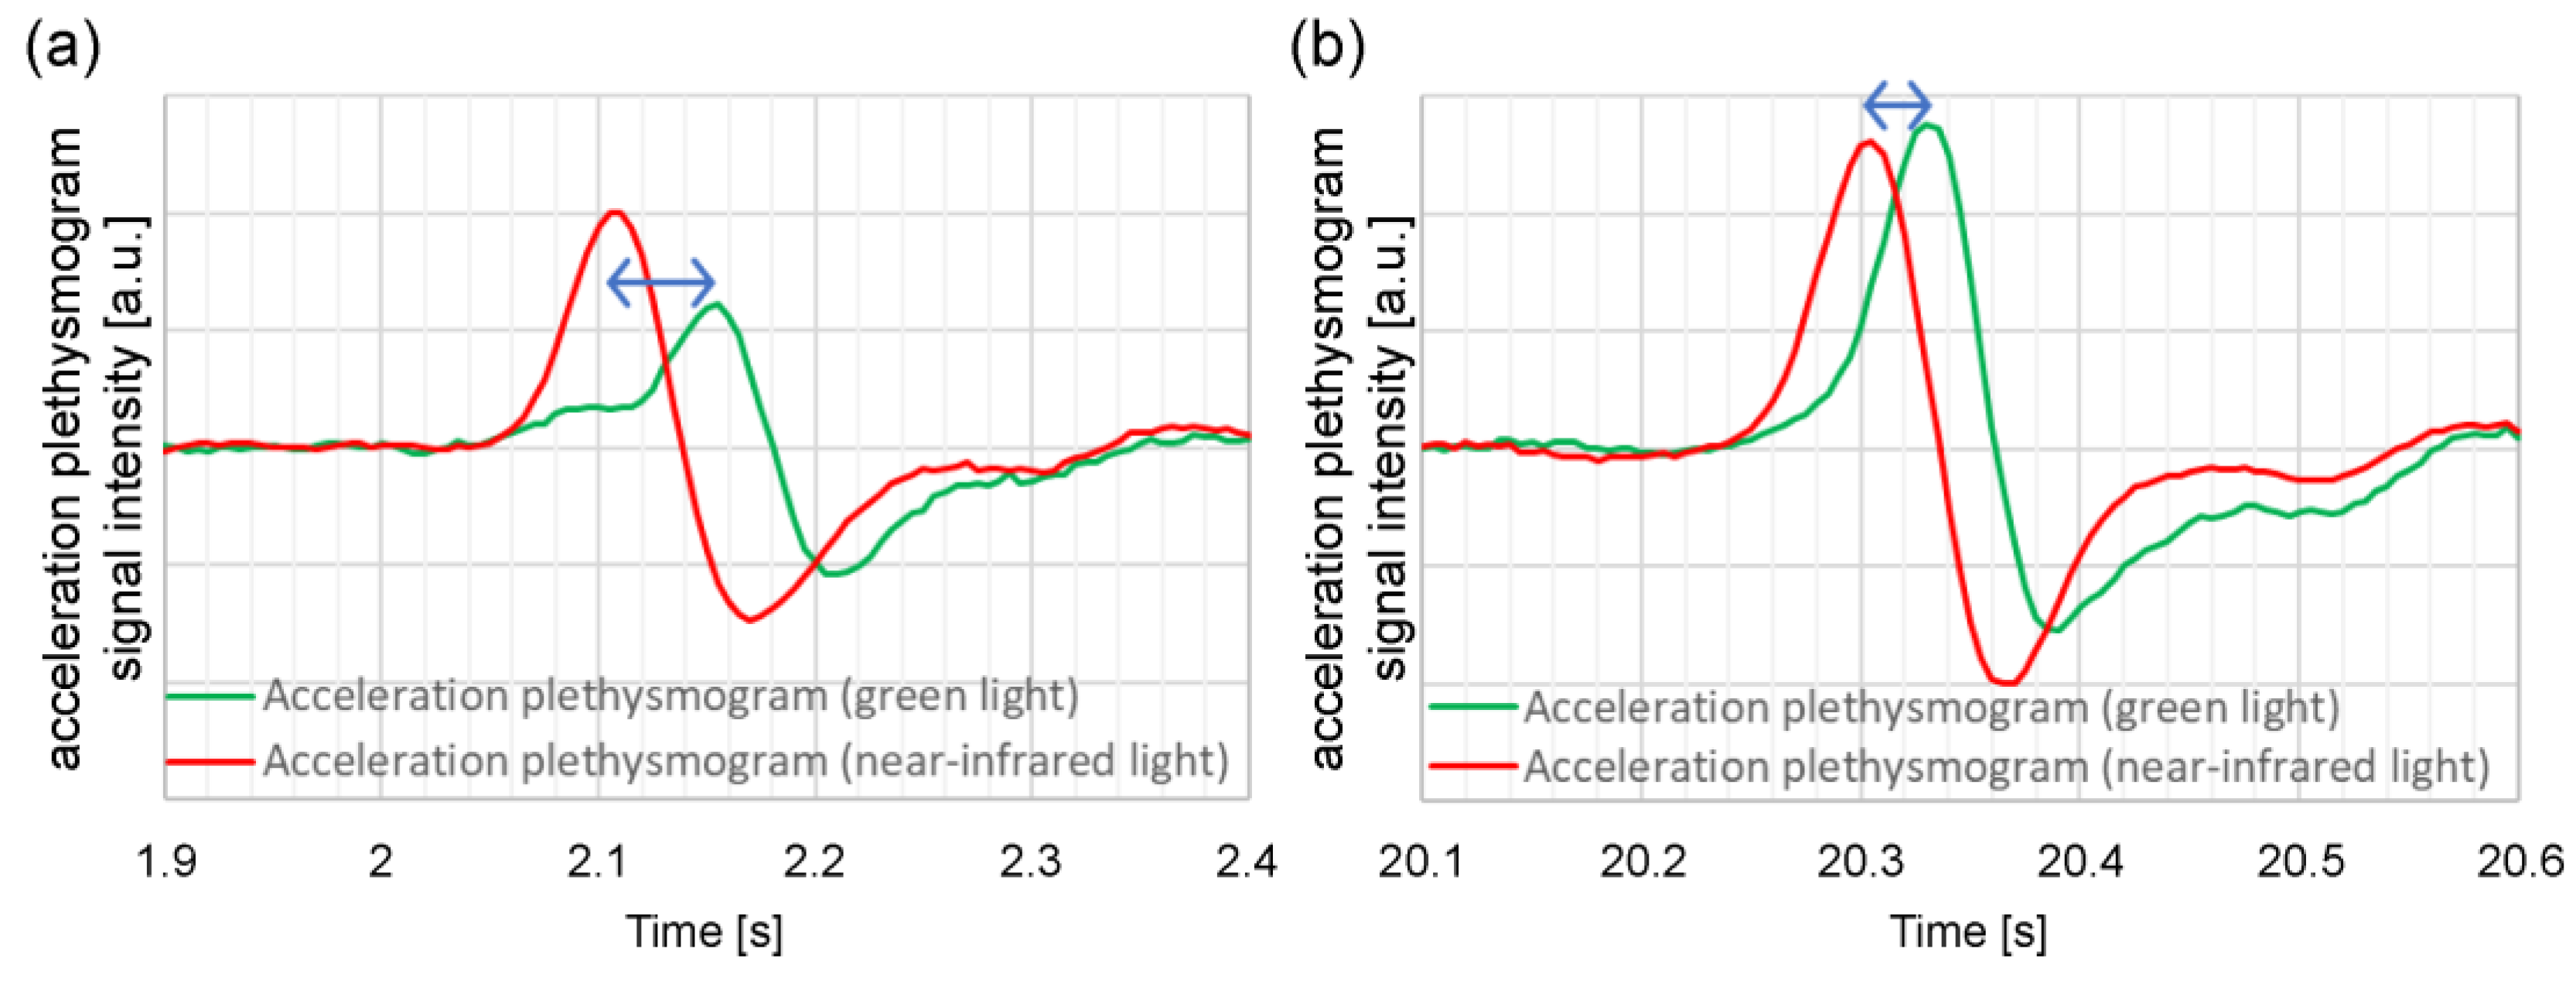
Figure 6 shows an example of an acceleration plethysmogram obtained by calculating the time delay between the green light a-wave peak and the near-infrared light a-wave peak. The peak of the acceleration plethysmogram’s maximum value is the a-wave peak, and the length of the arrow in Figure 6 represents the time delay between the green light a-wave peak and the near-infrared light a-wave peak. As shown in Figure 6, the time delay between the green light a-wave peak and the near-infrared light a-wave peak varies considerably during the measurement process; Figure 6(a) and 6(b) shows the waveforms when the time delays between the green light a-wave peak and the near-infrared light a-wave peak are large and small, respectively. When the time delay between the green light a-wave peak and the near-infrared light a-wave peak in (a) is long, the amplitude of the green light acceleration pulse is smaller than that of (b), and the waveform shape differs considerably.
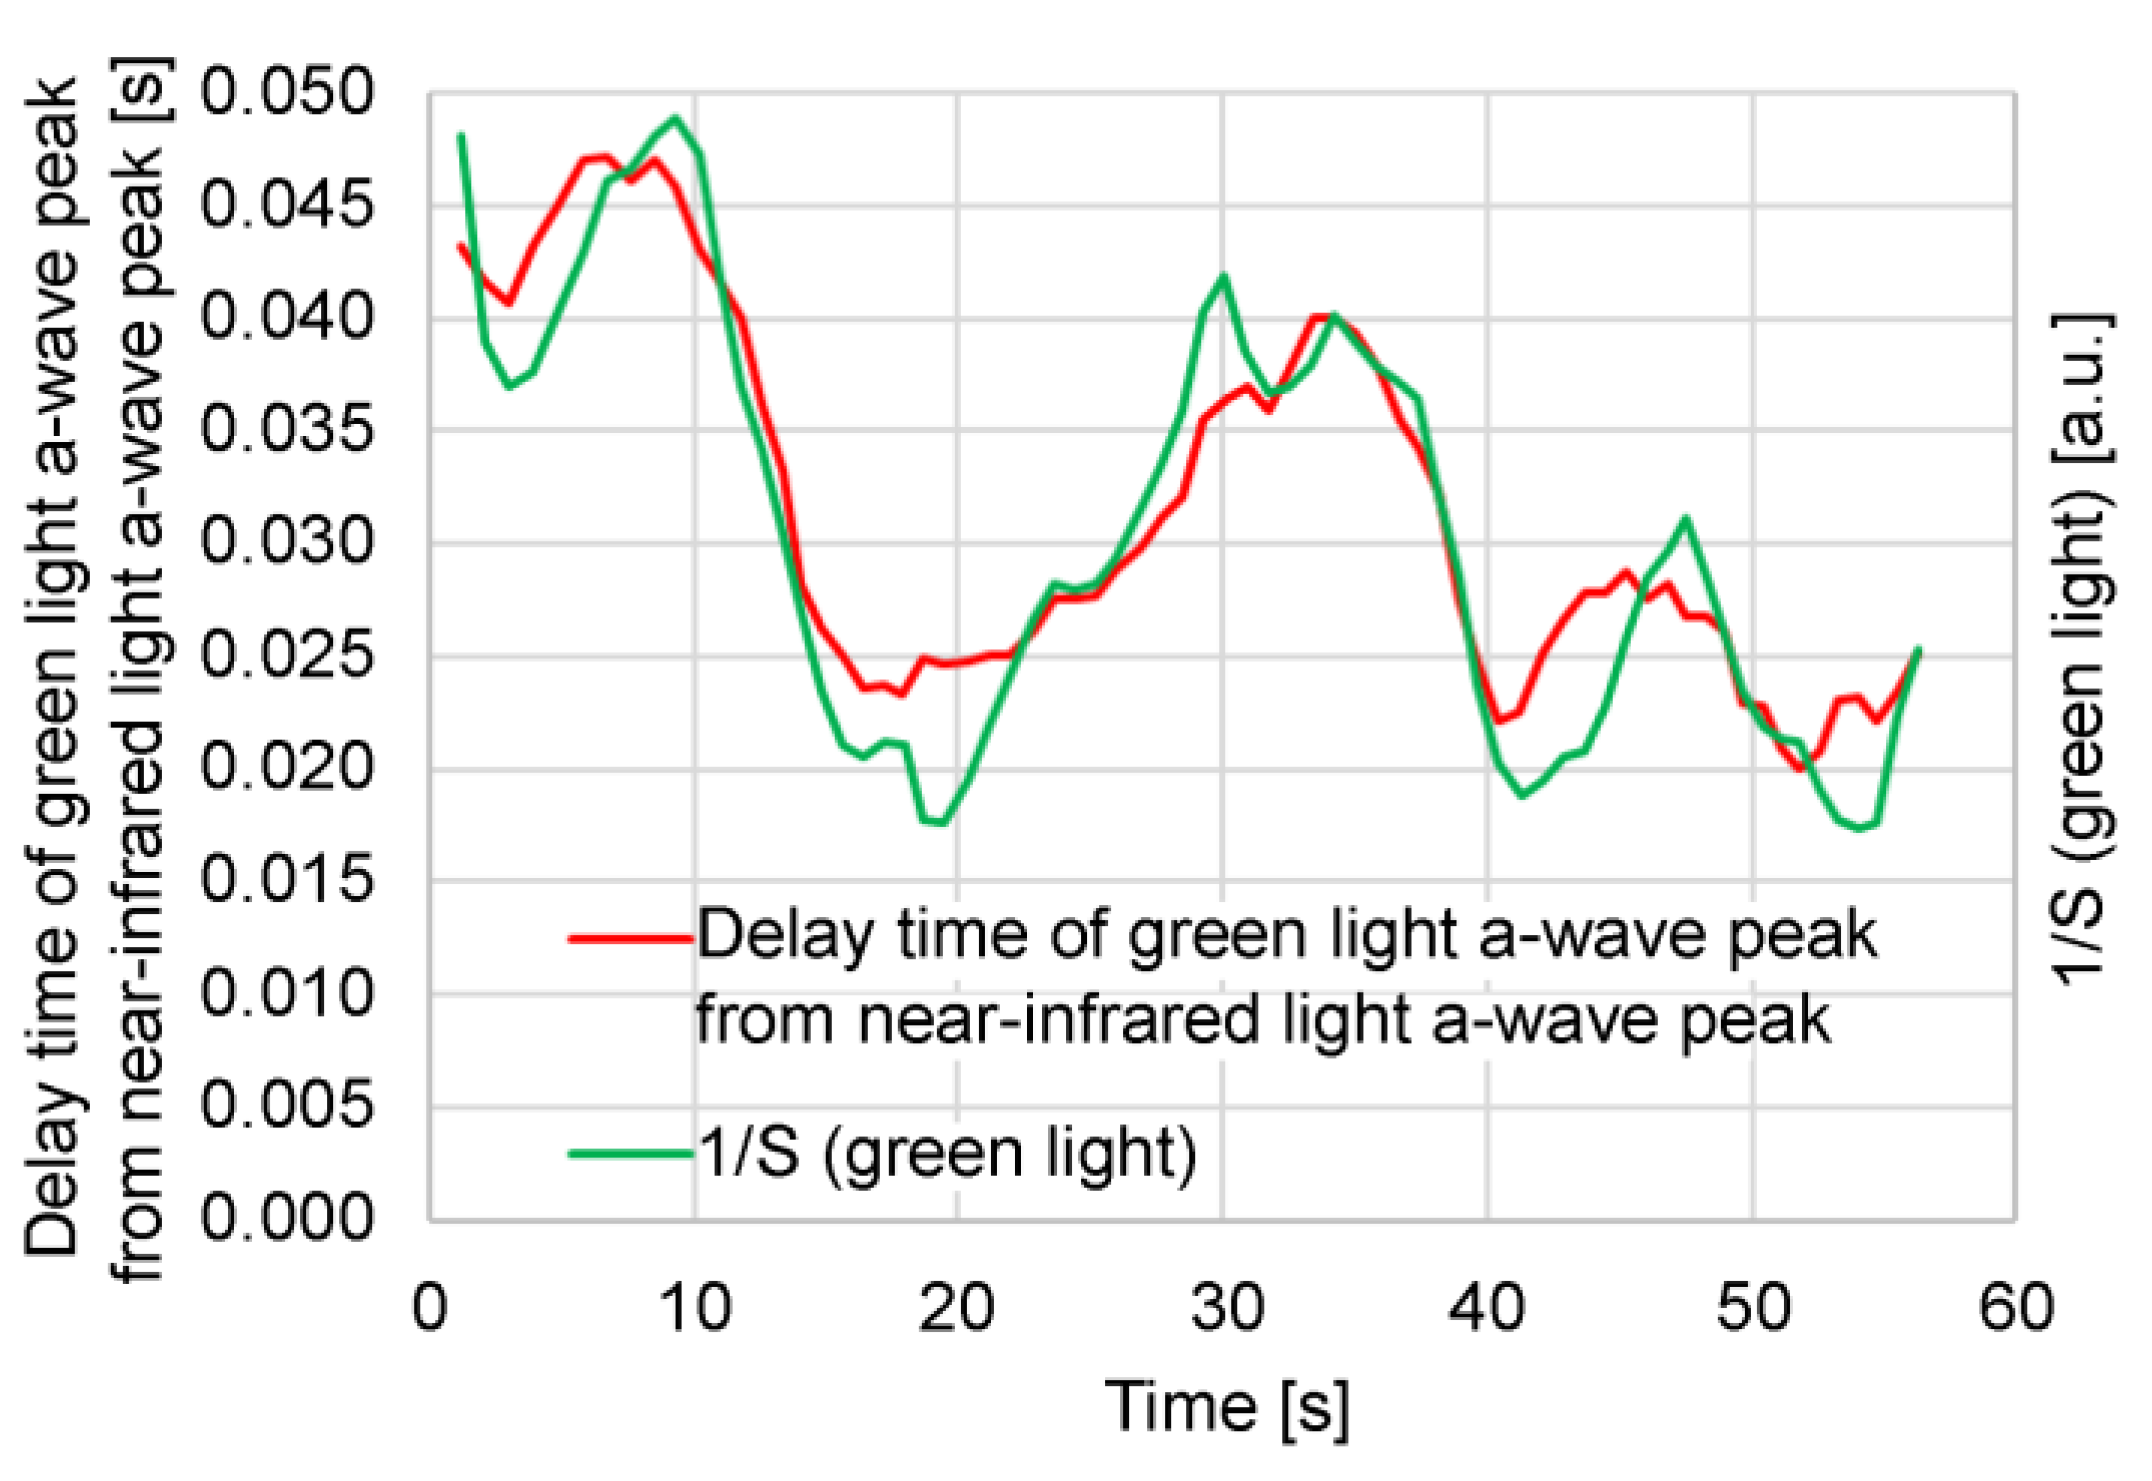
Figure 7 compares the time delay between the green light a-wave peak and the near-infrared light a-wave peak and the reciprocal (1/S) of the green light photoplethysmogram amplitude (S) in this measurement. It is evident that the time delay between the green light a-wave peak and the near-infrared light a-wave peak correlates with 1/S. A large 1/S value (i.e., a small S) signifies low blood flow. In this example, it is speculated that 1/S increases because of a decrease in capillary blood flow owing to a temporary decrease in the stroke volume. From this example, it can be speculated that the pulse wave transit time increases as the blood flow in the capillaries decreases. Additionally, the photoplethysmogram amplitude (S) varies depending on the contact state and pressure between the sensor and the skin; consequently, it can be difficult to use the absolute value of 1/S to estimate the hemodynamics of capillaries because of the variations in each measurement.
2.2./FWHMVPG
Blood pressure in large arteries is generally measured using a cuff-type sphygmomanometer; the blood pressure in blood vessels decreases as blood progresses from arteries to arterioles to capillaries [17], and the blood flow velocity decreases as it progresses from the aorta to the capillaries. The extent of the decrease in blood pressure and blood flow velocity varies depending on the measurement site, individual vascular condition (arteriosclerosis, etc.), mental condition (autonomic nerve condition, etc.), environment (temperature, noise, etc.), and clothing. Moreover, we found 1/FWHMVPG to be a feature related to hemodynamics in the arterioles and capillaries, particularly in the latter, the following two aspects being confirmed as features of 1/FWHMVPG:
  • Measurements in adult males and females who had not been diagnosed or treated for diabetes, hypertension, or cardiovascular disease showed an almost proportional relationship with wrist blood pressure under conditions where the vascular resistance did not change.
  • The value decreased when the blood vessels contracted owing to cooling in the vicinity of the measurement site. Brachial and wrist blood pressure increased in some cases.
In addition to the feature values of features (1) and (2), the following three feature values were found:
a/S;
(a-b)/(a-d);
1/ab time.
Here, a/S is the acceleration plethysmogram a-wave peak height (a) divided by the photoplethysmogram height (S) (Figure 3); (a-b)/(a-d) are the normalized a-b divided by the normalized a-d (Figure 4); and 1/ab time is the difference between the a- and b-wave peak times (Figure 4). These feature values, including 1/FWHMVPG, are related to the sharpness of the increase in the photoplethysmogram waveform.
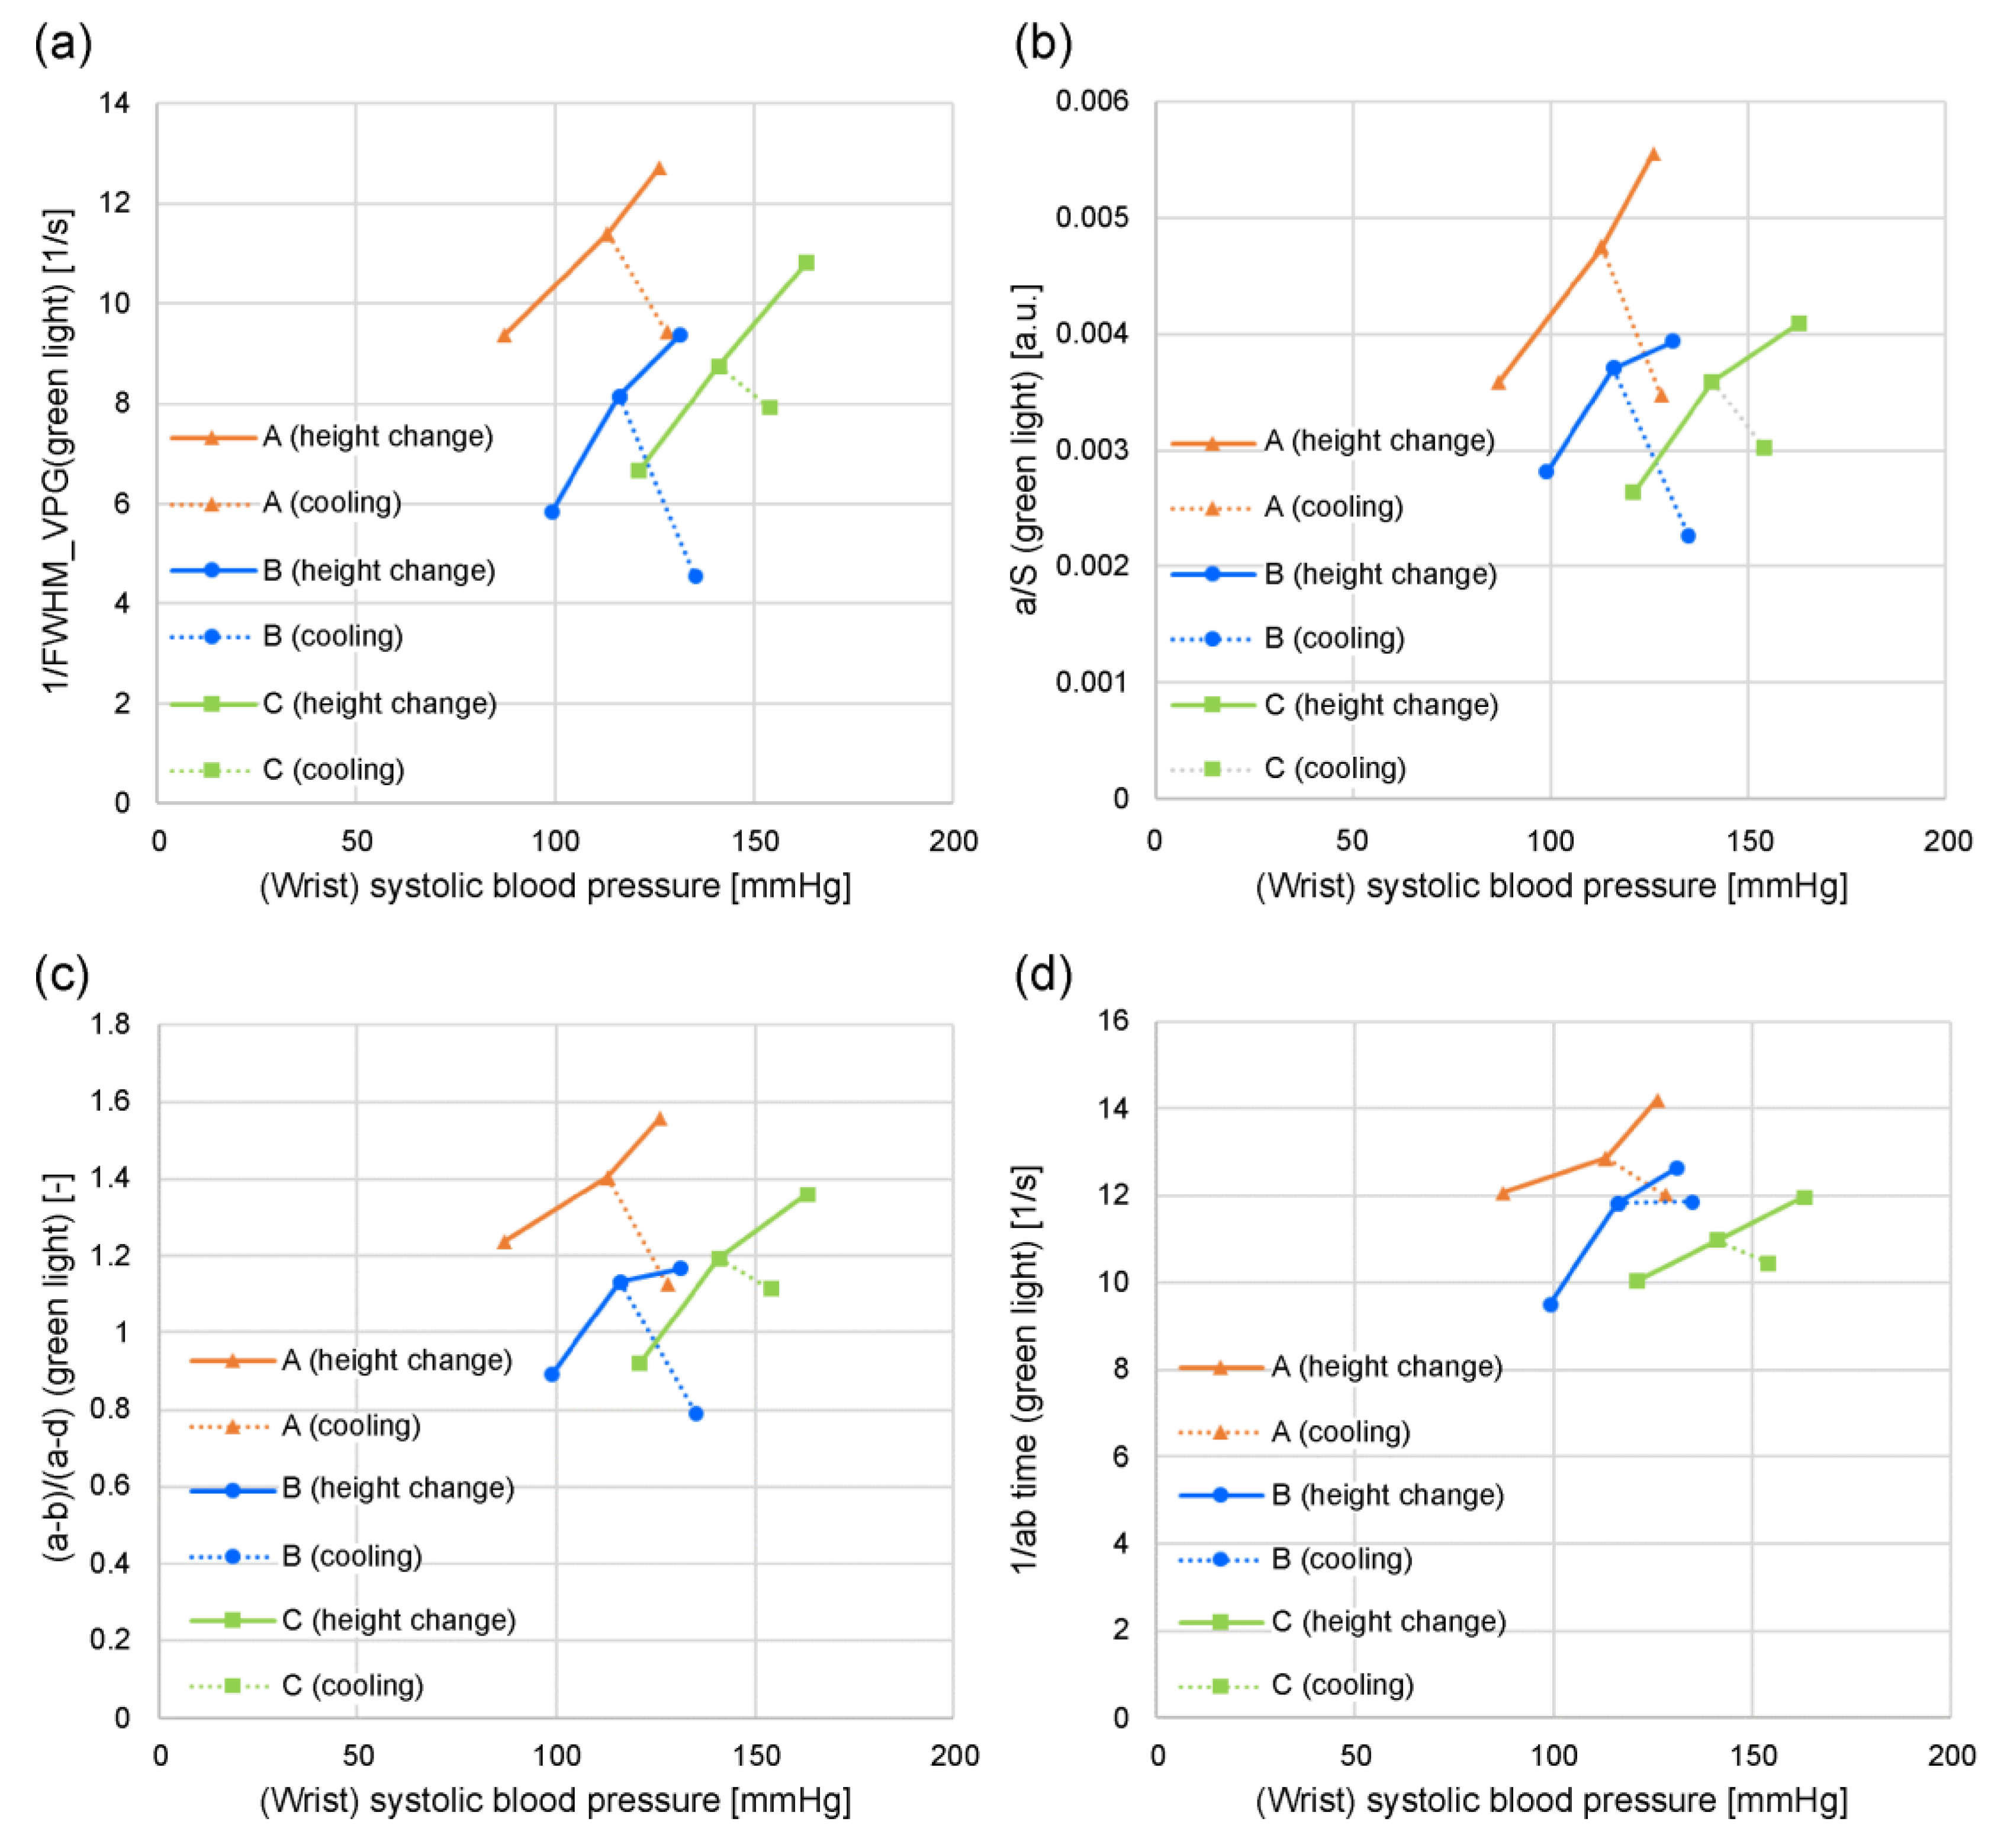
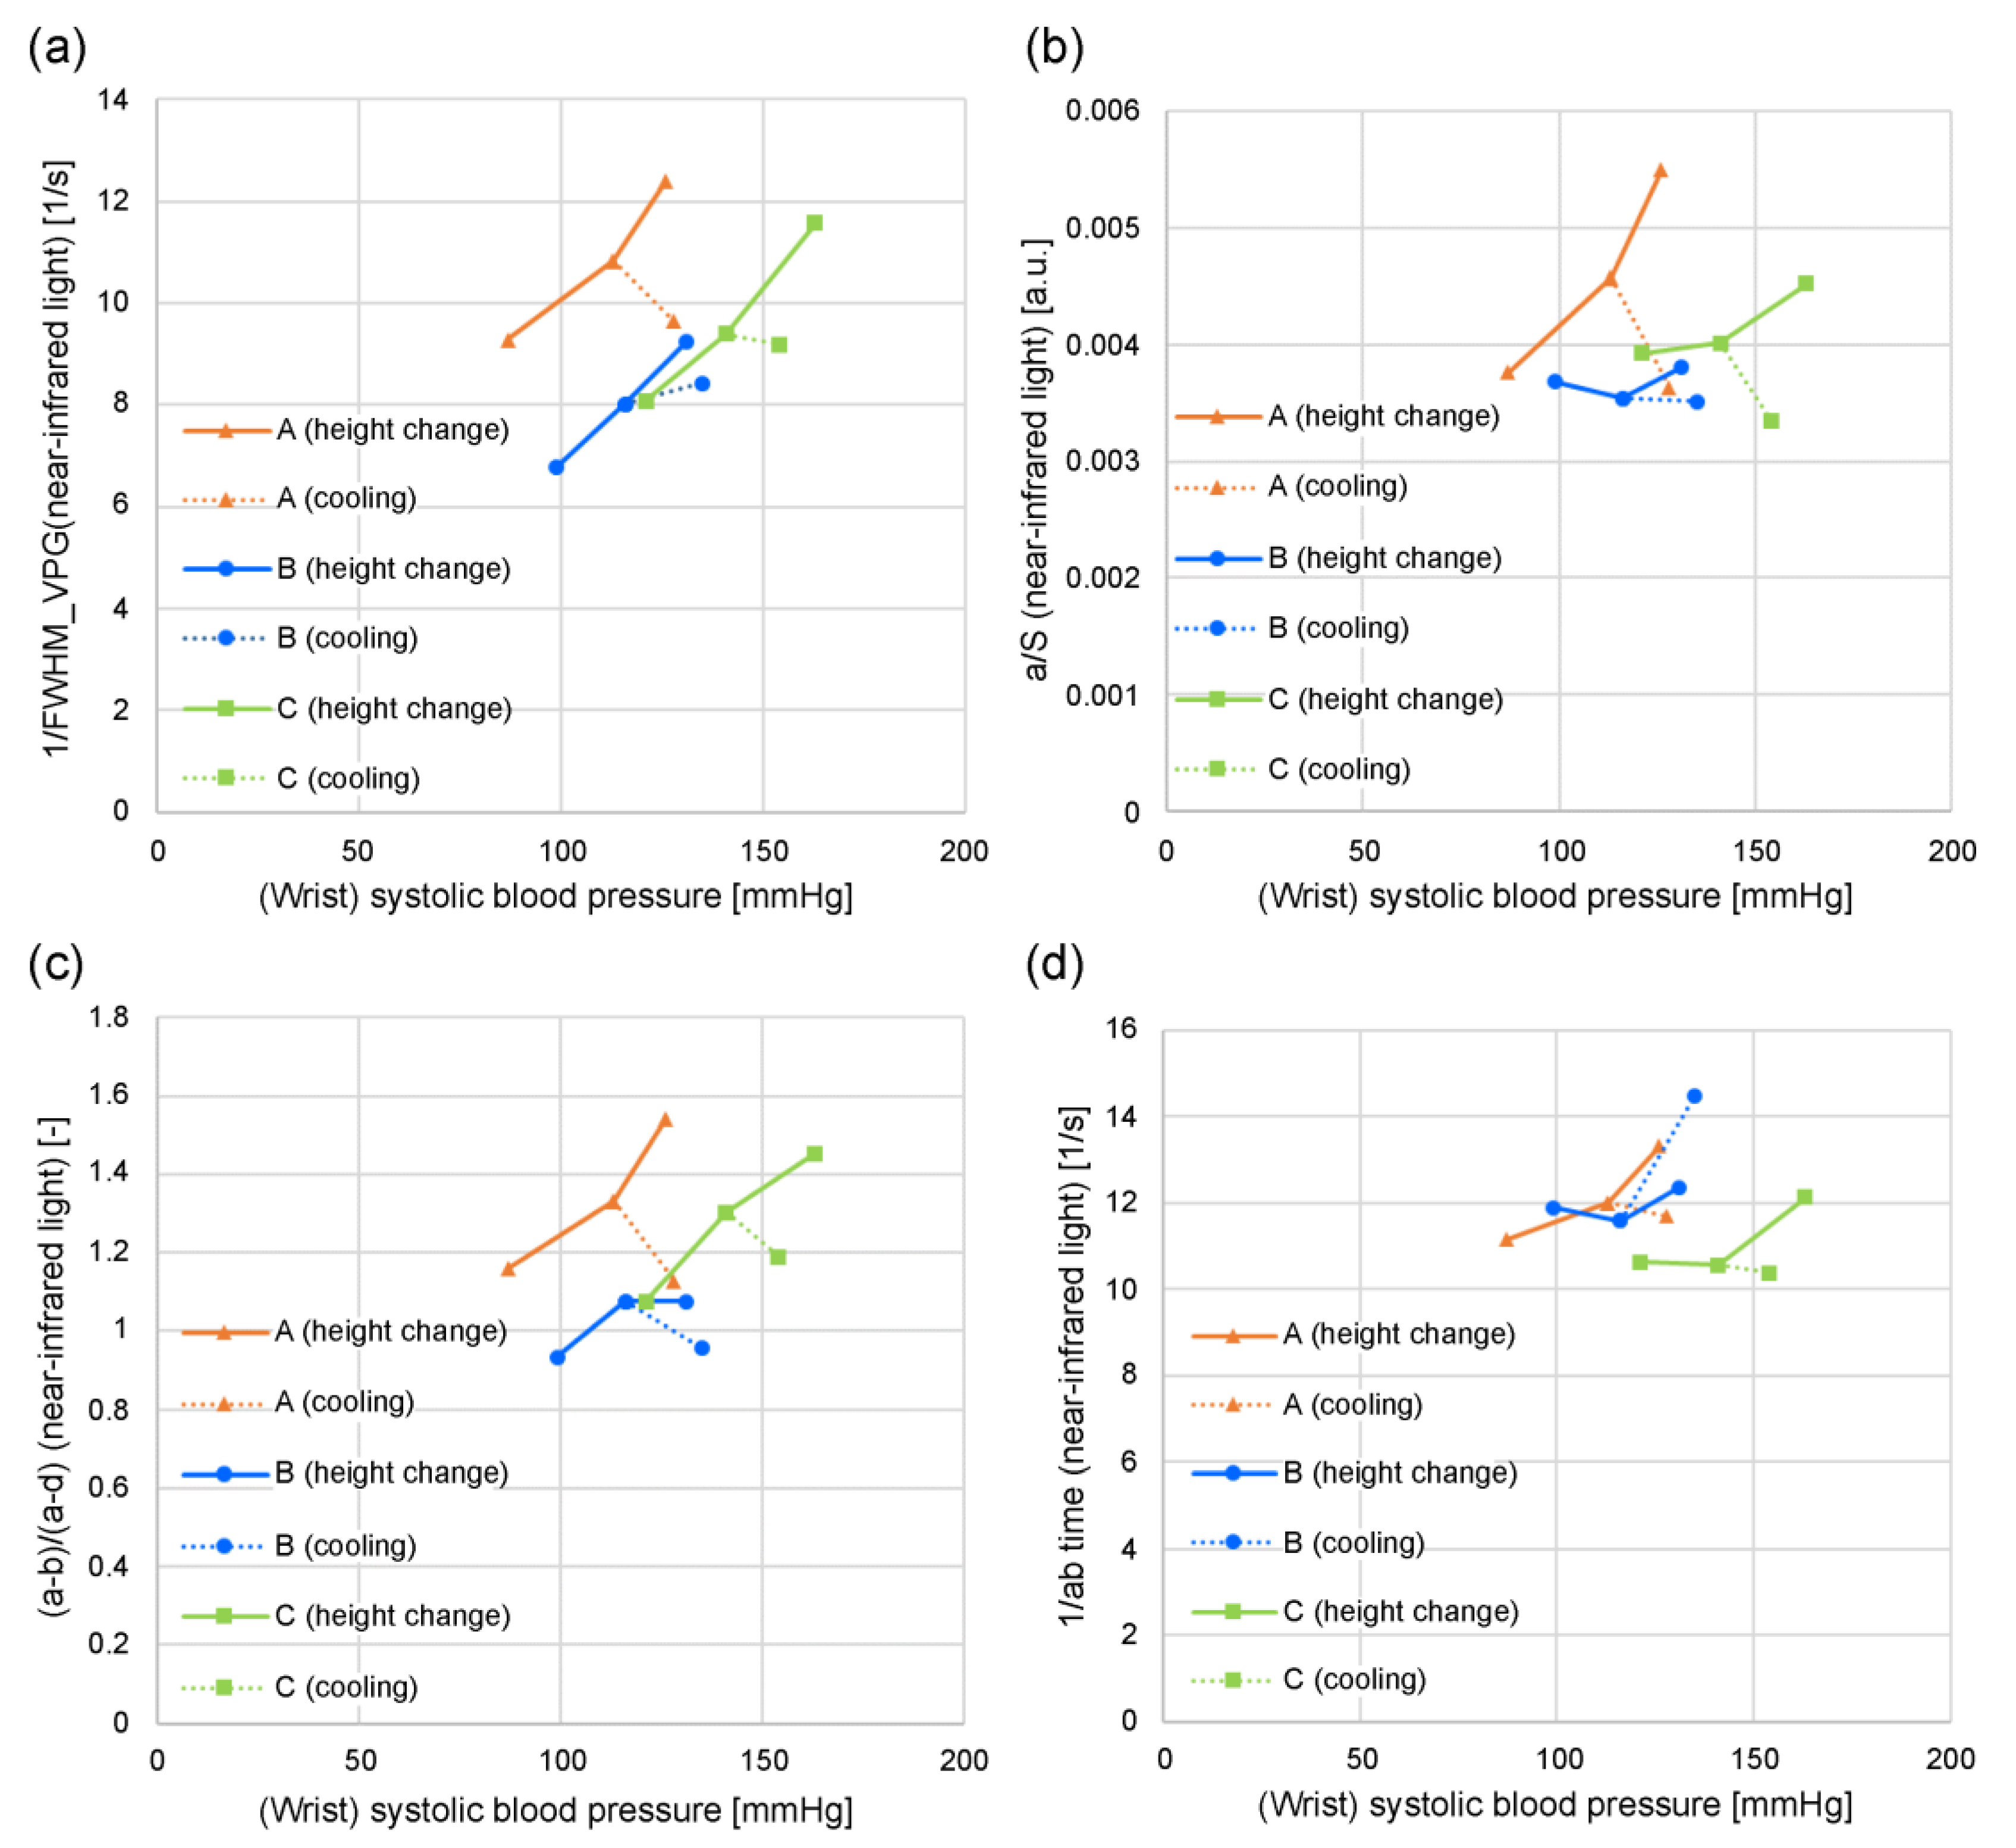
Figure 8 and Figure 9 show the relationship between the wrist systolic blood pressure and each feature value in adult men and women who have not been diagnosed and treated for diabetes, hypertension, or cardiovascular disease when changing the height of the measurement site (finger) from the heart, when the area near the elbow of the arm on the side where the finger is located (that is, the measurement site at chest height) is cooled (plotted for subjects A, B, and C). The orange line denotes subject A, the blue line denotes subject B, and the green line denotes subject C. Figure 8(a) shows 1/FWHMVPG (green light), Figure 8(b) shows a/S (green light), Figure 8(c) shows (a-b)/(a-d) (green light), Figure 8(d) shows 1/ab time (green light), Figure 9(a) shows 1/FWHMVPG (near-infrared light), Figure 9(b) shows a/S (near-infrared light), Figure 9(c) shows (a-b)/(a-d) (near-infrared light), and Figure 9(d) shows 1/ab time (near-infrared light).
As shown in Figure 8(a)–8(c), the wrist systolic blood pressure and each feature value tend to be proportional when the height changes (solid line). It is also evident that cooling reduces each feature value and increases the systolic blood pressure of the wrist (dashed line).
Compared with Figure 8(a)-8(c), Figure 8(d) 1/ab time exhibits less dependence on the wrist systolic blood pressure.
Figure 8(a)–8(d) shows the feature values calculated from the photoplethysmogram measured by the green light LED, and the results of the feature values calculated from the photoplethysmogram measured by the near-infrared light LED are shown in Figure 9(a)–9(d). The aforementioned trends are unclear, especially in subject B in Figure 9(b)–9(d), when compared to those for the green light.
Figure 10 shows that the above feature values are related to the steep increase in the photoplethysmogram waveform. Figure 10 shows examples of waveforms with different rising slopes in the photoplethysmograms. Of the two photoplethysmogram waveforms shown in Figure 10(a), the solid line increases sharply (slope: large). As shown in Figure 10(b), 1/FWHMVPG and a/S change, and Figure 10(c) (a-b)/(a-d) and 1/ab time change, it being evident that in both cases the waveforms with large slopes have considerably larger feature values related to the sharp rise of the photoplethysmogram waveform. However, for (a-b)/(a-d), the ratio of “slope: small” to “slope: large” is slightly different compared to other feature values. This is because (a-b)/(a-d) includes the features of the d-wave; consequently, it is a feature value that includes information other than the steepness of the rising slope.
The 1/FWHMVPG value acquired with the green light is more applicable to features (1) and (2). It can be speculated that this is because green light has a high bio-absorption rate and is absorbed before reaching the deep skin regions, resulting in only superficial region information being included (i.e., only capillary information). Similarly, near-infrared light includes not only information on capillaries but also information on arterioles; therefore, it can be speculated that it is susceptible to measurement conditions and individual differences.
Of the four feature values, a/S and (a-b)/(a-d) are susceptible to pressure and body motion noise because the values b, d, and S are more susceptible to them. Furthermore, (a-b)/(a-d) contains d-wave information other than the rising slope. Additionally, the 1/ab time value tends to be less dependent on the wrist systolic blood pressure. Consequently, it can be speculated that the extent of matching with features (1) and (2) is lower for other feature values than for 1/FWHMVPG (green light).
The following section presents the experimental results, with a focus on two feature values—that is, the time delay between the green light a-wave peak and the near-infrared light a-wave peak, and 1/FWHMVPG (green light).
The use of LEDs or lasers with wavelengths in the vicinity of blue to yellowish-green light (in the vicinity of 500–550 nm)—which are highly absorbed by the body—is suitable for acquiring information on shallow skin regions. Furthermore, the distance between the light source and light receiver should be as short as possible, specifically 1–3 mm.
The measurement sites of the photoplethysmogram included the wrist, neck, face, and ear, although the fingers are preferable, as the epidermis of the finger is relatively thin, making it easier to measure photoplethysmograms, the paths from the arterioles to the capillaries are less complicated than those of the face, and the values of each feature tend to be stable.
A ring-shaped wearable device equipped with an optical sensor worn on a finger is suitable for measuring photoplethysmograms, as there is little discomfort during continuous and intermittent measurements, even when worn for long periods.
3. Results

Angiopathy is a well-known complication of diabetes; therefore, patients with diabetes were selected as subjects to compare the hemodynamics of capillaries and arterioles with those of healthy subjects. Patients with diabetes were selected from inpatients or outpatients at Kanai Hospital between November 2021 and June 2022. The control group consisted of adult males and females who had not been diagnosed and treated for diabetes, hypertension, or cardiovascular disease, were employees of Murata Manufacturing Co., Ltd., satisfied the above conditions, and provided their consent from May 2021 to July 2021. This study was approved by the Ethics Committee of Kanai Hospital (Approval No. 121). Measurements were conducted indoors at a controlled room temperature to exclude the influence of outside temperatures.
There were 36 subjects (14 males and 22 females) for the diabetic group and 39 subjects (26 males and 13 females) for the control group. Measurements were performed at least once per person, up to eight times, the number of acquired data points being 111 for the diabetic group and 40 for the control group. The control group tended to be less elderly and had more males than the diabetic group.
Data that satisfied the following exclusion criteria among these gathered data were excluded from the analysis—that is, when the blood pressure could not be measured using a wrist-cuff-type sphygmomanometer, when the signal-to-noise ratio of the photoplethysmogram signal was less than 200, and when feature values (such as 1/FWHMVPG) could not be calculated from the photoplethysmogram signal. This was because when the signal-to-noise ratio of the photoplethysmogram signal was less than 200, the apex of the peak of the acceleration plethysmogram was buried in noise, resulting in a large drop in peak detection accuracy. A confirmed example in which the feature value could not be calculated from a photoplethysmogram signal was one in which body motion noise was present.
In this study, the signal intensity was defined as the photoplethysmogram height (S) in Figure 3, the noise intensity was defined as the root mean square of the remaining components after removing the photoplethysmogram component from the signal, and the ratio of these two values was defined as the signal-to-noise ratio.
The data that remained after the abovementioned exclusion process (50 datasets from 25 diabetic patients (6 males and 19 females) and 21 datasets from 21 individuals (17 males and 4 females) in the control group) were used for analysis.
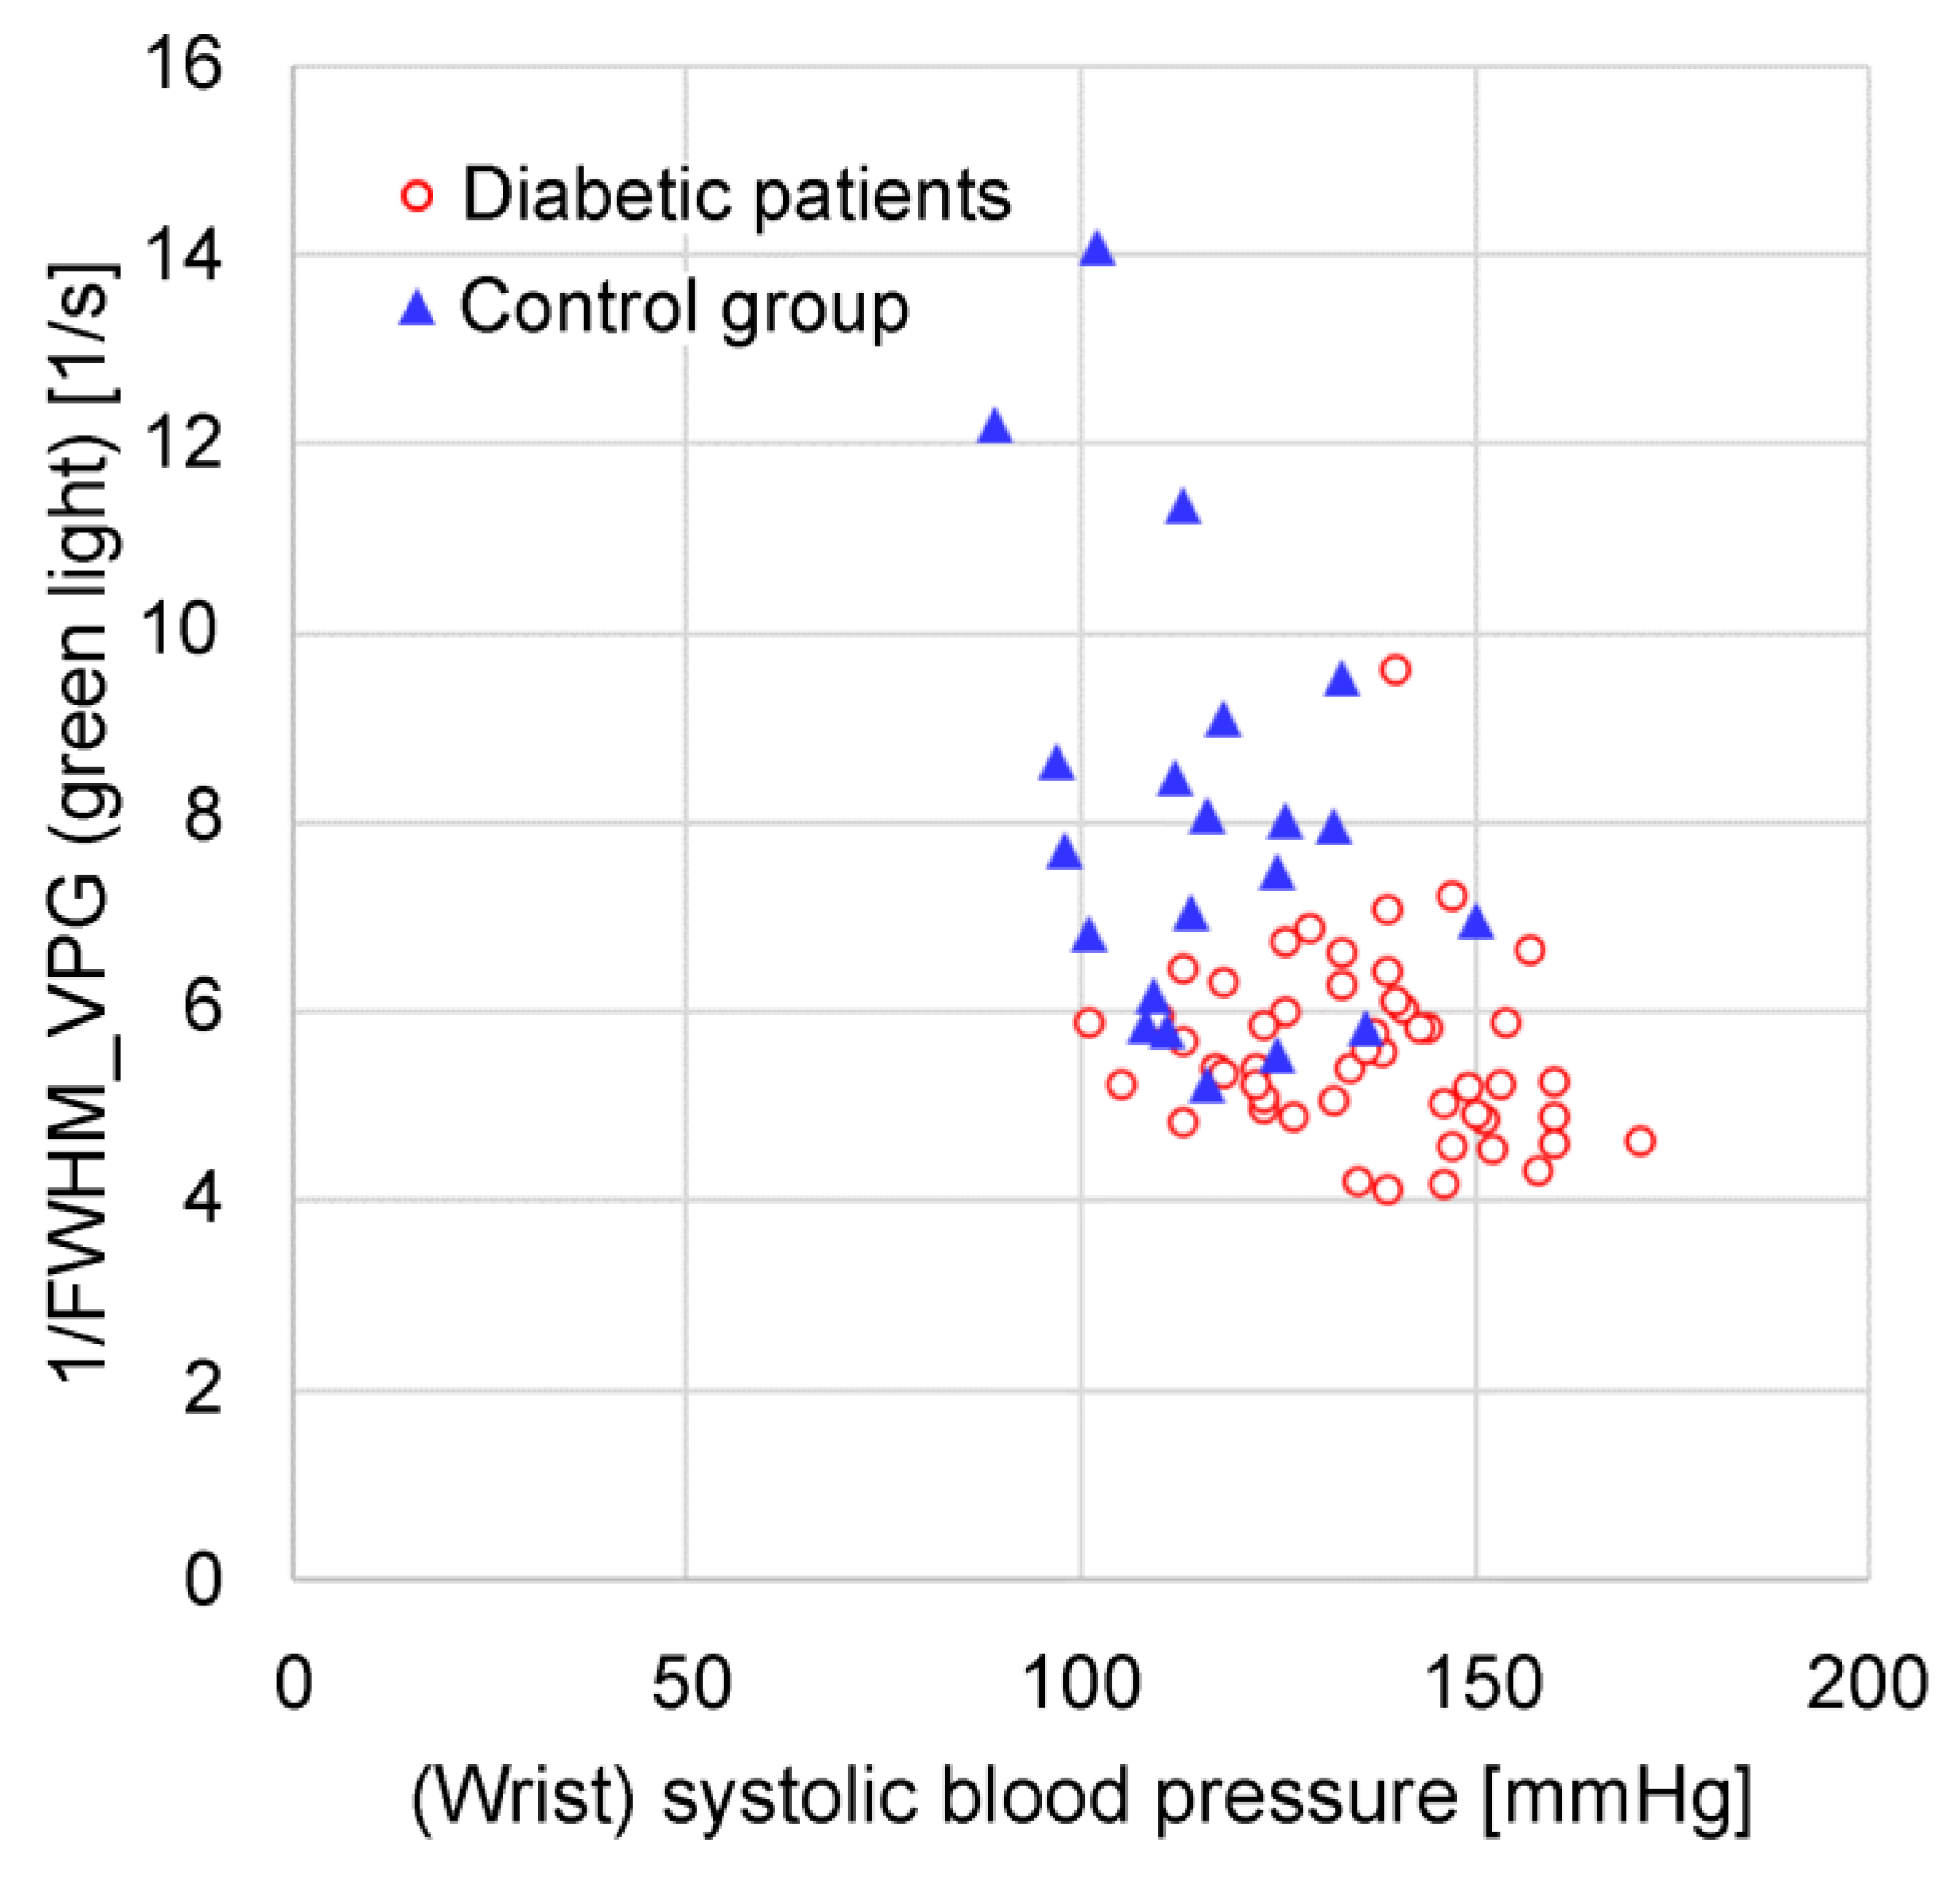
Figure 11 shows a graph of the green light 1/FWHMVPG against the systolic blood pressure measured at the wrist. It is evident that 1/FWHMVPG is concentrated in a smaller range in the diabetic group compared to the control group. Conversely, it is evident that the systolic blood pressure in the diabetic group tends to be higher than that of the control group.
The 1/FWHMVPG ranges from 4.1 [1/s] to 9.6 [1/s], with a mean of 5.6 [1/s] in the diabetic group and from 5.2 [1/s] to 14.1 [1/s], with a mean of 7.9 [1/s] in the control group. The 1/FWHMVPG differs significantly between the diabetic group and the control group (p = 0.00016).
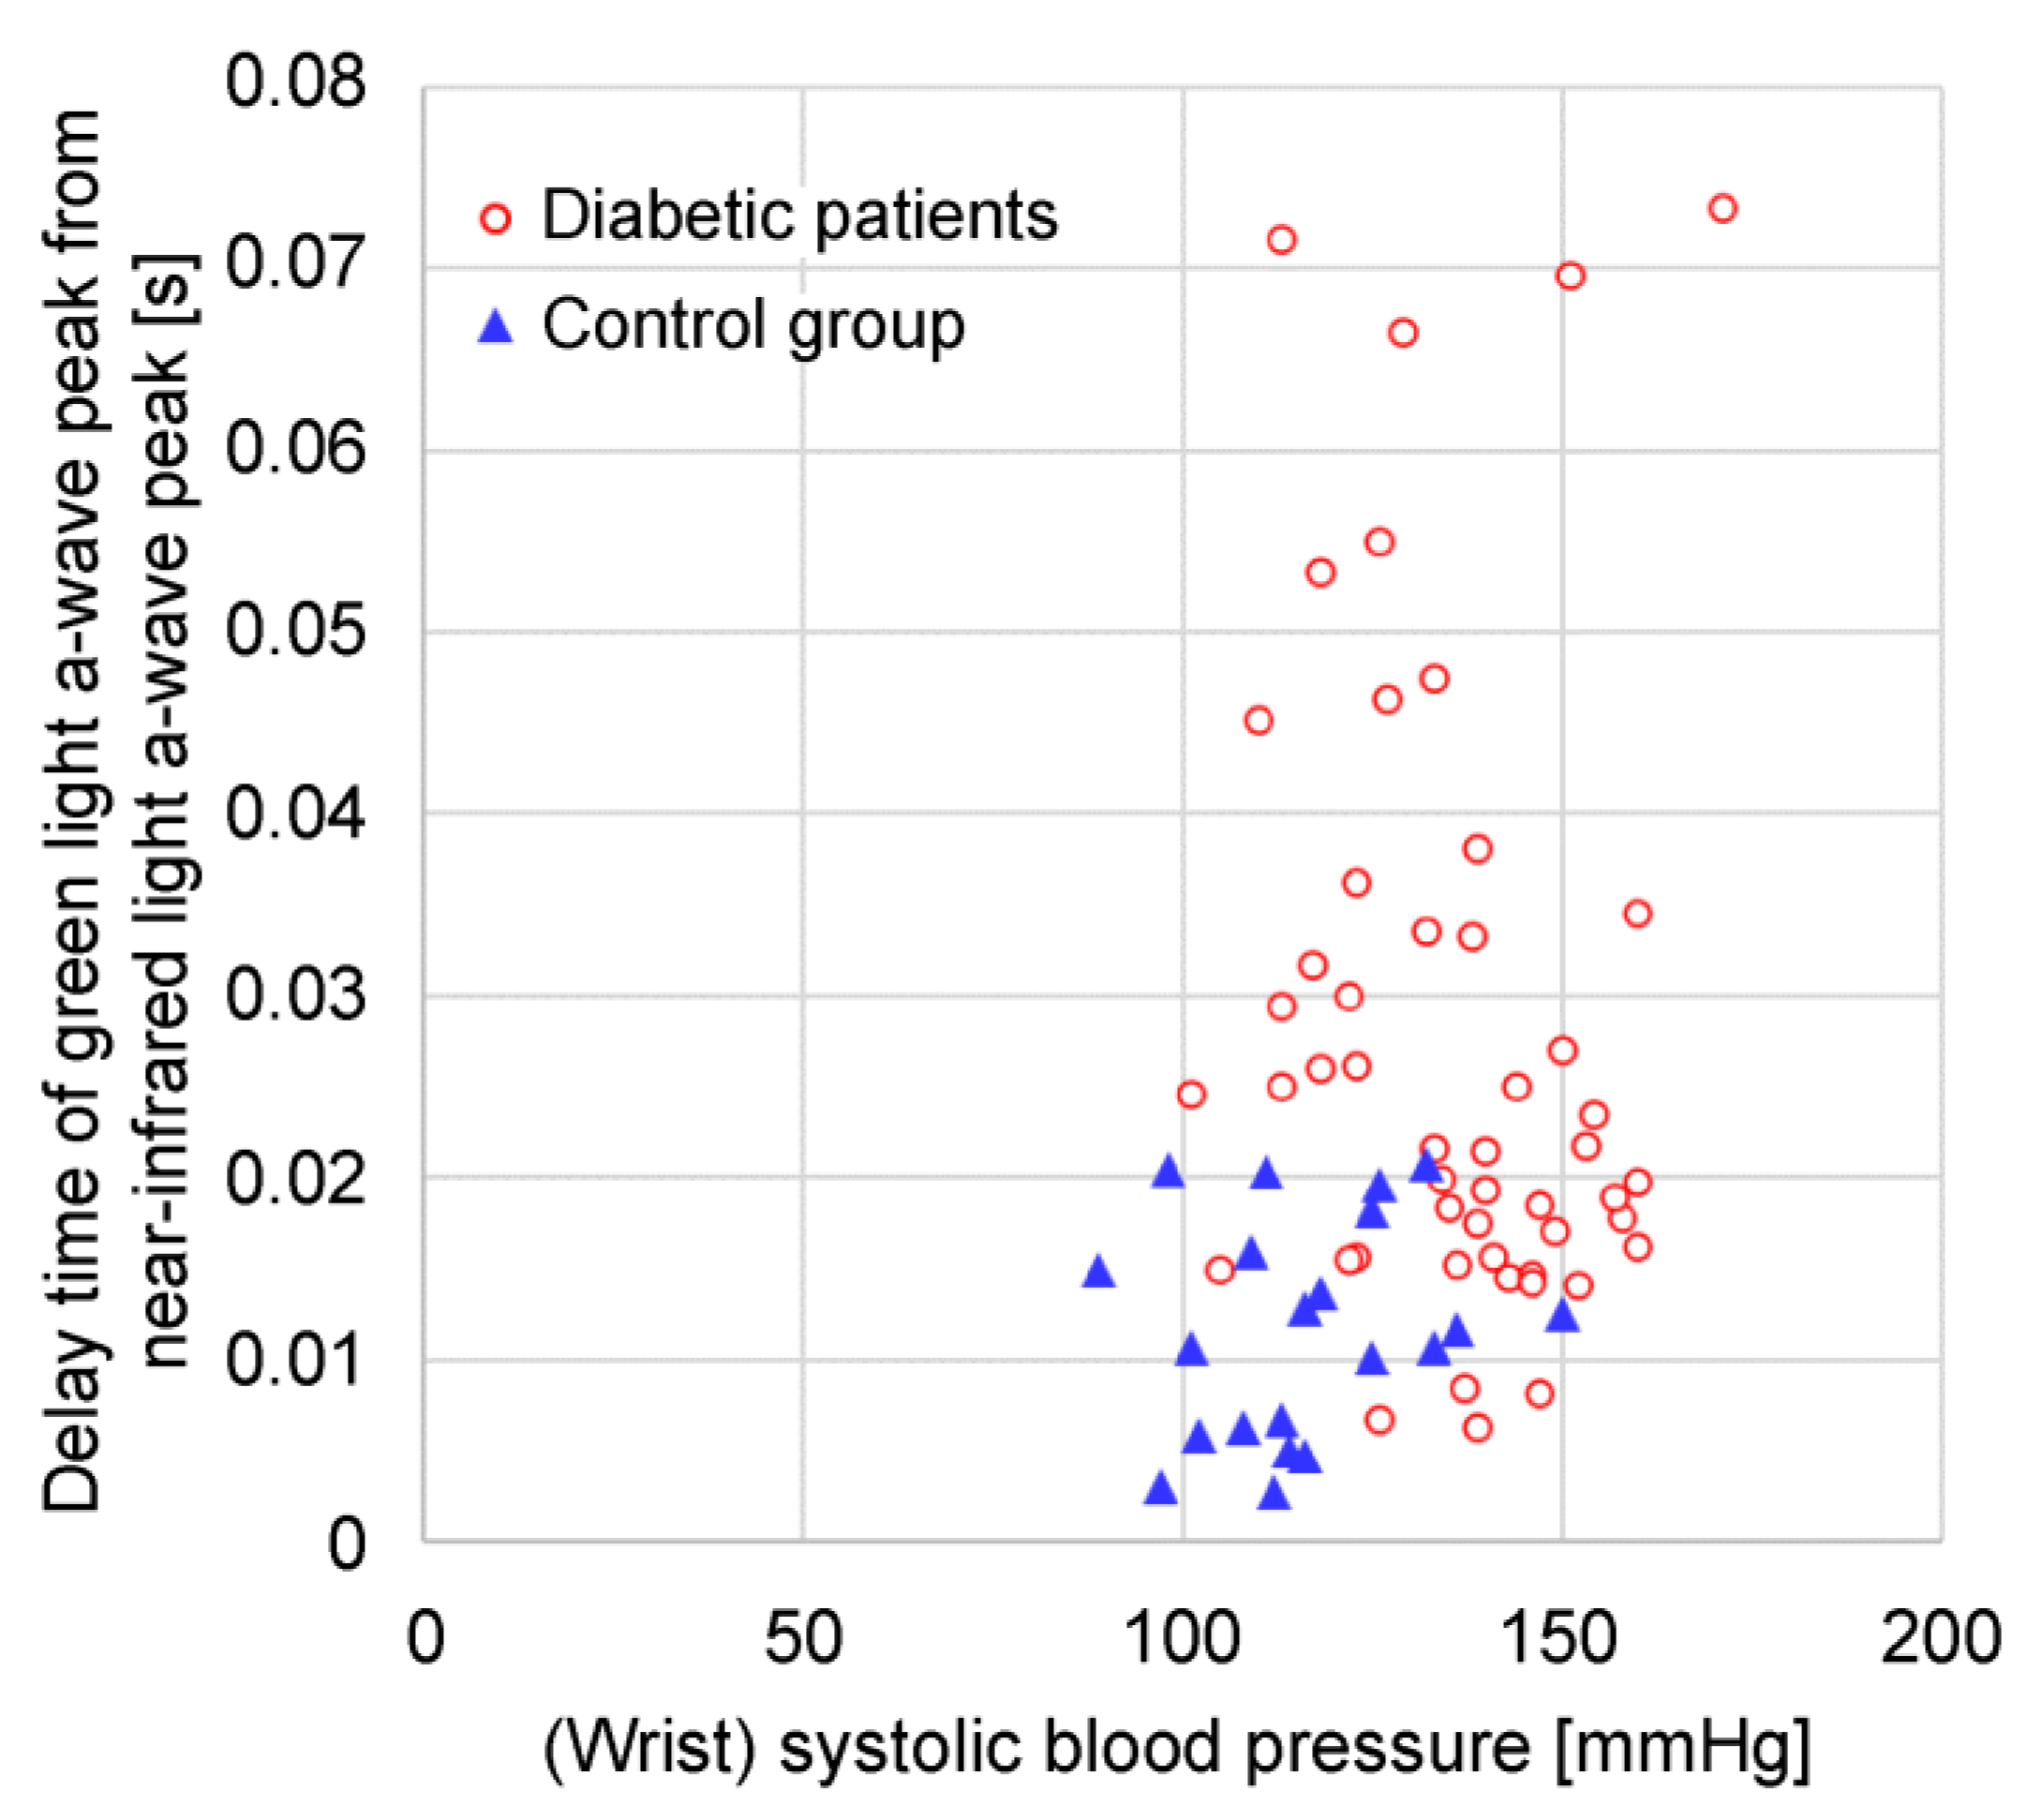
Figure 12 shows a graph of the time delay between the green light a-wave peak and the near-infrared light a-wave peak against the systolic blood pressure measured at the wrist. In the control group, the time delay between the green light a-wave peak and the near-infrared a-wave peak is concentrated in a small range, whereas in the diabetic group the time delay between is also widely distributed.
The time delay between the green light a-wave peak and the near-infrared light a-wave peak ranges from 0.006 [s] to 0.073 [s] with a mean of 0.028 [s] in the diabetic group and from 0.003 [s] to 0.021 [s] with a mean of 0.012 [s] in the control group. The time delay between the green light a-wave peak and the near-infrared light a-wave peak differs significantly between the diabetic group and the control group (p = 1.3×10⁻⁷).
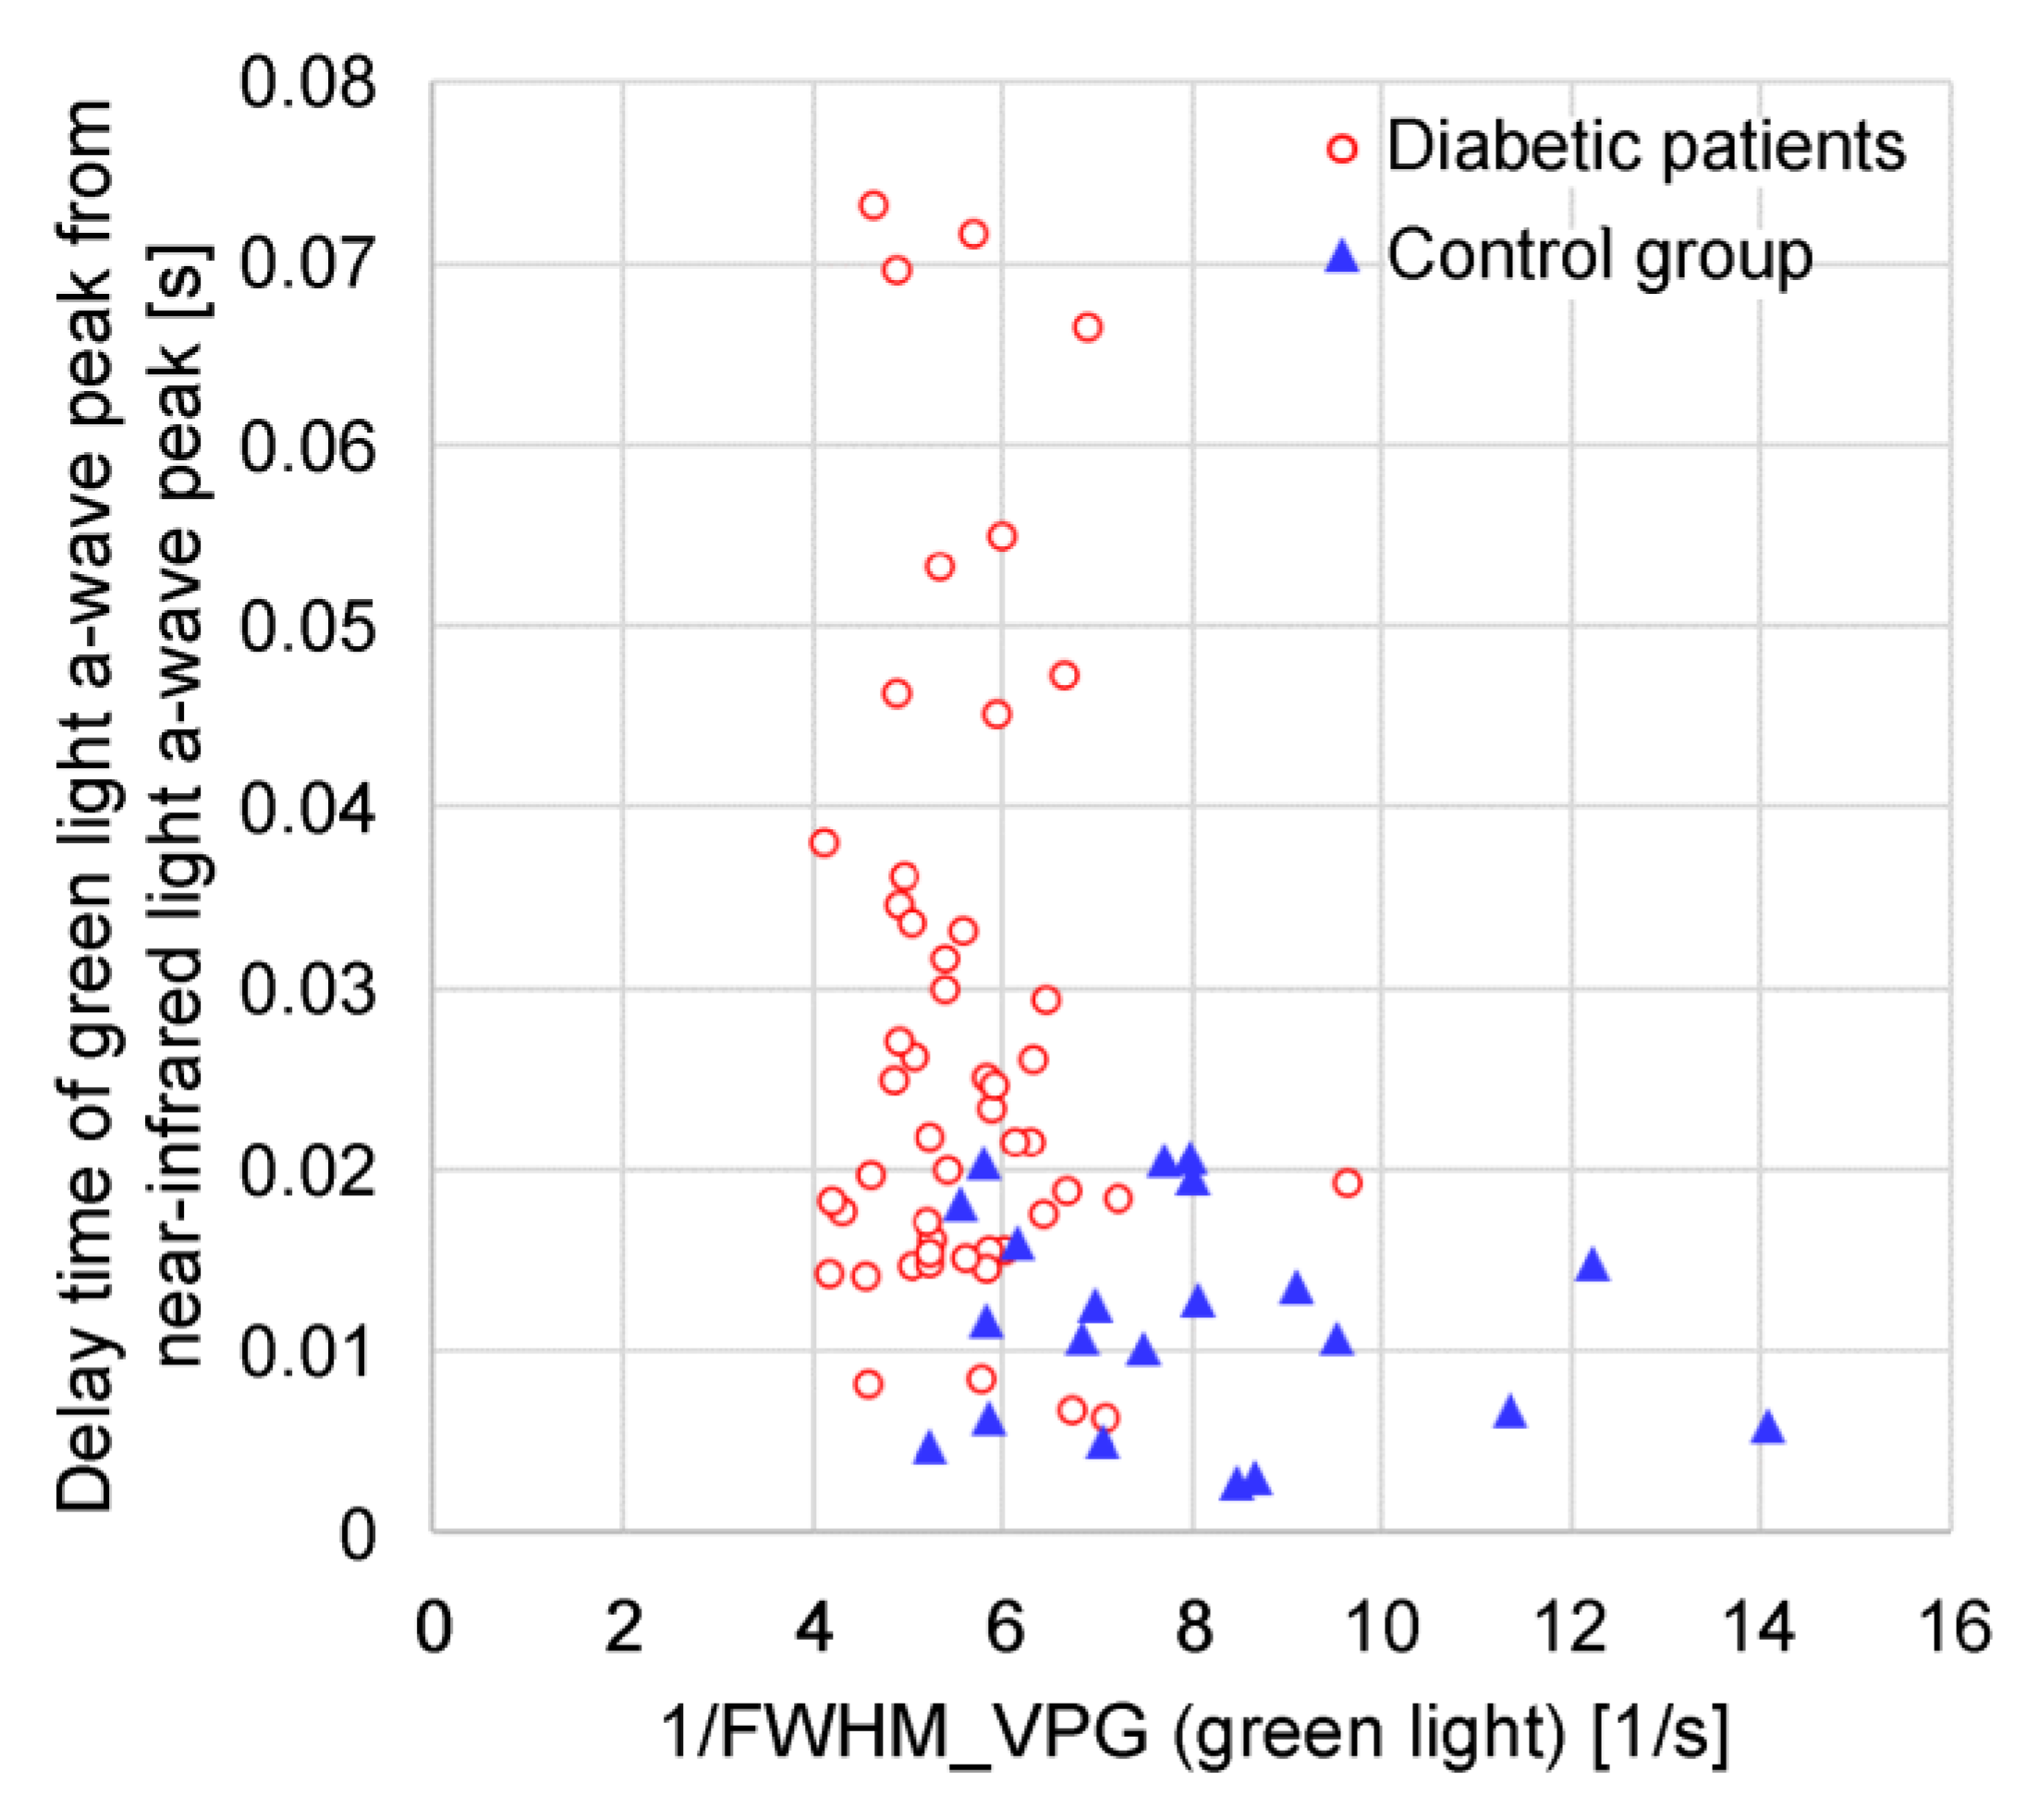
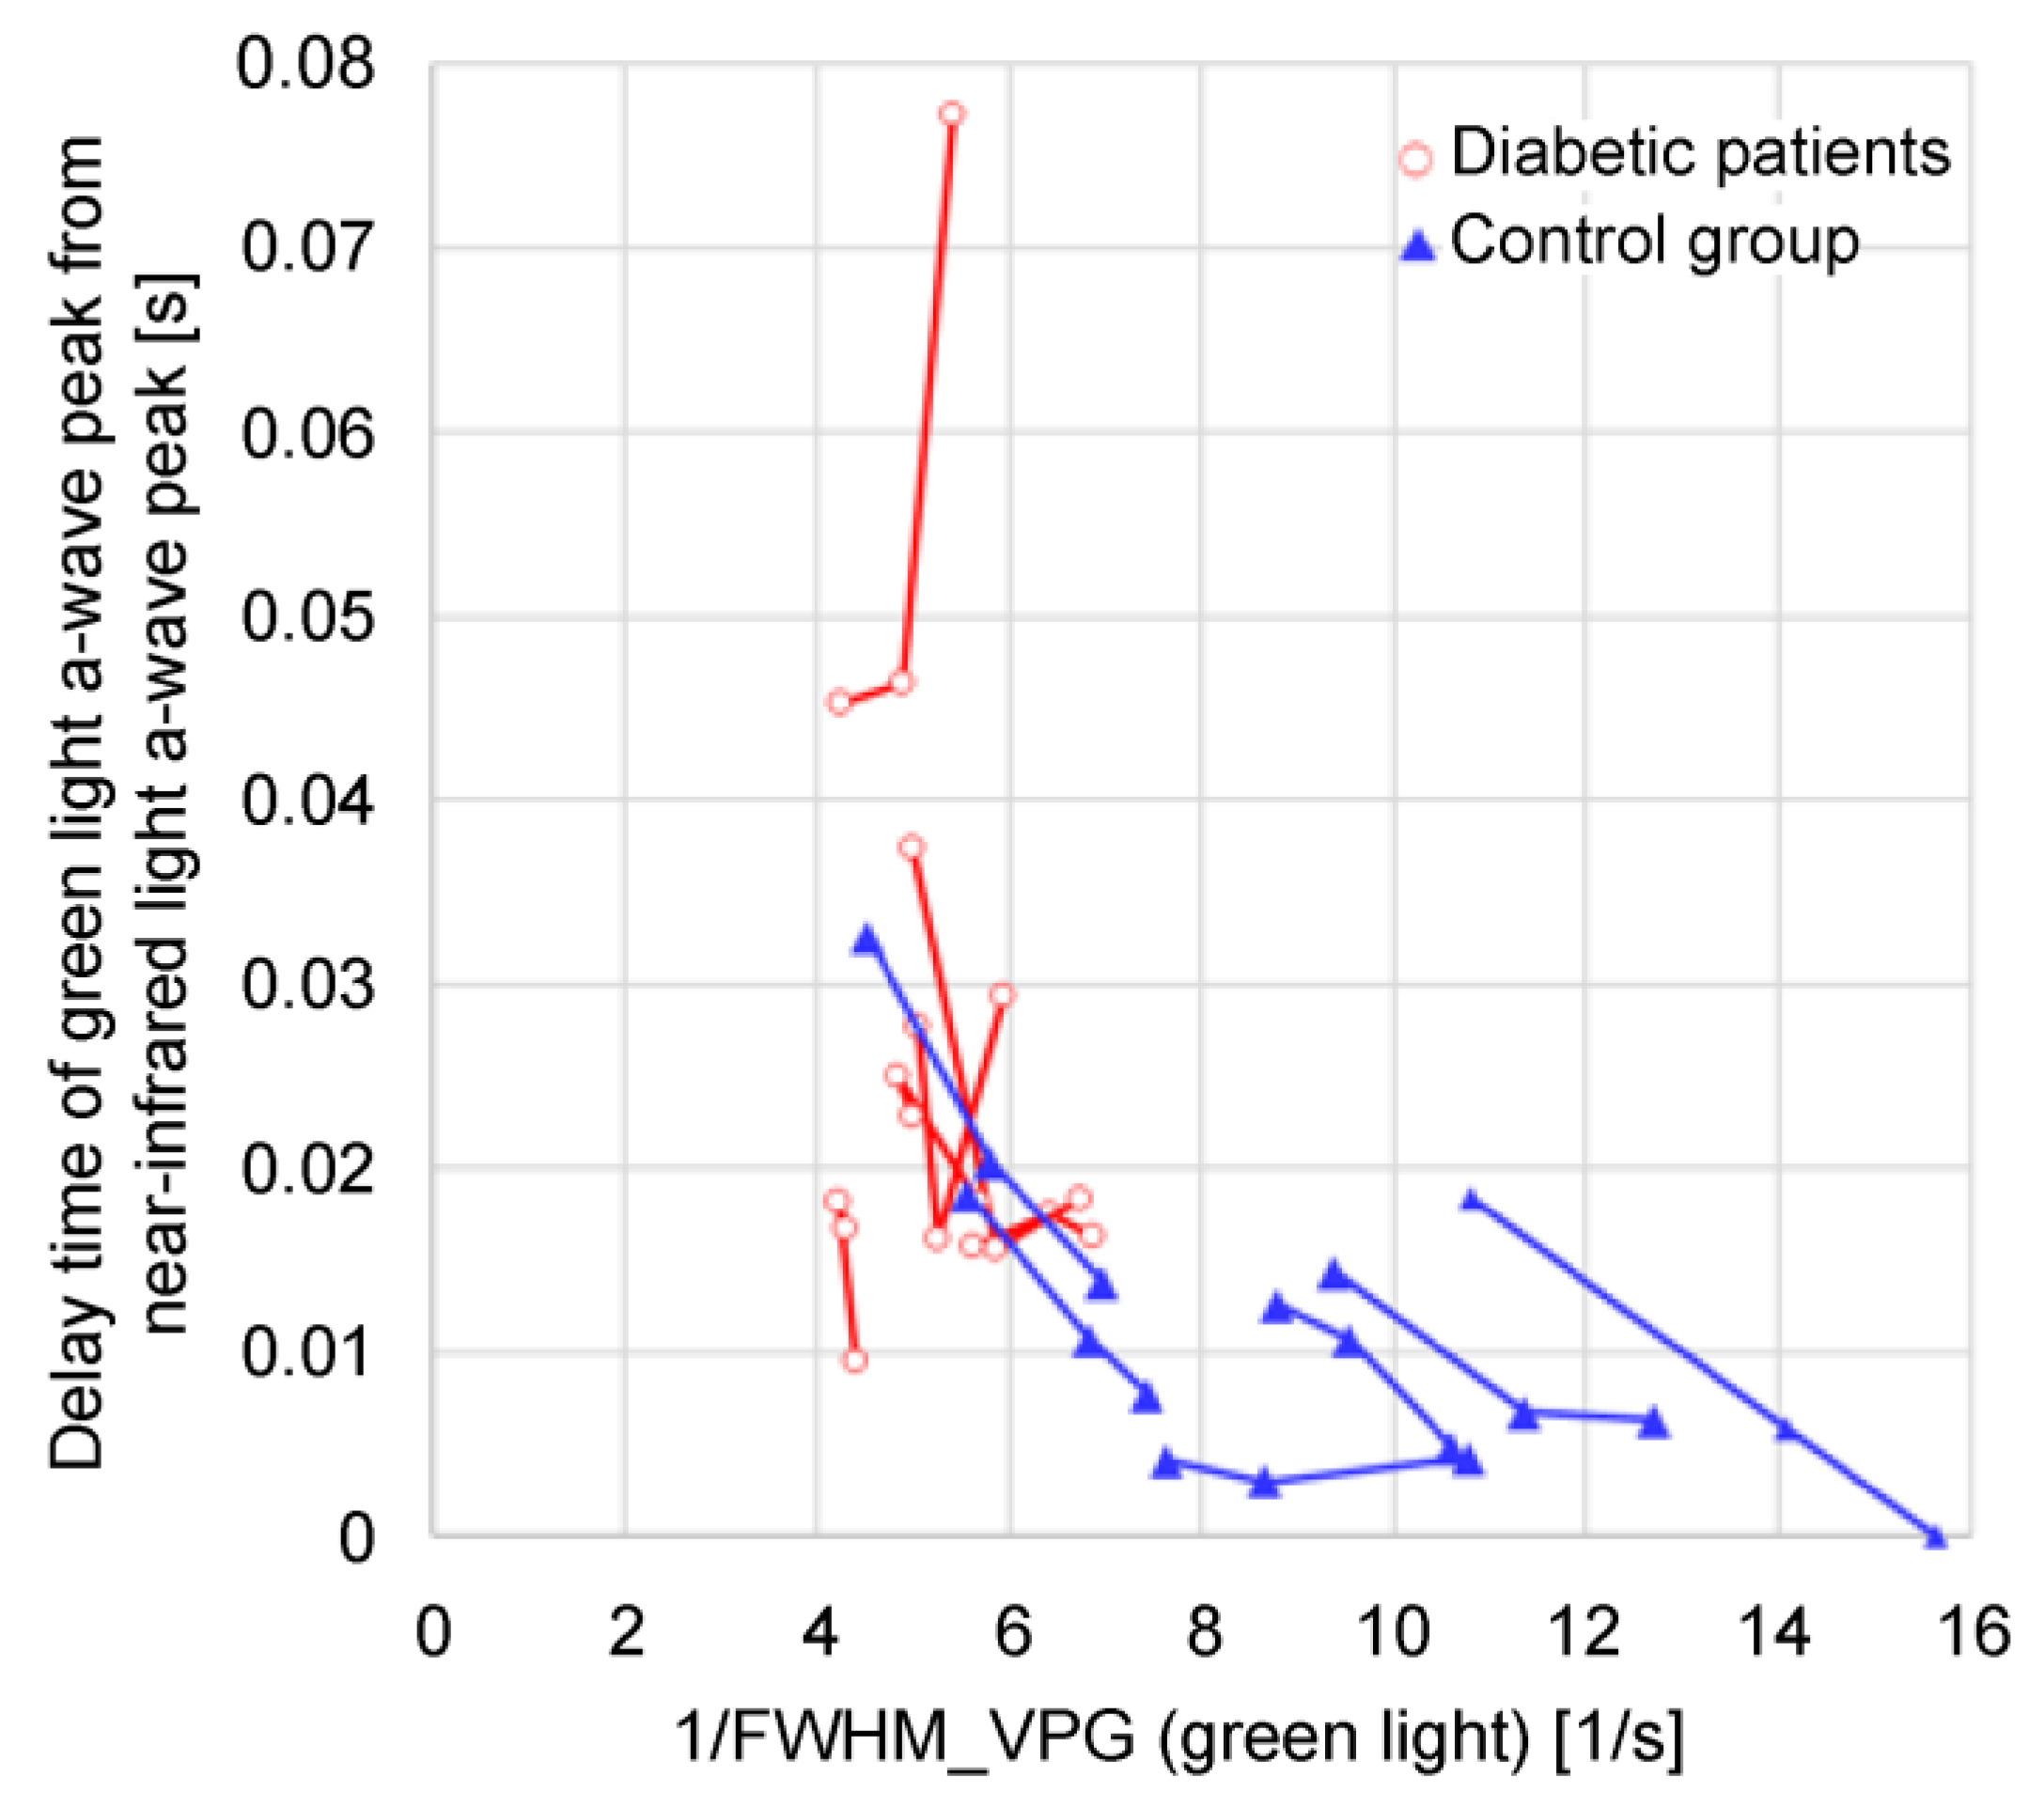
Figure 13 shows a graph of the time delay between the green light a-wave peak and the near-infrared light a-wave peak against the green light 1/FWHMVPG. In the diabetic group, the green light 1/FWHMVPG tends to be smaller than in the control group, and the time delay between the green light a-wave peak and the near-infrared light a-wave peak tends to be longer.
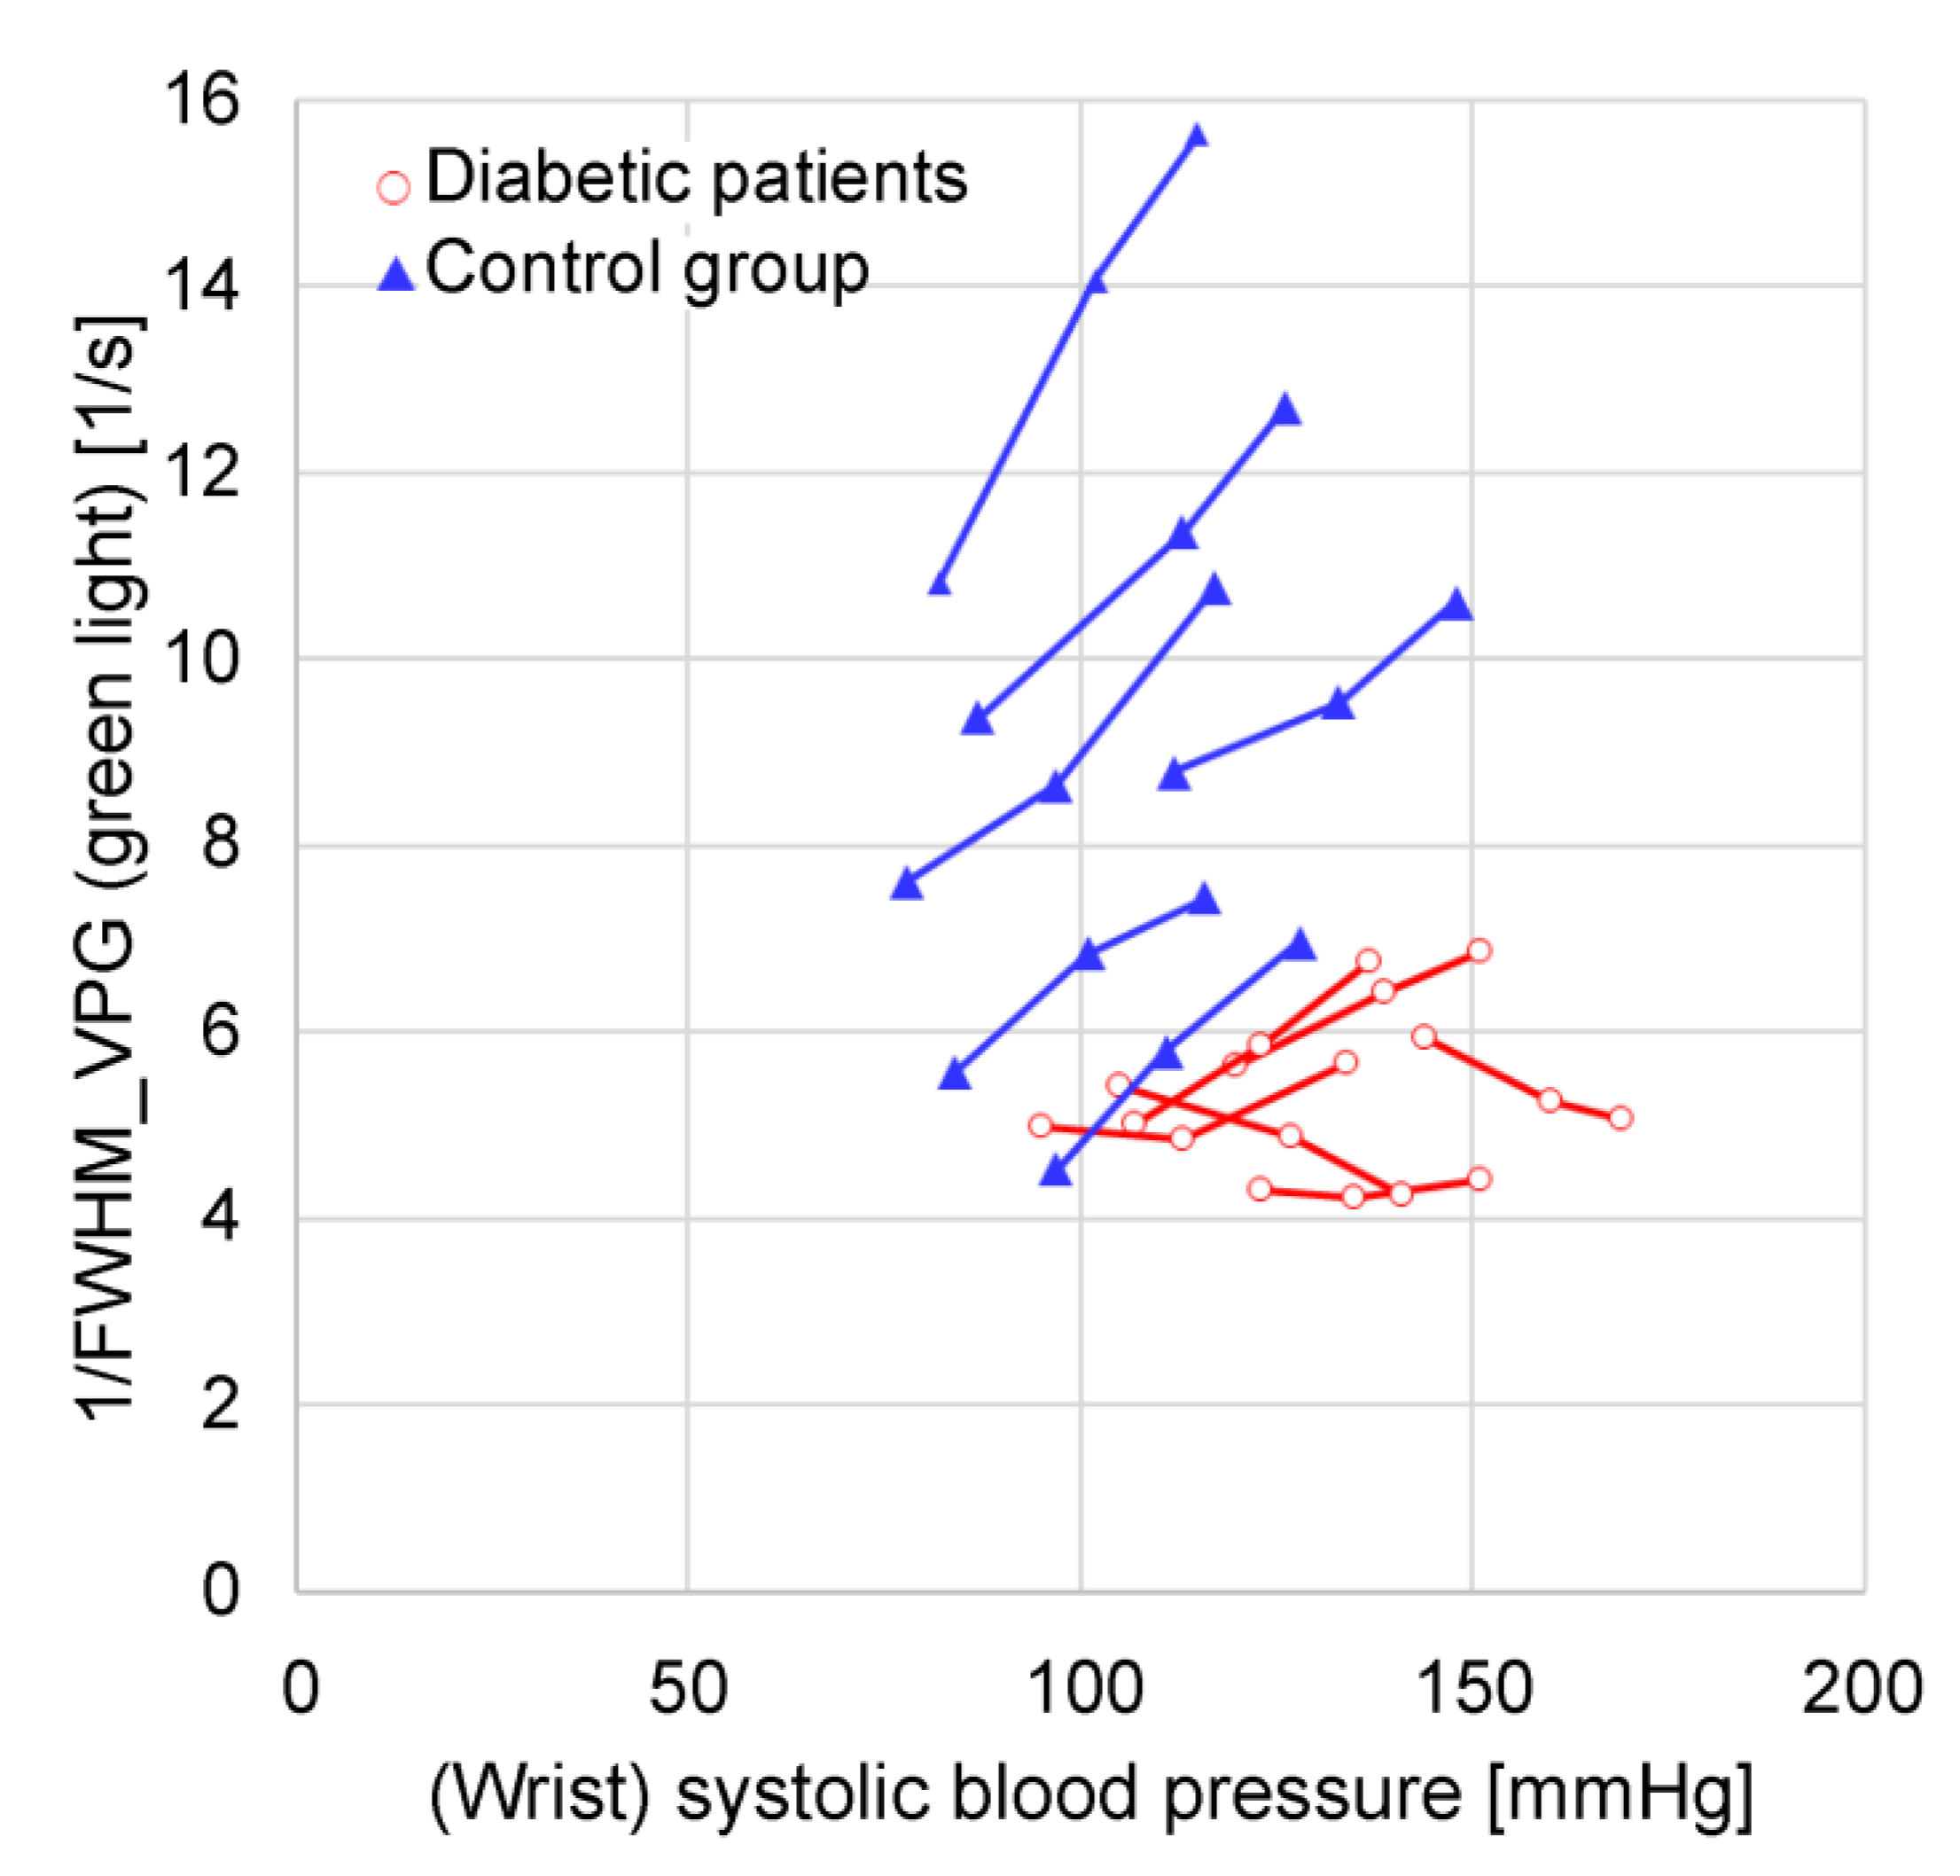
Figure 14 shows a graph of the change in green light 1/FWHMVPG and the time delay between the green a-wave peak and the near-infrared a-wave peak when the photoplethysmogram and blood pressure were measured by holding the left hand with the measurement tool at the navel, chest, and forehead height against the wrist cuff-type sphygmomanometer measurements.
Plotting all the data results in considerable data overlap, making it difficult to observe changes; therefore, six datasets were extracted for each of the diabetic and control groups. The extraction criteria were as follows: blood pressure measurements and feature value calculations could be conducted at the navel, chest, and forehead heights; wrist blood pressure measurement values were in descending order of navel height > chest height > forehead height; and those with minimal overlap with other data were extracted.
As is evident from Figure 14, green light 1/FWHMVPG shows a nearly proportional positive correlation with the wrist blood pressure in the control group. In the diabetic group, the absolute value of 1/FWHMVPG for green light is low and tends not to be very high with respect to the wrist blood pressure. It can be speculated that this behavior is due to the following: in the control group, the low vascular resistance from the radial artery to the arterioles and capillaries results in the capillary blood pressure following changes in the wrist blood pressure, whereas in the diabetic group there is vascular resistance; consequently, even if the wrist blood pressure increases, the intracapillary blood pressure does not readily increase.
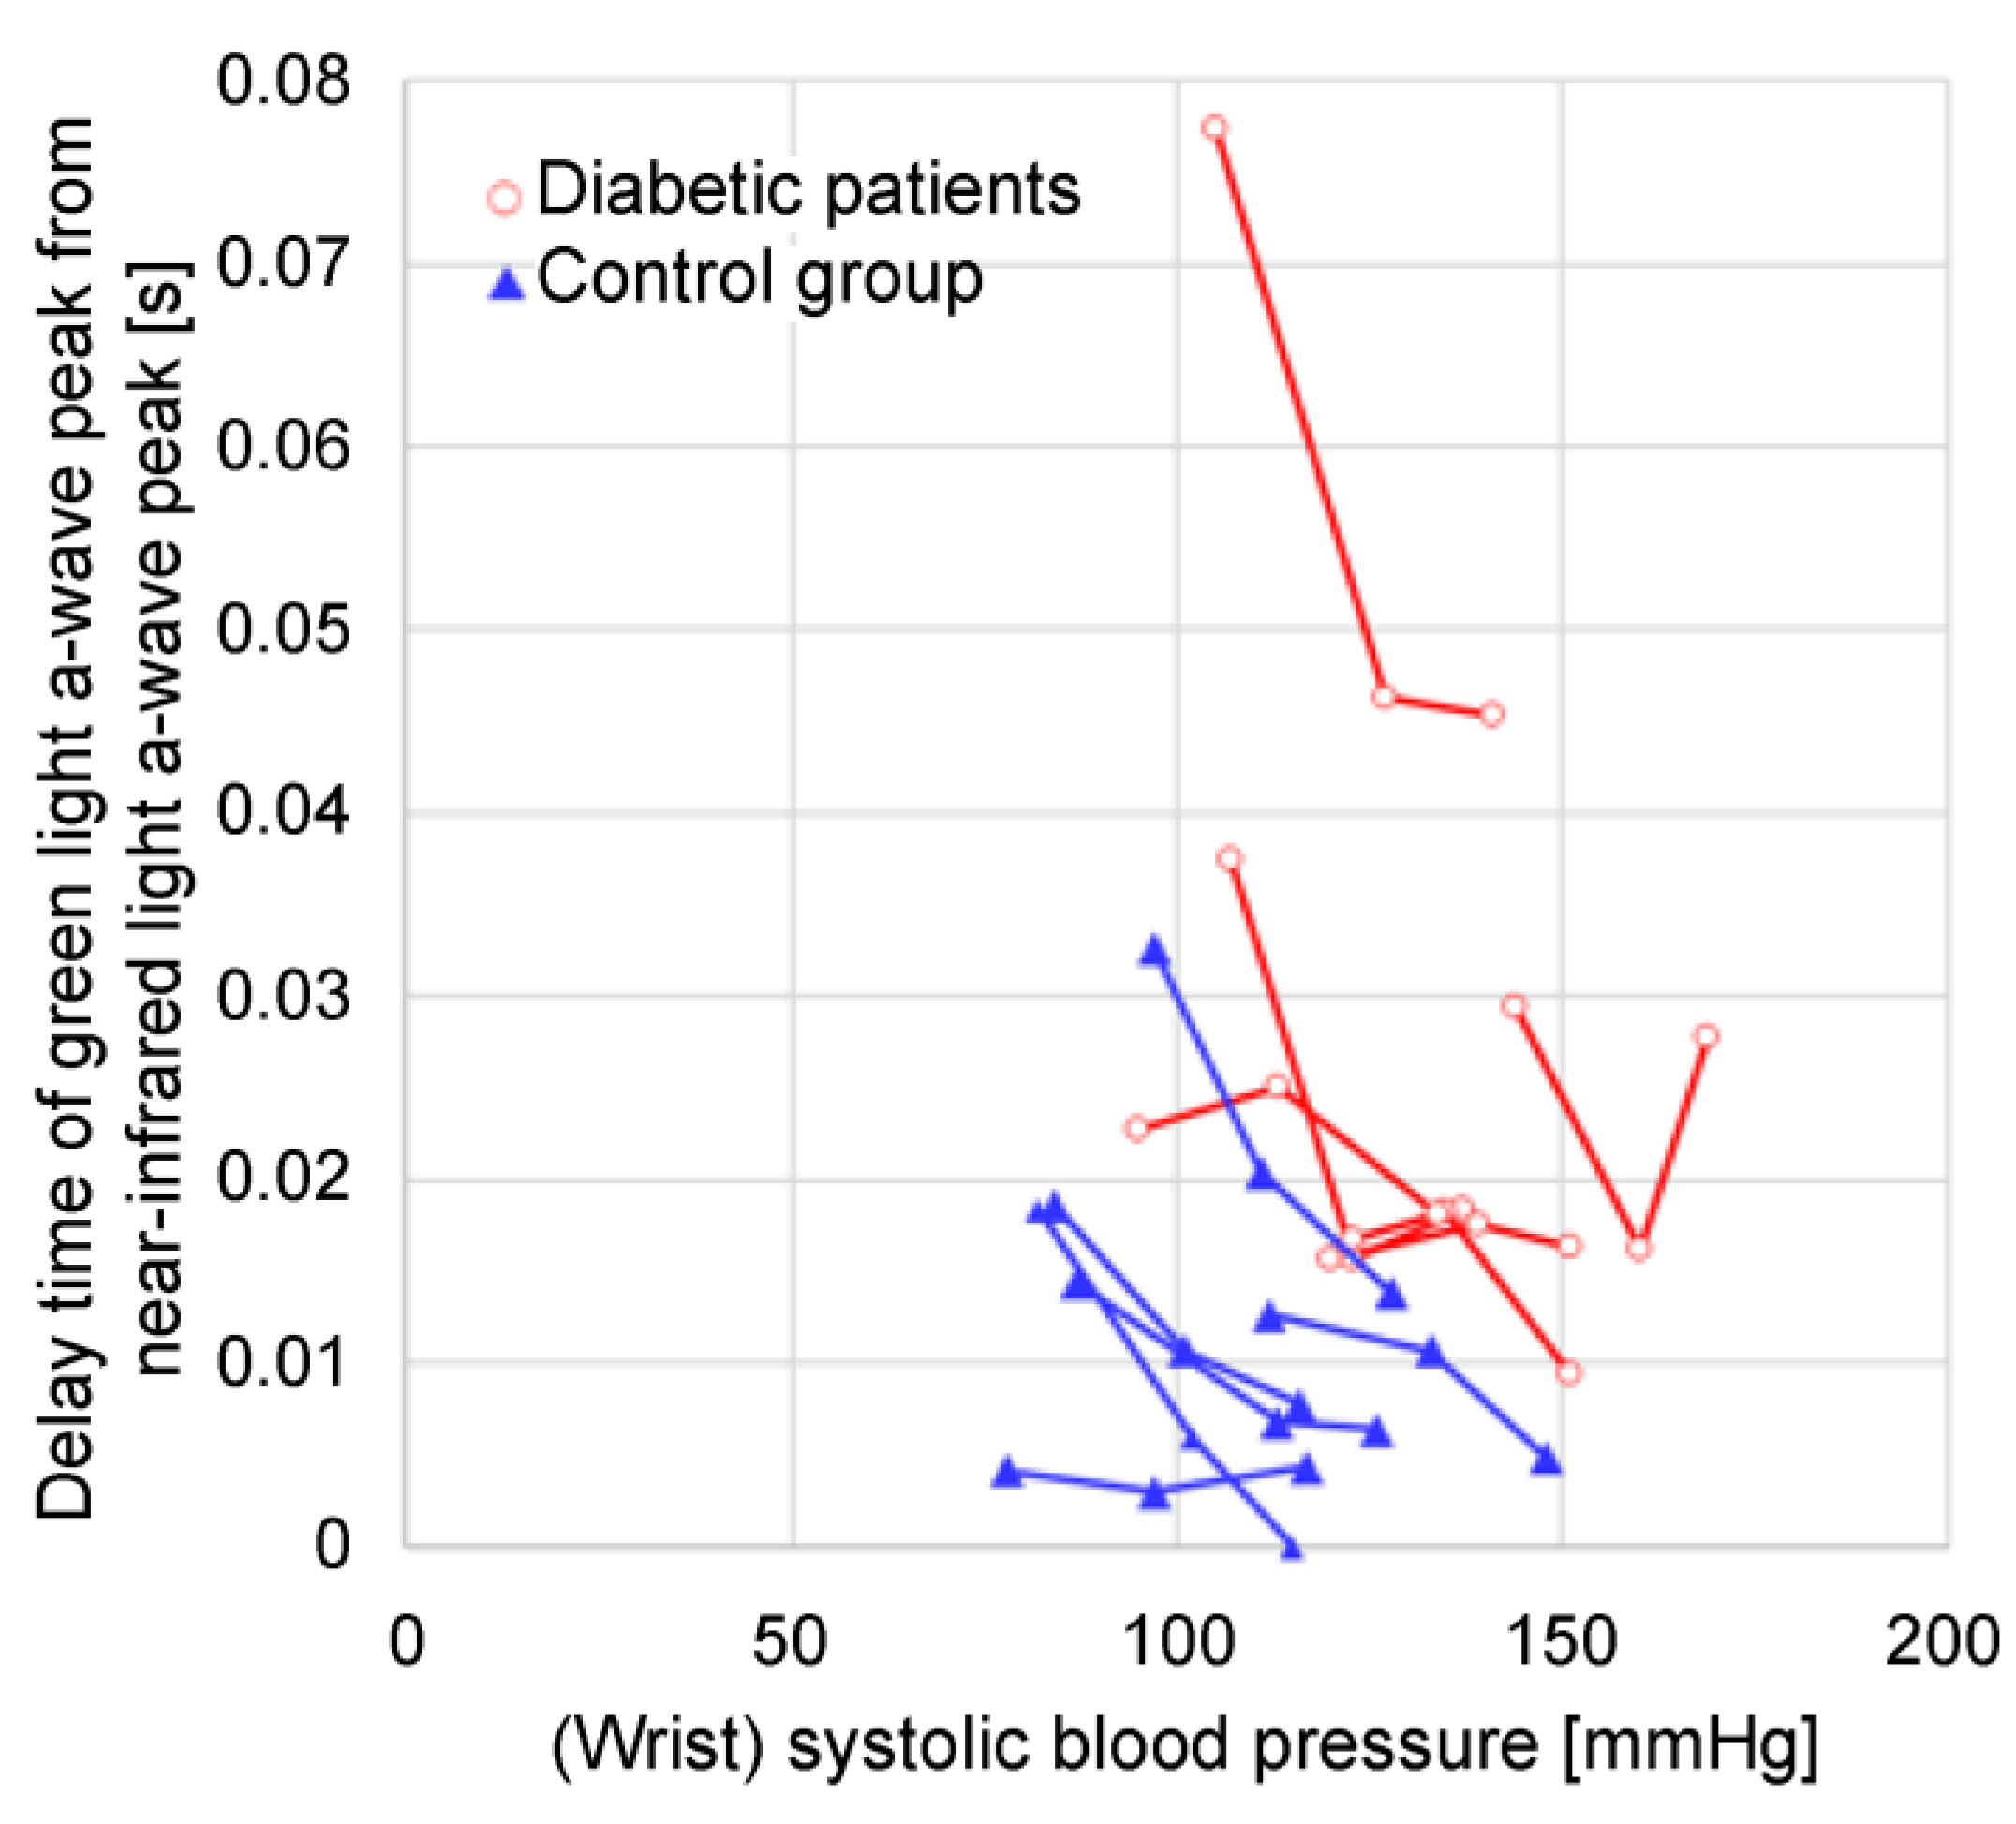
Figure 15 shows a graph of the time delay between the green light a-wave peak and the near-infrared light a-wave peak instead of 1/FWHMVPG (green light) for the data plotted in Figure 14. The time delay tends to increase as the wrist blood pressure decreases in the same subject.
Figure 16 shows a graph of the time delay between the green light a-wave peak and the near-infrared light a-wave peak with respect to 1/FWHMVPG (green light) for the data plotted in Figure 14. It is evident that decreases in 1/FWHMVPG (green light) tend to increase the time delay.

4. Discussion

A It is evident that 1/FWHMVPG (green light) was small in the diabetic group and that the time delay between the green light a-wave peak and the near-infrared light a-wave peak was large, the mechanism for which could be speculated to be as follows: as the vascular resistance of the capillaries and arterioles increases, the blood pressure in the capillaries and arterioles decreases, making it difficult for blood to flow; as the blood pressure decreases, the pulse wave velocity (PWV) decreases—that is, the time delay between the green light a-wave peak and the near-infrared light a-wave peak increases.
The time delay between the green a-wave peak and the near-infrared a-wave peak varies with the path length. Consequently, the absolute value of the time delay between the near-infrared light a-wave peak and the green light a-wave peak varies depending on the mounting position of the measurement tool and individual differences. Thus, it is desirable to determine the peripheral PWV by dividing the path length by the time delay. However, the path lengths of the arterioles and capillaries cannot be measured; therefore, the time delay between the green light a-wave peak and the near-infrared light a-wave peak can be substituted instead.
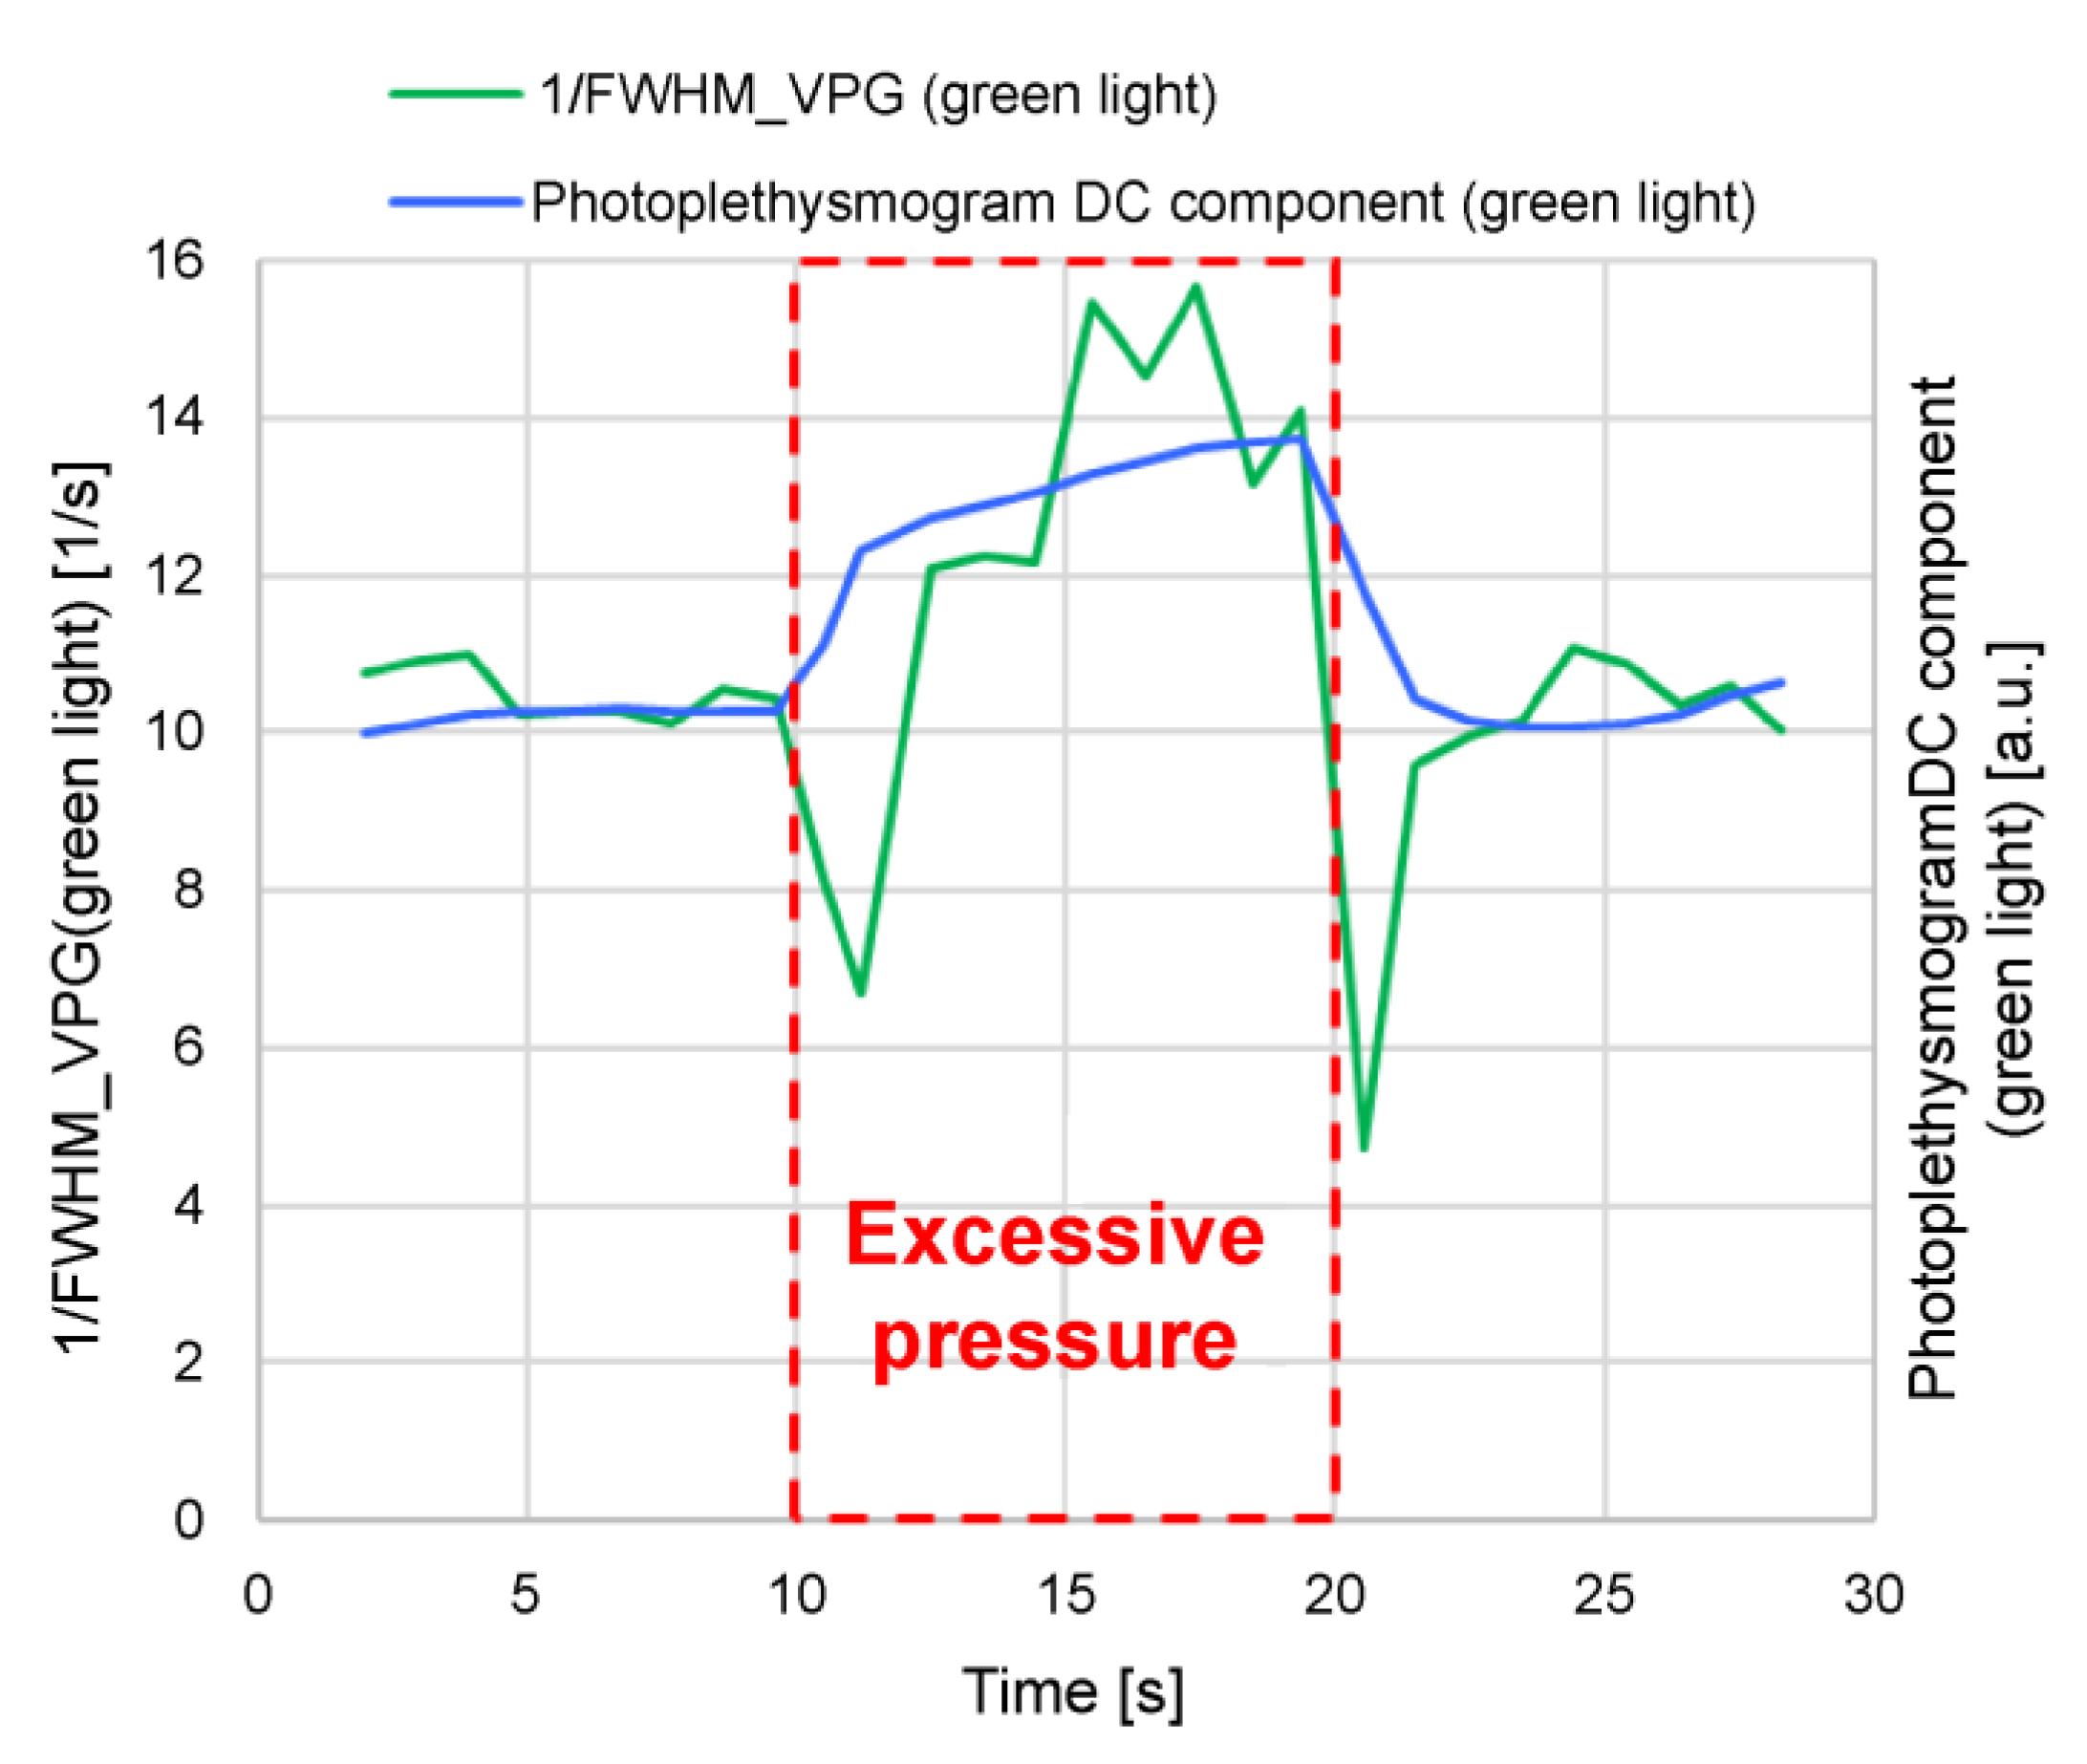
It can be difficult to accurately measure the blood pressure and blood flow in capillaries; consequently, we conducted the following experiment with 1/FWHMVPG (green light) and made inferences about its behavior. The measurement tool was designed to come into contact with the finger at an appropriate pressure for measurement stabilization. In the experiment, when measuring for 30 s, the finger was pressed strongly against the tool for 10–20 s from the start of the measurement process to increase the pressure, and the change in 1/FWHMVPG (green light) at that time was examined (Figure 17).
It is evident from Figure 17 that the photoplethysmogram DC components of the green light and 1/FWHMVPG (green light) increased when excessive pressure was applied (10–20 s). An increase in the DC component of the photoplethysmogram indicates that the absorption of light by the blood decreases, suggesting that blood flow is inhibited by excessive pressure, which in turn results in a decrease in blood volume.
When the measurement tool is pressed strongly against the finger, pressure is applied to the capillaries and arterioles and the blood vessels are compressed, impeding the blood flow and increasing the photoplethysmogram DC component. The blood (whose flow is blocked), flows to the surrounding capillaries that are not pressed; consequently, the blood pressure increases in the capillaries that are compressed, and the blood flow is presumed to decrease. Therefore, it is thought that 1/FWHMVPG (green light) behaves more like blood pressure than blood flow in the capillaries.
Additionally, a/S (green light), (a-b)/(a-d) (green light), and 1/ab time (green light) exhibit the same tendency as 1/FWHMVPG (green light).
The well-known pulse transit time is the time difference between two distant points in a large artery; the Bramwell–Hill formula [18] represents the PWV, and can be expressed as follows:
P W V 2 = P ρ V V         .
Equation (1) shows that PWV2 is proportional to the pressure change (pulse pressure, ΔP) and vascular volume (V), and inversely proportional to the blood density (ρ) and vascular volume change (ΔV). Equation (1) is for large arteries, but assuming that the time delay between the near-infrared light a-wave peak and the green light a-wave peak can be regarded as the pulse wave transit time from the arteriole to the capillary and the above equation can be applied, then the decrease in the PWV (increase in pulse wave transit time) can be thought to be caused by a low pulse pressure in the path (arteriole to capillaries) or a soft blood vessel (large ΔV/V). It can be difficult to imagine that the blood vessels of diabetic patients are soft; therefore, it can be assumed that the pulse pressure in the path (arteriole to capillary) is low. A low pulse pressure is equivalent to a low systolic blood pressure; consequently, it can be speculated that the low blood pressure in the arterioles and capillaries is the cause of the long delay from the near-infrared a-wave peak to the green a-wave peak.
However, peripheral hemodynamics have not yet been quantitatively evaluated. Because it can be assumed that peripheral hemodynamics are affected by the height from the heart, room temperature, noise, odor, fatigue, and sleep deprivation, in addition to medical history, sex, and age, long-term measurement of fluctuations is considered to be more important than a single measurement.

5. Conclusions

In this study, we confirmed that there were clear differences between the diabetic group and control group regarding 1/FWHMVPG (green light), which could be calculated easily using the volume photoplethysmography method, and the time delay between the green light a-wave peak and the near-infrared light a-wave peak.
We confirmed that the diabetic group tended to have a small 1/FWHMVPG (green light) and a long time delay between the green light a-wave peak and the near-infrared light a-wave peak. The speculated mechanism underpinning these results is as follows: increased vascular resistance in capillaries and arterioles in diabetic patients reduces blood pressure in the capillaries and arterioles, which in turn lowers 1/FWHMVPG (green light); reduced blood pressure in the capillaries and arterioles decreases the PWV, which in turn increases the time delay between the green light a-wave peak and the near-infrared light a-wave peak.
The photoplethysmography sensors used in this study could be integrated into low-cost, miniaturized, ring-type wearable devices, making it possible to continuously monitor the hemodynamics of arterioles and capillaries at home, which has been difficult to date. Moreover, the proposed method could be useful in outpatient diagnosis, as well as in disease prevention. However, the extent to which poor long-term peripheral hemodynamics affect health remains unclear, and further research is needed.

Author Contributions

Conceptualization, T.S.; methodology, T.S.; investigation, T.S.; fabrication of the measuring tool, K.H.; writing, T.S.; supervision, K.R., K.I., and N.K.; provision of patients, K.R., K.I., and N.K. All authors have read and agreed to the published version of the manuscript.

Funding

This research received no external funding.

Institutional Review Board Statement

The study was conducted in accordance with the Declaration of Helsinki, and approved by the Ethics Committee of Kanai Hospital (Kanai Hospital No. 121).

Informed Consent Statement

Informed consent was obtained from all subjects involved in the study.

Data Availability Statement

Data sharing is not applicable to this article as no datasets were generated or analyzed during the current study.

Acknowledgments

We would like to thank Editage (www.editage.jp) for English language editing.

Conflicts of Interest

The authors declare no conflicts of interest.

References

  1. Liu, G.; Li, Y.; Pan, A.; Hu, Y.; Chen, S.; Qian, F.; Rimm, E.B.; Manson, J.E.; Stampfer, M.J.; Giatsidis, G.; et al. Adherence to a healthy lifestyle in association with microvascular complications among adults with type 2 diabetes. JAMA Netw. Open 2023, 6, e2252239. [Google Scholar] [CrossRef] [PubMed]
  2. Thijssen, D.H.J.; Carter, S.E.; Green, D.J. Arterial structure and function in vascular ageing: are you as old as your arteries? J. Physiol. 2016, 594, 2275–2284. [Google Scholar] [CrossRef] [PubMed]
  3. Duranteau, J.; De Backer, D.; Donadello, K.; Shapiro, N.I.; Hutchings, S.D.; Rovas, A.; Legrand, M.; Harrois, A.; Ince, C. The future of intensive care: the study of the microcirculation will help to guide our therapies. Crit. Care 2023, 27, 190. [Google Scholar] [CrossRef] [PubMed]
  4. Eiken, F.L.; Pedersen, B.L.; Bækgaard, N.; Eiberg, J.P. Diagnostic methods for measurement of peripheral blood flow during exercise in patients with type 2 diabetes and peripheral artery disease: a systematic review. Int. Angiol. 2019, 38, 62–69. [Google Scholar] [CrossRef] [PubMed]
  5. Edul, V.K.; Gutierrez, F.J. Devices for assessing microcirculation. Curr. Opin. Crit. Care 2023, 29, 236–243. [Google Scholar] [CrossRef] [PubMed]
  6. Tafner, P.F.A.; Chen, F.K.; Rabello Filho, R.; Corrêa, T.D.; Chaves, R.C.F.; Serpa Neto, A. Recent advances in bedside microcirculation assessment in critically ill patients. Rev. Bras. Ter. Intensiva 2017, 29, 238–247. [Google Scholar] [CrossRef] [PubMed]
  7. Sorelli, M.; Bocchi, L.; Ince, C. Monitoring microcirculation at the bedside using handheld imaging microscopes: automatic tracking of erythrocytes. In 37th Annual International Conference of the IEEE Engineering in Medicine and Biology Society (EMBC), Milan, Italy, 2015, pp. 7378–7381.
  8. Tang, S.; Huang, C.; Gong, P.; Lok, U.W.; Zhou, C.; Yang, L.; Knoll, K.M.; Robinson, K.A.; Sheedy, S.P.; Fletcher, J.G.; et al. Adaptive and robust vessel quantification in contrast-free ultrafast ultrasound microvessel imaging. Ultrasound Med. Biol. 2022, 48, 2095–2109. [Google Scholar] [CrossRef] [PubMed]
  9. Helmy, M.; Truong, T.T. Jul E, Ferreira P. Deep learning and computer vision techniques for microcirculation analysis: a review. Patterns 2023, 4, 1–19. [Google Scholar] [CrossRef] [PubMed]
  10. McDuff, D.; Nishidate, I.; Nakano, K.; Haneishi, H.; Aoki, Y.; Tanabe, C.; Niizeki, K.; Aizu, Y. Non-contact imaging of peripheral hemodynamics during cognitive and psychological stressors. Sci. Rep. 2020, 10, 10884. [Google Scholar] [CrossRef] [PubMed]
  11. Ye, C.; Kawasaki, M.; Nakano, K.; Ohnishi, T.; Watanabe, E.; Oda, S.; Nakada, T.A.; Haneishi, H. Acquisition and analysis of microcirculation image in septic model rats. Sensors 2022, 22, 8471. [Google Scholar] [CrossRef] [PubMed]
  12. Choi, K.H.; Dai, N.; Li, Y.L.; Kim, J.; Shin, D.; Lee, S.H.; Joh, H.S.; Kim, H.K.; Jeon, K.H.; Ha, S.J.; et al. Functional coronary angiography-derived index of microcirculatory resistance in patients with ST-segment elevation myocardial infarction. JACC Cardiovasc. Interv. 2021, 14, 1670–1684. [Google Scholar] [CrossRef] [PubMed]
  13. Naehle, C.P.; Steinberg, V.A.; Schild, H.; Mommertz, G. Assessment of peripheral skeletal muscle microperfusion in a porcine model of peripheral arterial stenosis by steady-state contrast-enhanced ultrasound and Doppler flow measurement. J. Vasc. Surg. 2015, 61, 1312–1320. [Google Scholar] [CrossRef] [PubMed]
  14. Chipperfield, A.J.; Thanaj, M.; Clough, G.F. Multiscale, multidomain analysis of microvascular flow dynamics. Exp. Physiol. 2020, 105, 1452–1458. [Google Scholar] [CrossRef] [PubMed]
  15. Elgendi, M. On the analysis of fingertip photoplethysmogram signals. Curr. Cardiol. Rev. 2012, 8, 14–25. [Google Scholar] [CrossRef] [PubMed]
  16. Küçüksayan, A.S.; Sircan, A.K.; Küçüksayan, E. A New Low-Cost and Portable Optical Device for Real-Time Assessment of Tissue Microcirculation. In 2019 Medical Technologies Congress (TIPTEKNO), Izmir, Turkey, 2019, pp. 1–4. [CrossRef]
  17. Chaudhry, R.; Miao, J.H.; Rehman, A. Physiology, cardiovascular. StatPearls. Available online: https://www.ncbi.nlm.nih.gov/books/NBK493197/.
  18. Namba, T.; Masaki, N.; Takase, B.; Adachi, T. Arterial Stiffness assessed by cardio-ankle vascular index. Int. J. Mol. Sci. 2019, 20, 3664. [Google Scholar] [CrossRef] [PubMed]
Figure 1. (a) Finger-mounted measurement tool; (b) mounted state.
Preprints 137970 g001
Figure 2. Measurement posture with measurement device held at navel, chest, and forehead heights.
Preprints 137970 g002
Figure 3. Photoplethysmogram height (S) and acceleration plethysmogram a-wave peak height (a).
Preprints 137970 g003
Figure 4. Velocity and acceleration plethysmogram feature values: (a) FWHMVPG; (b) ab time; (c) normalized a-b, normalized a-d.
Preprints 137970 g004
Figure 5. Penetration depth of green and near-infrared light received by photodiode (PD).
Preprints 137970 g005
Figure 6. Example of changes in a-wave peak time difference between green light and the near-infrared acceleration plethysmograms (time delay between green light and near-infrared light a-wave peaks) in the same subject when this time delay is (a) large and (b) shortelocity and acceleration plethysmogram feature values: (a) FWHMVPG; (b) ab time; (c) normalized a-b, normalized a-d.
Preprints 137970 g006
Figure 7. Relationship between time delay of green light a-wave peak from near-infrared light a-wave peak and reciprocal of green light photoplethysmogram amplitude (S).
Preprints 137970 g007
Figure 8. Relationship between systolic blood pressure and each feature value when height of measurement site (finger) from heart changes and when vicinity of the measurement site is cooled: (a) 1/FWHMVPG (green light); (b) a/S (green light); (c) (a-b)/(a-d) (green light); (d) 1/ab time (green light).
Preprints 137970 g008
Figure 9. Relationship between systolic blood pressure and each feature value when height of measurement site (finger) from heart changes and when vicinity of measurement site is cooled: (a) 1/FWHMVPG (near-infrared light); (b) a/S (near-infrared light); (c) (a-b)/(a-d) (near-infrared light); (d) 1/ab time (near-infrared light).
Preprints 137970 g009
Figure 10. Examples of waveforms with different photoplethysmogram rising slopes: (a) photoplethysmogram waveform; (b) 1/FWHMVPG and a/S change; (c) (a-b)/(a-d) and 1/ab time change.
Preprints 137970 g010
Figure 11. Relationship between wrist systolic blood pressure and 1/FWHMVPG (green light).
Preprints 137970 g011
Figure 12. Relationship between the wrist systolic blood pressure and the time delay of green light a-wave peak from near-infrared light a-wave peak.
Preprints 137970 g012
Figure 13. Relationship between 1/FWHMVPG (green light) and time delay of green light a-wave peak from near-infrared light a-wave peak.
Preprints 137970 g013
Figure 14. Relationship between wrist systolic blood pressure and 1/FWHMVPG (green light) at varying heights above heart.
Preprints 137970 g014
Figure 15. Relationship between wrist systolic blood pressure and time delay of green light a-wave peak from near-infrared light a-wave peak when height above heart changes.
Preprints 137970 g015
Figure 16. Relationship between 1/FWHMVPG (green light) and time delay of green light a-wave peak from near-infrared light a-wave peak when height from heart changes.
Preprints 137970 g016
Figure 17. Photoplethysmogram DC component and 1/FWHMVPG (green light) when excessive pressure is applied.
Preprints 137970 g017
Disclaimer/Publisher’s Note: The statements, opinions and data contained in all publications are solely those of the individual author(s) and contributor(s) and not of MDPI and/or the editor(s). MDPI and/or the editor(s) disclaim responsibility for any injury to people or property resulting from any ideas, methods, instructions or products referred to in the content.
Copyright: This open access article is published under a Creative Commons CC BY 4.0 license, which permit the free download, distribution, and reuse, provided that the author and preprint are cited in any reuse.
Prerpints.org logo

Preprints.org is a free preprint server supported by MDPI in Basel, Switzerland.

Subscribe

© 2024 MDPI (Basel, Switzerland) unless otherwise stated