
Submitted:
30 October 2024
Posted:
31 October 2024
You are already at the latest version
Abstract
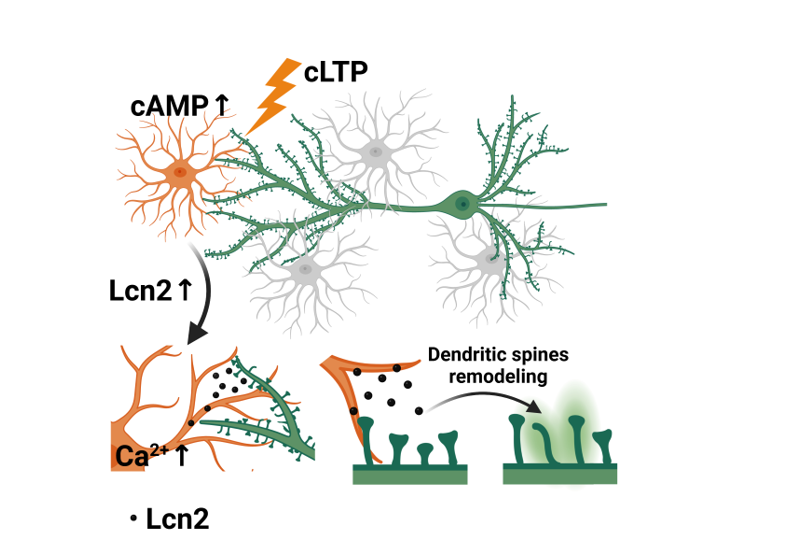
Learning and memory formation rely on synaptic plasticity, the process that changes synaptic strength in response to neuronal activity. In the tripartite synapse concept, molecular signals that affect synapse strength and morphology originate not only from the pre- and post-synaptic neuronal terminals but also from astrocytic processes ensheathing many synapses. Despite sig-nificant progress made in understanding astrocytic contribution to synaptic plasticity, only a few astrocytic plasticity-related proteins have been identified so far. In this study, we present evi-dence indicating the role of astrocyte-secreted Lipocalin-2 (Lcn2) in neuronal plasticity. We show that Lcn2 expression is induced in astrocytes in a kainate-evoked aberrant plasticity model. Next, we demonstrate that chemically induced long-term potentiation (cLTP), similarly increases Lcn2 expression in astrocytes of mix hippocampal cultures and that glutamate causes the immediate release of Lcn2 from these cultures. Additionally, through experiments in primary astrocytic cultures, we reveal that Lcn2 release is triggered by calcium signaling and we demonstrate that brief treatment of hippocampal neurons with Lcn2 alters morphology of dendritic spines. Based on these findings, we propose Lcn2 as an activity-dependent molecule released by astrocytes that influences dendritic spines morphology.
Keywords:
Lcn2
; cLTP
; dendritic spines
; astrocytes
; exocytosis
; glia
; gliotransmitter
; aberrant plasticity
1. Introduction
Learning a new information and storing it as a memory are among the brain major functions. At the cellular level, these cognitive processes rely mainly on synaptic plasticity, which is the ability of synapses to either strengthen or weaken in response to activity [1]. To date, synaptic plasticity has been studied mainly on excitatory synapses that are located primarily on dendritic spines - small dendritic protrusions [2]. The spines exhibit a continuum of shapes that are commonly categorized into mushroom, long and stubby [3,4]. The morphological characteristics of dendritic spines, such as the size of the spine head and neck, have been correlated with the synapse strength [5,6]. One of the most studied models of synaptic plasticity is long-term potentiation (LTP), where upon stimulation synapses are strengthened by the insertion of AMPA (α-amino-3-hydroxy-5-methyl-4-isoxazolepropionic acid) receptors into a spine membrane and this process is also associated with the spine enlargement [7,8,9,10]. Since its discovery, the mechanisms underlying LTP induction, expression and maintenance has been described in details [7,8,9,10].
Recently however, a more complex model of synapse and its plasticity, gained significant attention. The tripartite synapse model appreciates not only signals originating in the pre- or post-synaptic terminals of neurons, but also coming from fine astrocytic processes that ensheath a substantial proportion of synapses in the central nervous system [11,12,13,14]. The astrocytes sense various neurotransmitters, including glutamate, ATP, GABA (γ-aminobutyric acid), norepinephrine, and many others [15,16,17] and respond by increasing intracellular Ca2+ levels. The Ca2+ signals, have been shown to trigger exocytosis of gliotransmitters such as D-serine, ATP or glutamate which in turn influences synaptic strength and plasticity [13,18,19,20]. Although significant progress has been made in understanding astrocytic modulation of synaptic transmission, ongoing efforts aim to identify novel activity-dependent molecules released by astrocytes and clarify the mechanisms of their action on neuronal cells.
One of the proteins that recently emerged as an important mediator of neuronal morphology and function, which has been shown to have also glial origin is Lipocalin-2 (Lcn2, also known as NGAL and 24p3) [21,22,23,24,25]. It is a small, extracellular protein that binds siderophore-complexed iron and contributes to the innate immune response by limiting iron availability for pathogens [26,27]. In the central nervous system, Lcn2 has primarily been studied in the context of brain pathologies, including neuroinflammation, ischemia, pain, multiple sclerosis, epileptogenesis, stress and Alzheimer disease [21,23,24,25,28,29]. Data collected from different models consistently show an increase in Lcn2 expression in the brain in response to disease or injury. Depending on the model and the brain region, Lcn2 has been detected in various cell types, including astrocytes, microglia, neurons, epithelial cells, and choroid plexus endothelial cells [21,23,25,28,30,31,32,33]. However, the precise physiological functions of Lcn2 remain elusive. Research using mice with constitutive knockout of Lcn2 revealed that the absence of Lcn2 impairs hippocampal neurogenesis [34] and alters neuronal morphology in hippocampus and amygdala, with varying effects across neuron subpopulations and brain structure [22,24,25]. These morphological changes have been reported to be accompanied by functional impairments, such as decreased LTP in the CA1 region of the dorsal hippocampus and increased excitability of pyramidal neurons of the hippocampal CA1 and basolateral amygdala [22,24,25]. Moreover, Lcn2 knockout mice exhibit anxiety, depression-like behaviors, and mild cognitive impairment [22]. These observations underscore the need for a more comprehensive understanding of Lcn2 role in brain function.
In the present study, we demonstrated in vivo that the expression of Lcn2 in astrocytes increases during kainate-induced aberrant plasticity. Furthermore, we employed cell cultures, pharmacological manipulations, molecular biology techniques, and live-cell imaging to demonstrate in vitro that: 1) Lcn2 is expressed in astrocytes in response to chemical LTP (cLTP); 2) the release of Lcn2 can be triggered by glutamate stimulation; 3) release of Lcn2 is induced by calcium influx to astrocytes; 4) the Lcn2 treatment induces rapid changes in dendritic spine morphology. Together, our findings suggest the involvement of astrocytic Lcn2 in the regulation of dendritic spines morphology.
2. Materials and Methods
2.1. Animals
Male adult C57BL/6 mice were maintained in the Animal House of the Nencki Institute of Experimental Biology and were treated in compliance with the ethical standards of European and Polish regulations. Animals were housed individually with free access to food and water, at temperatures 23–25 °C, under a 12h light/12h dark cycle. The experimental procedures were approved by the 1st Local Ethics Committee in Warsaw (permission no. 678/2015).
2.2. Kainic Actid Injections
Mice were anesthetized by isoflurane inhalation (Baxter) in oxygen. Then they were put in a stereotaxic frame and injected unilaterally with kainic acid (70 nl of 20 mM solution; Nanocs) into the left CA1 area of the dorsal hippocampus (coordinates relative to bregma: AP −1.8 mm, ML +1.7 mm, and DV −2.3 mm). During the procedure, the mice were kept on a heating pad in order to prevent hypothermia. Control animals used for the DAB staining were injected with NaCl following the same procedure as described above.
2.3. Staining of Brain Slices
Eighteen days after kainate injection, mice underwent transcardial perfusion with 4% paraformaldehyde in PBS. The brains were post-fixed in the same solution overnight (ON) at 4°C and sectioned on a vibratome into 40μm-thick slices.
The brain sections used for Nissl staining were air-dried on slides, stained with 0.1% cresyl violet solution (in 3% acetic acid) for 5 min. Following washing, the sections were dehydrated, cleared in xylene, and closed with coverslips.
The brain slices used for DAB staining were washed thrice with PBS and the endogenous peroxidase was quenched for 5 min (10% methanol and 3% H2O2 in PBS). After thrice wash with PBS slices were permeabilized in 0.2% Triton X-100 in PBS for 15min, washed thrice with PBS, blocked in 10% normal horse serum (NHS) in PBS at RT and incubated ON at 4°C with primary anti-Lcn2 antibody (AF1857, diluted 1:200 in PBS with 2% NHS). Then they were washed three times with PBS and incubated for 2h at RT with secondary biotinylated anti-goat antibody (Vector, BA-9500, diluted 1:500 in PBS with 3% NHS). After thrice wash with PBS the cells were incubated for 1.5h with Avidin/Biotin Complex (ABC) Reagent (Vector Labs, PK-6100, VECTASTAIN® Elite® ABC-HRP Kit, Peroxidase), washed twice with PBS, incubated for 1-2 min with SIGMAFAST™ DAB (Sigma) and washed with miliQ water. Then slices were dried on slides, dehydrated with ethanol, cleared in xylene, mounted with DEPEX and imaged under Olympus IX70 microscope.
For fluorescent staining brain slices were washed with TNT buffer (100 mM Tris pH 7.4, 150 mM NaCl, 0.05% Tween 20), permeabilized in 0.3% Triton X-100 in TNT for 10 min, washed with TNT and blocked for 1h in TNB buffer [0.1 M Tris-HCl pH 7.5, 0.15 M NaCl, 0.5% blocking reagent (PerkinElmer FP1020)]. After blocking, slices were incubated ON at 4°C with primary antibodies diluted in TNB buffer: anti-mouse-Lcn2 antibody (1:300, goat, R&D, AF-1857) and anti-GFAP-Cy3 (1:1000, mouse, C9205, Sigma). Next, the slices were washed with TNT, incubated for 1h at RT with secondary biotinylated anti-goat antibody (Vector, BA-9500, diluted 1:500 in TNB buffer), washed with TNT, and incubated for 1h at RT with Alexa-Avidin (1:500 in TNB). After washing with TNT, slices were mounted on slides and imaged under Leica TCS SP5 confocal microscope.
2.4. DNA Vectors
To create the pβactin-Lcn2-SEP plasmid: 1) the lcn2 gene was amplified from P14 rat hippocampal cDNAs sample using Fwd: 5’- AGGAAGCTTGCTGAAACCATGGGCCTGGG, Rev: 5’- GGGAATTCGTTGTCAATGCATTGGTCGGTGGG primers and cloned to pβactin-GFP at HindIII, EcoRI restriction sites yielding the pβactin-Lcn2-GFP plasmid 2) the superecliptic pHluorin (SEP) was amplified using a pair of primers: Fwd: 5’- GGGAATTCAAAGGAGAAGAACTTTTCACTGGAG and Rev: 5’- CCTCTAGATCATTTGTATAGTTCATCCATGCC 3) green fluorescent protein (GFP) fragment was cut out from the pβactin-Lcn2-GFP plasmid with EcoRI and XbaI restriction enzymes and the amplified SEP gene was cloned at this restriction sites. To create the pZac2.1_gfaABC1D_Lcn2_FLAG_SEP: 1) the lcn2_SEP sequence was amplified from pβactin-Lcn2-SEP using Fvd: 5’- CGCGCTAGCGCTAAGCTTGCTGAAAC, Rev: 5’- GGCGCTCGAGGCGGCCGCATTCATTTGTATAG and cloned to pZac2.1gfABC1D_MCS plasmid at NheI, XhoI restriction sites yielding the pZac2.1gfABC1D_Lcn2_SEP plasmid 2) the FLAG linker was cloned in-between Lcn2 and SEP coding sequences using NEBuilder HiFi DNA Assembly Kit (New England Biolabs) according to the manufacturer protocol. The plasmid backbone was amplified from pZac2.1gfABC1D_Lcn2_SEP with Q5 polymerase used alongside with Q5 High GC Enhancer and Fvd: 5’- AAAGGAGAAGAACTTTTCACTGG and Rev: 5’- GTTGTCAATGCATTGGTCGGTGGG primers. The single-stranded oligonucleotide that was cloned into the backbone contained FLAG sequence and plasmid overlaps necessary for the assembly (5’-TCCCACCGACCAATGCATTGACAACGGATCCGACTACAAGGATGACGATGACAAGAGTAAAGGAGAAGAACTTTTCACTGGAG).
2.5. Cell Culture and Transfection
Dissociated primary hippocampal and cortical cultures were prepared from P0 Wistar rats as described previously [35,36]. For the life cell imaging experiment hippocampal cells were transfected at DIV 7-9 with 2 µg of pSynapsin_GFP plasmid. Transfection was done for 1h in a medium containing Neurobasal-A without phenol red (Gibco/Life Technologies) and 1% GlutaMax (Gibco/Life Technologies) and was carried using Lipofectamine 2000 reagent (Thermo Fisher Scientific). After transfection conditioned maintenance medium was recovered to the cells. For the glutamate stimulation the dissociated cortical cells were electroporated with 1.5µg of pβactin-Lcn2-SEP and 1.5 µg of pβactin-RFP using Rat Neuron Nucleofector Kit (Amaxa, Lonza, Germany) according to the protocol provided by the manufacturer.
The primary astrocytic cultures were prepared from P0 Wistar rats. The cortices were isolated and dissociated following the same procedure as used for mix cultures [36]. For the astrocytic cultures the plating medium (PM) comprised DMEM (high glucose, with GlutaMAX™ Supplement), 10% FBS, 1% penicillin and streptomycin (all from Gibco/ Life Technologies). After isolation the cells suspended in PM were transferred to 75 cm2 culture flasks. The fresh PM medium was provided the day after plating. After reaching 80% confluency the cells were shaken (6h, 240 rpm, 37°C) in fresh PM to remove the oligodendrocytes. Afterwards, the cells were washed with PM, and the PM medium was exchanged. On the next day the cells were shaken (1h, 180 rpm, 37°C) to remove microglial cells. Then the astrocytes were washed with PM, and the fresh PM medium was provided. For the experiments the astrocytic cells were electroporated with 5 µg of pZac_gfaABC1D_Lcn2_FLAG_SEP plasmid using nucleofection reagents for primary mammalian glial cells according to the manufacturer’s protocol (Amaxa, Lonza, Germany).
2.6. Glutamate Stimulation
At DIV 7-8 the culture medium from pβactin-Lcn2-SEP transfected cortical cultures was collected. Then the cultures were stimulated with 50µM glutamate (Sigma Aldrich) either for 10min or for 30min at 37°C in a fresh culture medium (Neurobasal-A without phenol red, 2% B27, 1% GlutaMax [all from Gibco/Life Technologies]). The unstimulated cells were kept for 30 min at 37°C in a fresh culture medium without glutamate addition. The culture medium before and after glutamate treatment was tested for the presence of the Lcn2-SEP protein using the standard Western Blot procedure. To reduce background, the membrane was blocked overnight (ON) at 4°C with 5% non-fat milk in Tris-buffered saline with 0.1% Tween® 20 Detergent (TBST). The primary anti-Lcn2 antibody (R&D, AF-3508, ON at 4°C) was diluted 1:200 and secondary antibody was diluted 1:10000 (anti-goat HRP, Invitrogen 81-1620, 1h at room temperature (RT)). The signal was detected with ECL Prime chemiluminescent substrate (Amersham), and the quantification was carried out using Image Lab software (BioRad). To avoid confounding effects from unequal Lcn2-SEP overexpression between wells, we have a standardized level of Lcn2-SEP released after treatment relative to its basal level in a culture medium before stimulation.
2.7. Life Cell Imaging
The life cell imaging was carried at DIV19-23 on the primary hippocampal cultures transfected with pSynapsin_GFP. The cells were placed in the imaging chamber, which was heated to 37°C and saturated with 5% CO2, and imaged with Leica TCS SP8 confocal microscope using HC PL APO CS2 63x/1.20 water immersion objective and 488 laser line. Acquired images of secondary and tertiary dendrites had 1024 × 1024 resolution and 0.069 x 0.069 µm pixel size. The same dendritic spines were imaged at two distinct time points (0min and 20min). At “time 0” 500 ng of rat recombinant Lcn2 (R&D, 3508-LC-050) dissolved in 50μl of the conditioned culture medium was added to “Lcn2” sample. In the “control” sample the culture medium was added instead of the recombinant Lcn2. The morphological parameters of the dendritic spines (area, length, head_width, length/head_width ratio) were determined using the SpineMagic Software [37]). The spines were then divided to “mushroom”, “stubby”, and “long” groups based on their shape at time 0. The classification was done using SpineTools Python script [38]. Next, we have chosen all the spines in mushroom and stubby category, and we normalized their length/width ratio for both times (0 and 20 minutes) to an average length/width ratio of spines at time 0 (separately for rLcn2-treated group and control). Since the biggest source of variance in our data are individual cells, we have averaged length/width ratio parameter per cell and treated them as an independent variable in our analysis. The data were analysed using Prism with Repeated-Measures Two-Way ANOVA and a post-hoc Šídák's multiple comparisons test.
2.8. Stimulation of Primary Rat Astrocytic Cultures with Ionomycin and ATP
The experiment was carried two days after transfection of primary astrocytic cultures with pZac_gfaABC1D_Lcn2_FLAG_SEP. First, the culture medium was collected in order to check baseline Lcn2 release. Samples of cell medium were centrifuged for 10 min at 16,000 × g to remove all cell debris and the supernatants were mixed with 5x Leammli buffer and analyzed using standard Western Blot procedure. The cells were washed twice with NRS buffer (10 mM HEPES-NaOH, pH 7.4; 140 mM NaCl, 5 mM KCl, 0.8 mM MgCl2, 2 mM CaCl2, 10 mM glucose) and then incubated for 5 or 20 minutes with NRS buffer containing 50 µM ATP (Merck) or 5 µM Ionomycin (Alomone labs). Control samples were incubated with NRS buffer with 0.025% DMSO. The proteins released to NRS buffer during stimulation were precipitated at 4°C with 60% EtOH, centrifuged at 15,000 × g for 5 min, resuspended in 1x Leammli buffer and probed for the presence of Lcn2_FLAG_SEP using standard Western Blot procedure. To reduce background and increase sensitivity of Lcn2 detection we blocked membrane with 5% non-fat milk in TBST ON at 4°C, used low concentrations of primary (anti-Lcn2, R&D, AF-3508, 1:1000, ON at 4°C) and secondary antibodies (anti-goat HRP, Invitrogen 81-1620, 1:100000, 1h at RT) and detected signal with West Femto chemiluminescent substrate (ThermoFisher Scientific). Signal quantification was carried using GelAnalyzer 19.1 software (available at www.gelanalyzer.com) by Istvan Lazar Jr. and Istvan Lazar Sr. To avoid confounding effects from unequal Lcn2-SEP overexpression between wells we have standardized level of Lcn2-SEP released after treatment relative to its basal level in a culture medium before stimulation.
2.9. Chemical Long-Term Potentiation (cLTP)
The cLTP experiment was carried on dissociated hippocampal cultures at DIV21-29 based on the previously published protocol [39]. In order to silence the spontaneous synaptic transmission the cells were incubated for 3h in the conditioned medium mix with 40 μM 6-cyano-7-nitroquinoxaline-2,3-dione (CNQX, Sigma-Aldrich), 100 μM (2R)-amino-5-phosphonovaleric acid (APV, Sigma-Aldrich), and 5 μM nimodipine (Sigma-Aldrich). Then the silencing mixture was removed, and the conditioned medium with 50 μM forskolin (Sigma Aldrich), 0.1 μM rolipram (Sigma Aldrich), and 50 μM picrotoxin (PTX) (Sigma Aldrich), was added to the cells for 24h to induce the cLTP. The control cells were silenced for 3h and then kept for 24h in conditioned medium without the drugs.
2.10. RNA Isolation and Quantitative Real-Time PCR
For the experiment, the cells subjected to the cLTP procedure were lysed using RLT buffer (Qiagen), and the RNA isolation was done with Qiagen RNeasy mini kit (Qiagen). The DNA was removed from samples using Turbo DNA-free kit (Invitrogen). The reverse transcription reaction was carried using SuperScript IV Reverse Transcriptase (Invitrogen). The PCR was done in the Applied Biosystems 7900HT Fast Real-Time PCR System using rat Lcn2 (Thermo Fisher Scientific, Rn00590612_m1), and rat GAPDH (Thermo Fisher Scientific, Rn01775763_g1) probes and TaqMan Fast Advanced Master Mix. The data were analyzed using ∆∆CT relative quantification method and normalized relative to GAPDH levels.
2.11. Immunostaining of the Cell Cultures
For immunocytochemistry the cells subjected to cLTP were fixed with pre-warmed 4% paraformaldehyde (PFA) and 4% sucrose in phosphate-buffered saline (PBS), pH~7.4, washed three times with PBS and kept in PBS with 0.02% sodium azide until the immunostaining. On the day of experiment fixed cells were washed three times with PBS, permeabilized with 0.3% Triton X-100 in PBS for 10min, washed with PBS and blocked for 1h at RT using TNB buffer [0.1 M Tris-HCl pH 7.5, 0.15 M NaCl, 0.5% blocking reagent (PerkinElmer FP1020)] with 10% normal donkey serum (NDS). Next the cells were incubated overnight (ON) at 4°C with anti-Lcn2 antibody (goat, 1:300, R&D, AF-3508), washed 3 times with PBS and incubated with anti-goat Alexa Fluor 488 (Invitrogen, A-11055) for 1h at RT. After thrice wash with PBS they were incubated ON at 4°C with GFAP (rabbit, 1:500, Abcam, AB7260) and MAP-2 (mouse, 1:500, m1406, Sigma-Aldrich) antibodies. Next, they were washed three times with PBS and incubated for 1h at RT with anti-rabbit Alexa Fluor 568 (Invitrogen, A-11036) and anti-mouse Alexa Fluor 647 (Invitrogen, A-31571) antibodies. All antibodies were diluted in TNB buffer with 10% NDS. After trice wash with PBS the cells were mounted using Fluoromount-G Mounting Medium, with DAPI (Thermo Fisher Scientific) and kept at 4°C until imaging. The images were acquired with Leica TCS SP8 confocal microscope using HC PL APO CS2 20x/0.75 immersion objective, 488/561/640 nm lines of white light laser and 405 nm line of pulse diode laser. Four fields were collected from each culture-well. Acquired images had 1024 × 1024 resolution and 0.568 x 0.568µm pixel size. For the analysis, the images were processed using Fiji distribution of ImageJ software [40]. The maximum intensity projections were obtained from the Z-stack series. In the DAPI channel the displayed pixel values were set to minimum = 0 and maximum = 30. The appropriate channels were merged in order to calculate number of Lcn2/GFAP, Lcn2/MAP-2, MAP-2/DAPI and GFAP/DAPI positive cells. Finally, the percentage of Lcn2/GFAP cells relative to GFAP/DAPI was calculated.
2.12. Total Internal Reflection Fluorescence (TIRF) Microscopy
For the TIRF imaging the coverslip with astrocytes was placed in a living chamber heated to 32°C with a constant flow of NRS buffer. First, the one-minute movie of the unstimulated astrocyte was recorded and then the NRS buffer was changed to NRS buffer with 5µM Ionomycin. The one-minute movies of the stimulated cells were recorded two minutes after the start of buffer exchange. Each movie consisted of 2000 frames recorded at the rate of 33 Hz with 11 millisecond exposure time. The movies were recorded on a QuantEM™ 512SC EMCCD camera [Photometrics] with 2x2 binning, resulting in a 256x256 frame resolution and 0.32 x 0.32 µm pixel size. The imaging was done on Carl Zeiss TIRF microscope equipped with Alpha Plan-Apochromat 100x/1.46 oil immersion objective and 488 laser line brought to an angle required for total internal reflection microscopy. Presence of the exocytosis events was determined using Suite2p [41] software and verified using custom ImageJ macros [40].
2.13. Statistical Analysis
The statistical analysis was performed using Graphpad Prism software (GraphPad Software, Inc.). The two-group comparison was carried using unpaired t-test with the exception of the quantification of Lcn2-SEP release rate which was analyzed with paired t-test. The multiple group comparison was done using either one-way analysis of variance (ANOVA) followed by Dunnett's or Tukey's multiple comparisons or repeated-measures two-way ANOVA followed by Šídák's post-hoc test. The data were presented as mean ± standard errors of the means (SEM).
2.14. Figures Preparation
We used ImageJ [40], CorelDraw and Biorender (https://www.biorender.com/) for preparing figures. GPT-4 (https://chatgpt.com/) and Claude 3.5 Sonnet (https://claude.ai/) were used to improve the readability and grammar of the text, and suggested changes were carefully reviewed and edited to ensure manuscript accuracy and coherence.
3. Results
3.1. Lcn2 Expression in Astrocytes Is Increased in a Kainate Model of Aberrant Plasticity
Kainate (KA) is a potent analog of glutamate that triggers considerable synaptic plasticity in the dentate gyrus (DG) region of the hippocampus by causing excitotoxity in CA subfields. It is therefore a great model to test an engagement of genes in synaptic plasticity [42] and we used it to identify cells expressing Lcn2 during synaptic plasticity. We delivered kainate through unilateral intrahippocampal injection of kainic acid and looked for changes in Lcn2 expression 18 days after treatment. As expected, the kainate injections induced cell death in CA1-CA3 subfields and led to structural reorganization of DG as manifested by granule cell dispersion (Figure 1A).
The immunohistochemical analysis of the brain slices revealed that kainate treatment induces Lcn2 expression in DG (Figure 1B). The Lcn2 positive cells resided predominantly in a DG hilus, subgranular zone as well as in a molecular layer, some Lcn2 positive cells are also present in granule cell layer (Figure 1B). The subsequent immunocytochemistry demonstrated that kainate increased expression of Lcn2 in hilus and granule cell layer of DG (Figure 1D), and that in this region, Lcn2 protein localized predominantly to GFAP-positive astrocytes (Figure 1C).
3.2. Lipocalin-2 Expression in Astrocytes Is Increased After cLTP
Since Lcn-2 is increased and appears in the brain in astrocytes during aberrant plasticity, we decided to determine if Lcn2 expression is also induced in another model of plasticity - LTP. We have selected this paradigm as it has been previously reported that Lcn2-deficient mice have impairments in hippocampal LTP [22]. In order to activate big population of cells, we induced cLTP in hippocampal dissociated cultures [39] using the protocol which has been previously shown to lead to morphological changes in dendritic spines, increase network activity as well as to induce gene transcription [35,43,44,45,46,47,48]. The quantitative real-time RT-PCR analysis of RNAs isolated from the cultures showed an increase in Lcn2 mRNA levels 24h after cLTP induction compared to untreated controls, while Lcn2 mRNA levels 6h after cLTP were not statistically different from the control (Figure 2A).
Since both neurons and astroglia have been reported to be a source of Lcn2 [21,25,31], and dissociated hippocampal cultures consist of both types of cells, we sought to determine which cell type expresses Lcn2 in response to cLTP. The immunocytochemistry analysis of mix primary hippocampal cultures fixed 24h after cLTP induction revealed the presence of Lcn2 protein in the cytoplasm of some GFAP-positive astrocytes (Figure 2B). Interestingly, we were not able to identify Lcn2 signal in MAP2-positive cells. The quantification of the number of Lcn2 and GFAP double-positive cells has shown an increase in Lcn2 protein levels in response to 24-hour cLTP compared to control (Figure 2C).
3.3. Lipocalin-2 Is Released Immediately After Glutamate Stimulation
The astrocytes actively participate in the synaptic plasticity by releasing gliotransmitters in response to activity-dependent neurotransmitter secretion [49,50]. To determine if Lcn2 is released in response to neuronal stimulation, we have overexpressed Lcn2 in fusion with pH-dependent superecliptic pHluorin (SEP) in primary cortical cultures and treated them with 50 µM glutamate at 7-8 days in vitro (DIV). As the molecules essential for plastic changes are rapidly released after stimulation, we specifically conducted Western blot analysis of culture medium at 10 and 30 min after glutamate treatment. The level of Lcn2 protein increased 10 minutes after glutamate, while 30 min incubation was not statistically different from not-treated cultures (Figure 2). This result suggests that Lcn2 can be released upon stimulation into the extracellular space.
3.4. Lipocalin-2 Release Is Triggered by the Calcium Influx to the Astrocytic Cells
In the tripartite synapse model, the release of neurotransmitters triggers an increase in cytosolic Ca2+ levels in astrocytes, consequently leading to the secretion of gliotransmitters. In order to explore whether the mechanism of Lcn2 exocytosis is Ca2+-dependent we used Lcn2-SEP expression plasmid. Initially, we expressed this construct in primary astrocytic cultures and used Western blotting to measure its release 5 and 20 minutes after treatment with either Ca2+ ionophore - Ionomycin or ATP. We selected ATP, in addition to directly increasing intracellular Ca2+ through Ionomycin application, as its action through purinergic receptors is well documented to trigger an increase of Ca2+ in astrocytes through the PLC/IP3 signal cascade [51,52,53]. Importantly, ATP has previously been shown to increase Ca2+-level in cultured astrocytes and to induce release of SEP-tagged plasticity protein BDNF in these cultures [54]. To avoid confounding effects from ATP-induced LTP [55] we have carried out experiments in pure astrocytic cultures. The results revealed an increase in released Lcn2 20 min after ATP and Ionomycin treatment (Figure 4).
To gain insights into the dynamics of individual vesicle release, we employed total internal reflection microscopy (TIRF). With this technique, we utilized the pH-sensitive nature of SEP to track the release of Lcn2-SEP from primary astrocytic cultures (Figure 5A).
We recorded one-minute movies at baseline and two minutes after initiating the buffer exchange to one with Ionomycin. The release of Lcn2-SEP from vesicles was observed as a brief increase in fluorescence, which was followed by diffusion of protein from plasma membrane as indicated by the decline in fluorescence (Figure 5C,D). The analysis of the Lcn2 release rate demonstrated an increase in Lcn2 exocytosis 2 min after Ionomycin treatment, indicating that Lcn2 secretion from astrocytes is Ca2+-inducible (Figure 5B,E).
3.5. Lipocalin-2 Induces Rapid Changes in Dendritic Spine Morphology
The structural remodeling of dendritic spines during LTP occurs immediately after neuronal stimulation [56,57]. Therefore, we wanted to check if a transient exposure to Lcn2 can elicit rapid changes in dendritic spine shape. To do that, we transfected cultures with GFP, and at 19-23 DIV, we performed confocal live cell imaging to record changes in spine shape occurring 20 min after Lcn2 treatment. Next, we classified spines into mushroom, long, and stubby groups based on their shape at the beginning of the imaging. We observed that 20 min Lcn2 treatment increased the length-to-width ratio of mushroom and stubby spines (Figure 6), showing that short incubation with Lcn2 leads to change in shape toward more immature form of spines – narrow and elongated.
4. Discussion
Our study aims to provide evidence supporting the involvement of astrocyte-secreted Lcn2 in the synaptic plasticity. Specifically, we demonstrate that (i) Lcn2 protein is elevated in astrocytes after kainate-induced plasticity (ii) cLTP increases expression of Lcn2 in mix hippocampal cultures, (iii) Lcn2 is released immediately after glutamate-induced synaptic activation, and (iv) the astrocytic Lcn2 release is Ca2+- dependent. Moreover, (v) brief exposure to recombinant Lcn2 induces morphological changes in dendritic spines. Collectively, our findings indicate that astrocytic Lcn2 contributes to the regulation of structural plasticity of dendritic spines.
In our study, we have demonstrated that Lcn2 expression increases in astrocytes in vivo during kainate-induced aberrant plasticity. Chia et al. previously demonstrated that Lcn2 expression increases in the hippocampus following intraventricular kainate injection leading to excitotoxicity [21]. Their study specifically highlighted elevated Lcn2 levels in the CA1 and CA3 regions, where significant neurodegeneration was observed [21]. In turn, our observations show that Lcn2 is increased after kainate in astrocytes mainly in DG, a region undergoing gross plastic changes in that model (Figure 1).
This localization pattern suggests a role for astrocytic Lcn2 in plasticity rather than neurodegeneration [42]. To further investigate this plasticity-related function of Lcn2 we employed a chemical long-term potentiation (cLTP) protocol to investigate Lcn2 expression under conditions that induce stable, long-lasting synaptic potentiation in vitro [39]. This protocol combines activation of cAMP-dependent gene expression with a reduction in neuronal inhibition, effectively replicating key aspects of electrically evoked LTP, such as spine enlargement and sustained network activity [43,58]. Our findings have revealed a significant upregulation of Lcn2 expression following cLTP induction, evidenced by an increase in Lcn2 mRNA levels (Figure 2A) and an elevated number of astrocytes expressing Lcn2 protein (Figure 2B,C). Interestingly, we observed increase in Lcn2 protein level only in a subpopulation of astrocytes. Our data showing elevated mRNA and protein levels 24h after stimulation are in agreement with a recent study of Horino-Shimizu, where increase in Lcn2 expression was also shown 24h after glutamate stimulation [59]. Additionally, it is possible, that astrocytic proteins are more important for memory consolidation rather than expression, which can be supported by the recent study of Sun et al (2024) [60]. This view was also recently summarized in the paper of Murphy-Royal, (2023) [61] where the authors argue that astrocytes modulate neuronal networks acting as a contextual gate, which might decode multiple environmental inputs to shape neuronal circuits.
Interestingly, while our results point to a subpopulation of astrocytes as a source of Lcn2 during both kainate-induced aberrant plasticity as well as during cLTP, it is worth noting that the cellular origin of Lcn2 in the brain appears to be context-dependent [21,23,25,28,30,31,32,33]. Various cell types, including neurons, astrocytes, microglia and endothelial cells, have been identified to express Lcn2 in brain pathologies. After kainate treatment, our immunohistochemistry analysis revealed that the majority of Lcn2-positive cells in DG localized to hilus, subgranular zone, and molecular layer with only single cells observed in the granule cell layer, suggesting a non-neuronal origin (Figure 1B). In the following immunofluorescence staining of DG hilus and granule cell layer the Lcn2 signal colocalized almost exclusively with GFAP – astrocytic marker (Figure 1C). We have not observed a Lcn2 signal, which couldn’t be assigned to GFAP-positive cells. This is in contrast with the massive neuronal Lcn2 expression which was previously observed after pathological conditions of restrain stress [24,25].
In the basal conditions, there are limited data regarding the expression and cellular origin of Lcn2 in the brain. In our cLTP model, the Lcn2 expression localized to astrocytes (Figure 2B) confirming our in vivo observations. Any residual signal in our immunofluorescence staining comes from autofluorescence induced by 488 laser and was also present in a control staining lacking anti-Lcn2 primary antibody (Supplementary Figure S1). Additionally, we were unable to observe if cLTP induces Lcn2 expression in microglia, as our culture model lacks this type of cells [62], but we have not observed a Lcn2-signal which couldn’t be assigned to a GFAP-positive cell. The astrocytic Lcn2 expression in a model of physiological plasticity aligns with previous findings by Chia et al. (2011) [21], who detected Lcn2 mRNA and protein in several brain regions and demonstrated that in untreated mice Lcn2 protein localizes to astrocytes (olfactory bulb, cerebellum and brainstem) and to epithelial cells (choroid plexus). The low levels of Lcn2 in untreated mice were also reported by two other studies [24,25]. Physiological Lcn2 expression is also supported by a transcriptomic study conducted by Cajigas et al. (2012) [63] who detected Lcn2 mRNA among transcripts isolated from the neuropil layer of hippocampal CA1, a brain region that contains dendrites, axons, glia, sparse interneurons, and blood vessels but not in transcripts from pyramidal neuron somata. Although the specific cellular source of Lcn2 in their study remains undetermined, these findings are consistent with our observations of astrocytic Lcn2 expression after cLTP. Notably, Lcn2 mRNA levels in the Cajigas et al. (2012) [63] study were low (6 reads), potentially explaining why we along with few other studies have not detected basal expression of Lcn2 protein [28,34,64]. However, it is important to note that limited abundance in the physiological brain does not preclude Lcn2 involvement in neuronal plasticity. In fact, low basal expression is characteristic of proteins whose overabundance could disrupt normal brain function, necessitating their tight regulation at multiple levels. For comparison, Matrix metalloproteinase-9 (MMP-9), a protein crucial for synaptic plasticity yet implicated in various pathological conditions when overexpressed [65], exhibited similarly low levels (5 reads) in the same dataset [63].
One potential mechanism for the regulation of Lcn2 expression during neuronal plasticity could be cAMP–PKA–CREB pathway that is activated by cLTP protocol used in our experiments. This pathway has been previously implicated in activity-dependent gene expression in astrocytes [66], and elevated astrocytic cAMP levels in vivo have been shown to trigger synaptic plasticity and influence memory formation [67].
Plasticity-related proteins are not only regulated at the transcriptional and translational levels, but also at the point of their secretion, allowing precisely timed responses to synaptic activity. Using Western blotting, we demonstrated rapid Lcn2 release from mix hippocampal cultures within 10 minutes of glutamate stimulation, indicating activity-induced exocytosis (Figure 2). Interestingly, we have not observed statistically significant increase in Lcn2 level in culture medium after 30 min from glutamate stimulation. This is most probably due to endocytosis of Lcn2 or the fact that it binds to the cell membrane. Previous studies have shown that in astrocytes, glutamate evokes a Ca2+ concentration rise, leading to release of gliotransmitters [12,16]. Here, we provided evidence for Ca2+-induced Lcn2 exocytosis from pure astrocytic cultures through two complementary approaches. Western blotting revealed increased extracellular Lcn2 levels 20 minutes after treatment with Ionomycin and ATP, both of which are known to elevate intracellular Ca2+ [68] (Figure 4). Furthermore, TIRF microscopy confirmed these findings, demonstrating a rapid increase in Lcn2 release rate within 2 minutes of Ionomycin application (Figure 5). Our results are in agreement with the recent report of Kim et al. (2024) [69], who also demonstrated Lcn2 release from astrocytes. However, the authors applied a different experimental approach [69]. They employed in vivo optogenetic stimulation of channelrhodopsin-2, which induces Ca2+ influx in astrocytes and showed using microdialysis a release of Lcn2 after repeated, and prolonged stimulation, that leads to neuroinflammation. Additionally, the authors used astrocytic cultures and showed a release of Lcn2 24 hours after a single 20-minute-long optogenetic stimulation. While their experiments support a general concept of Ca2+-induced Lcn2 release, our findings uniquely demonstrate that activity-induced release of Lcn2 can occur within minutes from stimulation. Importantly, other plasticity-related proteins are released in similar time from stimulation. For instance, the release of neuronal plasticity protein, MMP-9 is detectable within seconds after glutamate uncaging, when tracked at the level of single dendritic spines [56], and its level in the culture medium increases as early as 5 minutes after stimulation [70,71]. Additionally, the cleavage of MMP-9 target proteins such as BDNF and β-dystroglycan occurs on a similar time scale [70].
Although data on kinetics of activity-dependent protein release from astrocytes are limited, recent research by Liu et al. (2022) [72] provides valuable insights into the dynamics of BDNF secretion from both neurons and astrocytes and its impact on establishment of LTP [72]. Their study found that both cell types initiate BDNF release immediately after neuronal stimulation. However, as compared to neuronal BDNF release, astrocytic secretion displayed a smaller peak, longer duration, and slower kinetics. Yet, this specific release dynamics was crucial for establishment of long-lasting (over 120 minutes) LTP and remote memory. Our results are consistent with the findings of Liu et al. (2022) [72], as we observed the Lcn2 release immediately after Ca2+ influx (within 2 minutes) and the Lcn2 signal reached high concentrations in the medium within 10-20 minutes of stimulation. Thus, the dynamics of activity-dependent Lcn2 release align with those observed for other plasticity-related proteins.
Furthermore, we have demonstrated that 20-minute application of exogenous, recombinant Lcn2 significantly increases the length-to-head-width ratio of both mushroom and stubby dendritic spines (Figure 6). This parameter serves as a proxy for spine shape and its increase suggests spine elongation and/or head shrinkage, and thus indicates transformation of spines toward their less mature, filopodia-like form. These results are in line with the recent studies of Kim et al. (2024) [69], who has shown that treatment of hippocampal neurons with exogenous Lcn2 reduces levels of surface NMDA receptors, post-synaptic protein PSD levels and decreases level of LTP. Our results are also in agreement with Mucha et al. (2011) [25], who reported in in vitro model that prolonged exposure to Lcn2 (3-days) increases proportion of long spines and decreases proportion of mushroom spines. However, in vivo studies on Lcn2 effect on spine morphology show significant variability depending on the brain region examined. For example, Mucha et al. (2011) [25] and Skrzypiec et al. (2013) [24] observed no major changes in baseline spine morphology between wild-type and Lcn2-null genotypes in CA1, CA3 and basolateral amygdala. In contrast, Ferreira et al. (2013) [22] found that Lcn2-null mice have decreased proportion of mushroom spines and increased proportion of long spines in CA1 of dorsal hippocampus. In the model of prolonged stress, the impact of Lcn2 on spine morphology also varied by brain region [24,25]. In CA1 and CA3 fields of hippocampus the Lcn2 deletion leads to stress-induced shift toward mushroom morphology, which is not observed in wild-type animals. Conversely, in the basolateral amygdala, stress-induced changes in spine proportions are generally similar between genotypes [24].
Our results showing the effect of rLcn2 on dendritic spine morphology are however in contrast to changes observed after LTP, where synaptic strengthening is associated with dendritic spine enlargement [10]. Interestingly, a similar effect was previously observed for neuronal plasticity protein MMP-9 [35]. When applied exogenously the MMP-9 promotes an increase in the length/width ratio of dendritic spines [36], and its excessive activity, as observed in transgenic rats, impairs both LTP induction and maintenance [35]. At the same time other studies reported shift toward mushroom-shaped spines during enhanced MMP-9 activity [43,73]. The apparent contradiction was resolved by discovering that while MMP-9 activity leads to spine elongation, its subsequent inhibition with endogenous inhibitor TIMP-1 is indispensable for spine enlargement and LTP maintenance [35]. Therefore, we propose a conjecture that global application of Lcn2 promotes transition towards long, immature spines and has adverse effect on LTP, while the transient, local and controlled action of Lcn2 on synapse is required for spine maturation.
Although our results suggest that the Lcn2 acts as a novel activity-dependent molecule released by astrocytes which is involved in neuronal plasticity, our study is not without limitations. First, even though we have not observed Lcn2 signal which could not be assigned to GFAP-positive astrocytes, we cannot exclude that Lcn2 is not expressed in microglial cells under certain conditions. Therefore, further in vitro studies using more complex triple co-culture systems that contain microglia, as well as in vivo studies employing techniques with increased detection sensitivity (such as tyramide signal amplification), could help to resolve existing discrepancies about Lcn2 expression. Moreover, while our data support the concept of Ca2+-induced Lcn2 release upon activity, the molecular pathways that are activated by glutamate and ATP and result in Lcn2 exocytosis require further investigation. It would be crucial to systematically examine how inhibition of specific components of PLC/IP3 signaling cascade and as well as depletion of intracellular Ca2+ stores affect the Lcn2 release.
Furthermore, the mechanisms underlying the Lcn2-induced morphological changes are not yet fully understood. One potential mechanism involves Lcn2 interaction with MMP-9. In human, Lcn2 forms a complex with MMP-9, and regulates its stability and activity [74,75]. This interaction raises an intriguing possibility that astrocytic Lcn2 might influence dendritic spine morphology through its association with neuronal MMP-9, thus providing a novel pathway for astrocytic regulation of LTP. Notably, the Lcn2 release occurs in a time window of MMP-9 action and Lcn2-induced changes mimic those observed after MMP-9 application [36]. However, it has to be stressed that the presence of the Lcn2-MMP-9 complex in the rodent’s brain has not yet been confirmed. Lcn2 Cys-87 residue implied in the stabilization of human Lcn2-MMP-9 heterodimer is not present in mice and rats [76,77]. Thus, the involvement of the Lcn2-MMP-9 complex in rodents' brain plasticity warrants further study. Alternatively, Lcn2 might affect dendritic spines through a mechanism involving iron transfer [25]. Although Lcn2 itself cannot directly bind iron, it facilitates iron transfer through interaction with siderophore-iron complexes [78,79]. Nevertheless, the specific siderophore-iron complexes bound by Lcn2 in the brain remain unidentified.
5. Conclusions
In conclusion, our study supports the role of Lcn2 in the plasticity of dendritic spines and suggests its astrocytic origin in this process. We highlight the importance of precisely regulated Lcn2 release for normal brain function and open new avenues for understanding astrocyte-neuron interactions in learning and memory.
Supplementary Materials
The following supporting information can be downloaded at the website of this paper posted on Preprints.org.
Author Contributions
Conceptualization, K.K. and P.M.; methodology, K.K and P.M.; formal analysis, K.K, P.M, M.D, B.K, P.R; investigation, M.D., K.K. and B.K., K.N., P.R.; resources, L.K., P.M., K.K.; writing—original draft preparation, M.D, K.K. P.M.; writing—review and editing, K.K., P.M, M.D, B.K, P.R. L.K.; visualization, K.K; supervision, K.K and P.M.; project administration, K.K, P.M..; funding acquisition, M.D. and K.K. All authors have read and agreed to the published version of the manuscript.
Funding
This research was funded by National Science Centre, Poland grants Preludium 2015/19/N/NZ3/02334 (M.D.) and Opus 2022/45/B/NZ4/03262 (K.K). The authors report no financial interests or conflicts of interest.
Institutional Review Board Statement
The studies were performed in accordance with the European Communities Council Directive of November 24, 1986 (86/609/EEC), Animal Protection Act of Poland and approved by the 1st Local Ethics Committee in Warsaw (permission no 678/2015). All efforts were made to minimize the number of animals used and their suffering.
Data Availability Statement
Raw Data that support the findings of this study are available from the corresponding author upon request.
Acknowledgments
We thank Laboratory of Imaging Tissue Structure and Function in Center of Neurobiology of the Nencki Institute for access to imaging facility and microscopes used in this study.
Conflicts of Interest
The authors declare no conflicts of interest. The funders had no role in the design of the study; in the collection, analyses, or interpretation of data; in the writing of the manuscript; or in the decision to publish the results.
References
- Ramirez, A.; Arbuckle, M.R. Synaptic Plasticity: The Role of Learning and Unlearning in Addiction and Beyond. Biol Psychiatry 2016, 80, e73–e75. [Google Scholar] [CrossRef] [PubMed]
- Nimchinsky, E.A.; Sabatini, B.L.; Svoboda, K. Structure and Function of Dendritic Spines. Annu Rev Physiol 2002, 64, 313–353. [Google Scholar] [CrossRef] [PubMed]
- Pchitskaya, E.; Bezprozvanny, I. Dendritic Spines Shape Analysis—Classification or Clusterization? Perspective. Front. Synaptic Neurosci. 2020, 12. [Google Scholar] [CrossRef] [PubMed]
- Peters, A.; Kaiserman-Abramof, I.R. The Small Pyramidal Neuron of the Rat Cerebral Cortex. The Perikaryon, Dendrites and Spines. American Journal of Anatomy 1970, 127, 321–355. [Google Scholar] [CrossRef]
- Kasai, H.; Fukuda, M.; Watanabe, S.; Hayashi-Takagi, A.; Noguchi, J. Structural Dynamics of Dendritic Spines in Memory and Cognition. Trends Neurosci 2010, 33, 121–129. [Google Scholar] [CrossRef]
- Tønnesen, J.; Katona, G.; Rózsa, B.; Nägerl, U.V. Spine Neck Plasticity Regulates Compartmentalization of Synapses. Nat Neurosci 2014, 17, 678–685. [Google Scholar] [CrossRef]
- Patterson, M.A.; Szatmari, E.M.; Yasuda, R. AMPA Receptors Are Exocytosed in Stimulated Spines and Adjacent Dendrites in a Ras-ERK–Dependent Manner during Long-Term Potentiation. Proceedings of the National Academy of Sciences 2010, 107, 15951–15956. [Google Scholar] [CrossRef]
- Penn, A.C.; Zhang, C.L.; Georges, F.; Royer, L.; Breillat, C.; Hosy, E.; Petersen, J.D.; Humeau, Y.; Choquet, D. Hippocampal LTP and Contextual Learning Require Surface Diffusion of AMPA Receptors. Nature 2017, 549, 384–388. [Google Scholar] [CrossRef]
- Shi, S.-H.; Hayashi, Y.; Petralia, R.S.; Zaman, S.H.; Wenthold, R.J.; Svoboda, K.; Malinow, R. Rapid Spine Delivery and Redistribution of AMPA Receptors After Synaptic NMDA Receptor Activation. Science 1999, 284, 1811–1816. [Google Scholar] [CrossRef]
- Yang, Y.; Wang, X.; Frerking, M.; Zhou, Q. Spine Expansion and Stabilization Associated with Long-Term Potentiation. J Neurosci 2008, 28, 5740–5751. [Google Scholar] [CrossRef]
- Chai, H.; Diaz-Castro, B.; Shigetomi, E.; Monte, E.; Octeau, J.C.; Yu, X.; Cohn, W.; Rajendran, P.S.; Vondriska, T.M.; Whitelegge, J.P.; et al. Neural Circuit-Specialized Astrocytes: Transcriptomic, Proteomic, Morphological and Functional Evidence. Neuron 2017, 95, 531–549.e9. [Google Scholar] [CrossRef] [PubMed]
- Goenaga, J.; Araque, A.; Kofuji, P.; Herrera Moro Chao, D. Calcium Signaling in Astrocytes and Gliotransmitter Release. Front Synaptic Neurosci 2023, 15, 1138577. [Google Scholar] [CrossRef] [PubMed]
- Henneberger, C.; Papouin, T.; Oliet, S.H.R.; Rusakov, D.A. Long-Term Potentiation Depends on Release of D-Serine from Astrocytes. Nature 2010, 463, 232–236. [Google Scholar] [CrossRef]
- Ventura, R.; Harris, K.M. Three-Dimensional Relationships between Hippocampal Synapses and Astrocytes. J. Neurosci. 1999, 19, 6897–6906. [Google Scholar] [CrossRef] [PubMed]
- Perea, G.; Araque, A. Properties of Synaptically Evoked Astrocyte Calcium Signal Reveal Synaptic Information Processing by Astrocytes. J. Neurosci. 2005, 25, 2192–2203. [Google Scholar] [CrossRef] [PubMed]
- Porter, J.T.; McCarthy, K.D. Hippocampal Astrocytes In Situ Respond to Glutamate Released from Synaptic Terminals. J Neurosci 1996, 16, 5073–5081. [Google Scholar] [CrossRef]
- Suzuki, A.; Stern, S.A.; Bozdagi, O.; Huntley, G.W.; Walker, R.H.; Magistretti, P.J.; Alberini, C.M. Astrocyte-Neuron Lactate Transport Is Required for Long-Term Memory Formation. Cell 2011, 144, 810–823. [Google Scholar] [CrossRef]
- de Ceglia, R.; Ledonne, A.; Litvin, D.G.; Lind, B.L.; Carriero, G.; Latagliata, E.C.; Bindocci, E.; Di Castro, M.A.; Savtchouk, I.; Vitali, I.; et al. Specialized Astrocytes Mediate Glutamatergic Gliotransmission in the CNS. Nature 2023, 622, 120–129. [Google Scholar] [CrossRef]
- Pascual, O.; Casper, K.B.; Kubera, C.; Zhang, J.; Revilla-Sanchez, R.; Sul, J.-Y.; Takano, H.; Moss, S.J.; McCarthy, K.; Haydon, P.G. Astrocytic Purinergic Signaling Coordinates Synaptic Networks. Science 2005, 310, 113–116. [Google Scholar] [CrossRef]
- Perea, G.; Araque, A. Astrocytes Potentiate Transmitter Release at Single Hippocampal Synapses. Science 2007, 317, 1083–1086. [Google Scholar] [CrossRef]
- Chia, W.-J.; Dawe, G.S.; Ong, W.-Y. Expression and Localization of the Iron-Siderophore Binding Protein Lipocalin 2 in the Normal Rat Brain and after Kainate-Induced Excitotoxicity. Neurochem Int 2011, 59, 591–599. [Google Scholar] [CrossRef] [PubMed]
- Ferreira, A.C.; Pinto, V.; Dá Mesquita, S.; Novais, A.; Sousa, J.C.; Correia-Neves, M.; Sousa, N.; Palha, J.A.; Marques, F. Lipocalin-2 Is Involved in Emotional Behaviors and Cognitive Function. Front Cell Neurosci 2013, 7, 122. [Google Scholar] [CrossRef] [PubMed]
- Ferreira, A.C.; Dá Mesquita, S.; Sousa, J.C.; Correia-Neves, M.; Sousa, N.; Palha, J.A.; Marques, F. From the Periphery to the Brain: Lipocalin-2, a Friend or Foe? Prog Neurobiol 2015, 131, 120–136. [Google Scholar] [CrossRef] [PubMed]
- Skrzypiec, A.E.; Shah, R.S.; Schiavon, E.; Baker, E.; Skene, N.; Pawlak, R.; Mucha, M. Stress-Induced Lipocalin-2 Controls Dendritic Spine Formation and Neuronal Activity in the Amygdala. PLoS One 2013, 8. [Google Scholar] [CrossRef]
- Mucha, M.; Skrzypiec, A.E.; Schiavon, E.; Attwood, B.K.; Kucerova, E.; Pawlak, R. Lipocalin-2 Controls Neuronal Excitability and Anxiety by Regulating Dendritic Spine Formation and Maturation. Proceedings of the National Academy of Sciences 2011, 108, 18436–18441. [Google Scholar] [CrossRef]
- Flo, T.H.; Smith, K.D.; Sato, S.; Rodriguez, D.J.; Holmes, M.A.; Strong, R.K.; Akira, S.; Aderem, A. Lipocalin 2 Mediates an Innate Immune Response to Bacterial Infection by Sequestrating Iron. Nature 2004, 432, 917–921. [Google Scholar] [CrossRef]
- Goetz, D.H.; Holmes, M.A.; Borregaard, N.; Bluhm, M.E.; Raymond, K.N.; Strong, R.K. The Neutrophil Lipocalin NGAL Is a Bacteriostatic Agent That Interferes with Siderophore-Mediated Iron Acquisition. Mol Cell 2002, 10, 1033–1043. [Google Scholar] [CrossRef]
- Ip, J.P.; Noçon, A.L.; Hofer, M.J.; Lim, S.L.; Müller, M.; Campbell, I.L. Lipocalin 2 in the Central Nervous System Host Response to Systemic Lipopolysaccharide Administration. Journal of Neuroinflammation 2011, 8, 124. [Google Scholar] [CrossRef]
- Kuzniewska, B.; Nader, K.; Dabrowski, M.; Kaczmarek, L.; Kalita, K. Adult Deletion of SRF Increases Epileptogenesis and Decreases Activity-Induced Gene Expression. Mol Neurobiol 2016, 53, 1478–1493. [Google Scholar] [CrossRef]
- Bi, F.; Huang, C.; Tong, J.; Qiu, G.; Huang, B.; Wu, Q.; Li, F.; Xu, Z.; Bowser, R.; Xia, X.-G.; et al. Reactive Astrocytes Secrete Lcn2 to Promote Neuron Death. Proceedings of the National Academy of Sciences 2013, 110, 4069–4074. [Google Scholar] [CrossRef]
- Dong, M.; Xi, G.; Keep, R.F.; Hua, Y. Role of Iron in Brain Lipocalin 2 Upregulation after Intracerebral Hemorrhage in Rats. Brain Research 2013, 1505, 86–92. [Google Scholar] [CrossRef] [PubMed]
- Jin, M.; Jang, E.; Suk, K. Lipocalin-2 Acts as a Neuroinflammatogen in Lipopolysaccharide-Injected Mice. Experimental Neurobiology 2014, 23, 155–162. [Google Scholar] [CrossRef] [PubMed]
- Jung, B.-K.; Ryu, K.-Y. Lipocalin-2: A Therapeutic Target to Overcome Neurodegenerative Diseases by Regulating Reactive Astrogliosis. Exp Mol Med 2023, 55, 2138–2146. [Google Scholar] [CrossRef] [PubMed]
- Ferreira, A.C.; Santos, T.; Sampaio-Marques, B.; Novais, A.; Mesquita, S.D.; Ludovico, P.; Bernardino, L.; Correia-Neves, M.; Sousa, N.; Palha, J.A.; et al. Lipocalin-2 Regulates Adult Neurogenesis and Contextual Discriminative Behaviours. Mol Psychiatry 2018, 23, 1031–1039. [Google Scholar] [CrossRef]
- Magnowska, M.; Gorkiewicz, T.; Suska, A.; Wawrzyniak, M.; Rutkowska-Wlodarczyk, I.; Kaczmarek, L.; Wlodarczyk, J. Transient ECM Protease Activity Promotes Synaptic Plasticity. Sci Rep 2016, 6, 27757. [Google Scholar] [CrossRef]
- Michaluk, P.; Wawrzyniak, M.; Alot, P.; Szczot, M.; Wyrembek, P.; Mercik, K.; Medvedev, N.; Wilczek, E.; De Roo, M.; Zuschratter, W.; et al. Influence of Matrix Metalloproteinase MMP-9 on Dendritic Spine Morphology. Journal of Cell Science 2011, 124, 3369–3380. [Google Scholar] [CrossRef]
- Ruszczycki, B.; Szepesi, Z.; Wilczynski, G.M.; Bijata, M.; Kalita, K.; Kaczmarek, L.; Wlodarczyk, J. Sampling Issues in Quantitative Analysis of Dendritic Spines Morphology. BMC Bioinformatics 2012, 13, 213. [Google Scholar] [CrossRef]
- Jasińska, M.; Miłek, J.; Cymerman, I.A.; Łęski, S.; Kaczmarek, L.; Dziembowska, M. miR-132 Regulates Dendritic Spine Structure by Direct Targeting of Matrix Metalloproteinase 9 mRNA. Mol Neurobiol 2016, 53, 4701–4712. [Google Scholar] [CrossRef]
- Otmakhov, N.; Khibnik, L.; Otmakhova, N.; Carpenter, S.; Riahi, S.; Asrican, B.; Lisman, J. Forskolin-Induced LTP in the CA1 Hippocampal Region Is NMDA Receptor Dependent. Journal of Neurophysiology 2004, 91, 1955–1962. [Google Scholar] [CrossRef]
- Schindelin, J.; Arganda-Carreras, I.; Frise, E.; Kaynig, V.; Longair, M.; Pietzsch, T.; Preibisch, S.; Rueden, C.; Saalfeld, S.; Schmid, B.; et al. Fiji: An Open-Source Platform for Biological-Image Analysis. Nat Methods 2012, 9, 676–682. [Google Scholar] [CrossRef]
- Pachitariu, M.; Stringer, C.; Dipoppa, M.; Schröder, S.; Rossi, L.F.; Dalgleish, H.; Carandini, M.; Harris, K.D. Suite2p: Beyond 10,000 Neurons with Standard Two-Photon Microscopy 2017, 061507.
- Zagulska-Szymczak, S.; Filipkowski, R.K.; Kaczmarek, L. Kainate-Induced Genes in the Hippocampus: Lessons from Expression Patterns. Neurochem Int 2001, 38, 485–501. [Google Scholar] [CrossRef] [PubMed]
- Szepesi, Z.; Hosy, E.; Ruszczycki, B.; Bijata, M.; Pyskaty, M.; Bikbaev, A.; Heine, M.; Choquet, D.; Kaczmarek, L.; Wlodarczyk, J. Synaptically Released Matrix Metalloproteinase Activity in Control of Structural Plasticity and the Cell Surface Distribution of GluA1-AMPA Receptors. PLoS One 2014, 9. [Google Scholar] [CrossRef] [PubMed]
- Szepesi, Z.; Bijata, M.; Ruszczycki, B.; Kaczmarek, L.; Wlodarczyk, J. Matrix Metalloproteinases Regulate the Formation of Dendritic Spine Head Protrusions during Chemically Induced Long-Term Potentiation. PLoS One 2013, 8, e63314. [Google Scholar] [CrossRef] [PubMed]
- Grabowska, A.; Sas-Nowosielska, H.; Wojtas, B.; Holm-Kaczmarek, D.; Januszewicz, E.; Yushkevich, Y.; Czaban, I.; Trzaskoma, P.; Krawczyk, K.; Gielniewski, B.; et al. Activation-Induced Chromatin Reorganization in Neurons Depends on HDAC1 Activity. Cell Reports 2022, 38, 110352. [Google Scholar] [CrossRef] [PubMed]
- Franchini, L.; Stanic, J.; Ponzoni, L.; Mellone, M.; Carrano, N.; Musardo, S.; Zianni, E.; Olivero, G.; Marcello, E.; Pittaluga, A.; et al. Linking NMDA Receptor Synaptic Retention to Synaptic Plasticity and Cognition. iScience 2019, 19, 927–939. [Google Scholar] [CrossRef]
- Oh, M.C.; Derkach, V.A.; Guire, E.S.; Soderling, T.R. Extrasynaptic Membrane Trafficking Regulated by GluR1 Serine 845 Phosphorylation Primes AMPA Receptors for Long-Term Potentiation *. Journal of Biological Chemistry 2006, 281, 752–758. [Google Scholar] [CrossRef]
- Dinamarca, M.C.; Guzzetti, F.; Karpova, A.; Lim, D.; Mitro, N.; Musardo, S.; Mellone, M.; Marcello, E.; Stanic, J.; Samaddar, T.; et al. Ring Finger Protein 10 Is a Novel Synaptonuclear Messenger Encoding Activation of NMDA Receptors in Hippocampus. eLife 2016, 5, e12430. [Google Scholar] [CrossRef]
- Dityatev, A.; Rusakov, D.A. Molecular Signals of Plasticity at the Tetrapartite Synapse. Curr. Opin. Neurobiol. 2011, 21, 353–359. [Google Scholar] [CrossRef]
- Perea, G.; Navarrete, M.; Araque, A. Tripartite Synapses: Astrocytes Process and Control Synaptic Information. Trends in Neurosciences 2009, 32, 421–431. [Google Scholar] [CrossRef]
- Bowser, D.N.; Khakh, B.S. Vesicular ATP Is the Predominant Cause of Intercellular Calcium Waves in Astrocytes. J Gen Physiol 2007, 129, 485–491. [Google Scholar] [CrossRef]
- Guthrie, P.B.; Knappenberger, J.; Segal, M.; Bennett, M.V.L.; Charles, A.C.; Kater, S.B. ATP Released from Astrocytes Mediates Glial Calcium Waves. J Neurosci 1999, 19, 520–528. [Google Scholar] [CrossRef] [PubMed]
- Salter, M.W.; Hicks, J.L. ATP Causes Release of Intracellular Ca2+ via the Phospholipase C Beta/IP3 Pathway in Astrocytes from the Dorsal Spinal Cord. J Neurosci 1995, 15, 2961–2971. [Google Scholar] [CrossRef] [PubMed]
- Stenovec, M.; Lasič, E.; Božić, M.; Bobnar, S.T.; Stout, R.F.; Grubišić, V.; Parpura, V.; Zorec, R. Ketamine Inhibits ATP-Evoked Exocytotic Release of Brain-Derived Neurotrophic Factor from Vesicles in Cultured Rat Astrocytes. Mol Neurobiol 2016, 53, 6882–6896. [Google Scholar] [CrossRef] [PubMed]
- Wieraszko, A.; Seyfried, T.N. ATP-Induced Synaptic Potentiation in Hippocampal Slices. Brain Res 1989, 491, 356–359. [Google Scholar] [CrossRef]
- Legutko, D.; Kuźniewska, B.; Kalita, K.; Yasuda, R.; Kaczmarek, L.; Michaluk, P. BDNF Signaling Requires Matrix Metalloproteinase-9 during Structural Synaptic Plasticity. bioRxiv, 2024; 2023.12.08.569797. [Google Scholar] [CrossRef]
- Matsuzaki, M.; Honkura, N.; Ellis-Davies, G.C.R.; Kasai, H. Structural Basis of Long-Term Potentiation in Single Dendritic Spines. Nature 2004, 429, 761–766. [Google Scholar] [CrossRef]
- Hosokawa, T.; Rusakov, D.A.; Bliss, T.V.; Fine, A. Repeated Confocal Imaging of Individual Dendritic Spines in the Living Hippocampal Slice: Evidence for Changes in Length and Orientation Associated with Chemically Induced LTP. J. Neurosci. 1995, 15, 5560–5573. [Google Scholar] [CrossRef]
- Horino-Shimizu, A.; Moriyama, K.; Mori, T.; Kohyama, K.; Nishito, Y.; Sakuma, H. Lipocalin-2 Production by Astrocytes in Response to High Concentrations of Glutamate. Brain Res 2023, 1815, 148463. [Google Scholar] [CrossRef]
- Sun, W.; Liu, Z.; Jiang, X.; Chen, M.B.; Dong, H.; Liu, J.; Südhof, T.C.; Quake, S.R. Spatial Transcriptomics Reveal Neuron–Astrocyte Synergy in Long-Term Memory. Nature 2024, 627, 374–381. [Google Scholar] [CrossRef]
- Murphy-Royal, C.; Ching, S.; Papouin, T. A Conceptual Framework for Astrocyte Function. Nat Neurosci 2023, 26, 1848–1856. [Google Scholar] [CrossRef]
- Goshi, N.; Morgan, R.K.; Lein, P.J.; Seker, E. A Primary Neural Cell Culture Model to Study Neuron, Astrocyte, and Microglia Interactions in Neuroinflammation. Journal of Neuroinflammation 2020, 17, 155. [Google Scholar] [CrossRef]
- Cajigas, I.J.; Tushev, G.; Will, T.J.; tom Dieck, S.; Fuerst, N.; Schuman, E.M. The Local Transcriptome in the Synaptic Neuropil Revealed by Deep Sequencing and High-Resolution Imaging. Neuron 2012, 74, 453–466. [Google Scholar] [CrossRef] [PubMed]
- Marques, F.; Rodrigues, A.-J.; Sousa, J.C.; Coppola, G.; Geschwind, D.H.; Sousa, N.; Correia-Neves, M.; Palha, J.A. Lipocalin 2 Is a Choroid Plexus Acute-Phase Protein. J Cereb Blood Flow Metab 2008, 28, 450–455. [Google Scholar] [CrossRef] [PubMed]
- Huntley, G.W. Synaptic Circuit Remodelling by Matrix Metalloproteinases in Health and Disease. Nat Rev Neurosci 2012, 13, 743–757. [Google Scholar] [CrossRef] [PubMed]
- Hasel, P.; Dando, O.; Jiwaji, Z.; Baxter, P.; Todd, A.C.; Heron, S.; Márkus, N.M.; McQueen, J.; Hampton, D.W.; Torvell, M.; et al. Neurons and Neuronal Activity Control Gene Expression in Astrocytes to Regulate Their Development and Metabolism. Nat Commun 2017, 8, 15132. [Google Scholar] [CrossRef]
- Zhou, Z.; Okamoto, K.; Onodera, J.; Hiragi, T.; Andoh, M.; Ikawa, M.; Tanaka, K.F.; Ikegaya, Y.; Koyama, R. Astrocytic cAMP Modulates Memory via Synaptic Plasticity. Proceedings of the National Academy of Sciences 2021, 118, e2016584118. [Google Scholar] [CrossRef]
- Wang, F.; Smith, N.A.; Xu, Q.; Fujita, T.; Baba, A.; Matsuda, T.; Takano, T.; Bekar, L.; Nedergaard, M. Astrocytes Modulate Neural Network Activity by Ca2+-Dependent Uptake of Extracellular K+. Sci Signal 2012, 5, ra26. [Google Scholar] [CrossRef]
- Kim, J.-H.; Michiko, N.; Choi, I.-S.; Kim, Y.; Jeong, J.-Y.; Lee, M.-G.; Jang, I.-S.; Suk, K. Aberrant Activation of Hippocampal Astrocytes Causes Neuroinflammation and Cognitive Decline in Mice. PLOS Biology 2024, 22, e3002687. [Google Scholar] [CrossRef]
- Michaluk, P.; Kolodziej, L.; Mioduszewska, B.; Wilczynski, G.M.; Dzwonek, J.; Jaworski, J.; Gorecki, D.C.; Ottersen, O.P.; Kaczmarek, L. β-Dystroglycan as a Target for MMP-9, in Response to Enhanced Neuronal Activity. J. Biol. Chem. 2007, 282, 16036–16041. [Google Scholar] [CrossRef]
- Stawarski, M.; Rutkowska-Wlodarczyk, I.; Zeug, A.; Bijata, M.; Madej, H.; Kaczmarek, L.; Wlodarczyk, J. Genetically Encoded FRET-Based Biosensor for Imaging MMP-9 Activity. Biomaterials 2014, 35, 1402–1410. [Google Scholar] [CrossRef]
- Liu, J.-H.; Zhang, M.; Wang, Q.; Wu, D.-Y.; Jie, W.; Hu, N.-Y.; Lan, J.-Z.; Zeng, K.; Li, S.-J.; Li, X.-W.; et al. Distinct Roles of Astroglia and Neurons in Synaptic Plasticity and Memory. Mol Psychiatry 2022, 27, 873–885. [Google Scholar] [CrossRef]
- Wang, X.; Bozdagi, O.; Nikitczuk, J.S.; Zhai, Z.W.; Zhou, Q.; Huntley, G.W. Extracellular Proteolysis by Matrix Metalloproteinase-9 Drives Dendritic Spine Enlargement and Long-Term Potentiation Coordinately. Proc Natl Acad Sci U S A 2008, 105, 19520–19525. [Google Scholar] [CrossRef] [PubMed]
- Kjeldsen, L.; Bainton, D.F.; Sengeløv, H.; Borregaard, N. Identification of Neutrophil Gelatinase-Associated Lipocalin as a Novel Matrix Protein of Specific Granules in Human Neutrophils. Blood 1994, 83, 799–807. [Google Scholar] [CrossRef] [PubMed]
- Yan, L.; Borregaard, N.; Kjeldsen, L.; Moses, M.A. The High Molecular Weight Urinary Matrix Metalloproteinase (MMP) Activity Is a Complex of Gelatinase B/MMP-9 and Neutrophil Gelatinase-Associated Lipocalin (NGAL). Modulation of MMP-9 Activity by NGAL. J. Biol. Chem. 2001, 276, 37258–37265. [Google Scholar] [CrossRef]
- Coles, M.; Diercks, T.; Muehlenweg, B.; Bartsch, S.; Zölzer, V.; Tschesche, H.; Kessler, H. The Solution Structure and Dynamics of Human Neutrophil Gelatinase-Associated Lipocalin1. Journal of Molecular Biology 1999, 289, 139–157. [Google Scholar] [CrossRef]
- Goetz, D.H.; Willie, S.T.; Armen, R.S.; Bratt, T.; Borregaard, N.; Strong, R.K. Ligand Preference Inferred from the Structure of Neutrophil Gelatinase Associated Lipocalin. Biochemistry 2000, 39, 1935–1941. [Google Scholar] [CrossRef]
- Devireddy, L.R.; Hart, D.O.; Goetz, D.H.; Green, M.R. A Mammalian Siderophore Synthesized by an Enzyme with a Bacterial Homolog Involved in Enterobactin Production. Cell 2010, 141, 1006–1017. [Google Scholar] [CrossRef]
- Miethke, M.; Skerra, A. Neutrophil Gelatinase-Associated Lipocalin Expresses Antimicrobial Activity by Interfering with l-Norepinephrine-Mediated Bacterial Iron Acquisition. Antimicrob Agents Chemother 2010, 54, 1580–1589. [Google Scholar] [CrossRef]
Figure 1.
Intrahippocampal injection of KA induces Lcn2 expression in astrocytes in the dentate gyrus. (A) A representative example of Nissl staining of the hippocampus of ipsilateral (IPSI) and contralateral sites (CONTRA) of unilaterally KA-injected mice. Scale bar: 500 µm (B) Representative example of immunohistochemical staining of Lcn2 in the hippocampus of control and KA-injected mice. Scale bar: 500 µm; (C) Representative example of immunofluorescence images of DG immunostained with antibodies detecting Lcn2 (green), the astrocytic marker GFAP (red). The nuclei were visualized using DAPI (grey). Lcn2 protein was observed predominantly in the cytoplasm of GFAP-positive cells. Scale bar: 5 μm; (D) Quantification of the number of Lcn2-positive cells in DG. Bars – means ± SEM, dots – measurements collected from individual slices. Data were obtained from n= 4 (contralateral), 6 (ipsilateral) slices from 3 animals. Student’s t-test analysis.
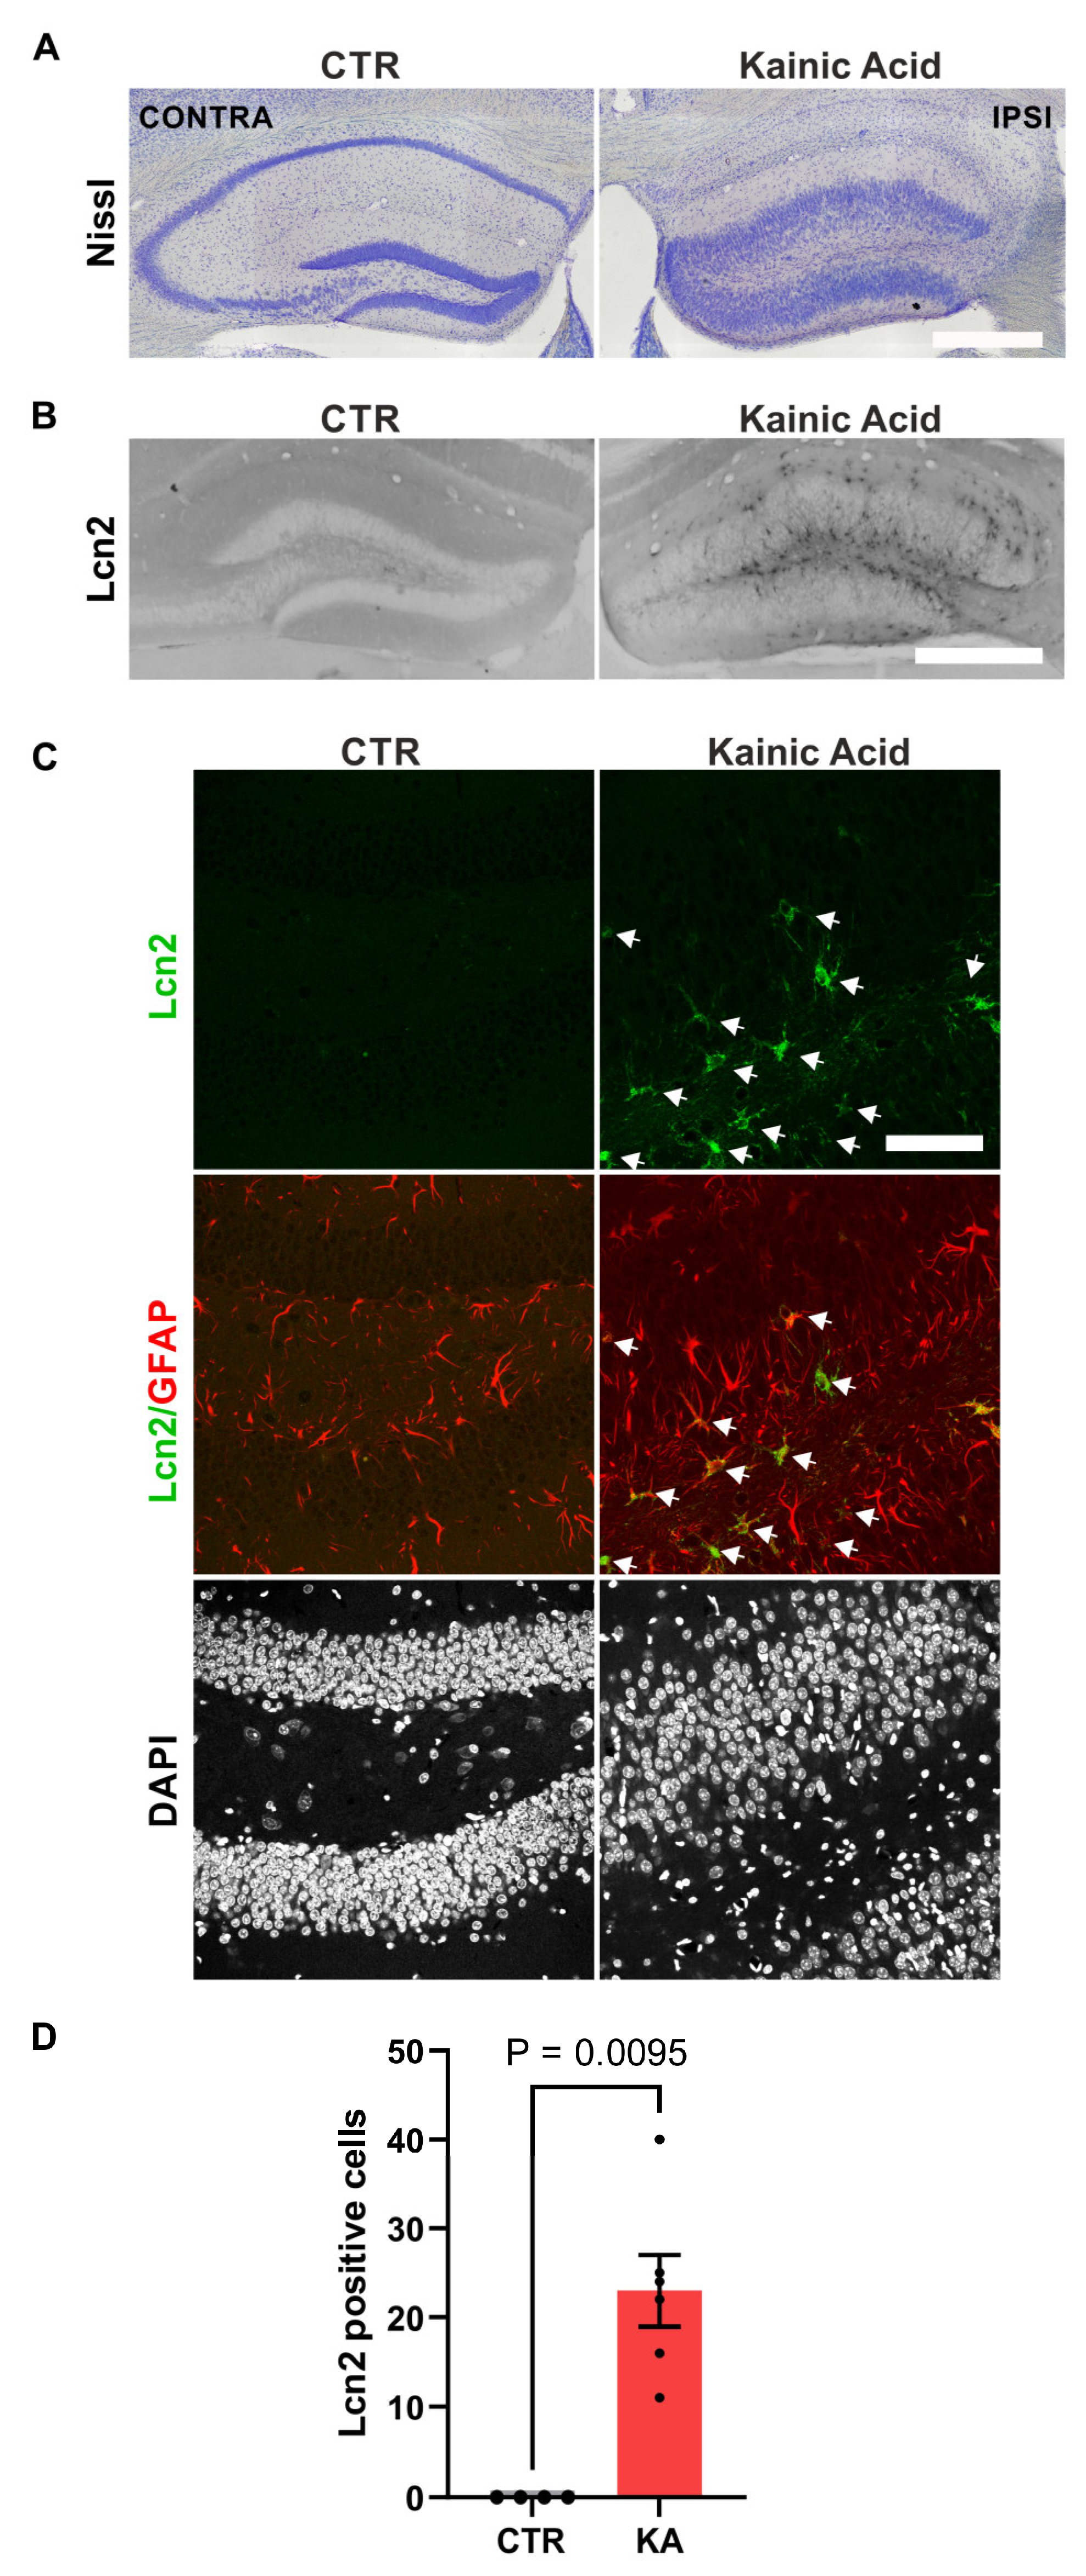
Figure 2.
cLTP induces Lcn2 expression in astrocytes of mix hippocampal cultures. (A) Quantification of real-time RT-PCR analysis of Lcn2 mRNA levels normalized to the endogenous GAPDH in cultures stimulated with cLTP. Bars – means ± SEM, dots – individual measurements of normalized levels of Lcn2 relative to the level of the non-stimulated control. Student’s t-test analysis; (B) Representative example of immunofluorescence images of mix hippocampal cultures (21 DIV) stimulated with cLTP for 24 hours and immunostained with antibodies detecting Lcn2 (white), the astrocytic marker GFAP (red), and the neuronal marker MAP2 (green). The nuclei were visualized using DAPI. Lcn2 protein was observed predominantly in the cytoplasm of GFAP-positive cells. Scale bar: 60 µm; (C) Quantification of the number of Lcn2 and GFAP double-positive cells. Bars – means ± SEM, dots – measurements collected from individual coverslips relative to the level of the control. Data were obtained from at least three independent cell cultures. Student’s t-test analysis.
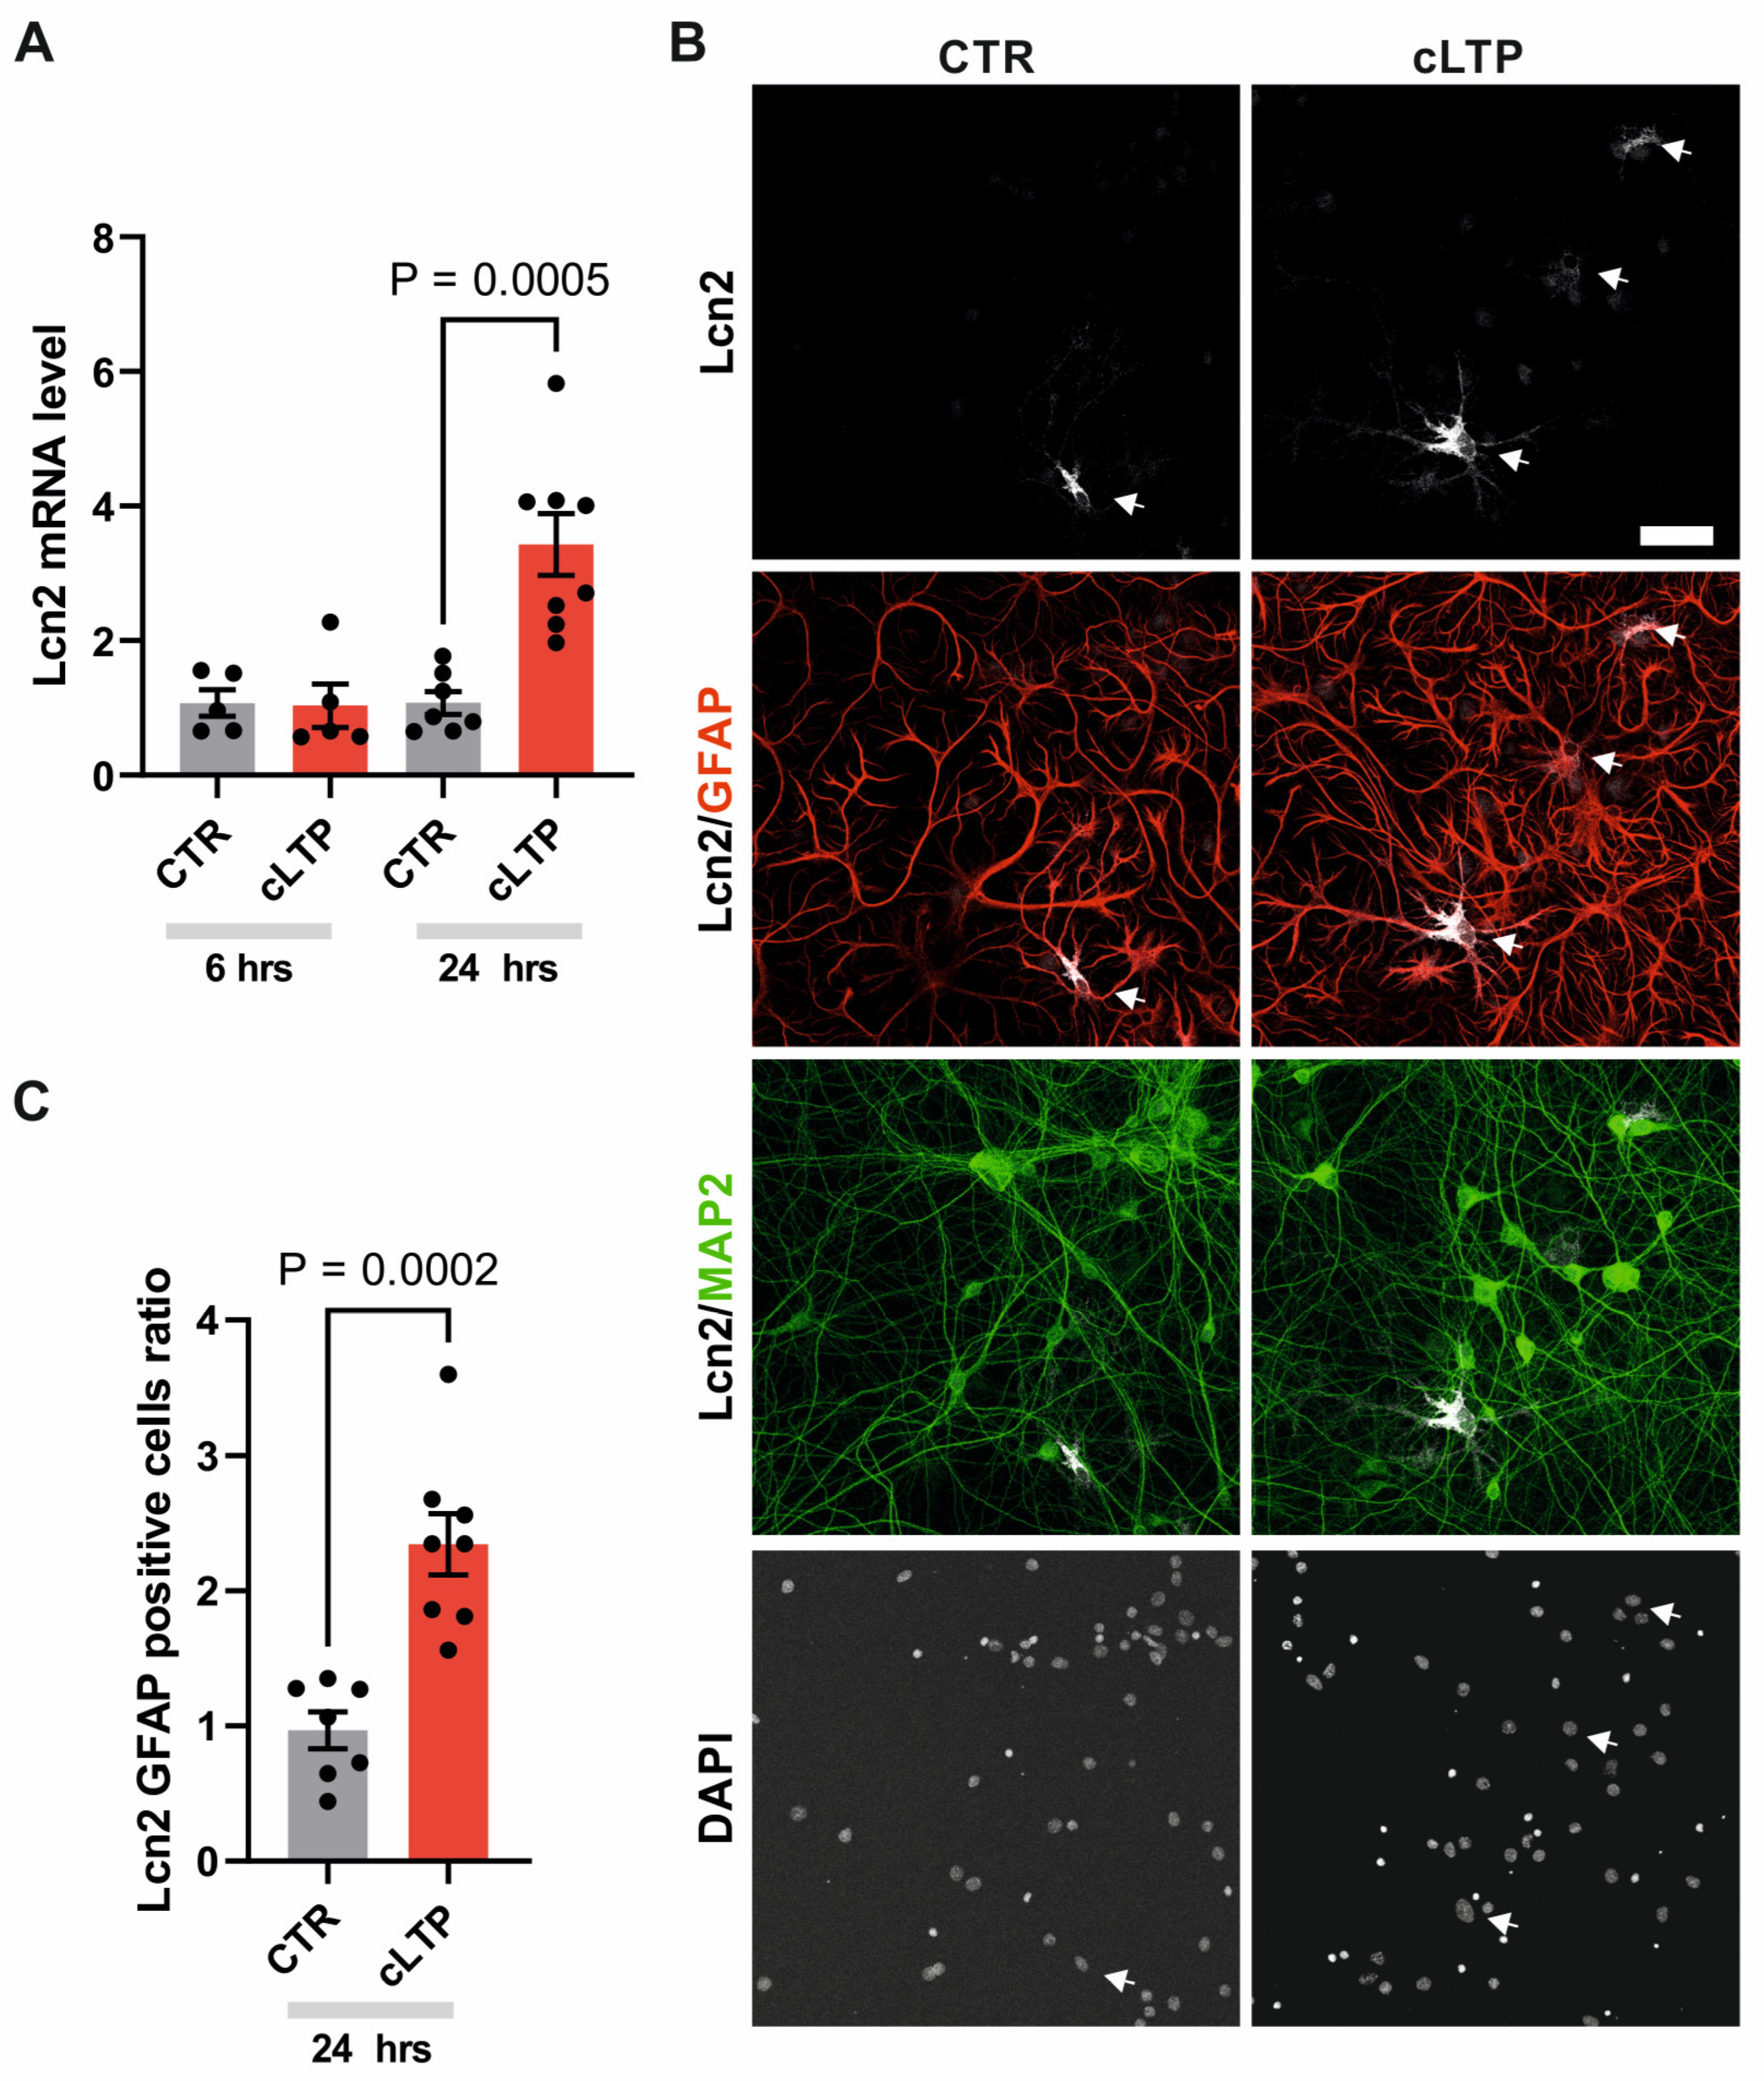
Figure 2.
Lcn2 release from mix cultures is induced by glutamate stimulation. (A) Representative immunoblot of Lcn2 (Lcn2-SEP) probed with anti-Lcn2 antibody in the culture media before treatment and in response to 10 and 30 min of 50µM glutamate (Glu) stimulation; (B) Quantification of immunoblot Lcn2-SEP band intensity relative to intensity before stimulation. Data were obtained from at least three independent cell cultures. Bars – means ± SEM, dots – individual data points (culture wells). One-way ANOVA, F (2, 19) = 6.580, p = 0.0067; Dunnett's multiple comparisons test CTR vs. 10 min, p = 0.0045.
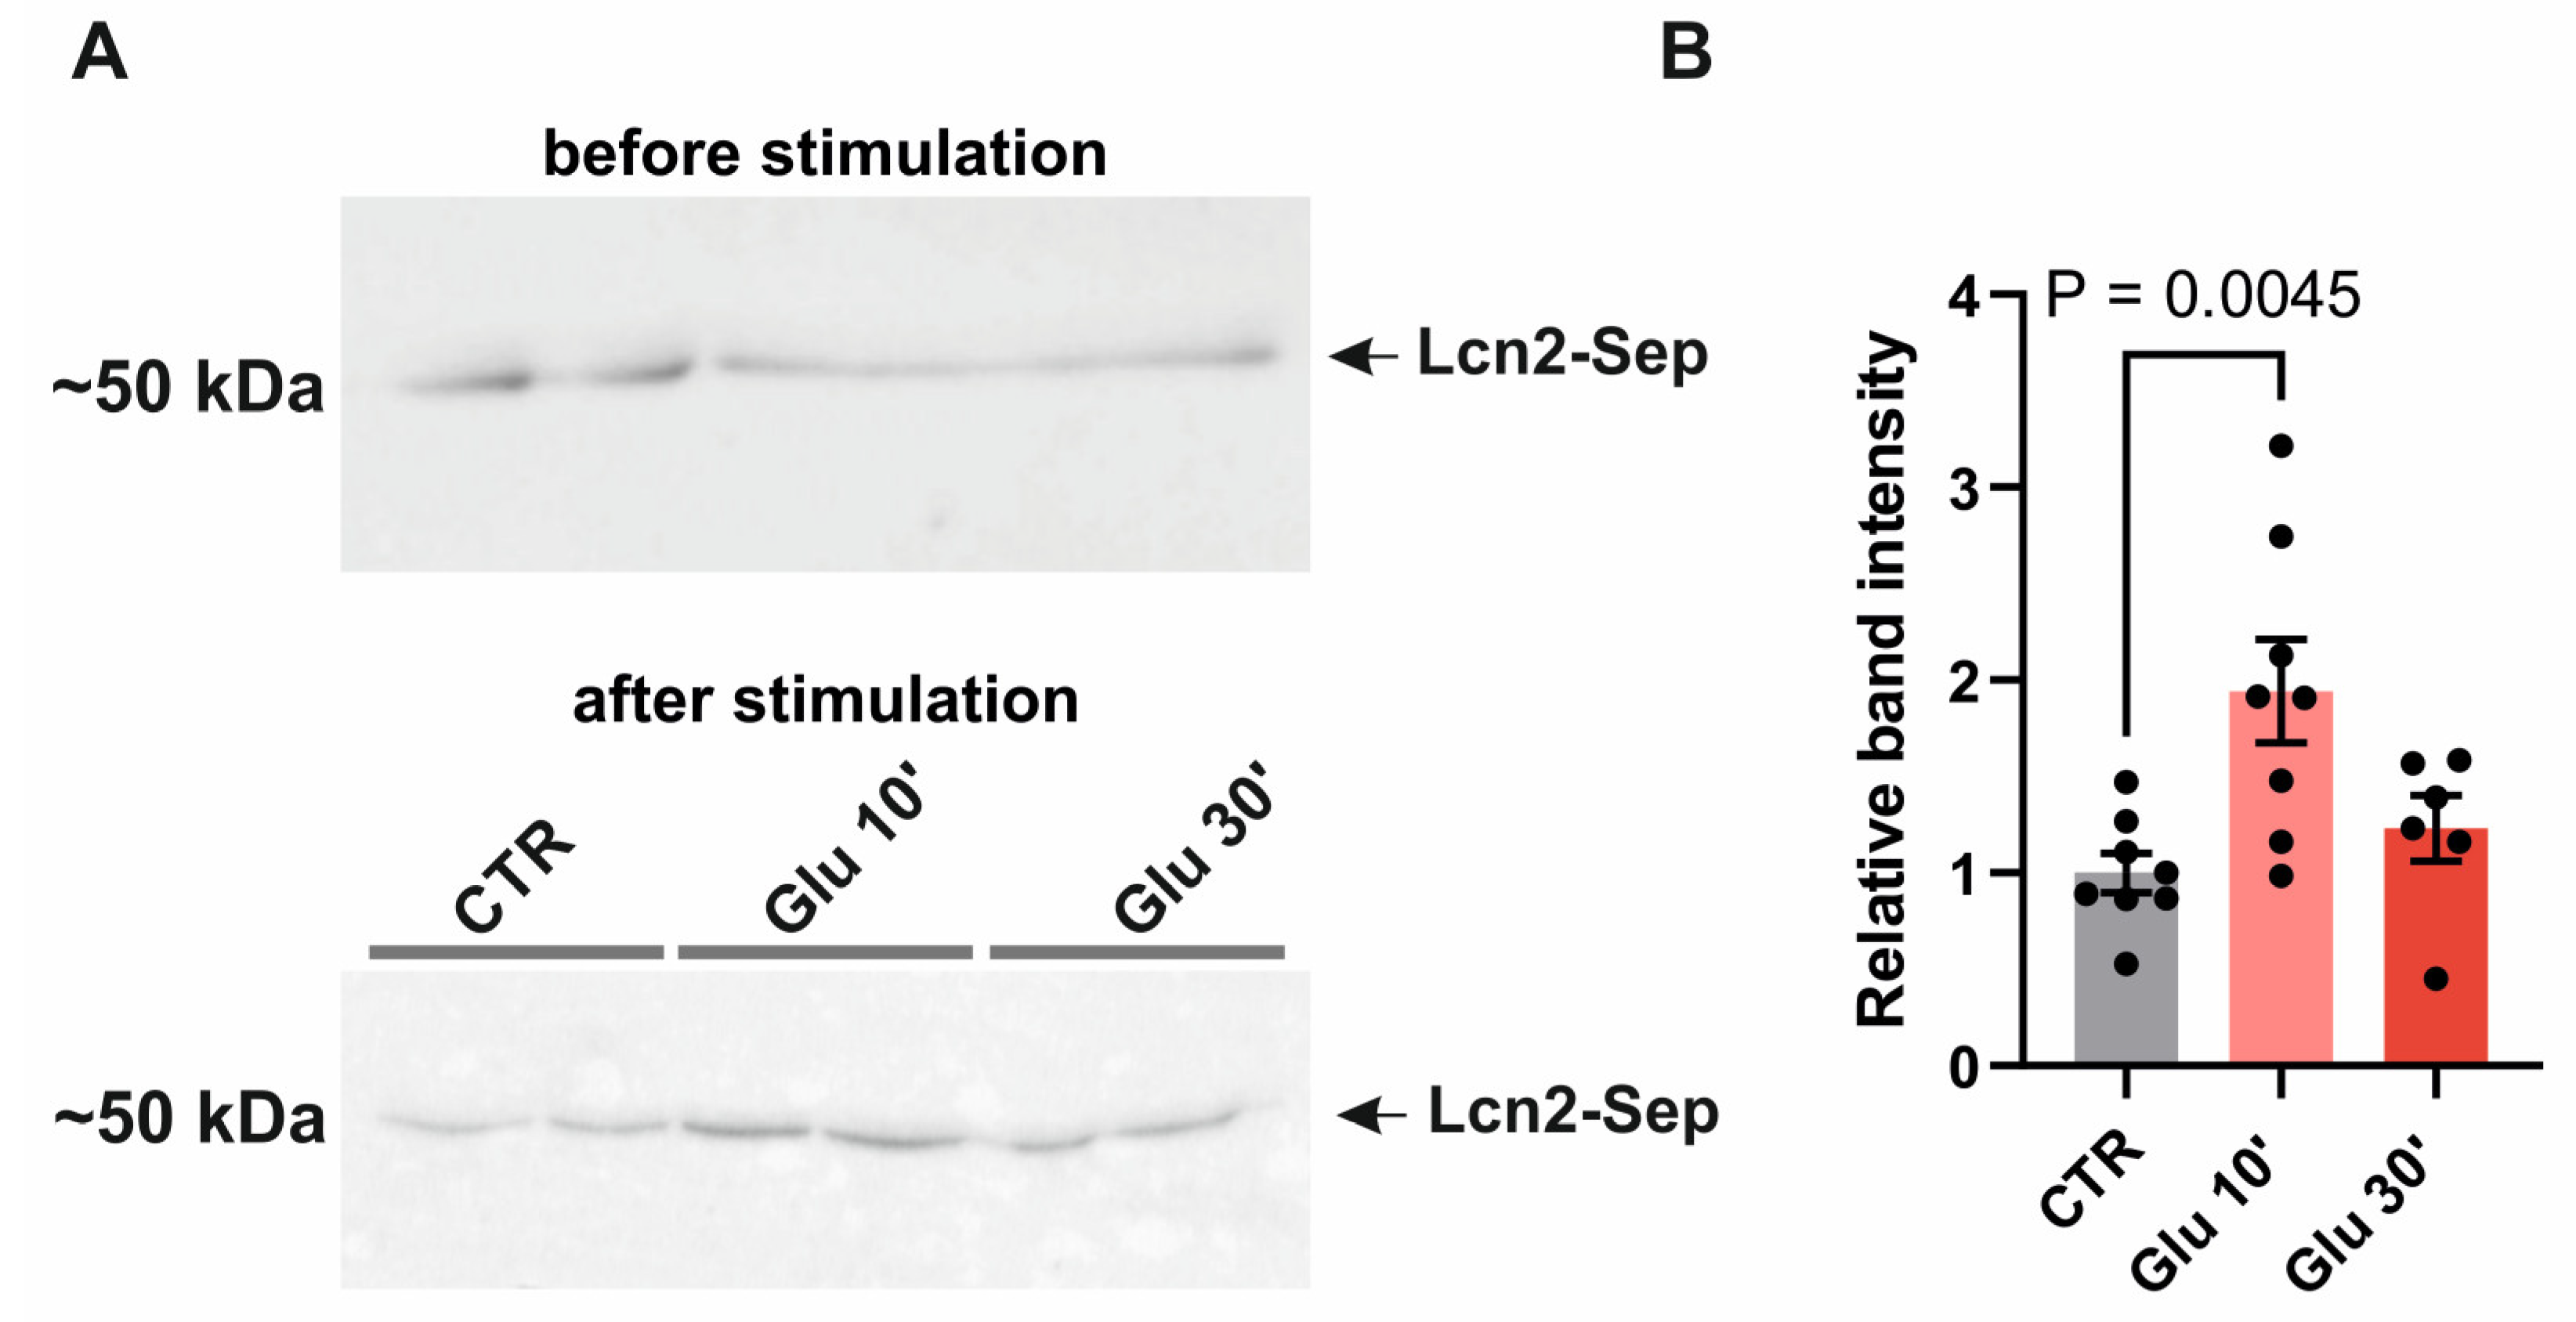
Figure 4.
Lcn2 release from astrocytes upon ATP or ionomycin stimulation. (A) Representative immunoblot of Lcn2 (Lcn2-SEP) in cell culture media from pure astrocytic culture before and after ATP treatment; (B) Quantification of immunoblots of Lcn2-SEP band intensity 5 or 20 min after ATP stimulation relative to the intensity before stimulation. Bars – mean ± SEM, dots – individual data points (media collected from the single culture well). One-way ANOVA, F (2, 33) = 4.230, p = 0,000, Tukey's multiple comparisons test CTR vs. 20 min ATP, p = 0.0011; (C) Representative immunoblot of Lcn2 (Lcn2-SEP) in cell culture media from pure astrocytic culture before and after Ionomycin treatment; (D) As in B but for Ionomycin stimulation. One-way ANOVA, F (2, 33) = 5,922 p=0,0063, Tukey's multiple comparisons test CTR vs. 20 min Ionomycin p = 0,0105. Data was obtained from at least three independent cell cultures.
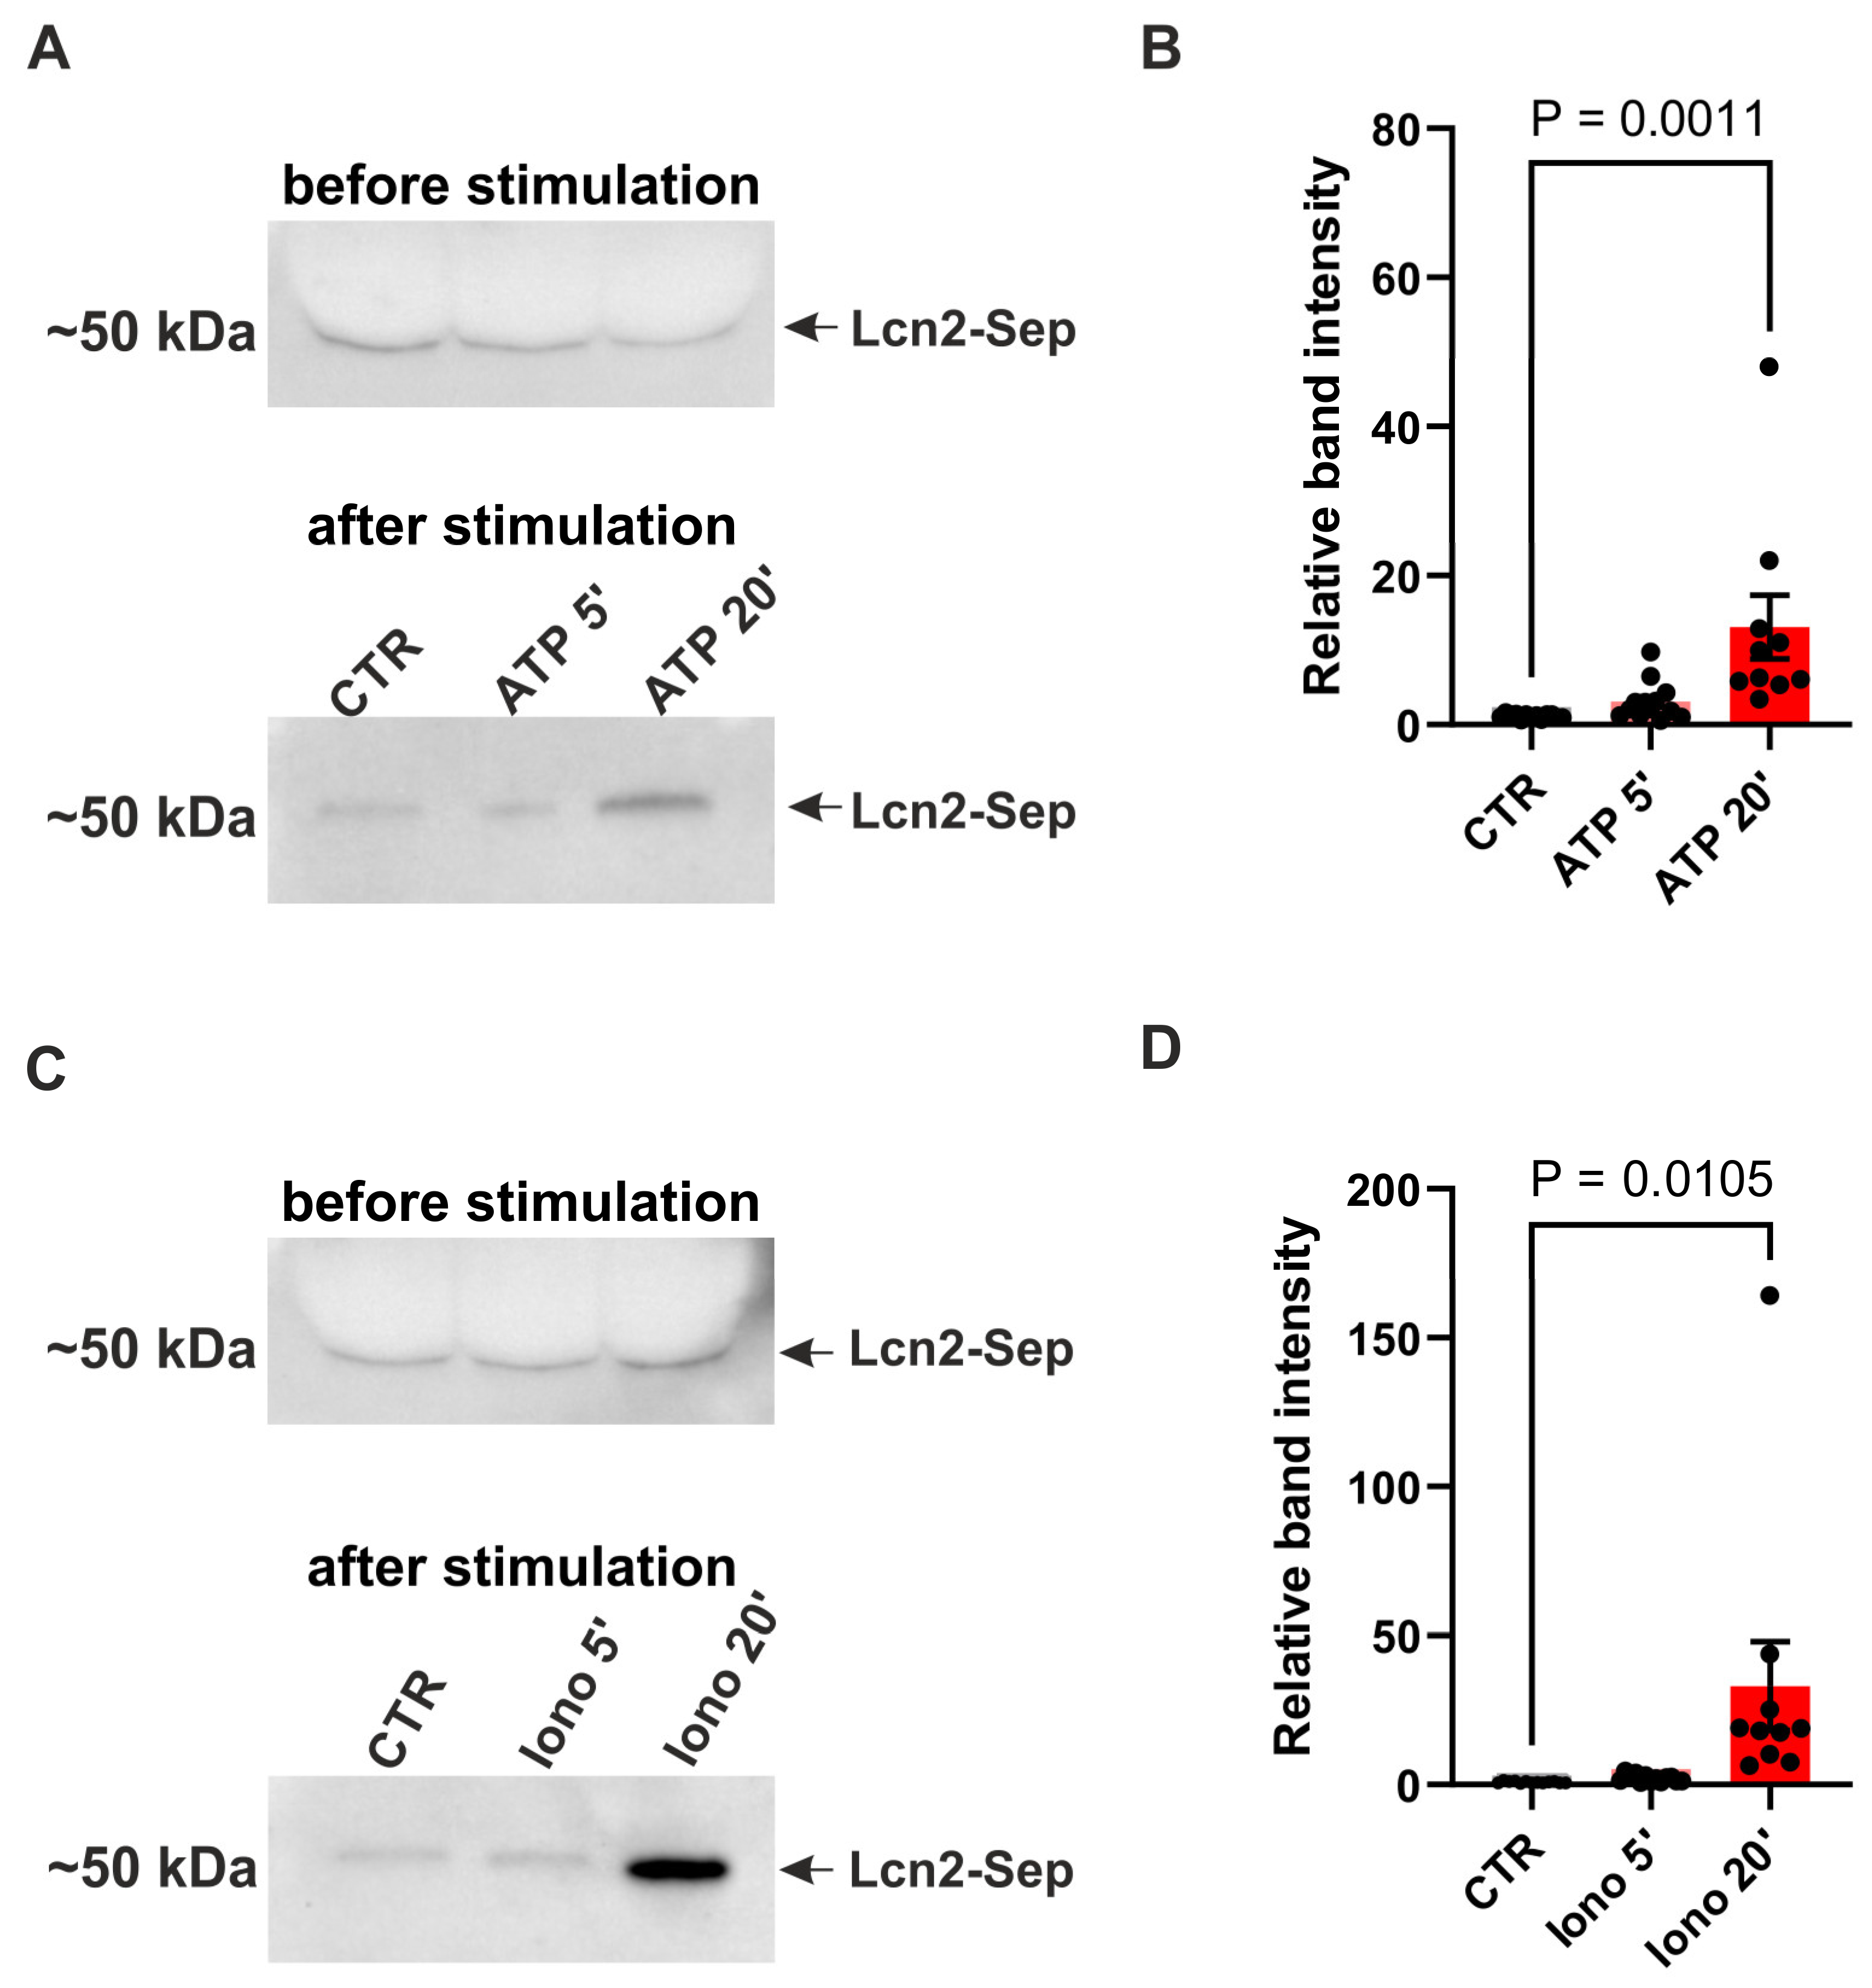
Figure 5.
Ca2+-dependent Lcn2-SEP release from astrocytes. (a) Experiment arrangement: Lcn2 fused to a pH-sensitive fluorescent protein (SEP), is packed into vesicles, where SEP fluorescence is quenched in the acidic environment. Upon fusion of the vesicles with the plasma membrane, pH is neutralized, resulting in a sudden increase in fluorescence intensity that can be detected by TIRF microscopy; (b) Representative TIRF maximal projection of time-stack images shows single-vesicle exocytosis in astrocytes expressing Lcn2-SEP. Localization of Lcn2-SEP exocytotic sites (yellow frames) in pure astrocytic cultures in basal condition or 2 min after Ionomycin stimulation. Scale bar 25 μm; (c) Example of the fluorescence increase during a single Lcn2-SEP exocytosis event shown as sequence of TIRF images acquired over the indicated time. The timescale is relative only for this particular event and shows the temporal resolution of the imaging setup and Lcn2 release. Scale bar 5 μm; (d) Representative example of change in the fluorescence intensity (ΔF/F0) for a single exocytosis-positive ROI recorded in astrocytes expressing Lcn2-SEP. The time scale starts with the beginning of recorded movie; (e) Quantification of Lcn2-SEP release rate in response to Ionomycin stimulation. Data were obtained from three independent primary astrocytic cultures, dots with lines – individual results for cells in a baseline condition and 2 min after initiating the buffer exchange to the buffer containing Ionomycin. Paired student’s t-test analysis, p = 0.0259, n = 11 cells.
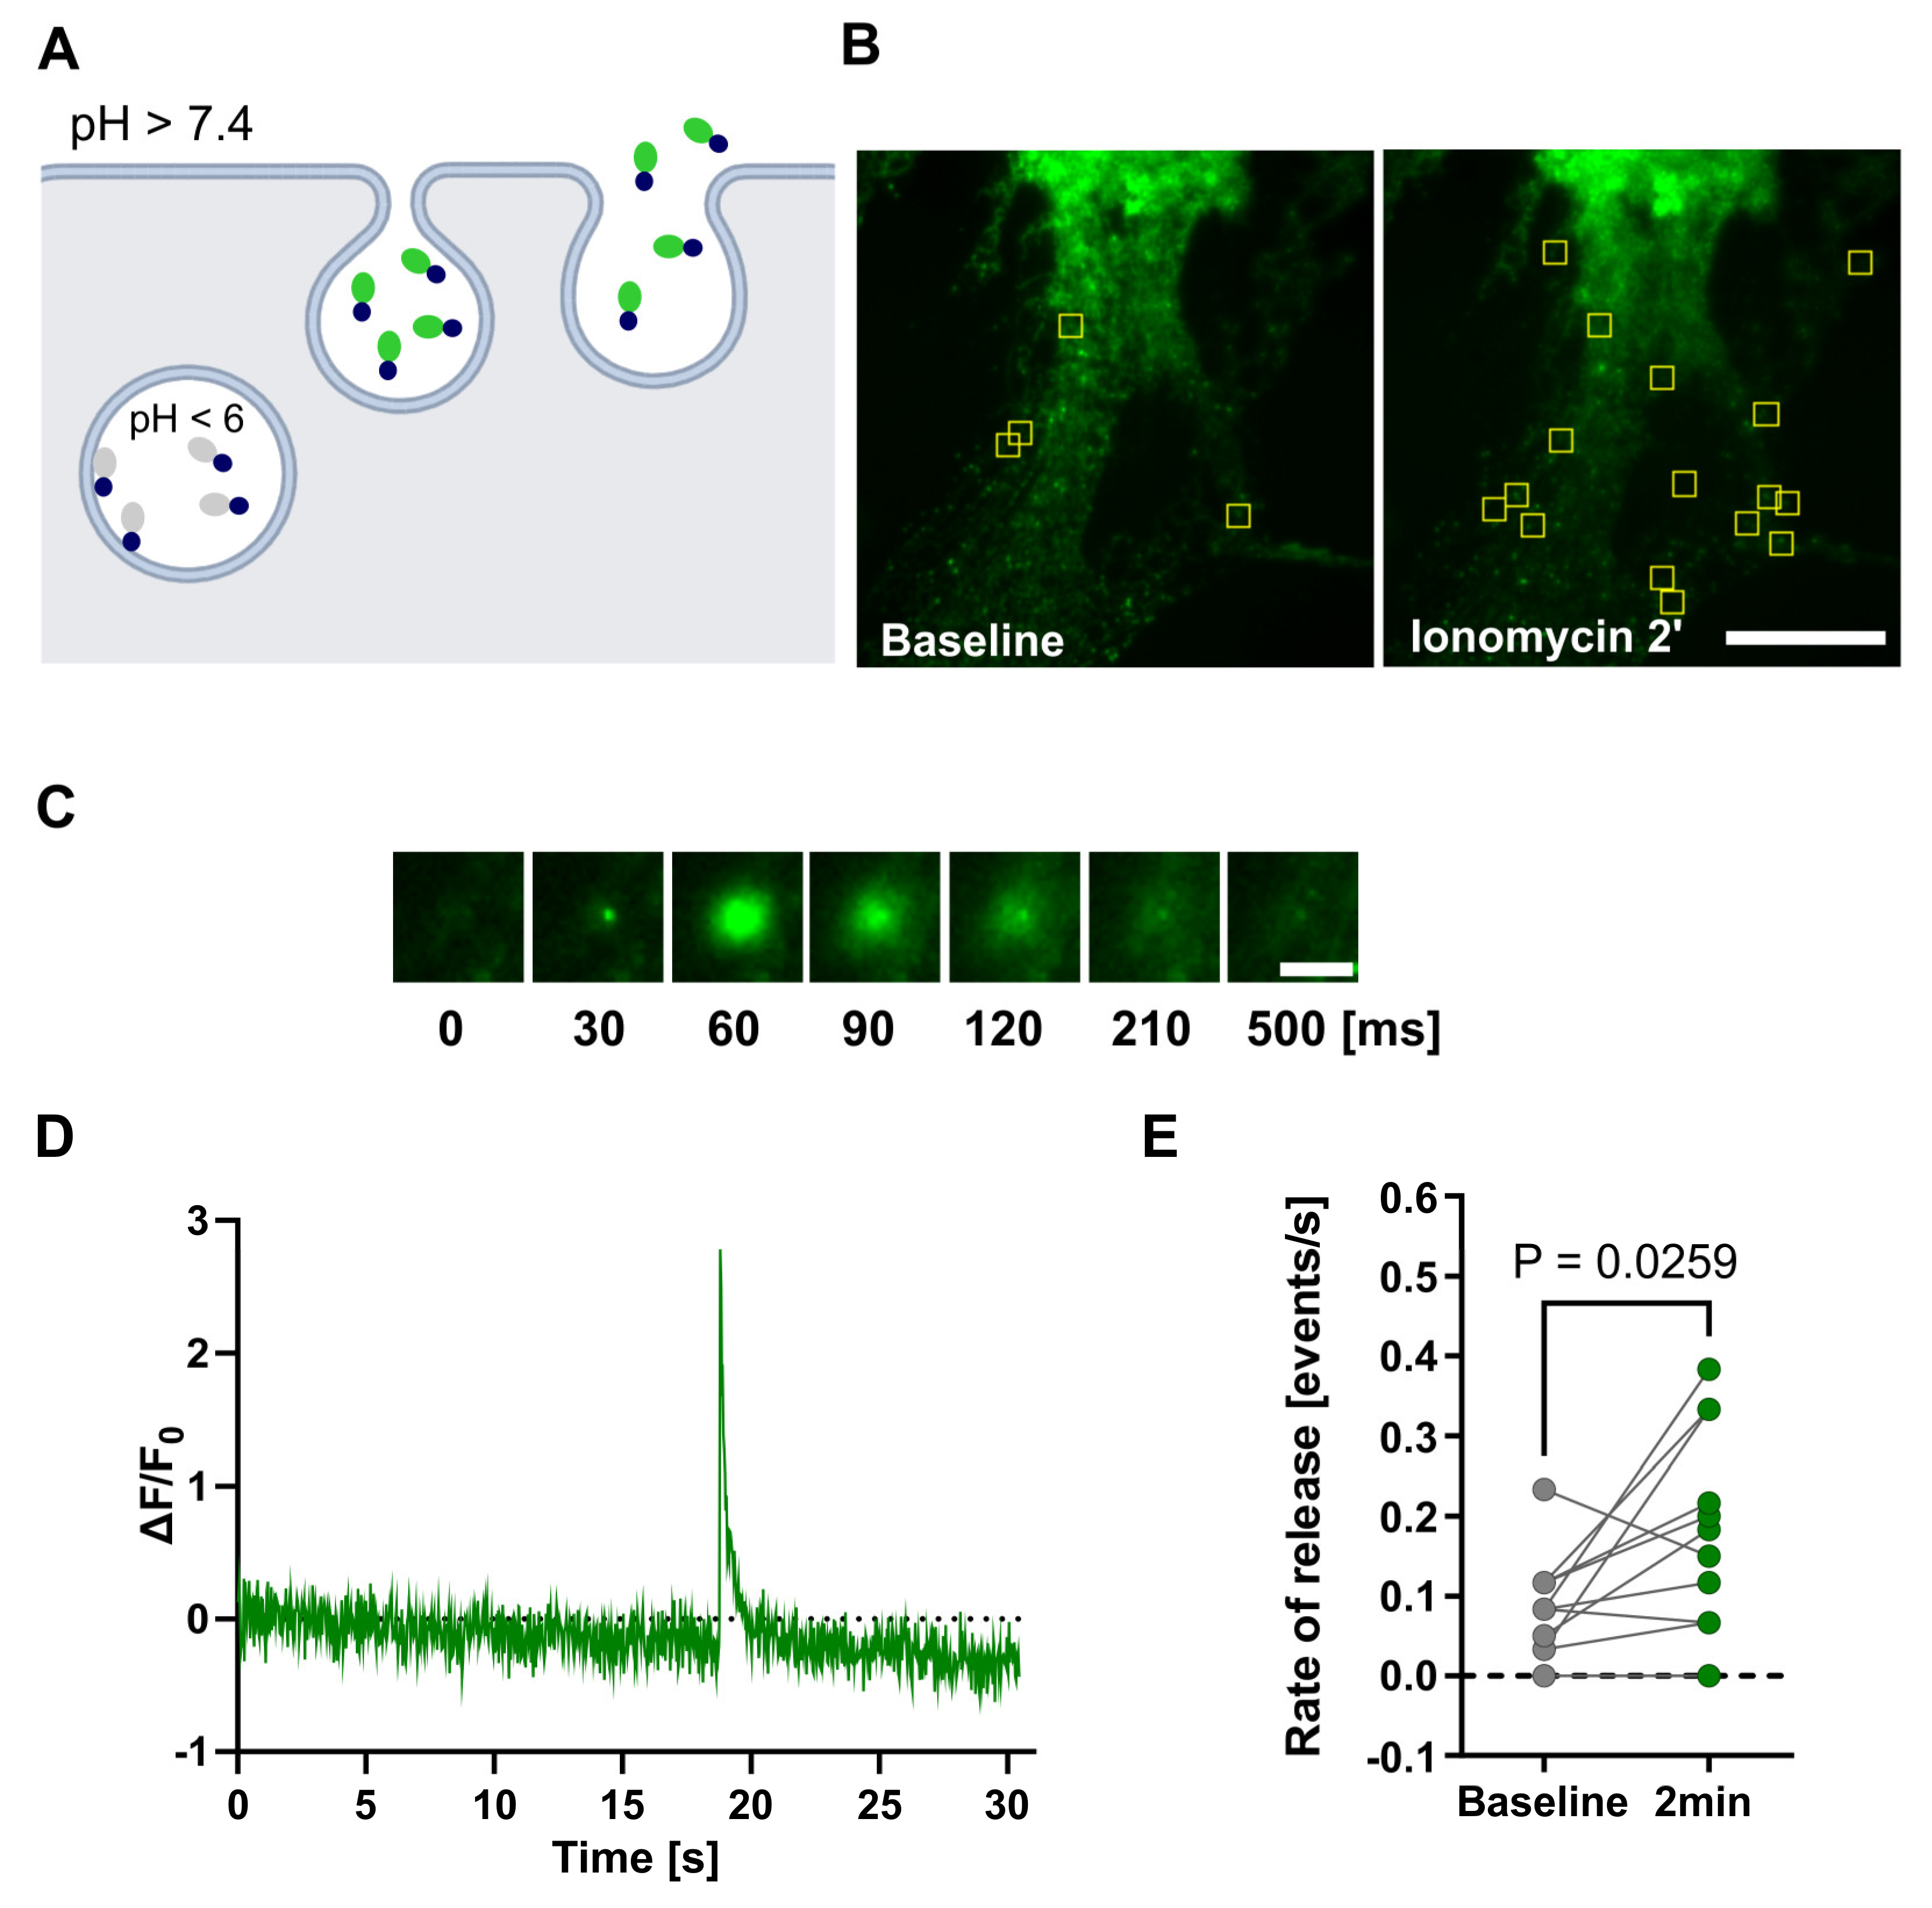
Figure 6.
rLcn2 promotes elongation of mushroom and stubby dendritic spines in vitro. (a) Two representative examples of GFP-positive dendrites in mix hippocampal cultures acquired during a live cell imaging (19-23 DIV) before and after incubation with recombinant Lcn2 (rLcn2) or in control cells. Filled arrowheads show dendritic spines with increased Length-to-Width parameter in response to 20 min rLcn2 stimulation, and open arrowheads show an unchanged spine morphology. Scale bar: 2 μm; (b) Before and after graph showing Length-to-Width parameter of mushroom and stubby dendritic spines incubated with rLcn2 or in the untreated control. The Length-to-Width of each spine was normalized relative to the average Length-to-Width of spines in its respective group at time 0. Data were obtained from at least three independent cell cultures. n = 14 cells in Control and n = 13 cells in rLcn2 variant. Repeated Measures Two-way ANOVA, Time x Lcn2 F (1, 25) = 7,179, p = 0,0129; Šídák's multiple comparisons test Control vs. rLcn2 at 20 min, p = 0,0196.
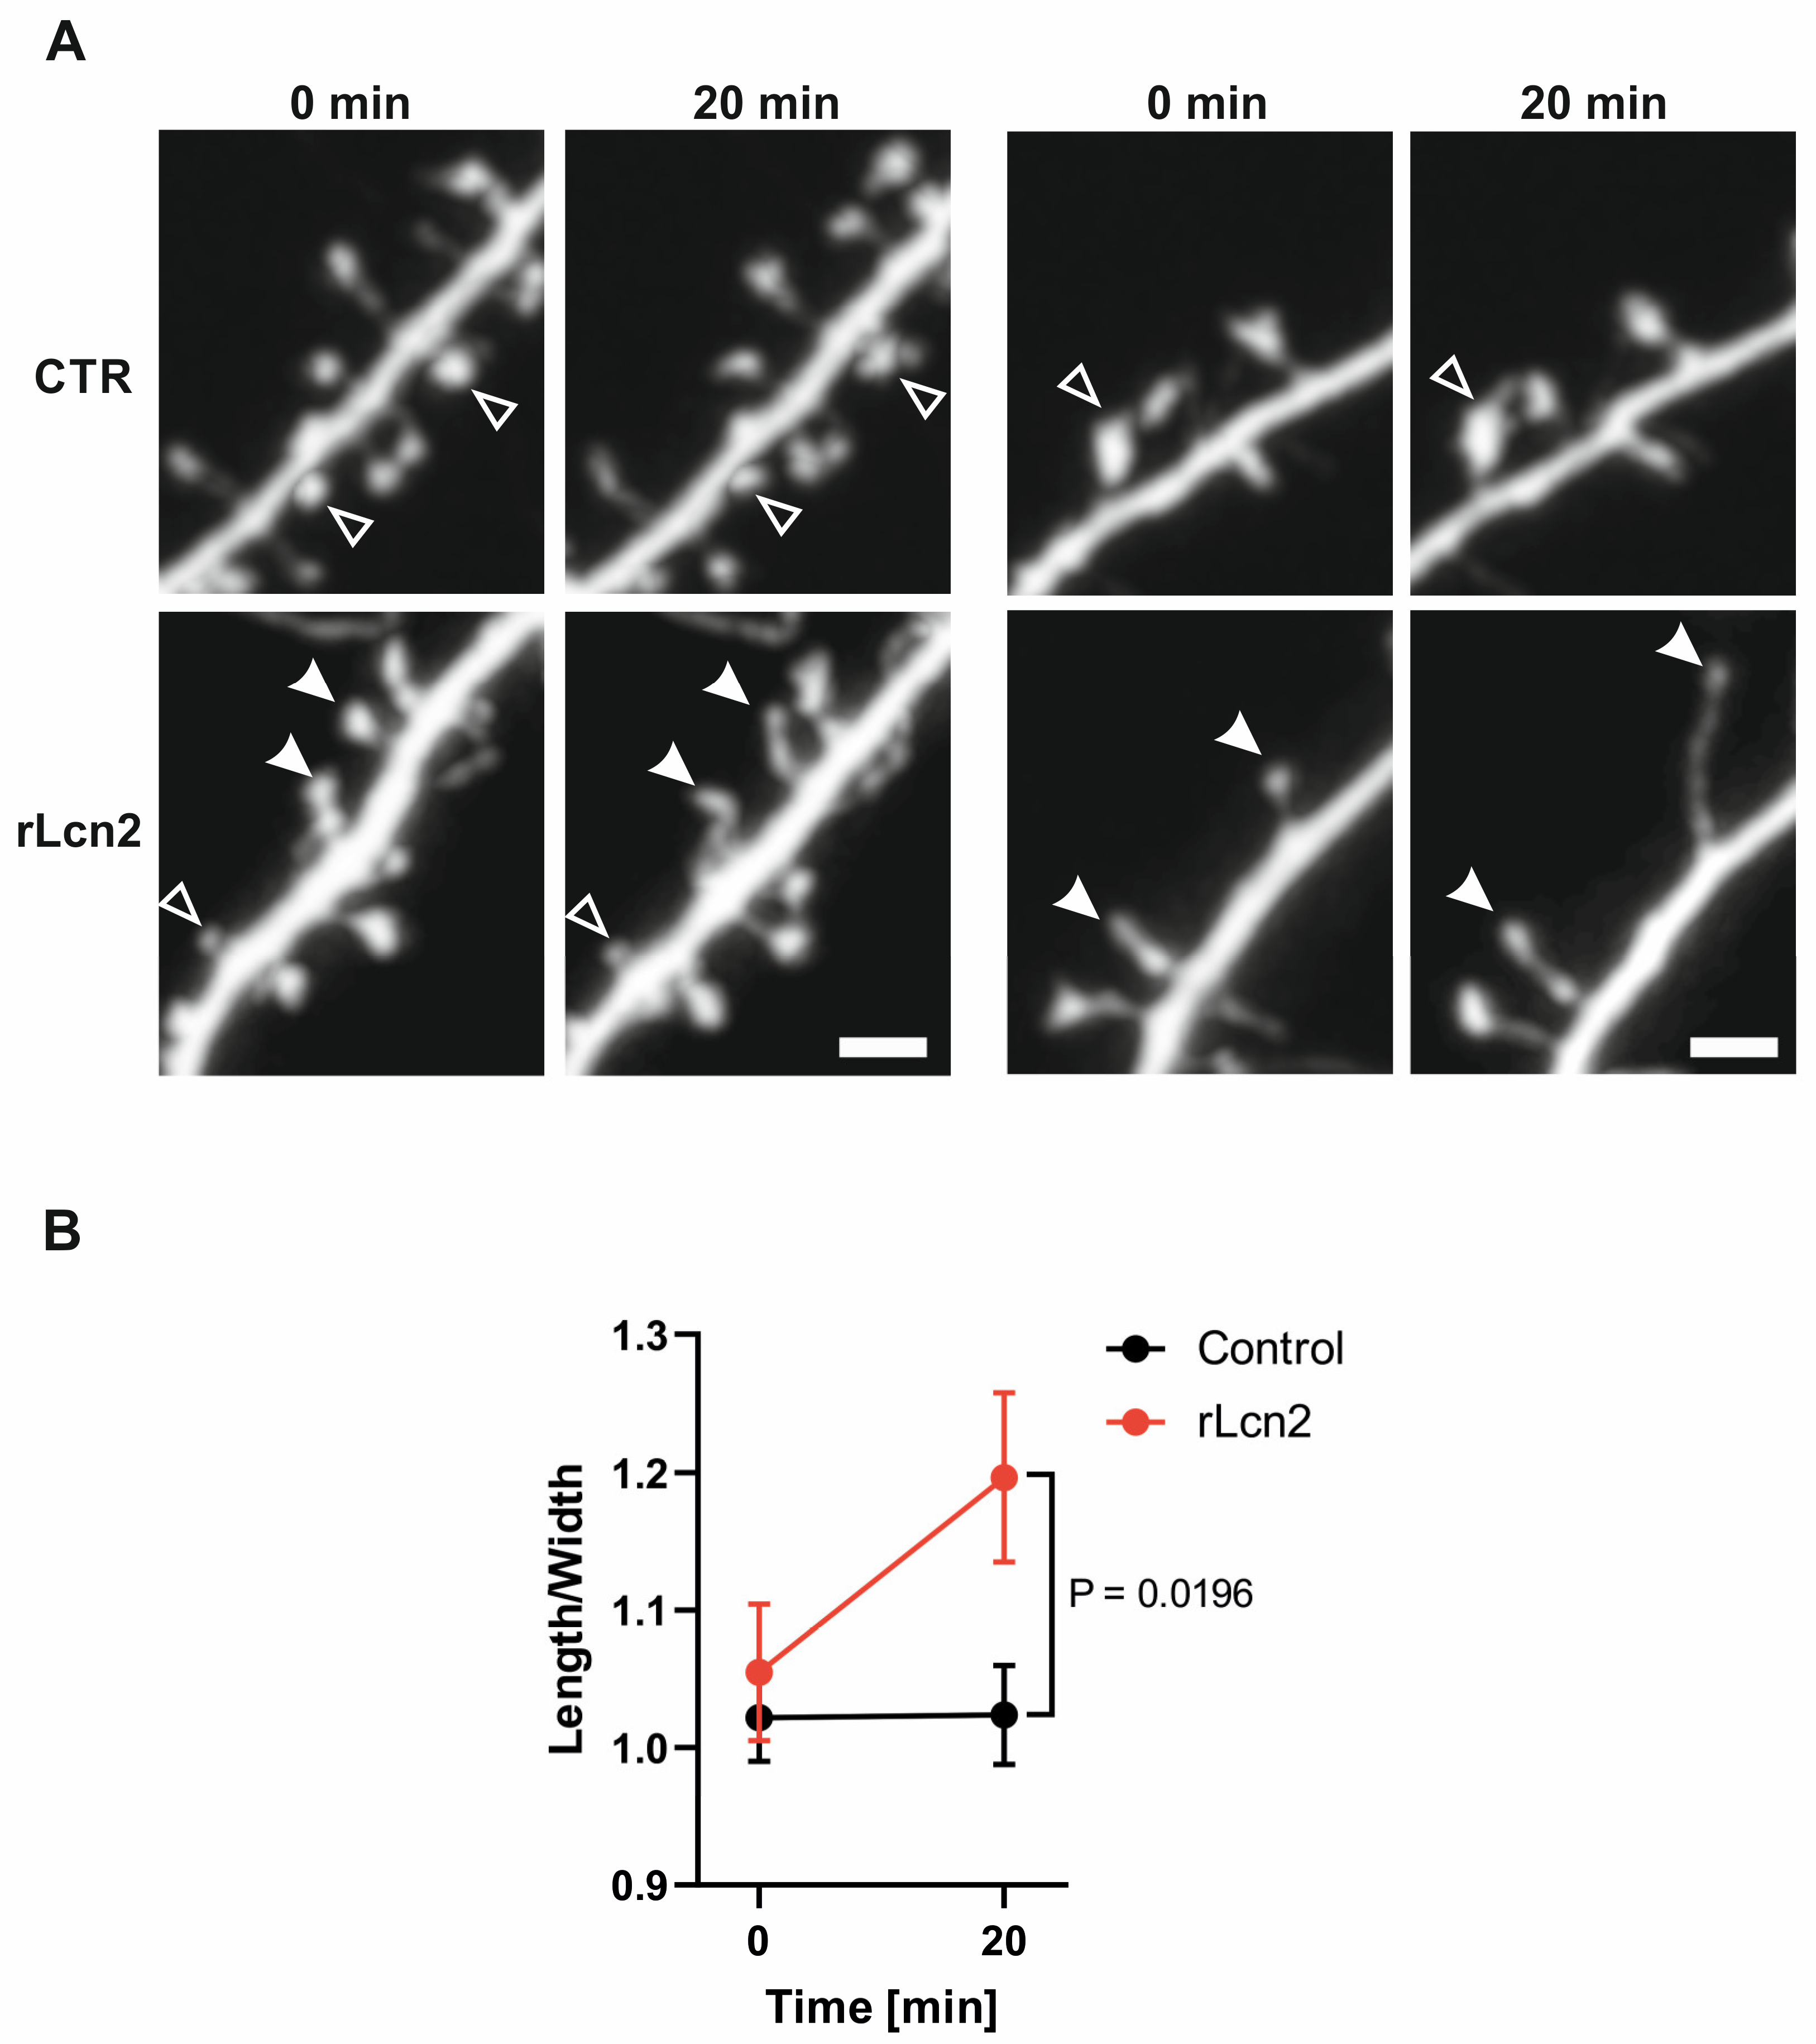
Disclaimer/Publisher’s Note: The statements, opinions and data contained in all publications are solely those of the individual author(s) and contributor(s) and not of MDPI and/or the editor(s). MDPI and/or the editor(s) disclaim responsibility for any injury to people or property resulting from any ideas, methods, instructions or products referred to in the content. |
© 2024 by the authors. Licensee MDPI, Basel, Switzerland. This article is an open access article distributed under the terms and conditions of the Creative Commons Attribution (CC BY) license (http://creativecommons.org/licenses/by/4.0/).
Copyright: This open access article is published under a Creative Commons CC BY 4.0 license, which permit the free download, distribution, and reuse, provided that the author and preprint are cited in any reuse.


