Preprint
Article

A Nash Bargaining with Negotiation Cost for Water Use and Pollution Conflict Management

This version is not peer-reviewed.

Submitted:

31 October 2024

Posted:

01 November 2024

You are already at the latest version

A peer-reviewed article of this preprint also exists.

Abstract
The intensifying overexploitation of water resources and the increasing pollution discharge have exacerbated conflicts in water resource utilization, making it urgent to effectively reconcile the contradiction between water resource utilization and environmental protection. This study developed a Cost-Inclusive Multi-Objective Bargaining Methodology (CIMB) coupled with Compromise Programming (CP) method to address conflicts between water use and pollution discharge, considering the economic benefits and the sustainable development of water resources. A deterministic multi-objective bargaining approach was employed, with two players representing the maximization of water use benefits and the minimization of total pollution discharge. This study takes the middle and lower reaches of the Han River region as an example to optimize water resource allocation in ten cities in this area. Using the CIMB-CP model, the water use and pollution discharge for different cities were obtained, and the impact of various factors on the game outcomes was analyzed. The model results indicate that negotiation cost have a significant impact on the Nash equilibrium solution. Compared to the Cost-Exclusive Multi-Objective Bargaining Methodology (CEMB) model, the Nash equilibrium solution of the CIMB-CP model shows an approximately 0.1% decrease in economic benefits and a approximately 0.3% decrease in pollution discharge. The risk attitudes of the participants have a significant impact on the game outcomes, and decision-makers need to formulate corresponding negotiation strategies based on their own risk preferences.
Keywords: 
Subject: 
Environmental and Earth Sciences  -   Water Science and Technology

1. Introduction

Water resources play a critical role in supporting agricultural, industrial, and urban development, serving as a vital foundation for economy and well-being of population. However, the increasing demands for water resources due to socio-economic development and population growth pose a significant risk of water scarcity and unsustainable usage [1,2]. Excessive water extraction and poor management practices result in declining groundwater levels, drying up of lakes and rivers, and the destruction of ecosystems [3,4]. Meanwhile, good water quality is required to maintain ecosystem integrity and biodiversity. Environmental pressures such as wastewater discharge and direct pollution can deteriorate water quality, disrupt the balance of ecosystems, and threaten the survival of aquatic organisms [5,6,7]. Therefore, a unified and rational approach is needed to effectively reconcile conflicts and balance human interests with environmental preservation [8].
In early water resource management, scholars relied on mathematical models and operation research methods, while often overlooking the vested interests and conflicts of various administrative entities within the basin or region, resulting in implementation challenges for optimal solutions [9]. Recently, researchers have acknowledged the imperative of addressing conflicts by deliberating on the equilibrium of interests among stakeholders and fostering consensus through negotiations within the basin [10]. Game theory provides a theoretical framework for achieving decision equilibrium among decision-making entities in their interrelationships. Compared with traditional multi-objective decision-making methods, the game theory approach can simulate the conflicts of interests arising from the interactions among multiple entities [11]. In water resource management and allocation, the game theory approach has gradually been researched to describe the behavioral scenarios of conflicting entities. Stakeholders can employ game theory approaches to resolve conflicts, seeking equilibrium through negotiation, cooperation, or competition, and ultimately reaching consensus decisions [12,13].
To address water resource conflicts, numerous scholars have made significant contributions. Chih-Sheng Lee [14] developed a multi-objective game theory model (MOGM) aimed at balancing economic and environmental concerns, devising a strategic approach for optimal reservoir basin management. Addressing water allocation conflicts particularly under water scarcity conditions, Homayounfar et al. [15] designed two non-discrete optimization models based on Nash bargaining game theory. Meanwhile, Nasiri-Gheidari et al. [16] constructed a robust multi-objective bargaining method to handle uncertainty in Nash equilibrium games, in which as uncertainty increases, the number of bargaining rounds also increases. Moradi and Limaei [17] employed a multi-objective game model and fuzzy programming approach to explore the feasibility of balancing economic development and environmental impacts, finding that both approaches yielded comparable results. Zeng et al. [18] developed a comprehensive mixed game mathematical programming model that integrates considerations for both water quantity and quality to overcome limitations associated with traditional game theory methods to address complex inter-jurisdictional water resource conflicts. In summary, scholars have applied bargaining game models to water resource allocation and proposed various methods for managing conflicts in water allocation. Through these application of multi-objective models, optimization techniques, and fuzzy programming, they have provided important theoretical and practical references for addressing issues related to economic, environmental, and other considerations in watershed water resource management.
However, disparities exist between Rubinstein's bargaining game model and real market transactions concerning water allocation. Chih-Sheng Lee's MOGM method, for example, does not specify the individual goals of each player in different rounds, and different goals can lead to different game outcomes [14]. In actual market transactions, the current negotiation rounds and attitudes towards market risks influence the players' goals, thereby affecting the entire game process.
Additionally, the Nash equilibrium solution obtained through the MOGM model is expressed as an interval rather than a fixed point, which still requires decision-makers to weigh their options. Therefore, we introduce compromise programming to address this issue. Compromise programming is a mathematical method specifically designed to tackle multi-objective optimization problems[19]. It aims to find a balance among multiple conflicting objectives rather than merely selecting the optimal solution for one objective. Through a satisfaction assessment mechanism, compromise programming enables decision-makers to identify an overall more satisfactory solution, even if they are not fully satisfied with any single objective. Consequently, this paper integrates a Cost-Inclusive Multi-Objective Bargaining Methodology - Compromise Programming (CIMB-CP) model to simulate the bargaining process of conflicts related to water use and pollution discharge. The ultimate objective is to furnish decision-makers with appropriate strategies to address water resource crises. This study can re-veal potential conflicting interests and motivations among the participants, thereby deriving rational and feasible decision strategies. The research methodology provides decision-makers with theoretical support and practical guidance to address issues and challenges in water resource allocation, ultimately achieving sustainable and equitable water resource management.
The article first introduces the Cost-Inclusive Multi-Objective Bargaining Method (CIMB) and further resolves the negotiation outcomes through the Compromise Programming (CP) approach. Subsequently, using the middle and lower reaches of the Han River basin as a case study, the application effects of this model in water resource allocation are analyzed, and a sensitivity analysis of the game results under different negotiation scenarios is conducted. Finally, the research conclusions are summarized, and future research directions are anticipated. The main objectives of this study include: (1) to construct a Nash bargaining game model that considers negotiation cost to more accurately simulate the conflict between water resource utilization and pollution emissions; (2) to analyze the impact of negotiation cost on game outcomes, providing a theoretical basis for water resource management decisions; (3) to explore the influence of participants' risk attitudes on game results, offering references for optimizing negotiation strategies; and (4) to verify the model's effectiveness and practicality using the middle and lower reaches of the Han River basin as a case study, and providing decision support for basin water resource management.

2. Methodology

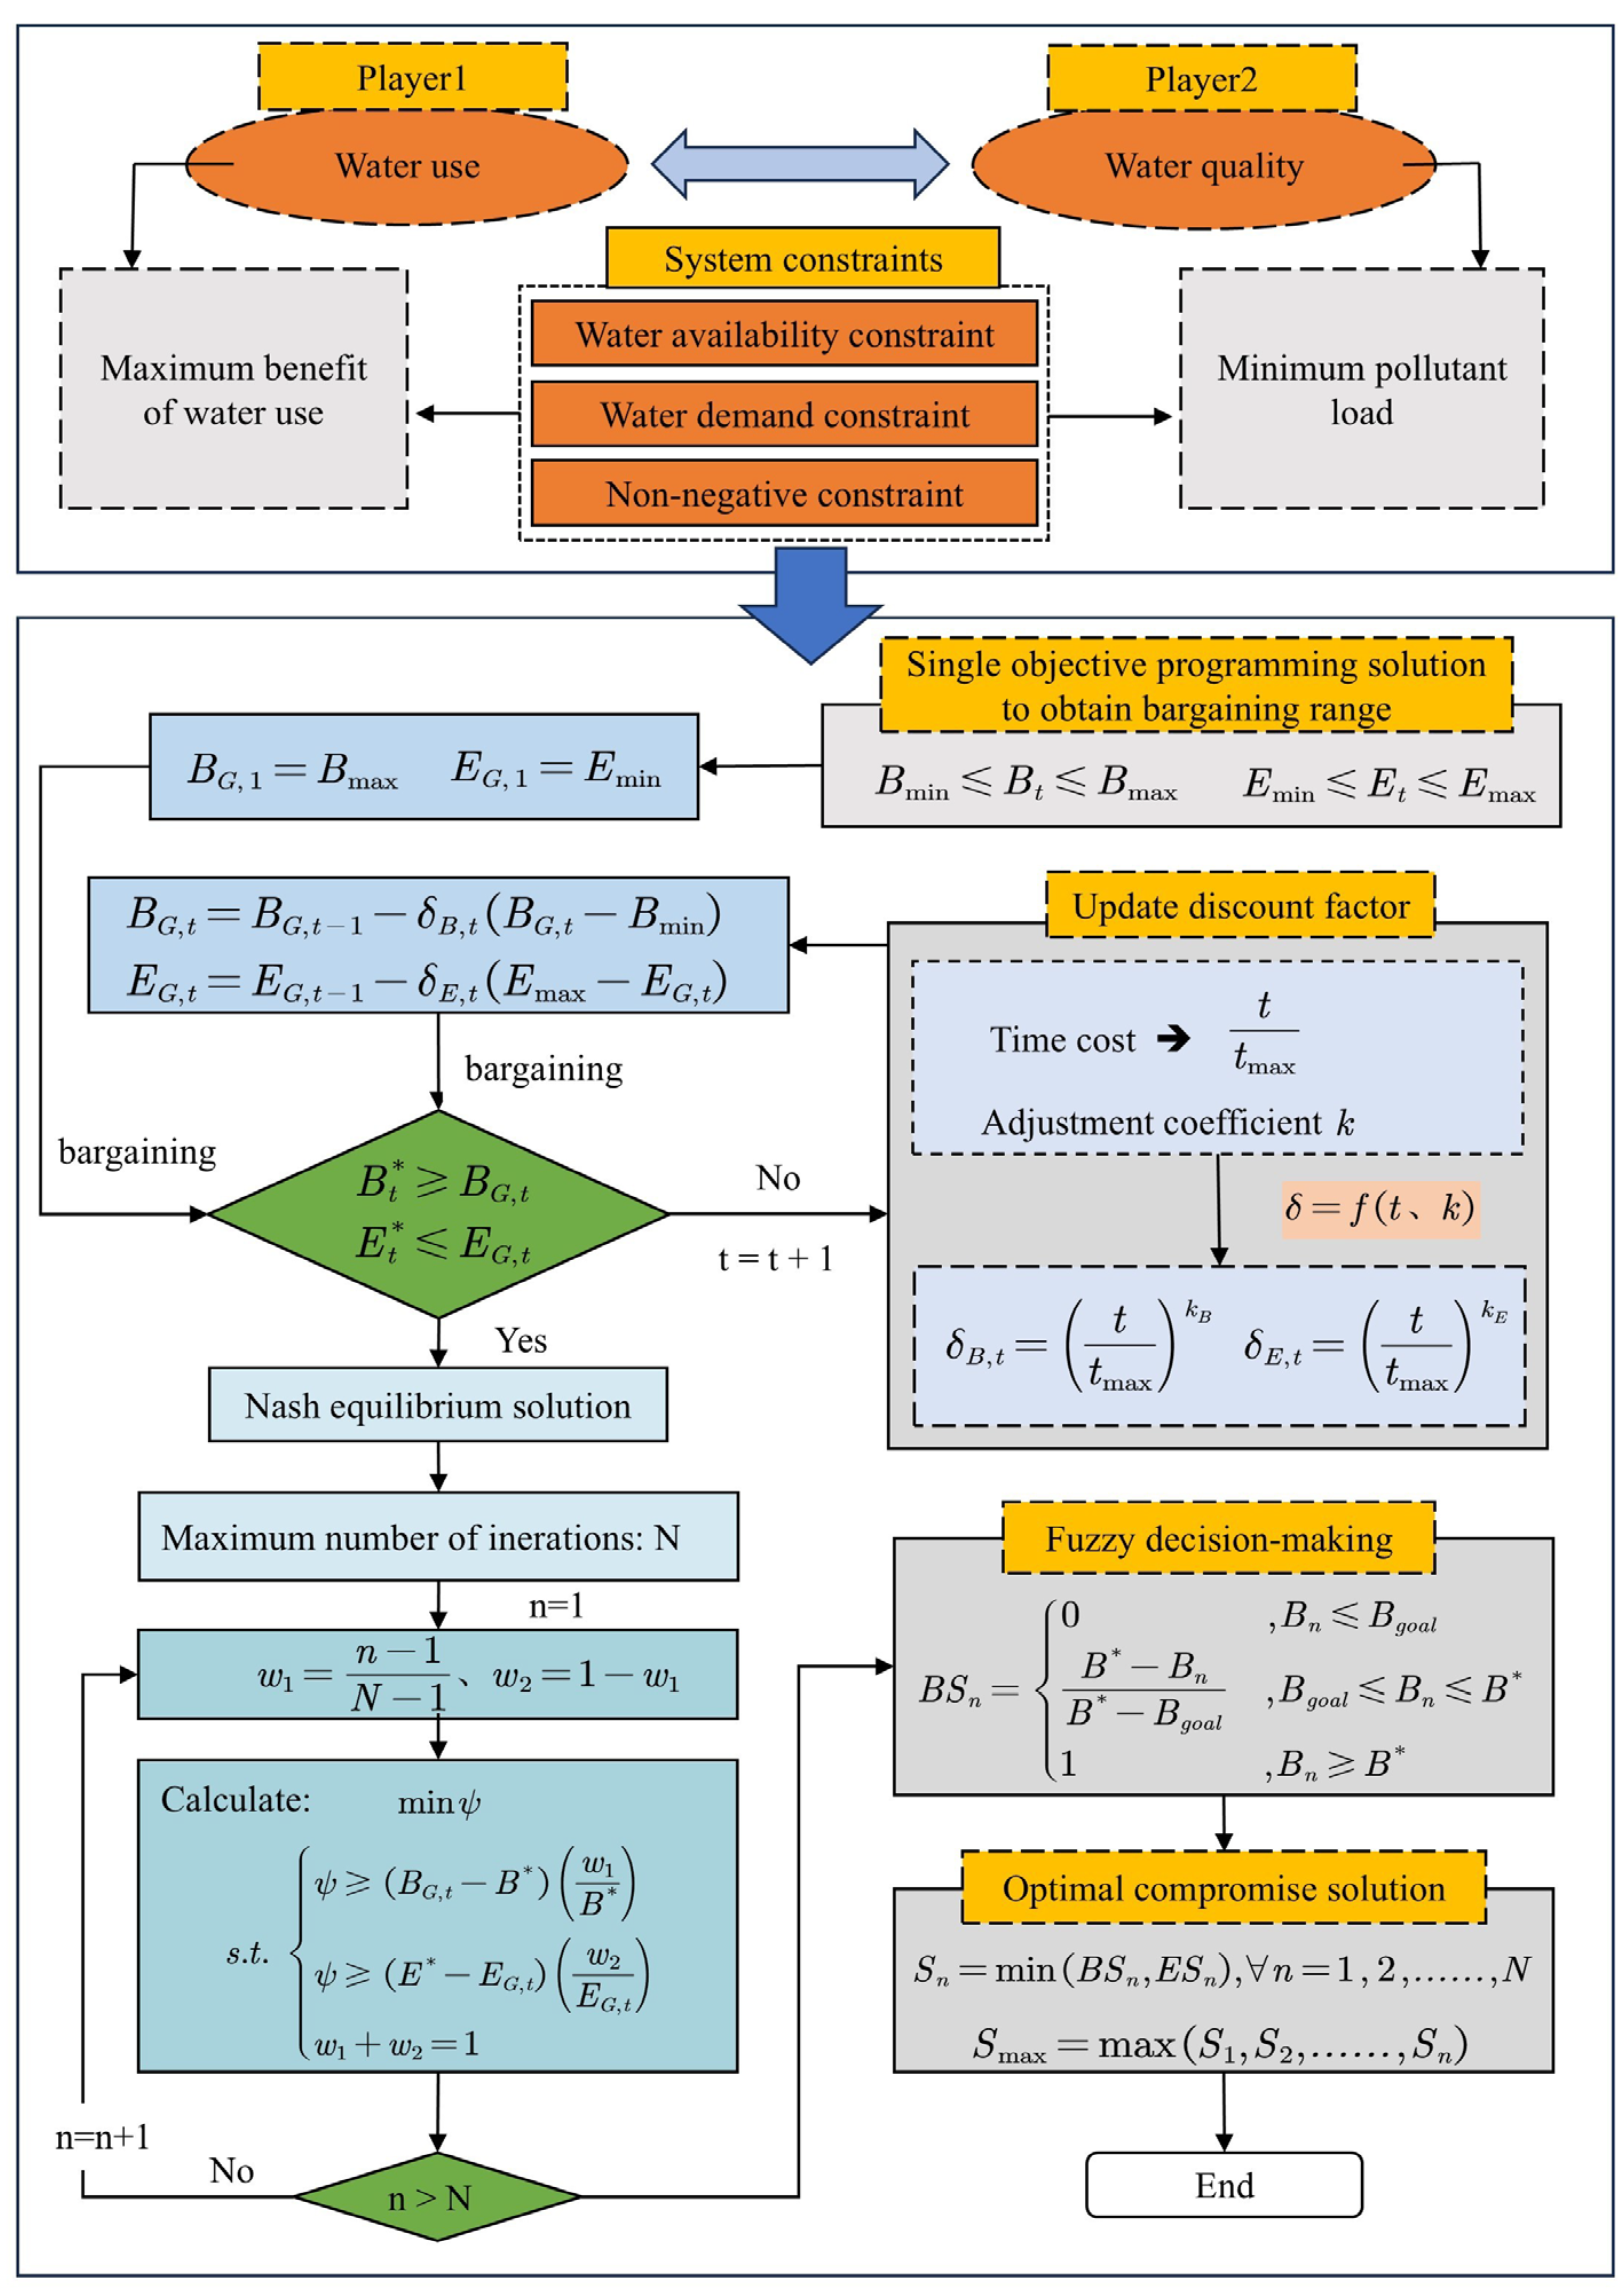
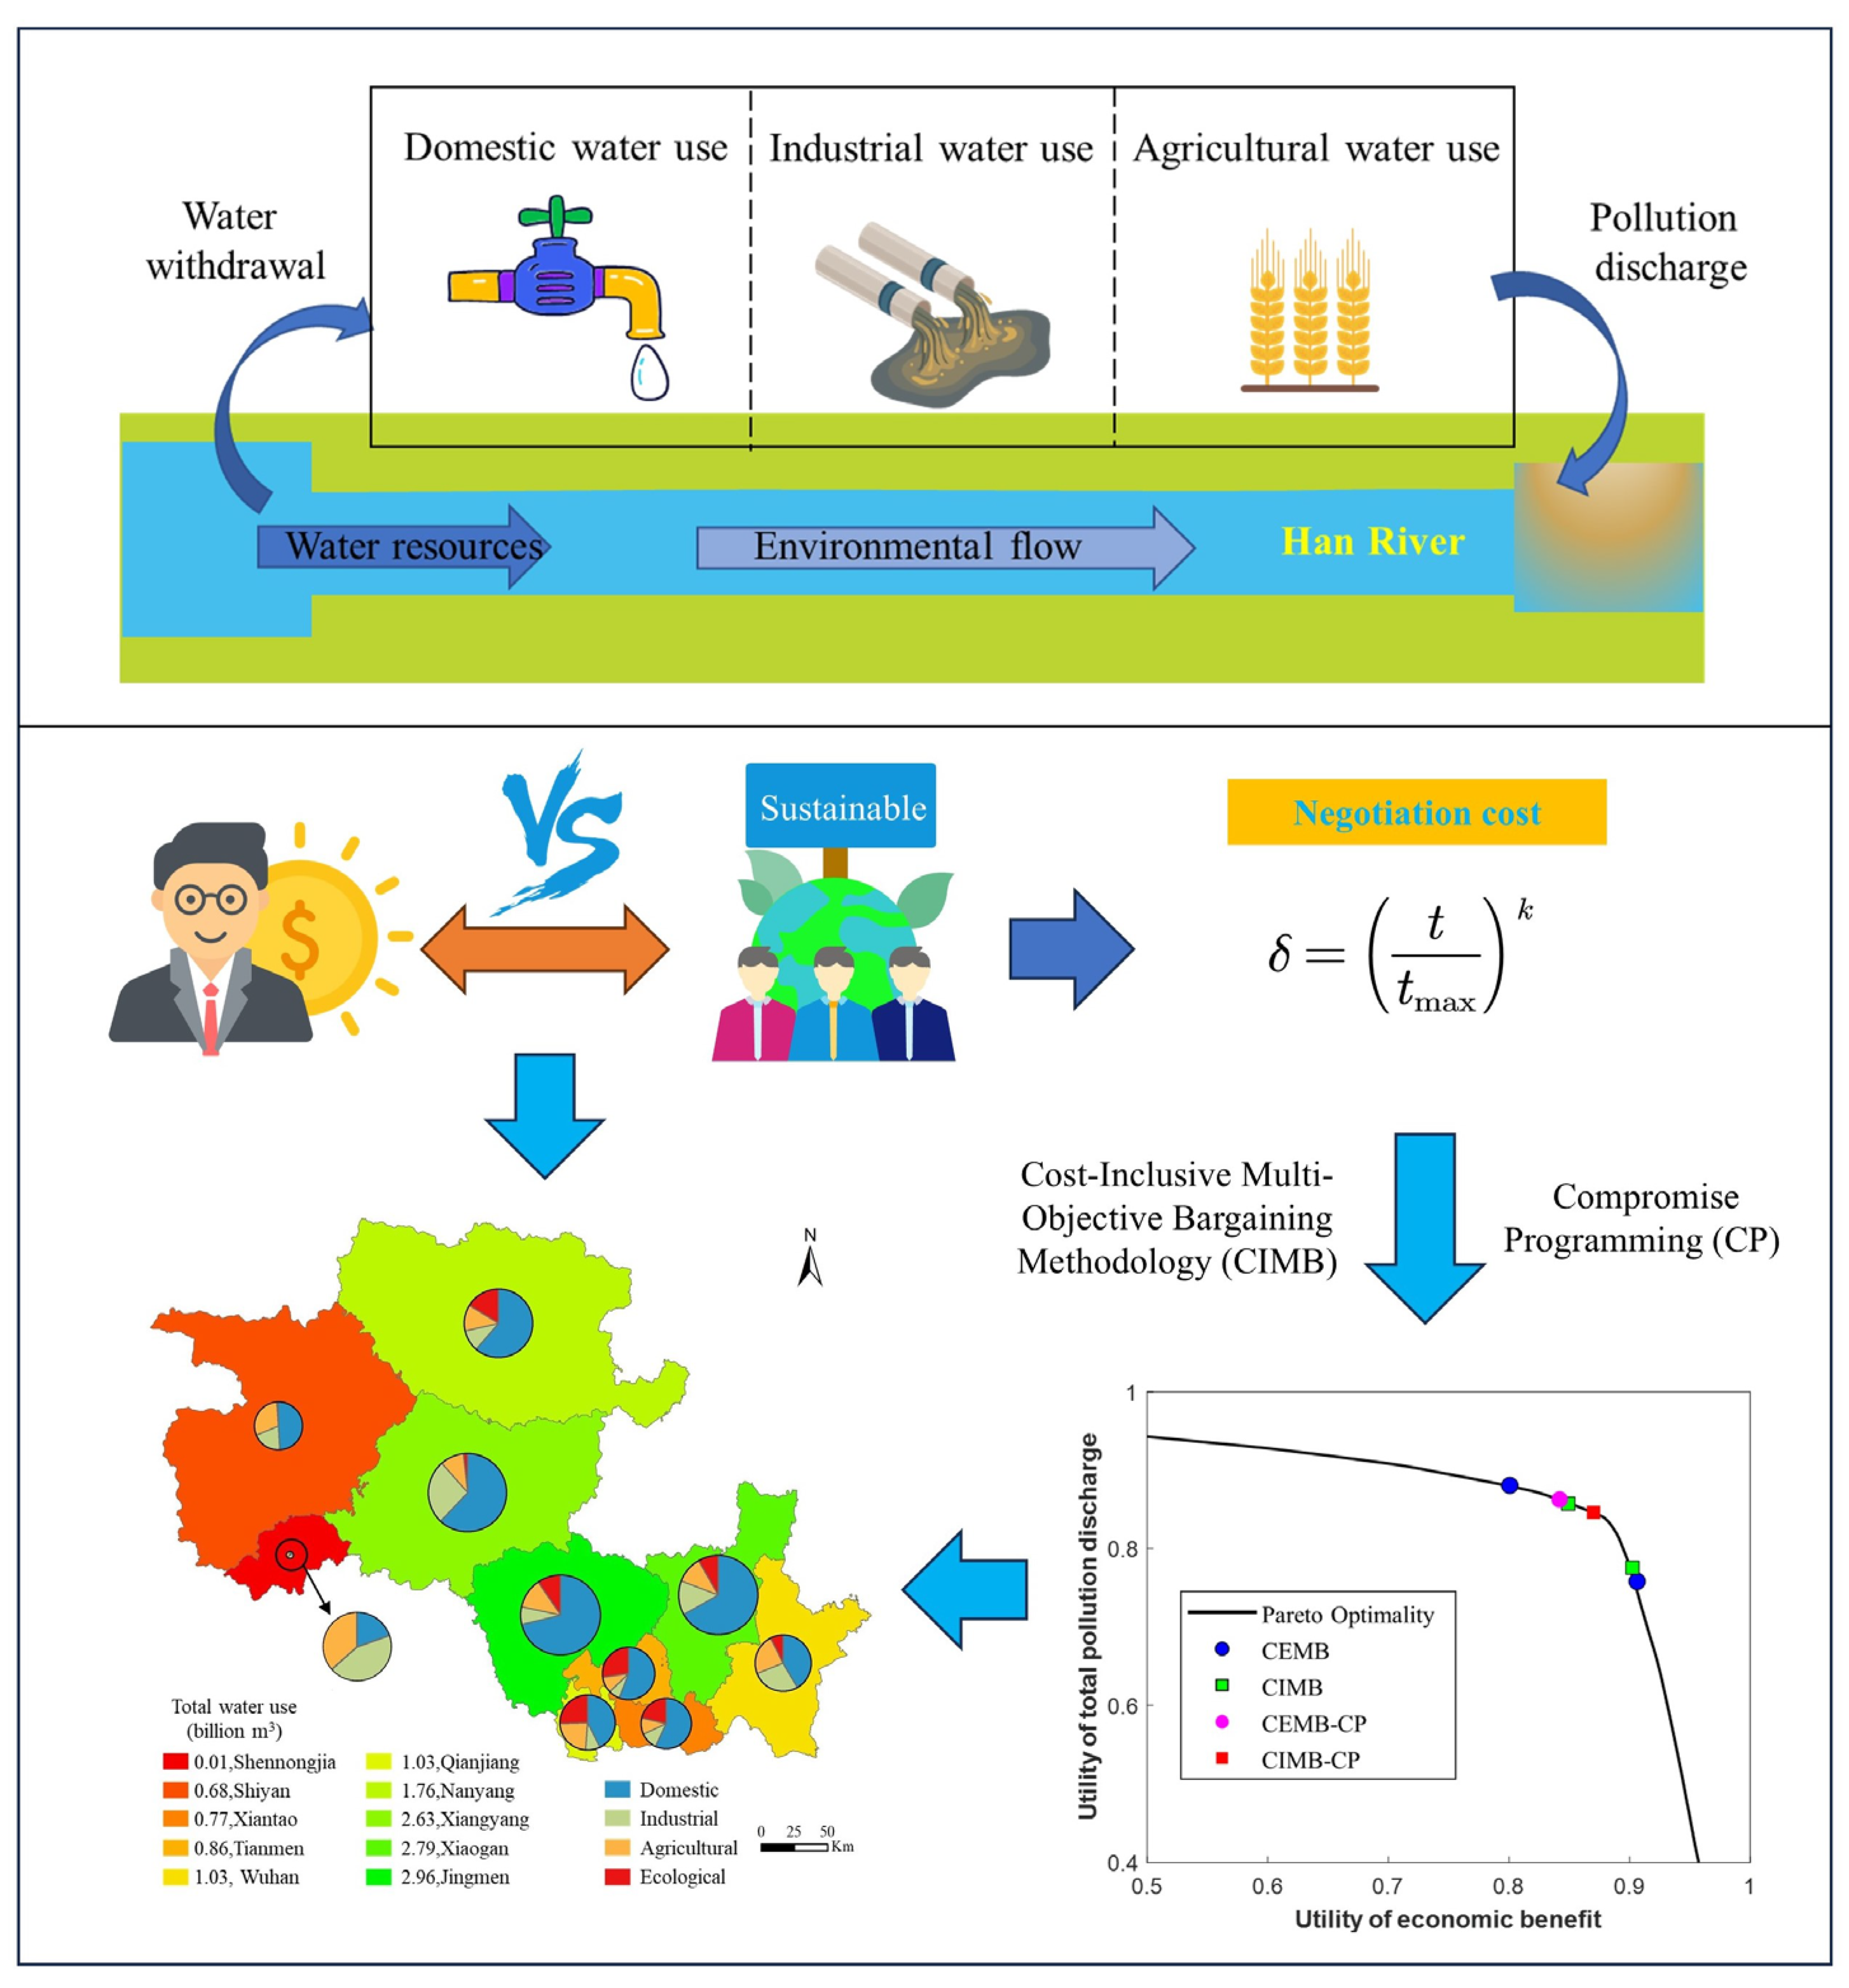
Figure 1 depicts the research framework of the CIMB-CP model, developed for water resource utilization and pollution discharge in the middle and lower reaches of the Hanjiang River Basin. Initially, this paper outlines the current state of water resources in the Hanjiang Basin and conducts an in-depth analysis of water extraction by the three major water-using sectors: domestic, industrial, and agricultural. Additionally, it uncovers potential pollution issues associated with these activities, clearly identifying the conflicts between ecological sustainability and economic benefits. To effectively address this challenge, the study introduces the Cost-Inclusive Multi-Objective Bargaining methodology (CIMB) and integrates Compromise Programming (CP) to optimize the cost-benefit balance during the negotiation process. Within the CIMB-CP model framework, a discount factor is introduced to represent the negotiation cost of both sides in the game. The influence of players' risk attitudes on the game outcome is thoroughly analyzed by exploring this discount factor. This study enhances the simulation of the conflict process among various players and explores the behavioral mechanisms of water resource allocation conflicts. The model not only offers a systematic solution set but also presents the total water consumption across various regions through detailed data distribution maps and accurately illustrates the specific water use proportions with pie charts, delving into the dynamic interplay between ecological and economic benefits. These analytical tools and data presentation methods collectively construct a comprehensive and in-depth framework for water resource management and pollution control, providing robust theoretical support and practical guidance for sustainable development in the middle and lower reaches of the Hanjiang River Basin.

2.1. Cost-Inclusive Multi-Objective Bargaining Methodology (CIMB)

A classical model of multi-objective programming is as follows:
min Z x = Z 1 x , Z 2 x , , Z q x s . t . h r x 0 , r = 1 , 2 , , l x p 0 , p = 1 , 2 , , v
Where Z x is an objective function and Z 1 x , Z 2 x , , Z q x is a set of all q objective functions. h r x is the r th constrain function and x p is the p th decision variable. To apply the bargaining model to the multi-objective problem, two stakeholder groups were treated as players: the economic player (Player 1) and the environmental player (Player 2). Player 1 focused on maximizing economic income while Player 2 aimed to minimize pollution discharge into the river.
First, determine the upper and lower values for each player. The negotiation interval, which represents the payoff in the bargaining approach, is the difference between these upper and lower levels of the objective functions. These bounds are found by maximizing and minimizing each individual objective function. Thus, the range of the maximum and minimum values for each player can be determined as follows:
For Player1,
B min B = Z 1 x B max
For Player2,
E min E = Z 2 x E max
After determining the range, the first round of negotiation begins. Player1 and Player2 then establish their objective values B max and E min as B g o a l and E g o a l , respectively. These objective values will serve as constraints for the other party in the following equations.
For player 1, the strategy is:
max B = Z 1 x s . t . h r x 0 , r = 1 , 2 , , l Z 2 x E g o a l x p 0 , p = 1 , 2 , , v
For player 2, the strategy is:
min E = Z 2 x s . t . h r x 0 , r = 1 , 2 , , l Z 1 x B g o a l x p 0 , p = 1 , 2 , , v
In fact, neither player will be satisfied with the other’s objective results during the first round of negotiations. Consequently, both players will lower their expectations; for example, Player 1 will reduce their economic income expectations, while Player 2 will increase their river pollution emissions, and a series of negotiations and concessions will commence. After further negotiations, the gap between the adjusted objective values and the MOGM results will become smaller. The bargaining process will continue until the final solutions for B * and E * are determined as follows:
B * B g o a l E * E g o a l
The values of B * and E * are the Nash equilibrium of the problem.
As the number of bargaining rounds increases, the players’ objective values change accordingly in each round. At the beginning, players are less willing to make significant concessions, but as the rounds progress, they gradually expand their concession space in order to quickly reach a Nash equilibrium. This process can be described using a discount factor as follows:
δ B , t = t t max k B
B g o a l , t = B g o a l , t 1 δ B , t B g o a l , t B min
δ E , t = t t max k E
E g o a l , t = E g o a l , t 1 + δ E , t E max E g o a l , t
Where δ B , t ,   δ E , t are the discount factor for Player1 and Player2, respectively, δ B , t ,   δ E , t is the maximum number of bargaining rounds acceptable to both players, k B ,   k E are adjustment coefficients for Player 1 and Player 2, representing their patience level during the bargaining rounds.

2.2. Compromise Programming (CP)

The solution obtained through the Cost-Inclusive Multi-Objective Bargaining Methodology (CIMB) is not unique but is represented as a set of intervals. To obtain a more accurate solution, this study introduces the Compromise Programming (CP) Method to further solve these intervals.
The CP method begins by identifying the Pareto frontier solution set, which is done by calculating the distance between the optimal values of two objective functions and their standard values. Then, fuzzy decision-making is used to determine the degree of satisfaction for the Pareto frontier solution. Finally, the optimal compromise solution is selected based on comparing the satisfaction degrees.
Identifying the Pareto frontier solution set involves considering the following constraints:
min f = ψ w 1 = n 1 N 1 ψ f 1 f 1 min w 1 f 1 min w 1 + w 2 = 1 ψ f 2 f 2 min w 2 f 2 min
Where ψ is the Chebyshev distance, ω1 and ω2 are the weight coefficients, respectively, n and N are the current times and the maximum times of iterations in process of compromise programming, respectively; f 1 ,   f 2 is the n-th solutions of programming problem for Player1 and Player2, respectively.
After identifying the Pareto frontier solution, the fuzzy decision-making method is used to assess the satisfaction levels of players for these solutions. The optimal compromise solution is then selected from the Pareto frontier solution. The specific mathematical model is presented as follows:
S l , n = 1 , f l , n f l max f l max f l , n f l max f l min , f l min f l , n f l max 0 , f l , n f l max
Where S 1 , n ,   S 2 , n is the satisfaction degree of n-th programming problem for Player1 and Player2, respectively.
The optimal compromise solution is acquired by comparing the satisfaction degree as following:
S n = min Y 1 , n , Y 2 , n , n = 1 , 2 , , N
Where S n is the satisfaction degree value of the n-th programming decision for two players, and S max is the maximum value of all the minimum satisfaction degree values.

3. Case Study

3.1. Problem Statement

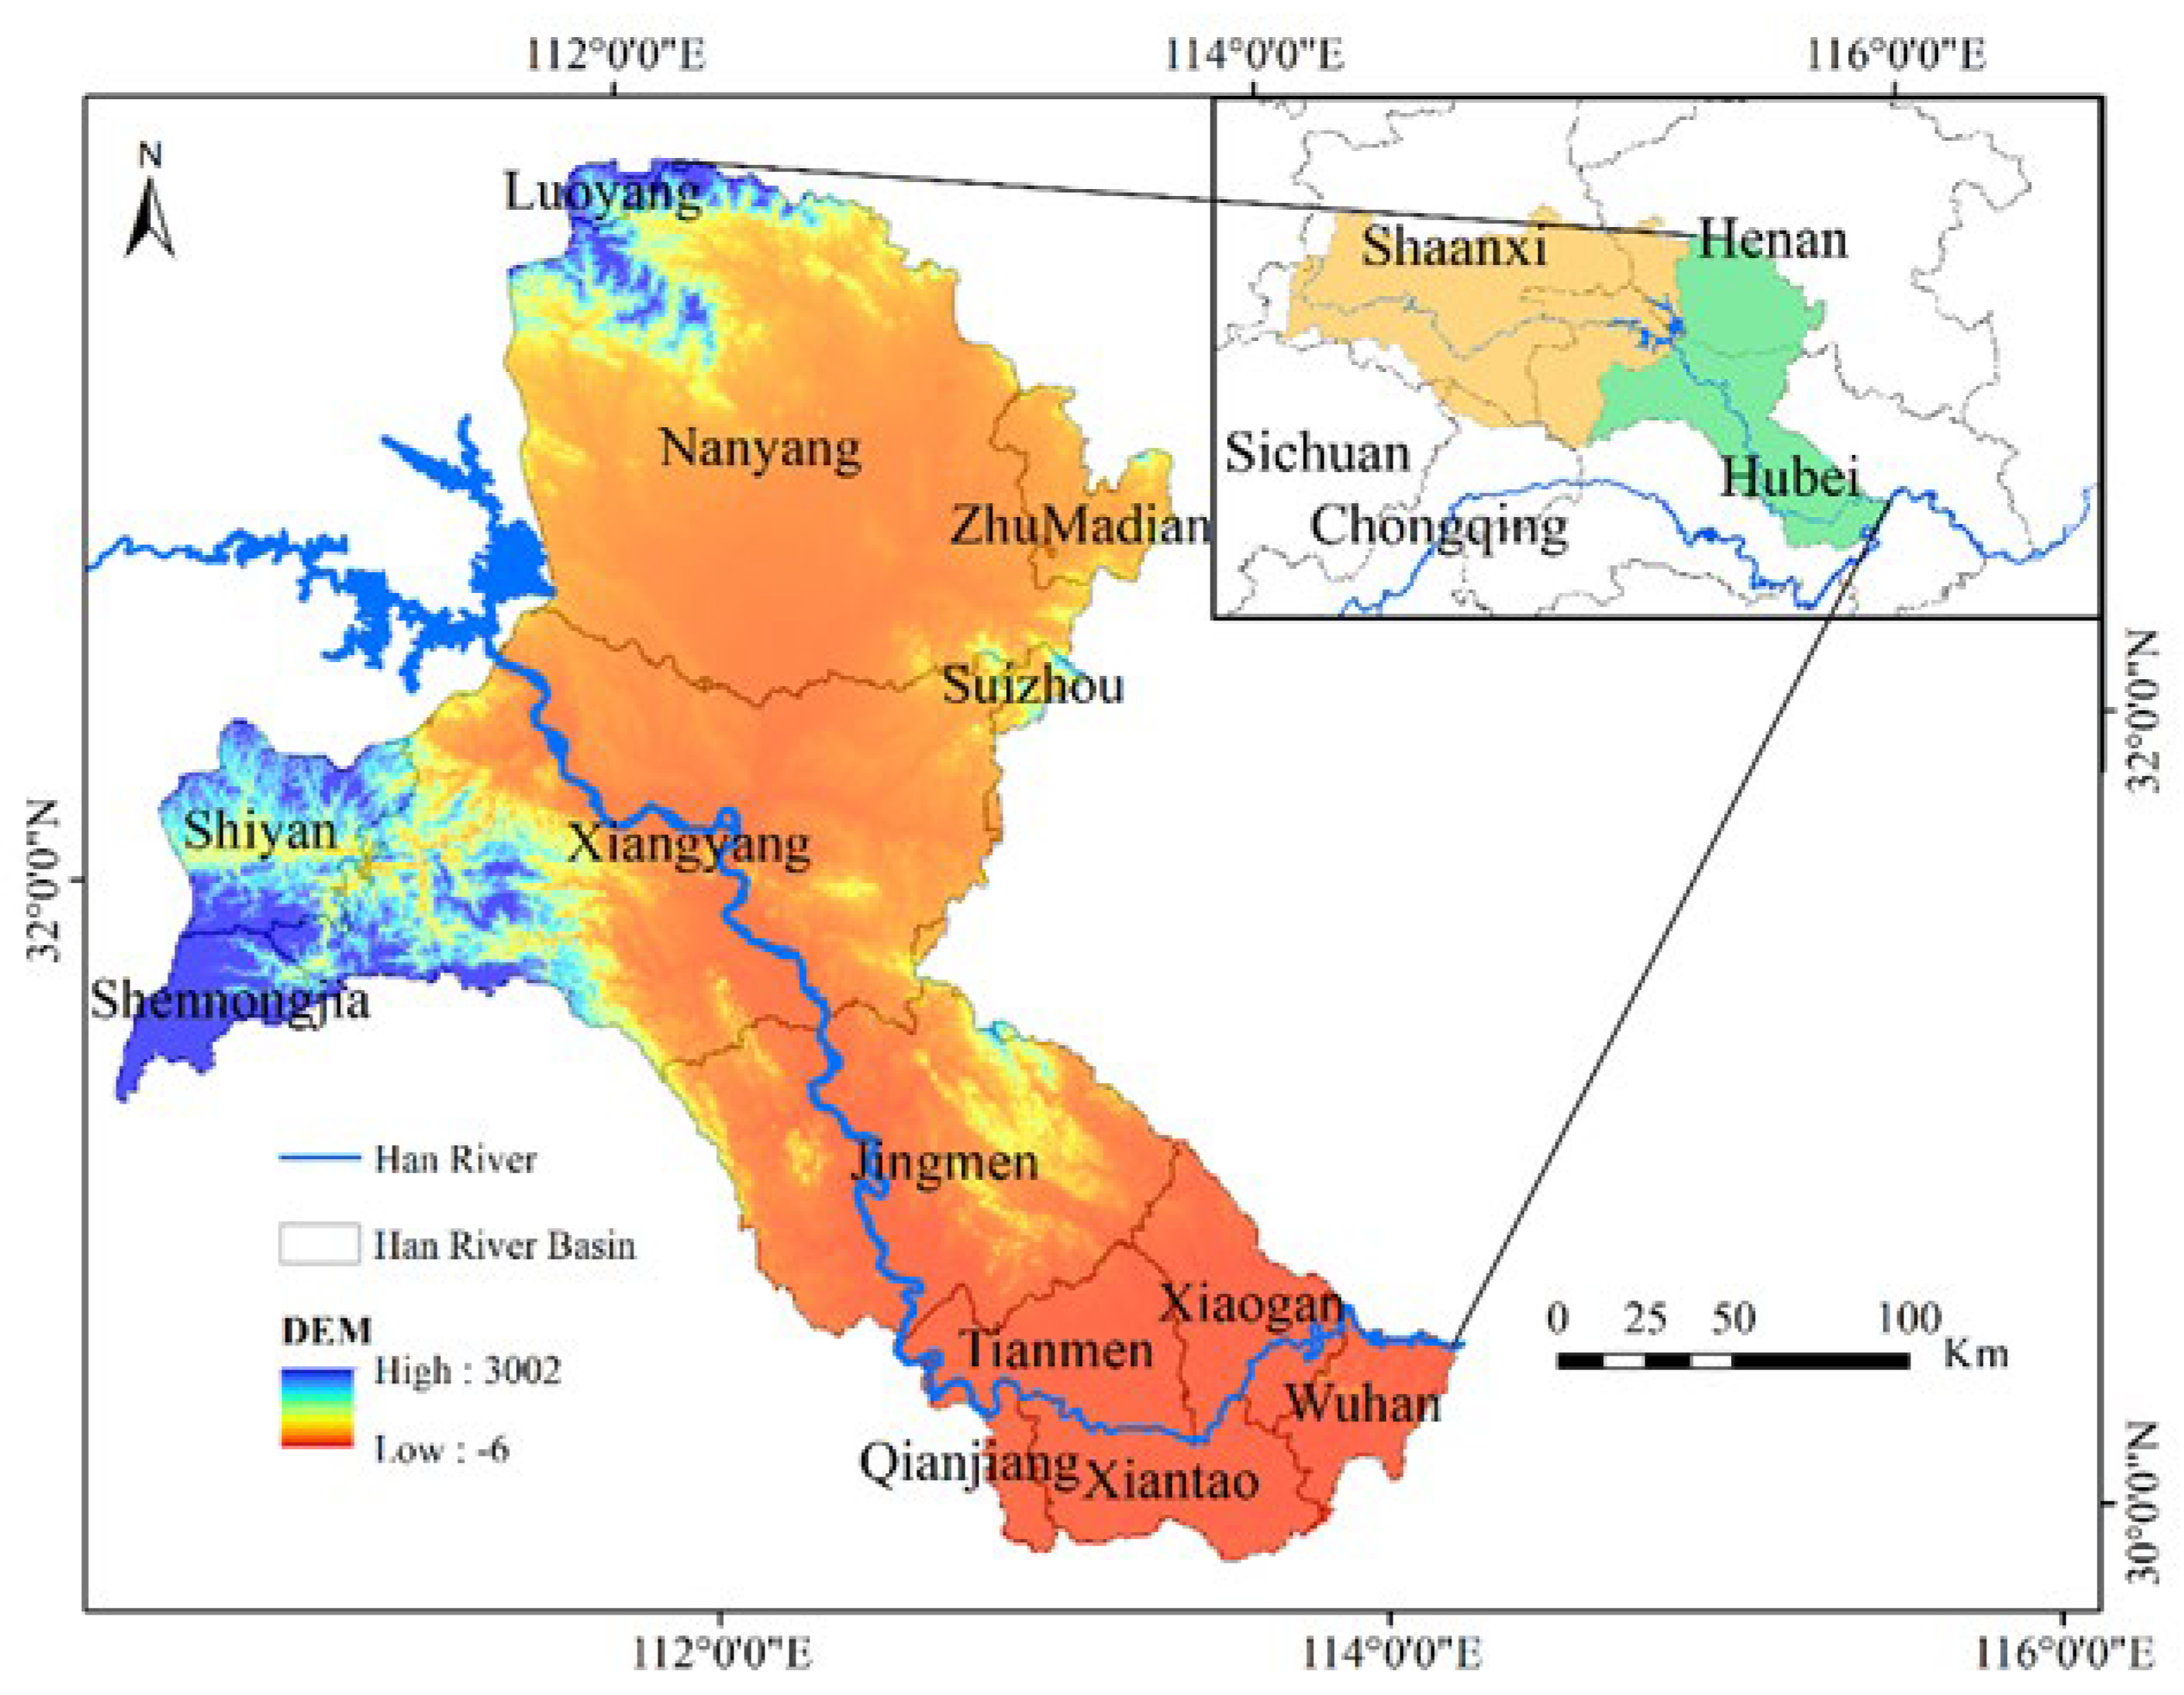
The Han River’s middle and lower reaches traverse the administrative regions of Hubei and Henan provinces, situated between longitudes 111°E and 115°E, and latitudes 30°N and 33°N. Spanning a total length of 652 kilometers, the river flows through Nanyang, Xiangyang, Shiyan, Jingmen, Tianmen, Qianjiang, Xiantao, and Wuhan, among other areas. This region is a crucial grain production base for Hubei Province, as depicted in Figure 2. The middle and lower reaches of the Han River are influenced by the subtropical monsoon climate, with an average annual temperature ranging from 15°C to 17°C and annual precipitation between 700 and 1300 mm. The runoff distribution throughout the year is uneven, with the majority occurring between May and October, accounting for approximately 70% to 80% of the annual runoff. In contrast, during the dry season from December to February of the following year, runoff constitutes only about 7% of the annual total.
With the rapid development of the Han River Ecological Economic Zone and accelerated urbanization, there has been an increase in non-point source pollution from agriculture, urban domestic sewage, and industrial wastewater discharges into the river[20,21]. Consequently, the water quality and ecological environment of the Han River’s middle and lower reaches have progressively deteriorated. Since the first large-scale diatom bloom outbreak in 1992, such occurrences have become increasingly frequent. Additionally, the South-to-North Water Diversion Project, which transfers water from the Danjiangkou Reservoir, has led to a decrease in the Han River’s flow velocity and pollution assimilation capacity, exacerbating environmental and ecological issues. Riverine ecological restoration and the balanced development of regional economy and environment are crucial for maintaining the equilibrium of the river’s ecosystem[22,23]. Therefore, this study employs the CIMB-CP methodology to investigate the economic and environmental interests of the two primary stakeholders in the Han River’s middle and lower reaches, providing valuable insights for the rational development and protection of Han River water resources.

3.2. CIMB-CP Modeling Formulation

This study focuses on the major 10 cities in the middle and lower reaches of the Han River Basin, which are Jingmen, Qianjiang, Shennongjia, Shiyan, Tianmen, Wuhan, Xiantao, Xiangyang, Xiaogan, and Nanyang. Each city is analyzed with respect to four water use sectors: domestic, industrial, agricultural, and ecological. Based on the CIMB-CP method applied to the Han River Basin, various constraints, including total water resources constraints and water use constraints, are comprehensively considered. To apply the bargaining model to the multi-objective problem, two stakeholder groups were treated as players: the economic player (Player 1) and the environmental player (Player 2). Player 1 focused on maximizing economic income while Player 2 aimed to minimize pollution discharge into the river. Figure 3 illustrates the research flowchart of this study.
For player 1,
max B t = i = 1 I j = 1 J N E T i j x i j , t
s . t . E t E G , t
E G , t = E G , t 1 + δ E , t E max E G , t
δ E , t = t t max k E
For player 2,
min E t = i = 1 I j = 1 J e i j C i j + N i j + P i j x i j , t
s . t . B t B G , t
B G , t = B G , t 1 δ B , t B G , t B min
δ B , t = t t max k B
Where i = 1 , 2 , , I is the water resource division; j = 1 , 2 , , J is the water sector; t = 0 , 1 , , T is round t in the bargaining process; x i j , t is the amount of water resources allocated (billion m3); N E T i j is the water efficiency factor (yuan/m3); e i j is the water pollution discharge coefficient; C i j ,   N i j ,   P i j are the emission concentrations of Chemical Oxygen Demand (COD), ammonia nitrogen, and total phosphorus (mg/L); B t ,   B G , t are the optimal value and goal value of player 1, respectively (billion yuan); E t ,   E G , t are the optimal value and goal value of player 2, respectively (kiloton). B G , 0 = B max E G , 0 = E min are the initial target values of player 1 and player 2, respectively and they were set to the maximum economic benefit for player 1 and minimum total pollution discharge for player 2; δ B , t , δ E , t are the discount factor of player 1 and player 2 respectively, reflecting the cost in the bargaining process.
The system constraints that both players obey are described as follows.
(1)All water usage should be less than the area's water availability:
i = 1 I j = 1 J x i j , t A W S
(2)The allocated water volume of the water sector should be less than the required water volume of the sector:
η i j W D i j x i j , t W D i j
(3)All variables should be greater than or equal to 0, that is, non-negative constraints:
x i j , t 0 A W S 0 W D i j 0
Where AWS is the total water availability in the region; W D i j is the water demand for each sector; η i j is the minimum water supply coefficient, with a value ranging from 0 to 1.
After obtaining the Nash equilibrium using the MOGM method, the results are further solved using the compromise programming method described above. The specific formula is as follows:
min f = ψ w 1 = n 1 N 1 ψ B n B g o a l w 1 B g o a l w 1 + w 2 = 1 ψ E n E * w 2 E *
For player 1,
B S n = 0 , B n B g o a l B * B n B * B g o a l , B g o a l B n B * 1 , B n B *
For player 2,
E S n = 0 , E n E g o a l E * E n E * E g o a l , E g o a l E n E * 1 , E n E *
The optimal compromise solution is acquired by comparing the satisfaction degree as following:
S n = min B S n , E S n , n = 1 , 2 , , N
S max = max S 1 , S 2 , , S n
Where B n ,   E n is the n-th solutions of programming problem for Player1 and Player2, respectively; B S n ,   E S n is the satisfaction degree of n-th programming problem for Player1 and Player2, respectively.

3.3. Data Collection

The baseline year for this study is 2020, and the planning year is 2030. Historical water usage data, population data, economic data, and pollution discharge data for various cities in the middle and lower reaches of the Han River Basin were collected. The water demand for each city in 2030 was calculated using the quota method. The total available water supply for the basin is based on a multi-year average. According to the “Hubei Province Water Resources Bulletin,” approximately one-third of Wuhan’s water supply comes from the Han River. Therefore, in this study, the predicted water demand for Wuhan is taken as one-third of its original predicted demand. The historical water usage data for each city is sourced from the “Hubei Province Water Resources Bulletin” and the “Henan Province Water Resources Bulletin.” Economic data related to water usage by different departments in each city is derived from the “Hubei Province Statistical Yearbook” and the “Henan Province Statistical Yearbook.” The sewage discharge coefficients and pollutant removal rates are obtained from the “Urban Drainage Engineering Planning Code” (GB 50318–2017) and the “Pollutant Discharge Standards for Urban Sewage Treatment Plants” (GB 18918–2002), respectively.

4. Results and Discussion

4.1. Economic Benefit and Pollution Discharge

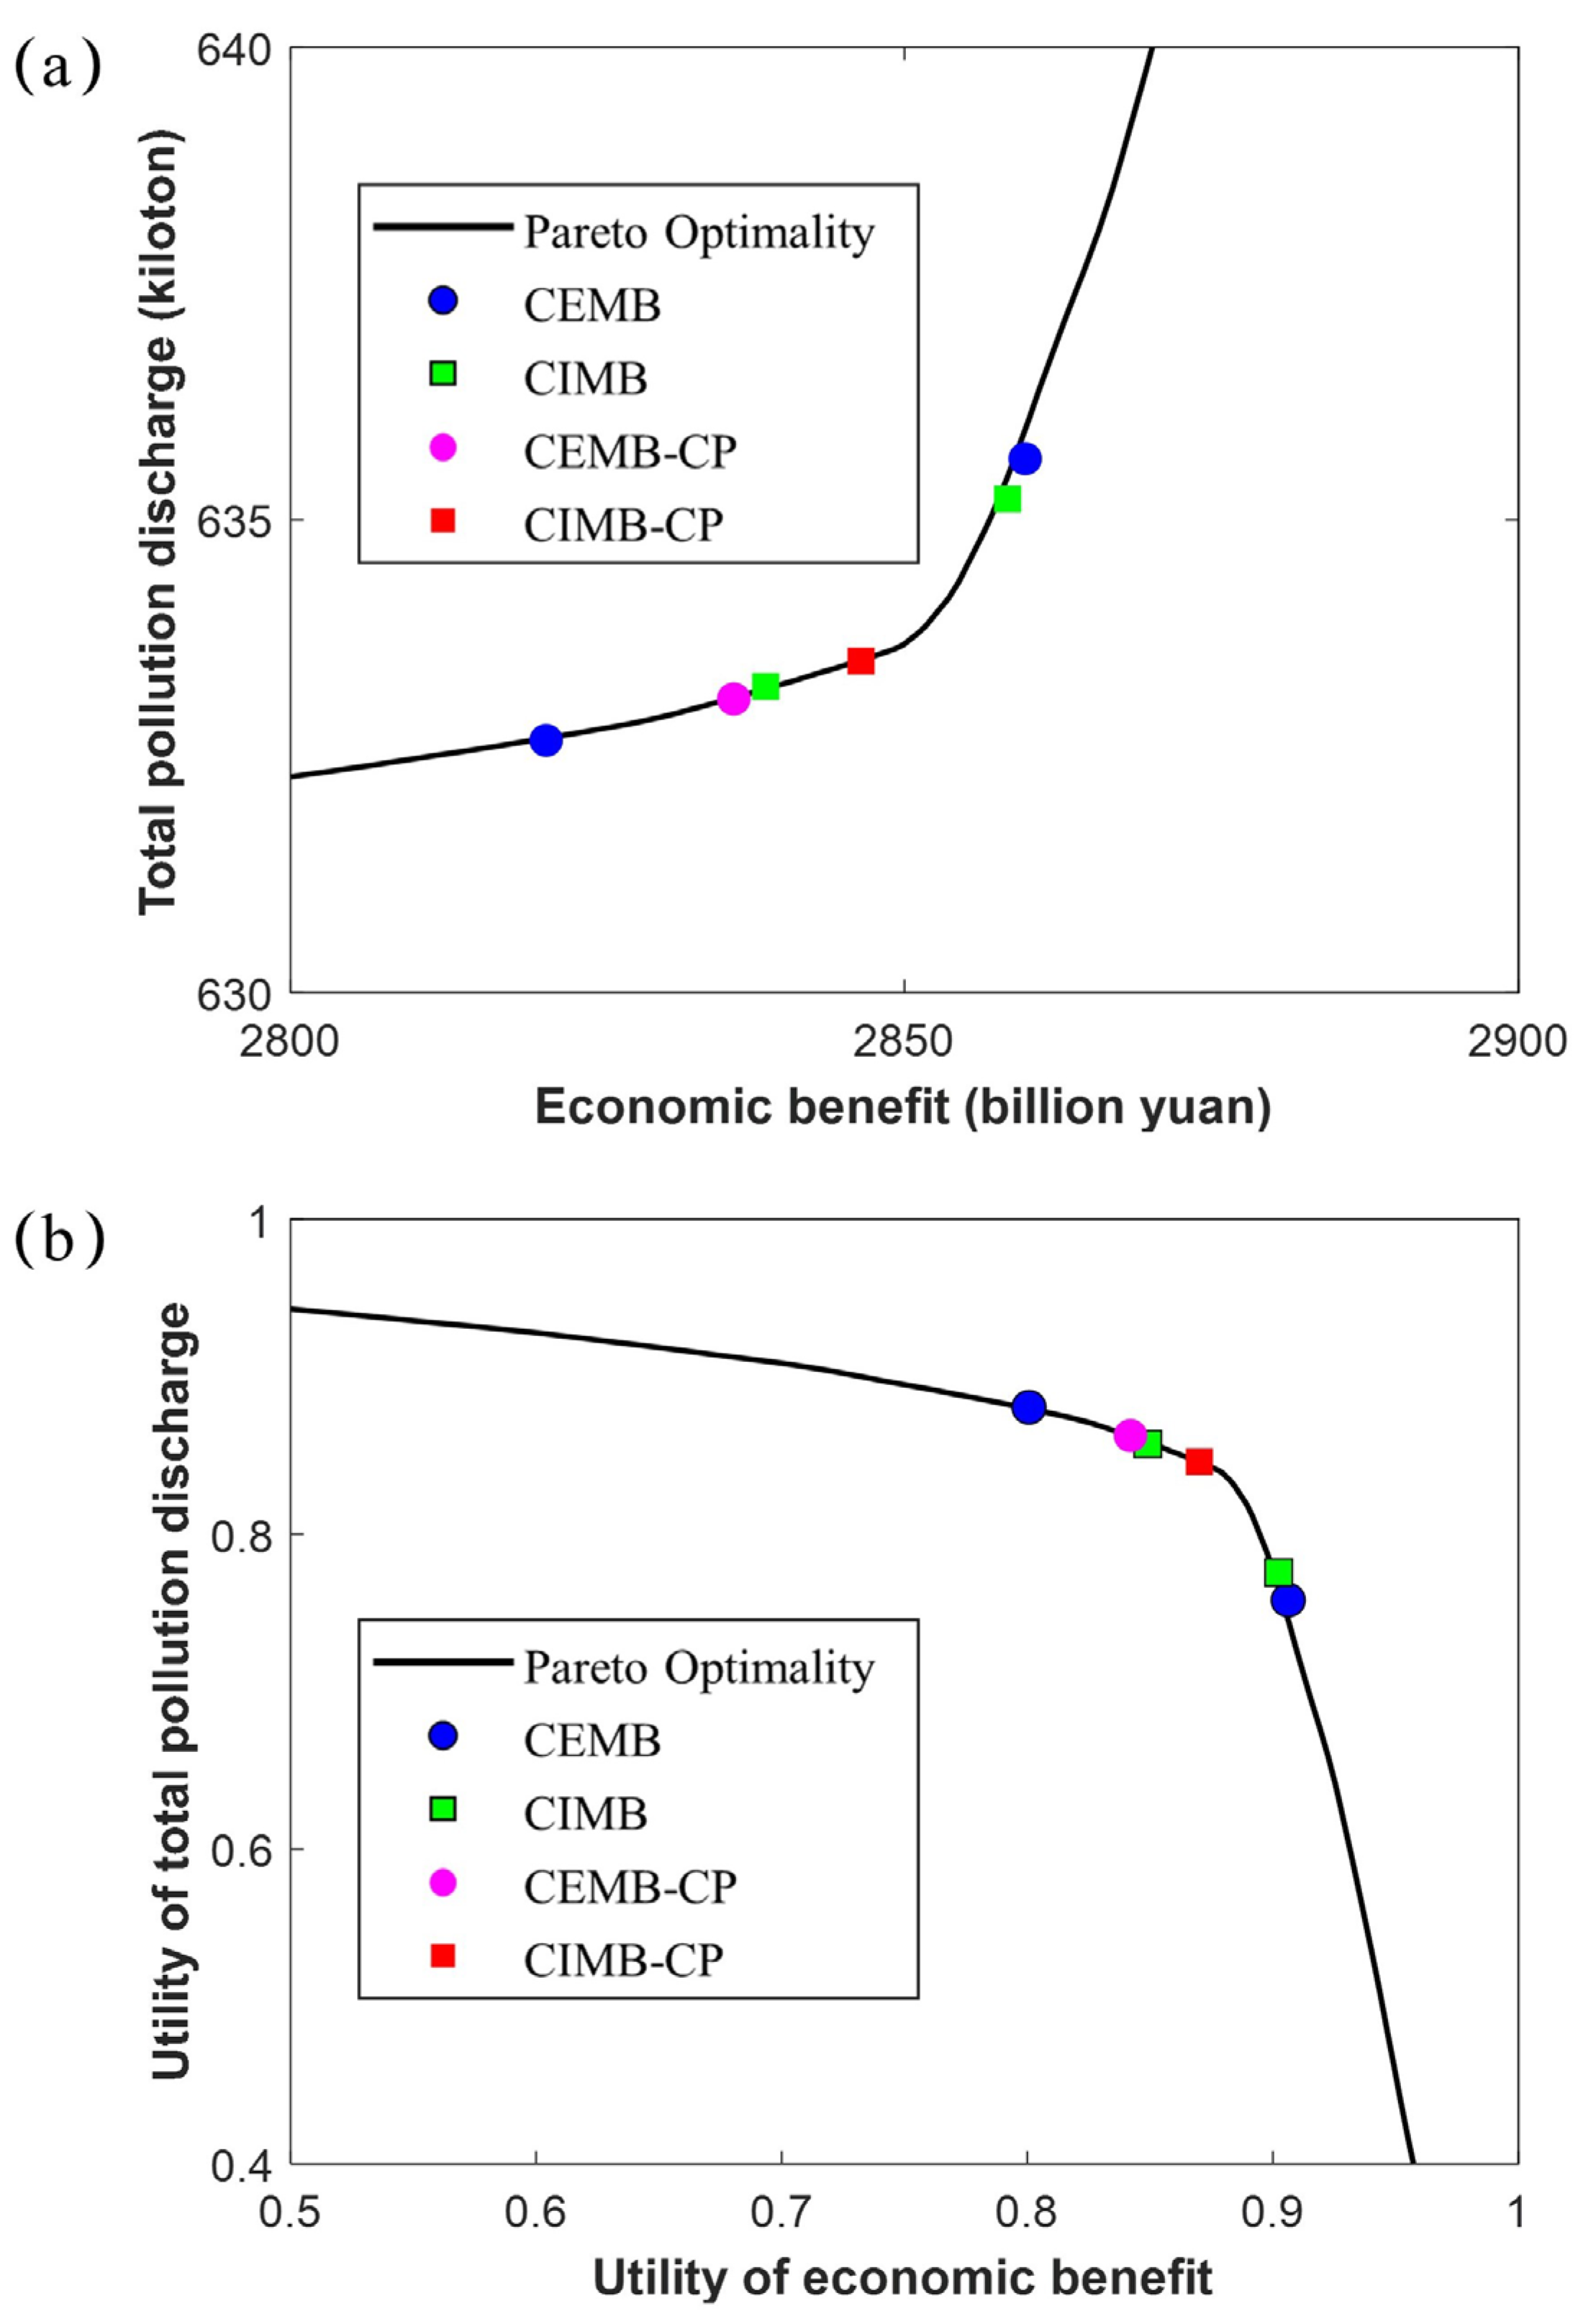
This study derives the Nash equilibrium solution and compromise programming solution for both players through the calculation of the CIMB-CP model. To facilitate comparative analysis, we employed the methodology proposed by lee [14] to solve the Cost-Exclusive Multi-Objective Bargaining Methodology (CEMB) model and further applied compromise programming techniques for computational purposes. To quantitatively assess the differences between the two approaches, we plotted the results on a Pareto curve generated using the NSGA-II algorithm, thereby providing a visual representation of the decision discrepancies under the two methods. The outcomes for the Economic benefit and Pollution discharge in the middle and lower reaches of the Han River, obtained by different methods, are depicted in Figure 4. In the CIMB-CP model, the discount factor for Player 1 and Player 2 are both set at 2, with the maximum number of bargaining rounds limited to 20.
By solving for the two players individually, we obtained the optimal solutions under single-objective conditions. We then substituted these solutions into the objective function of the other player to determine the bargaining ranges for both players. The results showed that Player 1’s bargaining range was (2525.0, 2894.7) billion yuan, and Player 2’s bargaining range was (629.77, 654.44) kiloton. The results calculated by the two methods are shown in Figure 4(a). The Nash equilibrium solution obtained by CIMB were (2859.82 billion yuan, 635.64 kiloton) and (2820.81 billion yuan, 632.67 kiloton). Correspondingly, the equilibrium solution obtained by CEMB were (2858.40 billion yuan, 635.22 kiloton) and (2838.70 billion yuan, 633.24 kiloton). It is evident that the Nash equilibrium solution obtained through the Multi-Objective Bargaining Methodology (MOBM) significantly condensed the initial bargaining range. Moreover, compared to CEMB, the inclusion of negotiation cost further reduced the range of the Nash equilibrium solution in CIMB, indicating that the CIMB model holds greater practical value in real-world applications.
The distinct ranges of Nash equilibrium solution derived from the CIMB and CEMB methodologies inherently engender deviations in the final decision solution obtained through compromise programming. Specifically, the final decision solution for CEMB corresponds to an economic benefit of 2836.09 billion yuan, contrasted with the 2842.46 billion yuan associated with the final decision solution for CIMB. Concurrently, the pollution discharge magnitudes for these methods were 633.11 thousand tons and 633.35 thousand tons, respectively. Despite the marginal economic benefit enhancement when considering negotiation cost, this adjustment also resulted in a slight uptick in pollution discharge. By applying the max-min method, we calculated the utility point corresponding to the final decision solutions of the CEMB-CP and CIMB-CP method, yielding (0.8415, 0.8646) and (0.8587, 0.8549), respectively. Our analysis revealed that within the CIMB-CP model, the utility points for both players were more proximate, signifying that the negotiation process rendered the utilities more equilibrated. By integrating negotiation cost, decision-makers can more effectively discern and leverage interdependent interests, thereby fostering cooperative and coordinated strategies.

4.2. Water Resources Allocation

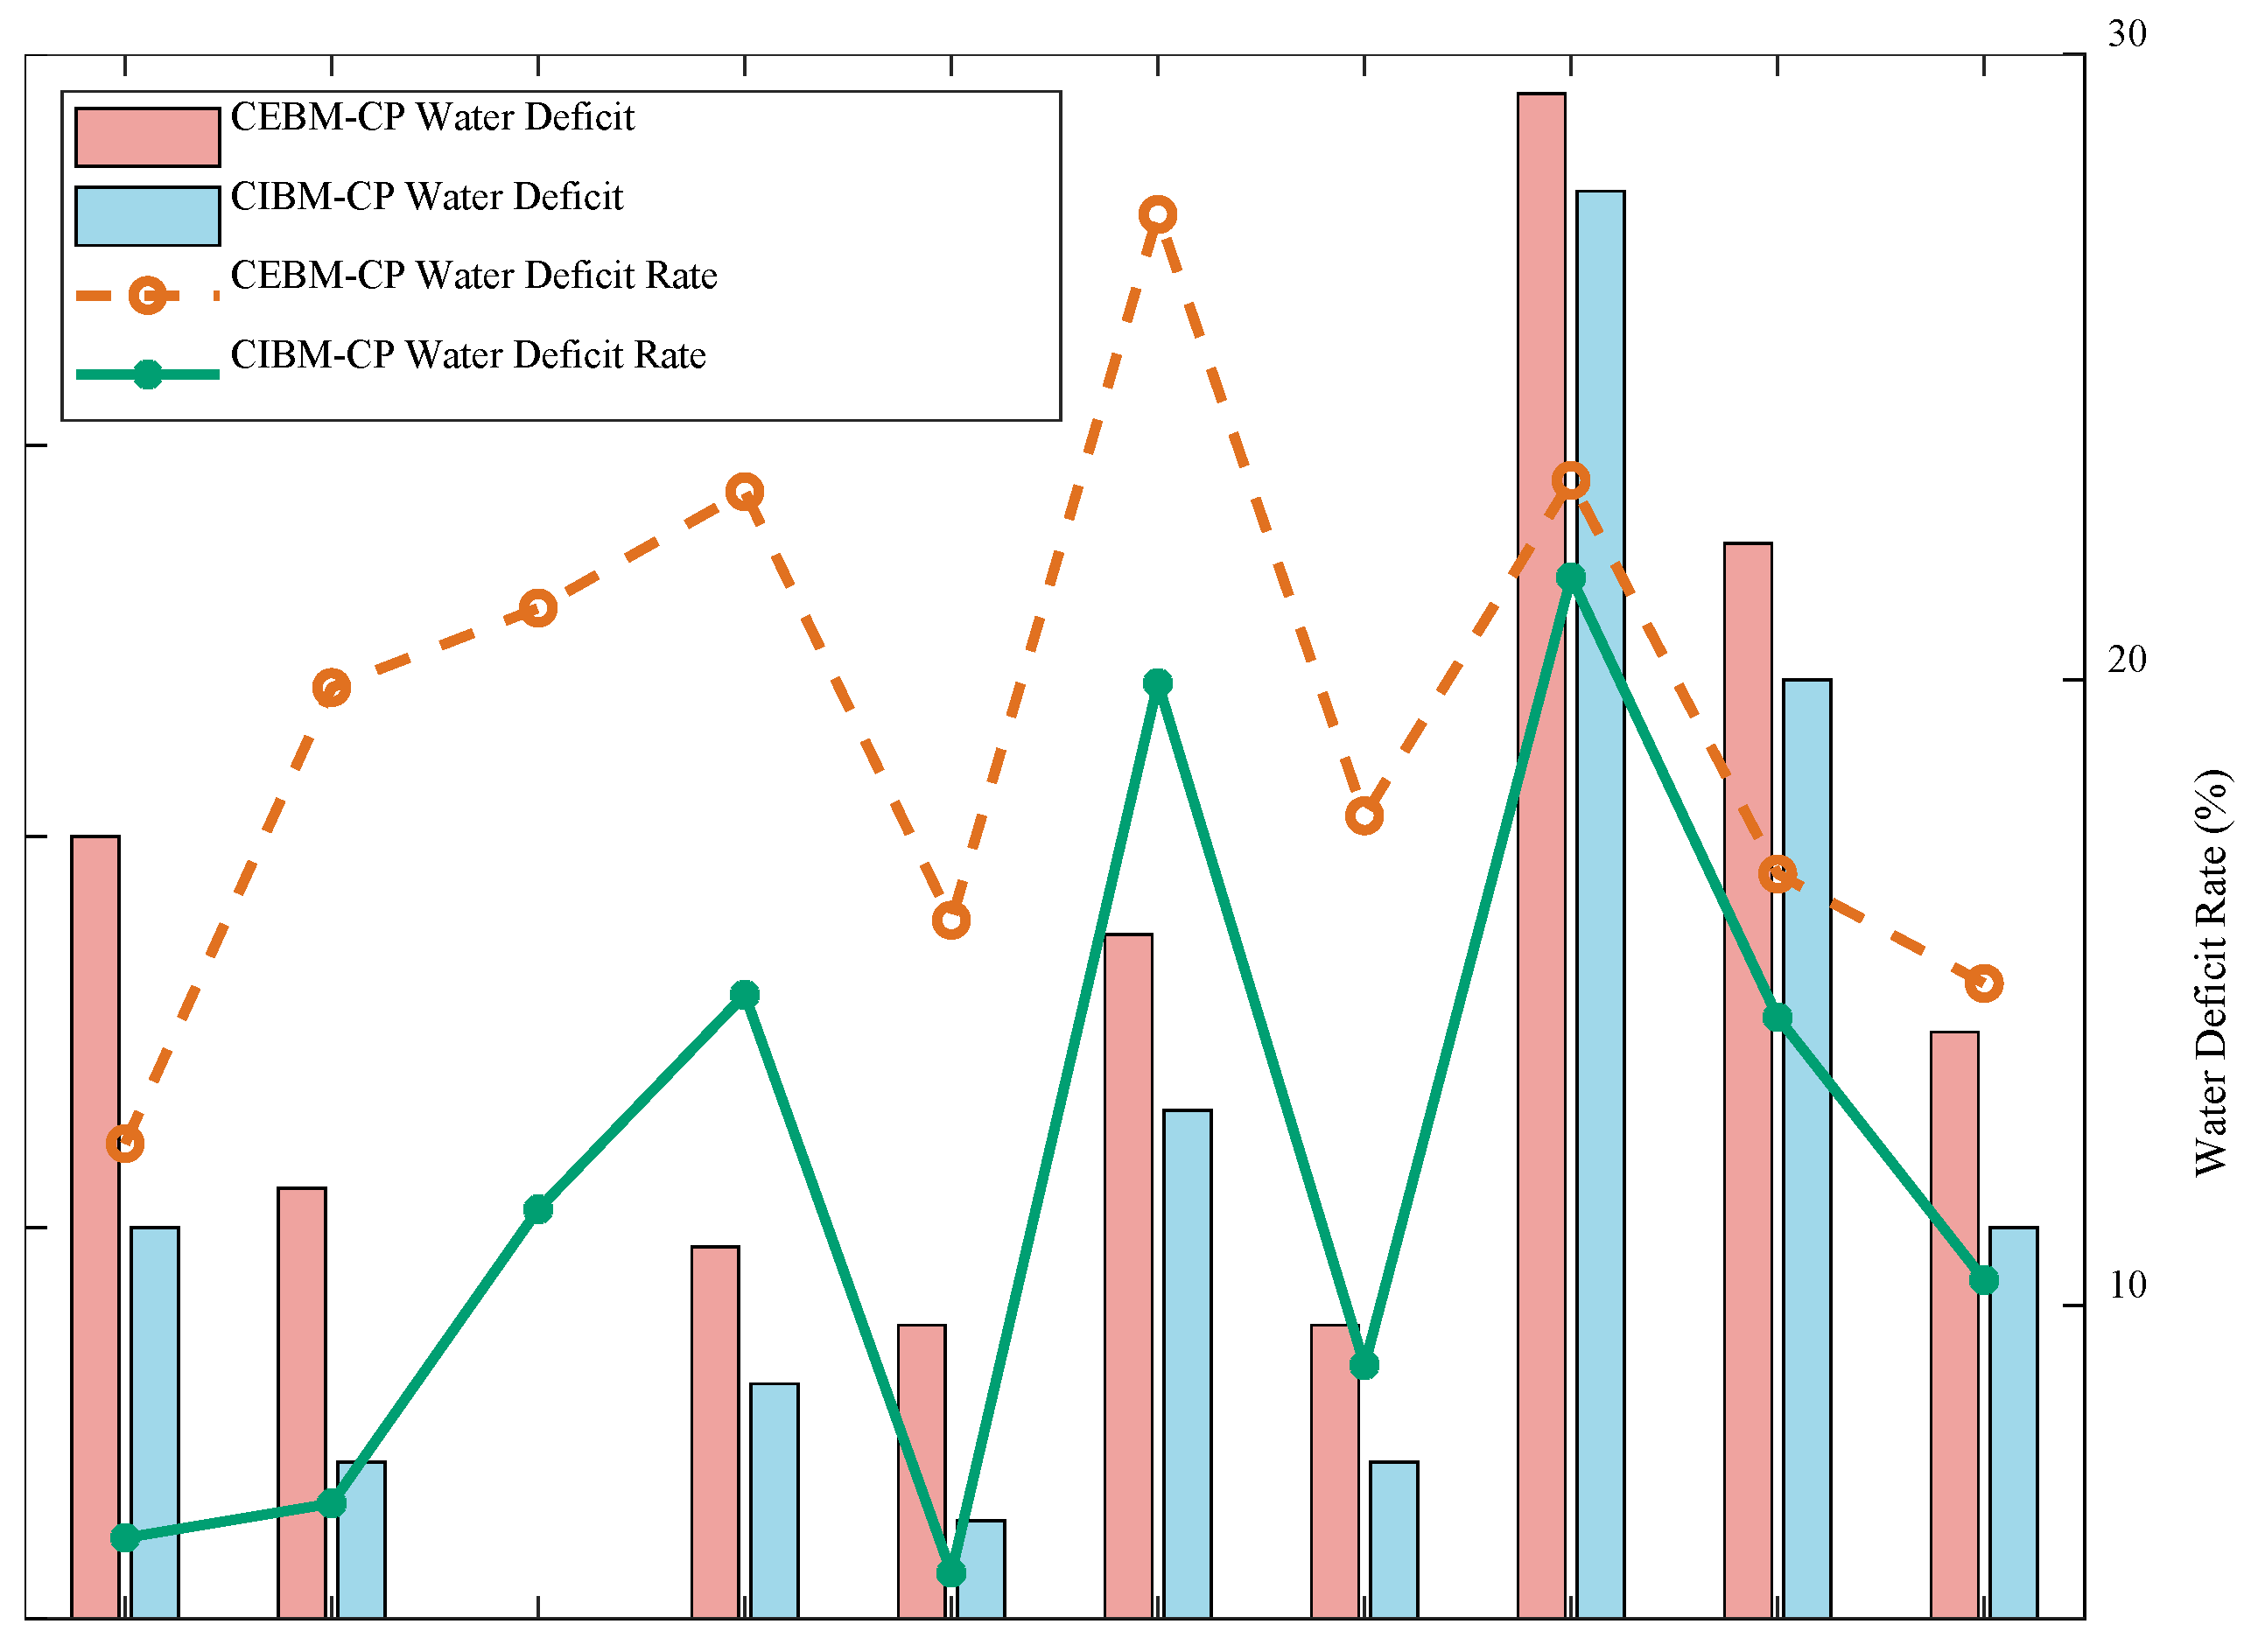
In the statistical calculation of water resource allocation in the middle and lower reaches of the Han River basin, we employed two models, CEMB-CP and CIMB-CP, yielding respective water resource allocation quantities of 13.67 billion cubic meters and 14.55 billion cubic meters. To gain a deeper understanding of the water resource allocation under these two models for each city, we conducted a detailed analysis of the water shortage volume and shortage ratio for each city and visualized the results in Figure 5.
From the data in Figure 5, it is evident that the results derived from the CEMB-CP model generally exhibit higher water shortages in both volume and ratio compared to the CIMB-CP model. Specifically, the CEMB-CP model indicates that Xiangyang has the highest water shortage volume at 0.78 billion cubic meters, followed by Xiaogan at 0.55 billion cubic meters. In stark contrast, Shennongjia shows the lowest water shortage volume at only 0.003 billion cubic meters. The results from the CIMB-CP model also exhibit a similar trend, with Xiangyang recording a water shortage volume of 0.73 billion cubic meters, followed closely by Xiaogan at 0.48 billion cubic meters. Shennongjia continues to exhibit the lowest water shortage volume at 0.002 billion cubic meters. In terms of water shortage ratio, the CEMB-CP model points out that Wuhan has the highest water shortage ratio at 27.44%, followed by Xiangyang at 23.19%. Although Jingmen has the lowest water shortage ratio, it still stands at a considerable 12.59%. The results from the CIMB-CP model differ slightly, with the highest water shortage ratio occurring in Xiangyang at 21.64%, while Wuhan's water shortage ratio is 19.95%. Again, Jingmen maintains the lowest water shortage ratio at 6.29%.
In summary, whether from the perspective of water resource shortage volume or ratio, Xiangyang and Xiaogan face relatively greater water resource pressure, while Shennongjia and Jingmen perform relatively better in these two indicators. These analyses provide crucial reference data for understanding the allocation and management of water resources in the middle and lower reaches of the Han River basin, laying a foundation for future water resource planning and policy formulation.
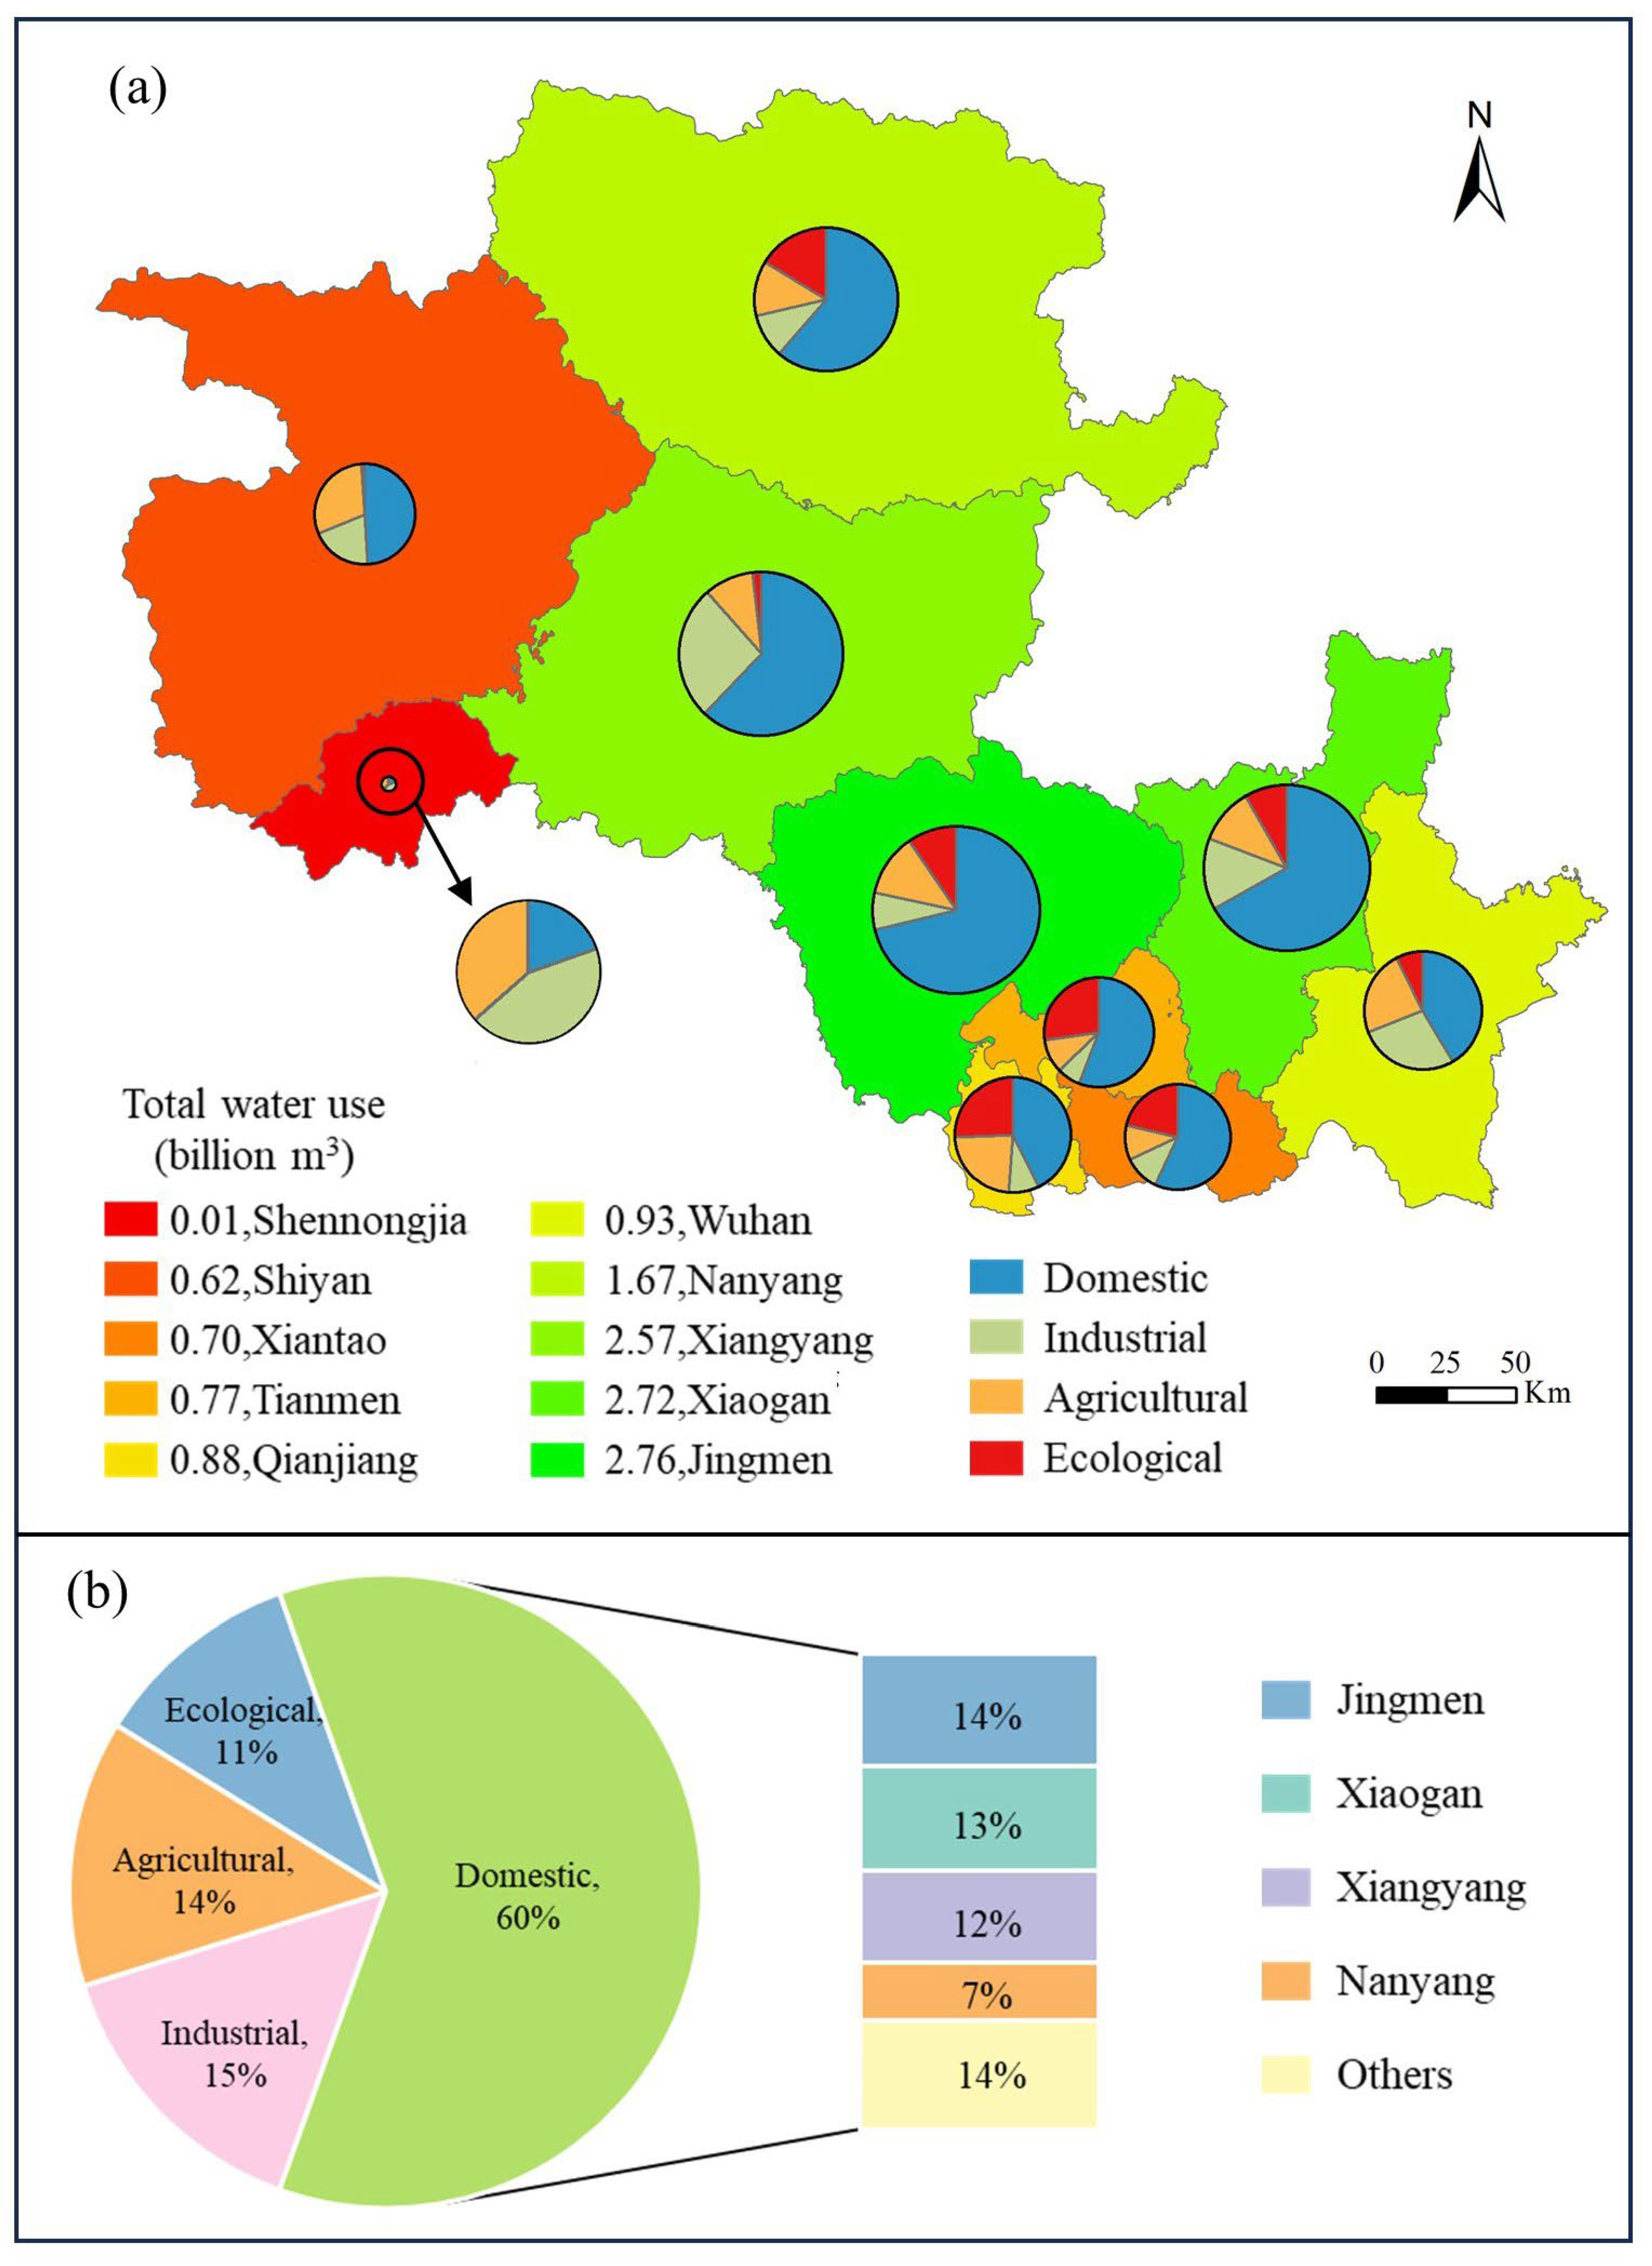
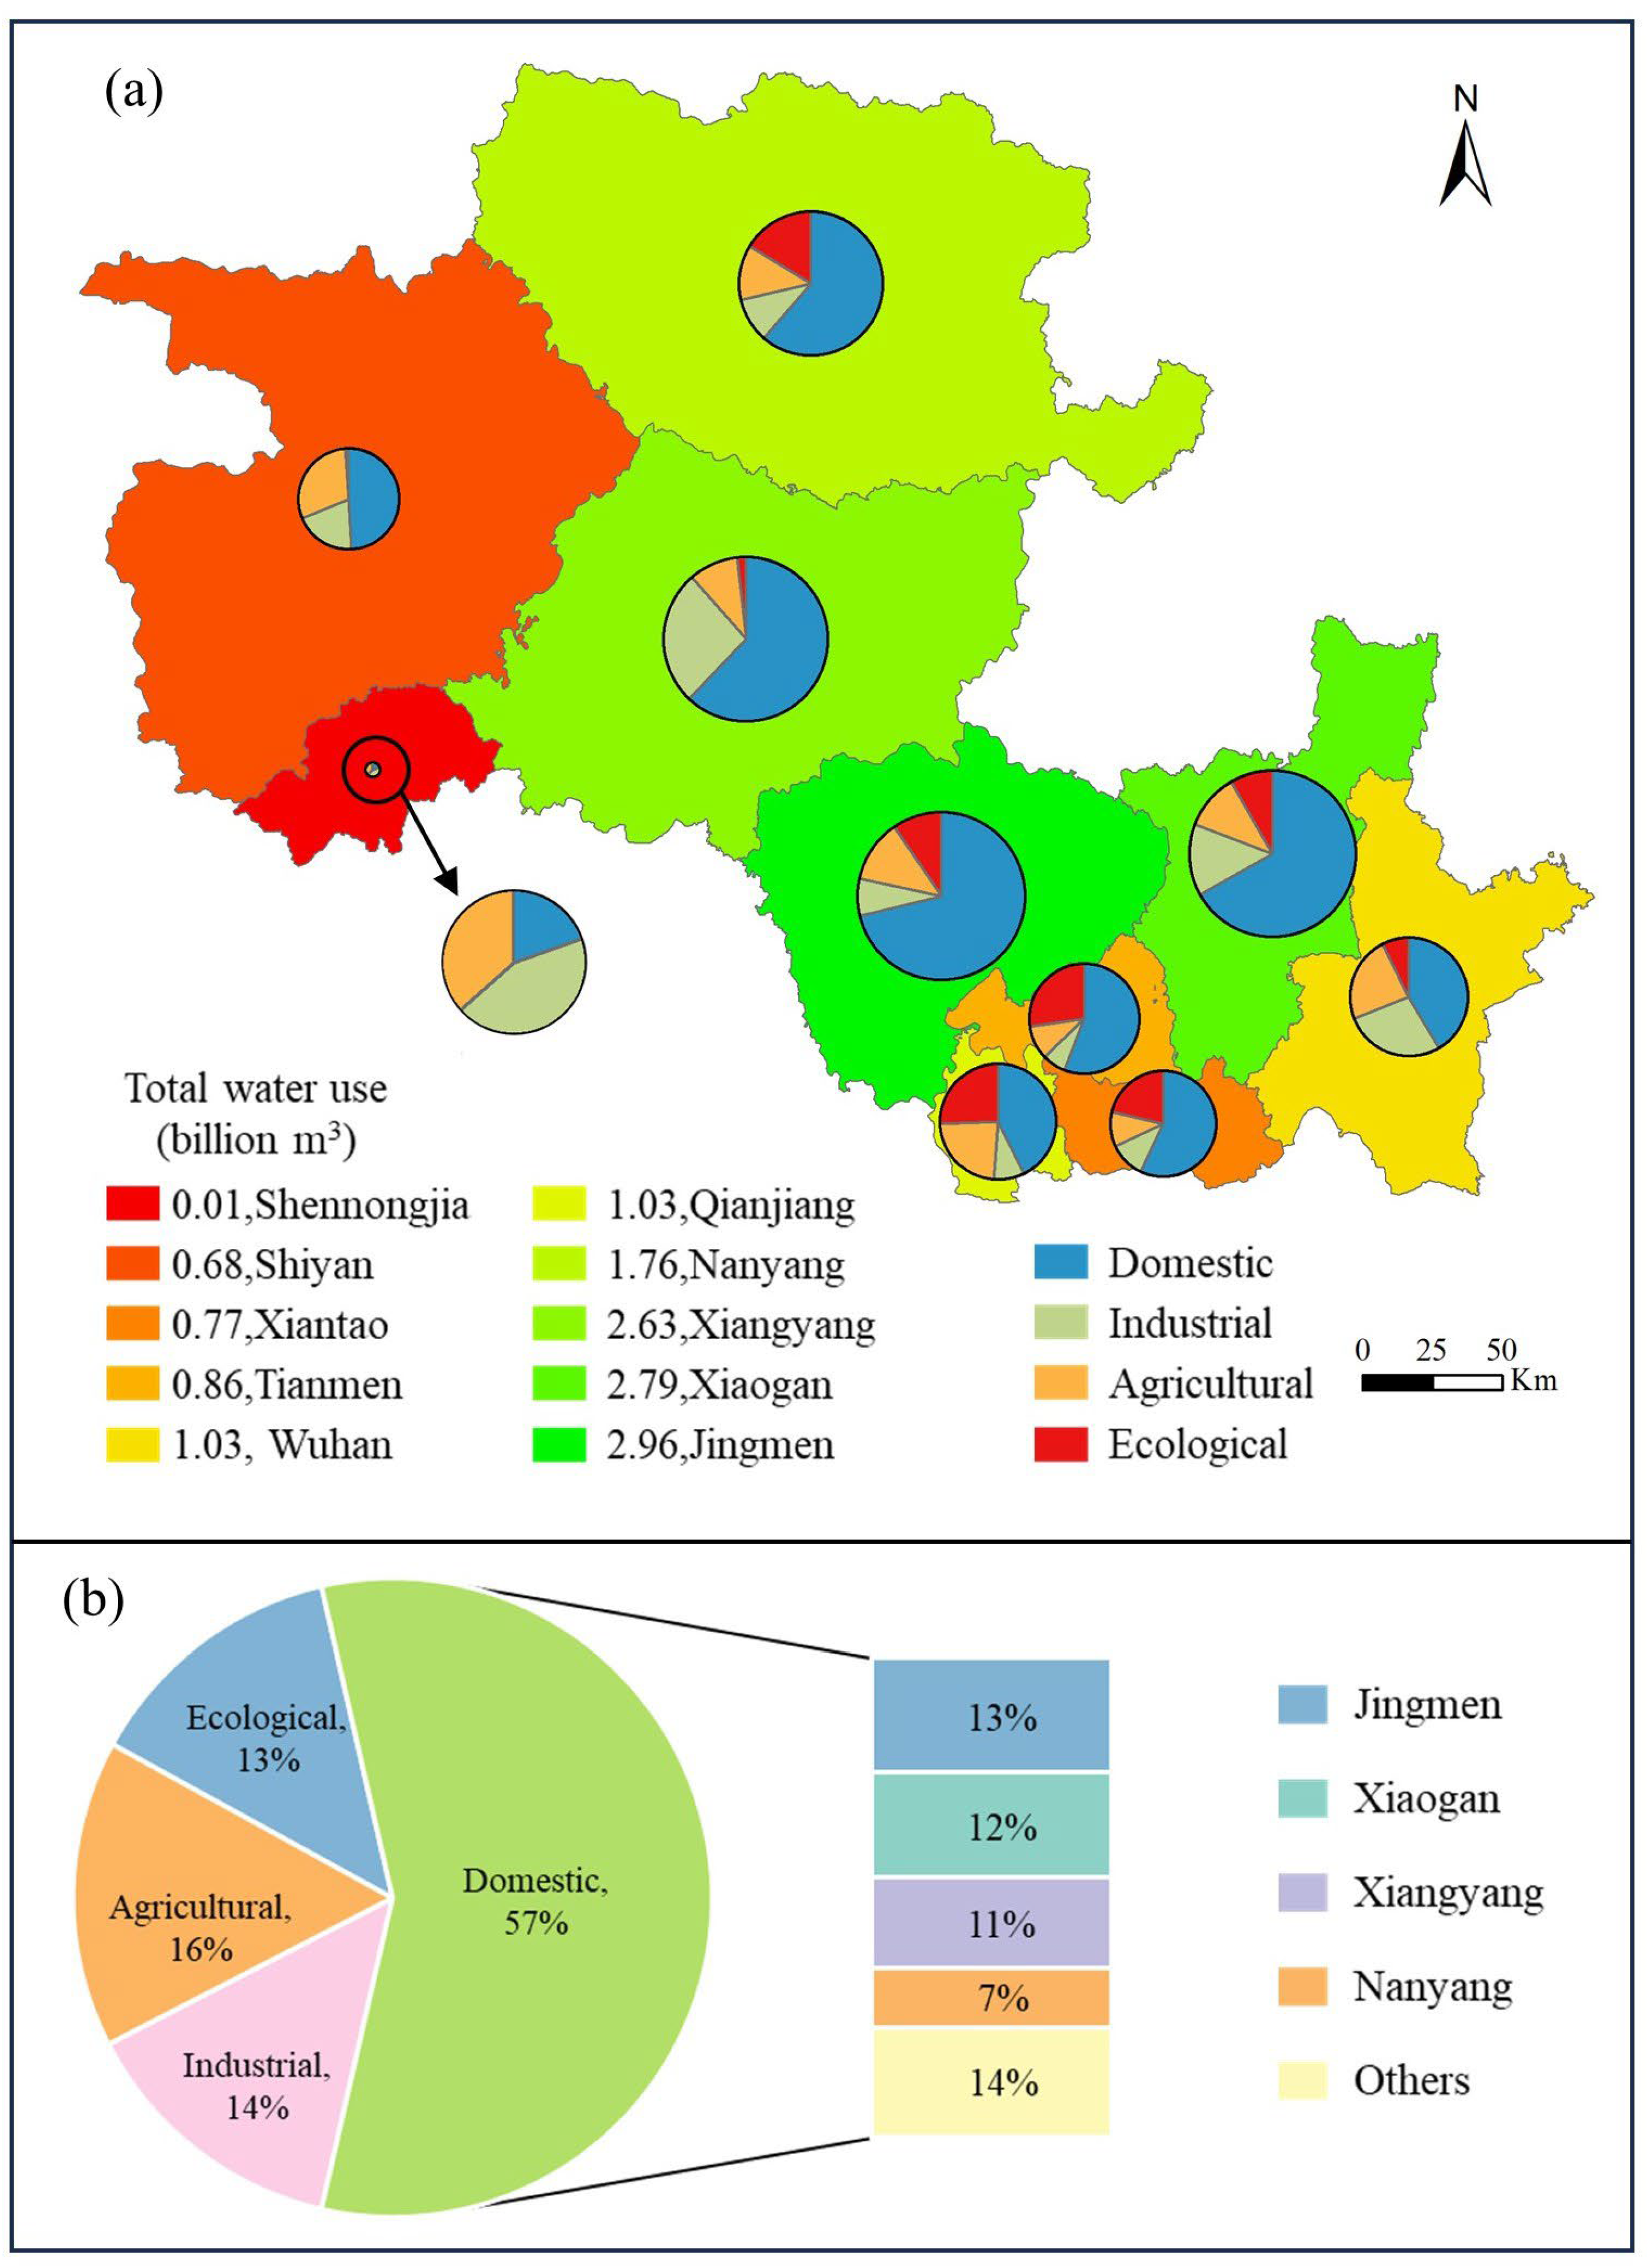
Based on the CEMB-CP and CIMB-CP models, we obtained the water allocation results for four water-use sectors (domestic, industrial, agricultural, and ecological) across various cities in the middle and lower reaches of the Han River. The specific data are presented in Figure 6 and Figure 7. Figures 6(a) and 7(a) illustrate the total water consumption and the proportion of each water-use sector in each city according to both models. It can be observed that Shennongjia has the smallest total allocated water amount, with both models providing a result of 0.01 billion cubic meters, while Jingmen has the largest total allocation, with values of 2.76 billion cubic meters and 2.96 billion cubic meters respectively. Overall, the order of total water resources distribution obtained from the two models is largely consistent, with the only exceptions being the adjusted order for Qianjiang and Wuhan between the two models.
It is evident from the figure that the domestic sector consistently accounts for the majority of total water usage across most cities, reflecting a high demand for water resources in daily urban life. However, cities like Qianjiang and Shennongjia exhibit relatively lower domestic water allocation proportions, which may be attributed to local water resource management strategies or residents' water usage habits.
In contrast to the domestic sector, the industrial sector's water allocation proportion is markedly lower. Cities such as Jingmen, Qianjiang, Tianmen, Xiantao, Xiaogan, and Nanyang have industrial water usage ratios below 15%, indicating that the industrial development in these regions has not yet reached a high water-consuming stage or that water-saving measures have been implemented. Only a few cities have a higher industrial water allocation proportion, such as Shennongjia, where the industrial sector's water allocation accounts for 43.90% and 39.13% under the CEMB-CP and CIMB-CP models, respectively.
The water allocation for the agricultural sector varies significantly across different cities. For example, Shennongjia and Shiyan have agricultural water usage ratios exceeding 30%, highlighting the agricultural sector's significant role locally. In other cities, the agricultural water usage proportion generally falls between 10% and 15%, indicating differing impacts of agricultural development across regions.
The ecological sector's water allocation proportion exhibits the most significant fluctuations among cities. For instance, Qianjiang, Tianmen, Xiangyang, and Nanyang have ecological water allocation ratios exceeding 11%. Among these, Tianmen has the highest ecological water usage, accounting for 27.34% and 32.43% under the CEMB-CP and CIMB-CP models, respectively. In contrast, cities like Shennongjia, Shiyan, and Xiangyang have ecological water allocation ratios below 5%.
In summary, the disparities in water resource allocation across different cities reflect varying economic structures, development stages, and environmental protection awareness. Effective water resource management is crucial not only for sustainable urban development but also for environmental protection. Policymakers should therefore pay attention to the differences in water usage proportions across sectors and implement scientific planning and distribution to enhance water resource utilization efficiency, thereby promoting coordinated economic and ecological development.
Based on the statistical results shown in Figure 6(b) and Figure 7(b), a comparison of water allocation between the CEMB-CP and CIMB-CP models across four sectors—domestic, industrial, agricultural, and ecological—reveals that domestic water usage constitutes the largest proportion in both models, accounting for 60% and 57%, respectively. Specifically, in the CEMB-CP model, the proportions for industrial, agricultural, and ecological water usage are 15%, 14%, and 11%, respectively. In contrast, under the CIMB-CP model, these proportions are 14%, 16%, and 13%, respectively. Although the allocation ratios for domestic and industrial water usage differ slightly between the two models, the total water allocation difference is minimal because the CIMB-CP model allocates a higher total volume of water. The additional water resources in the CIMB-CP model are primarily directed towards agricultural and ecological sectors.
The trend of water allocation in the domestic sector across cities remains consistent between the two models. Specifically, in the CIMB-CP model, the domestic water usage proportions for Jingmen, Xiaogan, Xiangyang, and Nanyang are 13%, 12%, 11%, and 7%, respectively, with the combined total for these four cities being 43%. The combined proportion for the remaining cities is 14%, leading to a total domestic water usage of 57%. In the CEMB-CP model, these figures are adjusted upwards, with Jingmen, Xiaogan, Xiangyang, and Nanyang having domestic water usage proportions of 14%, 13%, 12%, and 7%, respectively, amounting to a combined total of 46%. Although the combined proportion for the remaining cities remains at 14%, the overall total increases to 60%. These results indicate that the water distribution trend across major cities remains relatively stable between the two models. Despite slight variations in specific proportions due to differing total water resources, both models exhibit similar prioritization in domestic water allocation across key cities.

4.3. Sensitivity Analysis

In the context of actual negotiations, each participant may adopt different attitudes toward market risk, which can be classified into conservative and aggressive categories. A participant's risk attitude during negotiations influences their perception of risk and reward, expectations of negotiation outcomes, and their willingness to reach an agreement. For instance, conservative participants tend to take cautious actions, preferring stability and conservative results, while aggressive participants are more inclined to assume risks in pursuit of greater benefits and returns.
In the CIMB model, we introduce a discount factor to reflect negotiation cost. Additionally, negotiation cost encompass the maximum bargaining rounds (tmax) and a modulation coefficient (k). As the number of negotiation rounds approaches or reaches tmax, participants experience increased pressure to reach an agreement promptly, avoiding the cost escalation associated with protracted negotiations. The modulation coefficient k is employed to adjust the rate of change in negotiation cost. By manipulating the value of k, we can explore how varying risk attitudes influence the choice of negotiation strategies and decision-making processes. Considering the diverse negotiating environments that participants may face, analyzing the variations in k can reveal the sensitivity of negotiation cost, which is crucial for optimizing negotiation strategies. Consequently, this study establishes five combinations of k values for two players, simulating negotiation scenarios under various risk attitude backgrounds, as detailed in Table 1.
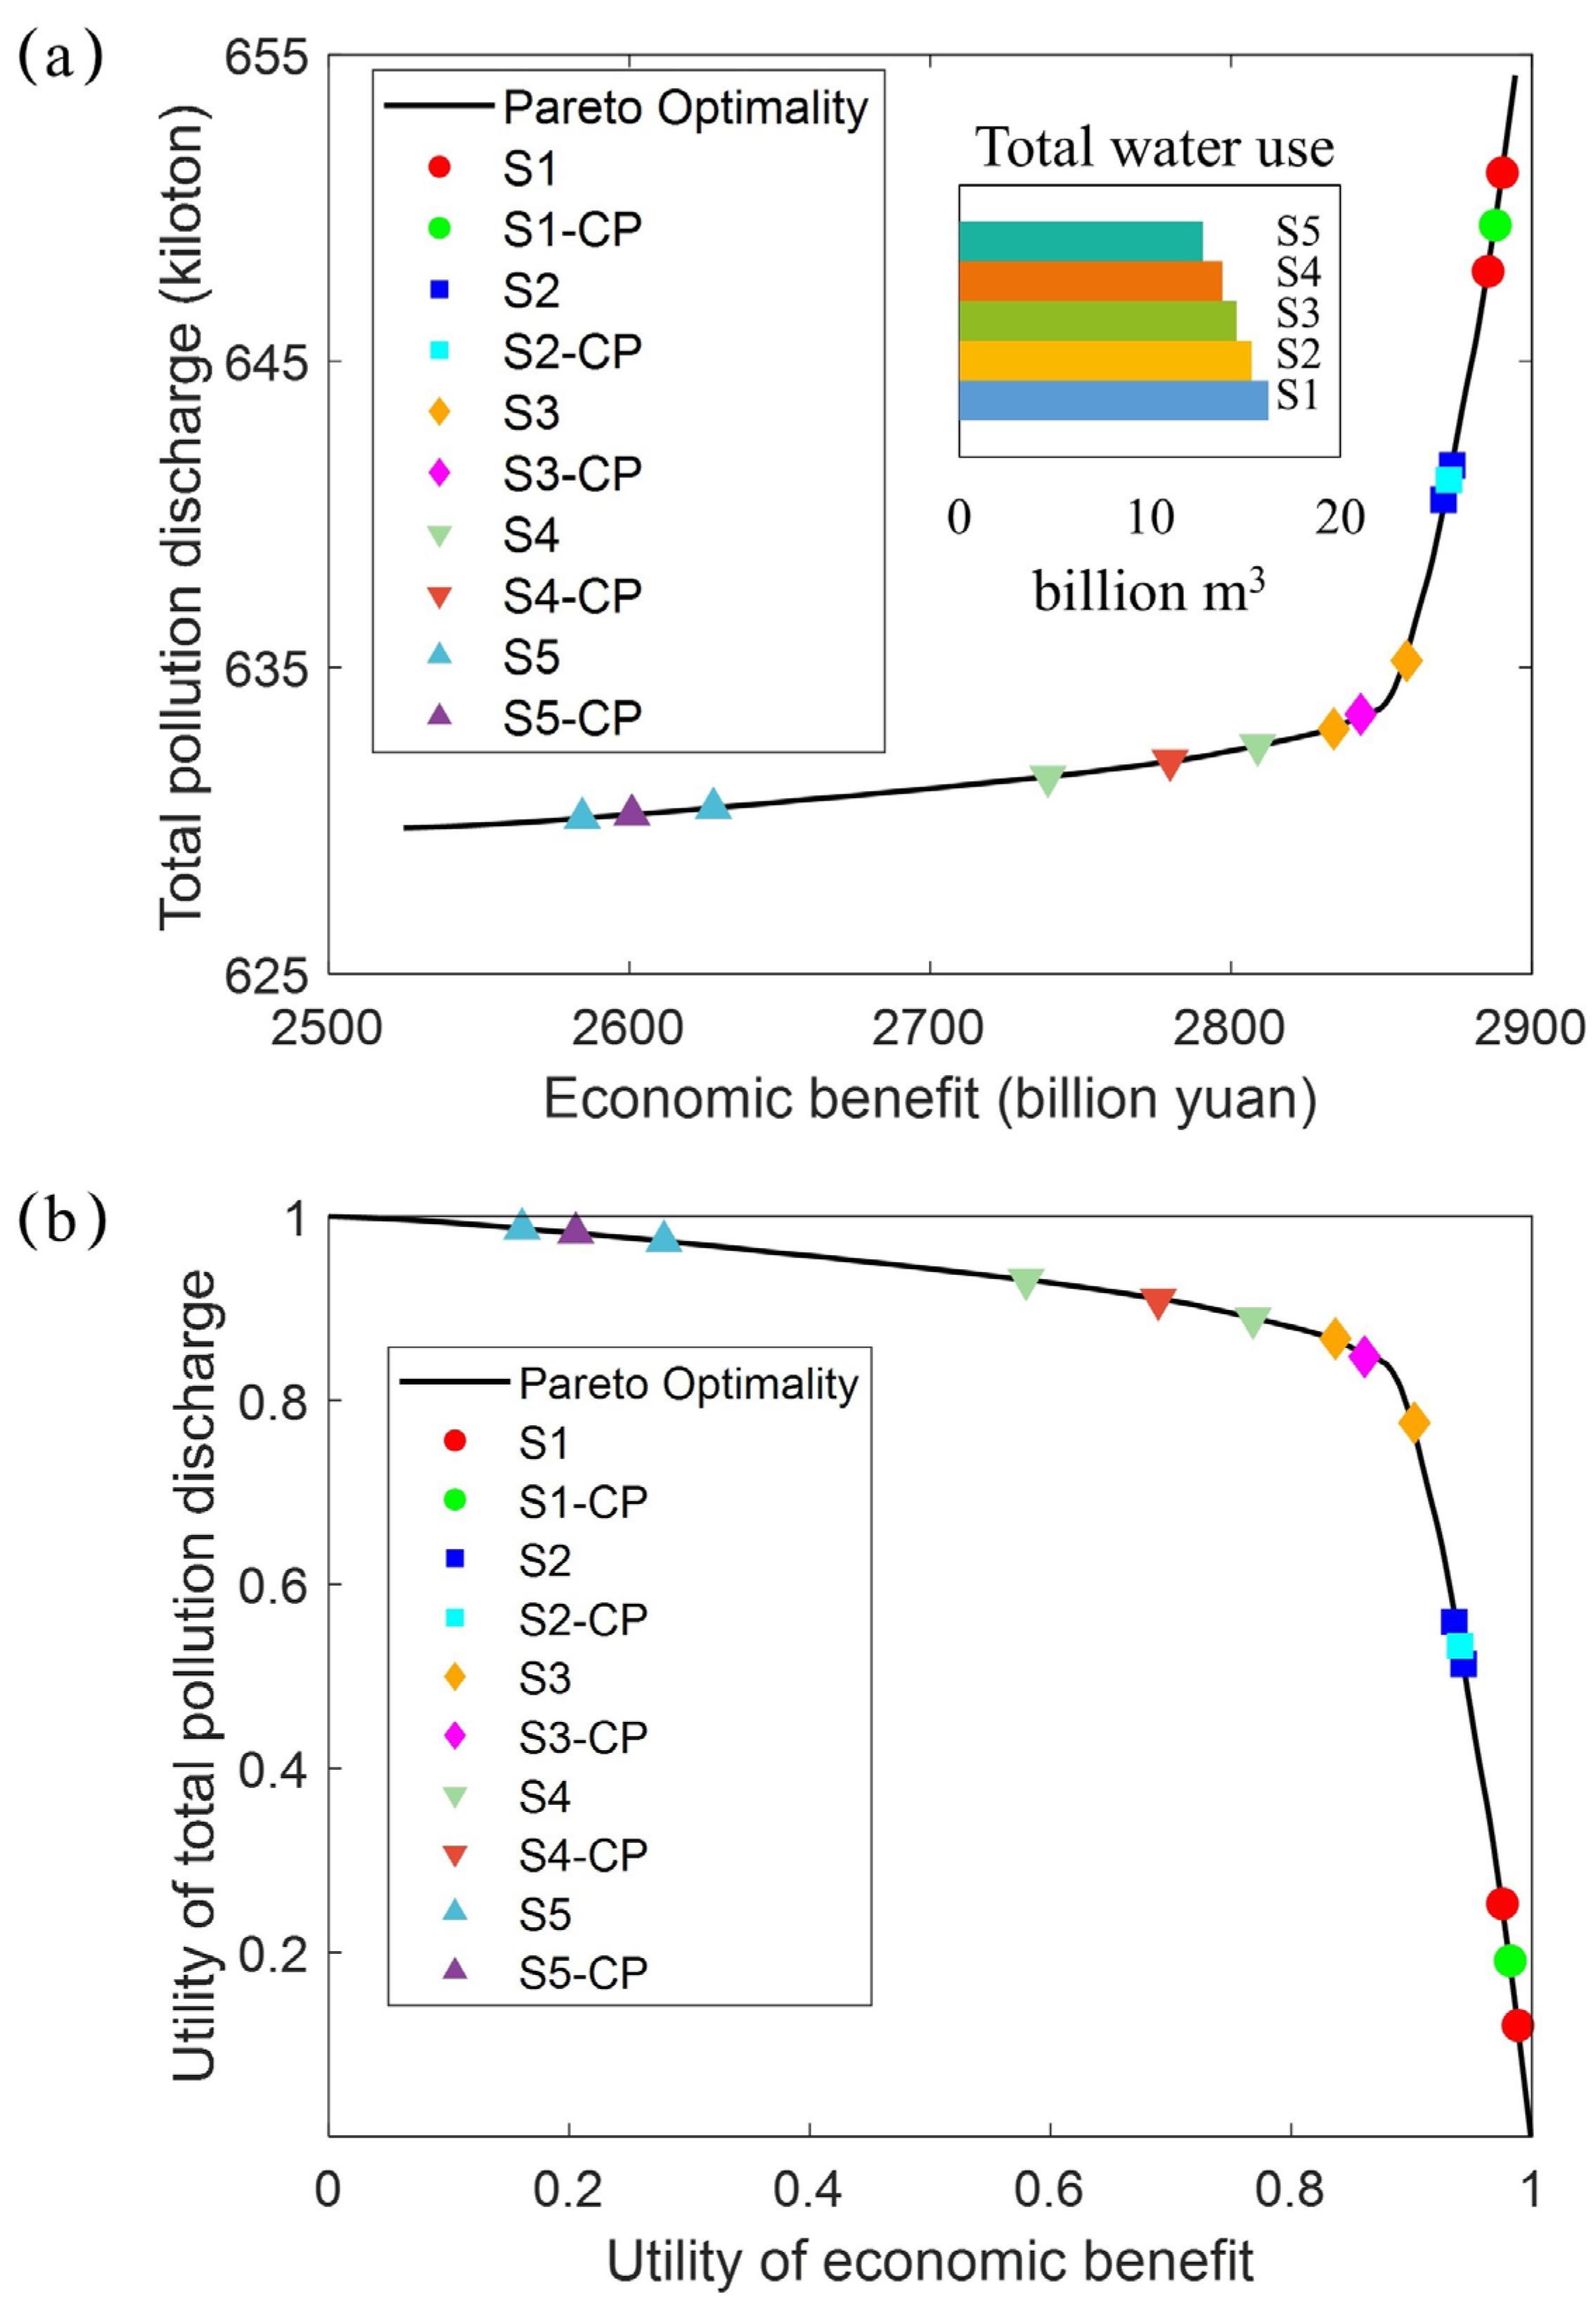
In various combination scenarios, the solutions of the CIMB model and the final decision outcomes of CIMB-CP are illustrated in Figure 8. As the value of KB in the combination increases, the final decision reflects a rise in economic benefits alongside an increase in pollution emissions. This indicates that under higher KB values, Player 1's interests are better safeguarded and enhanced, with their financial gains significantly improved. However, this scenario is evidently disadvantageous for Player 2, as the higher pollution emissions lead to increased environmental costs and potential risks. Conversely, when the value of KE in the combination rises, the final decision shows a decrease in pollution emissions and a corresponding drop in economic benefits. This suggests that under higher KE values, Player 2's environmental interests are given more attention and protection, as the reduction in pollution emissions directly lessens their environmental burden. Nevertheless, this scenario adversely affects Player 1, as their economic gains are suppressed.
Furthermore, an analysis of total water usage data across different combination scenarios (S1 to S5) reveals a gradual decline in water allocation, from 16.22 billion cubic meters in S1 to 12.77 billion cubic meters in S5, a decrease of 21.3%. This is because allocating more water resources leads to greater benefits but also results in higher pollution emissions.
The utility results calculated using the max-min approach are shown in Figure 8(b). Regardless of which player holds a stronger position, they cannot achieve a satisfactory compromise solution. For instance, in scenarios S1 and S5, utility points of (0.9820, 0.1910) and (0.2054, 0.9822) are provided for Player 1 and Player 2, respectively. The distribution of these utility points shows extreme deviation, indicating that such decision solutions are unlikely to emerge in normal decision-making processes and are typically not adopted in negotiations. In scenario S1, Player 1's utility value is near maximization (0.9820), but Player 2's value is extremely low (0.1910), demonstrating Player 1's significant advantage, while Player 2 benefits little from the negotiation. Conversely, in scenario S5, Player 2's utility value is near maximization (0.9822), while Player 1's value is very low (0.2054), presenting an opposite extreme effect to that of scenario S1.
In contrast to these extreme scenarios, when KB and KE values are comparable and both players maintain equal standing, their utility points are more balanced. For example, in scenario S3, the utility point is (0.8610, 0.8415), indicating that the players can achieve fairly equal utility values and thus a fair and balanced decision solution. Such decisions are generally more acceptable to both parties as they avoid one-sided excessive benefits.
During negotiation and decision-making, both players must consider not only their economic gains but also weigh the costs associated with environmental protection. The different combinations of KB and KE directly affect the balance between economic and environmental benefits for both parties. While Player 1 may pursue greater economic benefits, they might overlook the exacerbation of environmental impacts, making a rigid choice between gains and long-term environmental damage. Player 2, on the other hand, focuses more on reducing pollution emissions but faces sacrifices in economic benefits. Understanding and analyzing the impact of KB and KE in various combination scenarios is crucial for effective negotiation and decision-making. To achieve a more balanced and sustainable outcome, it is recommended that both parties engage in thorough communication and consultation when setting KB and KE values, aiming for a more reasonable balance between economic benefits and environmental protection. This would not only contribute to a healthier ecological environment but also ensure the consideration and maximization of both parties' economic interests.
5. Conclusions

This study constructs a Nash bargaining game model that incorporates negotiation cost and conducts empirical analysis using the Han River middle and lower reaches as a case study, arriving at the following conclusions:
Impact of Negotiation Cost on Nash Equilibrium Solution: By incorporating negotiation cost into the Nash bargaining game model, the range of Nash equilibrium solutions is expanded, allowing decision-makers to more comprehensively consider the interests and constraints of all parties involved, thereby obtaining more rational decision-making schemes. In the empirical analysis of the Han River middle and lower reaches, we found that after considering negotiation cost, both the economic benefits and the pollution emissions of the Nash equilibrium solution decreased, but the gap between them also narrowed, indicating that negotiation cost play a regulatory role in the outcome of the game.
Optimization of Water Resource Allocation: By optimizing the allocation of water resources in the Han River middle and lower reaches, it is found that there are differences in the proportion of water resource allocation among different cities, reflecting the economic structure, development stages, and environmental awareness of different regions. For example, Jingmen and Xiaogan have higher water resource allocations, while Shennongjia has a lower allocation, which is closely related to the economic development levels and water resource needs of each region. Therefore, when formulating water resource management policies, it is necessary to fully consider the actual conditions of each region, implement scientific planning, improve water resource utilization efficiency, and promote the coordinated development of the economy, society, and the ecological environment.
Impact of Risk Attitudes on CIMB-CP: The risk attitudes of participants significantly influence negotiation outcomes. Conservative participants tend to pursue stable and conservative results, while aggressive participants are more willing to take risks for greater returns. In the empirical analysis of the Han River middle and lower reaches, we found that when participants have a higher risk preference coefficient, economic benefits increase but so do pollution emissions; conversely, when the risk preference coefficient is lower, pollution emissions decrease but economic benefits also decline. Therefore, during the negotiation process, participants need to fully consider their own risk preferences and develop corresponding negotiation strategies to maximize their own interests.
Application Value of the Model: The Nash bargaining game model constructed in this study, which considers negotiation cost, can provide theoretical support and practical guidance for water resource management decision-making. The model can help decision-makers better understand and analyze conflicts of interest in water resource management and develop more rational and effective decision-making schemes, thereby achieving sustainable use of water resources and the coordinated development of the economy and society. Additionally, the model can also be applied to water resource management in other basins or regions and compared with other water resource management models to evaluate its strengths, weaknesses, and scope of applicability.

Author Contributions

Zhipeng Fan: Conceptualization, Methodology, Model programming, Data analysis, Writing-original draft, Writing – review & editing. Xiang Fu: Conceptualization, Methodology, Supervision, Project administration, Funding acquisition, Writing – review & editing. Xiaodan Zhao: Data analysis, Writing – review & editing.

Funding

This study was funded by the National Key Research and Development Program of China (2022YFC3202300) and National Natural Science Foundation of China (52479023, U21A2002).

Data Availability Statement

The original contributions presented in the study are included in the article, and further inquiries can be directed to the corresponding author.

Conflicts of Interest

The authors declare no conflicts of interest.

References

  1. Darbandsari, P.; Kerachian, R.; Malakpour-Estalaki, S.; Khorasani, H. An Agent-Based Conflict Resolution Model for Urban Water Resources Management. SUSTAINABLE CITIES AND SOCIETY 2020, 57. [Google Scholar] [CrossRef]
  2. Hubacek, K.; Guan, D.; Barrett, J.; Wiedmann, T. Environmental Implications of Urbanization and Lifestyle Change in China: Ecological and Water Footprints. Journal of Cleaner Production 2009. [Google Scholar] [CrossRef]
  3. López-Alvis, J.; Carrera-Hernández, J.J.; Levresse, G.; Nieto-Samaniego, Á.F. Assessment of Groundwater Depletion Caused by Excessive Extraction through Groundwater Flow Modeling: The Celaya Aquifer in Central Mexico. Environ Earth Sci 2019, 78, 482. [Google Scholar] [CrossRef]
  4. Downing, J.A. Protecting Local Water Quality Has Global Benefits.
  5. Tayebi, S.; Feizizadeh, B.; Esfandi, S.; Aliabbasi, B.; Ali Alavi, S.; Shamsipour, A. A Neighborhood-Based Urban Water Carrying Capacity Assessment: Analysis of the Relationship between Spatial-Demographic Factors and Water Consumption Patterns in Tehran, Iran. Land 2022, 11, 2203. [Google Scholar] [CrossRef]
  6. Wang, G. Development Tendency Analysis for the Water Resource Carrying Capacity Based on System Dynamics Model and the Improved Fuzzy Comprehensive Evaluation Method in the Changchun City, China. Ecological Indicators 2021. [Google Scholar] [CrossRef]
  7. Wang, Y. Coupling and Coordination Analysis of Urbanization, Economy and Environment of Shandong Province, China.
  8. Ma, T.; Sun, S.; Fu, G.; Hall, J.W.; Ni, Y.; He, L.; Yi, J.; Zhao, N.; Du, Y.; Pei, T.; et al. Pollution Exacerbates China’s Water Scarcity and Its Regional Inequality.
  9. Giordano, R.; Passarella, G.; Uricchio, V.; Vurro, M. Fuzzy Cognitive Maps for Issue Identification in a Water Resources Conflict Resolution System. PHYSICS AND CHEMISTRY OF THE EARTH 2005, 30, 463–469. [Google Scholar] [CrossRef]
  10. Nikoo, M.; Kerachian, R.; Poorsepahy-Samian, H. An Interval Parameter Model for Cooperative Inter-Basin Water Resources Allocation Considering the Water Quality Issues. WATER RESOURCES MANAGEMENT 2012, 26, 3329–3343. [Google Scholar] [CrossRef]
  11. Madani, K. Game Theory and Water Resources. JOURNAL OF HYDROLOGY 2010, 381, 225–238. [Google Scholar] [CrossRef]
  12. Li, Y.; Fu, X.; Chu, X.; Liu, S. A Conflict Resolution Model for Reservoir Operation in Dry Seasons under Channel Alteration. JOURNAL OF HYDROLOGY 2022, 610. [Google Scholar] [CrossRef]
  13. Fu, Y.; Zhang, J.; Zhang, C.; Zang, W.; Guo, W.; Qian, Z.; Liu, L.; Zhao, J.; Feng, J. Payments for Ecosystem Services for Watershed Water Resource Allocations. JOURNAL OF HYDROLOGY 2018, 556, 689–700. [Google Scholar] [CrossRef]
  14. Lee, C. Multi-Objective Game-Theory Models for Conflict Analysis in Reservoir Watershed Management. CHEMOSPHERE 2012, 87, 608–613. [Google Scholar] [CrossRef] [PubMed]
  15. Homayounfar, M.; Lai, S.; Zommorodian, M.; Oroji, A.; Ganji, A.; Kaviani, S. Developing a Non-Discrete Dynamic Game Model and Corresponding Monthly Collocation Solution Considering Variability in Reservoir Inflow. WATER RESOURCES MANAGEMENT 2015, 29, 2599–2618. [Google Scholar] [CrossRef]
  16. Nasiri-Gheidari, O.; Marofi, S.; Adabi, F. A Robust Multi-Objective Bargaining Methodology for Inter-Basin Water Resource Allocation: A Case Study. ENVIRONMENTAL SCIENCE AND POLLUTION RESEARCH 2018, 25, 2726–2737. [Google Scholar] [CrossRef] [PubMed]
  17. Moradi, S.; Limaei, S. Multi-Objective Game Theory Model and Fuzzy Programing Approach for Sustainable Watershed Management. LAND USE POLICY 2018, 71, 363–371. [Google Scholar] [CrossRef]
  18. Zeng, Y.; Li, J.; Cai, Y.; Tan, Q.; Dai, C. A Hybrid Game Theory and Mathematical Programming Model for Solving Trans-Boundary Water Conflicts. JOURNAL OF HYDROLOGY 2019, 570, 666–681. [Google Scholar] [CrossRef]
  19. Li, L.-L.; Miao, Y.; Lim, M.K.; Sethanan, K.; Tseng, M.-L. Integrated Energy System for Low-Carbon Economic Operation Optimization: Pareto Compromise Programming and Master-Slave Game. Renewable Energy 2024. [Google Scholar] [CrossRef]
  20. Kang, M.; Lee, G.; Ko, I. Evaluating Watershed Management within a River Basin Context Using an Integrated Indicator System. JOURNAL OF WATER RESOURCES PLANNING AND MANAGEMENT 2010, 136, 258–267. [Google Scholar] [CrossRef]
  21. Cheng, B.; Zhang, Y.; Xia, R.; Wang, L.; Zhang, N.; Zhang, X. Spatiotemporal Analysis and Prediction of Water Quality in the Han River by an Integrated Nonparametric Diagnosis Approach. Journal of Cleaner Production 2021, 328, 129583. [Google Scholar] [CrossRef]
  22. Kuo, Y.-M.; Liu, W.; Zhao, E.; Li, R.; Muñoz-Carpena, R. Water Quality Variability in the Middle and down Streams of Han River under the Influence of the Middle Route of South-North Water Diversion Project, China. Journal of Hydrology 2019. [Google Scholar] [CrossRef]
  23. Zhang, J.; Bing, J.; Li, X.; Guo, L.; Deng, Z.; Wang, D.; Liu, L. Inter-Basin Water Transfer Enhances the Human Health Risk of Heavy Metals in the Middle and Lower Han River, China. JOURNAL OF HYDROLOGY 2022, 613. [Google Scholar] [CrossRef]
Figure 1. The research framework.
Preprints 138121 g001
Figure 2. Geographical location of the Middle and Lower Han River.
Preprints 138121 g002
Figure 3. The research flowchart.
Preprints 138121 g003
Figure 4. Comparison of CEMB-CP and CIMB-CP for Economic Benefit and Pollution Discharge.
Preprints 138121 g004
Figure 5. Water Deficit Comparison Between CEBM-CP and CIBM-CP.
Preprints 138121 g005
Figure 6. Comparative Analysis of Water Resource Allocation with CEMB-CP.
Preprints 138121 g006
Figure 7. Comparative Analysis of Water Resource Allocation with CIMB-CP.
Preprints 138121 g007
Figure 8. Decision and Utility Analysis of CIMB-CP Across Various Scenarios.
Preprints 138121 g008
Table 1. Adjusted Coefficient k Combinations Under Different Risk Attitudes.
Scenario S1 S2 S3 S4 S5
KB 5 4 3 2 1
KE 1 2 3 4 5
Disclaimer/Publisher’s Note: The statements, opinions and data contained in all publications are solely those of the individual author(s) and contributor(s) and not of MDPI and/or the editor(s). MDPI and/or the editor(s) disclaim responsibility for any injury to people or property resulting from any ideas, methods, instructions or products referred to in the content.
Copyright: This open access article is published under a Creative Commons CC BY 4.0 license, which permit the free download, distribution, and reuse, provided that the author and preprint are cited in any reuse.
Alerts
Prerpints.org logo

Preprints.org is a free preprint server supported by MDPI in Basel, Switzerland.

Subscribe

© 2025 MDPI (Basel, Switzerland) unless otherwise stated