1. Introduction
Enhanced Oil Recovery (EOR) techniques are crucial for maximizing oil production from reservoirs. When considering the utilization of magnetic graphene oxide in conjunction with heavy crude oil for EOR applications, it is essential to understand the properties of heavy crude oil and the challenges in its recovery. Heavy crude oil is characterized by high viscosity and complex structures, such as asphaltene and resin aggregates, which impact its flow behavior and recovery efficiency [
1,
2,
3].
The high viscosity of heavy crude oil poses challenges for its mobility within the reservoir, necessitating technologies to improve flow properties [
4,
5,
6]. Various EOR methods have been explored to enhance heavy oil recovery, with a focus on reducing its viscosity and improving its mobility within the porous media [
7,
8]. Additionally, the use of ionic liquids as diluents and carbon-based materials as catalysts has shown promise in facilitating the extraction of heavy crude oil [
9,
10]. Understanding these challenges provides a foundational basis for exploring innovative EOR techniques
In the context of EOR, magnetic graphene oxide and nanofluids offer opportunities for wettability alteration and interfacial tension reduction, crucial for enhancing oil recovery processes. The synthesis of magnetic graphene nanosheets has demonstrated potential for efficient oil recovery applications [
11]. Moreover, the application of magnetic nanofluids has been studied for their impact on interfacial properties and wettability alteration, which are key factors in improving oil recovery efficiency.
Coreflooding testing provides a practical method for evaluating the performance of EOR techniques under reservoir conditions. By conducting coreflooding experiments with magnetic graphene oxide and nanofluids in the presence of heavy crude oil, researchers can assess the effectiveness of these materials in altering wettability and enhancing oil recovery [
12]. Such experiments offer insights into the feasibility and efficacy of incorporating magnetic materials into EOR strategies for heavy oil reservoirs.
Within this study, the synthesis of magnetic graphene oxide (Fe3O4@GO) was conducted using magnetite (Fe2O4) functionalized graphene oxide. The magnetic nanofluid was prepared using 28000 ppm TDS formation brine, with xanthan gum utilized as a stabilizing agent. Comprehensive morphological and spectroscopic characterization of both graphene oxide (GO) and magnetic graphene oxide (Fe3O4@GO) was performed. Following this, two coreflooding experiments were conducted: the first, utilizing a high-permeability sandstone reservoir to assess potential formation damage caused by the magnetic nanofluid injection, and the second, employing a tighter, lower-permeability rock to evaluate nanoparticle retention within the porous medium. Results indicated that the magnetic nanofluid not only exhibited no detrimental effects on formation integrity in the porous medium but also led to improved permeability following injection.
2. Materials and Methods
2.1. Materials
Graphite powder, sodium nitrate, potassium permanganate, 98% sulfuric acid, hydrochloric acid, 30% hydrogen peroxide, sodium chloride (99.5%), sodium hydroxide, ferrous sulfate heptahydrate, potassium nitrate and toluene were of analytical grade, and were purchased from Merck. The crude oil samples and sandstone cores were obtained from an oil field located in the Colombian northeast zone. The formation brine composition, SARA (Saturated, Aromatics, Resins, Asphaltenes), and API properties of crude oil sample are presented in
Table 1.
2.2. Fabrication of GO Nanofluid
Graphene oxide nanosheets were produced through an adaptation of the Tours-modified Hummer’s method [
13]. In summary, 2 g of pristine graphite powder were mixed with 120 ml of sulfuric acid in a container. This mixture was continuously stirred at 60°C. Then, 12 g of potassium permanganate were gradually added at a rate of 0.5 g per minute, while maintaining the temperature at 60°C. These conditions were maintained for 24 hours. To terminate the oxidation process, 30% hydrogen peroxide was carefully added drop by drop. Subsequently, 500 mL of deionized water (DW) was incorporated, and the dispersion was left to settle at room temperature for 8 hours without stirring.
Residual acids and oxidizing agents were eliminated through repeated rinsing and centrifugation at 8000 rpm for 30 minutes. The pH was adjusted to 8 by adding 0.1 M NaOH. The GO obtained was mixed with 500 mL of deionized water (DW) and then exfoliated via ultrasound for 6 hours to produce a GO aqueous dispersion. To ensure that the graphene oxide dispersion would not obstruct the porous medium and cause formation damage, the suspension was filtered through a 45-micron cellulose membrane. Finally, the GO dispersion was freeze-dried at -30°C for five days, followed by lyophilization to obtain the GO powder [
14].
2.3. Synthesis of Magnetic Graphene Oxide
The magnetic graphene oxide was obtained through the partial oxidation of Fe
+2, previously adsorbed onto graphene oxide (GO), and the in-situ formation of Fe
3O
4 nanoparticles. To begin, a 5 mg/mL aqueous dispersion of GO was placed in a flask and purged with nitrogen for 5 minutes. The mixture was then heated to 90°C while stirring at 1000 rpm. Next, 25 mL of an aqueous iron sulfate solution was added, followed by a 15-minute incubation period. Subsequently, a 25 mL solution containing sodium hydroxide and potassium nitrate was gradually added and allowed to react for 30 minutes. Lastly, the resulting product was subjected to multiple centrifugation cycles with distilled water until a neutral pH was achieved [
15].
2.4. Characterization of the Materials
Fourier transform infrared spectra (FT-IR) of the Magnetic Graphene Oxide nanoparticle (GO) was recorded in the spectral range from 4000-400 cm-1 using a Nicolet iS50 thermo Scientific spectrophotometer. The size distribution and the stability of Fe3O4@GO liquid suspension were obatined using dynamic light scattering measurement (DLS) and Z –Potential analysis, respectively. The sandstone core samples were analyzed using X-ray Diffraction (XRD) to determine their composition and scanning electron microscopy (SEM) to examine their morphology. Petrophysical properties of the formation plug were measured using a fully automated Vinci Technologies multi-sample porosimeter-permeameter, employing Helium and Nitrogen at various confining pressures ranging from 400 to 10,000 psi.
2.5. Preparation of Magnetic Nanofluid
The nanofluid preparation procedure, was conducted as follows: Initially, 10 ml of the Fe
3O
4@GO dispersion obtained underwent evaporation in an oven at 60 °C for 24 hours. Based on the initial concentration, three Fe
3O
4@GO magnetic nanofluids were prepared at concentrations of 200, 500, and 1000 ppm. This involved dispersing the dried sample in distilled water, homogenizing it with ultrasound for 5 minutes, and adjusting the pH. The stability of these nanofluids was monitored for 48 hours to assess their long-term behavior [
16].
2.6. Stabilization of Magnetic Nanofluid in Formation Brine
The hydrophilic characteristics of magnetic graphene oxide contribute to its dispersion in freshwater. However, the presence of salts, particularly cations, destabilizes the dispersion of magnetic graphene oxide as these cations readily interact with the graphene oxide flakes. Ionic interaction neutralizes the material, facilitating interaction between the flakes, leading to agglomeration (destabilization) and subsequent material precipitation. To mitigate this process, spacers can be employed. These are molecular or polymeric systems that weakly interact with the material to be stabilized, keeping it separated and preventing agglomeration. In this process, the biopolysaccharide known as xanthan gum is used as the stabilizer.
Initially, 500 mL of the formation brine described in
Table 1 are prepared at twice the desired concentration. Ten grams of each salt are weighed and added to 500 mL of distilled or deionized water, mechanically stirred for 20 minutes. Subsequently, 600 milligrams of xanthan gum are added to 500 mL of a 1000 ppm dispersion of magnetic graphene oxide in distilled or deionized water, and mechanically stirred at 1000 rpm for 30 minutes until completely dissolved. Finally, the 500 mL of saline solution (formation brine) are added to the 500 mL of the magnetic graphene oxide-xanthan gum dispersion while maintaining stirring at 1000 rpm for an additional 30 minutes. This procedure allows for the preparation of a stable magnetic nanofluid in a saline medium.
2.7. Compatibility Test
Testing the fluid-fluid compatibility of magnetic nanofluid with reservoir fluids is a crucial initial step towards its potential use as an enhanced oil recovery method. Compatibility tests allow us to assess the likelihood of nanoparticle agglomeration, changes in fluid properties, and potential formation of emulsions or sludge. Such information is critical in determining the viability of a nanofluid as a displacement agent and helps to prevent operational issues that could negatively affect field performance. Therefore, conducting fluid-fluid compatibility tests is an essential aspect of the development and evaluation of nanofluid-based enhanced oil recovery methods. Fluid-fluid compatibility tests include visual wettability, sludge, emulsion breakage and detergency. [
14].
2.8. Core Flooding Testing
For the coreflooding tests, a Vinci Technologies CFS 700 core flooding system was used, which allows setting the confining pressure and maximum pore pressure of 10000 psi (recommended pore pressure 500 psi minimum, below the confining pressure) and maximum furnace temperature of 150°C, it has 2 injection pumps that can operate at constant pressure or flow and in double configuration providing continuous flow without pulsations, with flow rates from 0.001 to 50 /min. The core holder allows working with samples from 1.5" to 12" in length.
3. Results
This section presents the characterization of the synthesized nanofluid and the rock, as well as the results of the fluid-fluid and rock-fluid compatibility tests.
3.1. Characterization of the Graphene Oxide (GO) and Magnetic Graphene Oxide (@GO)
The
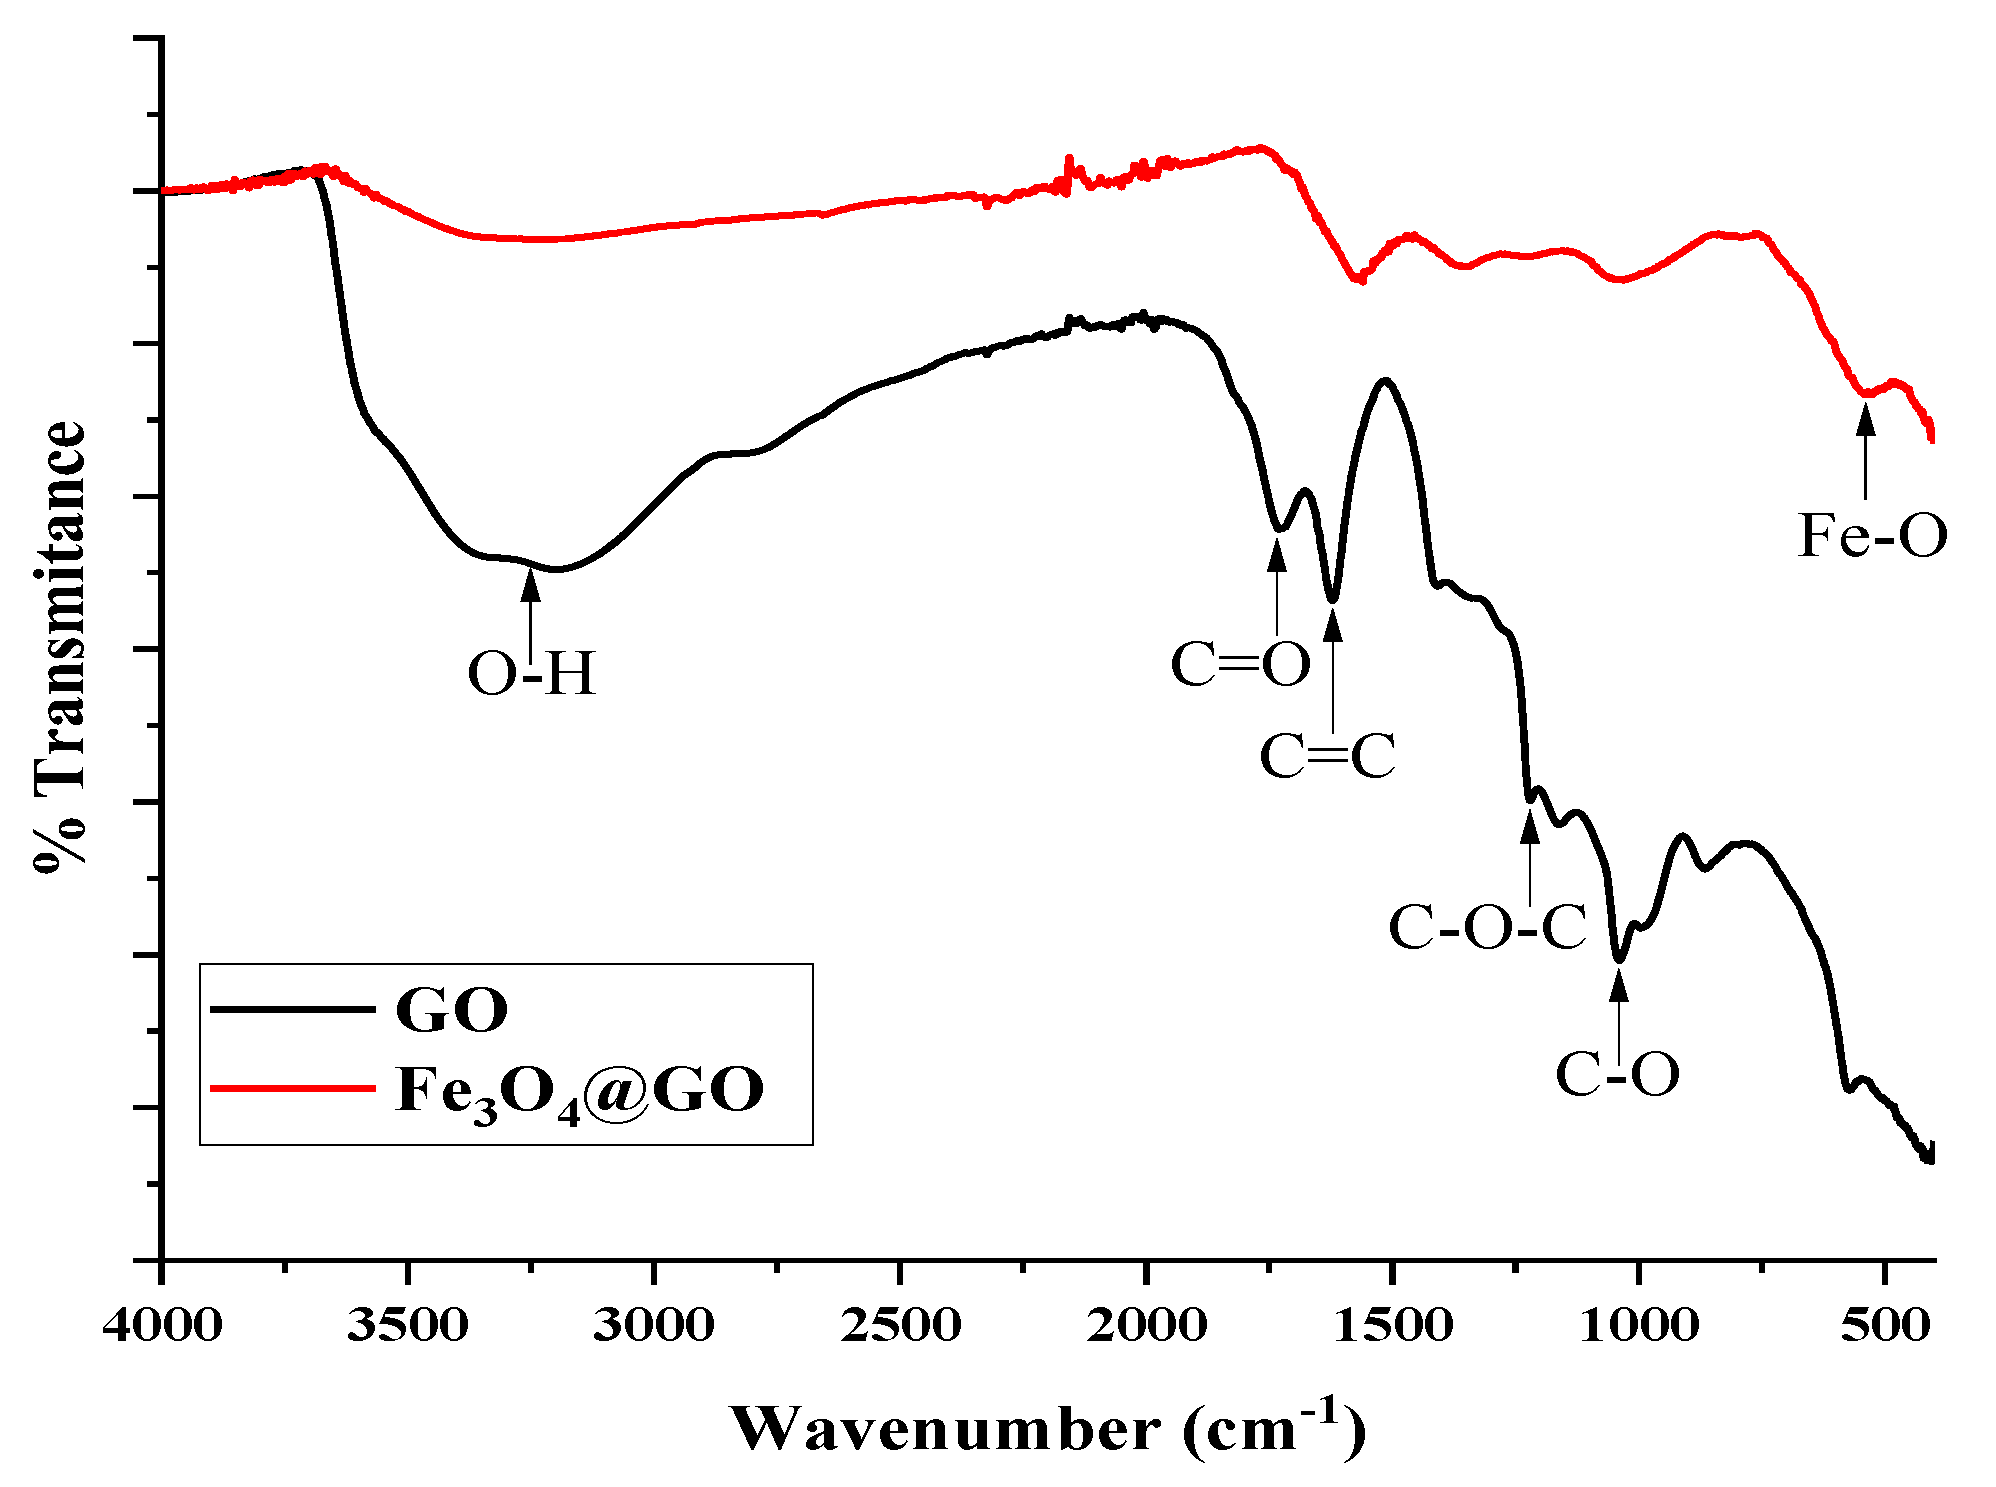
Figure 1 shows the FTIR spectrum of the GO and
@GO, revealed the presence of the oxygen functional groups characteristic of graphene oxide. The bands corresponding to the stresses of the carboxyl functions at 1700
, hydroxyls in the range of 3000 to 3500
and epoxy at 859
[
17,
18]. On the other hand, the spectrum of
@GO reveals the formation of Fe-O on GO, highlighting its characteristic band at 555
. A decrease in the intensities of the characteristic bands of GO is also observed, suggesting a possible shielding due to the formation of
NPs on its surface [
19,
20].
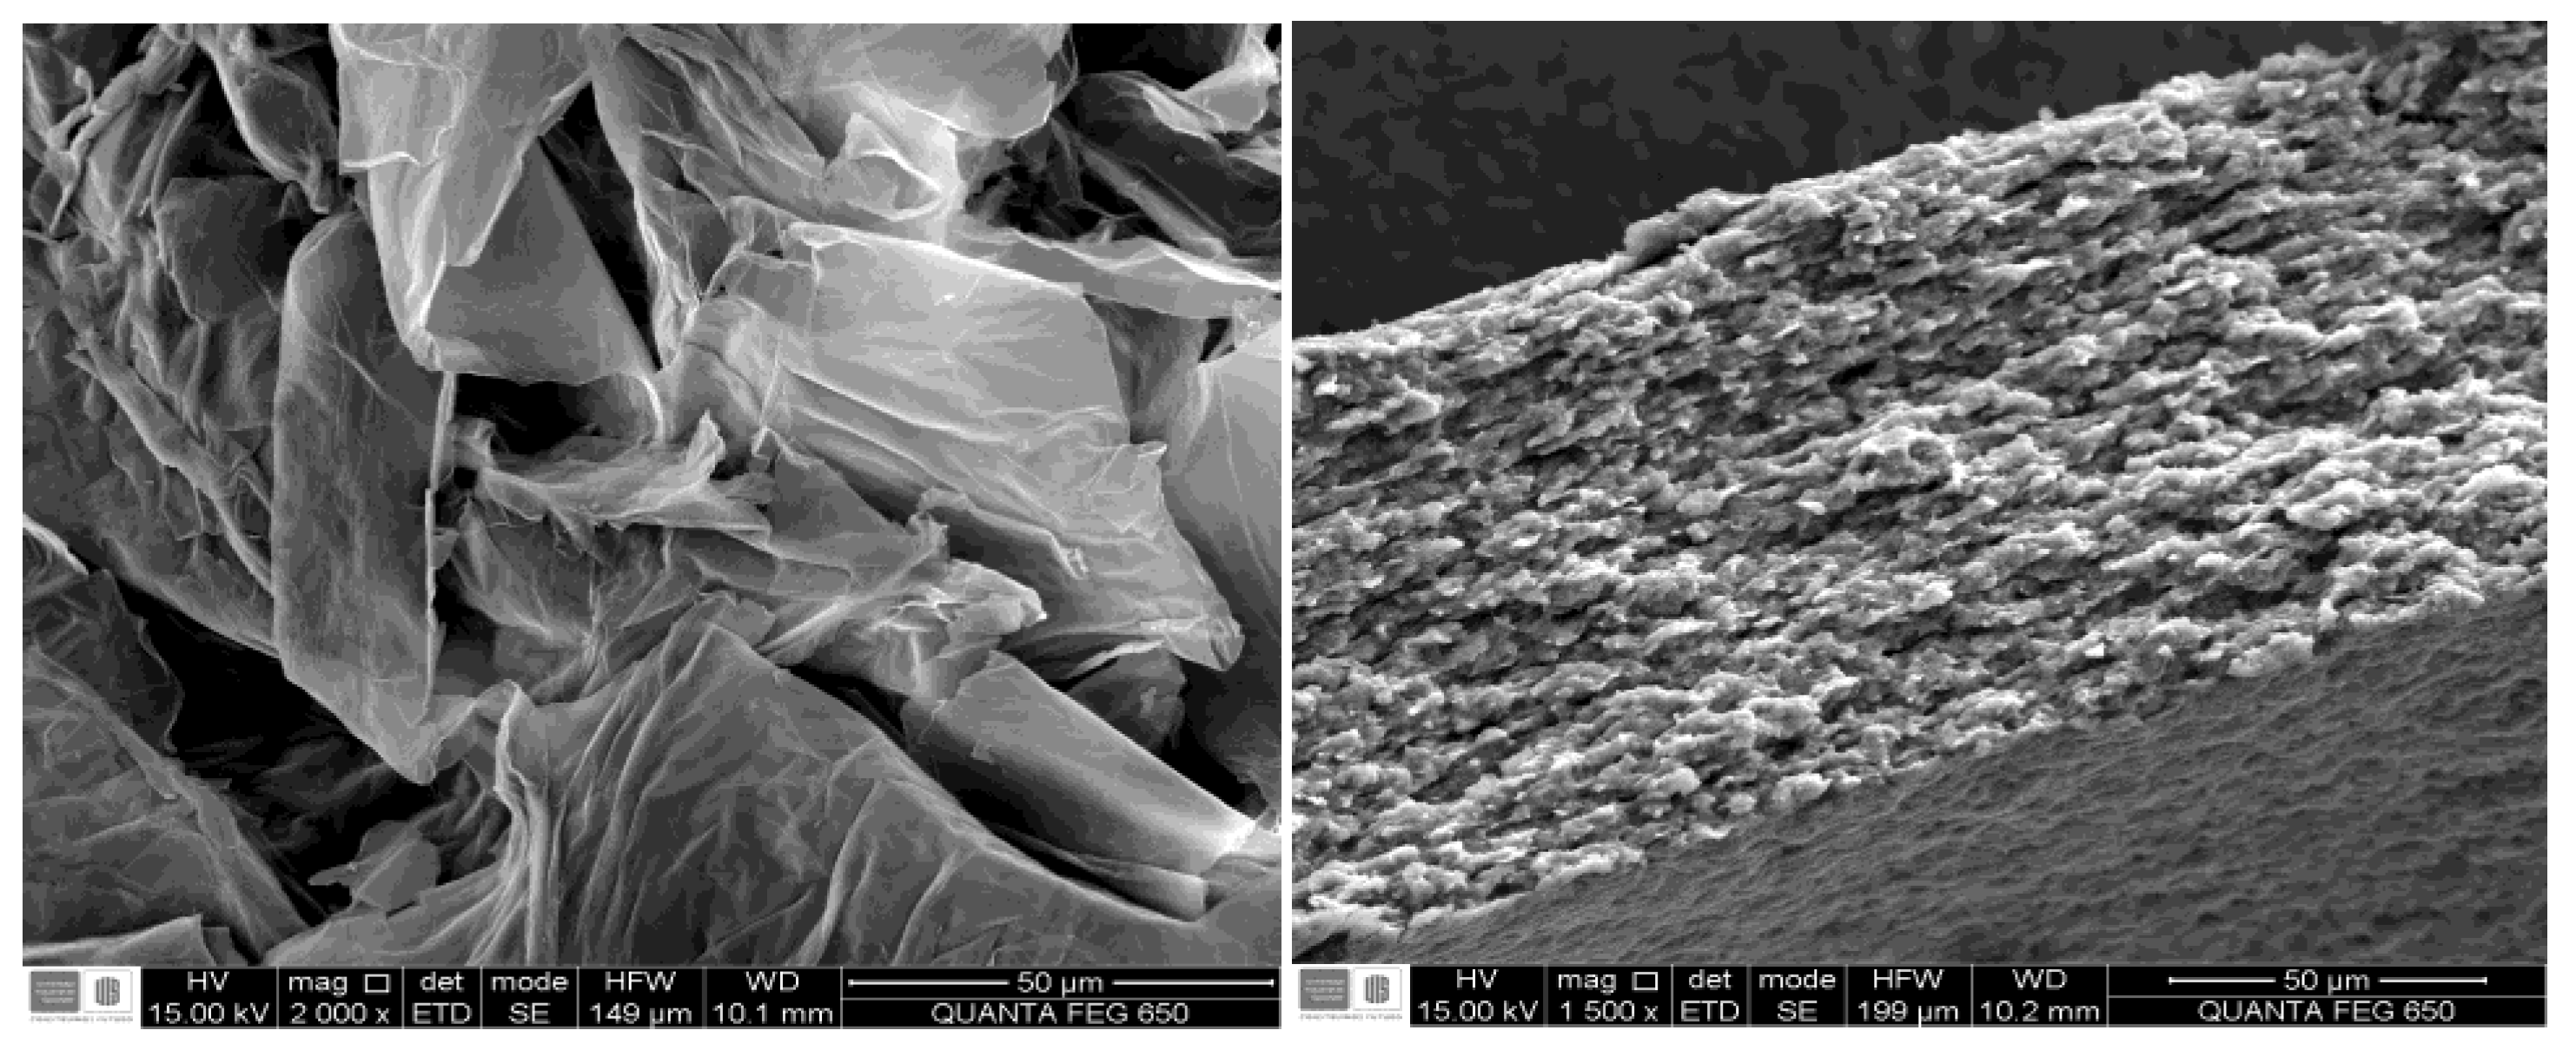
In the micrographs presented in
Figure 2 (left), a morphology resembling a wrinkled silk veil, characteristic of GO, is observed [
21,
22,
23]. Conversely,
Figure 2 (right) demonstrates a modification in the morphology of the GO sheets, attributed to the homogeneous growth of Fe
3O
4 nanoparticles distributed across its surface [
24,
25]. Additionally, energy dispersive spectroscopy (EDS) provided semi-quantitative elemental composition data for the Fe
3O
4@GO sample. As depicted in
Table 2, a significant amount of iron is recorded in comparison to the carbon content within the material. This observation corroborates the information obtained from FTIR analysis, which revealed the coating of the GO surface by the growth of Fe
3O
4 nanoparticles.
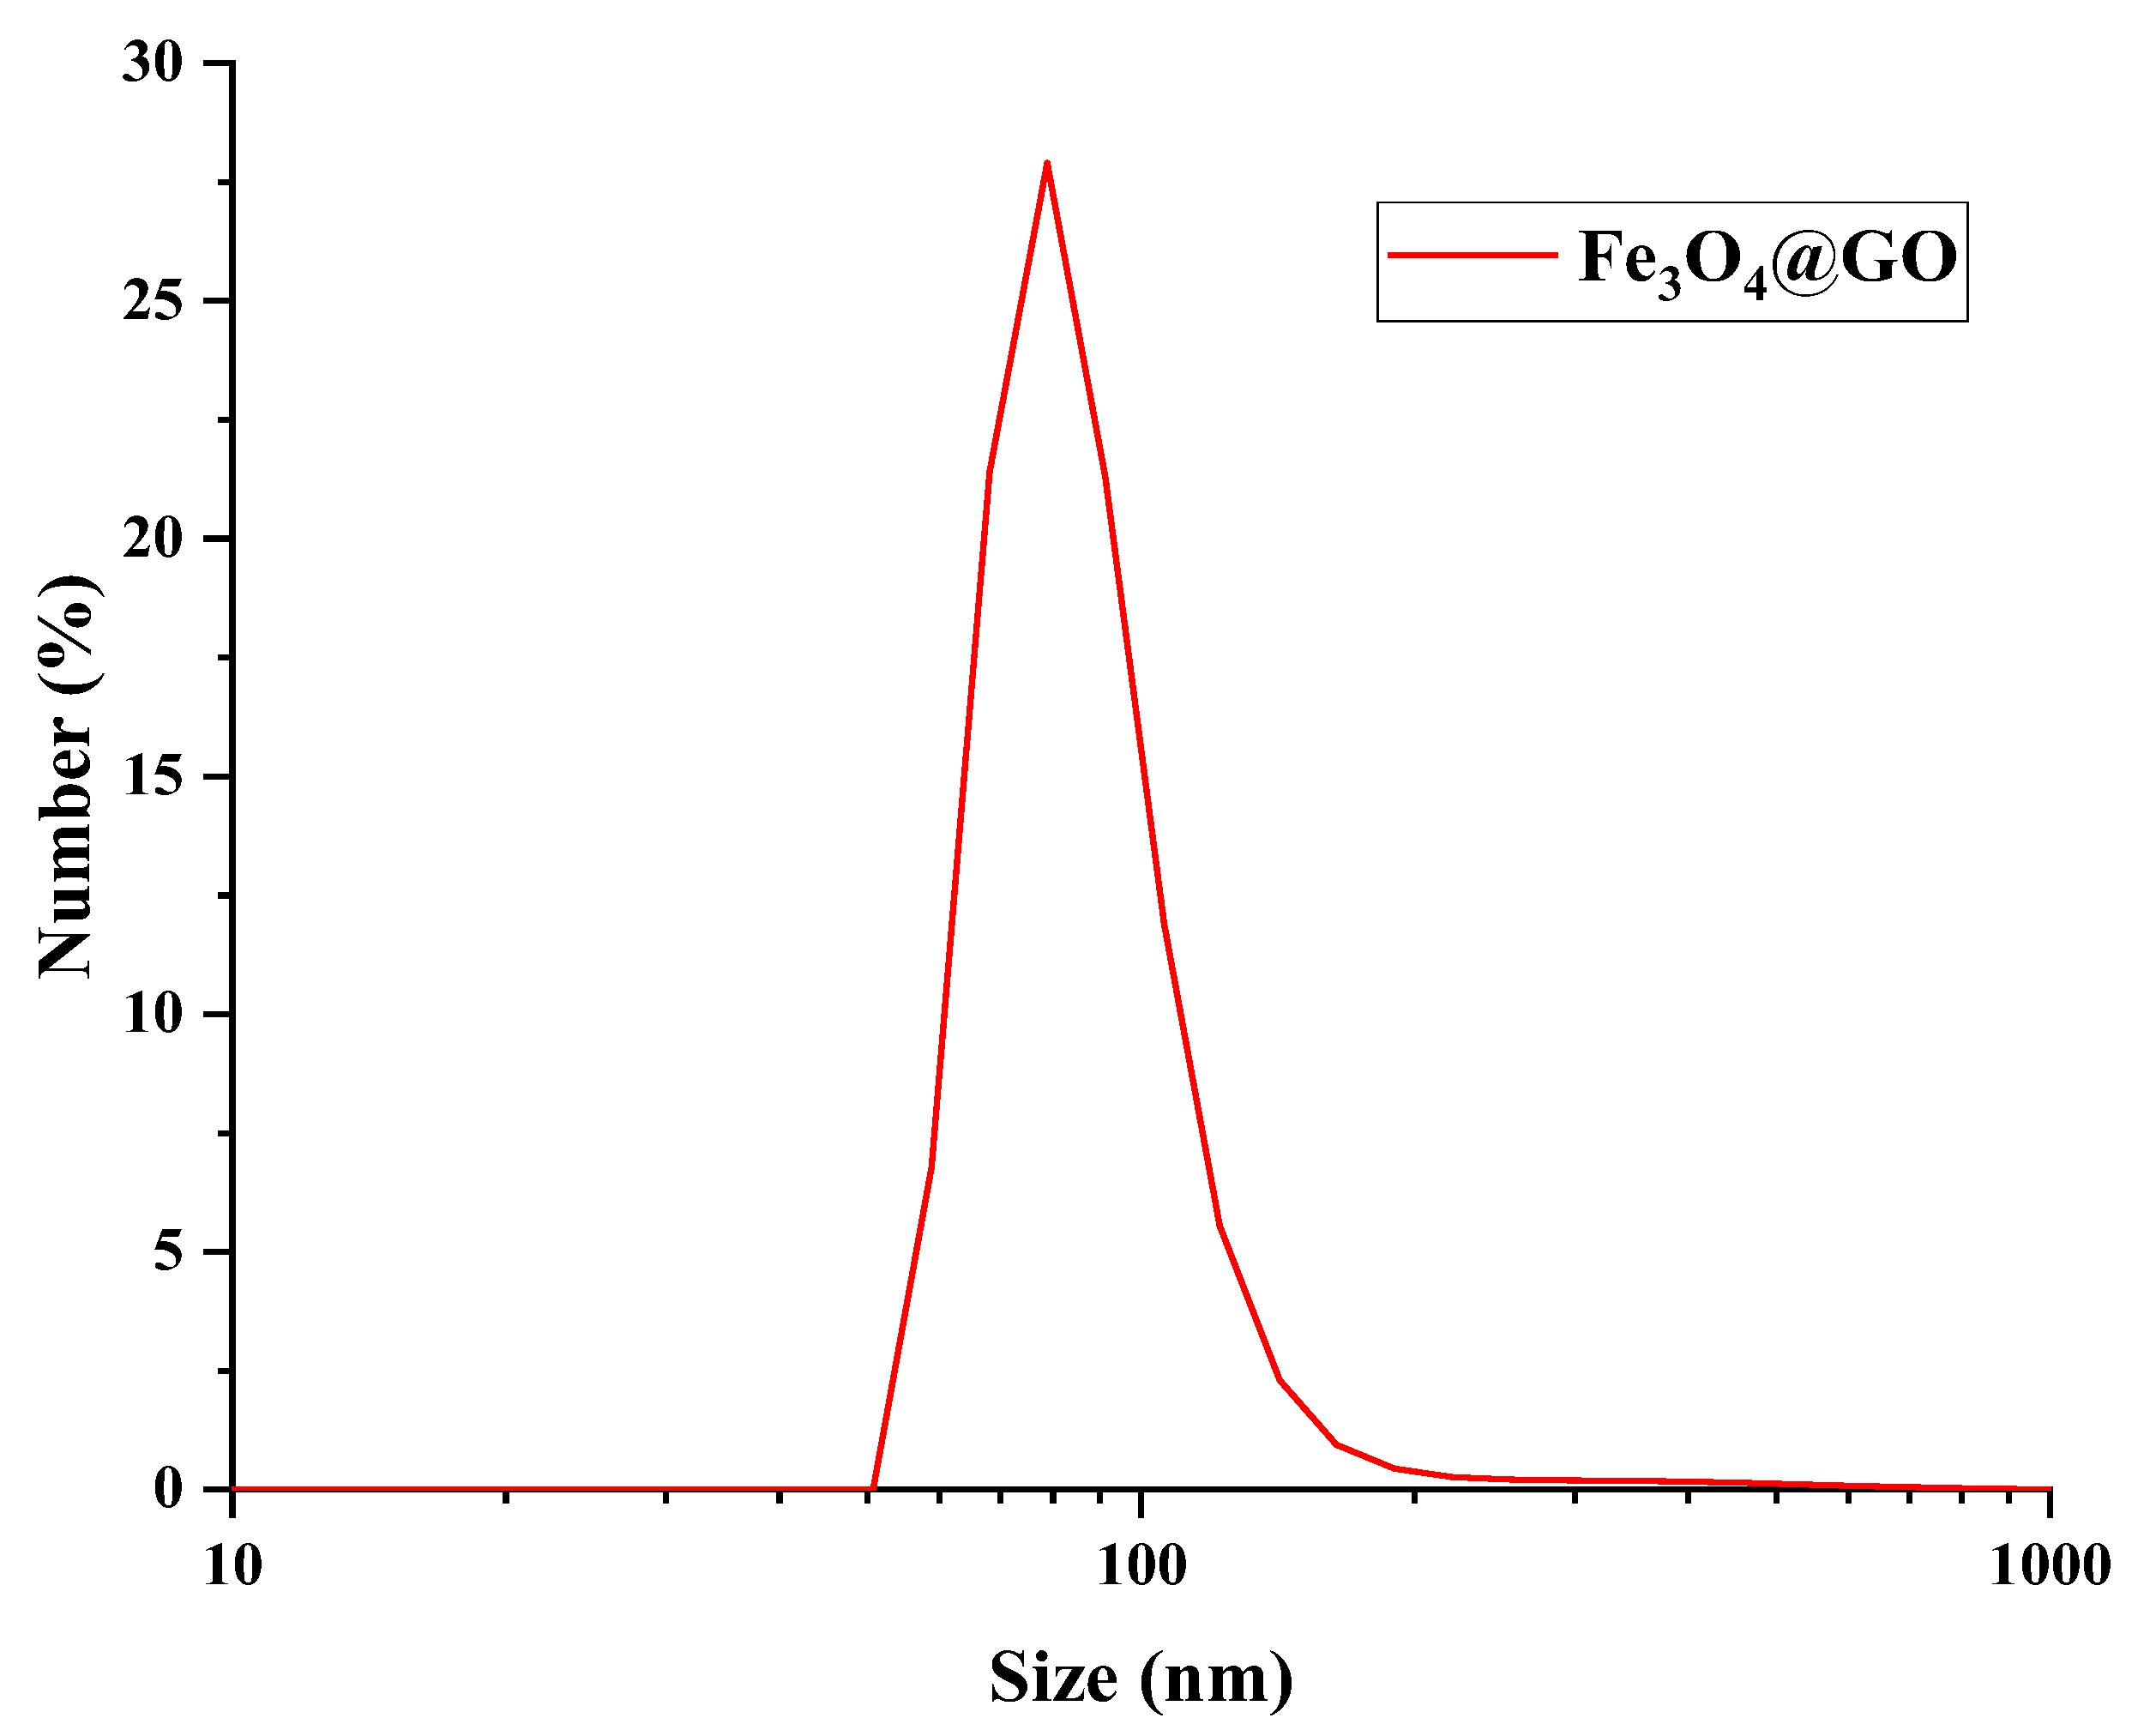
The size distribution of Fe
3O
4@GO was measured by DLS and is presented in
Figure 3. showed that the Fe
3O
4@GO particles are in the range of 50 to 110 nm with and average diameter of 80.2 nm.
The preceding findings substantiate the notable stability observed in all three aqueous nanofluids prepared. Even in the instance of the nanofluid containing 1000 ppm Fe3O4@GO, no evidence of precipitation was discerned after 48 hours. This behavior is ascribed to the stabilizing influence of GO, which, owing to its hydrophilic nature, forms numerous interactions with water. This characteristic stems from the abundance of oxygenated functional groups within the GO structure.
3.2. Rock Characterization
Two Berea sandstone core samples, denoted as A-12-B and B4-2B, were utilized in this study, for stage 1 and stage 2, respectively. Core plugs were extracted using a core plugging machine, followed by cleaning via the Dean-stark method employing toluene, and subsequent drying at 120°C in an oven for 24 hours. The petrophysical properties of both samples are detailed in
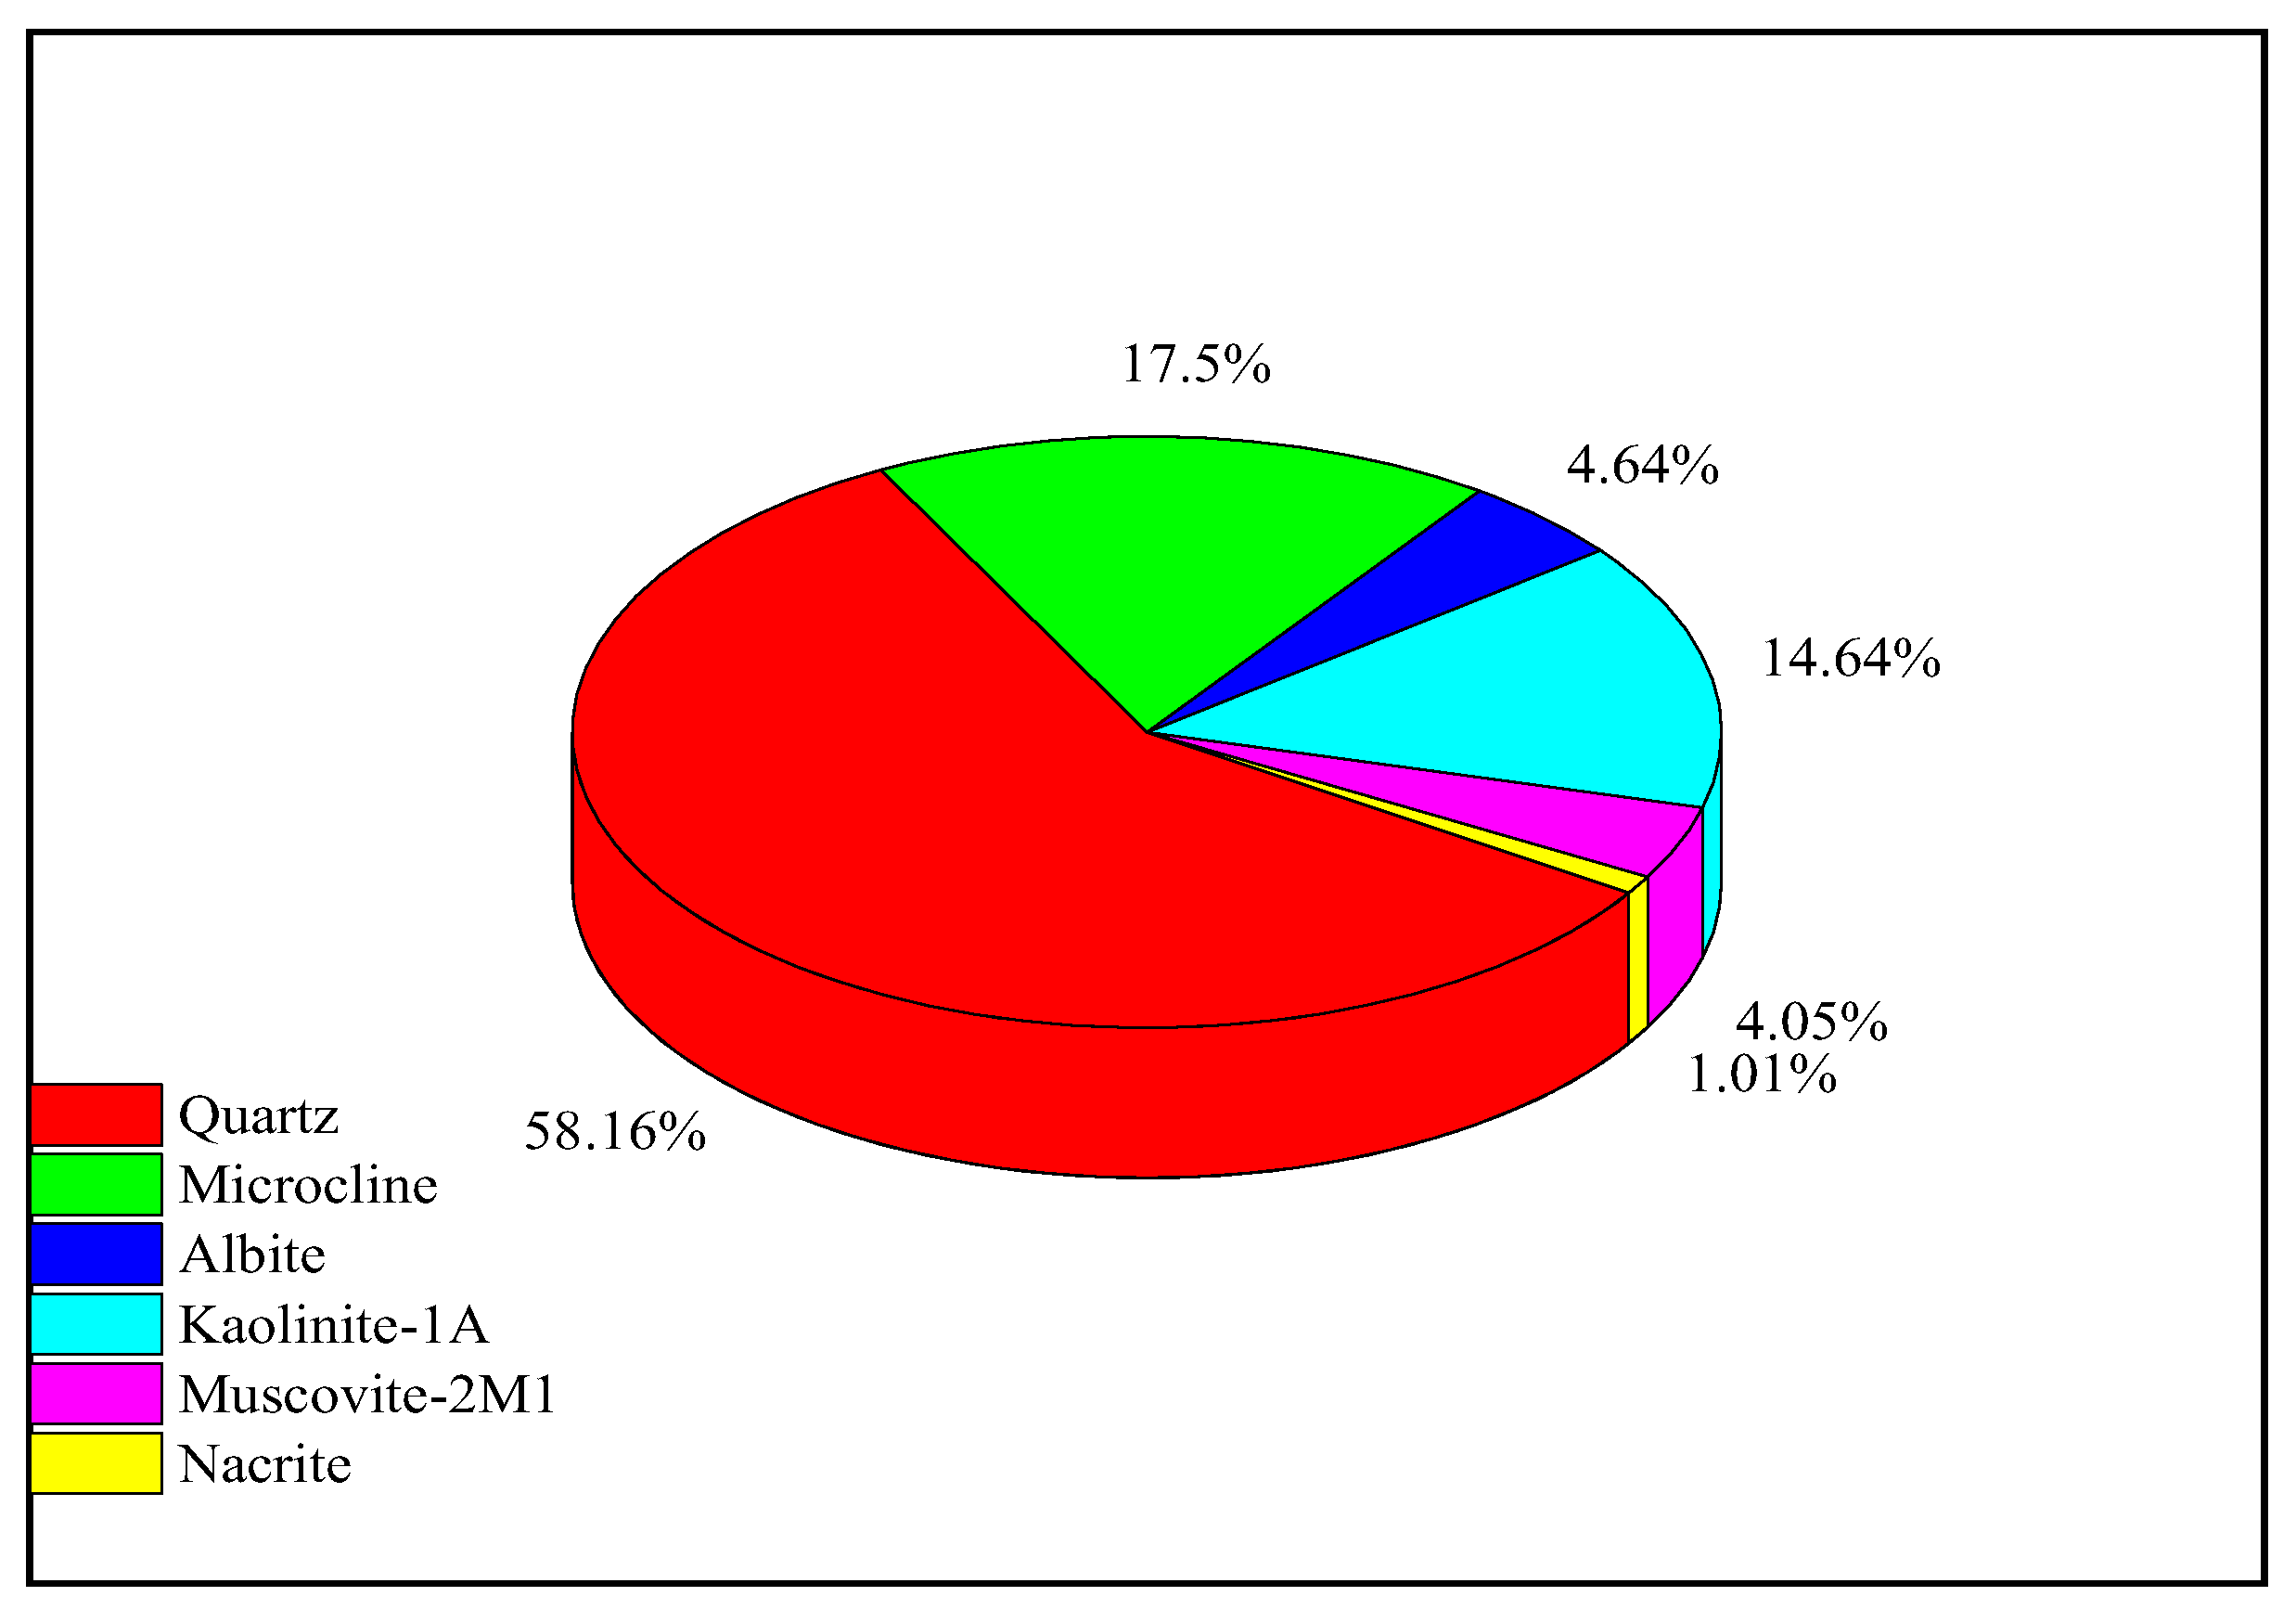
Table 3. Only the B4-2B sample underwent X-ray diffraction (XRD) analysis to assess the presence of minerals that may affect nanoparticle retention. This sample comprises 57% quartz, with the remainder consisting of clay components (
Figure 4).
3.3. Compatibility Test
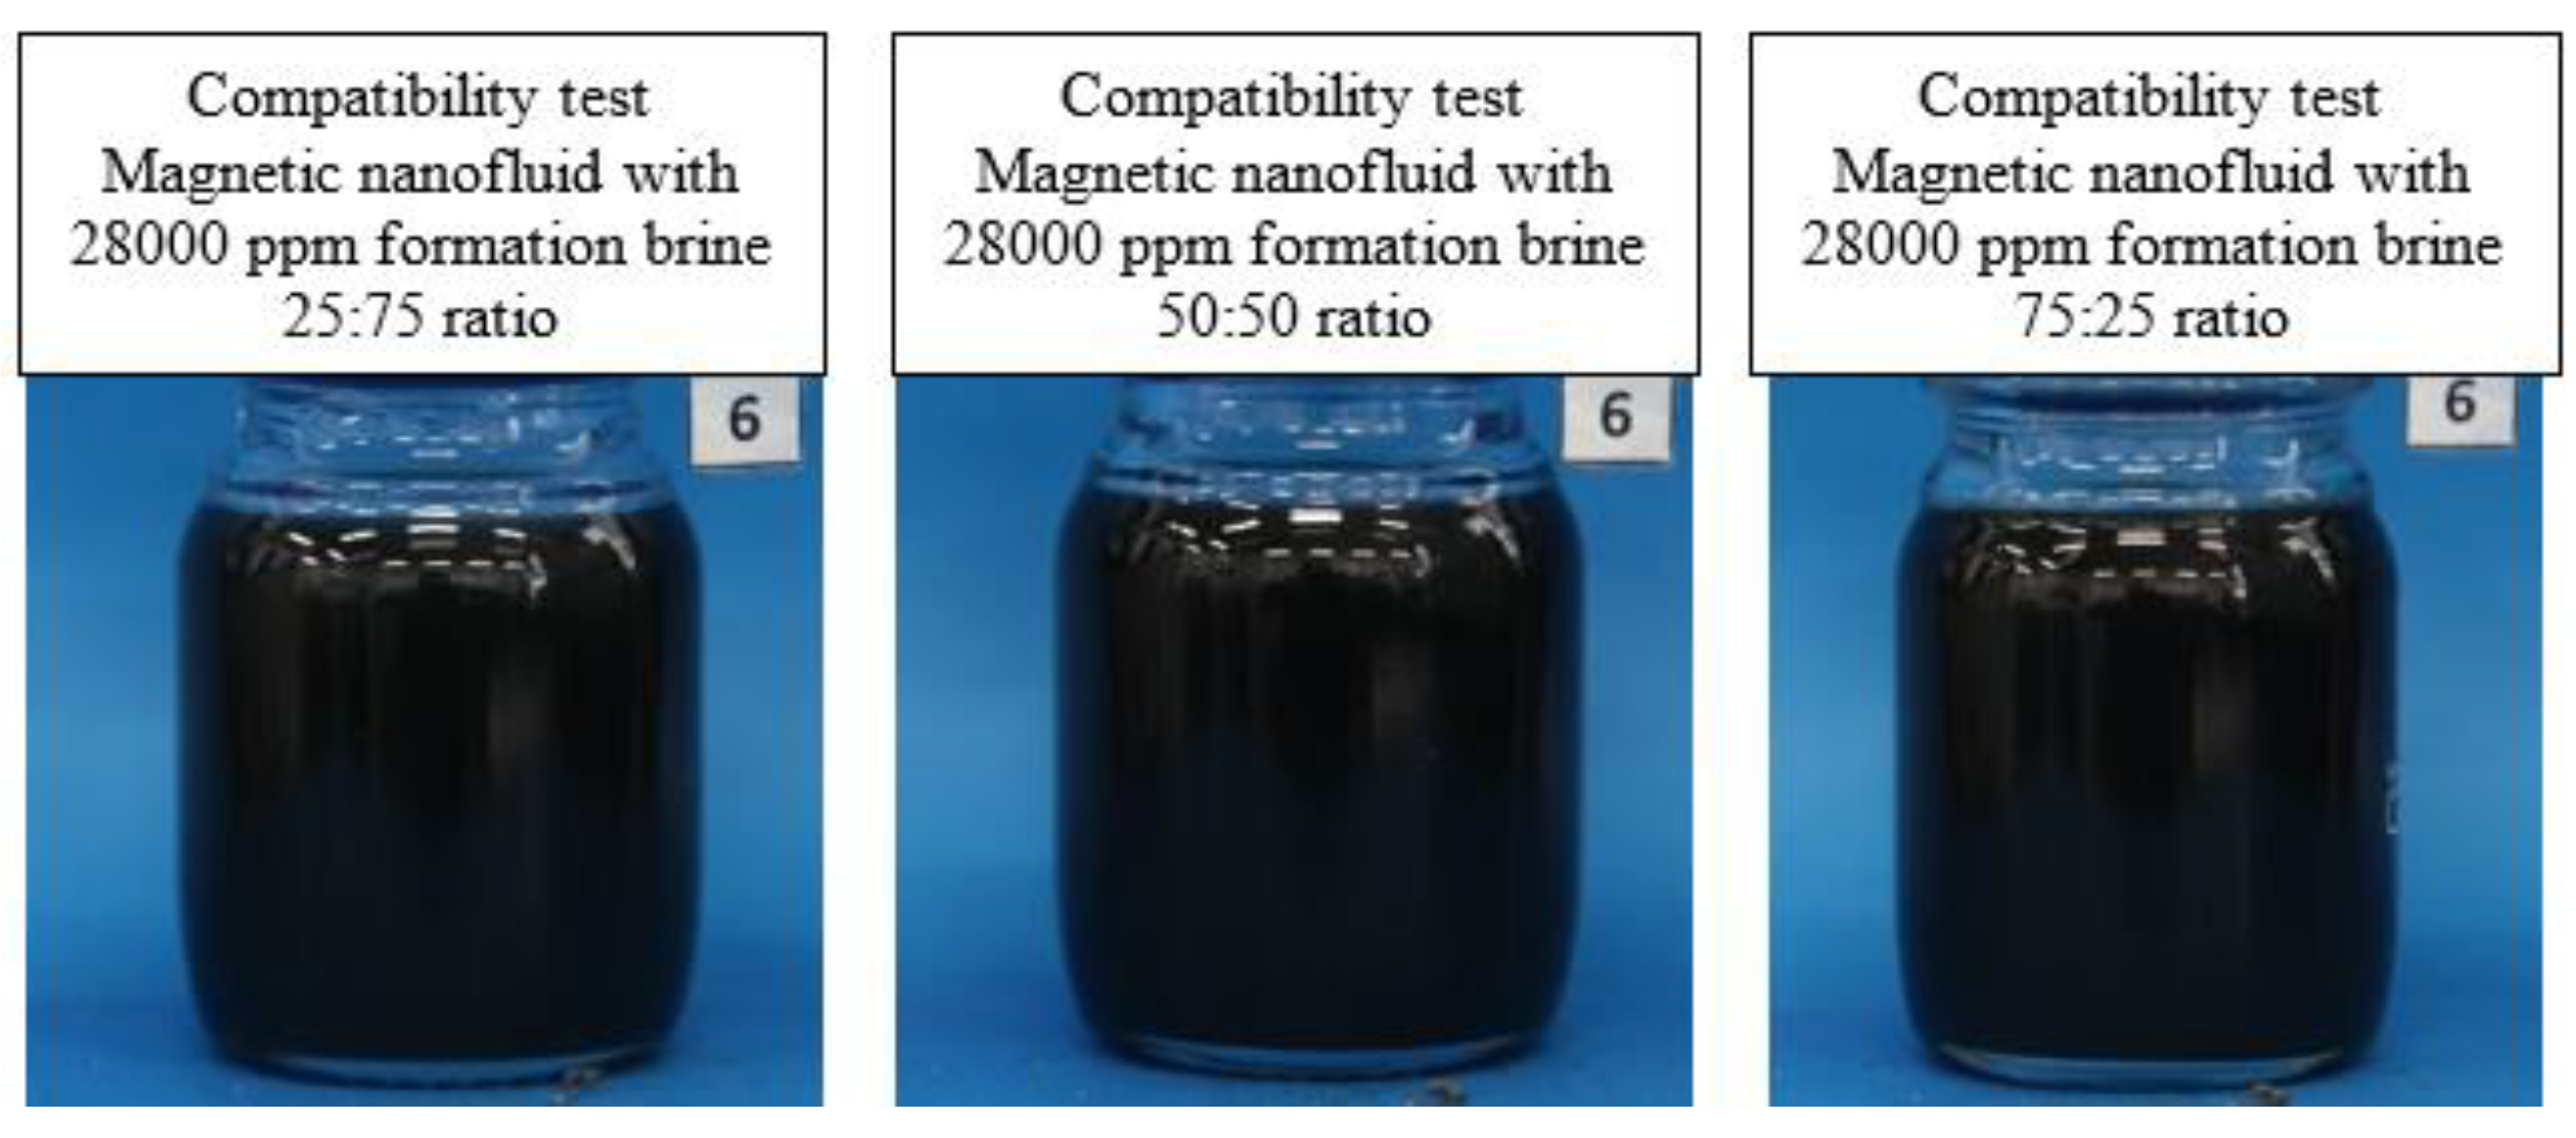
The first test involves compatibility assessment: magnetic nanofluid and formation brine were mixed in three different ratios (25:75, 50:50, 75:25), stirred at speeds ranging from 14000 to 18000 rpm for 60 seconds. The mixture was then transferred into a flask and placed in a temperature-controlled oven. Observations were made, and photographic records of both fluids were taken. Visual inspection ensured the absence of precipitates; the formation of precipitate indicates clear fluid incompatibility due to magnetic graphene oxide destabilization.
Figure 5 illustrates the test results.
A good compatibility between the magnetic nanofluid and the formation brine is evident after 24 hours, thus defining the scenario for incorporating the nanoparticles into the production water.
Once the compatibility test was successfully completed, the remaining tests outlined in API RP 42:1990 were conducted: visual wettability, sludge, emulsion breaking, and detergency.
The visual wettability test qualitatively determines the wetting tendency of a product or surfactant at the laboratory level against the formation sand; ideally, the product should wet the sand with water, as was the case here.
The sludge test determines a crude oil's tendency to form solid precipitates when in contact with a generally acidic product independent of its emulsion-forming tendency. The test between the crude oil and the nanofluid showed no sludge formation.
The emulsion breaking test indicates the tendency of a product or surfactant to increase or decrease emulsion formation in a crude oil-sample system at the laboratory level. The test between the crude oil and the magnetic nanofluid in brine with a commercial surfactant (sodium dodecyl sulfate) showed emulsion breaking exceeding 95%.
Finally, in the fluid-fluid interaction test, the detergency test was conducted, determining the cleaning capacity of the chemical treatments when in contact with the reservoir. At the end of the test, a good detergency of the magnetic nanofluid in brine over the sand was observed, as the latter remained clean without traces of crude oil.
3.4. Coreflooding Testing
Two displacement experiments were conducted in the porous medium. The first core flooding was performed using the high-permeability Berea sample A-12-B, designed to assess potential formation damage when the magnetic nanofluid was displaced through the porous medium and to determine the fluid saturation of the reservoir in the presence of the magnetic nanofluid. The protocol for the second coreflooding was carried out on a Berea sample B4-2B with lower permeability and higher clay content, aimed at evaluating the retention of the nanofluid by the porous medium under dynamic conditions.
Table 4 presents a summary of the two displacements carried out: the type of fluid, its purpose and the main result obtained are shown.
3.4.1. Coreflooding Stage 1
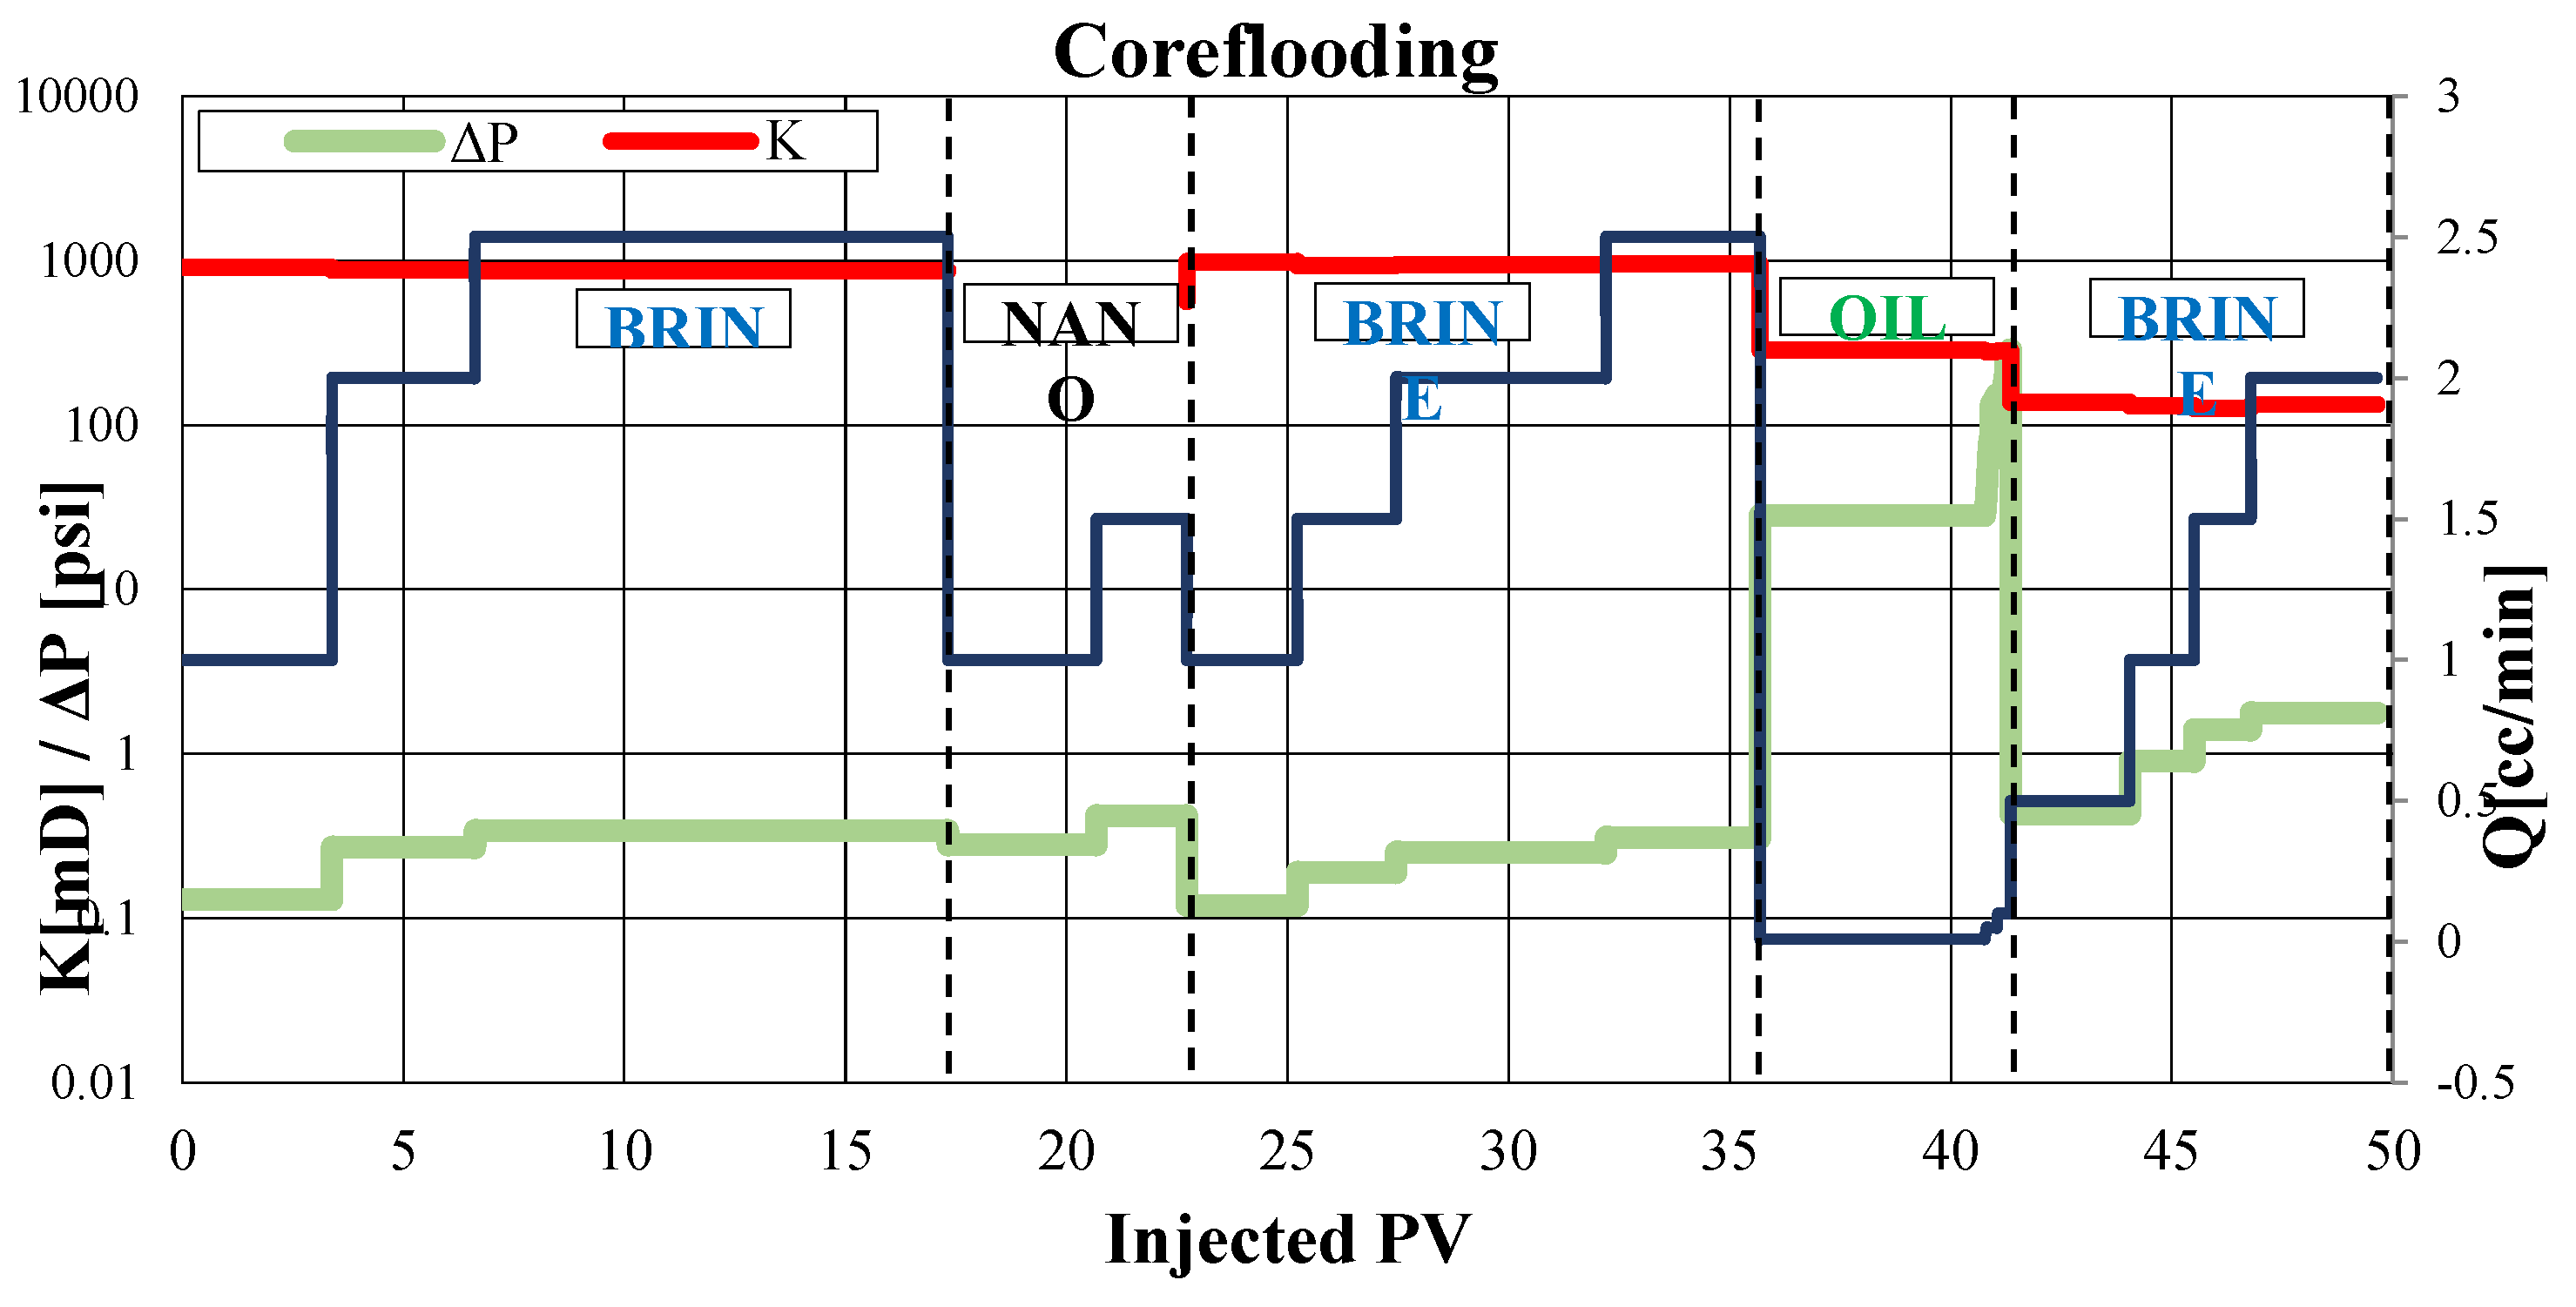
Since the permeability does not decrease after the displacement of the magnetic nanofluid in brine, it can be concluded that it does not cause any damage to the porous medium.
After restoration of permeability, the values of irreducible water saturation (Swirr) and residual oil saturation (Sor) are calculated using material balance, with values of 25.1% and 31.5%, respectively.
Figure 6 provides a graphical summary of the initial core flooding experiment. It illustrates the relationship between the number of pore volumes (PV) injected, the differential pressure measured at various flow rates, and the resulting absolute or effective permeability for each fluid tested.
3.4.2. Coreflooding Stage 2
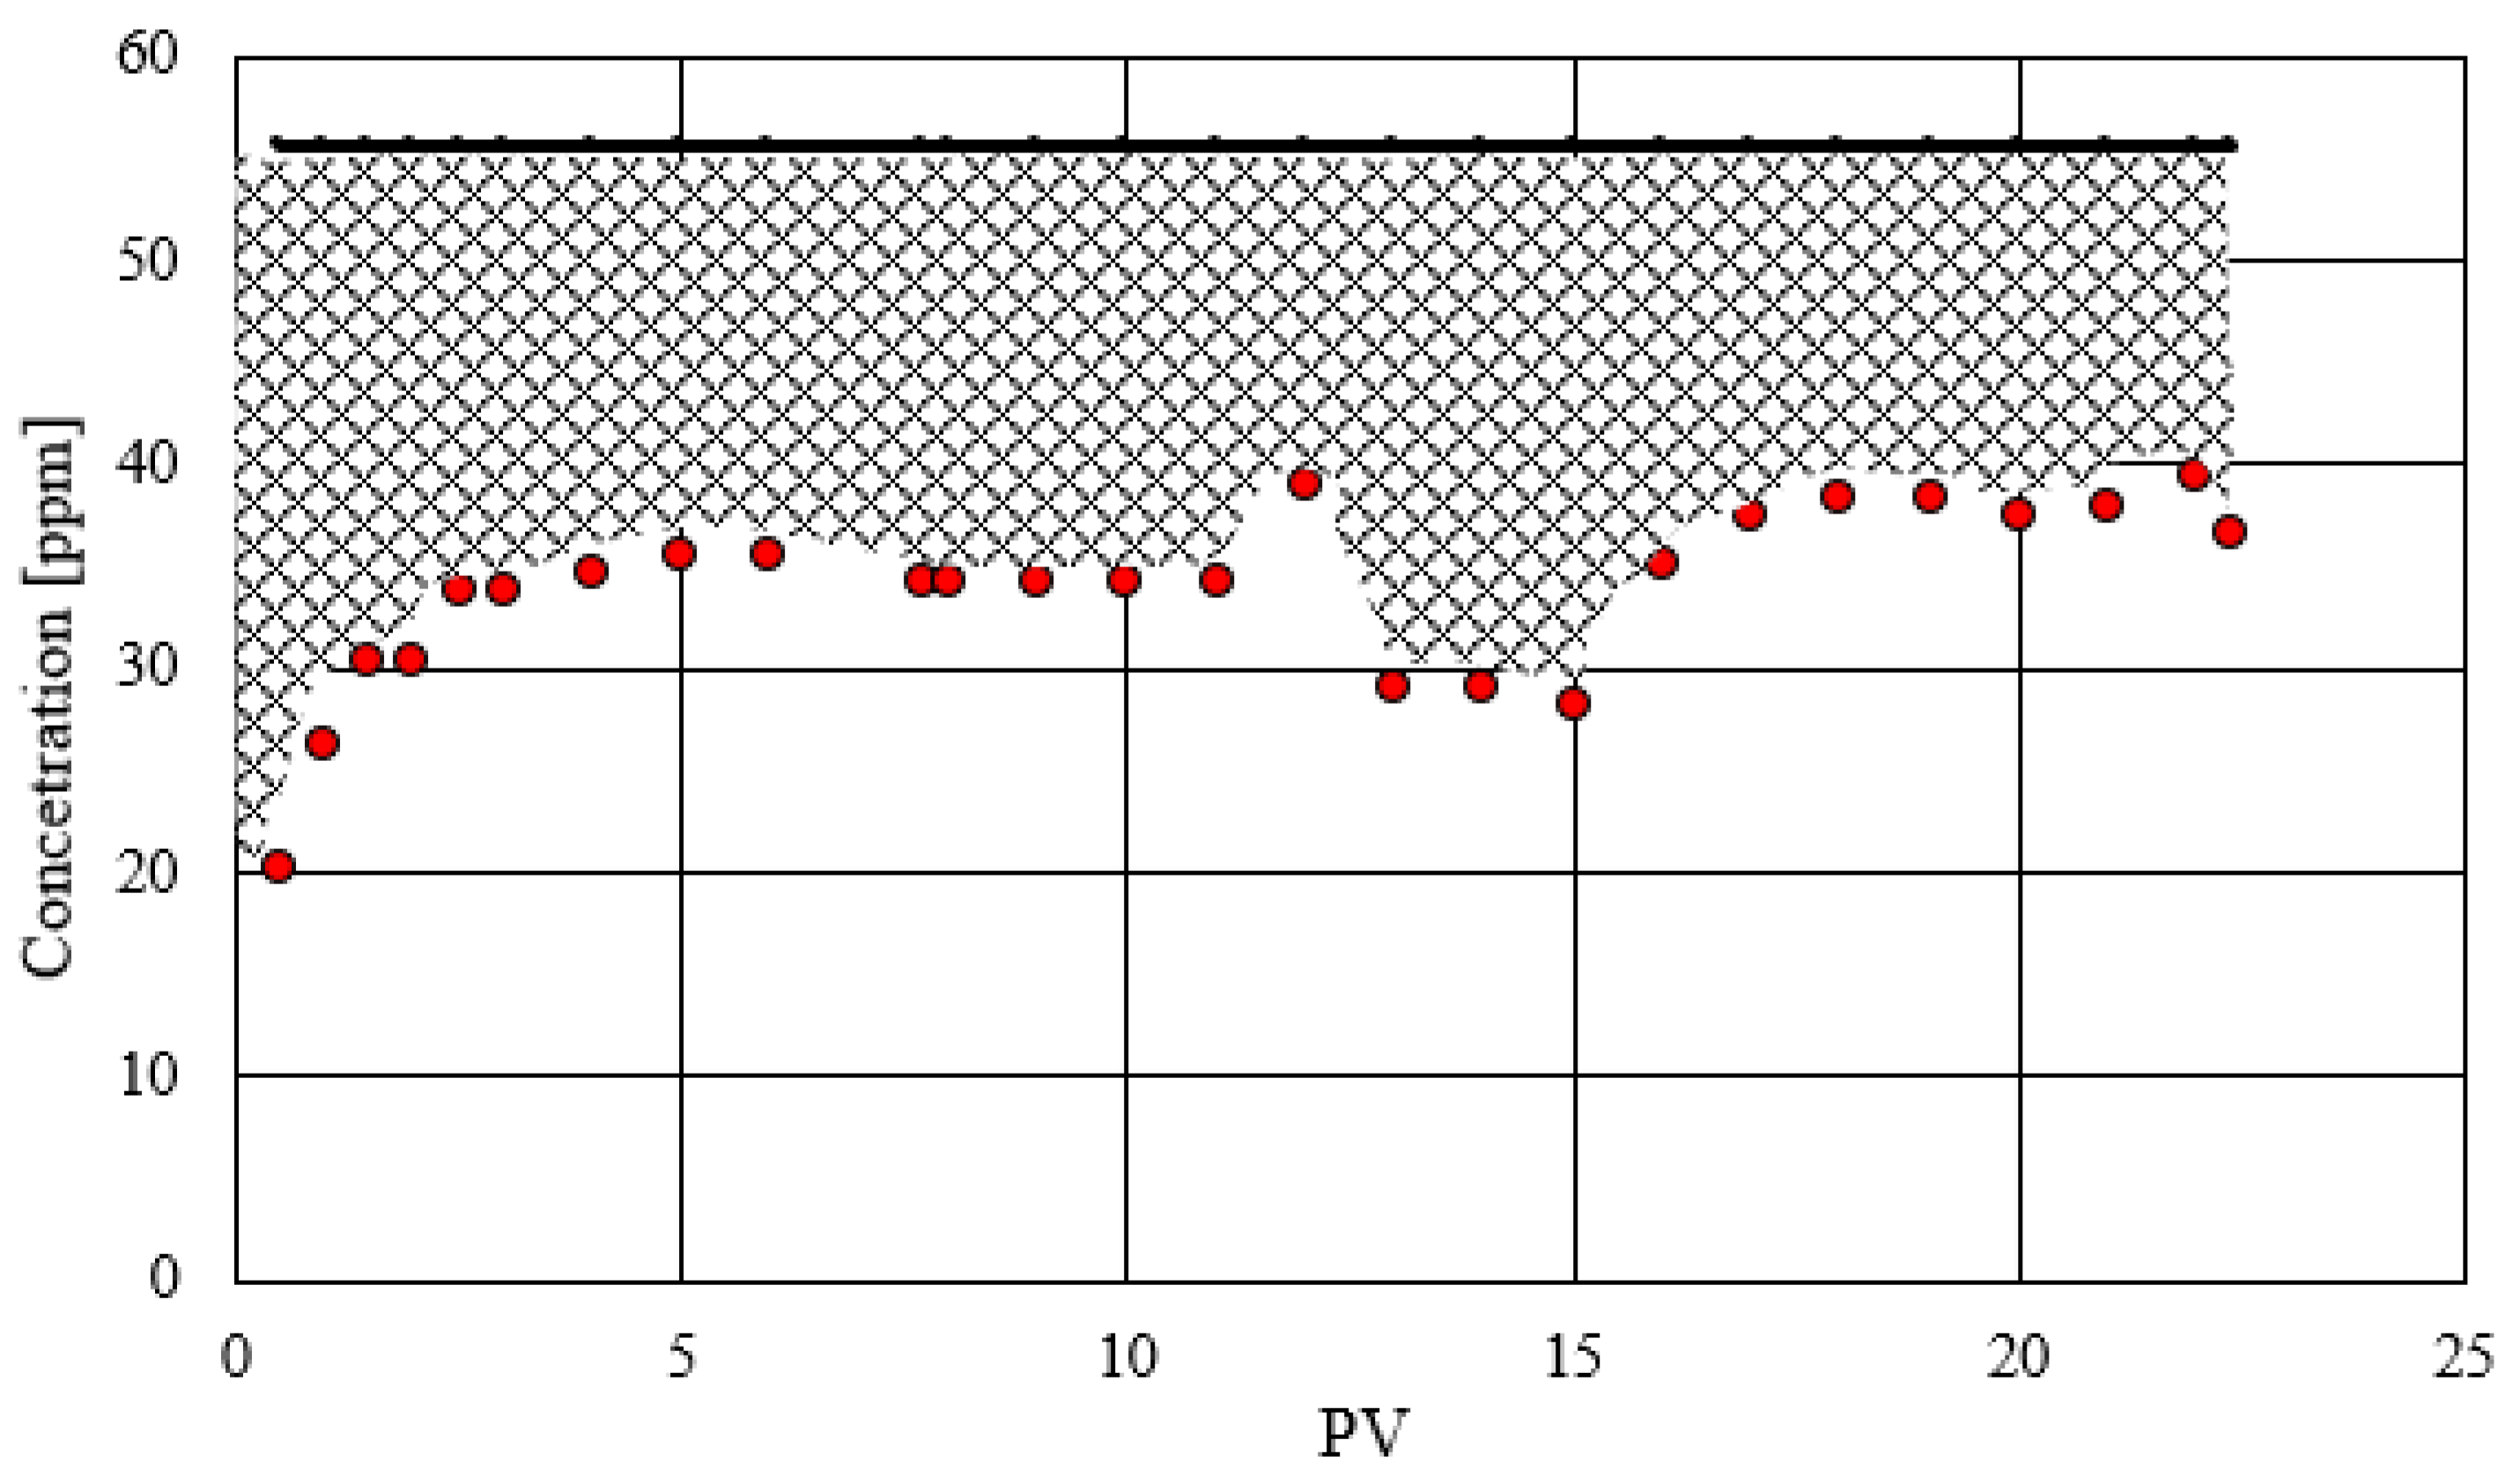
The second coreflooding was designed to assess the retention of the nanofluid within the porous medium under dynamic conditions. The fluids, and operating conditions were identical to those of the first coreflooding, except for the confining pressure. After mounting the sample and establishing operational conditions, the absolute brine permeability was determined to be 231.3 mD. Initially, a sample of the ferromagnetic nanofluid solution was analyzed to determine its iron concentration, yielding a value of 55.274 ppm. Subsequently, the ferromagnetic nanofluid was injected through the rock sample. Effluent samples were collected at regular intervals, measured in pore volumes, to determine the iron concentration and thereby assess the nanofluid's adsorption rate. Iron content measurements are shown in
Figure 7, which were conducted using Flame Atomic Absorption Spectroscopy (FAAS). The graph illustrates the evolution of iron concentration in the effluent (represented by red dots) in comparison to the initial iron concentration in the nanofluid (indicated by a black horizontal line). The difference between the areas under these two curves quantifies the amount of iron adsorbed by the rock.
The curve's trend indicates a steady state, where the amount of Fe discharged remains constant from PV 3 until the end of the coreflooding. Adsorption occurs in the initial PVs when the magnetic nanofluid encounters the brine-saturated porous medium. The decrease in Fe concentration around 10 pore volumes is associated with a change in flow rate (from 1 to 0.1 cc/min), which increases the contact time or residence of the nanofluid in the rock, thereby enhancing its adsorption. The concentration of Fe in the magnetic nanofluid is 55.274 ppm, the blank corresponding to the brine yielded a value of 0.394 ppm of Fe, which was subtracted from the Fe readings for the effluents. The injected mass of iron is calculated by multiplying the initial Fe concentration by the volume of Fe-GO solution injected, which corresponds to 22.4 pore volumes. Each PV is equivalent to 0.018 L (see
Table 3). Conversely, the total output mass is determined by multiplying the Fe concentration in the effluent by the sample volume. The difference between the injected mass and the output mass represents the amount absorbed by the rock, which is illustrated by the shaded area in
Figure 7.
This value, when divided by the weight of the rock sample used (165.23 g), yields the amount of iron adsorbed or retained per unit mass of rock. It's important to note that iron constitutes 72.4% of the magnetite used in the Fe-GO synthesis. Additionally, the ratio of magnetite to magnetic graphene oxide is 138.2 ppm to 184.3 ppm. Therefore, to express the adsorbed or retained amount of Fe-GO, the calculation would be as follows:
According to Radnia [
31], values ranging from 0.15 to 14.46 mg of GO adsorbed per gram of sandstone are reported; GO original suspension evaluated varying between 100, 900, 2000, 3000, and 4000 ppm. However, these values are measured under static conditions. The difference lies in the fact that in the dynamic test, the magnetic nanofluid contacts only the interconnected pores, which correspond to 22.26% of the total plug volume. In contrast, under static conditions, the contact area of the rock (which is disaggregated) is greater, and consequently, the adsorption should be higher. Ishtiaq et al. conducted experiments under both conditions using sandstone with and without nanomaterials (GO), adsorbing EDTA, and found that under static testing, adsorption was up to three times higher than under dynamic conditions.
4. Conclusions
Hummer's modified synthesis method was effective in obtaining graphene oxide, showed by the presence of functional groups in the structure of the material according to FTIR spectra. Using the GO obtained as precursor, magnetic graphene oxide (Fe3O4@GO) was successfully synthesized by partial oxidation of Fe+2 coupled to GO sheets. This process was confirmed by the appearance of a new band in the FTIR spectrum attributed to the Fe-O bond, accompanied by the decrease in the intensities of the characteristic GO bands. In addition, SEM microscopy revealed significant changes in the morphology of the material, and a reduced particle size of 80 nm was obtained by the dynamic light scattering technique.
The magnetic nanofluid in brine at a concentration of 500 ppm of magnetic graphene oxide and 300 ppm of xanthan gum is stable in high salinity formation waters.
Upon conducting the initial nanofluid injection into the porous medium, it was determined that the fluid does not damage the formation. A comparison of the absolute permeability to brine values obtained before and after nanofluid injection (approximately 934 mD) reveals that permeability is fully recovered.
The irreducible water saturation and residual oil saturation were determined to be 21.5% and 31.5%, respectively. Consequently, the movable water saturation ranges from 21.5% to 68.5%.
The experimental data demonstrates a notably high oil recovery despite the unfavorable mobility ratio in the system, attributed to the high viscosity of the crude oil. Such recovery is only achievable with highly favorable relative permeability curves, wherein the oil mobility is enhanced while that of water is diminished.
A second coreflooding experiment was conducted to investigate the adsorption of magnetic nanofluid in a porous medium. It was observed that a steady state is reached, with the amount of Fe remaining constant from PV 3 until the end of the displacement. Adsorption occurs primarily in the initial PV when the magnetic nanofluid encounters the porous medium saturated with brine. The mass retained per gram of rock was found to be 0.09511 mg of magnetic fluid/g rock, a value lower than that reported in the literature. However, it's important to note that the literature values were obtained under static conditions.
Author Contributions
All authors contributed to the study conception and design. Material preparation was performed by Nelson Gutierrez Niño, data collection and analysis were performed by Jimena Lizeth Gómez Delgado, Nelson Gutierrez Niño, Luis Felipe Carillo Moreno, Nicolás Santos Santos and Enrique Mejía Ospino. The first draft of the manuscript was written by Jimena Lizeth Gómez Delgado and all authors commented on previous versions of the manuscript. All authors read and approved the final manuscript.
Funding
This work was supported by Colombian Ministry of Science and Technology (MINCIENCIAS) within the framework of project No. 80740-413-2021.
Acknowledgments
This work was supported by Colombian Ministry of Science and Technology (MINCIENCIAS) within the framework of project No. 80740-413-2021. The authors are grateful to the Central Laboratories of the Technological Park of Guatiguará of the Universidad Industrial Santander; Surface Laboratory, Spectroscopy Laboratory, Microscopy Laboratory and Catalysis Research Center (CICAT) for their assistance.
References
- Zhang, S., Sun, L., Xu, J., Wu, H., & Wen, H. (2010). Aggregate structure in heavy crude oil: using a dissipative particle dynamics based mesoscale platform. Energy & Fuels, 24(8), 4312-4326. [CrossRef]
- Liu, H., Xu, Y., Chen, H., Zhang, J., & Xu, J. (2022). Viscoelastic behavior and constitutive relation of heavy crude oils. Acs Omega, 7(35), 30816-30822. [CrossRef]
- Song, S., Zhang, H., Sun, L., Shi, J., Cao, X., & Yuan, S. (2018). Molecular dynamics study on aggregating behavior of asphaltene and resin in emulsified heavy oil droplets with sodium dodecyl sulfate. Energy & Fuels, 32(12), 12383-12393. [CrossRef]
- Hart, A. (2013). A review of technologies for transporting heavy crude oil and bitumen via pipelines. Journal of Petroleum Exploration and Production Technology, 4(3), 327-336. [CrossRef]
- Oñate-Gutiérrez, J., Ramírez-Pradilla, J., Pinzón, J., & Combariza, M. (2020). Asphaltene structure modifiers as a novel approach for viscosity reduction in heavy crude oils. Energy & Fuels, 34(5), 5251-5257. [CrossRef]
- Muñoz, J., Ancheyta, J., & Castañeda, L. (2016). Required viscosity values to ensure proper transportation of crude oil by pipeline. Energy & Fuels, 30(11), 8850-8854. [CrossRef]
- Muñoz, J., Ancheyta, J., & Castañeda, L. (2016). Required viscosity values to ensure proper transportation of crude oil by pipeline. Energy & Fuels, 30(11), 8850-8854. [CrossRef]
- Li, Y., Li, Q., Wang, X., Yu, L., & Yang, J. (2018). Aquathermolysis of heavy crude oil with ferric oleate catalyst. Petroleum Science, 15(3), 613-624. [CrossRef]
- Li, X., Sun, W., Wu, G., He, L., Li, H., & Sui, H. (2011). Ionic liquid enhanced solvent extraction for bitumen recovery from oil sands. Energy & Fuels, 25(11), 5224-5231. [CrossRef]
- Li, K., Hou, B., Wang, L., & Cui, Y. (2014). Application of carbon nanocatalysts in upgrading heavy crude oil assisted with.
- microwave heating. Nano Letters, 14(6), 3002-3008. [CrossRef]
- Zhang, F., Zhang, Z., Xie, F., Han, X., Xia, H., Zhu, L., … & Oh, W. (2014). Formation of magnetic graphene nanosheets for rapid enrichment and separation of methyl orange from water. Journal of the Korean Ceramic Society, 51(6), 570-574. [CrossRef]
- Liu, Y., Tan, J., Cai, H., Wang, G., & Mou, S. (2021). Experimental study on percolation mechanism and displacement characteristics of cold recovery in offshore heavy oil field. Journal of Petroleum Exploration and Production Technology, 11(11), 4087-4115. [CrossRef]
- Kumar, R., Sharma, T., 2018. Stability and rheological properties of nanofluids stabilized by SiO2 nanoparticles and SiO2-TiO2 nanocomposites for oilfield applications. Colloids. Surf. A Physicochem. Eng. Asp. 539, 171e183. [CrossRef]
- Gómez-Delgado, J.L., Rodriguez-Molina, J.J., Perez-Angulo, J.C. et al. Evaluation of the wettability alteration on sandstone rock by graphene oxide adsorption. emergent mater. (2023). [CrossRef]
- Gómez, I. D., Cabanzo, R., & Mejía-Ospino, E. Process for obtaining a graphene composite with magnetic properties. Patent No. NC2016/0002346.
- Gómez, I. D., Cabanzo, R., & Mejía-Ospino, E. Facile method to functionalize graphene oxide with variable load of magnetite nanoparticles. (2019). [CrossRef]
- N. J. Walch, A. Nabok, F. Davis, and S. P. J. Higson, ‘Characterisation of thin films of graphene-surfactant composites produced through a novel semi-automated method’, Beilstein Journal of Nanotechnology, vol. 7, no. 1, pp. 209–219, 2016. [CrossRef]
- S. Majumder, A. Meher, S. Moharana, and K. H. Kim, ‘Graphene nanoribbon synthesis and properties in polymer composites: A review’, Carbon, vol. 216. Elsevier Ltd, Jan. 05, 2024. [CrossRef]
- Khalil M.I., ‘Co-precipitation in aqueous solution synthesis of magnetite nanoparticles using iron (III) salts as precursors’, Arabian Journal of Chemistry, vol. 8, no. 2, pp. 279–284, Mar. 2015. [CrossRef]
- Velásquez A.A., and. Urquijo J.P., ‘Synthesis and characterization of magnetite-maghemite nanoparticles in presence of polyethylene glycol obtained by mechanical milling’, Materials Science and Engineering: B, vol. 263, Jan. 2021. [CrossRef]
- Harres A., et al., ‘Magnetic properties of graphene oxide decorated with magnetite nanoparticles’, Diam Relat Mater, vol. 138, Oct. 2023. [CrossRef]
- S. C. Thickett and P. B. Zetterlund, ‘Graphene oxide (GO) nanosheets as oil-in-water emulsion stabilizers: Influence of oil phase polarity’, J Colloid Interface Sci, vol. 442, pp. 67–74, 2015. [CrossRef]
- M. Shanmugharaj, J. H. Yoon, W. J. Yang, and S. H. Ryu, ‘Synthesis, characterization, and surface wettability properties of amine functionalized graphene oxide films with varying amine chain lengths’, J Colloid Interface Sci, vol. 401, pp. 148–154, 2013. [CrossRef]
- M. Elgamal, N. A. Abd El-Ghany, and G. R. Saad, ‘Synthesis and characterization of hydrogel-based magnetite nanocomposite adsorbents for the potential removal of Acid Orange 10 dye and Cr(VI) ions from aqueous solution’, Int J Biol Macromol, vol. 227, pp. 27–44, Feb. 2023. [CrossRef]
- S. B. Mohamed Khalith et al., ‘Synthesis and characterization of magnetite carbon nanocomposite from agro waste as chromium adsorbent for effluent treatment’, Environ Res, vol. 202, Nov. 2021. [CrossRef]
- T. Sharma and J. S. Sangwai, ‘Silica nanofluids in polyacrylamide with and without surfactant: Viscosity, surface tension, and interfacial tension with liquid paraffin’, J Pet Sci Eng, vol. 152, no. September 2016, pp. 575–585, 2017. [CrossRef]
- H. Ma, M. Luo, and L. L. Dai, ‘Influences of surfactant and nanoparticle assembly on effective interfacial tensions’, Physical Chemistry Chemical Physics, vol. 10, no. 16, pp. 2207–2213, 2008. [CrossRef]
- E. Joonaki and S. Ghanaatian, ‘The application of nanofluids for enhanced oil recovery: Effects on interfacial tension and coreflooding process’, Pet Sci Technol, vol. 32, no. 21, pp. 2599–2607, 2014. [CrossRef]
- Luo, D., Wang, F., Zhu, J., Cao, F., Liu, Y., Li, X., Willson, R.C., Yang, Z., Chu, C.W., Ren, Z., 2016. Nanofluid of graphene- based amphiphilic Janus nanosheets for tertiary or enhanced oil recovery: high performance at low concentration. Proc. Natl. Acad. Sci. Unit. States Am. 113, 7711–7716. [CrossRef]
- Liang T., Hou J.R., M. Qu, J. X. Xi, and I. Raj, ‘Application of nanomaterial for enhanced oil recovery’, Petroleum Science, vol. 19, no. 2. China University of Petroleum Beijing, pp. 882–899, Apr. 01, 2022. [CrossRef]
- Radnia, H., Rashidi, A.M., Solaimany-Nazar, A.R., Eskandari, M.M., Jalilian, M., 2018. A novel nano-fluid based on sulfonated graphene for enhanced oil recovery. J. Mol. Liq. 271, 795e806. [CrossRef]
- Bjorndalen, N., Mustafiz, S., & Islam, M. (2003). Numerical modelling of petroleum fluids under microwave irradiation for improved horizontal well performance. Int Commun Heat Mass Transfer, 765-774. [CrossRef]
- Ishtiaq, U., Muhsan, A.S., Rozali, A.S. et al. Graphene oxide/carbon nanotubes nanocoating for improved scale inhibitor adsorption ability onto rock formation. J Petrol Explor Prod Technol 10, 149–157 (2020). [CrossRef]
|
Disclaimer/Publisher’s Note: The statements, opinions and data contained in all publications are solely those of the individual author(s) and contributor(s) and not of MDPI and/or the editor(s). MDPI and/or the editor(s) disclaim responsibility for any injury to people or property resulting from any ideas, methods, instructions or products referred to in the content. |
© 2024 by the authors. Licensee MDPI, Basel, Switzerland. This article is an open access article distributed under the terms and conditions of the Creative Commons Attribution (CC BY) license (http://creativecommons.org/licenses/by/4.0/).
