1. Introduction
Radiation combined injury (RCI) is a condition in which an individual is exposed to ionizing radiation along with another form of injury, such as physical trauma (e.g., burns or wounds), hemorrhage, or infection [
1,
2,
3,
4]. This condition is particularly concerning in situations like nuclear accidents or radiological disasters, where people may be exposed to radiation and also sustain injuries from blasts or fires [
3,
4]. Research indicates that around 60% of injuries in mass casualty incidents involving radiation are likely to be RCI [
3]. The coexistence of these injuries complicates treatment and significantly worsens the patient’s prognosis [
2,
3,
4]. Currently, there are no U.S. Food and Drug Administration (FDA)-approved treatments specifically for RCI.
Total body irradiation (TBI) combined with skin wound trauma represents a specific type of RCI that significantly hinders recovery due to delayed wound closure [
1,
2,
3,
5], subsequently increasing the risk of infection [
1,
3,
6]. We have developed an RCI model using B6D2F1/J mice (TBI followed by skin wound), providing an valuable tool for studying radiation combined skin wound injury [
1] and assessing potential MCMs [
2,
4,
6]. Radiation exposure directly damages endothelial cells, causing cell death and impaired function [
7]. Reduced nitric oxide (NO) production by injured endothelial cells causes blood vessel constriction, decreasing blood flow to irradiated tissue, which impairs oxygen delivery, slows healing, and may lead to organ failure [
8]. During the skin wound healing process, granulation tissue, which is rich in blood vessels, immune cells, and fibroblasts, is essential for wound closure [
9]. Endothelial dysfunction disrupts the angiogenesis required for granulation tissue formation, thereby slowing wound closure [
10]. These findings suggest that endothelial dysfunction is a key factor in both radiation injury and skin wounds individually.
In our previously study using mouse model of RCI, we found that oral administration of L-citrulline at 1 g/kg once daily for 21 days, starting 24 hours post-TBI, increased 30-day survival by 25% and significantly accelerated wound healing after 9.5 Gy RCI [
2]. Endothelial dysfunction, characterized by impaired production or bioavailability of NO [
11,
12], may be addressed by L-citrulline treatment, which enhances NO production [
13]. L-citrulline is converted to L-arginine in the kidneys and intestines, and L-arginine serves as a precursor for NO production by endothelial cells. This study suggested that endothelial dysfunction may play a role in RCI, particularly in the delayed wound healing observed following RCI. Furthermore, we demonstrated that RCI induces persistent proinflammatory responses, both systemically and locally [
1]. Since inflammation can trigger endothelial dysfunction [
14], our findings suggested that endothelial dysfunction may contribute to the effects of RCI. However, direct evidence linking endothelial dysfunction to the RCI-induced delay in wound healing remains elusive [
15]. In this study, using the same mouse model of RCI, we measured the biomarkers of endothelial dysfunction and inflammation in both serum and skin wounds on days 3, 7, and 14 after 9.0 Gy RCI. We also assessed the impaired wound healing at these time points.
3. Discussion
Endothelial dysfunction, characterized by impaired vascular function, has emerged as a key factor in various pathophysiological processes [
38], including delayed wound healing [
39]. This study investigated the complex relationship between endothelial dysfunction and delayed wound healing in the context of ionizing radiation combined with skin wound injury (RCI), with a focus on the underlying mechanisms. The findings provide direct evidence of more persistent and severe endothelial damage and inflammation, both systemically and locally, in RCI, leading to delayed wound healing in a radiation dose-dependent fashion, as shown in
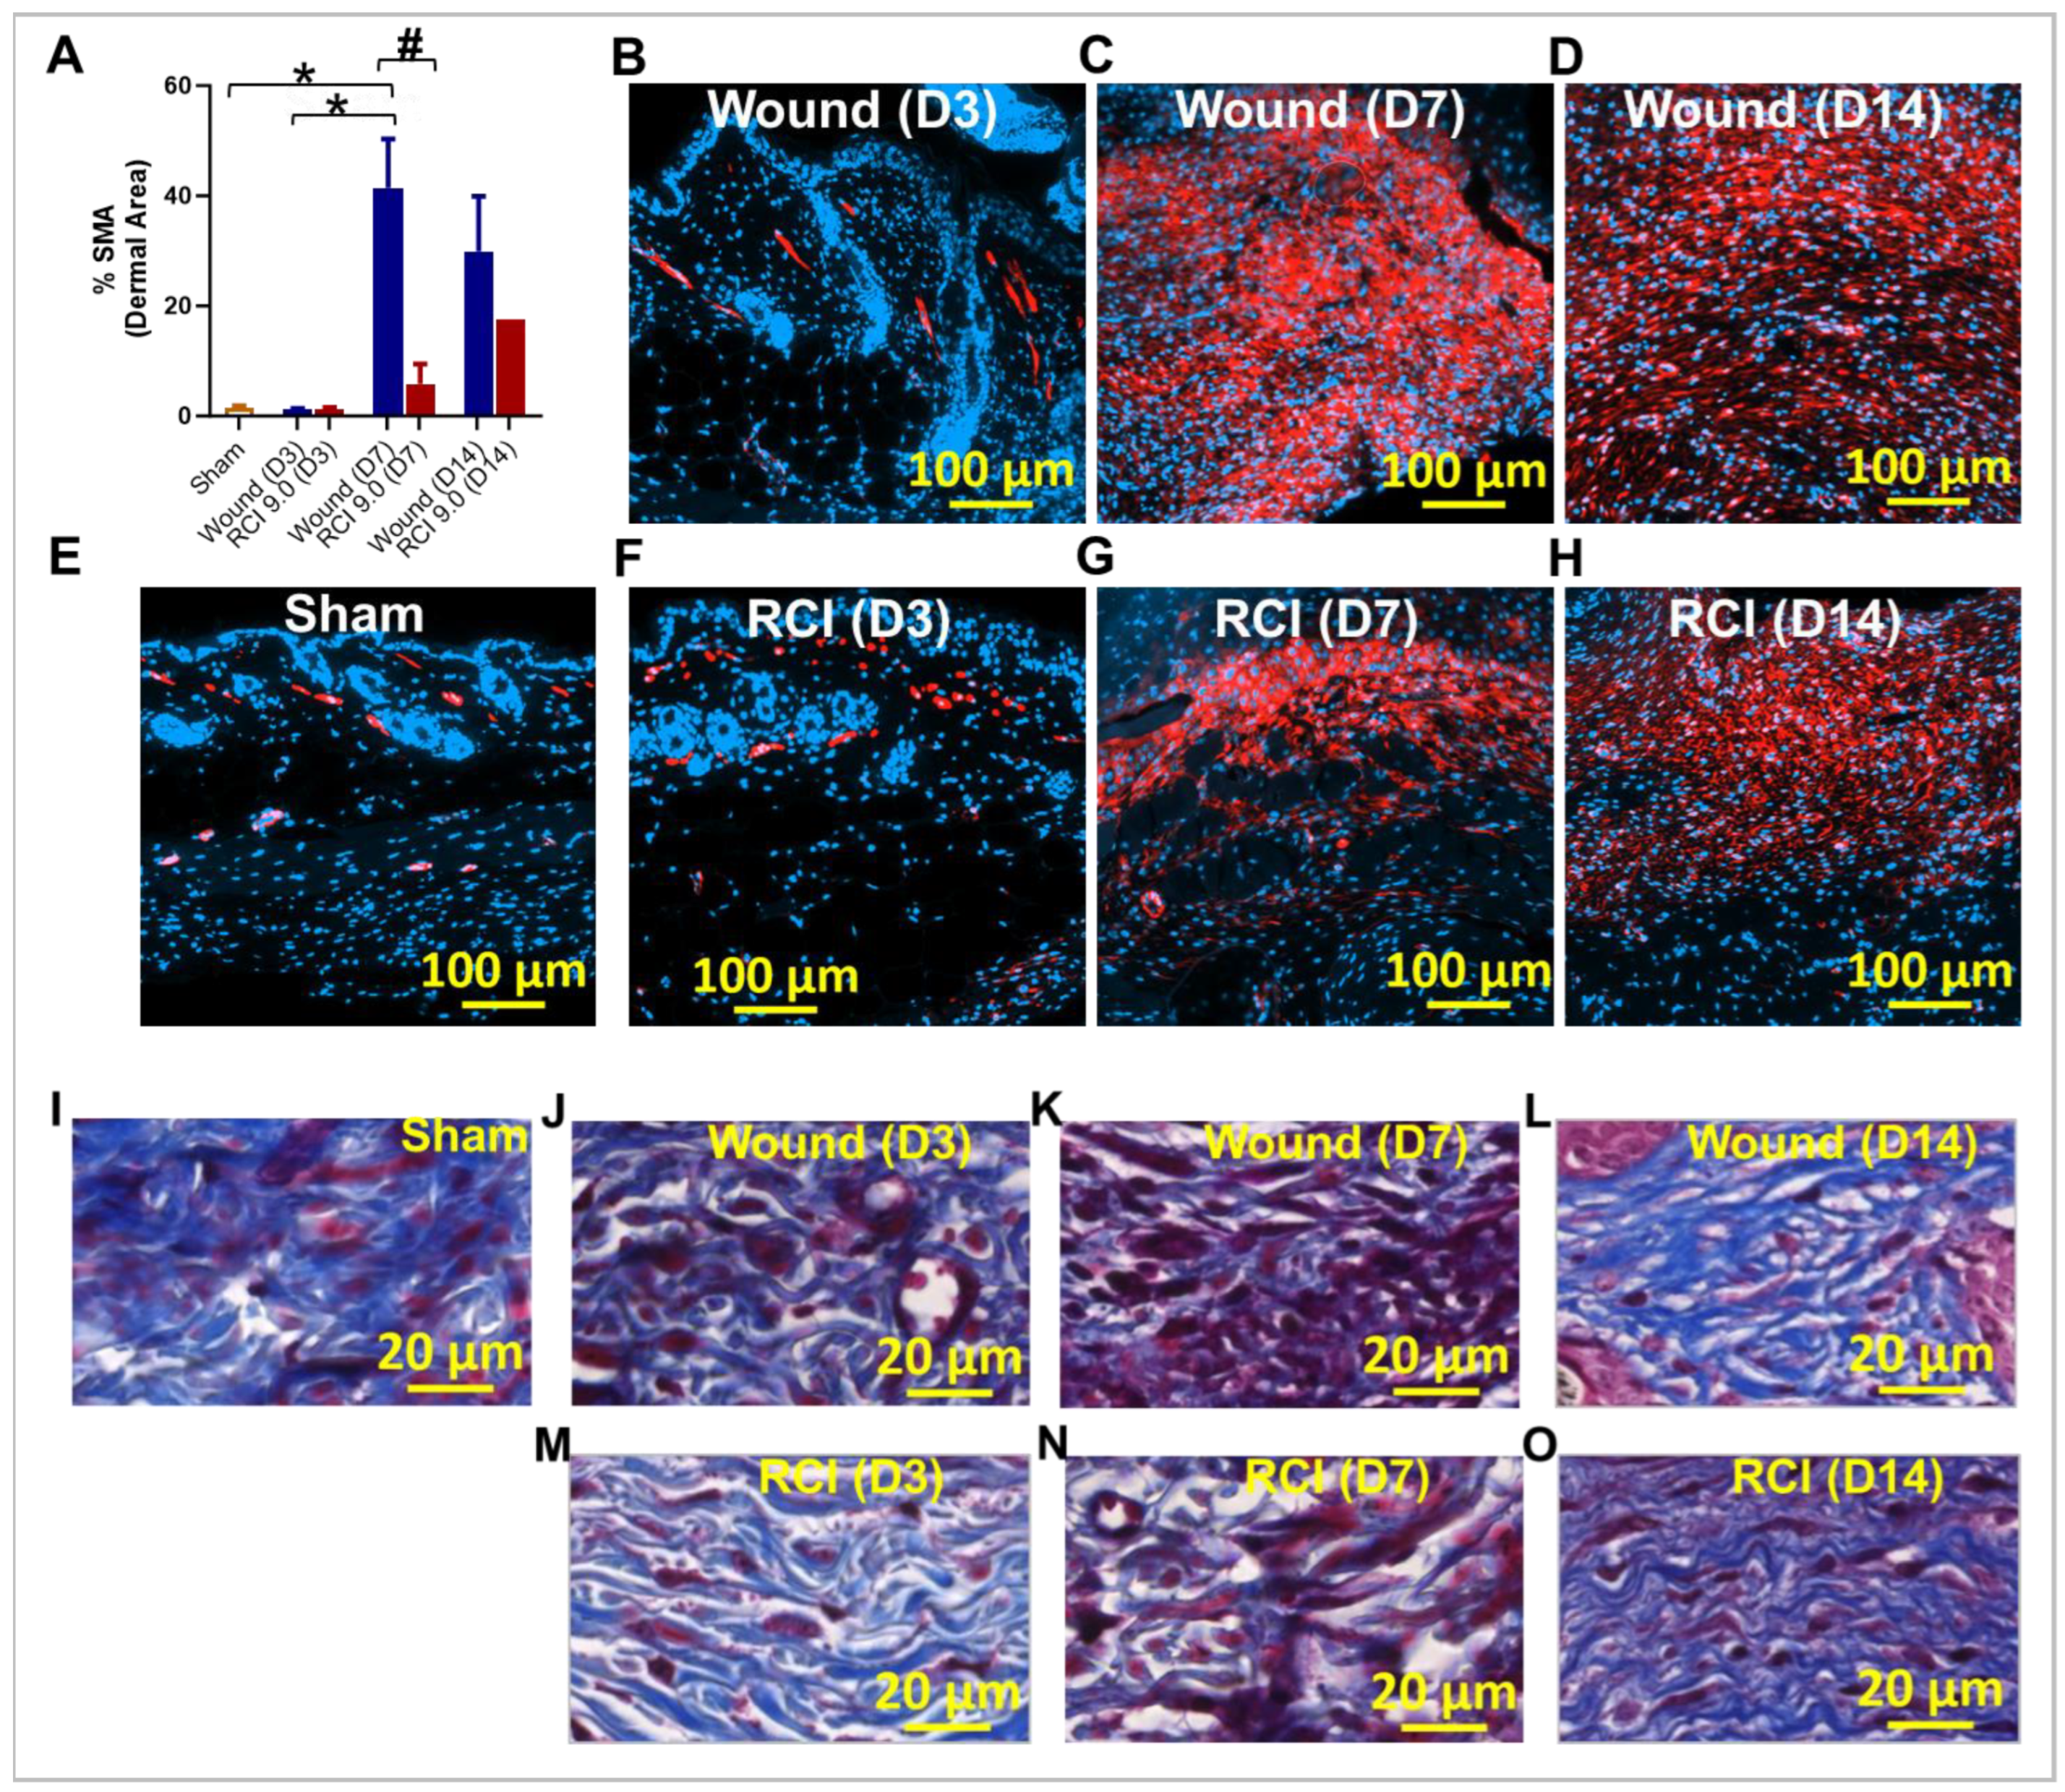
Figure 1B. In addition, the results suggest that, unlike skin wound-alone, RCI impairs granulation tissue formation, reduces myofibroblast presence, and delays collagen deposition, which corresponds with more severe endothelial damage in skin wounds. These findings support our hypothesis that RCI triggers endothelial dysfunction, contributing to delayed wound healing. The lack of FDA-approved MCMs for preventing, mitigating, or treating RCI is primarily due to a limited understanding of the mechanisms underlying its harmful effects. This study provides proof of principle that targeting endothelial dysfunction may be a viable strategy for preventing, mitigating, or treating RCI.
TGF-β signaling plays a critical role in regulating endothelial function [
40], suppressing inflammation [
41] and promoting ECM deposition [
42], all of which are essential for proper wound healing. Disruption of TGF-β signaling can result in endothelial dysfunction, impaired angiogenesis, and abnormal ECM remodeling, all contributing to delaying wound healing [
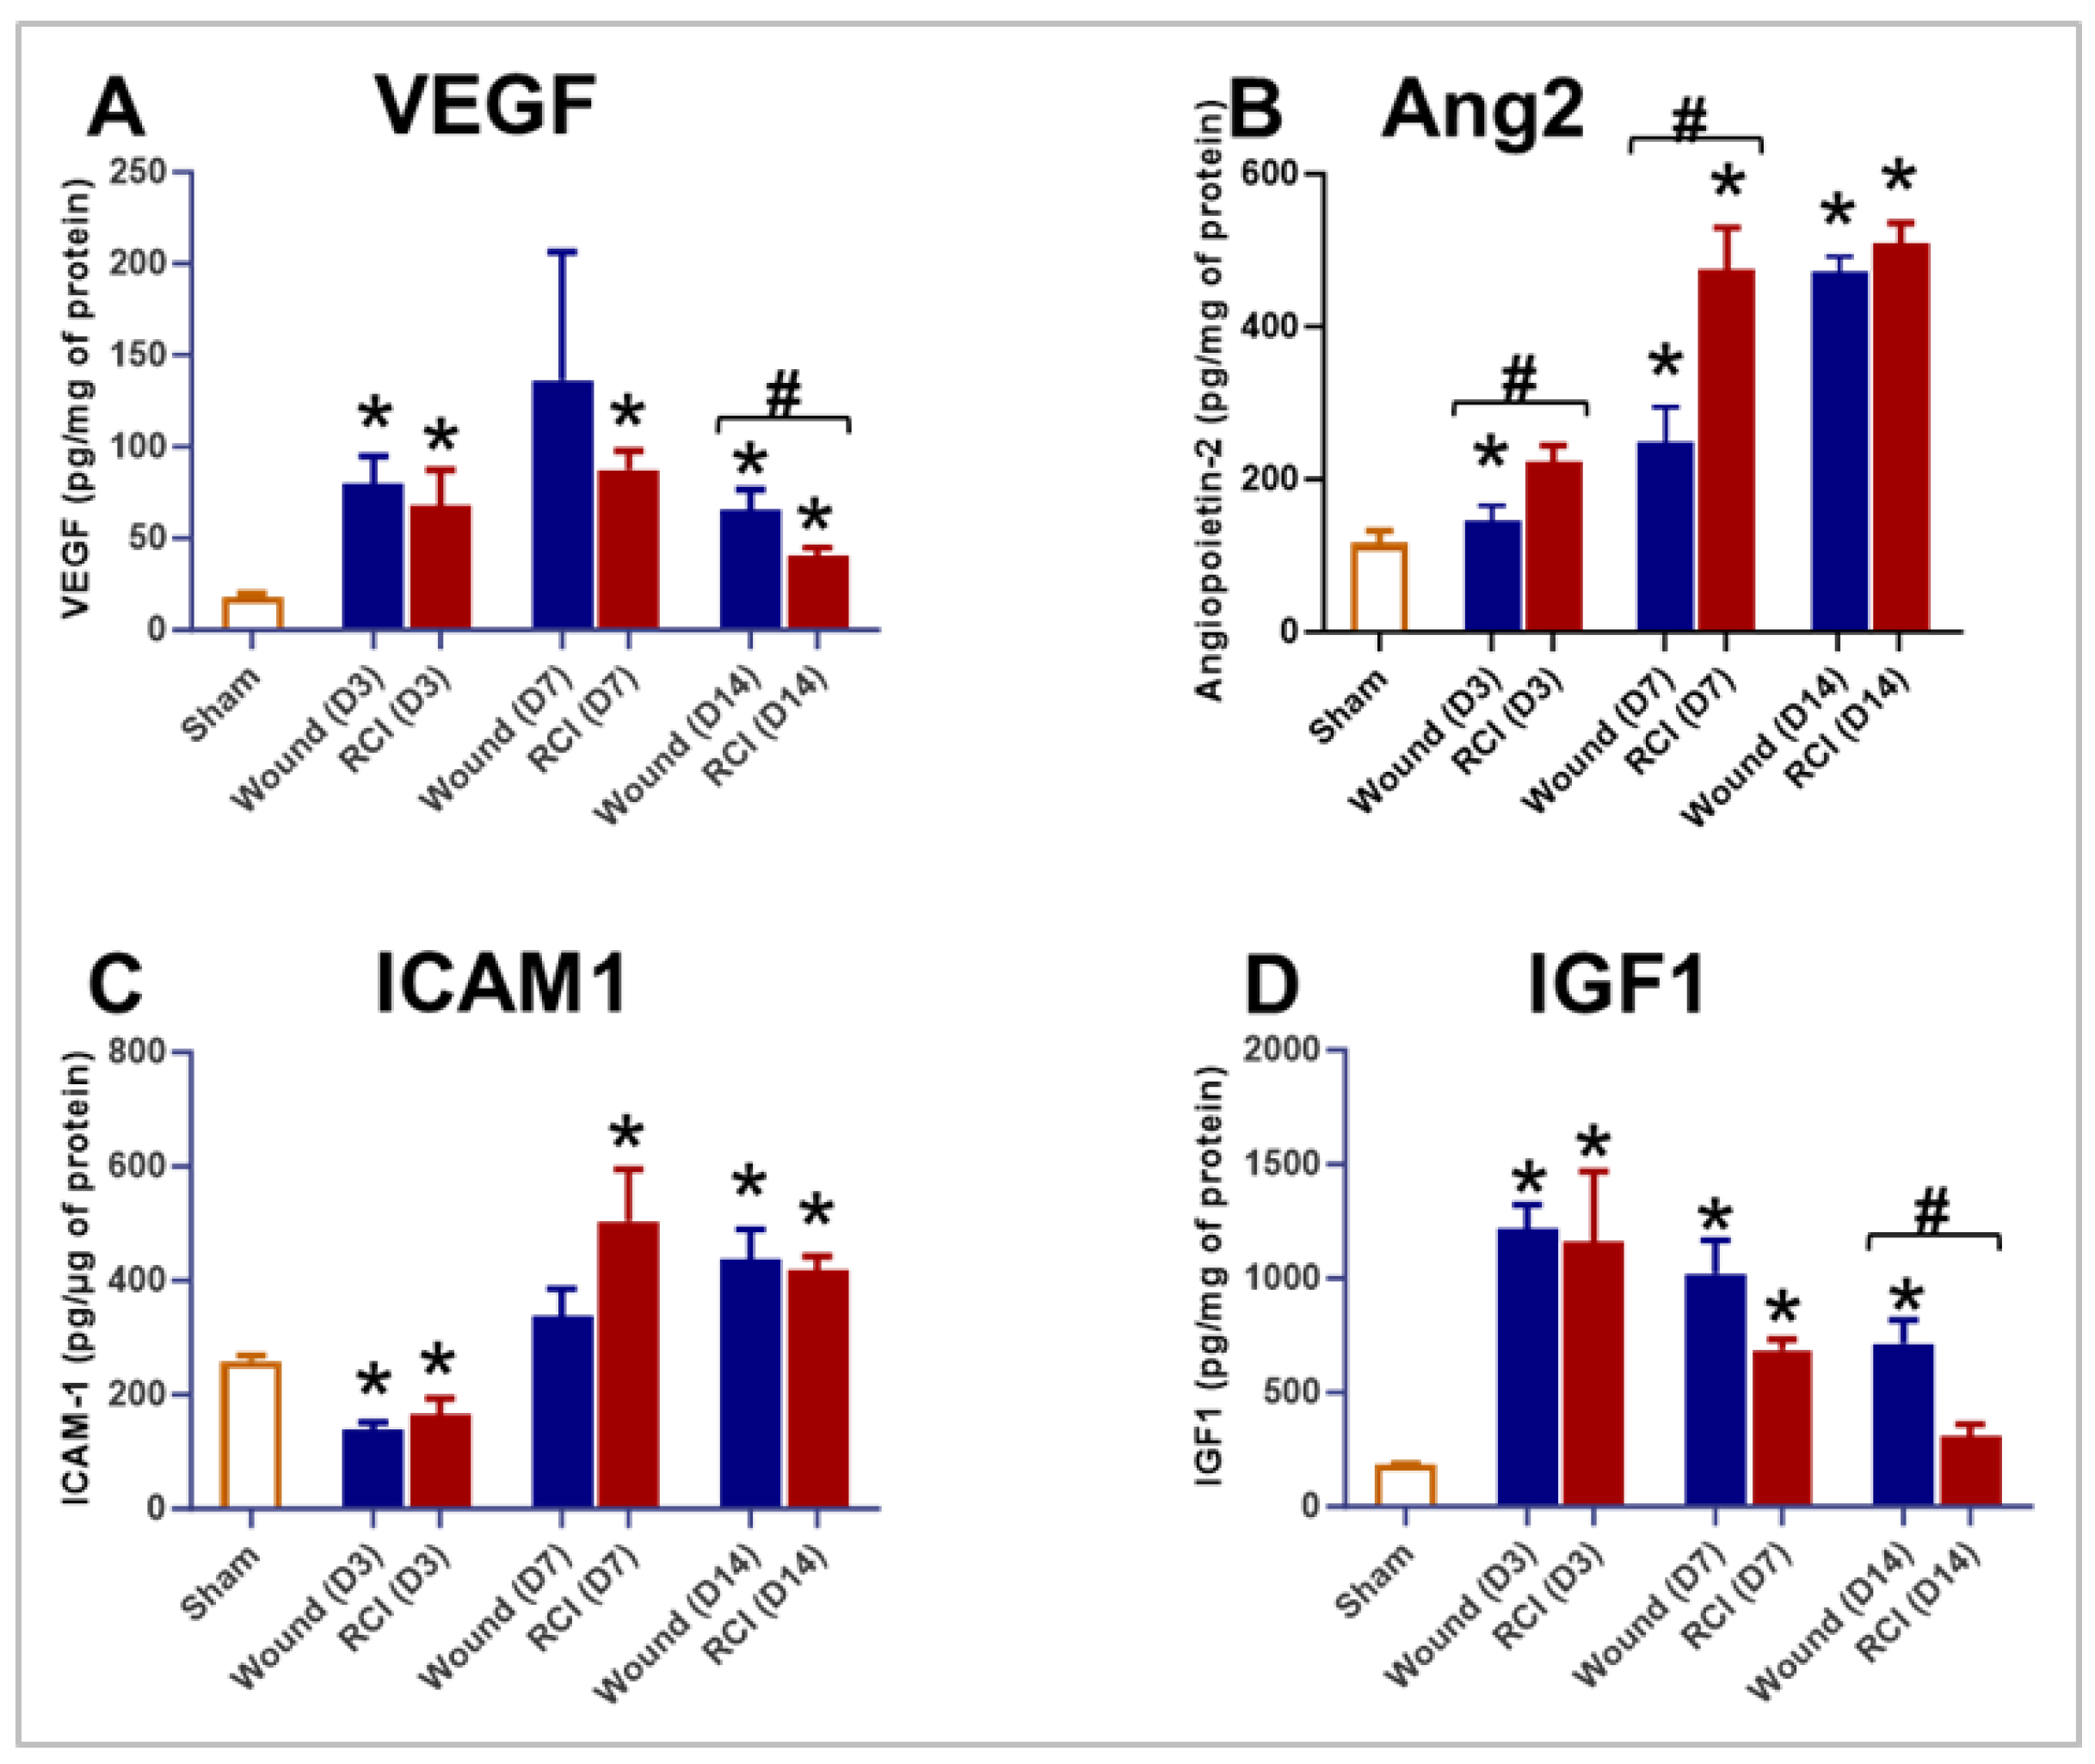
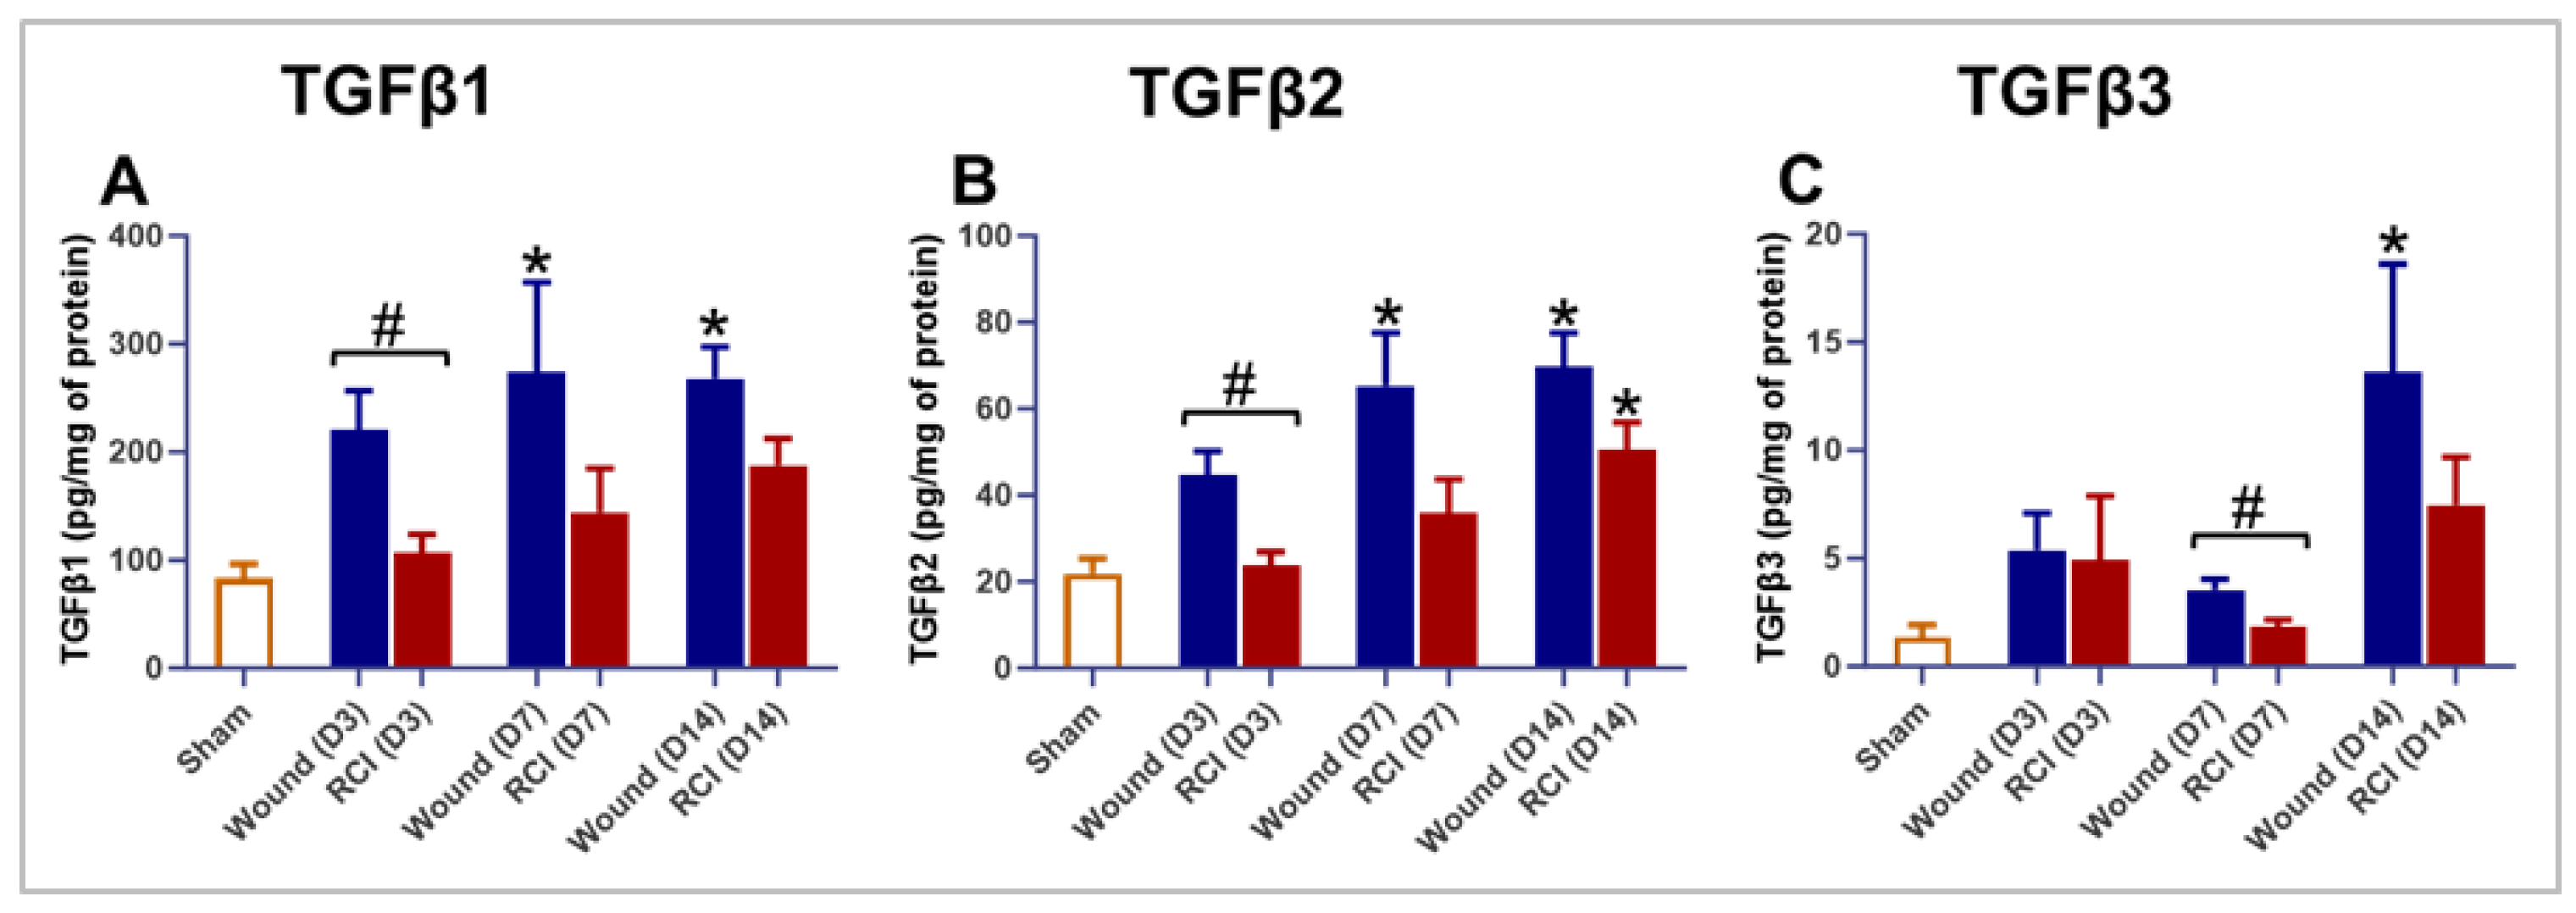
43]. In this study, we found that, compared to wounds alone, RCI suppressed TGF-β expression both systemically and locally during the inflammatory and proliferative phases of wound healing. This dysregulation of TGF-β expression in RCI resulted in reduced ECM production in skin wounds. Furthermore, RCI decreased VEGF and increased Ang2 in mouse skin samples (
Figure 5A and B). VEGF is a key factor in angiogenesis, necessary for delivering oxygen and nutrients to the wound site [
30]; a reduction in VEGF levels could result in inadequate blood supply to the wound, delaying granulation tissue formation, which is crucial for wound healing. Moreover, elevated Ang2 levels could destabilize blood vessels, making them more prone to leakage [
44]. Although Ang2 is involved in angiogenesis, excessive levels can disrupt the process, leading to impaired blood vessel formation [
44].
Previous studies have revealed that the systemic factors, such as TBI-induced hematopoietic suppression, impair wound healing by significantly reducing immune cell infiltration in skin wounds [
45]. Our group recently published a study demonstrating that delayed wound closure is not solely dependent on the extent of bone marrow damage but is significantly influenced by systemic inflammation and local factors induced by radiation [
1]. That finding was based on data collected from animals surviving 30 days after TBI [
1]. In the current study, we gathered data from earlier time points - days 3, 7, and 14 post-TBI and identified that, in addition to systemic inflammation, both systemic and local endothelial dysfunction influence wound healing after RCI. Furthermore, we provided compelling evidence that, although RCI significantly reduced NEU and MONO levels in circulation compared to the wound-alone, it did not affect the infiltration of NEU and Mϕ into the wounds.
While this study provides strong evidence linking the RCI to endothelial dysfunction and delayed wound healing, it is important to acknowledge that we did not conduct a comprehensive functional assessment of the endothelium and vasculature. Future studies could address this limitation by employing techniques like intravital microscopy or laser Doppler flowmetry to evaluate blood flow in the microcirculation [
46], which is critical for wound healing. Incorporating these functional assessments would provide a more complete understanding of the mechanisms underlying endothelial dysfunction and delayed wound healing in RCI.
Delayed skin wound healing in RCI can significantly affect outcomes, including survival [
1,
2]. Improperly healed skin wounds, as observed in RCI mice, are at a higher risk of infection and can lead to increased mortality [
1,
2]. By addressing this issue and investigating the role of TGF-β, this study may help identify potential therapeutic targets for treating delayed wound healing in RCI. In our future study, we will further explore the role of TGF-β signaling in RCI-induced delay in skin wound healing.
4. Materials and Methods
Mice and Ethics Statement
Female B6D2F1 mice (10 weeks old) were purchased from Jackson Laboratories (Bar Harbor, ME). Mice were housed, up to five per cage, in a controlled environment with a 12:12 hours light-dark cycle, room temperature of 23 ± 3ºC and humidity of 50 ± 20% within a facility accredited by the Association for Assessment and Accreditation of Laboratory Animal Care, International (AAALAC International) at the Uniformed Services University of the Health Sciences (USUHS) [
1,
2]. Acidified water (pH 2.5 - 3.0) and Teklad global rodent diet 8604 (Inotiv, West Lafayette, IN) were provided
ad libitum. Mice were acclimated for at least two weeks prior to initiation of experiments [
1,
2]. All animal manipulations were conducted in accordance with the USUHS guidelines and regulations as approved by the Institutional Animal Care and Use Committee (IACUC). USUHS IACUC Policy: Establishment of Humane Endpoints was implemented for judging morbidity and moribundity, especially during the critical period where increased morbidity and mortality is expected. During the critical period, the morbid mice were examined at least three times daily, early morning, afternoon and evening by the staff from the principal investigator group and the Department of Laboratory Animal Resources (DLAR), including weekends and holidays. Mice were considered moribund based on the following criteria: 1) Blue mucus membranes/skin; 2) Abdominal breathing (± gasping or open mouth breathing); 3) Inability to stand; 4) Does not right when placed on side within 5 seconds; 5) 35% or more body weight loss; 6) scored at 12 or more. Moribund animals were euthanized following the American Veterinary Medical Association (AVMA) guidelines [
1,
2].
Total-Body Irradiation
Fifteen minutes prior to total-body irradiation (TBI), all 13-14-week-old mice were placed in ventilated plexiglass containers, with four mice per container. A total of 40 mice were irradiated simultaneously without anesthesia [
1,
2]. In the RI and RCI groups, radiation was delivered to absorbed doses of 8.5 – 9.5 Gy at a rate of approximately 0.4 Gy/min from a bilateral radiation field at AFRRI’s 60-Cobalt facility. The dose rate, determined by the distance between the irradiators and animals, was measured using an alanine/electron spin resonance (ESR) dosimetry system with acrylic mouse phantoms (American Society for Testing and Materials, Standard E 1607; ASTI International, Philadelphia, PA) [
1,
2]. Mice in sham and wound-alone groups were sham-irradiated and manipulated similarly to those in the RCI group but remained in the cobalt staging room.
Skin Wounding
To prepare for skin wounding, the dorsal fur was shaved using an electric hair clipper under isoflurane anesthesia three days before TBI [
1,
2]. Within 1–2 h after TBI, a circular-like wound (200–300-mm
2) was created in mice from the wound-alone and RCI groups under isoflurane anesthesia, using a 70% ethanol-sterilized steel punch on the skin fold between the shoulder blades [
1,
2]. After wounding, mice were placed in autoclaved clean cages with ALPHA-dri bedding (Product# ALPHADRI, Lab Supply), and the wounds were left open to the environment. All mice subjected to skin injury were then intraperitoneally (i.p.) administered 0.5 ml of acetaminophen solution (150 mg/kg in saline; Acetaminophen injection: NDC 63323, Fresenius Kabi, Lake Zurich, IL) immediately after injury to alleviate pain [
1,
2]. As a control, 0.5 ml of saline was also i.p administered to groups that received sham irradiation or TBI alone.
Thirty-Day Survival
Mice in the RI and RCI groups were monitored 2-3 times per day for 30 days by investigators and vivarium staff [
1,
2]. During the critical period of expected mortality (days 10-20 post-TBI), mice were examined three times daily. Moribund mice were euthanized according to USUHS IACUC-approved scoring criteria for establishing early end points in a mouse TBI model [
1,
2]. Euthanasia was performed by CO
2 inhalation, followed by confirmatory cervical dislocation. Time-to-death data were recorded, Kaplan-Meier survival curves were plotted, and survival probabilities were calculated at the day 30 post-TBI time point.
Body Weight and Wound Size Measurement
Body weight was measured on days 0 (immediately after TBI), 1, 3, 7, 10, 14, 17, 21, 24, and 28 post-TBI [
1,
2]. The percentage of body weight (body weight %) was calculated using the formula: body weight % = 100% * (body weight on day X / body weight on day 0), where “body weight on day X” refers to measurements taken on days 1, 3, 7, 10, 14, 17, 21, 24, or 28 post-TBI, and “body weight on day 0” refers to the basal body weight.
Wound size was measured using digital caliper on days 1, 3, 7, 10, 14, 17, 21, 24, and 28 post-TBI. The average wound area was calculated using the formula: Wound area = π * (A/2) * (B/2), where A and B represent diameters at right angles to each other [
1,
2]. The percentage of wound closure (% wound closure) was calculated as: % wound closure = 100% * [1 - (wound area on day X / wound area on day 1)]. Here, “wound area on day X” refers to measurements taken on days 3, 7, 10, 14, 17, 21, 24, or 28 post-TBI, and “wound area on day 1” refers to the basal wound area. A 100% wound closure indicates a fully closed wound.
Blood and Tissue Collection, Peripheral Blood Cell Count, and Serum Preparation
At specified time points, days 3, 7, and 14 post-9.0 Gy RCI, blood was drawn under anesthesia (3% isoflurane, 97% O
2) via cardiac puncture. A volume of 30 - 50 µL of blood was collected into a microtube containing EDTA for peripheral blood cell count, while the remaining blood was collected into a microtube with a serum separator additive for serum preparation [
1,
2]. Following blood draw, euthanasia was performed via cervical dislocation. Skin tissue around the wounds was then collected and divided into two pieces. One half was fixed in 10% formalin for histological examination, while the other half was snap frozen in liquid nitrogen for enzyme-linked immunosorbent assay (ELISA) analysis.
Whole blood samples in EDTA-containing microtube were analyzed for complete blood count with differential using a clinical hematoanalyzer (Element HT5; Heska, Loveland, CO) following the manufacturer’s instructions. For blood collected in serum separating tubes, sera were obtained after centrifugation at 10,000g for 10 min, following 30 – 120 minutes of coagulation at room temperature [
1,
2]. Sera were immediately aliquoted and stored at – 80ºC for ELISA analysis.
Skin Tissue Lysate Preparation
To prepare skin tissue lysates, frozen skin tissue was washed in ice-cold PBS, and then homogenized in ice-cold PBS containing 10 mM N-Ethylmaleimide (NEM, Cat# E3876, Sigma, Saint Louis, MO) and 1x Halt
TM Protease & Phosphatase inhibitor (Cat# 1862495, Thermo Scientific, Rockford, IL) [
1]. This was done using a bead lysis kit (Cat# GREENE5, Next Advance, Troy, NY) and a Bullet Blender (Storm 24, Next Advance, Troy, NY) according to the manufacturer’s instructions. After homogenization, supernatant-1 was collected by centrifugation at 13,000g for 20 min at 4ºC. The remaining pellet was resuspended in ice-cold PBS containing 0.5% (w/v) Hexadecyltrimethylammonium bromide (HTA-Br, Cat# H5882, Sigma, Saint Louis, MO) and 1x Halt
TM Protease & Phosphatase inhibitor, and then homogenized again using the same Bullet Blender [
1]. Supernatant-2 collected after this second round of centrifugation was mixed with supernatant-1. The protein concentration in the skin tissue lysate was measured using the Pierce
TM BAC protein assay kit (REF# 23225, Thermo Scientific, Rockford, IL) according to the manufacturer’s instructions.
N-Acetylglucosaminidase Activity and Myeloperoxidase Activity Assays
β-NAG Activity and MPO activity in skin tissue lysates were measured using the N-Acetylglucosaminidase Activity Assay Kit (Colorimetric, Cat# ab204705, abcam, Waltham, MA) and the Myeloperoxidase Activity Assay Kit (Colorimetric, Cat# ab105136, abcam, Waltham, MA), respectively, according to the manufacturer’s instructions.
Enzyme-Linked Immunosorbent Assay
Following the manufacturer’s instructions, the serum and/or skin tissue levels of the following factors were determined by ELISA: VEGF, Ang-1, Ang-2, IGF-1, ICAM-1; TNF-α, CXCL1/KC, TGFβ1, TGFβ2, TGFβ3, CTGF, and fibronectin. The kits used were as follows: Mouse VEGF Immunoassay (MMV00-1, R&D Systems, Inc., Minneapolis, MN), Mouse Angiopoietin-1 ELISA Kit (Colorimetric, NBP3-18634, Novus Biologicals, Centennial CO), Mouse/Rat Angiopoietin-2 Immunoassay (MANG20, R&D Systems, Inc., Minneapolis, MN), Mouse/Rat IGF-I/IGF-1 Immunoassay (MG100, R&D Systems, Inc., Minneapolis, MN), ICAM1 (CD54) Mouse ELISA Kit (ab100688, abcam, Waltham, MA), Mouse TNF-α Immunoassay (MTA00B-1, R&D Systems, Inc., Minneapolis, MN), Mouse CXCL1/KC Immunoassay (MKC00B-1, R&D Systems, Inc., Minneapolis, MN), Bio-Plex ProTM TGF-β 3-plex assay (171W4001M, Bio-Rad Laboratories, Inc., Hercules, CA), Mouse CTGF ELISA Kit (ab289838, abcam, Waltham, CA), and Mouse Fibronectin ELISA Kit (NBP2-60517, Novus Biologicals, Centennial CO).
Histological Examination of Skin
Skin tissue around the wounds was immediately fixed in 10% formalin for 24-26 hours, washed three times with PBS, and then stored in 70% ethanol at room temperature [
1,
2]. For histological examination, the tissue was dehydrated, embedded in paraffin, and sectioned into 5-µm-thick cross sections [
1,
2]. The gross morphology of the wounds was assessed using H&E staining [
1,
2]. To evaluate the presence of the myofibroblasts in the skin wounds, the expression levels of α-SMA, a marker of myofibroblast, were determined by IHC staining on formalin-fixed and paraffin-embedded sections. Briefly, sections were incubated overnight at 4 ºC with rabbit anti- α-SMA (1:500 dilution, Cat# 124964, abcam, Waltham, MA). Following extensive washes with PBS, sections were incubated for one hour at RT with Goat anti-Rabbit IgG (H+L) Cross-Adsorbed Secondary Antibody, Alexa Fluor™ 568 (1:200 dilution, Cat# A-11011, Invitrogen, Carlsbad, CA) and mounted with ProLong™ Glass Antifade Mountant with NucBlue™ Stain (Cat# P36981, Invitrogen, Carlsbad, CA) [
1]. To detect collagen fibers in mouse skin, formalin-fixed and paraffin-embedded sections were stained with Masson's Trichrome Stain Kit (Cat# 25088-1, Polysciences, Warrington, PA) following the manufacturer’s instruction, where collagen fibers were stained blue, nuclei black, and cytoplasm, muscle, erythrocytes red. Both bright-field and fluorescent images were acquired using the Zeiss Axioscan.Z1 and analyzed with Zeiss Zen 2.5 (blue edition) (Carl Zeiss AG, Oberkochen, Germany) [
1].
Statistical Analysis
We employed a probit regression model within IBM SPSS Statistics (Armonk, NY) to evaluate the relationship between radiation dose and mortality probability, yielding LD10/30 to LD90/30 values for both RI and RCI [
47]. Other data were analyzed using GraphPad Prism 10 (version 10.2.3, San Diego, CA) [
1,
2]. For 30-day survival, Log-rank (Mantel-Cox) test was used to compare Kaplan-Meier survival curves [
1,
2]. For non-survival data, results were expressed as mean ± standard error of the mean (SEM). Differences among/between groups were analyzed using either one-way or two-way analysis of variance (ANOVA), followed by Dunnett’s, Sidak’s, or Tukey’s multiple comparisons, or an unpaired two-way t-test [
1,
2]. A p-value of less than 0.05 was considered statistically significant.
Author Contributions
Conceptualization, L.W. and M.X.; methodology, L.W., B.L., M.Z., L.H., W.C., M.X.; formal analysis, L.W., B.L., M.Z; investigation, L.W., B.L., M.Z., L.H., W.C., M.X.; writing—original draft preparation, L.W.; writing—review and editing, L.W. and M.X.; supervision, L.W. and M.X.; project administration, L.W. and M.X.; funding acquisition, L.W. and M.X. All authors have read and agreed to the published version of the manuscript.
Figure 1.
Effect of Different Radiation Doses on Mouse Survival, Wound Healing, and Body Weight Loss Following Skin Wound Alone, RI and RCI. Mice in both the RI and RCI groups were exposed to varying radiation doses: 8.5 Gy, 8.85 Gy, 9.25 Gy, and 9.5 Gy. (Panel A) Radiation dose response curves for RI mice (blue) and RCI mice (red) are shown. The LD50/30 (the radiation dose expected to cause lethality to 50% of an exposed population within 30 days) was determined using probit analysis. For RI mice, the LD50/30 is 9.47 Gy (95% confidence interval: 9.31-9.70 Gy), while for RCI mice, the LD50/30 is 9.28 Gy (95% confidence interval: 9.13-9.46 Gy). (Panel B) The delay in skin wound healing was observed in a dose-dependent manner: wound-alone (dashed line, bronze); 8.5 Gy RCI (solid line, blue); 8.85 Gy RCI (solid line, red); 9.25 Gy RCI (solid line, green); and 9.5 Gy RCI (solid line, purple). Significant differences in wound healing were observed: *p < 0.05 for wound-alone vs 8.5 Gy RCI; #p < 0.05 for wound-alone vs 8.85 Gy RCI; ^p < 0.05 for wound-alone vs 9.25 Gy RCI; $p < 0.05 for wound-alone vs 9.5 Gy RCI, determined by two-way ANOVA followed by Dunnett’s multiple comparisons test. The sample size ranged from N = 7 to 20 per group per time point. (Panel C-F) RCI mice showed more body weight loss compared to RI mice across all tested doses: 8.5 Gy, 8.85 Gy, 9.25 Gy, and 9.5 Gy (RI: blue; RCI: red); Significant differences in weight loss were observed (*p < 0.05 for RI vs RCI), determined by two-way ANOVA followed by Sidak’s multiple comparisons test. The sample size ranged from N = 7 to 20 per group per time point. Data in panel B to panel F are expressed as mean ± standard error of the mean (SEM).
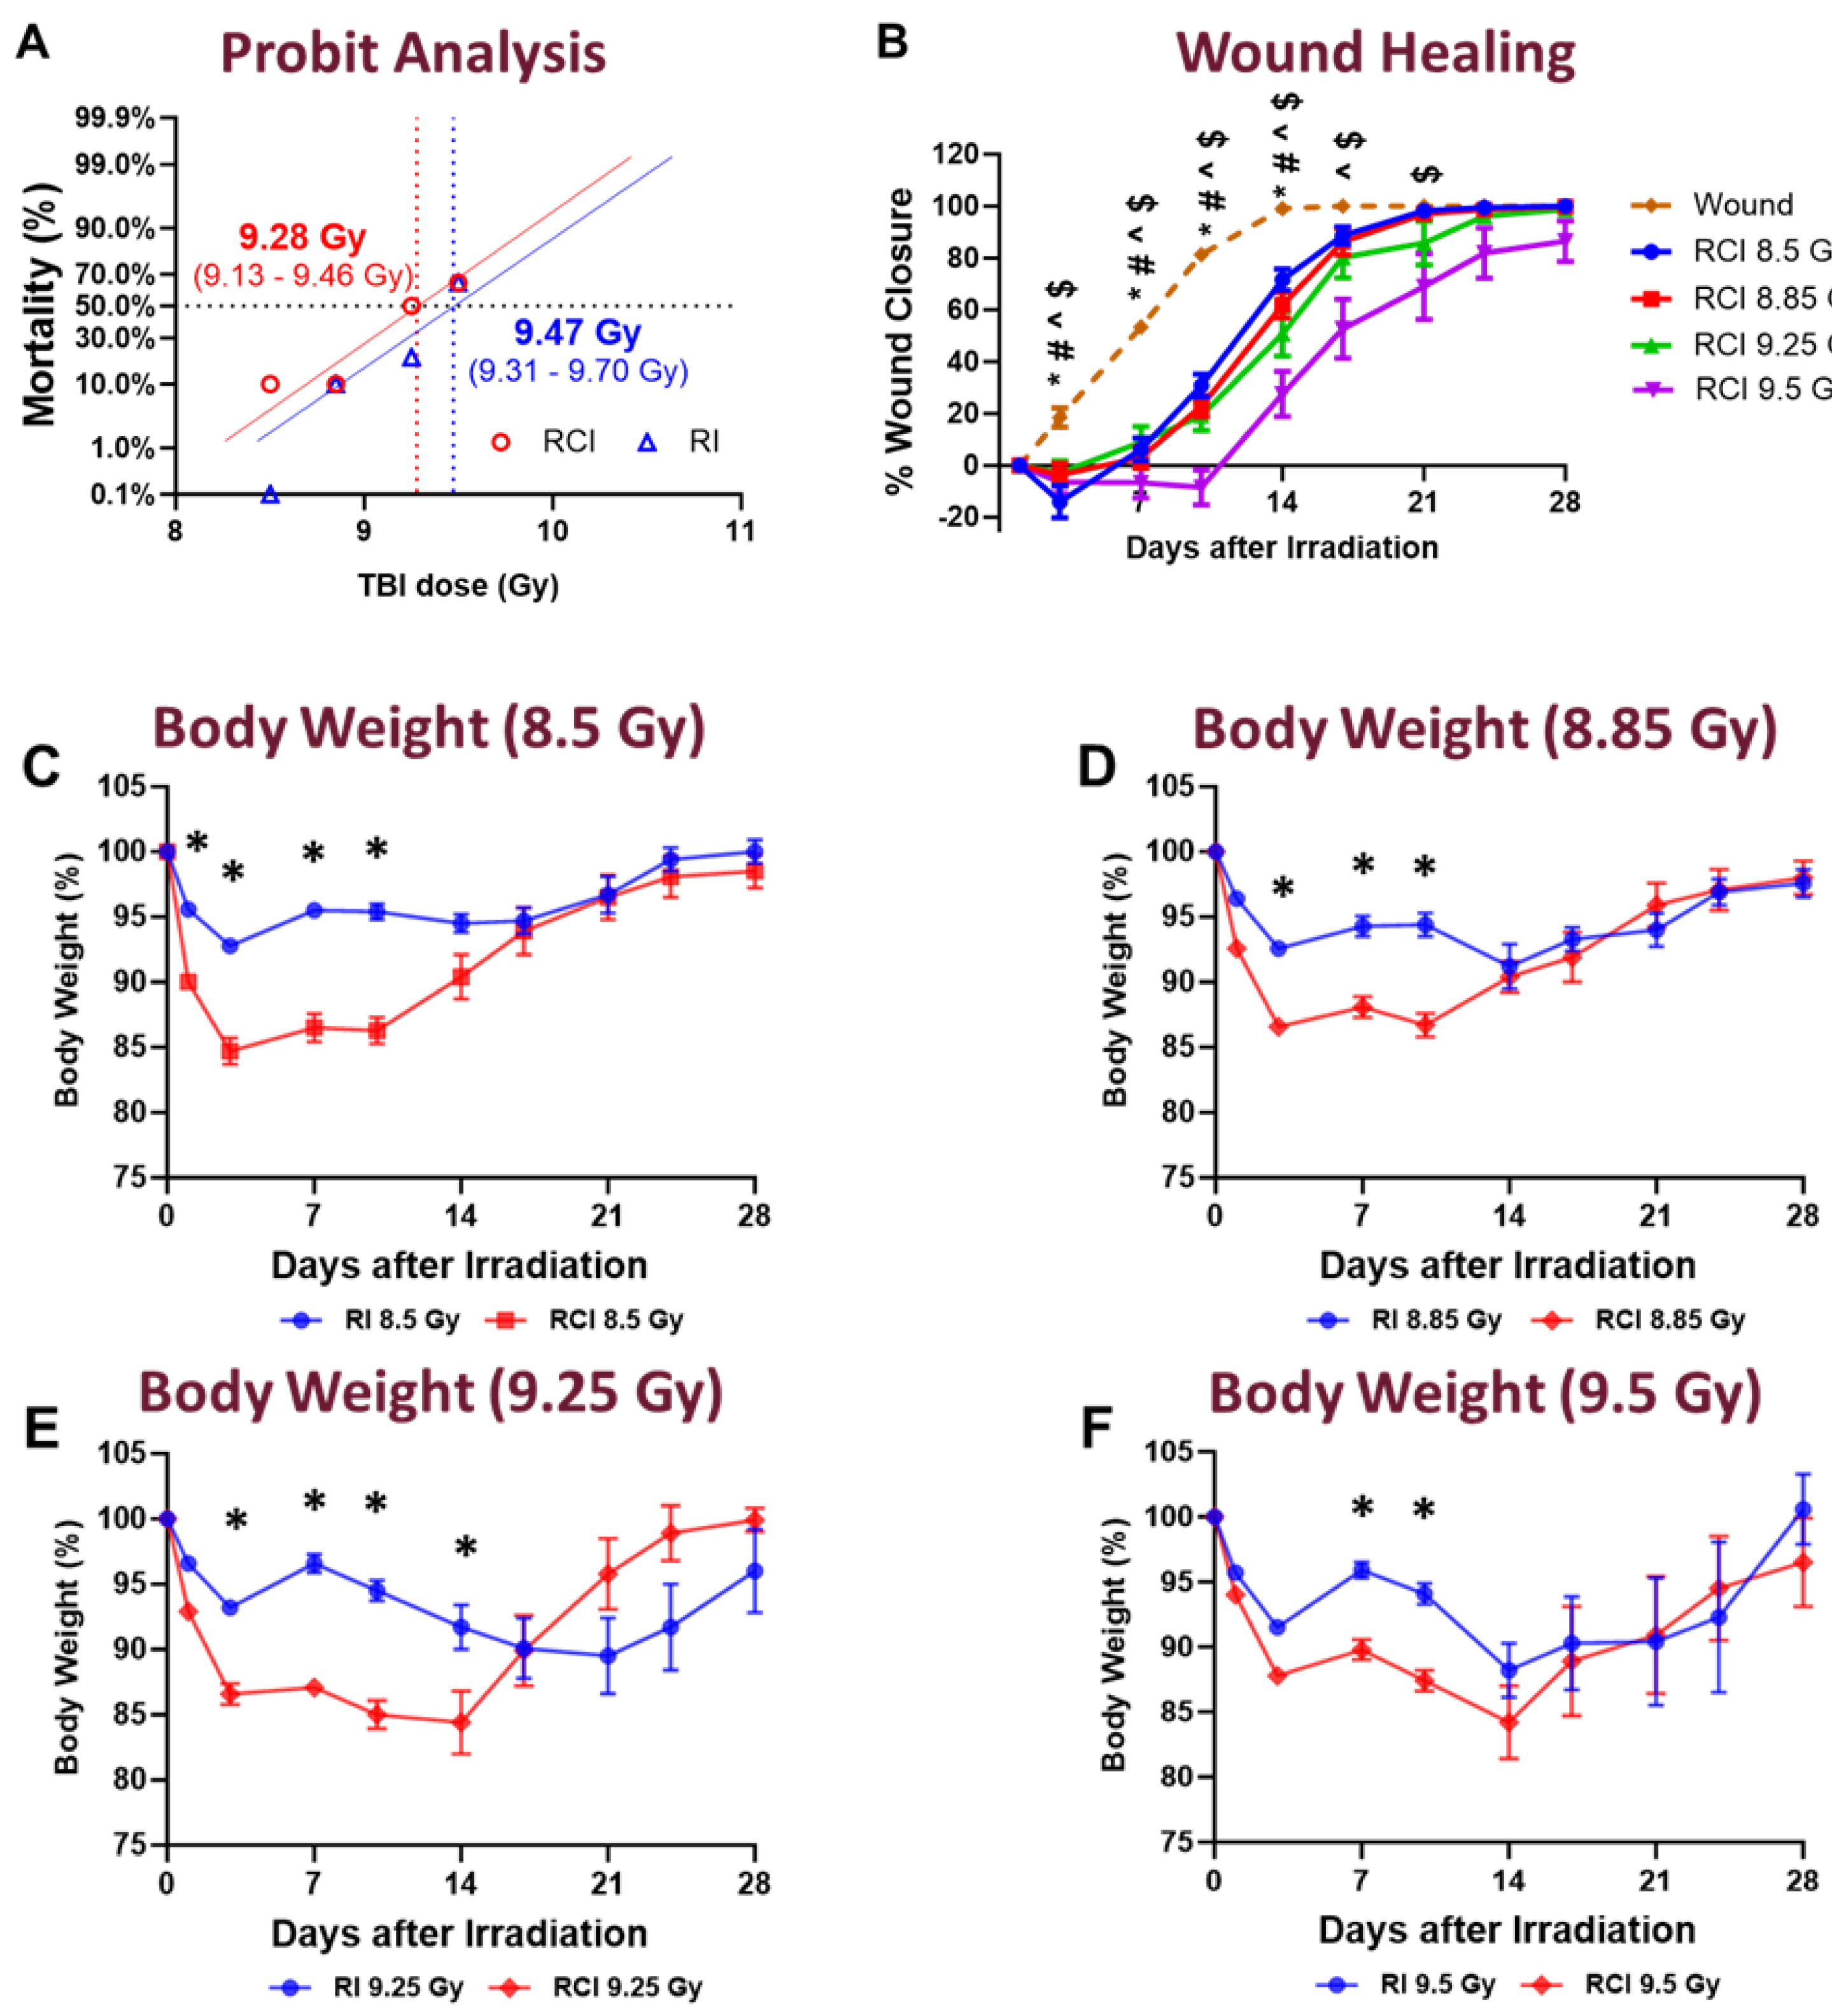
Figure 2.
Effect of RCI on Serum Markers Associated with Endothelial Dysfunction and Inflammation. Mice were subjected to sham injury, wound-alone, and 9.0 Gy RCI, and sera were collected on days 3, 7, and 14 post-injury. Various markers associated with endothelial dysfunction and inflammation were assessed using ELISA. The markers analyzed include: (Panel A) vascular endothelial growth factor (VEGF); (Panel B) Angiopoietin-1 (Ang1); (Panel C) Angiopoietin-2 (Ang2); (Panel D) insulin-like growth factor 1 (IGF1); (Panel E) tumor necrosis factor alpha (TNFα); (Panel F) keratinocyte-derived cytokine (KC, also known as CXCL-1); (Panel G) transforming growth factor-beta 1 (TGFβ1); (Panel H) TGFβ2; and (Panel I) TGFβ3. Data are expressed as mean ± SEM. Significant differences in the mentioned markers were observed: *p < 0.05 for Sham vs Wound/RCI on days 3, 7, and 14 post-injury, determined by one-way ANOVA followed by Dunnett’s multiple comparisons test; #p < 0.05 for Wound vs RCI at the same time point, determined by two-way ANOVA followed by Sidak’s multiple comparisons test. The sample size ranged from N = 3 to 9 per group per time point.
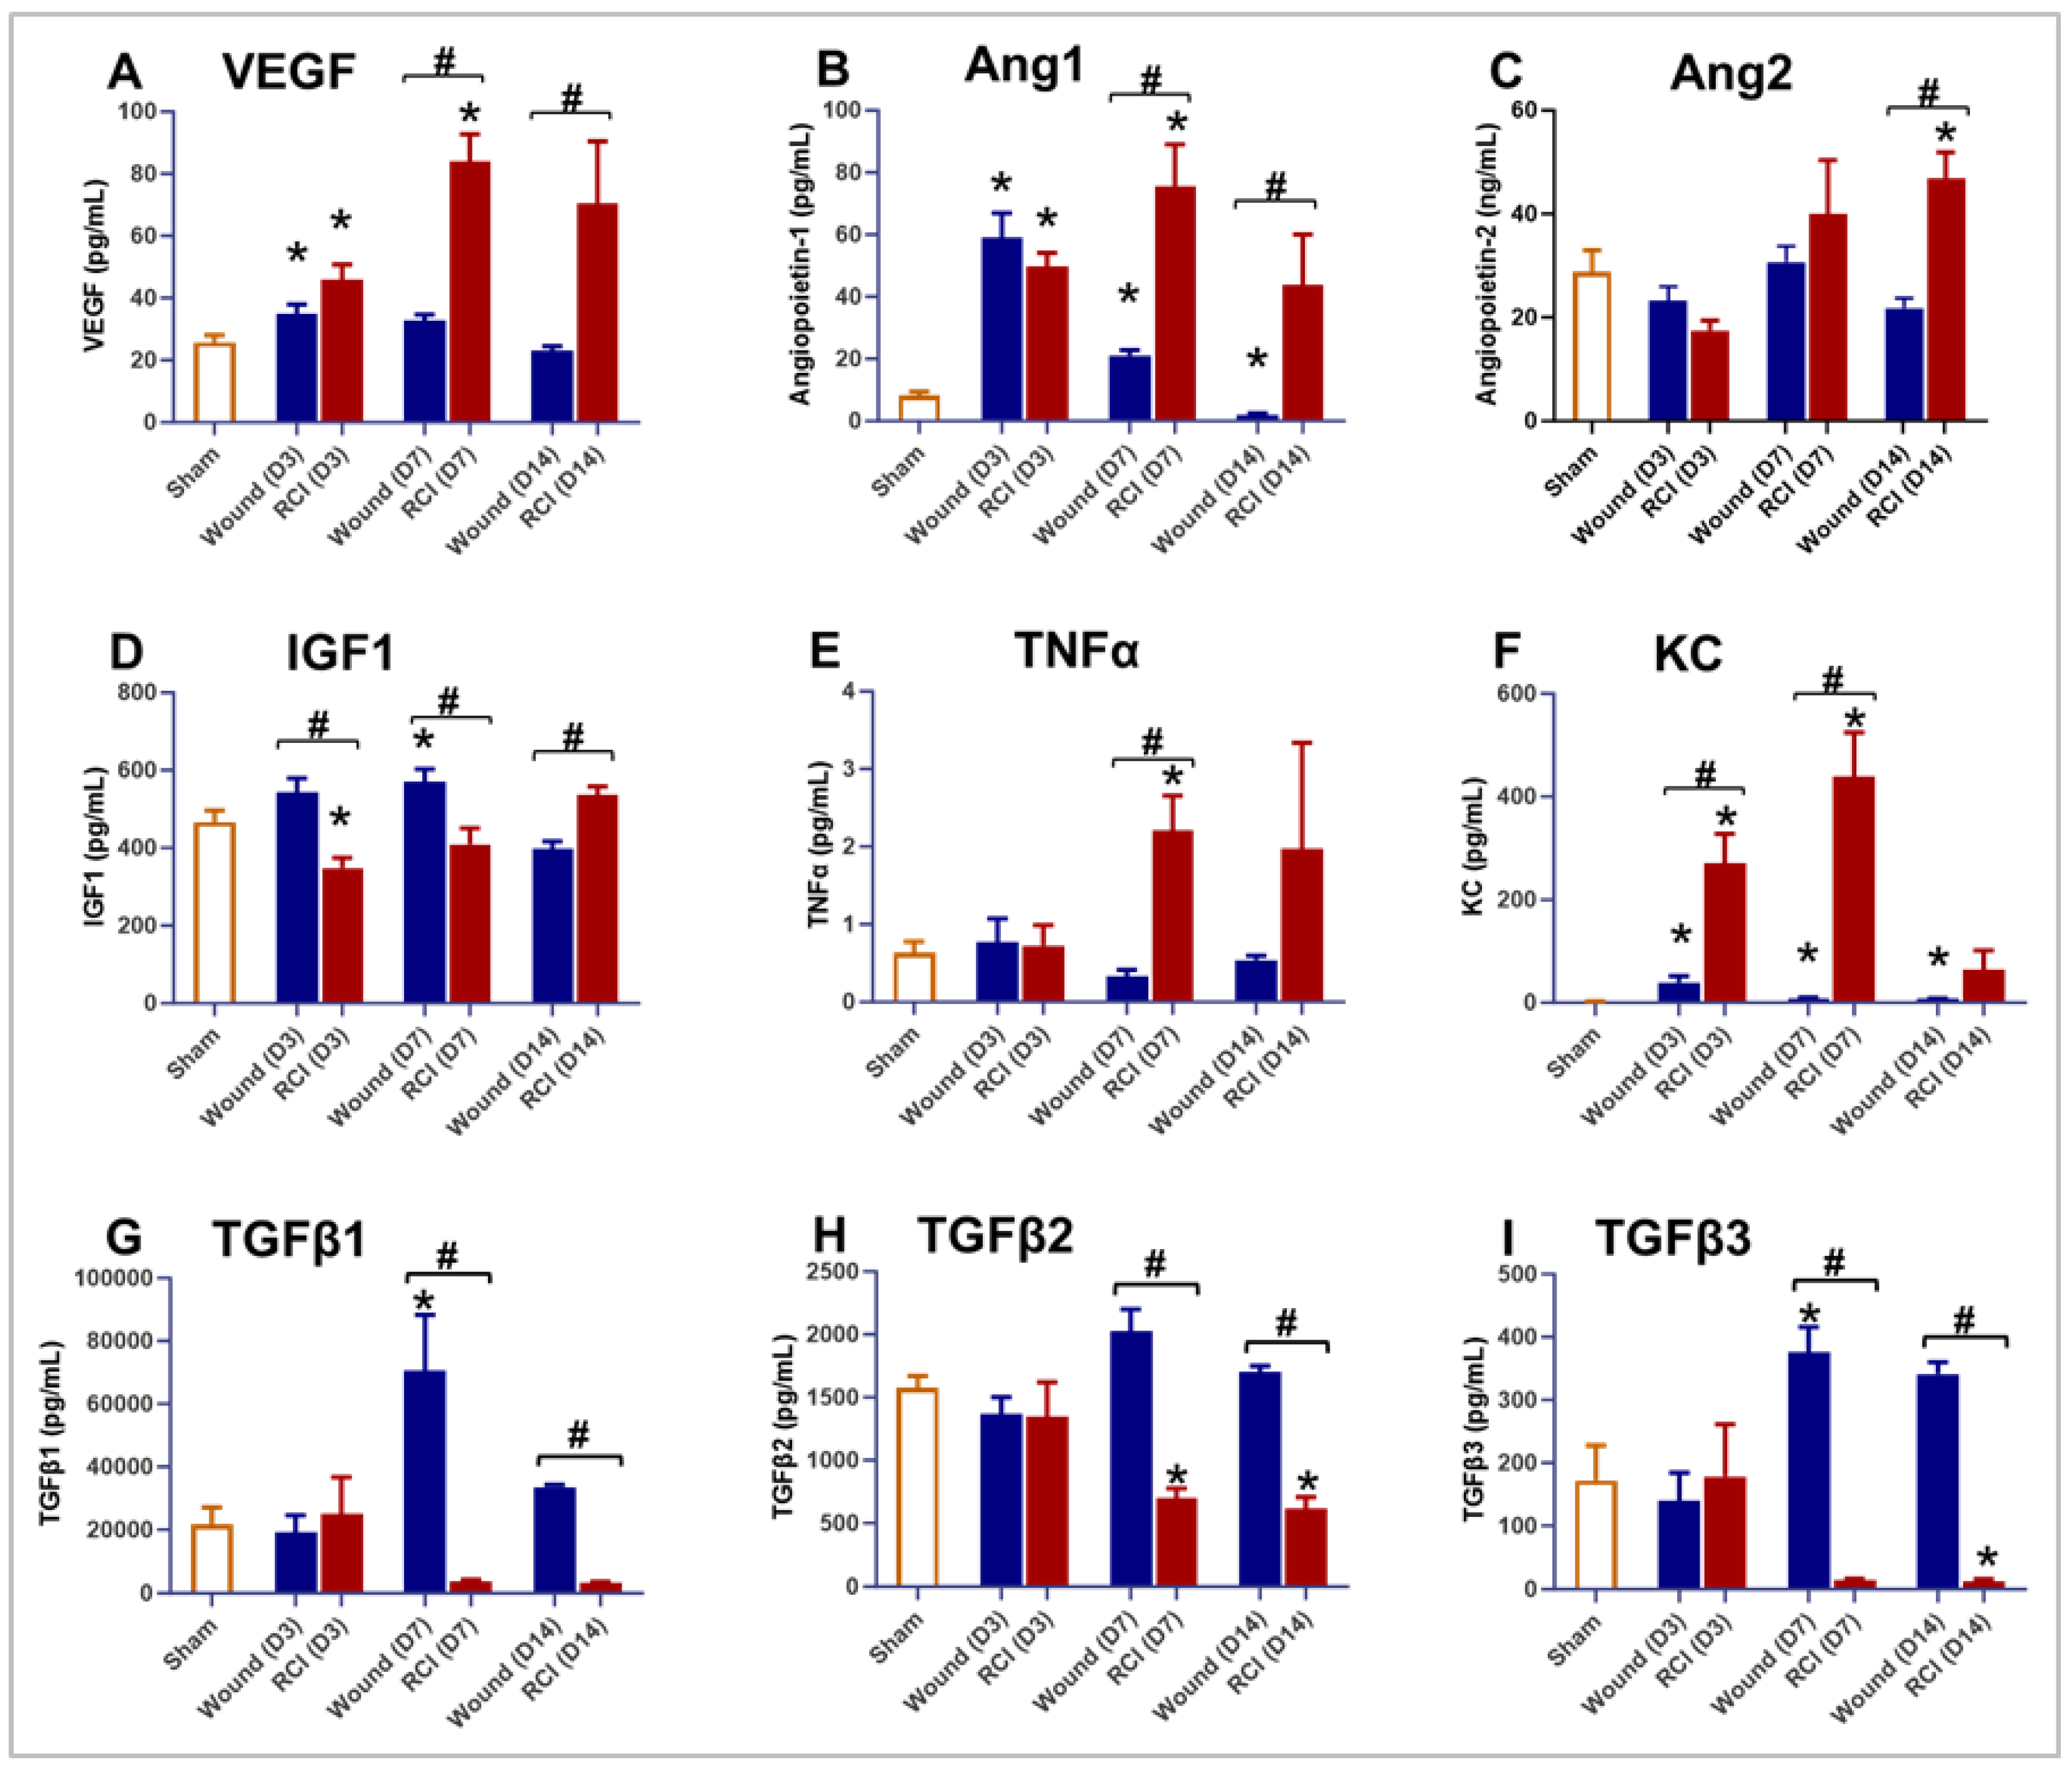
Figure 3.
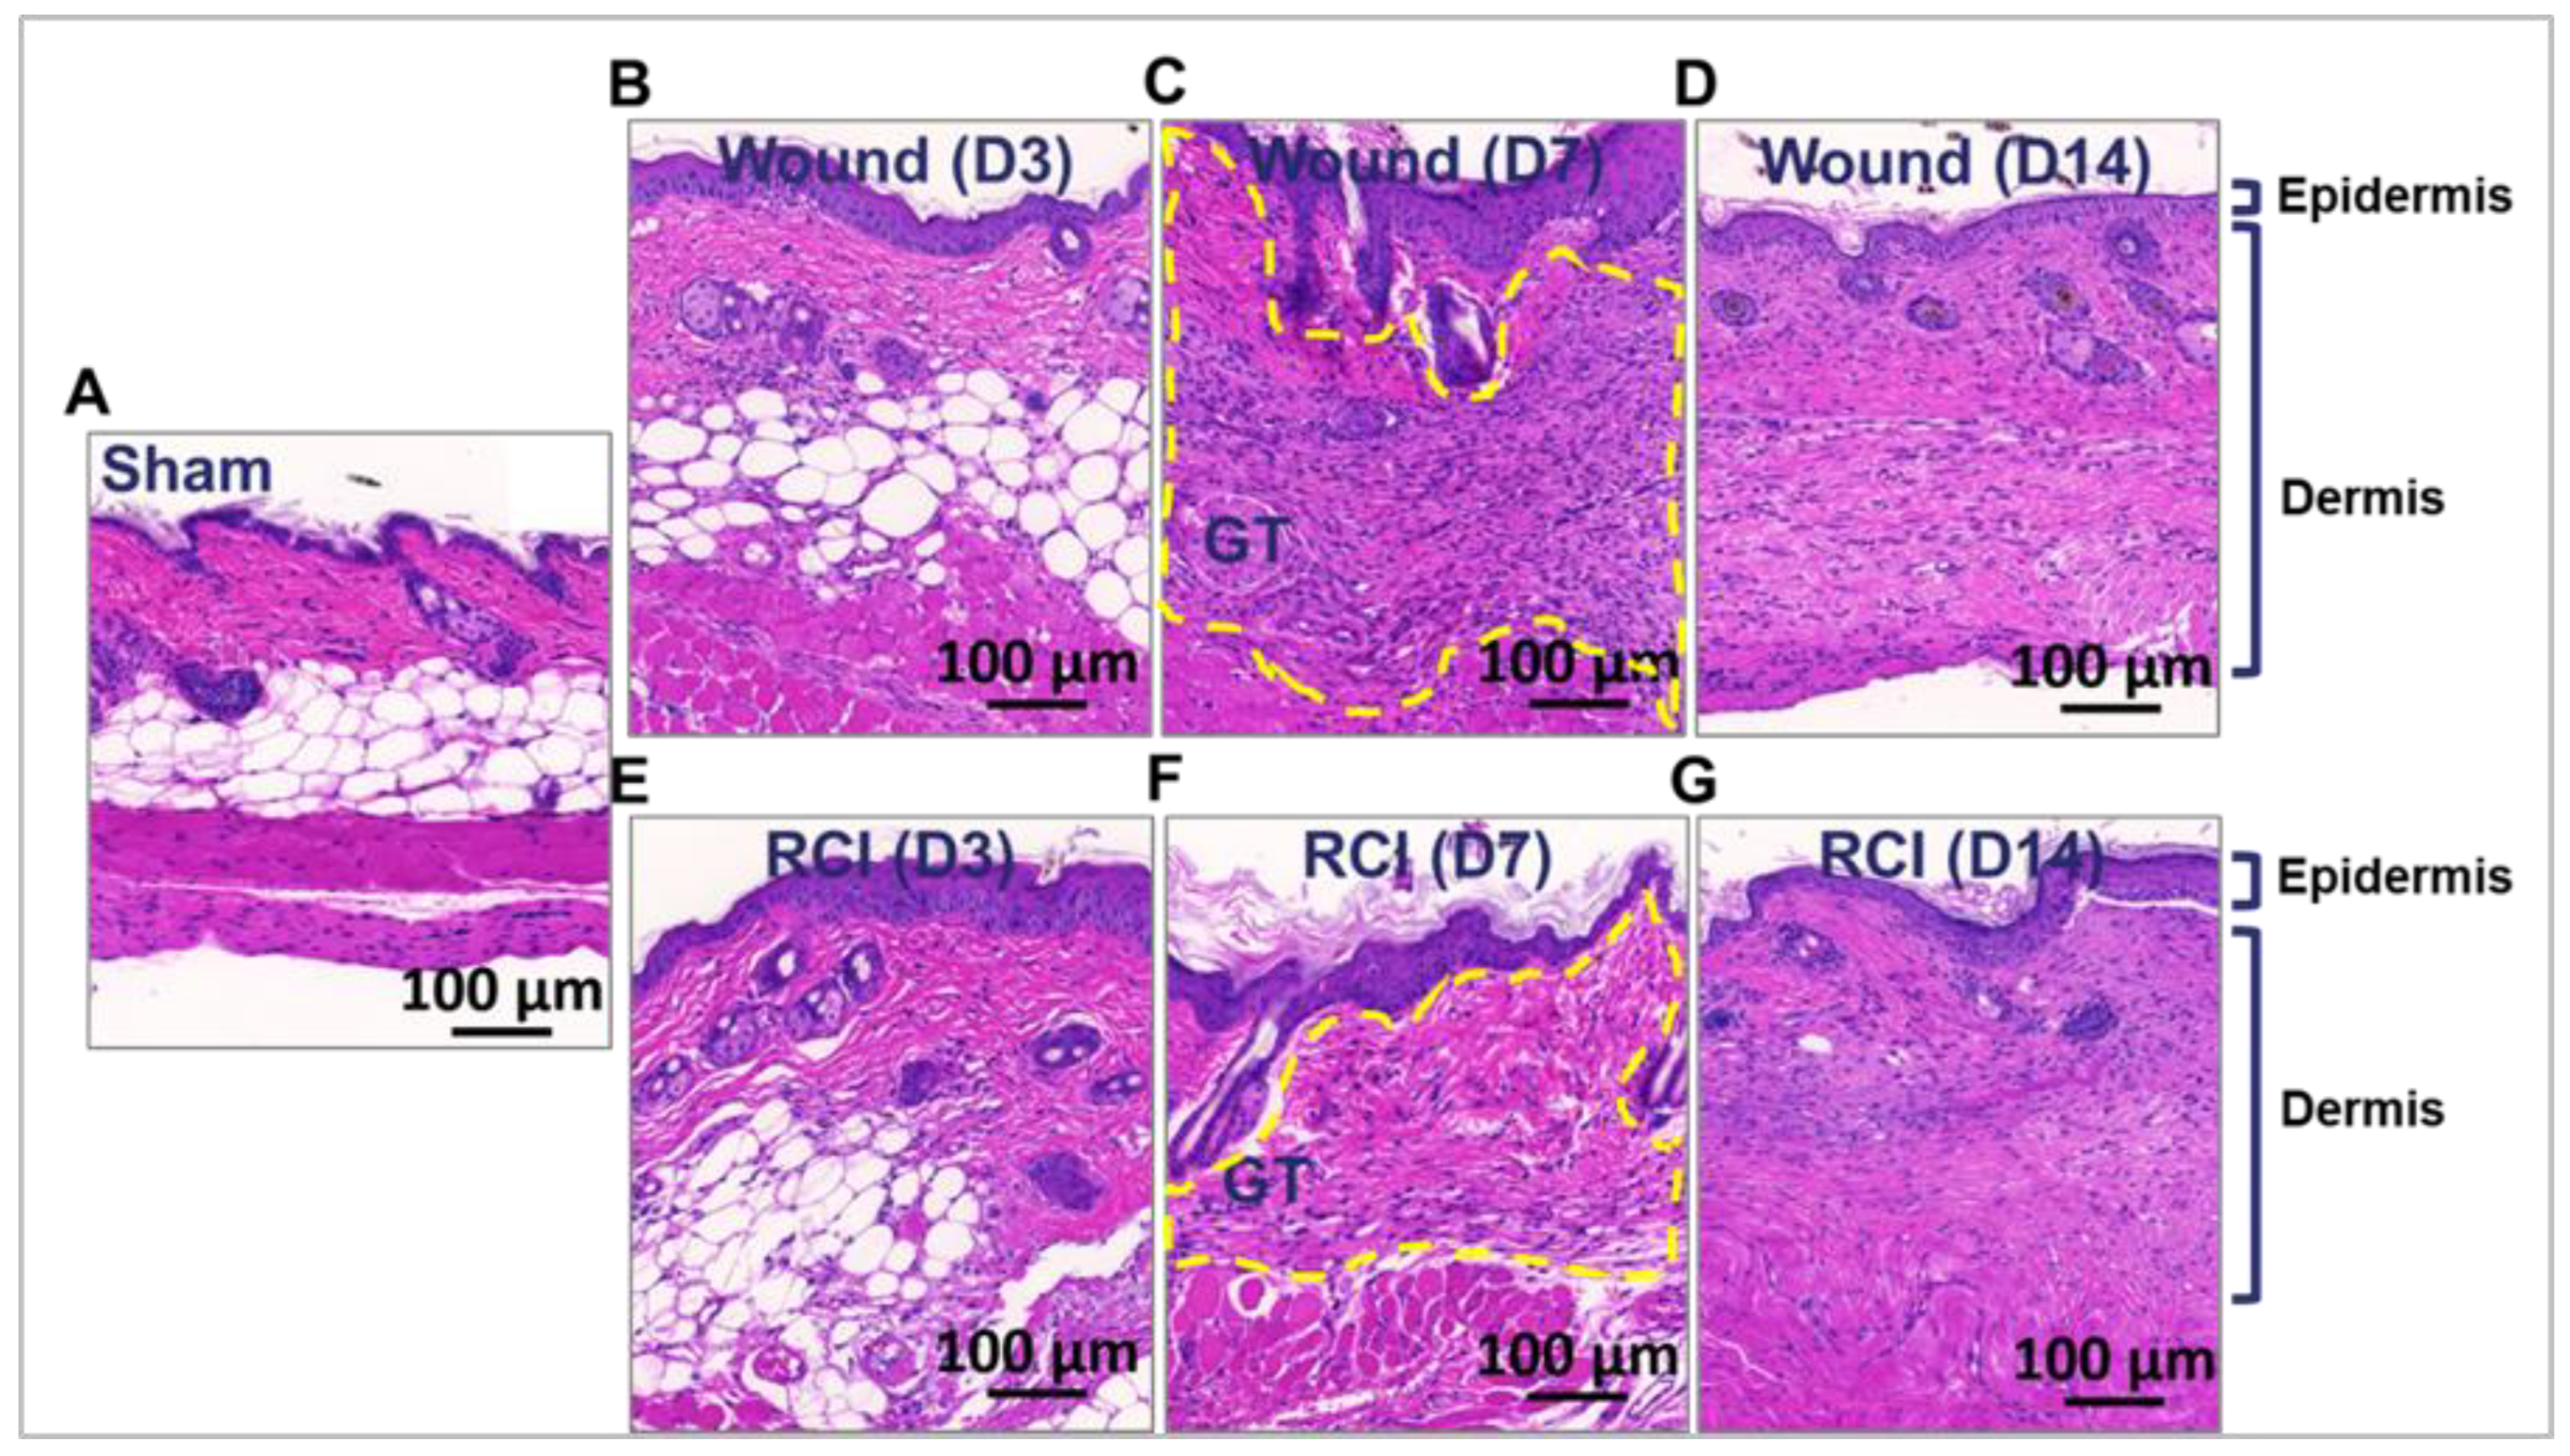
Effect of RCI on Granulation Tissue Formation During Skin Wound Healing. Mice were subjected to sham injury (Panel A), wound-alone (Panel B-D), and 9.0 Gy RCI (Panel E-G). Skin tissues surrounding the wounds were collected on days 3, 7, and 14 post-injury. Hematoxylin and eosin (H&E) staining was performed on formalin-fixed and paraffin-embedded skin cross sections, showing nuclei in blue-purple and cytoplasm in pink-red. Representative images of the skin peri-wound area display two main layers: the epidermis and the dermis. Granulation tissue formed on day 7 post-injury is outlined with a dotted yellow line. The scale bar represents 100 μm.
Figure 4.
Impact of RCI on Peripheral Blood Neutrophil and Monocyte Counts and Neutrophil and Macrophage Infiltration in Skin Wounds. Mice were subjected to sham injury, wound-alone, and 9.0 Gy RCI. Blood and skin tissues surrounding the wounds were collected on days 3, 7, and 14 post-injury. Complete blood count (CBC) with differential analysis was performed on EDTA-treated blood to evaluate the types of blood cells, specifically (Panel A) neutrophils (NEU) and (Panel B) monocytes (MONO). To assess NEU and macrophage (Mϕ) infiltration in the wounds, activity of (Panel C) Myeloperoxidase (MPO) and (Panel D) β-N-Acetylglucosaminidase (β-NAG) were measured in skin tissue lysates. Data are expressed as mean ± SEM. Significant differences were observed, indicated as *p < 0.05 for Sham vs Wound/RCI on days 3, 7, and 14 post-injury, determined by one-way ANOVA followed by Dunnett’s multiple comparisons test; and #p < 0.05 for Wound vs RCI at the same time point, determined by two-way ANOVA followed by Sidak’s multiple comparisons test. The sample size ranged from N = 4 to 9 per group per time point.
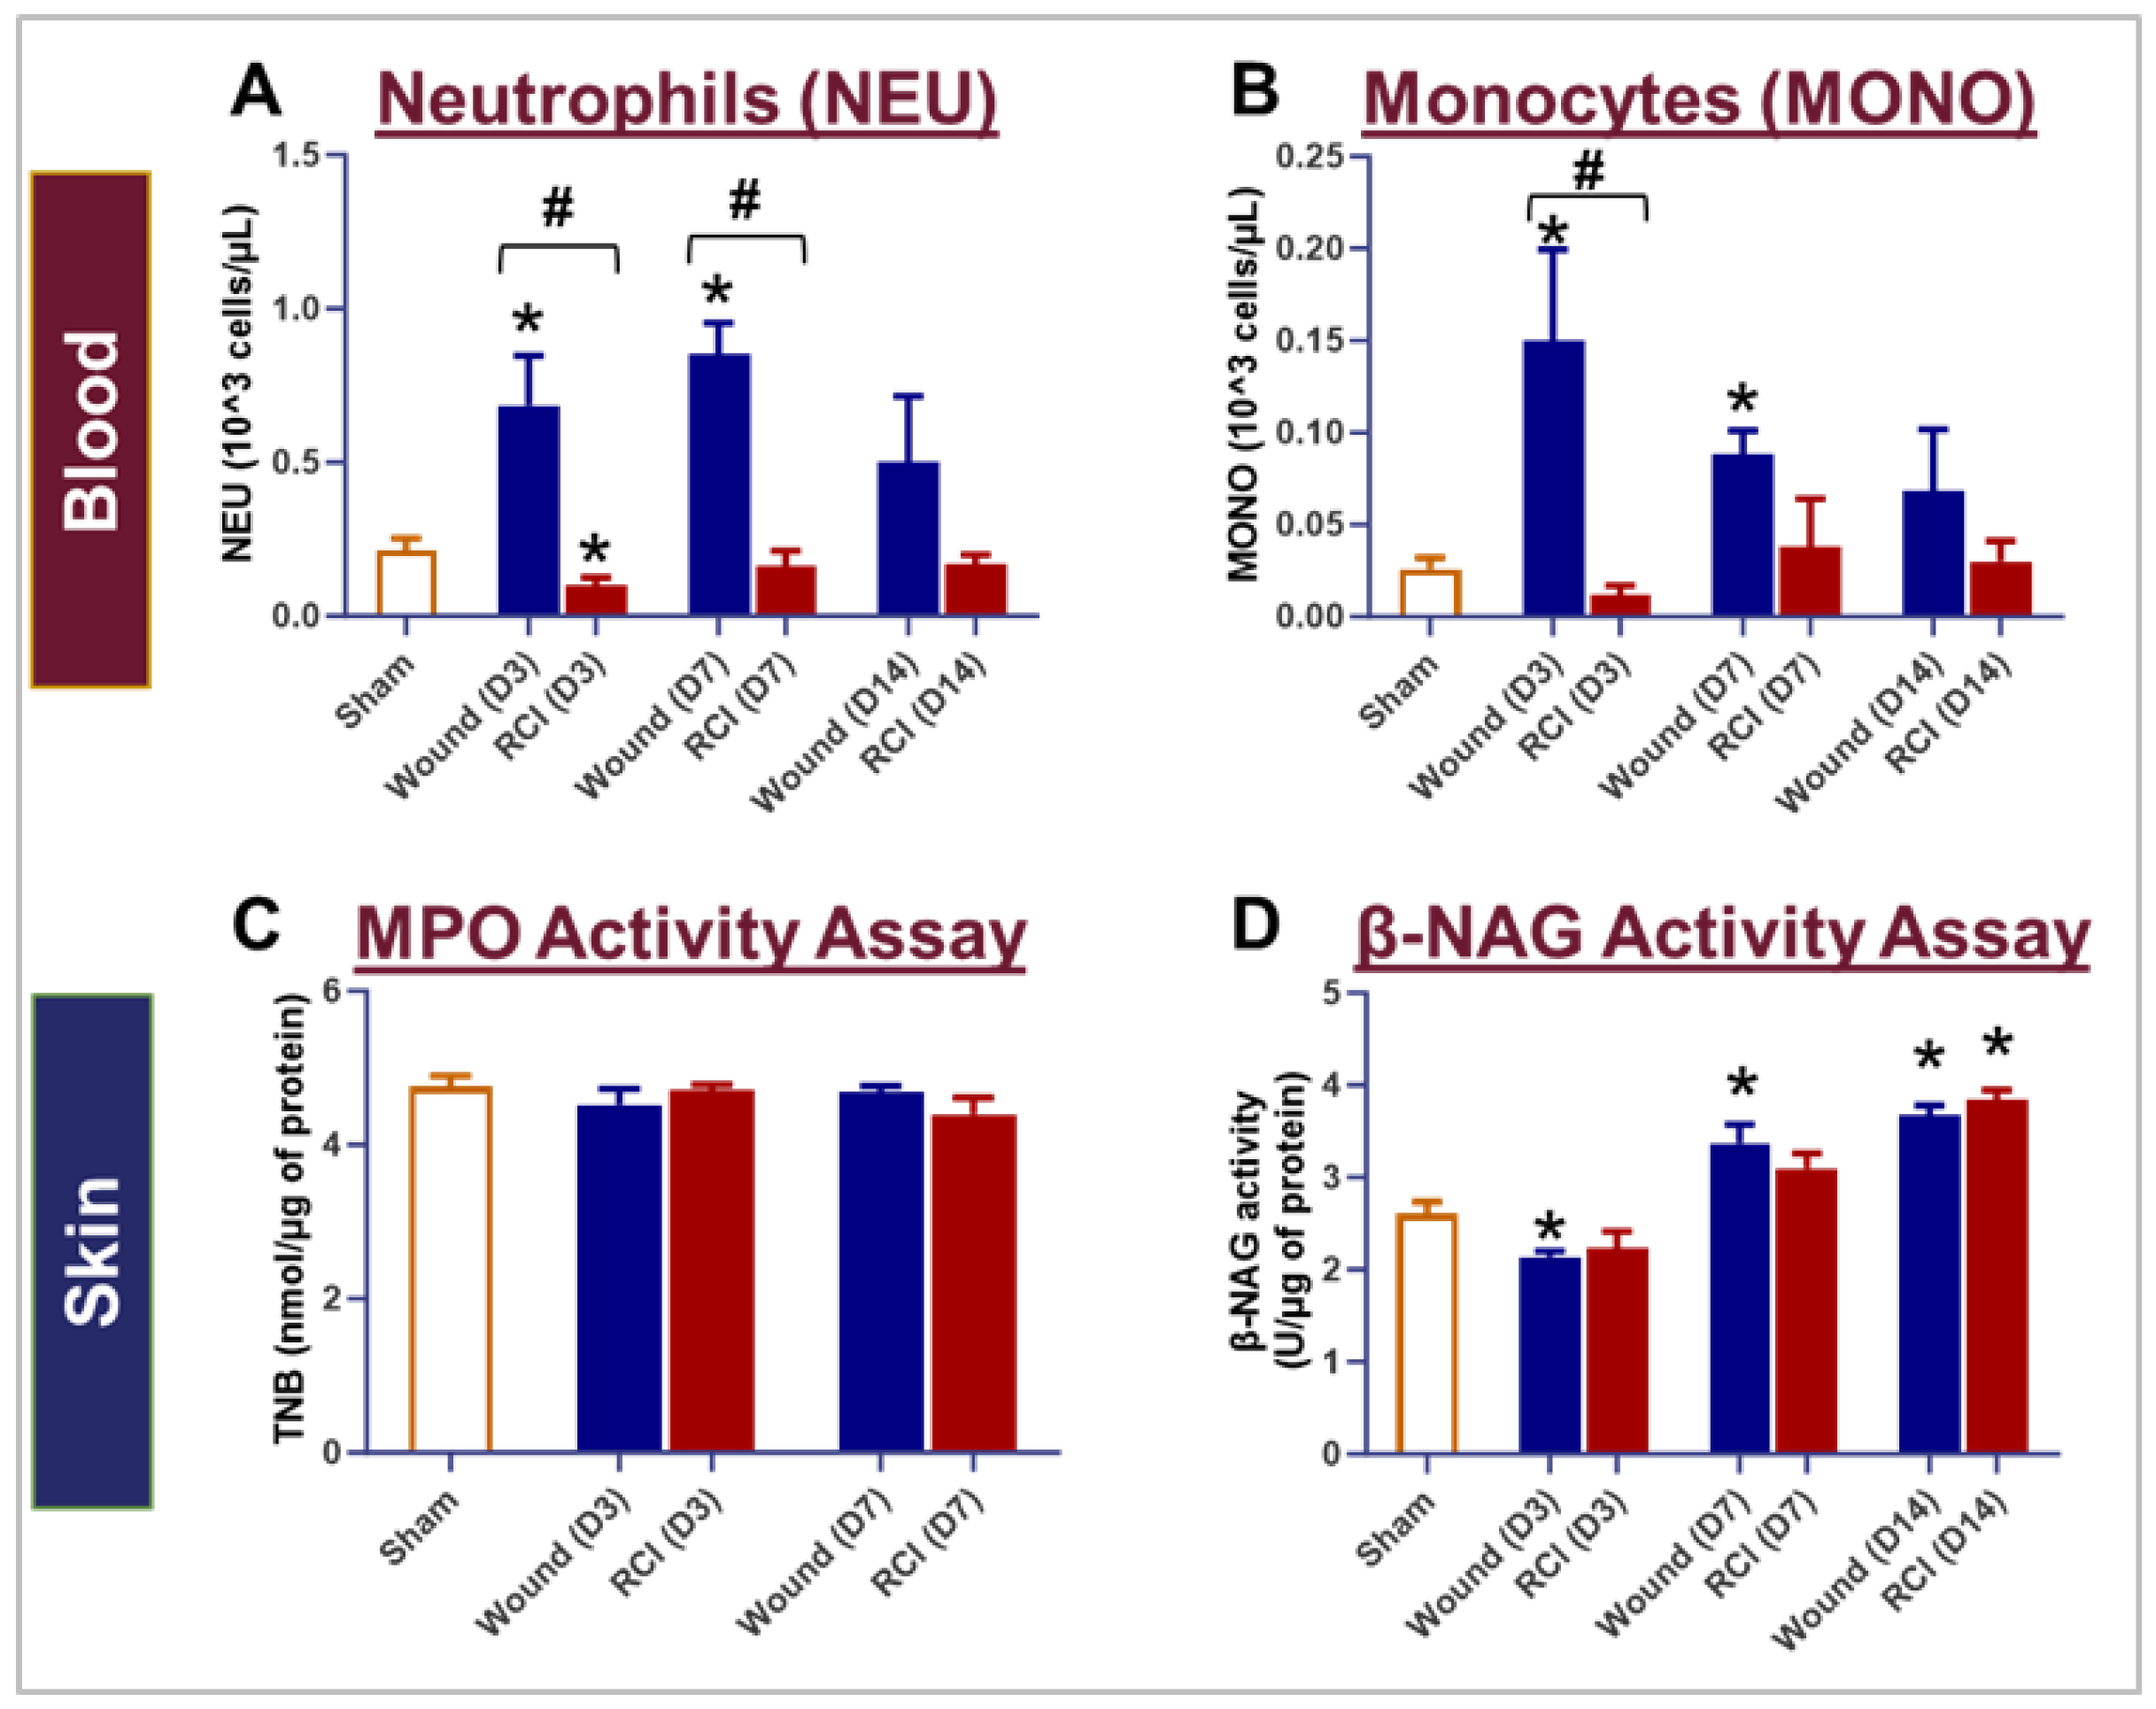
Figure 5.
Effect of RCI on Skin Tissue Endothelial Dysfunction Markers. Mice were subjected to sham injury, wound-alone, and 9.0 Gy RCI, and skin tissues surrounding the wounds were collected on days 3, 7, and 14 post-injury. Various markers associated with endothelial dysfunction were assessed in skin tissue lysates using ELISA. The markers analyzed include: (Panel A) vascular endothelial growth factor (VEGF); (Panel B) Angiopoietin-2 (Ang2); (Panel C) intercellular adhesion molecule 1 (ICAM1); and (Panel D) insulin-like growth factor 1 (IGF1). Data are expressed as mean ± SEM. Significant differences in these markers were observed: *p < 0.05 for Sham vs Wound/RCI on days 3, 7, and 14 post-injury, determined by one-way ANOVA followed by Dunnett’s multiple comparisons test; and #p < 0.05 for Wound vs RCI at the same time point, determined by two-way ANOVA followed by Sidak’s multiple comparisons test. The sample size ranged from N = 3 to 9 per group per time point.
Figure 6.
Effect of RCI on Skin Tissue Levels of Transforming Growth Factor-beta (TGFβ) 1-3. Mice were subjected to sham injury, wound-alone, and 9.0 Gy RCI, and skin tissues surrounding the wounds were collected on days 3, 7, and 14 post-injury. Skin tissue levels of (Panel A) TGFβ1, (Panel B) TGFβ2, and (Panel C) TGFβ3 were measured using the Bio-Plex multiplexing system. Data are expressed as mean ± SEM. Significant differences in TGFβ1-3 were observed: *p < 0.05 for Sham vs Wound/RCI on days 3, 7, and 14 post-injury, determined by one-way ANOVA followed by Dunnett’s multiple comparisons test; and #p < 0.05 for Wound vs RCI at the same time point, determined by two-way ANOVA followed by Sidak’s multiple comparisons test. The sample size was N = 4 per group per time point.
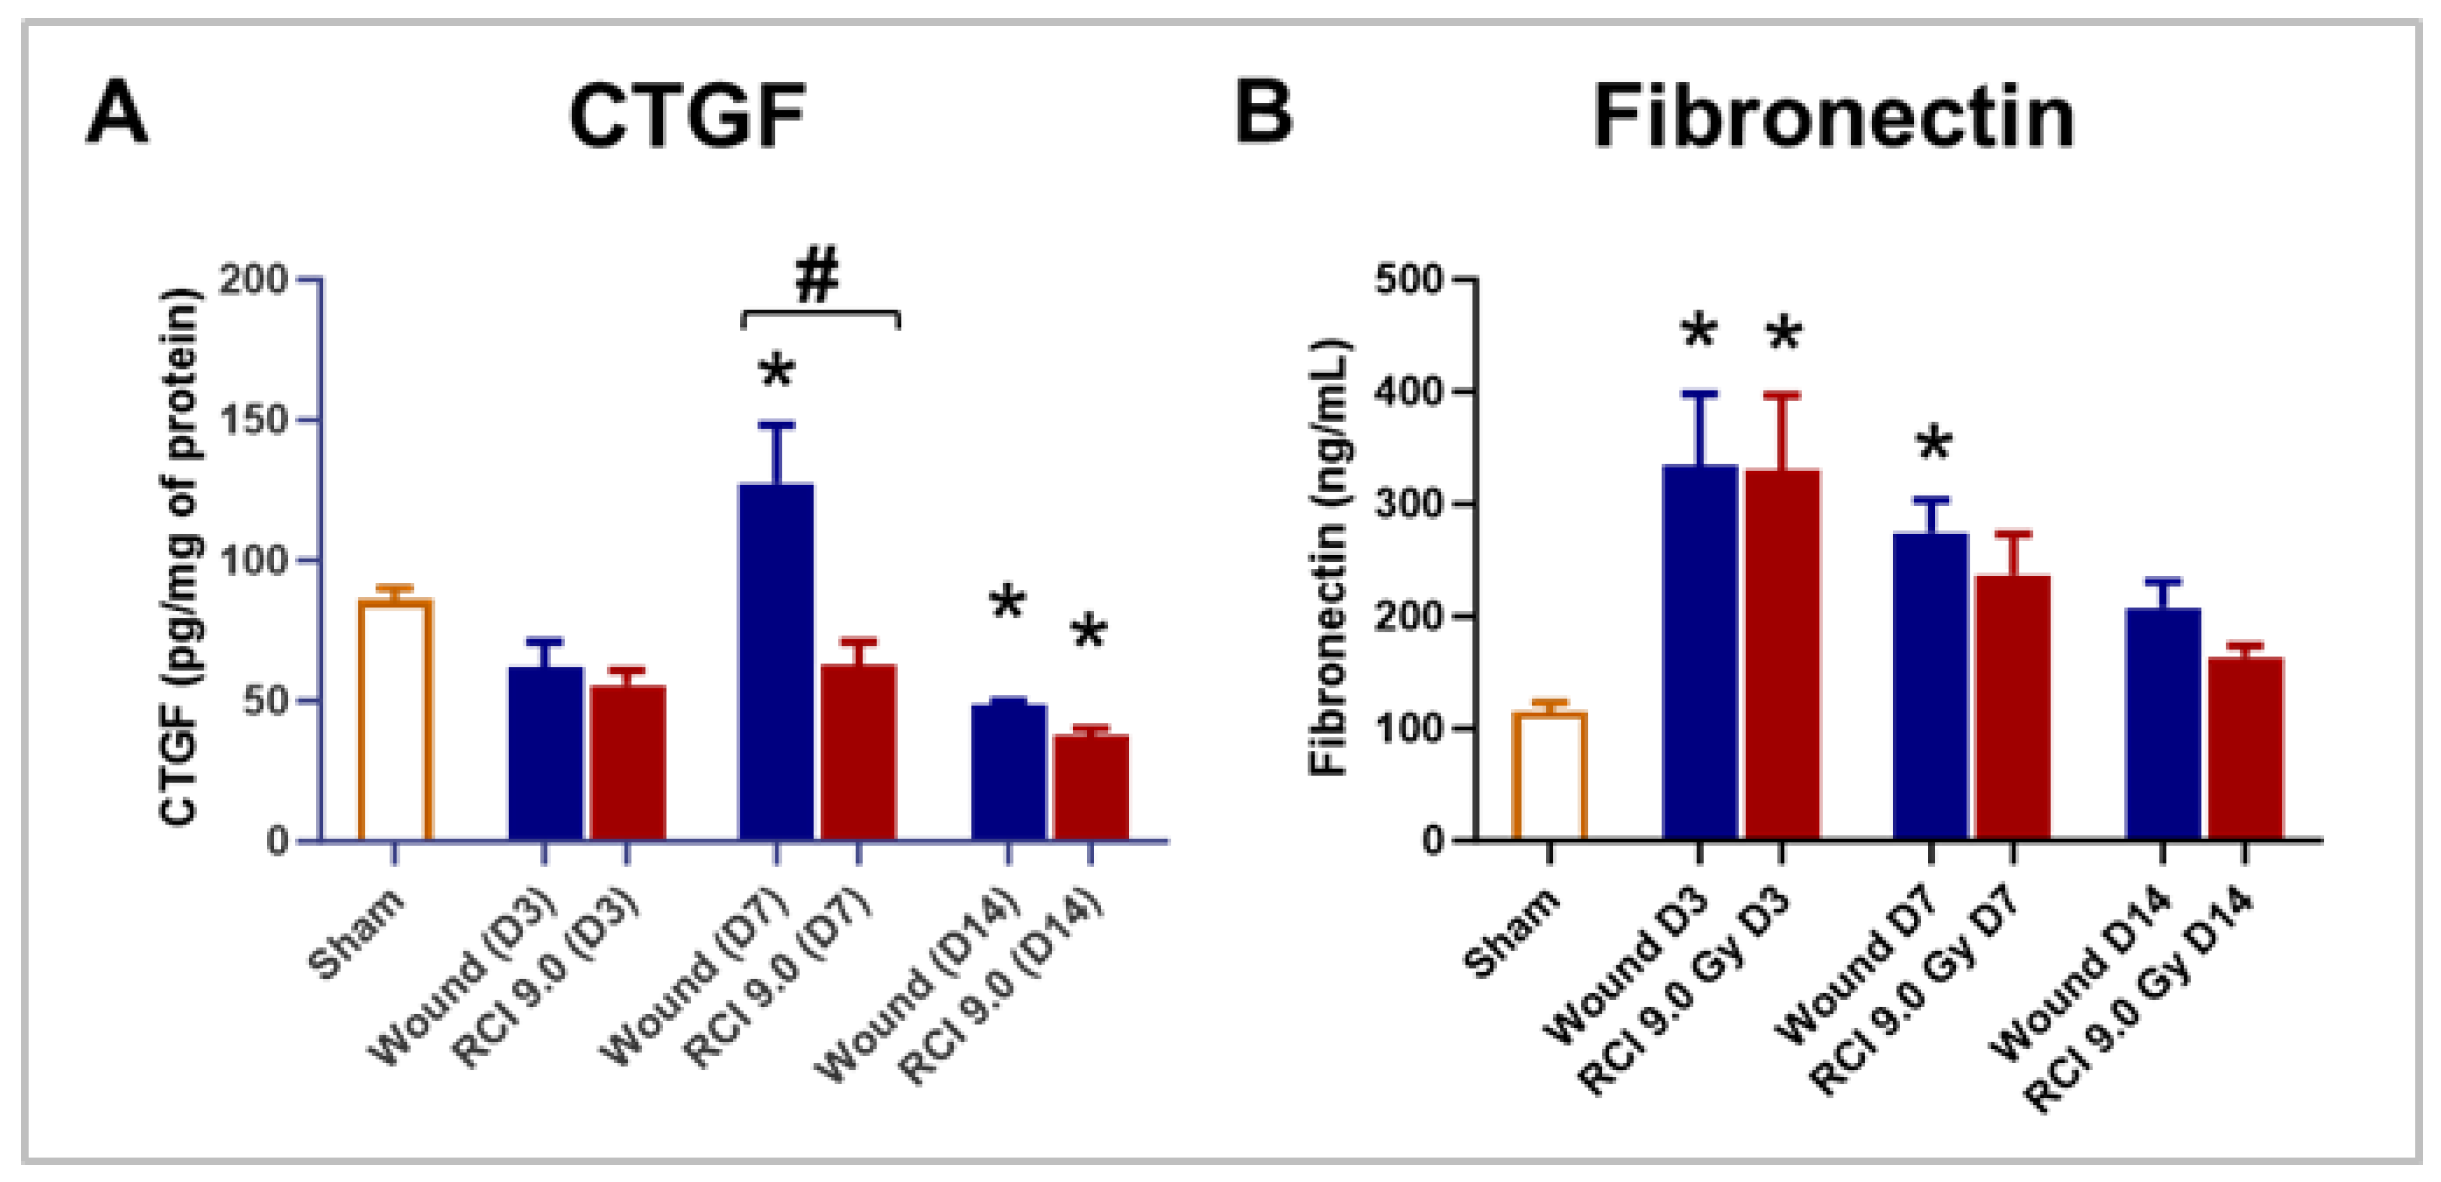
Figure 7.
Effect of RCI on Skin Tissue Levels of Connective Tissue Growth Factor (CTGF) and Fibronectin. Mice were subjected to sham injury, wound-alone, and 9.0 Gy RCI, and skin tissues surrounding the wounds were collected on days 3, 7, and 14 post-injury. Levels of (Panel A) CTGF and (Panel B) Fibronectin were measured in tissue lysates by EKISA. Data are expressed as mean ± SEM. Significant differences in these factors were observed: *p < 0.05 for Sham vs Wound/RCI on days 3, 7, and 14 post-injury, determined by one-way ANOVA followed by Dunnett’s multiple comparisons test; and #p < 0.05 for Wound vs RCI at the same time point, determined by two-way ANOVA followed by Sidak’s multiple comparisons test. The sample size ranged from N = 4 - 9 per group per time point.
Figure 8.
Effect of RCI on Fibroblast Differentiation and Collagen Deposition during Skin Wound Healing. Mice were subjected to sham injury (Panel E and I), wound-alone (Panel B-D and J-L), and 9.0 Gy RCI (Panel F-H and M-O). Skin tissues surrounding the wounds were collected on days 3, 7, and 14 post-injury. (Panel A-H) Immunohistochemical (IHC) staining using anti- alpha-smooth muscle actin (anti-α-SMA) antibody was performed on formalin-fixed and paraffin-embedded skin cross sections, highlighting α-SMA in red and nuclei in blue. (Panel A) Quantitative analysis of the percentage of α-SMA (% SMA) signal in the dermal area is shown. Data are expressed as mean ± SEM. Significant differences in % SMA were observed: *p < 0.05 for difference among Sham, Wound, and RCI on days 3, 7, and 14 post-injury, determined by one-way ANOVA followed by Tukey’s multiple comparisons test; and #p < 0.05 for Wound vs RCI at the same time point, determined by two-way ANOVA followed by Sidak’s multiple comparisons test. The sample size ranged from N = 3 - 4 per group per time point (except for N = 1 for RCI at the day 14 post-injury time point). The scale bar represents 100 μm. (Panel I-O) Masson’s Trichrome staining was performed on formalin-fixed and paraffin-embedded skin cross sections, showing collagen fibers in blue, nuclei in black, and cytoplasm in red. The scale bar represents 20 μm.
