
Submitted:
30 October 2024
Posted:
01 November 2024
You are already at the latest version
Abstract
This study aimed to determine gene pool structure in the tomato (Solanum lycopersicum) along with the relationships of populations in different regions. To do so, it leveraged 276 diverse cultivated accessions representing 35 countries, obtained via the USDA-GRIN tomato germplasm collection. Single nucleotide polymorphisms (SNPs) in these accessions were detected by sequencing, and genetic diversity, population structure, and phylogenetic relationships were estimated from the SNP alleles. The results of model-based ancestry analysis, phylogenetic tree construction, and principal component analysis supported these accessions as representing three well-differentiated genetic populations. Phylogenetic analyses traced the accessions back to their regions of origin, highlighting Central and South America as the primary center of domestication, with secondary centers in Europe and North America. This study provides a comprehensive analysis of the genetic variation in and relationships among cultivated tomato genotypes. The findings are of benefit to curators, researchers, and breeders in understanding, utilizing, conserving, and managing the collection, and in thereby contributing more efficiently to international tomato research.
Keywords:
tomato
; Solanum lycopersicum
; single nucleotide polymorphism (SNP)
; population structure
; genetic diversity
1. Introduction
Tomatoes (Solanum lycopersicum), as a globally valued horticultural crop, owe their economic impact, nutritional benefits, and culinary versatility to the genetic diversity within the species [1]. Enhancing the genetic makeup of tomatoes has long been a priority for plant breeders, with a focus on improving traits such as yield, disease resistance, fruit quality, and environmental adaptability [2,3]. The genetic diversity within the Solanaceae family, which includes tomatoes, potatoes, and peppers, has been instrumental in breeding programs; nearly all disease resistances in contemporary tomato varieties originate from their wild relatives [4].
The domestication and evolution of tomatoes have been profoundly shaped by the partitioning of genetic variation within and among populations, a process illuminated through population structure analysis. This genetic structure, influenced by historical processes like migration, natural selection, and genetic drift, has led to the formation of genetically distinct groups within the tomato species' range [5]. Each tomato population bears unique genetic signatures shaped by environmental and historical factors [6] making the identification of population structure crucial for understanding the extent of genetic differentiation and the factors contributing to it [7]. Originating in the South American Andes with domestication in Mexico [8], tomatoes spread globally, first to Europe in the 1500s and subsequently worldwide [9], leading to significant genetic changes. The domestication process selected traits favorable to human cultivation, such as larger fruit size, reduced seed dispersal, and improved taste [10] but also resulted in a genetic bottleneck, leaving cultivated varieties with less genetic diversity compared to their wild relatives [11]. Tomatoes were introduced to the United States in the early 18th century, initially as ornamental plants due to their exotic appearance [8]. Over time, they became an important food crop, with cultivation spreading across different regions of the country [9]. The diverse climates across the United States—from the hot, humid Southeast to the cooler, arid West—necessitated the selection of varieties adapted to local conditions, which in turn contributed to the development of a broad range of tomato cultivars with varying traits [10]. The genetic diversity of U.S. tomato germplasm is influenced by the genetic bottleneck that occurred during the early phases of tomato domestication and introduction. The tomatoes brought to the U.S. from Europe were already a subset of the original genetic diversity found in their native range in South America [4]. However, American farmers and breeders expanded this diversity through the introduction of new varieties and the selection of plants with desirable traits such as disease resistance, yield, and fruit quality [12].
The U.S. has played a pivotal role in the development of modern tomato varieties, particularly through its extensive breeding programs. These programs have focused on improving traits like disease resistance, fruit quality, shelf life, and adaptability to different growing conditions [11]. Breeding efforts often involved the incorporation of genetic material from wild relatives of tomatoes, particularly for enhancing disease resistance. For instance, the introduction of resistance genes from wild species such as Solanum pimpinellifolium and Solanum habrochaites has been a significant focus [4]. One of the most notable contributions to tomato genetic diversity from the U.S. is the development of hybrid varieties. Hybrid tomatoes, first introduced in the mid-20th century, offered improved uniformity, disease resistance, and higher yields [13]. The creation of hybrids required the development of inbred lines with specific genetic traits, which further expanded the genetic base of U.S. tomato germplasm [14].
Advancements in molecular biology techniques, such as single nucleotide polymorphisms (SNPs) and genotyping by sequencing (GBS), have significantly enhanced our understanding of tomato genetic diversity across different regions. In areas where tomatoes were first domesticated, such as Central and South America, higher genetic diversity is maintained [14], while regions like Europe and North America, where tomatoes were introduced later, often exhibit lower genetic diversity due to the founder effect and subsequent selection pressures [13]. Despite this, secondary centers of diversity, particularly in Italy and Spain, have emerged, showcasing distinctive morphological variations in their tomato populations [12]. These molecular tools have been invaluable in providing detailed information about genetic relationships, population dynamics, and complex genetic architectures. They have also facilitated the detection of human-mediated gene flow, historical migrations, and hybridization events, enabling researchers to study demographic processes, hybridization dynamics, and the introgression of adaptive genes across genetic boundaries [15]. Modern breeding techniques, including marker-assisted and genomic selection, allow breeders to leverage genetic markers linked to specific attributes, accelerating the development of cultivars with better quality, yield, and disease resistance [10,16]. Modern breeding techniques, including marker-assisted and genomic selection, allow breeders to leverage genetic markers linked to specific attributes, accelerating the development of cultivars with better quality, yield, and disease resistance [6,17].
Wild relatives of tomatoes have been vital in enhancing the genetic diversity of U.S. tomato germplasm. These wild species offer traits like pest and disease resistance, tolerance to abiotic stresses, and unique fruit qualities that have diminished in cultivated varieties [4]. U.S. breeders have incorporated these genes through introgression breeding, significantly broadening the genetic base [18]. Additionally, the U.S. hosts major germplasm collections, such as the National Plant Germplasm System (NPGS), which preserves a wide range of tomato genetic resources [14]. The present study emphasizes the importance of studying tomato germplasm primarily from the U.S.-based USDA-GRIN collection, as this represents a significant portion of the global diversity in cultivated tomatoes [13]. Understanding the genetic diversity and population structure within these accessions is crucial for both conservation and crop improvement efforts [19]. By applying GBS to derive SNPs, the study explores the genetic relationships, population dynamics, and genetic structure of these tomato populations [20]. Given the U.S.'s pivotal role in tomato breeding and the development of modern cultivars, analyzing this germplasm provides critical insights that can enhance breeding strategies and ensure the conservation of essential genetic resources for future agricultural challenges [11].
2. Materials and Methods
2.1. The Plant Materials
Plant materials in this study consisted of 276 accessions from the USDA-GRIN tomato germplasm collection, which originated from 35 different countries and are representative of major regions worldwide: the United States (n=178 accessions, 64.5%), North America excluding the United States (n=20, 7.24%), Central and South America (n=40, 14.49%), Europe (n=23, 8.33%), Asia (n=14, 5.07%), and Australia (n=1, 0.36%). After conducting separate analyses of diversity and structure for each location and country, all 276 accessions were pooled to provide an overarching perspective (see S1 Table).
2.2. DNA Extraction, Genotyping by Sequencing (GBS), and SNP Calling
The CTAB/SDS method was applied to extract DNA from fresh tomato leaves. GBS was performed on the isolated DNA according to the method of [NO_PRINTED_FORM] [20] with paired-end reads. Sequencing was performed on the Illumina NovaSeq platform at the University of Wisconsin-Madison Biotechnology Center (UWBC) (https://biotech.wisc.edu/, accessed 13 May 2024). The obtained sequences were aligned with the Solanum lycopersicum ITAG_4.0 reference genome (https://phytozome-next.jgi.doe.gov/info/Slycopersicum_ITAG4_0, accessed 13 May 2024). Single nucleotide polymorphism (SNP) identification utilized a pipeline integrating TASSEL-GBS [21] and Stacks 2 (https://catchenlab.life.illinois.edu/stacks/, accessed 13 May 2024; [NO_PRINTED_FORM] 2019). This process yielded 392,496 SNP markers distributed over all 12 tomato chromosomes; the genotypic data was provided by UWBC.
2.3. Population Structure
Based on SNP loci obtained from GBS, the population structure of the tomato accessions was evaluated with the model-based tool STRUCTURE 2.3.4 [23]. The number of populations (K) was estimated by a Markov Chain Monte Carlo process with 10,000 iterations of burn-in period, the run length was 20,000, and an admixture model was applied. Subsequent analysis established a correlation between allele frequencies in each individual run [24]. Simulated values of K ranged from 1 to 10, with ten iterations for each value. Delta K was computed for each simulated K as outlined by [25]. Structure Harvester was used to determine the ideal value of K [26]. Subsequently, each tomato accession was allocated to a cluster (Q) according to the ascertained likelihood of its membership, with a threshold of 0.525 for two clusters and 0.50 in scenarios involving three or more clusters. The accession population structure based on the optimal K value was visualized as a stacked bar plot of cluster likelihood.
2.4. Genetic Diversity
Power Marker V3.25 [27] was used to determine the major allele frequency, heterozygosity, gene diversity, and polymorphism information content (PIC) of each SNP and also the genetic diversity of the complete assemblage of 276 tomato accessions, including regionally derived subpopulations. Genetic distance was determined with the CS Chord 1967 method [28]. Arlequin 3.5 [29] was utilized for the analysis of molecular variance on all relevant markers. TASSEL 5.2.13 was used to analyze the genetic links among accessions and to determine the ideal number of clusters based on phylogenetic relationships and principal component analysis (PCA). Neighbor-joining phylogenetic trees [30] representing the genetic distances between areas or countries were constructed in Power Marker V3.25 and visualized using MEGA 11 [31].
3. Results
3.1. Single Nucleotide Polymorphism Diversity
In total, 10,724 polymorphic SNPs with less than 50% missing data were extracted from the 276 accessions. Subsequent filtering excluded alleles with frequency less than 1.5%, loci with more than 15% missing data, and loci with more than 35% heterozygosity. After this filtering, the final set comprised 5,162 SNPs of six distinct types: [AG] with 1,583 SNPs (30.67%), [CT] with 1,554 SNPs (30.1%), [GT] with 507 SNPs (9.82%), [AT] with 627 SNPs (12.12%), [AC] with 532 SNPs (10.31%), and [CG] with 359 SNPs (6.98%). Among the entire set of 5,162 loci, the major allele frequency ranged 0.45–0.98 (mean 0.91), gene diversity 0.002–0.59 (mean 0.12), heterozygosity 0.00–0.27 (mean 0.08), and PIC 0.001–0.49 (mean 0.09). These findings indicate that gene flow and genetic diversity are represented within the 276 tomato accessions.
3.2. Population Structure
Evaluation of the 276 tomato accessions/cultivars with STRUCTURE 2.3.4 [25] revealed delta K to peak at K = 3, indicative of three main populations (clusters, Q1, Q2, and Q3) (Figure 1A,B). When applying a likelihood threshold of 0.55, 266 accessions (96.4%) were assigned to one of the three populations: 27 (10.2%) to Q1, 201 (75.6%) to Q2, and 38 (14.2%) to Q3 (Figure 1B, Supplementary Table S1). The other ten (3.6%) were categorized as admixtures (S1 Table). Neighbor-joining cluster analysis likewise yielded three groups (Figure 1C), and PCA (Figure 1D) was also consistent with three tomato populations well-differentiated on genetic features plus a scattering of admixtures.
3.3. The Accessions from Different Geographic Origins
Initially, the 276 tomato accessions were categorized into six groups based on geographic origin: North America excluding the USA, USA, Central and South America, Europe, Asia, and Australia. "Central and South America" was designated as a distinct category due to being recognized as the likely origin of tomato domestication [14,32,33] . Meanwhile, cultivars from the United States were separated out in acknowledgement of their advanced development for cultivation (Table 1, Supplementary Table S2). Table 1 summarizes tomato genetic parameters according to region of origin.
Notably, the USA and Central and South America were the most represented with a collective 218 accessions (79%), while North America excluding the USA, Europe, Asia, and Australia together comprised only 58 accessions (21%). Thus, the majority of "North America" accessions originated in the USA. Gene diversity varied among regions, ranging from 0.004 in Australia to 0.28 in Central and South America. Heterozygosity was limited outside Central and South America, at 0.01 in Australia and 0.04 elsewhere, suggesting that most alleles in these regions are fixed. Central and South America accessions displayed higher heterozygosity (0.1 or 10%). The PIC ranged from 0.003 in Australia to 0.24 in Central and South America, mirroring gene diversity and supporting that Australian accessions have the least variation, while those from Central and South America harbor the most variation. Construction of a neighbor-joining phylogenetic tree based on the CS Chord distance revealed three clusters: Cluster 1 comprising Asia, North America excluding the USA, and Central and South America; Cluster 2 comprising only the USA; and Cluster 3 consisting of Europe and Australia (Figure 2). Tomatoes within a phylogenetic cluster shared more genetic background. Table 2 summarizes the distribution of these distinct populations among the six regions.
All three of the structure populations were represented in accessions from the USA, Asia, and Central and South America; meanwhile, only two (Q2 and Q3) were identified in North America excluding the USA, and only one (Q2) in Europe and Australia. This reflects the influence of geographical factors on tomato genetic diversity and population structure.
3.4. Phylogeny of the Accessions Across Diverse Countries
Of the 33 countries from which accessions were obtained, 11 were represented by four or more accessions, comprising 236 accessions (Supplementary Table S1). The genetic diversity of this subset was further examined according to country of origin. Figure 3 shows the phylogenetic tree obtained when grouping accessions by country.
The countries were clearly divided into two groups: Cluster 1 comprising two countries from Central & South America (Peru and Ecuador), two from North America excluding the USA (Canada and Mexico), one from Europe (France), and the USA; and Cluster 2 comprising two countries from Central and South America (Chile and Brazil), two from Asia (China and Russia), and one from Europe (Italy). Overall, these two clusters are comparable to the region-based grouping, except in the placement of the USA, France, and Italy.
4. Discussion
4.1. The Profile of SNPs
In this study, the genotyping of 5,162 tomato single nucleotide polymorphisms (SNPs) via Illumina sequencing revealed the most common types to be [AG] and [CT] (30.67% and 30.1%, respectively), consistent with the report by [NO_PRINTED_FORM] [34] that those SNP types are more predominant in tomato, and also similar to trends observed in other Solanum species [35].
The filtering process excluded low-frequency alleles (below 1.5%), loci with excessive missing data, and those with high heterozygosity, ensuring marker reliability [13]. The distribution of major allele frequencies (0.45–0.98, mean 0.91) suggests high allele frequency across the population, likely due to selective pressures during tomato domestication and breeding, which contributed to a genetic bottleneck in cultivated varieties [36]. Gene diversity (0.002–0.59, mean 0.12) indicates limited overall genetic diversity, with some loci exhibiting more variation [13]. Heterozygosity (0.00–0.27, mean 0.08) further confirms low genetic variability, with most accessions appearing homozygous due to selective breeding [36].
Additionally, the low average Polymorphism Information Content (PIC) (0.001-0.49, mean 0.09) reflects that many SNPs are not highly informative for distinguishing between individuals [13]. These findings suggest that while some genetic diversity is present within the 276 accessions, much of it is concentrated in specific regions, with many accessions sharing similar genetic backgrounds [37]. This highlights the genetic bottleneck in domesticated tomatoes and the need to increase diversity in breeding programs by introducing genetic material from wild relatives or underutilized landraces. Enhancing genetic diversity is critical for improving traits such as disease resistance, stress tolerance, and adaptability to future agricultural challenges, including climate change and evolving pests [38].
4.2. Population Structure and Genetic Diversity
In this study, a likelihood threshold of 0.55 assigned 96.4% of accessions to one of the three populations, with 10.2% in Q1, 75.6% in Q2, and 14.2% in Q3, while 3.6% were categorized as admixtures, indicating gene flow or hybridization between populations. This structure was further supported by both phylogenetic analysis and PCA, which also showed three well-differentiated genetic groups and a scattering of admixed accessions [25]. These findings indicated a distinct genetic background of the tomato germplasm, likely shaped by different breeding histories, geographic origins, and domestication processes, while a low level of gene exchange.
Our result is consistent with the report of genetic clustering in Bolivian tomatoes by [NO_PRINTED_FORM] [39], and supports the idea that domesticated tomatoes maintain distinct genetic pools. However, another study that examined 322 cultivated tomato genotypes conversely reported more admixture and less clear differentiation [19]; this conflicting result could be due to differences in sample size, geographical origins, or methodology. The clear identification of distinct genetic populations in the current study is a crucial finding for breeding and conservation strategies, as such differentiation facilitates the selection of parent lines for hybridization, maintains genetic diversity, and informs efforts to protect unique genetic pools.
4.3. Geographic Influence
It is likely that tomato domestication occurred in Central and South America, consistent with accessions from that region exhibiting the highest genetic diversity (gene diversity 0.28, heterozygosity 0.1, PIC 0.24) [39].Conversely, Australian accessions showed the least genetic diversity (gene diversity 0.004, heterozygosity 0.01, PIC 0.003), likely on account of the limited number of accessions and potential genetic bottlenecks during their introduction and cultivation [40]. Accessions from the USA represented advanced cultivars developed for modern agriculture and accordingly showed substantial genetic variation (gene diversity 0.26, heterozygosity 0.04, PIC 0.22). This high diversity aligns with reports of extensive breeding efforts and genetic improvement programs aimed at enhancing traits such as fruit quality, yield, and disease resistance [2].
Construction of a neighbor-joining phylogenetic tree for accession regions of origin based on genetic distance determined using the CS Chord 1967 method revealed three main clusters: Cluster 1 (Asia, North America excluding the USA, Central and South America), Cluster 2 (USA), and Cluster 3 (Europe, Australia). This result suggests closer genetic relationships within each cluster, influenced by regional breeding practices and historical introductions. The high genetic similarity within the USA cluster (Cluster 2) can be attributed to intensive breeding programs that homogenize genetic backgrounds to achieve specific agricultural goals [41]. This clustering indicates that tomatoes from the USA have developed a distinct genetic identity, likely due to intensive breeding programs, while Europe and Australia share a closer genetic background.
The population structure analysis further confirmed these geographic trends. All three genetic populations (Q1, Q2, and Q3) were present in the USA, Asia, and Central and South America, reflecting their greater genetic diversity and historical gene flow. In contrast, only two populations (Q2 and Q3) were identified in North America excluding the USA, and just one (Q2) was found in Europe and Australia, indicating more limited diversity in these regions. Overall, these findings underscore the influence of geographic origin on tomato genetic diversity and population structure, with regions like Central and South America and the USA exhibiting higher genetic diversity, while Europe and Australia show more genetic uniformity due to lower heterozygosity and fewer represented populations. These insights are critical for future breeding efforts, as they highlight the regions with the most genetic potential for developing new, resilient tomato varieties. [42].
4.4. The Tomato Accessions from Diverse Countries
The country-level analysis of genetic diversity, focused on 11 countries with four or more accessions (236 accessions total), revealed two distinctive clusters that can be attributed to historical and geographical factors.
Cluster 1 included six countries: Peru, Ecuador, Canada, Mexico, France, and the USA. The grouping of Peru and Ecuador with countries from North America and Europe suggests a complex history of tomato spread, likely influenced by early trade routes and colonial exchanges. As representative South American countries, the inclusion of Peru and Ecuador in Cluster 1 emphasizes the genetic richness of tomato populations in these countries, possibly due to the domestication process [36]. Meanwhile, the presence of the USA and France in this cluster indicates significant genetic exchange and introduction of South American varieties into these countries, contributing to the genetic diversity of their tomato populations [43].
Cluster 2 comprised five countries: Chile, Brazil, China, Russia, and Italy. The grouping of Chile and Brazil with countries from Asia and Europe highlights the global dispersion and adaptation of tomatoes. Meanwhile, China and Russia are major tomato producers with diverse agro-climatic conditions; their inclusion in this cluster suggests that these countries have maintained and possibly expanded genetic diversity through breeding programs [19]. Finally, Italy's placement in Cluster 2, contrary to its geographical proximity to France in Cluster 1, indicates a distinct genetic pool, potentially due to unique historical breeding practices and local variety conservation [19].
The results of this research align with and extend previous research on tomato genetic diversity. For instance, [NO_PRINTED_FORM] [36] examined both wild ancestors and contemporary breeding accessions and documented significant variation, especially highlighting the genetic richness in South American regions. Similarly, [43] discussed the historical introduction of South American varieties into other continents and its contribution to the observed genetic diversity in places like the USA and France. Additionally, the genetic similarity between distant countries such as China and Russia align with the report of [NO_PRINTED_FORM] [19] concerning the influence of breeding programs and agro-climatic adaptation in maintaining genetic diversity.
All told, these findings underscore the importance of using regional- and country-specific data in elucidating the genetic landscape of tomatoes. The similar clustering obtained from different grouping approaches highlights the robustness of the results and demonstrates that genetic diversity studies provide consistent insights into crop evolution and breeding [44]. Moreover, the present results provide crucial information for breeding programs aimed at improving tomato resilience, productivity, and food security. Diversity studies can guide breeders in selecting diverse parental lines for traits like disease resistance and climate adaptability and can aid conservation efforts in identifying and preserving genetically unique accessions to ensure a broad genetic base for future breeding.
These findings underscore the significance of utilizing region- and country-specific data to elucidate the genetic landscape of tomatoes. The consistent clustering observed across different grouping approaches highlights the robustness of the results and demonstrates that genetic diversity studies provide reliable insights into crop evolution and breeding.
5. Conclusions
This analysis of genome-wide SNPs in 276 tomato accessions identified three well-differentiated genetic populations associated with collection locations. Cluster 1 primarily included genotypes from Asia, North America (excluding the USA), and Central and South America. Cluster 2 consisted exclusively of accessions from the USA. Cluster 3 encompassed genotypes from Europe and Australia. These groupings support the hypothesis that tomatoes were originally domesticated in Central and South America and have secondary centers of diversity in Europe and North America, and additionally underscore the influence of geographic and historical factors on tomato diversity and population structure.
Supplementary Materials
The following supporting information can be downloaded at the website of this paper posted on Preprints.org.
Author Contributions
Conceptualization, A.S. and H.X.; methodology, A.S. and H.X.; software, A.S. and H.X.; validation, A.S., H.X., and H.A.; formal analysis, A.S. and H.X.; investigation, I.A., A.S., Q.L., KC., Y.Q., and R.D; resources K.-S.L.; data curation, A.S., H.X., I.A. and H.A.; writing—original draft preparation, I.A., H.X. and H.A.; writing—KC, Q.L., Y.Q., R.D. and A.S.; visualization, A.S. and H.X.; supervision, A.S. and H.X.; project administration, A.S. and K.-S.L.; funding acquisition, A.S. All authors have read and agreed to the published version of the manuscript
Funding
The research was partially supported by USDA Crop Germplasm Evaluation grant 58-8060-1-008; USDA ARS Agreement Number/FAIN 58-6080-3-012; the University of Arkansas Provost’s Collaborative Research Grant; USDA NIFA Hatch project ARK0VG2018 and ARK02440; and a scholarship from the Saudi Arabia government, The Saudi Arabian Cultural Mission (SACM) and University of Tabuk, Saudi Arabia.
Data Availability Statement
The data that support the findings of this study are available in the Supplementary Materials. The SNP data are available in https://figshare.com/articles/dataset/SNPS/27263169?file=49882998.
Acknowledgments
This research was supported by USDA-ARS Tomato Germplasm. The authors are grateful to the scientists who have contributed to this project, and to the reviewers and editors for their constructive review.
Conflicts of Interest
The authors declare that they have no conflict of interest.
References
- Adisa, I.O.; Rawat, S.; Pullagurala, V.L.R.; Dimkpa, C.O.; Elmer, W.H.; White, J.C.; Hernandez-Viezcas, J.A.; Peralta-Videa, J.R.; Gardea-Torresdey, J.L. Nutritional Status of Tomato (Solanum Lycopersicum) Fruit Grown in Fusarium-Infested Soil: Impact of Cerium Oxide Nanoparticles. J Agric Food Chem 2020, 68. [Google Scholar] [CrossRef] [PubMed]
- Fadhilah, A.N.; Farid, M.; Ridwan, I.; Anshori, M.F.; Yassi, A. GENETIC PARAMETERS AND SELECTION INDEX OF HIGH-YIELDING TOMATO F2 POPULATIONS. SABRAO J Breed Genet 2022, 54. [Google Scholar] [CrossRef]
- Filho, A.B.C.; Maia, M.M.; Mendoza-Cortez, J.W.; Rodrigues, M.A.; Nowaki, R.H.D. Growing Seasons and Fractional Fertilization for Arugula. Comunicata Scientiae 2014, 5. [Google Scholar]
- Rick, C.; Chetelat, R. Utilization of Related Wild Species for Tomato Improvement. In Proceedings of the I International Symposium on Solanacea for Fresh Market 412; 1995; pp. 21–38. [Google Scholar]
- Alstad, D.N.; Hotchkiss, S.C.; Corbin, K.W. Gene Flow Estimates Implicate Selection as a Cause of Scale Insect Population Structure. Evol Ecol 1991, 5. [Google Scholar] [CrossRef]
- Arunyawat, U.; Stephan, W.; Städler, T. Using Multilocus Sequence Data to Assess Population Structure, Natural Selection, and Linkage Disequilibrium in Wild Tomatoes. Mol Biol Evol 2007, 24. [Google Scholar] [CrossRef]
- Bradburd, G.S.; Coop, G.M.; Ralph, P.L. Inferring Continuous and Discrete Population Genetic Structure across Space. Genetics 2018, 210. [Google Scholar] [CrossRef]
- Jenkins, J.A. The Origin of the Cultivated Tomato. Econ Bot 1948, 2, 379–392. [Google Scholar] [CrossRef]
- Mccue, G.A. The History of the Use of the Tomato: An Annotated Bibliography. Annals of the Missouri Botanical Garden 1952, 39, 289–348. [Google Scholar] [CrossRef]
- Sim, S.C.; Robbins, M.D.; Van Deynze, A.; Michel, A.P.; Francis, D.M. Population Structure and Genetic Differentiation Associated with Breeding History and Selection in Tomato (Solanum Lycopersicum L.). Heredity (Edinb) 2011, 106. [Google Scholar] [CrossRef]
- Tanksley, S.D.; Mccouch, S.R. Seed Banks and Molecular Maps: Unlocking Genetic Potential from the Wild. Science (1979) 1997, 277, 1063–1066. [Google Scholar] [CrossRef]
- Kulus, D. Genetic Diversity for Breeding Tomato. In Cash Crops: Genetic Diversity, Erosion, Conservation and Utilization; 2022; pp. 505–521.
- Sim, S.C.; van Deynze, A.; Stoffel, K.; Douches, D.S.; Zarka, D.; Ganal, M.W.; Chetelat, R.T.; Hutton, S.F.; Scott, J.W.; Gardner, R.G.; et al. High-Density SNP Genotyping of Tomato (Solanum Lycopersicum L.) Reveals Patterns of Genetic Variation Due to Breeding. PLoS One 2012, 7. [Google Scholar] [CrossRef] [PubMed]
- Labate, J.A.; Sheffer, S.M.; Balch, T.; Robertson, L.D. Diversity and Population Structure in a Geographic Sample of Tomato Accessions. Crop Sci 2011, 51. [Google Scholar] [CrossRef]
- Nieto Feliner, G.; Casacuberta, J.; Wendel, J.F. Genomics of Evolutionary Novelty in Hybrids and Polyploids. Front Genet 2020, 11. [Google Scholar] [CrossRef] [PubMed]
- Tiwari, J.K.; Yerasu, S.R.; Rai, N.; Singh, D.P.; Singh, A.K.; Karkute, S.G.; Singh, P.M.; Behera, T.K. Progress in Marker-Assisted Selection to Genomics-Assisted Breeding in Tomato. CRC Crit Rev Plant Sci 2022, 41. [Google Scholar] [CrossRef]
- Kulus, D. Genetic Resources and Selected Conservation Methods of Tomato. Journal of Applied Botany and Food Quality 2018, 91. [Google Scholar] [CrossRef]
- Bai, Y.; Lindhout, P. Domestication and Breeding of Tomatoes: What Have We Gained and What Can We Gain in the Future? Ann Bot 2007, 100, 1085–1094. [Google Scholar] [CrossRef]
- Lin, T.; Zhu, G.; Zhang, J.; Xu, X.; Yu, Q.; Zheng, Z.; Zhang, Z.; Lun, Y.; Li, S.; Wang, X. Genomic Analyses Provide Insights into the History of Tomato Breeding. Nat Genet 2014, 46, 1220–1226. [Google Scholar] [CrossRef]
- Elshire, R.J.; Glaubitz, J.C.; Sun, Q.; Poland, J.A.; Kawamoto, K.; Buckler, E.S.; Mitchell, S.E. A Robust, Simple Genotyping-by-Sequencing (GBS) Approach for High Diversity Species. PLoS One 2011, 6. [Google Scholar] [CrossRef]
- Glaubitz, J.C.; Casstevens, T.M.; Lu, F.; Harriman, J.; Elshire, R.J.; Sun, Q.; Buckler, E.S. TASSEL-GBS: A High Capacity Genotyping by Sequencing Analysis Pipeline. PLoS One 2014, 9. [Google Scholar] [CrossRef]
- Rochette, N.C.; Rivera-Colón, A.G.; Catchen, J.M. Stacks 2: Analytical Methods for Paired-End Sequencing Improve RADseq-Based Population Genomics. Mol Ecol 2019, 28. [Google Scholar] [CrossRef]
- Pritchard, J.K.; Stephens, M.; Donnelly, P. Inference of Population Structure Using Multilocus Genotype Data. Genetics 2000, 155. [Google Scholar] [CrossRef] [PubMed]
- Lv, J.; Qi, J.; Shi, Q.; Shen, D.; Zhang, S.; Shao, G.; Li, H.; Sun, Z.; Weng, Y.; Shang, Y.; et al. Genetic Diversity and Population Structure of Cucumber (Cucumis Sativus L.). PLoS One 2012, 7. [Google Scholar] [CrossRef] [PubMed]
- Evanno, G.; Regnaut, S.; Goudet, J. Detecting the Number of Clusters of Individuals Using the Software STRUCTURE: A Simulation Study. Mol Ecol 2005, 14. [Google Scholar] [CrossRef] [PubMed]
- Earl, D.A.; vonHoldt, B.M. STRUCTURE HARVESTER: A Website and Program for Visualizing STRUCTURE Output and Implementing the Evanno Method. Conserv Genet Resour 2012, 4. [Google Scholar] [CrossRef]
- Liu, K.; Muse, S. V. PowerMaker: An Integrated Analysis Environment for Genetic Maker Analysis. Bioinformatics 2005, 21. [Google Scholar] [CrossRef] [PubMed]
- Cavalli-Sforza, L.L.; Edwards, A.W. Phylogenetic Analysis. Models and Estimation Procedures. Am J Hum Genet 1967, 19, 233–257. [Google Scholar]
- Excoffier, L.; Lischer, H.E.L. Arlequin Suite Ver 3.5: A New Series of Programs to Perform Population Genetics Analyses under Linux and Windows. Mol Ecol Resour 2010, 10. [Google Scholar] [CrossRef]
- Saitou, N.; Nei, M. The Neighbor-Joining Method: A New Method for Reconstructing Phylogenetic Trees. Mol Biol Evol 1987, 4. [Google Scholar] [CrossRef]
- Tamura Koichiro; Glen Stecher; Kumar Sudhir Tamura 2021. Mol Biol Evol 2021.
- Bai, Y.; Lindhout, P. Domestication and Breeding of Tomatoes: What Have We Gained and What Can We Gain in the Future? Ann Bot 2007, 100. [Google Scholar] [CrossRef]
- Chávez-Servia, J.L.; Vera-Guzmán, A.M.; Linares-Menéndez, L.R.; Carrillo-Rodríguez, J.C.; Aquino-Bolaños, E.N. Agromorphological Traits and Mineral Content in Tomato Accessions from El Salvador, Central America. Agronomy 2018, 8. [Google Scholar] [CrossRef]
- Tiwari, J.K.; Yerasu, S.R.; Rai, N.; Singh, D.P.; Singh, A.K.; Karkute, S.G.; Singh, P.M.; Behera, T.K. Progress in Marker-Assisted Selection to Genomics-Assisted Breeding in Tomato. CRC Crit Rev Plant Sci 2022, 41, 321–350. [Google Scholar] [CrossRef]
- He, C.; Poysa, V.; Yu, K. Development and Characterization of Simple Sequence Repeat (SSR) Markers and Their Use in Determining Relationships among Lycopersicon Esculentum Cultivars. Theoretical and Applied Genetics 2003, 106. [Google Scholar] [CrossRef] [PubMed]
- Blanca, J.; Montero-Pau, J.; Sauvage, C.; Bauchet, G.; Illa, E.; Díez, M.J.; Francis, D.; Causse, M.; van der Knaap, E.; Cañizares, J. Genomic Variation in Tomato, from Wild Ancestors to Contemporary Breeding Accessions. BMC Genomics 2015, 16. [Google Scholar] [CrossRef] [PubMed]
- Corrado, G.; Rao, R. Towards the Genomic Basis of Local Adaptation in Landraces. Diversity (Basel) 2017, 9. [Google Scholar] [CrossRef]
- Alzahib, R.H.; Migdadi, H.M.; Al Ghamdi, A.A.; Alwahibi, M.S.; Afzal, M.; Elharty, E.H.; Alghamdi, S.S. Exploring Genetic Variability among and within Hail Tomato Landraces Based on Sequence-Related Amplified Polymorphism Markers. Diversity (Basel) 2021, 13. [Google Scholar] [CrossRef]
- Villanueva-Gutierrez, E.E.; Johansson, E.; Prieto-Linde, M.L.; Centellas Quezada, A.; Olsson, M.E.; Geleta, M. Simple Sequence Repeat Markers Reveal Genetic Diversity and Population Structure of Bolivian Wild and Cultivated Tomatoes (Solanum Lycopersicum L.). Genes (Basel) 2022, 13. [Google Scholar] [CrossRef]
- Glogovac, S.; Takač, A.; Belović, M.; Gvozdanović-Varga, J.; Nagl, N.; Červenski, J.; Danojević, D.; Trkulja, D.; Prodanović, S.; Živanović, T. Characterization of Tomato Genetic Resources in the Function of Breeding. Ratarstvo i Povrtarstvo 2022, 59. [Google Scholar] [CrossRef]
- Donoso, A.; Carrasco, B.; Araya, C.; Salazar, E. Genetic Diversity and Distinctiveness of Chilean Limachino Tomato (Solanum Lycopersicum L.) Reveal an in Situ Conservation during the 20th Century. Frontiers in Conservation Science 2023, 4. [Google Scholar] [CrossRef]
- Wei, K.; Stam, R.; Tellier, A.; Silva-Arias, G.A. Copy Number Variations Shape Genomic Structural Diversity Underpinning Ecological Adaptation in the Wild Tomato Solanum Chilense. bioRxiv 2023. [Google Scholar] [CrossRef]
- Tieman, D.; Zhu, G.; Resende, M.F.R.; Lin, T.; Nguyen, C.; Bies, D.; Rambla, J.L.; Beltran, K.S.O.; Taylor, M.; Zhang, B.; et al. A Chemical Genetic Roadmap to Improved Tomato Flavor. Science 2017, 355. [Google Scholar] [CrossRef] [PubMed]
- Rodríguez, G.R.; Muños, S.; Anderson, C.; Sim, S.C.; Michel, A.; Causse, M.; McSpadden Gardener, B.B.; Francis, D.; van der Knaap, E. Distribution of SUN, OVATE, LC, and FAS in the Tomato Germplasm and the Relationship to Fruit Shape Diversity. Plant Physiol 2011, 156. [Google Scholar] [CrossRef] [PubMed]
Figure 1.
(A) Delta K values for different numbers of populations assumed (K) in the STRUCTURE analysis. (B) Classification of 276 accessions into three populations using STRUCTURE 2.3.1. The distribution of the accessions to different populations is indicated by the color code. Numbers on the y-axis show the subgroup membership, and the x-axis shows the different accession. (C)Unrooted Neighbor-Joining (NJ) tree of the 276accessions drawn by MEGA 11 and each colored shape represents one cluster matching the structure population (red for Q1, green for Q2, and blue for Q3).(D) the scatter diagram of Principal Component Analysis (PCA) of the 276 accessions, calculated by TASSEL and drawn by Excel and each colored spot is representative of one cluster Q1 to Q3 same as in (C).
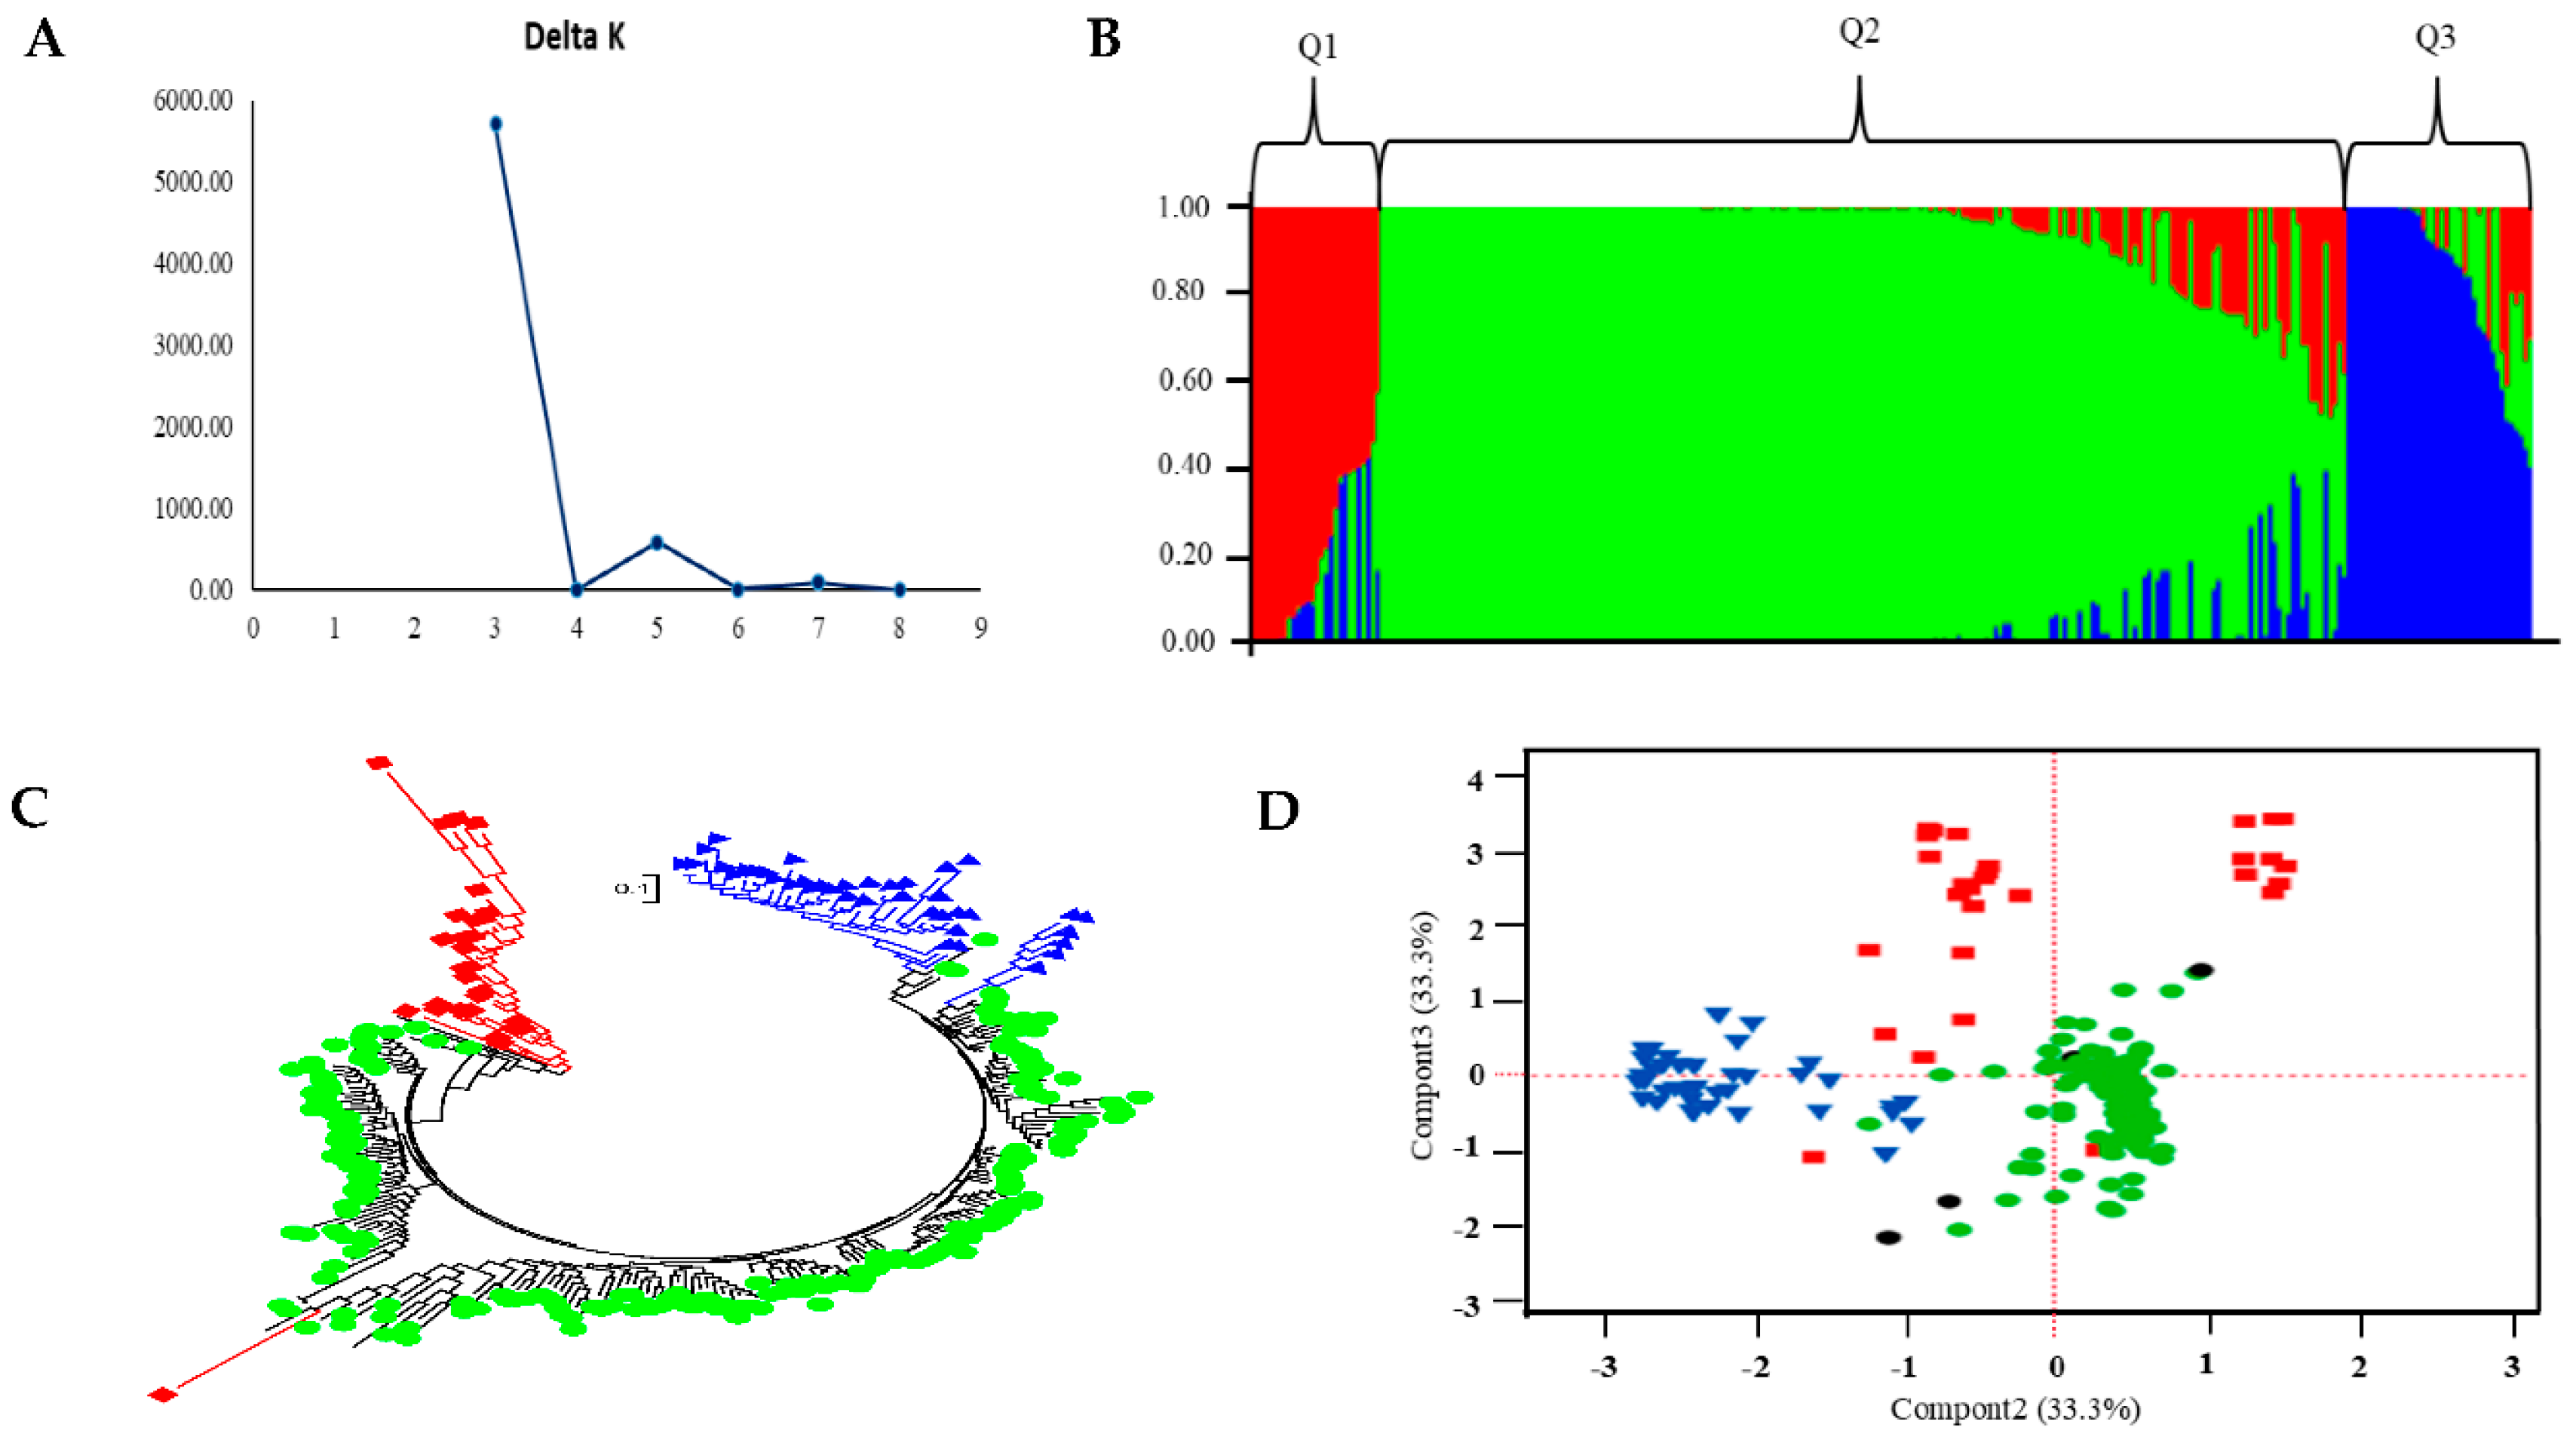
Figure 2.
Neighbor-joining phylogenetic tree of the six regions represented in the 276 tomato accessions, based on CS Chord genetic distance. Colors represent the proportion of accessions belonging to cluster Q3: blue, less than 10%; red, more than 20% (Table 2).
Figure 2.
Neighbor-joining phylogenetic tree of the six regions represented in the 276 tomato accessions, based on CS Chord genetic distance. Colors represent the proportion of accessions belonging to cluster Q3: blue, less than 10%; red, more than 20% (Table 2).
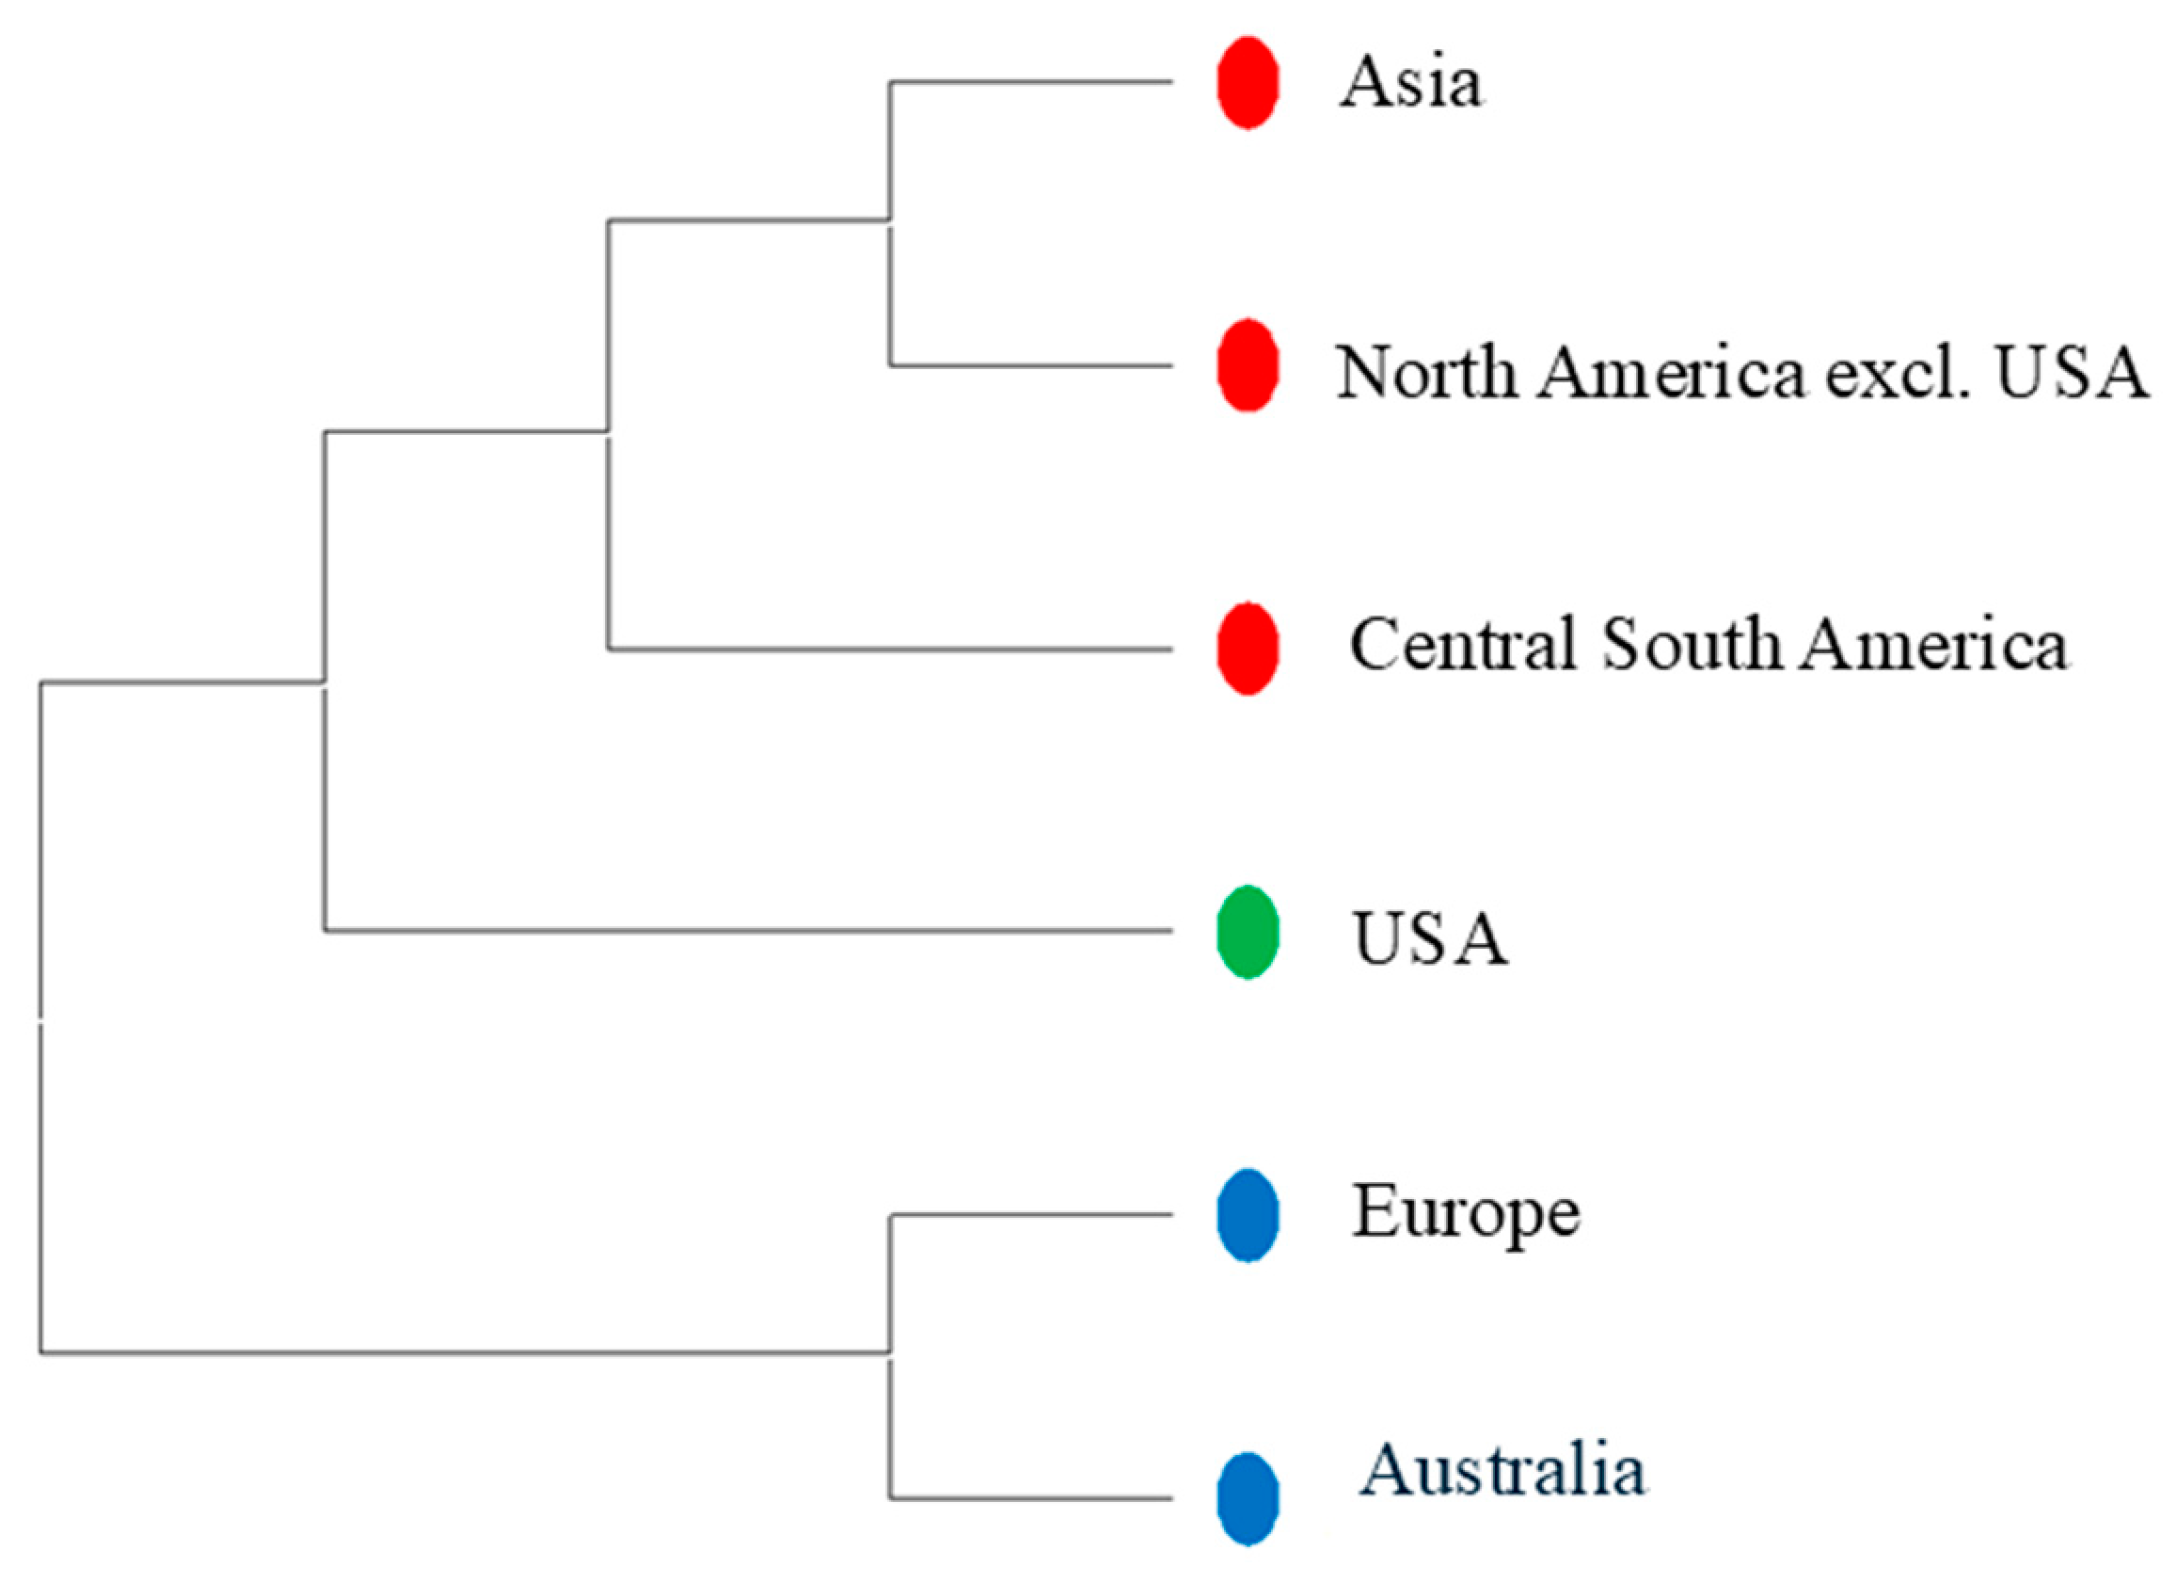
Figure 3.
Neighbor-joining phylogenetic tree of the 11 countries represented by four or more accessions, based on CS Chord genetic distance.
Figure 3.
Neighbor-joining phylogenetic tree of the 11 countries represented by four or more accessions, based on CS Chord genetic distance.
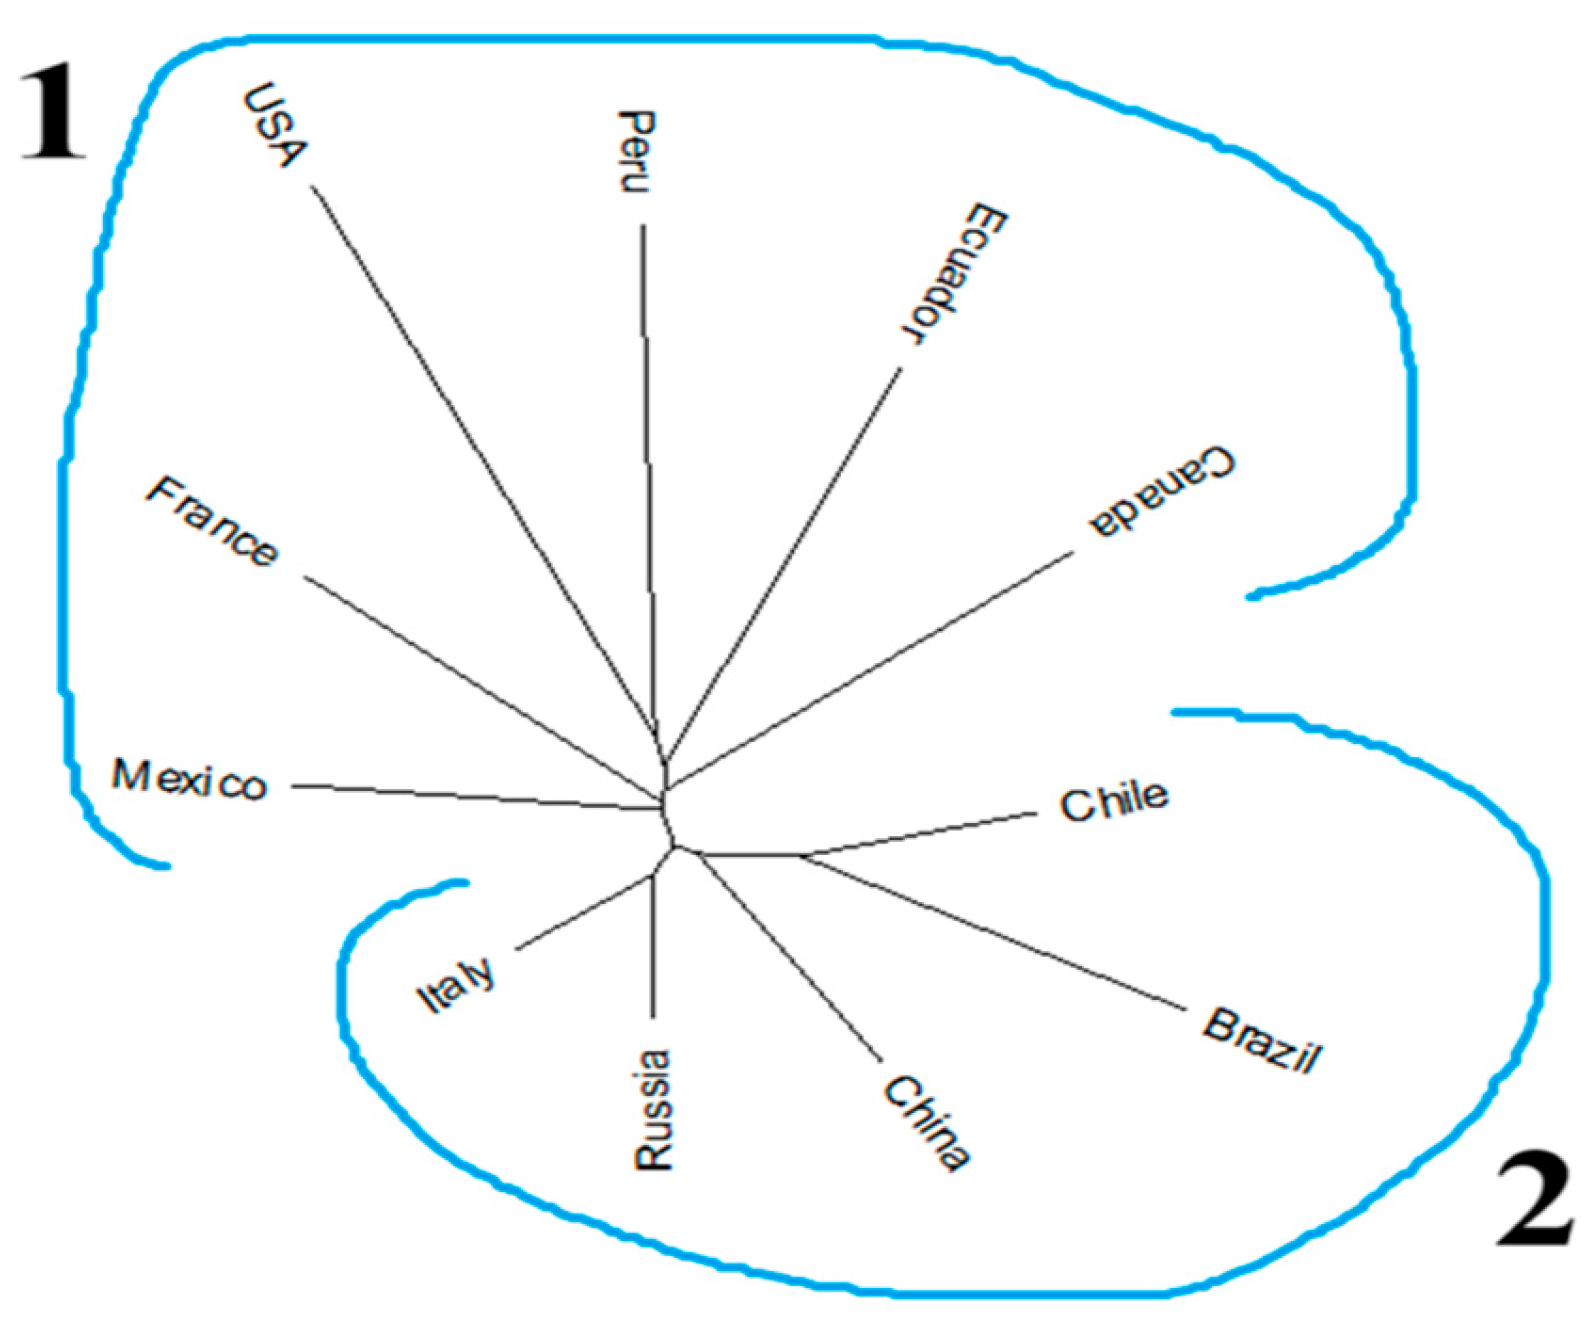

Table 1.
Region-level allelic analysis of 276 tomato accessions based on genotyping of 5161 SNPs.
| Region | No. Accessions |
Major Allele Frequency (%) |
No. Countries |
Gene Diversity |
Heterozygosity | PIC | Country |
|---|---|---|---|---|---|---|---|
| USA | 178 | 82 | 1 | 0.26 | 0.04 | 0.22 | USA |
| North America excl. USA |
20 | 89 | 4 | 0.17 | 0.04 | 0.15 | Canada, Mexico, Trinidad, Cuba |
| Central and South America |
40 | 83 | 13 | 0.28 | 0.1 | 0.24 | Salvador, Guatemala, Nicaragua, Panama, Costarica, Argentina, Bolivia, Brazil, Chile, Colombia, Ecuador, Peru, Venezuela |
| Europe | 23 | 90 | 9 | 0.15 | 0.04 | 0.13 | Bulgaria, Czech, France, Germany, Hungary, Italy, Netherlands, Spain, United Kingdom |
| Asia | 14 | 86 | 7 | 0.22 | 0.04 | 0.19 | Afghanistan, China, Japan, Nepal, Russia, Turkey, Taiwan |
| Australia | 1 | 99 | 1 | 0.004 | 0.01 | 0.003 | Australia |
Table 2.
Representation of phylogenetic clusters among tomato accessions from each region.
| Region | No. of accessions in each cluster by region |
% of accessions in each cluster by region |
Total No. of accessions in each region | ||||||
|---|---|---|---|---|---|---|---|---|---|
| Q1 | Q2 | Q3 | Admixture | Q1 | Q2 | Q3 | Admixture | ||
| USA | 25 | 112 | 32 | 9 | 14 | 62.9 | 17.9 | 5.2 | 178 |
| North America excl. USA | 0 | 19 | 1 | 0 | 0 | 95 | 5 | 0 | 20 |
| Central & South America | 1 | 36 | 1 | 2 | 2.5 | 90 | 2.5 | 5 | 40 |
| Europe | 0 | 23 | 0 | 0 | 0 | 100 | 0 | 0 | 23 |
| Asia | 1 | 11 | 2 | 0 | 7.1 | 78.6 | 14.3 | 0 | 14 |
| Australia | 0 | 1 | 0 | 0 | 0 | 100 | 0 | 0 | 1 |
| 276 | |||||||||
Disclaimer/Publisher’s Note: The statements, opinions and data contained in all publications are solely those of the individual author(s) and contributor(s) and not of MDPI and/or the editor(s). MDPI and/or the editor(s) disclaim responsibility for any injury to people or property resulting from any ideas, methods, instructions or products referred to in the content. |
© 2024 by the authors. Licensee MDPI, Basel, Switzerland. This article is an open access article distributed under the terms and conditions of the Creative Commons Attribution (CC BY) license (http://creativecommons.org/licenses/by/4.0/).
Copyright: This open access article is published under a Creative Commons CC BY 4.0 license, which permit the free download, distribution, and reuse, provided that the author and preprint are cited in any reuse.


