Preprint
Article

From Single-Cell RNA Sequencing to Functional Networks: Understanding Genetic Variants in Cancer Through Perturb-seq

This version is not peer-reviewed.

Submitted:

30 October 2024

Posted:

01 November 2024

You are already at the latest version

Abstract
This project introduces a comprehensive pipeline that integrates various bioinformatics tools and methodologies derived from extensive bibliographic research to leverage Perturb-seq, a high-throughput sequencing method, for finding complex altered protein–protein interaction (PPi) subnetworks in cancer variants. The pipeline demonstrates excellent performance, successfully distinguishes impactful, identifies variants with similar expression profiles, and shows promising results for retrieving key affected modules already observed in KRAS and TP53 variants. These promising results indicate the potential of the Perturb-seq approach to become a standard strategy for uncovering not only common significantly expressed genes, but also interactors that could be targeted in future therapeutic strategies. All code to recapitulate the analysis is available along with documentation of pipeline usage at https://github.com/jesusch10/perturbseq_analysis.
Keywords: 
Subject: 
Biology and Life Sciences  -   Biology and Biotechnology
Biomarkers and Therapeutic Targets Based on Bioinformatical Studies

1. Introduction

Regulatory networks govern cellular diversity and responses, making them crucial to functionally characterize the pathways that influence cell fate and behaviour for developing advanced targeted and combination therapies (Jaitin et al., 2016; Replogle et al., 2022). However, analysing cell-type-specific changes in complex organs and differentiation hierarchies is challenging due to the intricate nature of biological circuits, which involve redundancies, nonlinear interactions between pathways, and variability in cellular plasticity and heterogeneity in both in vivo and in vitro models. There is a need for genome-wide approaches that can identify interactions between genetic elements at the single-cell level (Jaitin et al., 2016; Datlinger et al., 2017).
In cancer research and clinical practice, identifying driver genes and pathways is essential (Beroukhim et al., 2010; Martínez-Jiménez et al., 2020; Bailey et al., 2018). A gene expression change induced by a cancer variant compared to the control or wild type (WT) allele can hint at its biological role but does not directly indicate physiological outcomes like tumour development or drug response (Ursu et al., 2022). Frequency-based methods in genome-wide screens have been effective in identifying potential driver genes by finding those with unexpectedly high mutation rates during cancer progression (Wood et al., 2007; Jones et al., 2008; Parsons et al., 2008; Ding et al., 2008; Cancer Genome Atlas Research Network, 2008). This framework has evolved with Perturb-seq, a novel high-throughput method that allows for multi-locus gene perturbation with single-cell transcriptome profiling (Dixit et al., 2016; Adamson et al., 2016; Jaitin et al., 2016; Replogle et al., 2022).
Yet, the resulting list of potential driver genes often lacks a unified biological background linking these genes to specific phenotypes and identifying alternative targets of interest (Wu et al., 2010; Yang et al., 2021). To overcome these limitations, new network-based methods have been developed that combine genomics data with protein–protein interaction (PPi) network topology (Yang et al., 2023; Leiserson et al., 2015; Levi et al., 2021; Chitra et al., 2022).
For instance, numerous mutations in TP53 and KRAS have been discovered in lung cancer. Since these proteins influence various cellular pathways, it's important to understand not just the function of each mutation, but also how it might impact specific pathways. However, the underlying cellular and molecular mechanisms remain unclear (Canale et al., 2022; Berger et al., 2016). Existing methods vary, leading to inconsistent results, and mainly focus on static interaction networks. Grouping variants with similar effects could reduce computational costs, and creating an expression-based atlas of cancer variant impacts could serve as an initial framework for annotating allele functions (Ursu et al., 2022). Iterative analysis can also improve the accuracy of results by prioritizing and validating significant interactions and addressing issues with noisy datasets that cause false positives (Replogle et al., 2022; Wu et al., 2010).
This project presents a comprehensive and efficient pipeline that compares and integrates various bioinformatics tools and methodologies, based on extensive literature review, to successfully distinguish impactful variants, identify variants with similar expression profiles, and retrieve key affected modules, such as those observed in KRAS and TP53 variants (Figure 1). The pipeline begins with the high-throughput counts matrix obtained from any Perturb-seq experiment. The data is then processed to remove low-quality genes and cells, followed by normalization of the counts. Impactful variants are identified using the Hotelling T² statistic, while similar variants are grouped by Spearman correlation. Genes from each variant cluster are input into STRING to create a PPi network in Cytoscape, enabling the recovery of interconnected nodes (Szklarczyk et al., 2019; Shannon et al., 2003). These nodes are further annotated with log fold changes (LFCs) and p-values via differential expression analysis. This framework serves as the input for an implementation of the Hierarchical HotNet algorithm, which addresses the limitations of current network-propagation methods (Reyna et al., 2018). Detected altered subnetworks are divided into biologically meaningful modules using the MCODE tool in Cytoscape and annotated in Reactome, so interactions are cross-validated too (Bader et al., 2003; Vastrik et al., 2007). All code for replicating the analysis, along with documentation on pipeline usage, is available at https://github.com/jesusch10/perturbseq_analysis.

1.1. Perturb-seq as standard strategy

Bulk RNA sequencing (bulk RNA-seq) and single-cell RNA sequencing (scRNA-seq) are both methods widely used to analyse gene expression profiles in cells. Unlike bulk RNA-seq, which captures the average gene expression across a population of heterogenous cells masking subtle and time-dependent transcriptional differences, scRNA-seq allows to study the transcriptome of individual cells identifying key regulators (Yu et al., 2021). However, this technology is inherently descriptive and does not establish causality unless combined with perturbation models. When integrated with such models, genetic interactions can reveal functional relationships between genes and pathways in different cellular contexts, though this is constrained by the number of single cells that can be sequenced (Jaitin et al., 2016).
Genetic screens systematically assess gene function in eukaryotic cells and can be designed in two main formats: (1) an "arrayed" format in which each perturbation is applied and analysed separately to interpret the combined nonlinear effects of multiple factors, or (2) a "pooled" format, which is more efficient and scalable and allows for the examination of higher-order interactions but is limited to simpler readouts (Dixit et al., 2016).
Pooled genetic screens are effective tools for discovering mechanisms affecting cell survival, proliferation, drug resistance, and viral infection. However, they rely on basic phenotypic readouts that average population properties and do not distinguish between different perturbations causing similar responses or account for bulk phenotypes driven by diverse cell subpopulations (Adamson et al., 2016; Jaitin et al., 2016). Additionally, as CRISPR/Cas9 is often used for pooled screens, cells must be physically separated to receive individual gRNAs, limiting the resolution needed for transcriptome profiling and understanding complex phenotypes (Jaitin et al., 2016; Datlinger et al., 2017; Replogle et al., 2022). Mapping genetic changes to their phenotypic consequences traditionally involves either a (1) phenotype-centric or "forward genetic" approach which identifies genetic changes driving specific phenotypes, or (2) a gene-centric or "reverse genetic" approach, which catalogues phenotypes resulting from specific genetic changes. Both approaches have limitations, with forward screens typically using simple phenotypes that may conflate different mechanisms and reverse screens being limited to chosen targets limiting systematic comparisons (Replogle et al., 2022).
To address these challenges, a novel high-throughput method called Perturb-seq has been developed. This technique combines CRISPR/Cas9 for multi-locus gene perturbation with high efficacy and specificity, and massively parallel droplet-based scRNA-seq with high resolution. Perturb-seq generates comprehensive genotype-phenotype maps by profiling hundreds of thousands of separately perturbed cells, providing detailed phenotypic readouts (Dixit et al., 2016; Adamson et al., 2016; Jaitin et al., 2016; Replogle et al., 2022).
Perturb-seq enables the analysis in vitro and in vivo of complex phenotypes from large numbers of perturbations and combinations, reducing the time and cost associated with transcriptome assays without needing complex reagents (Dixit et al., 2016; Jaitin et al., 2016; Datlinger et al., 2017; Replogle et al., 2022). By extending this method to other high-dimensional molecular phenotypes or diverse cell metadata, the same experiment can reveal genetic interactions and contributions of PPi (Dixit et al., 2016). Many well-characterized human genes serve as controls to help interpret comprehensive datasets (Replogle et al., 2022).
The Perturb-seq pipeline begins with a robust triple cell barcoding strategy that encodes CRISPR-mediated perturbations in expressed transcripts captured during scRNA-seq. This involves two indices included in cDNA molecules: (1) a cell barcode (CBC) to label all mRNA from a specific cell, and (2) a unique molecular identifier (UMI) for molecular counting of captured mRNA correcting for PCR duplicates (Adamson et al., 2016). The third index, a guide barcode (GBC), is a synthetic transcript usually transduced into cells by lentiviruses to identify the specific perturbation, such as a Cas9-targeting single guide RNA (sgRNA); UMI usually goes in the same viral vector along with Cas9 (Adamson et al., 2016; Jaitin et al., 2016; Datlinger et al., 2017).
To manage sequencing costs, methods like target amplification or depletion of high-abundance genes can be used. As technology matures, costs per cell are decreasing, but analysing the vast output of noisy data remains challenging. This data needs to address various aspects such as differential gene expression, RNA splicing, TE expression, differentiation, transcriptional heterogeneity, cell-cycle progression, and chromosomal instability (Adamson et al., 2016; Replogle et al., 2022). Moreover, for detecting alleles with strong effects, or possibly alleles with smaller effect sizes by grouping similar variants, a calculation of 20 cells per variant is enough (Ursu et al., 2022).
Perturb-seq is not restricted to coding genes or gene knockdown but can also perturb non-coding RNAs, promoters, and enhancers (Jaitin et al., 2016). On the other hand, Perturb-seq is compatible with various CRISPR-based perturbations, including CRISPR interference (CRISPRi), which allows for sequence-specific repression of gene expression in both prokaryotic and eukaryotic cells (Replogle et al., 2022; Jensen et al., 2021). Studies applying CRISPRi have successfully produced loss-of-function perturbations, though as described the data generated on different transcriptional phenotypes is limited (Adamson et al., 2016; Replogle et al., 2022; Wu et al., 2022; Tian et al., 2019).

1.2. Resolving affected biological pathways by interpreting high-throughput data

Emerging functional genomic tools are focused on analysing biochemical events that drive cellular processes, crucial for understanding the progression of various cancer types (Zheng et al., 2023; Vogelstein et al., 2004). Different cancer types can originate through multiple routes (Vogelstein et al., 2004). Yet, large-scale genome-wide screening projects have identified common core signalling pathways involved in cancer etiology (Wood et al., 2007; Jones et al., 2008; Parsons et al., 2008; Ding et al., 2008; Cancer Genome Atlas Research Network, 2008). By mapping mutated, amplified, or deleted genes onto biological pathways, researchers can identify statistically significant clusters of otherwise unrelated genes, revealing the biological pathways affected by these genetic alterations (Wu et al., 2010).
Gene regulatory networks (GRNs) illustrate the functional regulatory interactions between DNA-binding transcription factors (TFs) and their target genes (Yachie-Kinoshita et al., 2019). Reconstructing GRNs requires combining various experimental observations, such as spatial and temporal gene expression data (Keat Wei et al., 2017; Babichev et al., 2019). Many tools have been developed for GRN reconstruction (Dixit et al., 2016; Aibar et al., 2017; Margolin et al., 2006). However, these tools often treat TFs as uniform features and do not consider specific characteristics like DNA-binding domains, protein domains, structure, or subcellular localization (Holland et al., 2020; Hecker et al., 2023).
Reconstructing GRNs has significant challenges, including the need for extensive computational resources, time-consuming data processing, and the complexity of interpreting the resulting networks (Babichev et al., 2019). Network inference algorithms perform better with data from 'structural' perturbations, but they still lack robust causal inference capabilities after 20 years of research (Soranzo et al., 2007) (Saint-Antoine et al., 2023; Kim et al., 2003). One reason is that single-cell RNA-seq techniques may not yet provide sufficient resolution and expression variation for reliable GRN inference, despite rapid advances in the number of cells measured and the depth of coverage (Pratapa et al., 2020). Consequently, available GRNs likely represent only a small fraction of all in vivo interactions (Walhout, 2006).
Protein-protein interaction (PPi) networks are other static models that help to understand molecular and cellular mechanisms controlling physiology and progression of diseases (Davidson et al., 2002; Safari-Alighiarloo et al., 2014). Analysing amino acid substitutions that create deleterious phenotypes can reveal active parts of the network and their biological consequences (Ozturk et al., 2022). This information is valuable for developing effective diagnostic and therapeutic strategies (Davidson et al., 2002). The scale-free topology of PPi networks suggests a higher tolerance to random failures, making them more robust than GRNs for studying variants affecting high-degree nodes. In fact, there are much more PPi structurally resolved available than GRNs, ideal for the purpose of this project (Ozturk et al., 2022).

2. Methods

2.1. Data and filtering

Specialized software is used to demultiplex, filter, and align sequencing reads to the corresponding reference transcriptome and the reference gRNA library (Meyers et al., 2023; Zhou et al., 2011; Spisak et al., 2024; Schnitzler et al., 2024). Cell Ranger 3.0 is commonly employed for these tasks (Dixit et al., 2016; Adamson et al., 2016; Replogle et al., 2022; Ursu et al., 2022; Otto et al., 2023; Pacalin et al., 2024; Zheng et al., 2023; Butterworth et al., 2023; Ozturk et al., 2023; Jin et al., 2020). There are various methods to assign cells to variants, such as using at least one UMI supporting the variant, thresholding UMI counts, or selecting the greatest UMI counts (Ursu et al., 2022; Barry et al., 2024; Papalexi et al., 2021; Schraivogel et al., 2020).
Given the difficulty of dealing with the many ways to conduct a Perturb-seq experiment, efforts should focus on the resulting common matrix of UMI counts, with CBC as rows and gene identities as columns. The analytical pipeline purposed here aims to parse and decompose the noisy count matrix generated by Perturb-seq, which contains RNA-seq profiles of tens of thousands of individual cells, into interpretable components that separate the responses to a given perturbation at the resolution of individual cells (Adamson et al., 2016).
The raw counts used in this project are publicly accessible on Gene Expression Omnibus (accession number GSE161824 (Barrett et al., 2013). This data includes expression profiling by high throughput sequencing of 300,000 single lung cancer cells, with 98 and 99 variants, including the wild type (WT) for TP53 and KRAS experiments, respectively, already assigned (Ursu et al., 2022).
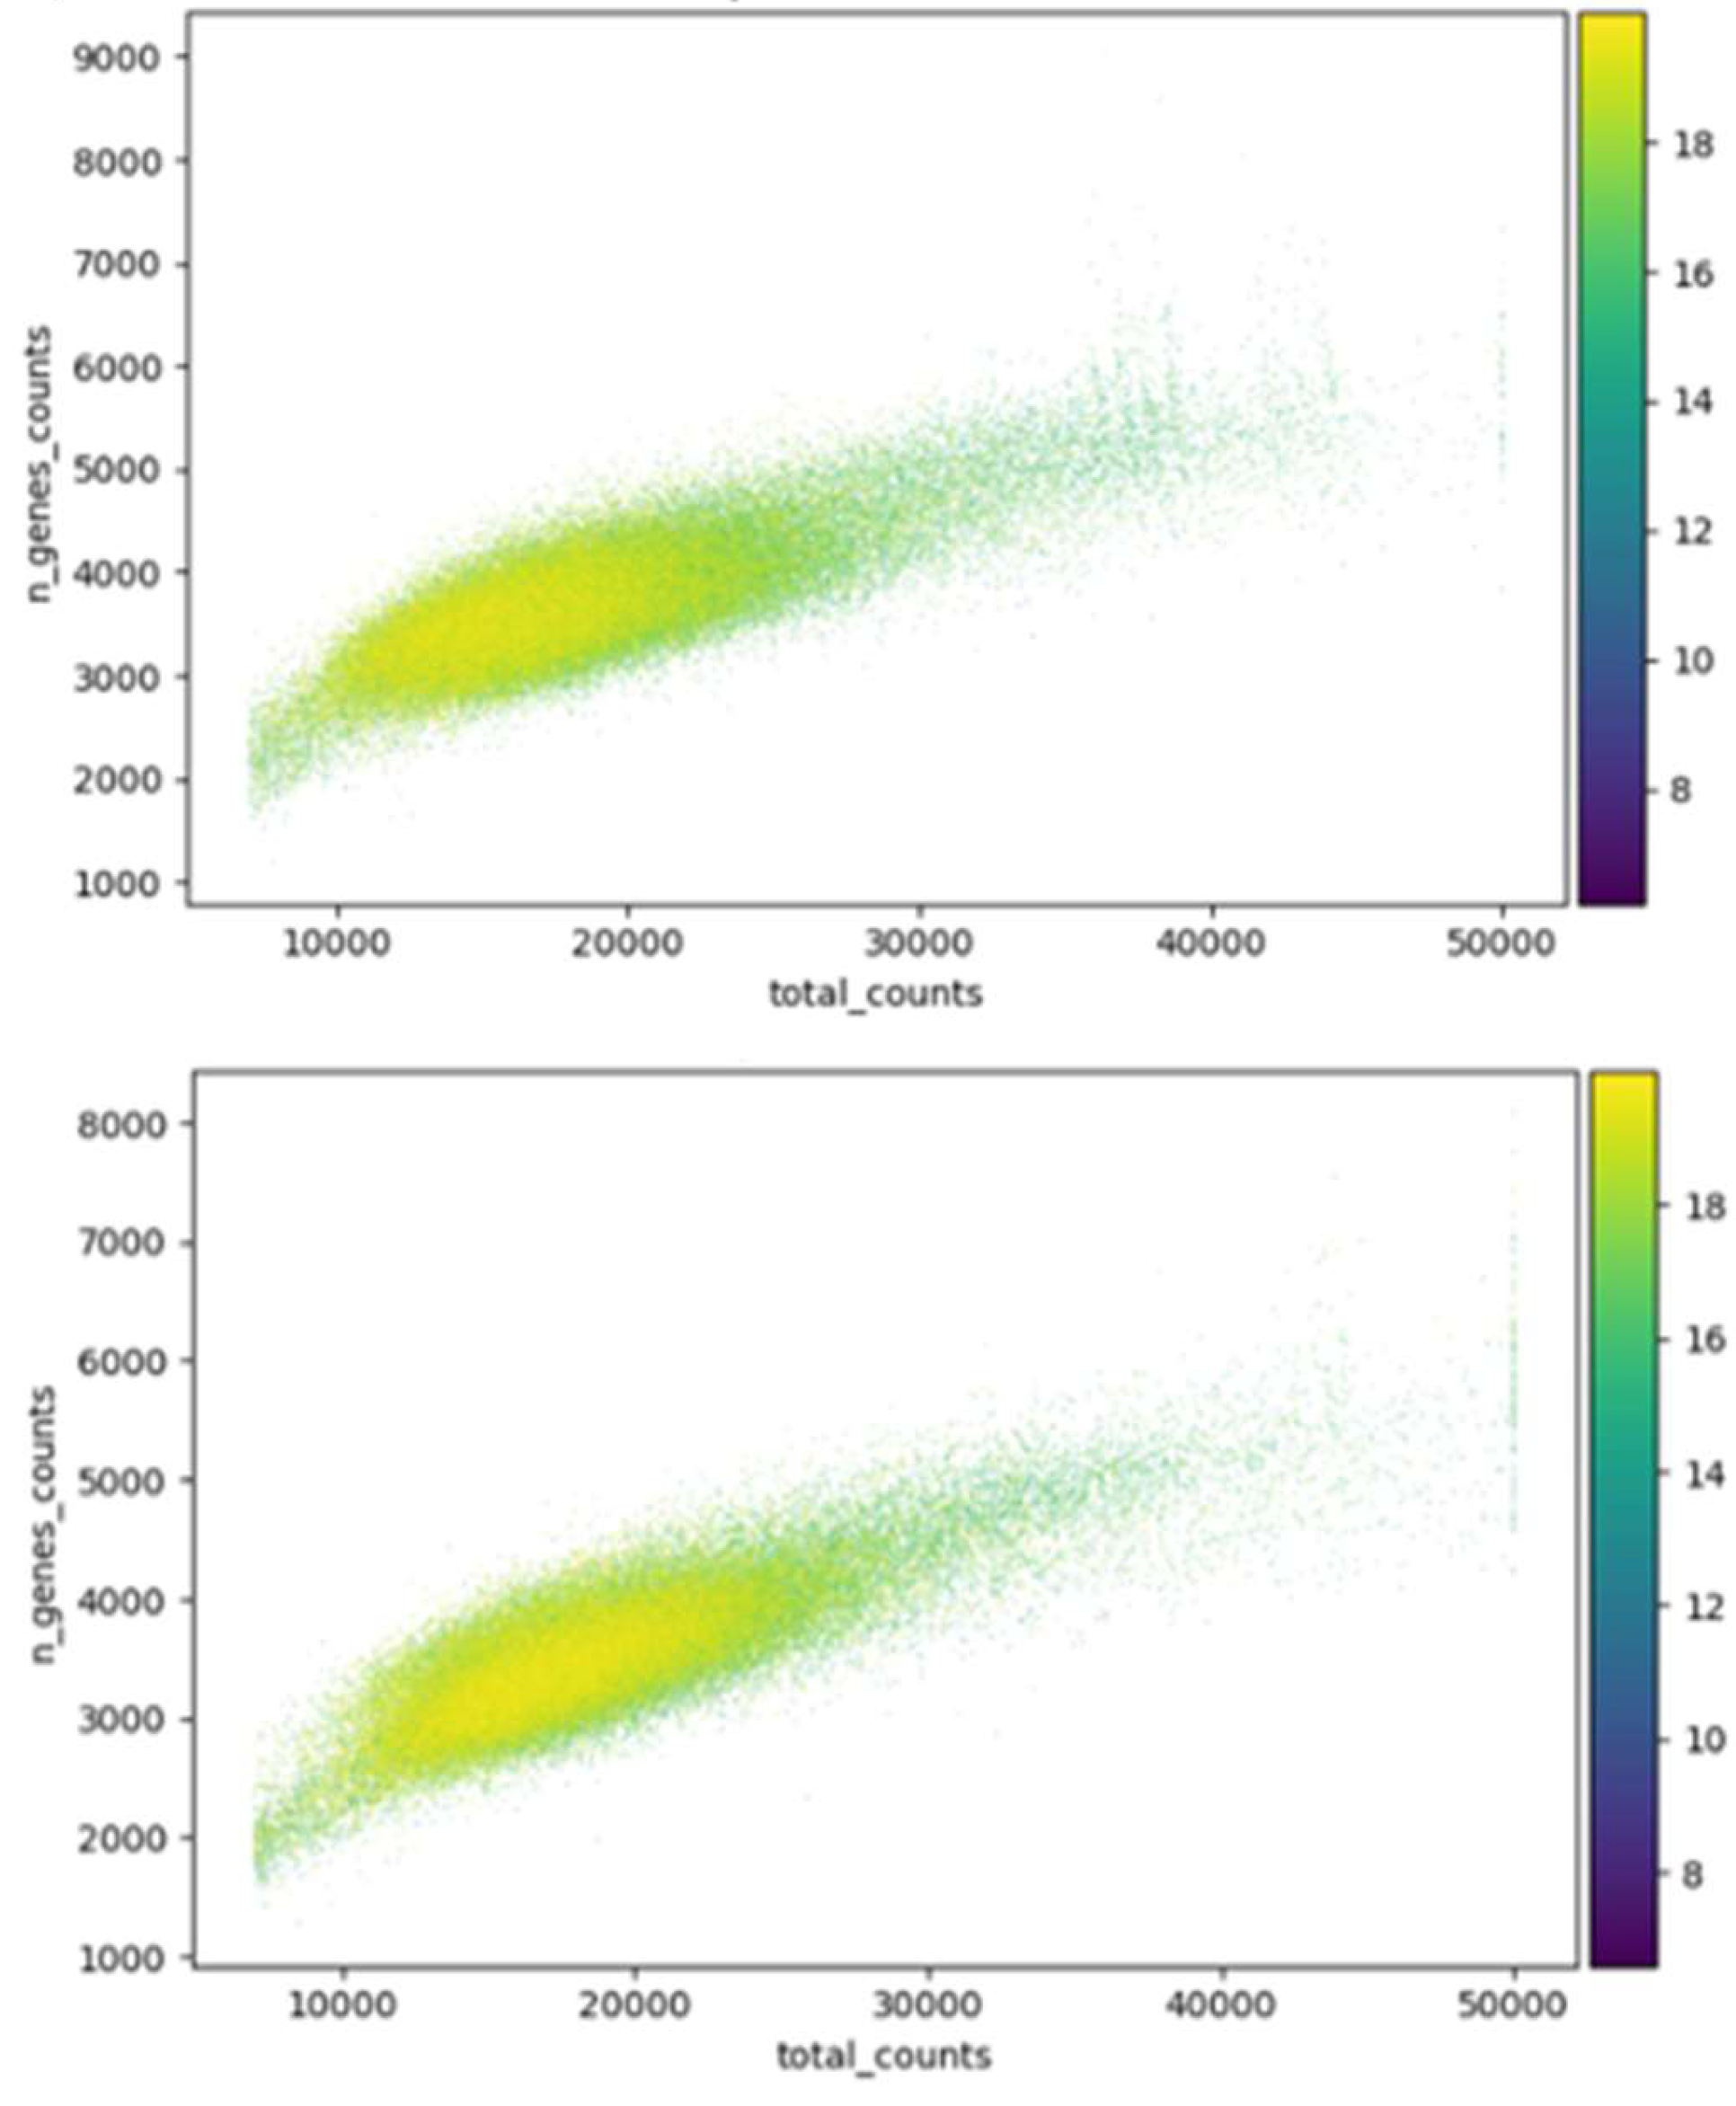
Initially, raw data is visually inspected, plotting the total number of counts per cell (UMIs) against the number of genes with non-zero counts to then set 7,000 and 50,000 as UMI range. Cells with unusually high sequencing depth are downsampled, while low-quality cells with counts below the minimum threshold are filtered out. Batch effect correction is performed by downsampling channels by a factor calculated as the UMI median of a batch divided by 20,000, the desired UMI median for sequencing depth across batches. Channels with a UMI median less than the desired value are not adjusted (Ursu et al., 2022).
As a default parameter, cells with more than 20% mitochondrial genes counts are filtered out, as high mitochondrial gene expression indicates stressed or dying cells (Griffiths et al., 2021; Sunshine et al., 2023; Lotfollahi et al., 2023; Otto et al., 2023). For this purpose, the MitoCarta3.0 database provides updated mitochondrial gene symbols (Rath et al., 2021). Using the Scanpy toolkit, cells with fewer than 200 non-zero count genes and genes expressed in less than 5% of cells are also filtered (Figure 2) (Wolf et al., 2018; Littman et al., 2023; Otto et al., 2023; Pacalin et al., 2024). Data normalization follows, adjusting each cell's total count to 10,000 and applying a natural logarithm transformation to the data matrix (Ursu et al., 2022; Lotfollahi et al., 2023; Otto et al., 2023).
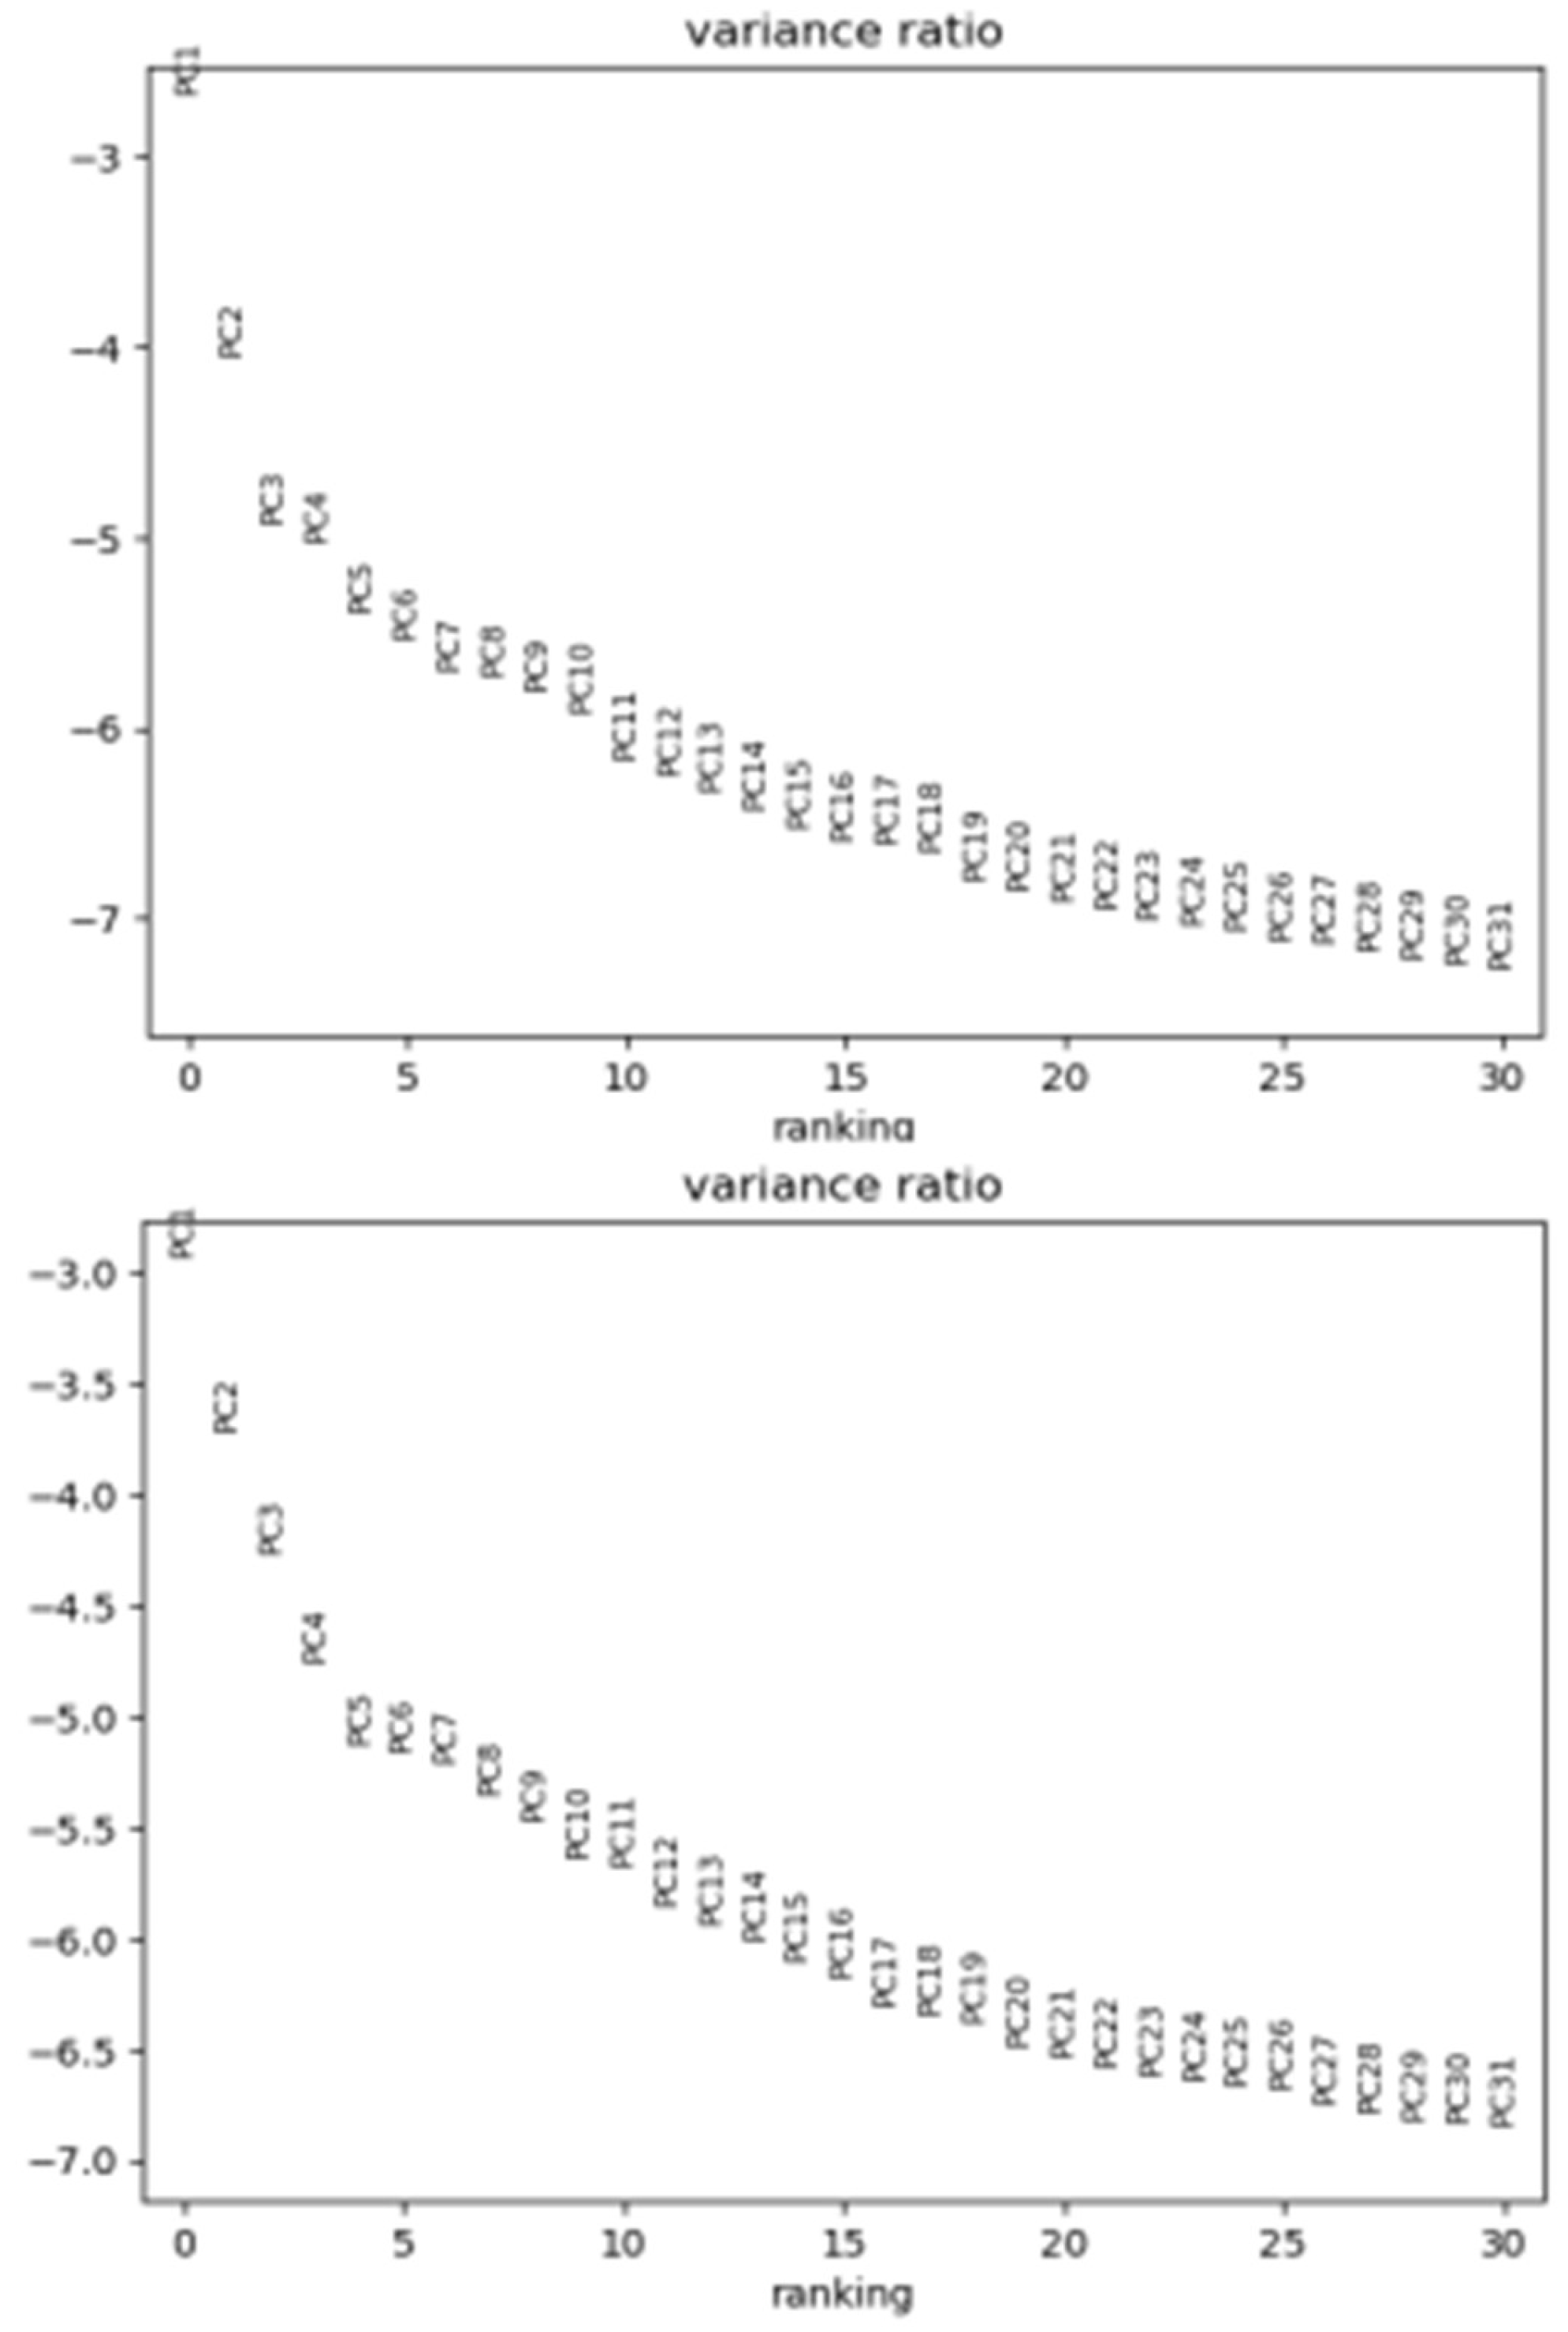
To select the most informative genes, an additional filtering step selects the most highly variable genes. Thresholds are set at 0.0125 to 4 for mean gene expression, and 0.4 for the minimum gene dispersion (variability in expression across cells) (Zheng et al., 2017). The data matrix is then scaled to unit variance and zero mean (z-scores), and Principal Component Analysis (PCA) is used for dimensionality reduction, keeping the first 50 principal components (PCs) (Figure 3) (Replogle et al., 2022; Ursu et al., 2022).

2.2. Comparing variants

To quantify the deviation between each perturbation and the WT, Hotelling’s two-sample T-squared statistic (T²), a multivariate extension of the t-test for two-sample hypothesis testing, can be used in the PC space, implemented with the spm1d Python package (Hotelling, 1992) (Pataky, 2012). Hotelling T² requires at least as many PCs as there are cells
per variant, at least 20 cells per variant as mentioned, so the top 20 PCs are used to compare matrices of cells of 20 PCs for each variant (Ursu et al., 2022). This quantifies the extent to which a variant's expression profile deviates from the WT: higher scores indicate a higher impact (likely a loss-of-function), while lower scores suggest 'WT-like' perturbations (possible gain-of-function) (Butterworth et al., 2023; Ozturk et al., 2023). Non-functional variant positions are under positive selective pressure in tumours and are frequently mutated across patients (Ursu et al., 2022).
To identify 'impactful' variants that significantly change their expression profile, a null distribution of Hotelling T² statistic scores is derived by permuting the count matrix (Ursu et al., 2022). For a 95% confidence interval, the score threshold for a desired False Discovery Rate (FDR) is computed, yielding thresholds of 44.42 and 41.55 for the TP53 and KRAS experiments, respectively.
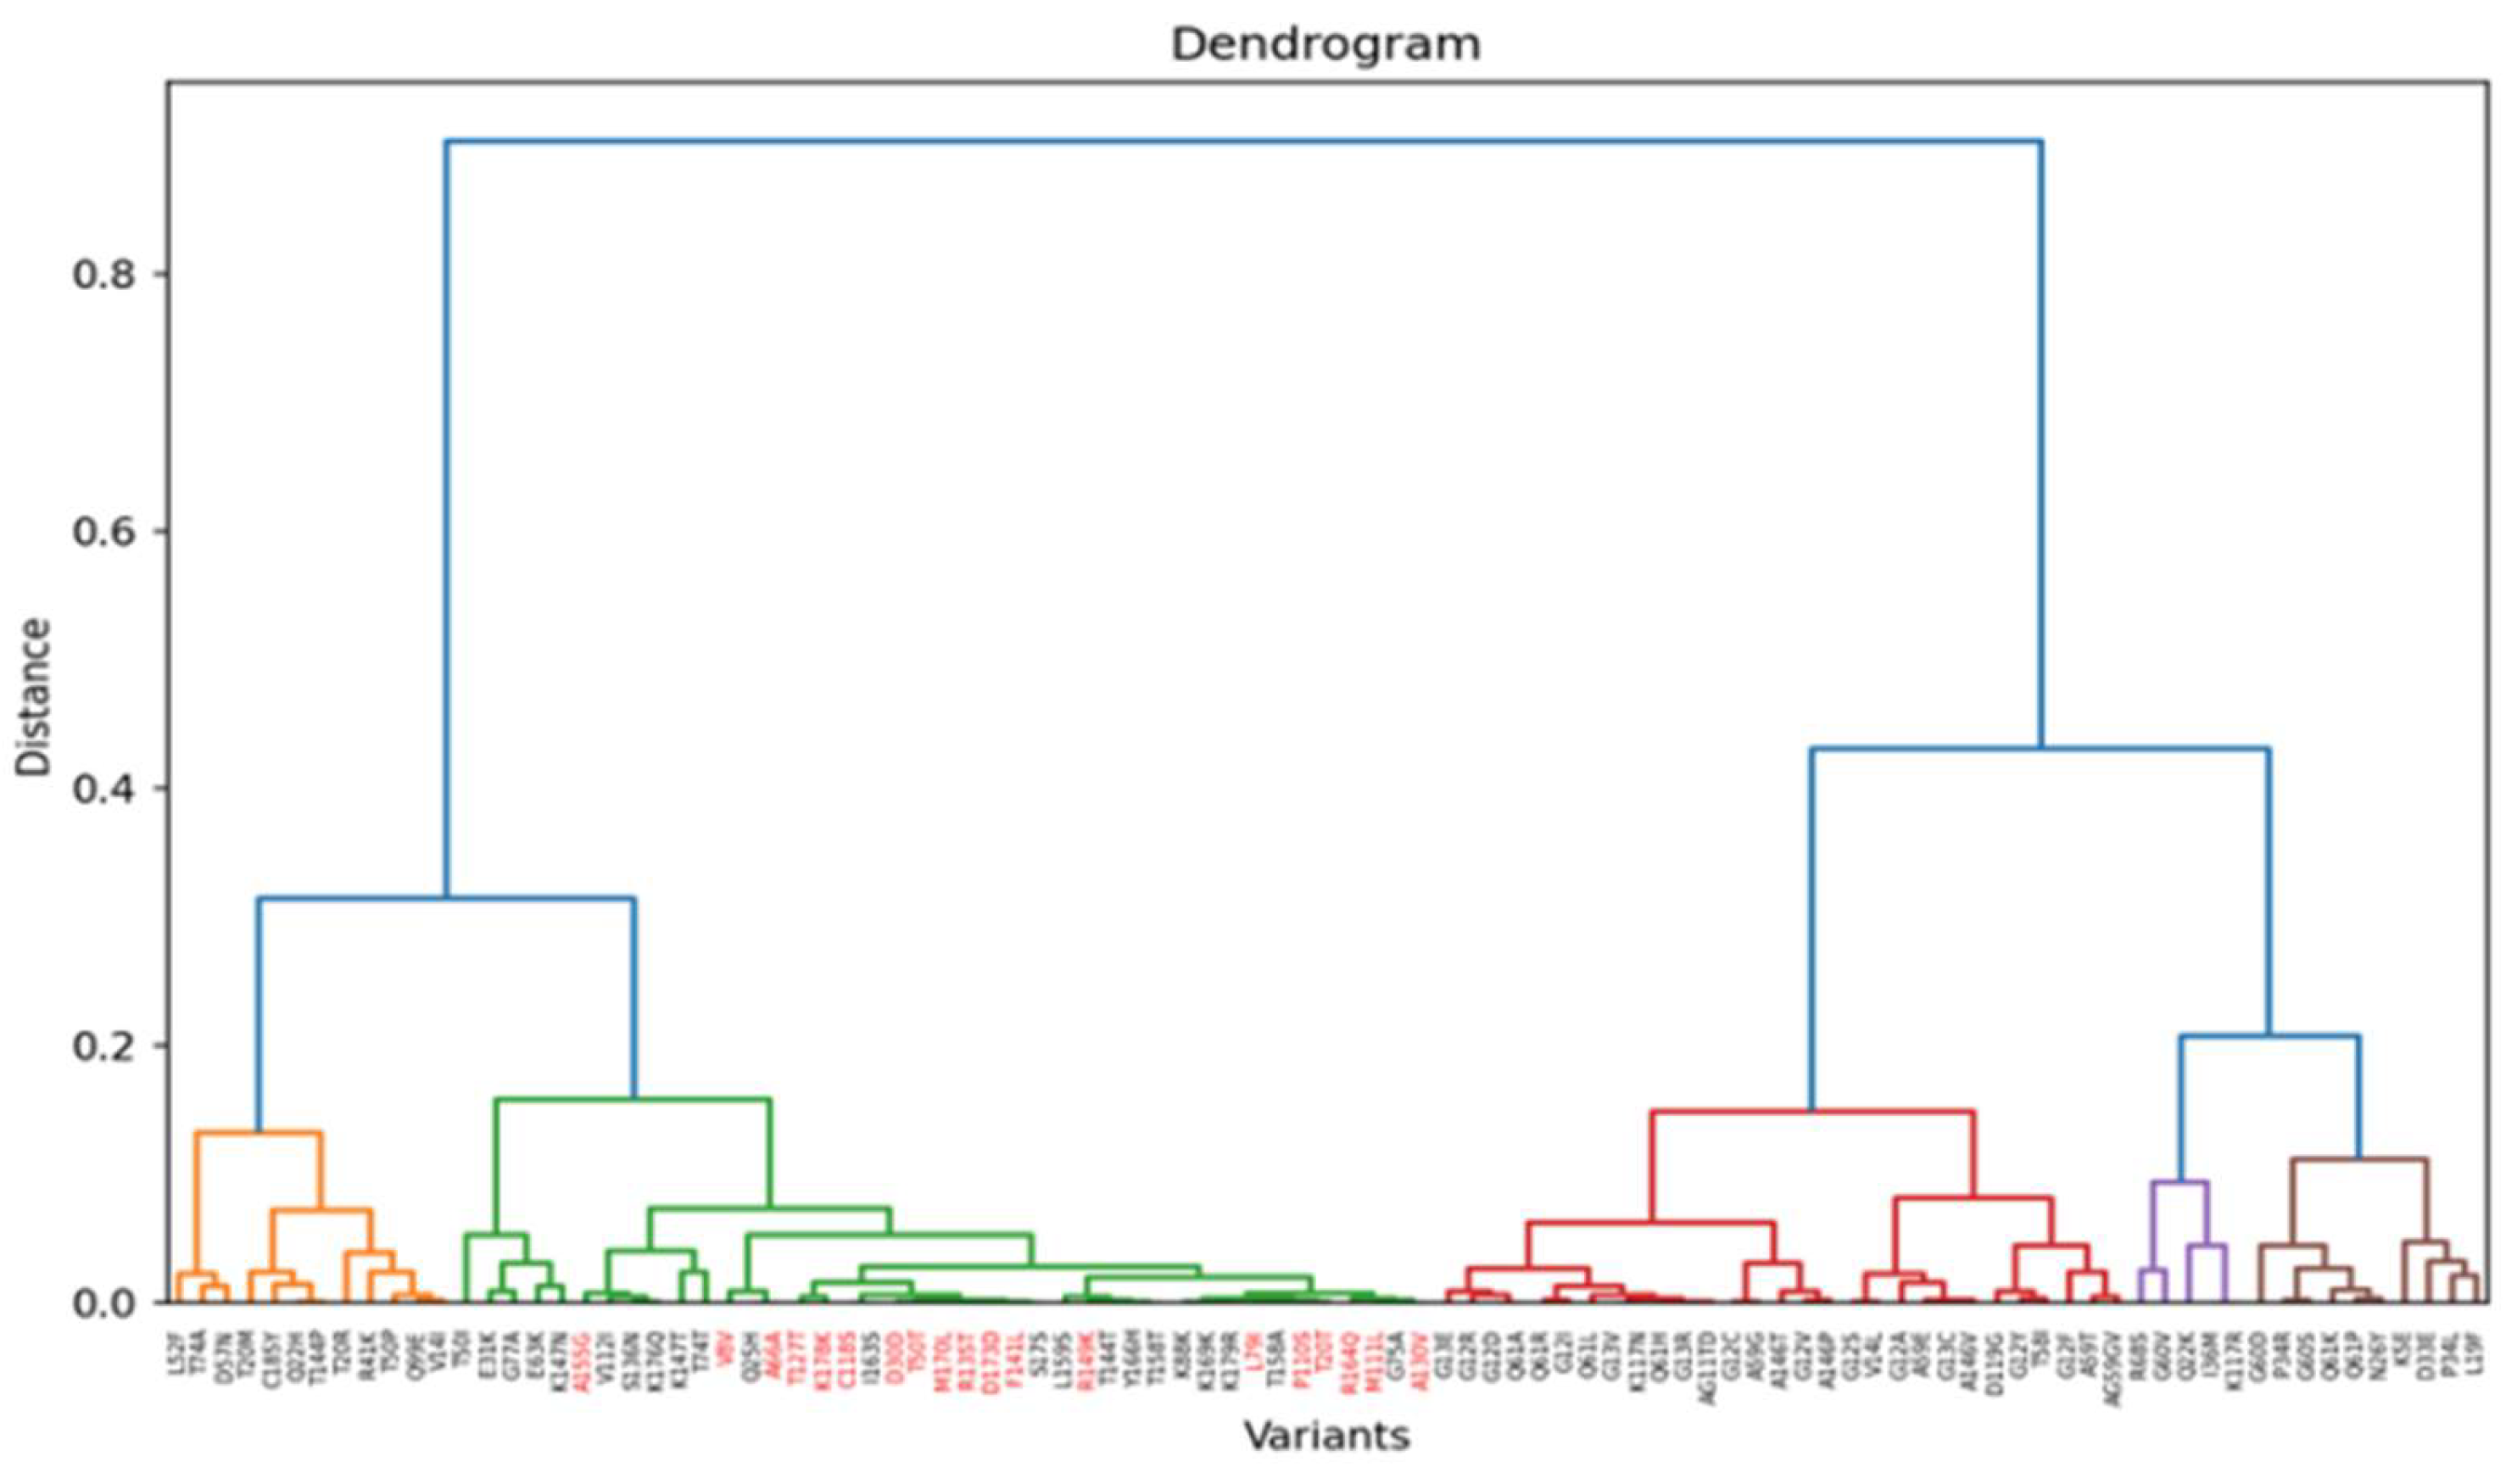
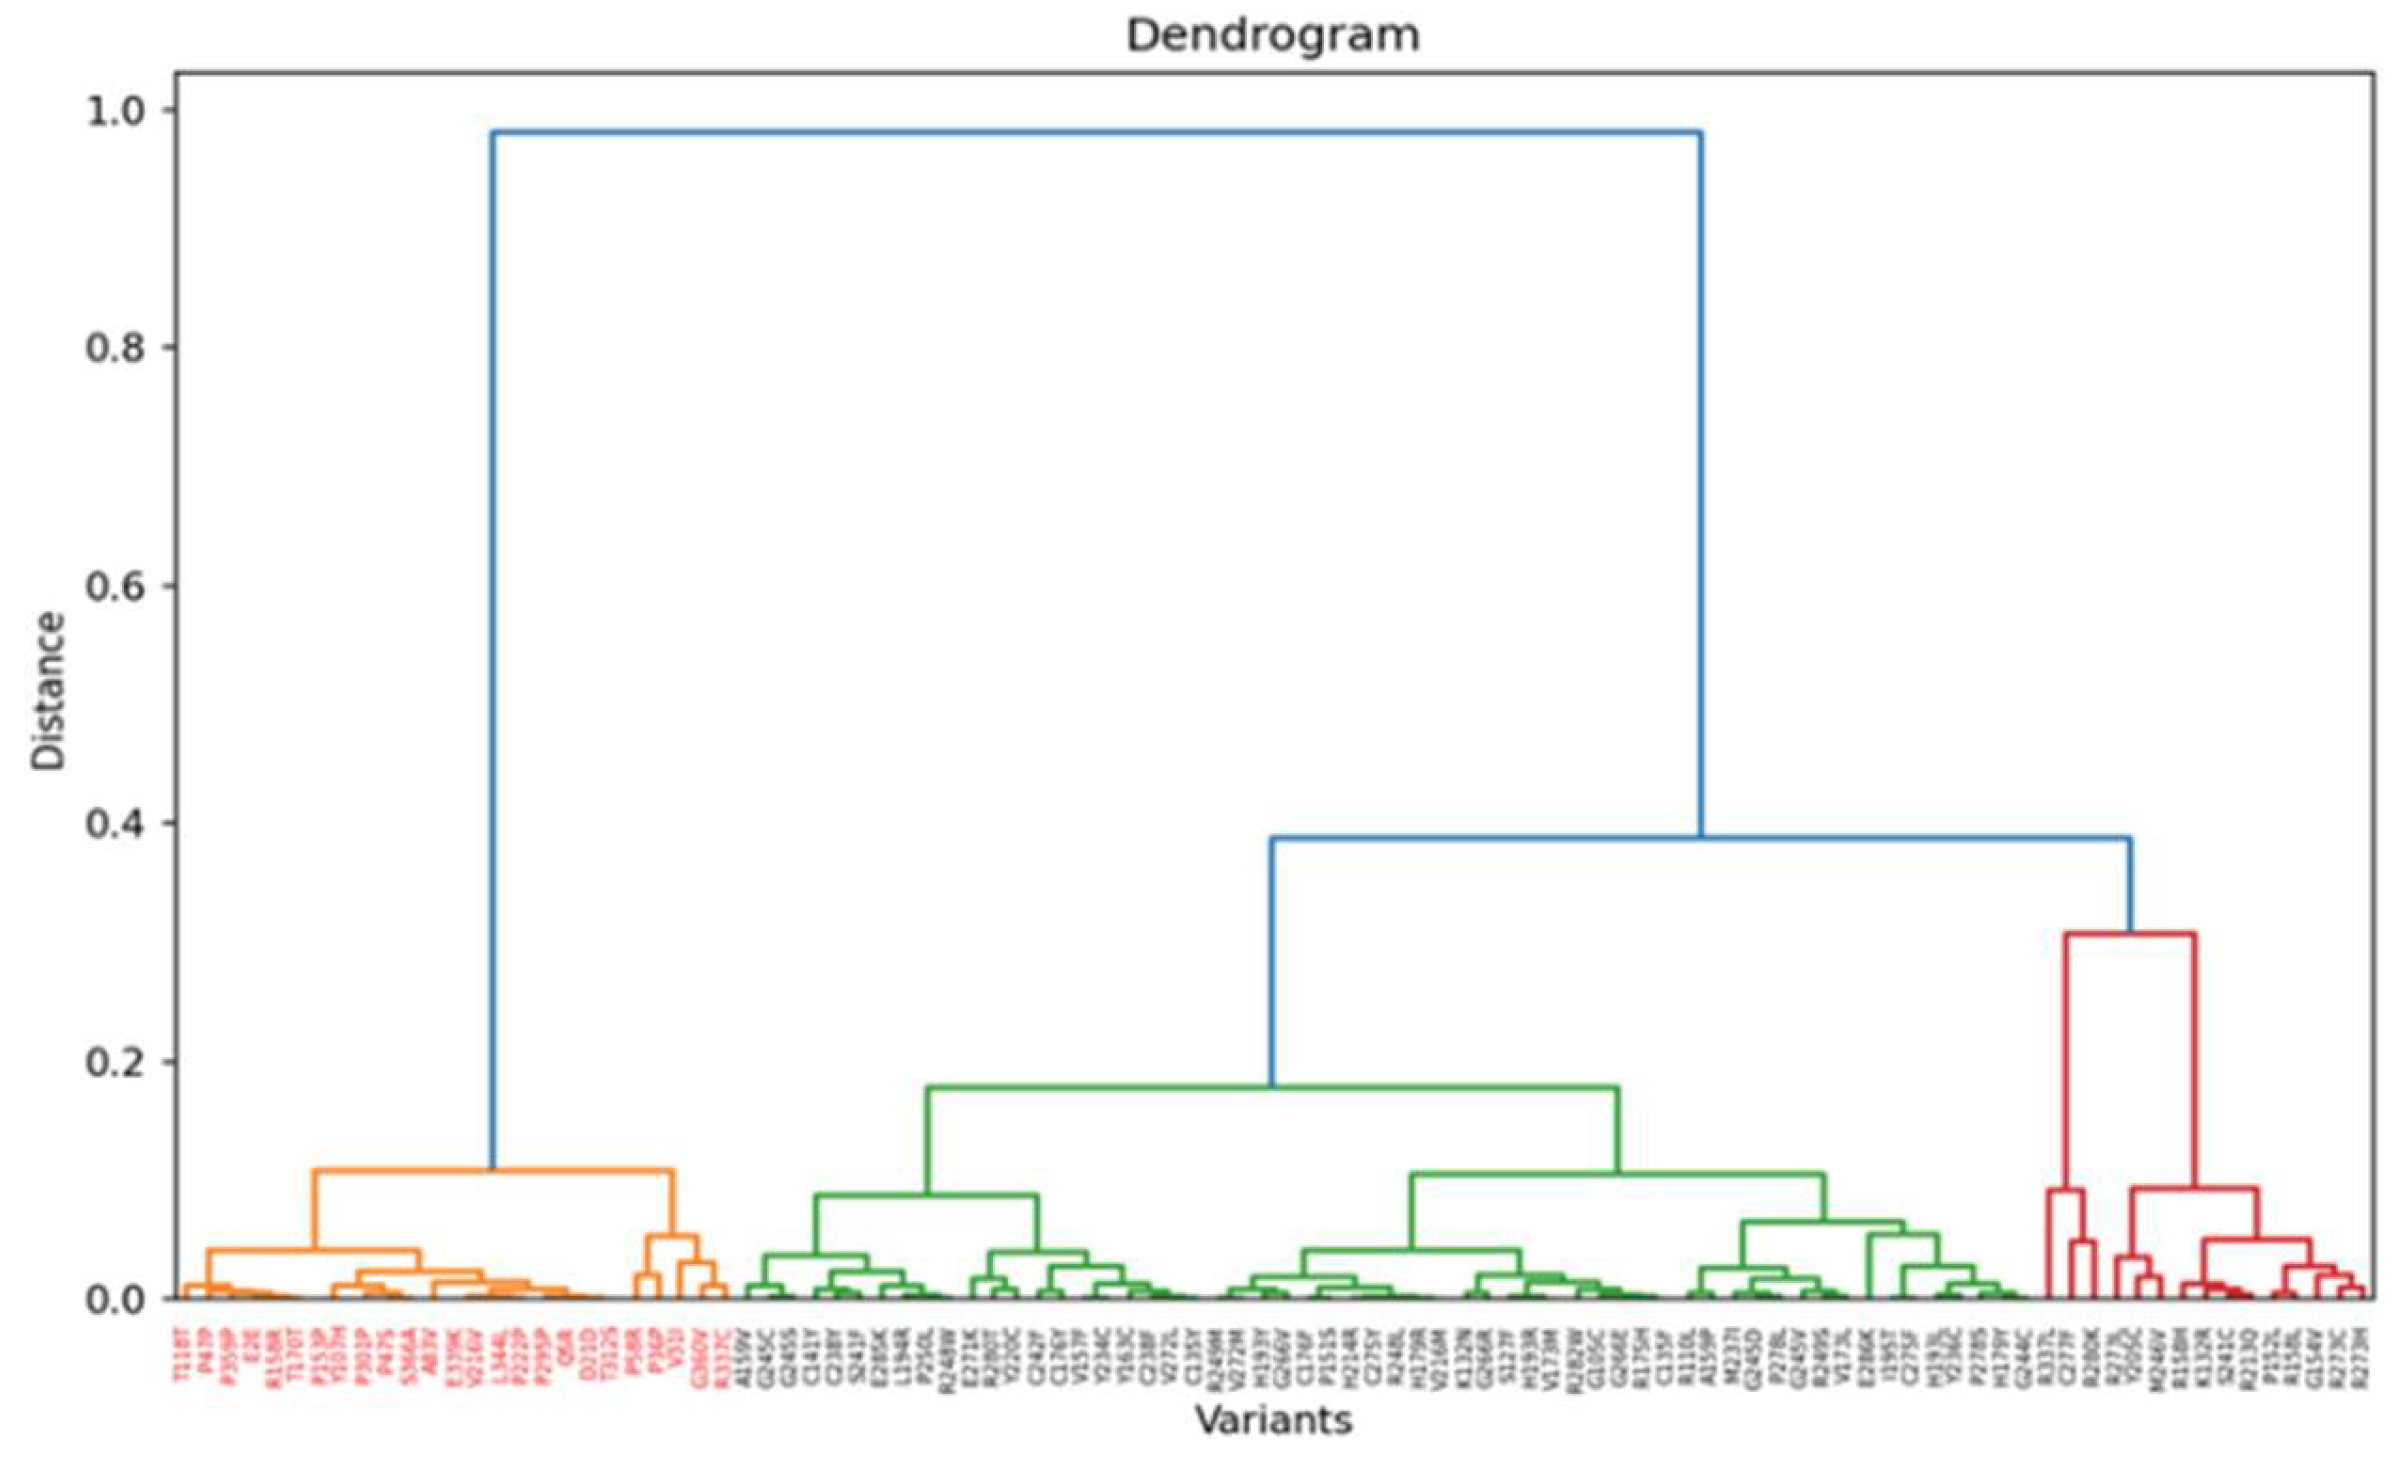
Additionally, related multiplexed perturbations with common transcriptional patterns can be clustered to provide a high-resolution characterization of altered cell fates (common phenotypic fingerprints) (Adamson et al., 2016; Sunshine et al., 2023; Meyers et al., 2023; Zheng et al., 2023). Spearman correlation coefficients between the average expression profiles of each pair of variants are calculated, then grouping cells by similar GBC, and followed by unsupervised hierarchical clustering of the correlation matrix using L1 distance and complete linkage (Adamson et al., 2016; Replogle et al., 2022; Butterworth et al., 2023). Spearman correlation, unlike Pearson correlation, captures monotonic relationships without assuming a specific data distribution (Sedgwick, 2014). The hierarchy is visually inspected and cut to obtain discrete cluster assignments (Figure 8 and 10).

2.3. Leiden clustering

To visualize single-cell datasets, cells are often represented in a low-dimensional space using uniform manifold approximation and projection (UMAP), typically with 15 nearest neighbours per cell and a minimum distance of 0.5 between embedded points (Hein et al., 2022; Yao et al., 2023; McInnes et al., 2018). Subsequently, cells from the nearest neighbour graph are clustered using algorithms like the Louvain algorithm, which is widely used for uncovering community structures (Ursu et al., 2022; Blondel et al., 2008).
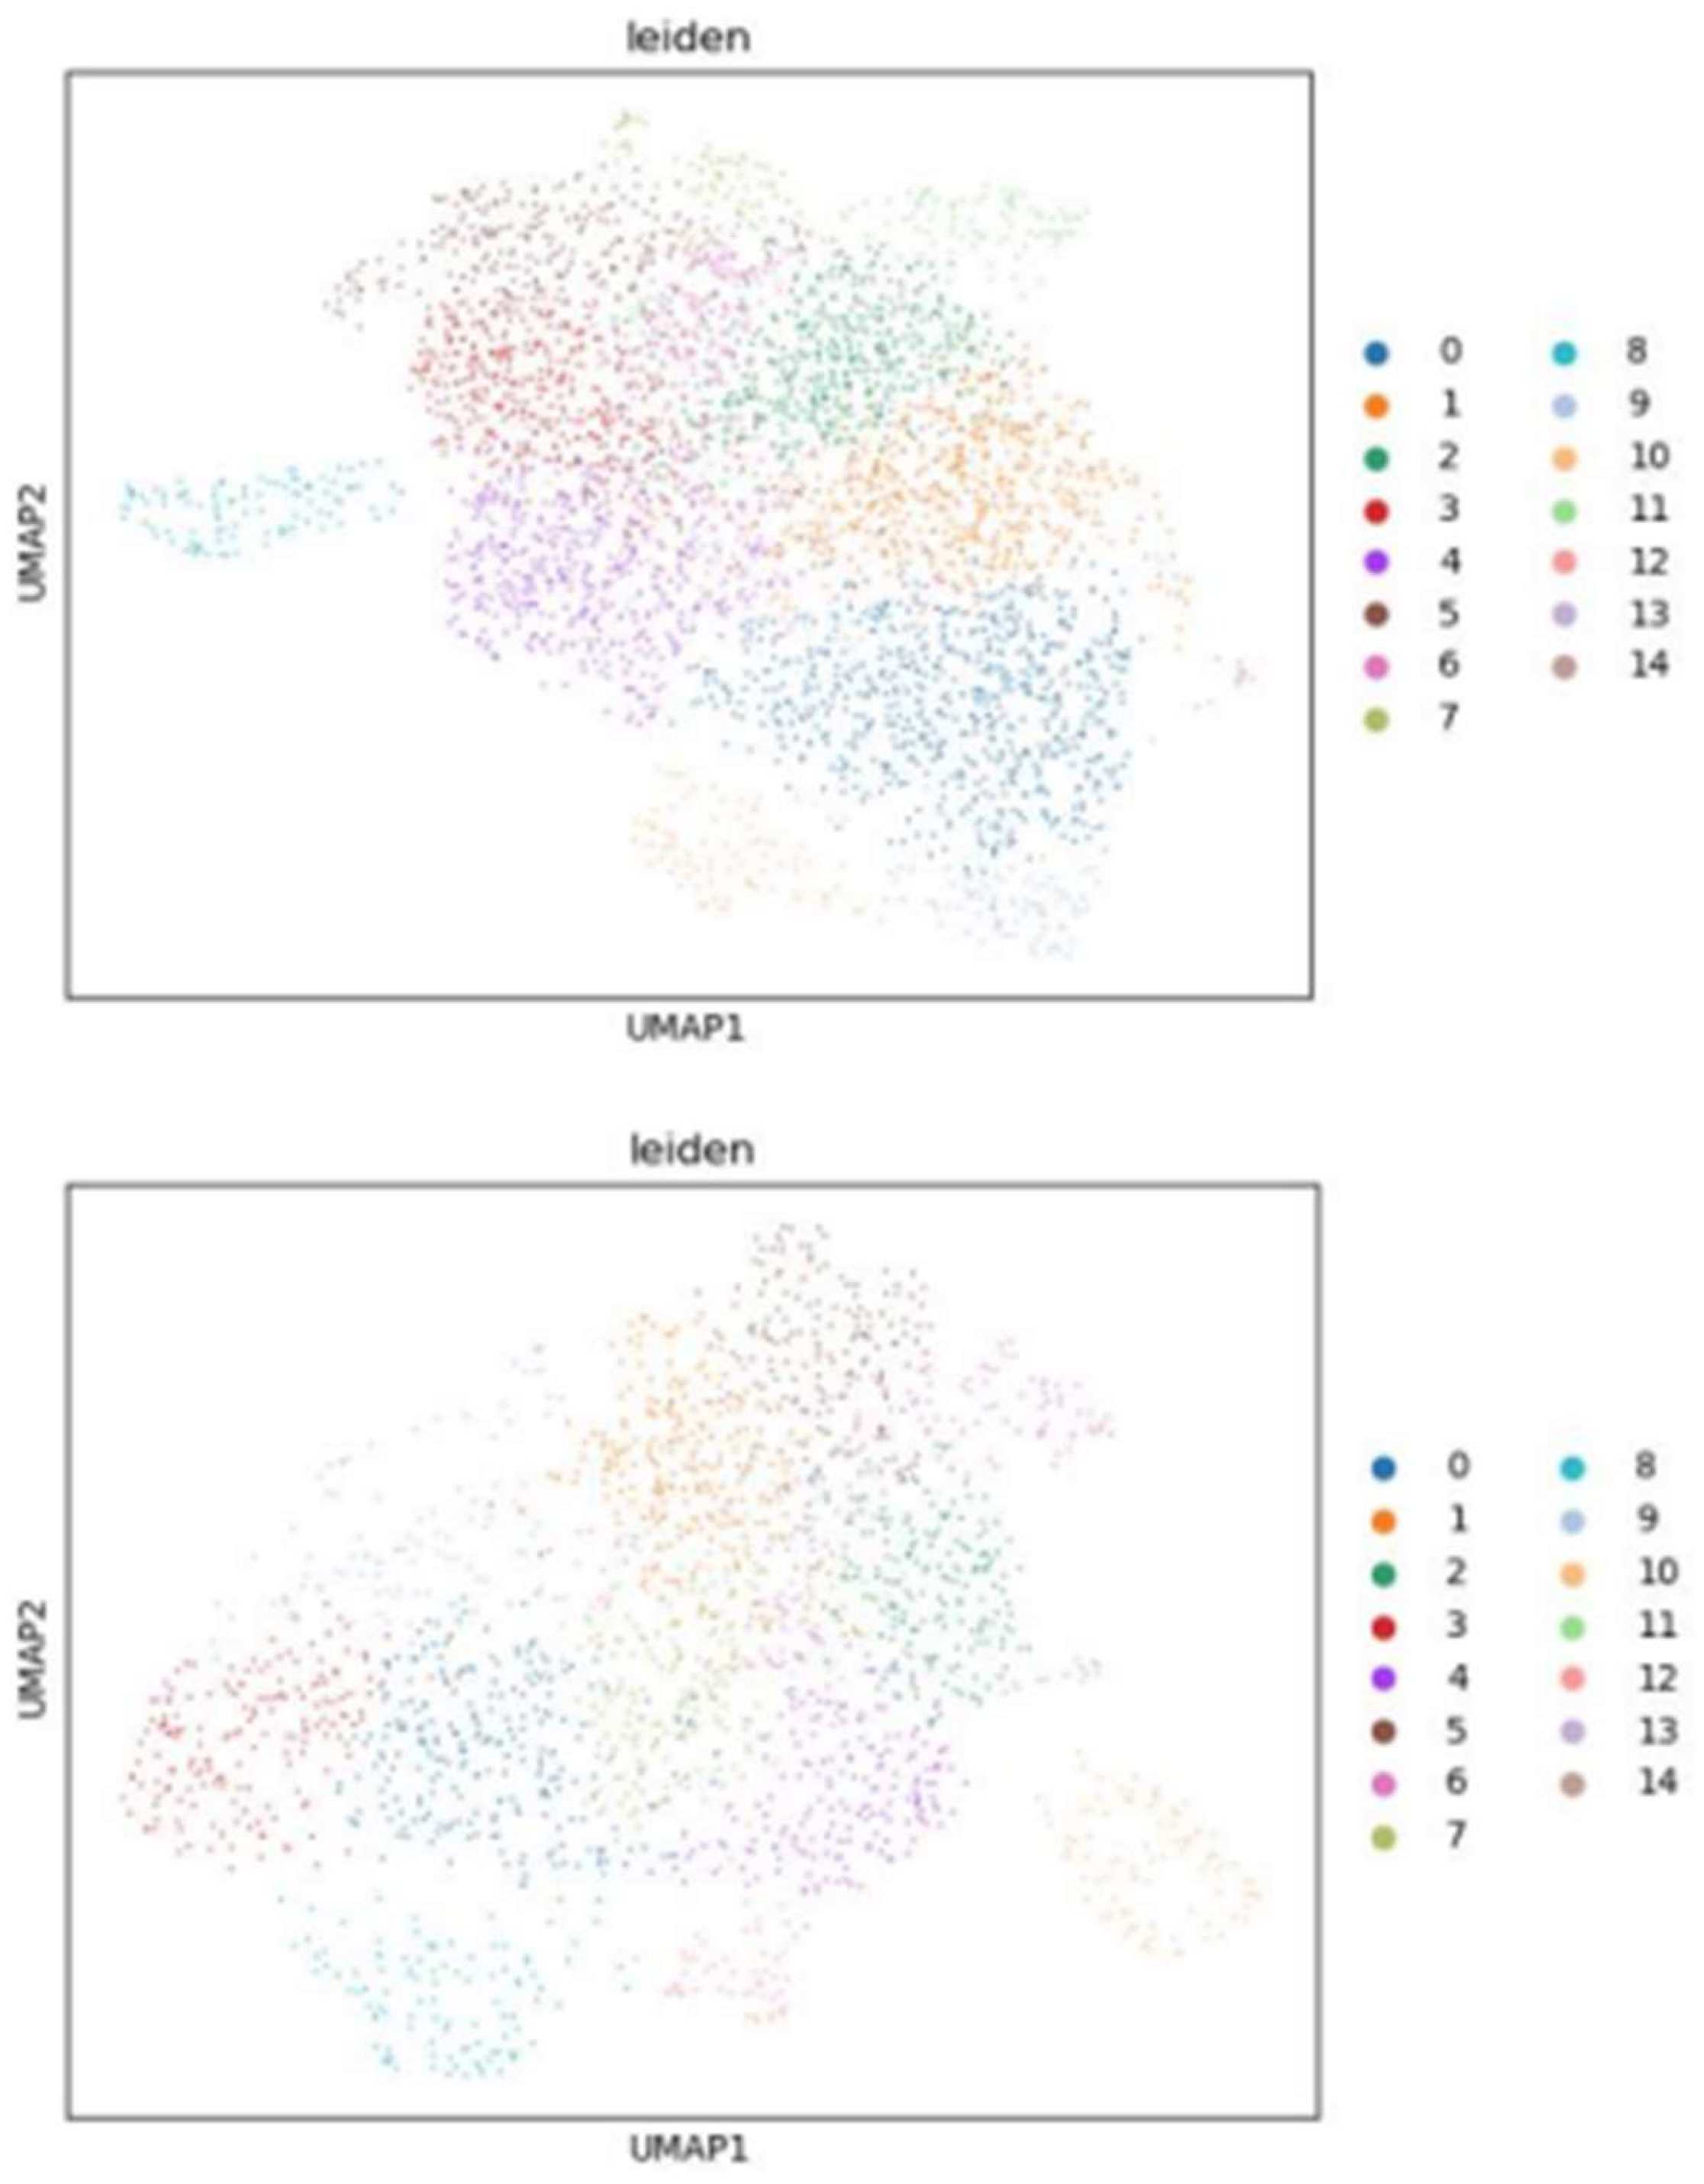
However, recently the Leiden algorithm has been shown to be faster and to uncover better partitions than the Louvain algorithm (Traag et al., 2019). It has been systematically applied to summarize genotype-phenotype relationships by clustering genes into expression programs based on their co-regulation (Replogle et al., 2022; Littman et al., 2023; Hein et al., 2022; Yao et al., 2023). In addition, it is possible to identify sets of genes with coherent average expression profiles across variants, known as gene programs (GPs), by correlating the average profiles of genes across variants (Figure 16). Using the gProfiler toolkit in Python, an enrichment analysis of functional terms can be performed, focusing on the KEGG Pathway Database, which includes manually drawn pathway maps representing molecular interaction, reaction, and relation networks (Kolberg et al., 2023) (Kanehisa et al., 2017).

2.4. Differential expression análisis (DEA)

In comparative high-throughput sequencing assays, a fundamental task is analysing read counts per gene in RNA-seq to identify systematic changes across experimental conditions (Love et al., 2014; Muzellec et al., 2023; Muzellec et al., 2023). This process helps distinguish genes associated with diseases or other phenotypes from false positive hits or genes affected by the general instability of the malignant genome (Gortzak-Uzan et al., 2008). RNA-seq data, however, are often overdispersed from the assumed Poisson distributions, making it essential to focus on comparing expression values across different samples rather than absolute expression levels (Zhou et al., 2011) (Robinson et al., 2010).
DESeq2 is a method designed for quantitative analysis of differential expression, emphasizing the strength of differential expression through shrinkage estimation for dispersions and log fold changes (LFCs). This approach improves stability, reproducibility, and interpretability compared to maximum-likelihood-based solutions (Love et al., 2014). DESeq2 has been widely used to identify differentially expressed genes in various studies (Zheng et al., 2023; Ozturk et al., 2023; Wu et al., 2022; Jin et al., 2020; Tian et al., 2019).
In this context, PyDESeq2, a Python implementation of the DESeq2 workflow, is applied here for differential expression analysis (DEA). PyDESeq2 offers higher model likelihood and speed improvements for large datasets. It computes p-values using Wald tests and adjusts for multiple testing through the Benjamini-Hochberg procedure (Muzellec et al., 2023). Results are further processed here in two dataframes: one containing LFC values for each gene per variant and another with q-values for assessing the significance of genes using a 0.05 alpha threshold.

2.5. The STRING database

The STRING database collects, scores, and integrates all publicly available sources of PPi information, supplemented with computational predictions. These interactions, despite varying in specificity and strength, represent essential biological interfaces crucial for functional systems (Szklarczyk et al., 2019). The query network can be layout in Cytoscape, an open-source software project that integrates, models, and analyses biomolecular interaction networks, incorporating high-throughput expression data and other molecular states into a unified conceptual framework (Cline et al., 2007; Shannon et al., 2003).
To facilitate this task, a STRING app for Cytoscape enables users to easily retrieve, visualize, and analyse networks of hundreds to thousands of proteins through a graphical user interface. This app also stores the exact query term used to find the protein, facilitating easy linkage back to the original data (Szklarczyk et al., 2019). The network retrieved from STRING is an undirected model, meaning no distinctions are made between the nodes, and all edges (connections between nodes) are bidirectional (Borroto-Escuela et al., 2014; Saki et al., 2021).
In this context, after filtering, the remaining most variable genes are passed to the STRING query in Cytoscape with a score cutoff of 0.8 (80% confidence) and 0 as the maximum additional interactors. These parameters provide a narrowed high-confidence network easy to explore (Doncheva et al., 2023). From this network, the nodes directly connected to the main network, including the perturbed gene, are selected to create a separate subnetwork. This highly interconnected and enriched subnetwork includes all downstream signalling components and various protein complexes and functional categories, serving as the basis for further analysis (Belk et al., 2022).
While STRING offers higher coverage by containing collections of pairwise relationships among proteins and genes, it does not necessarily indicate a biologically functional relationship between interacting genes or proteins (Wu et al., 2010). Therefore, results from STRING must be curated and validated through pathway projects to clean the data and trainpredictive models effectively.

2.6. Adaptation of Hierarchical Hotnet
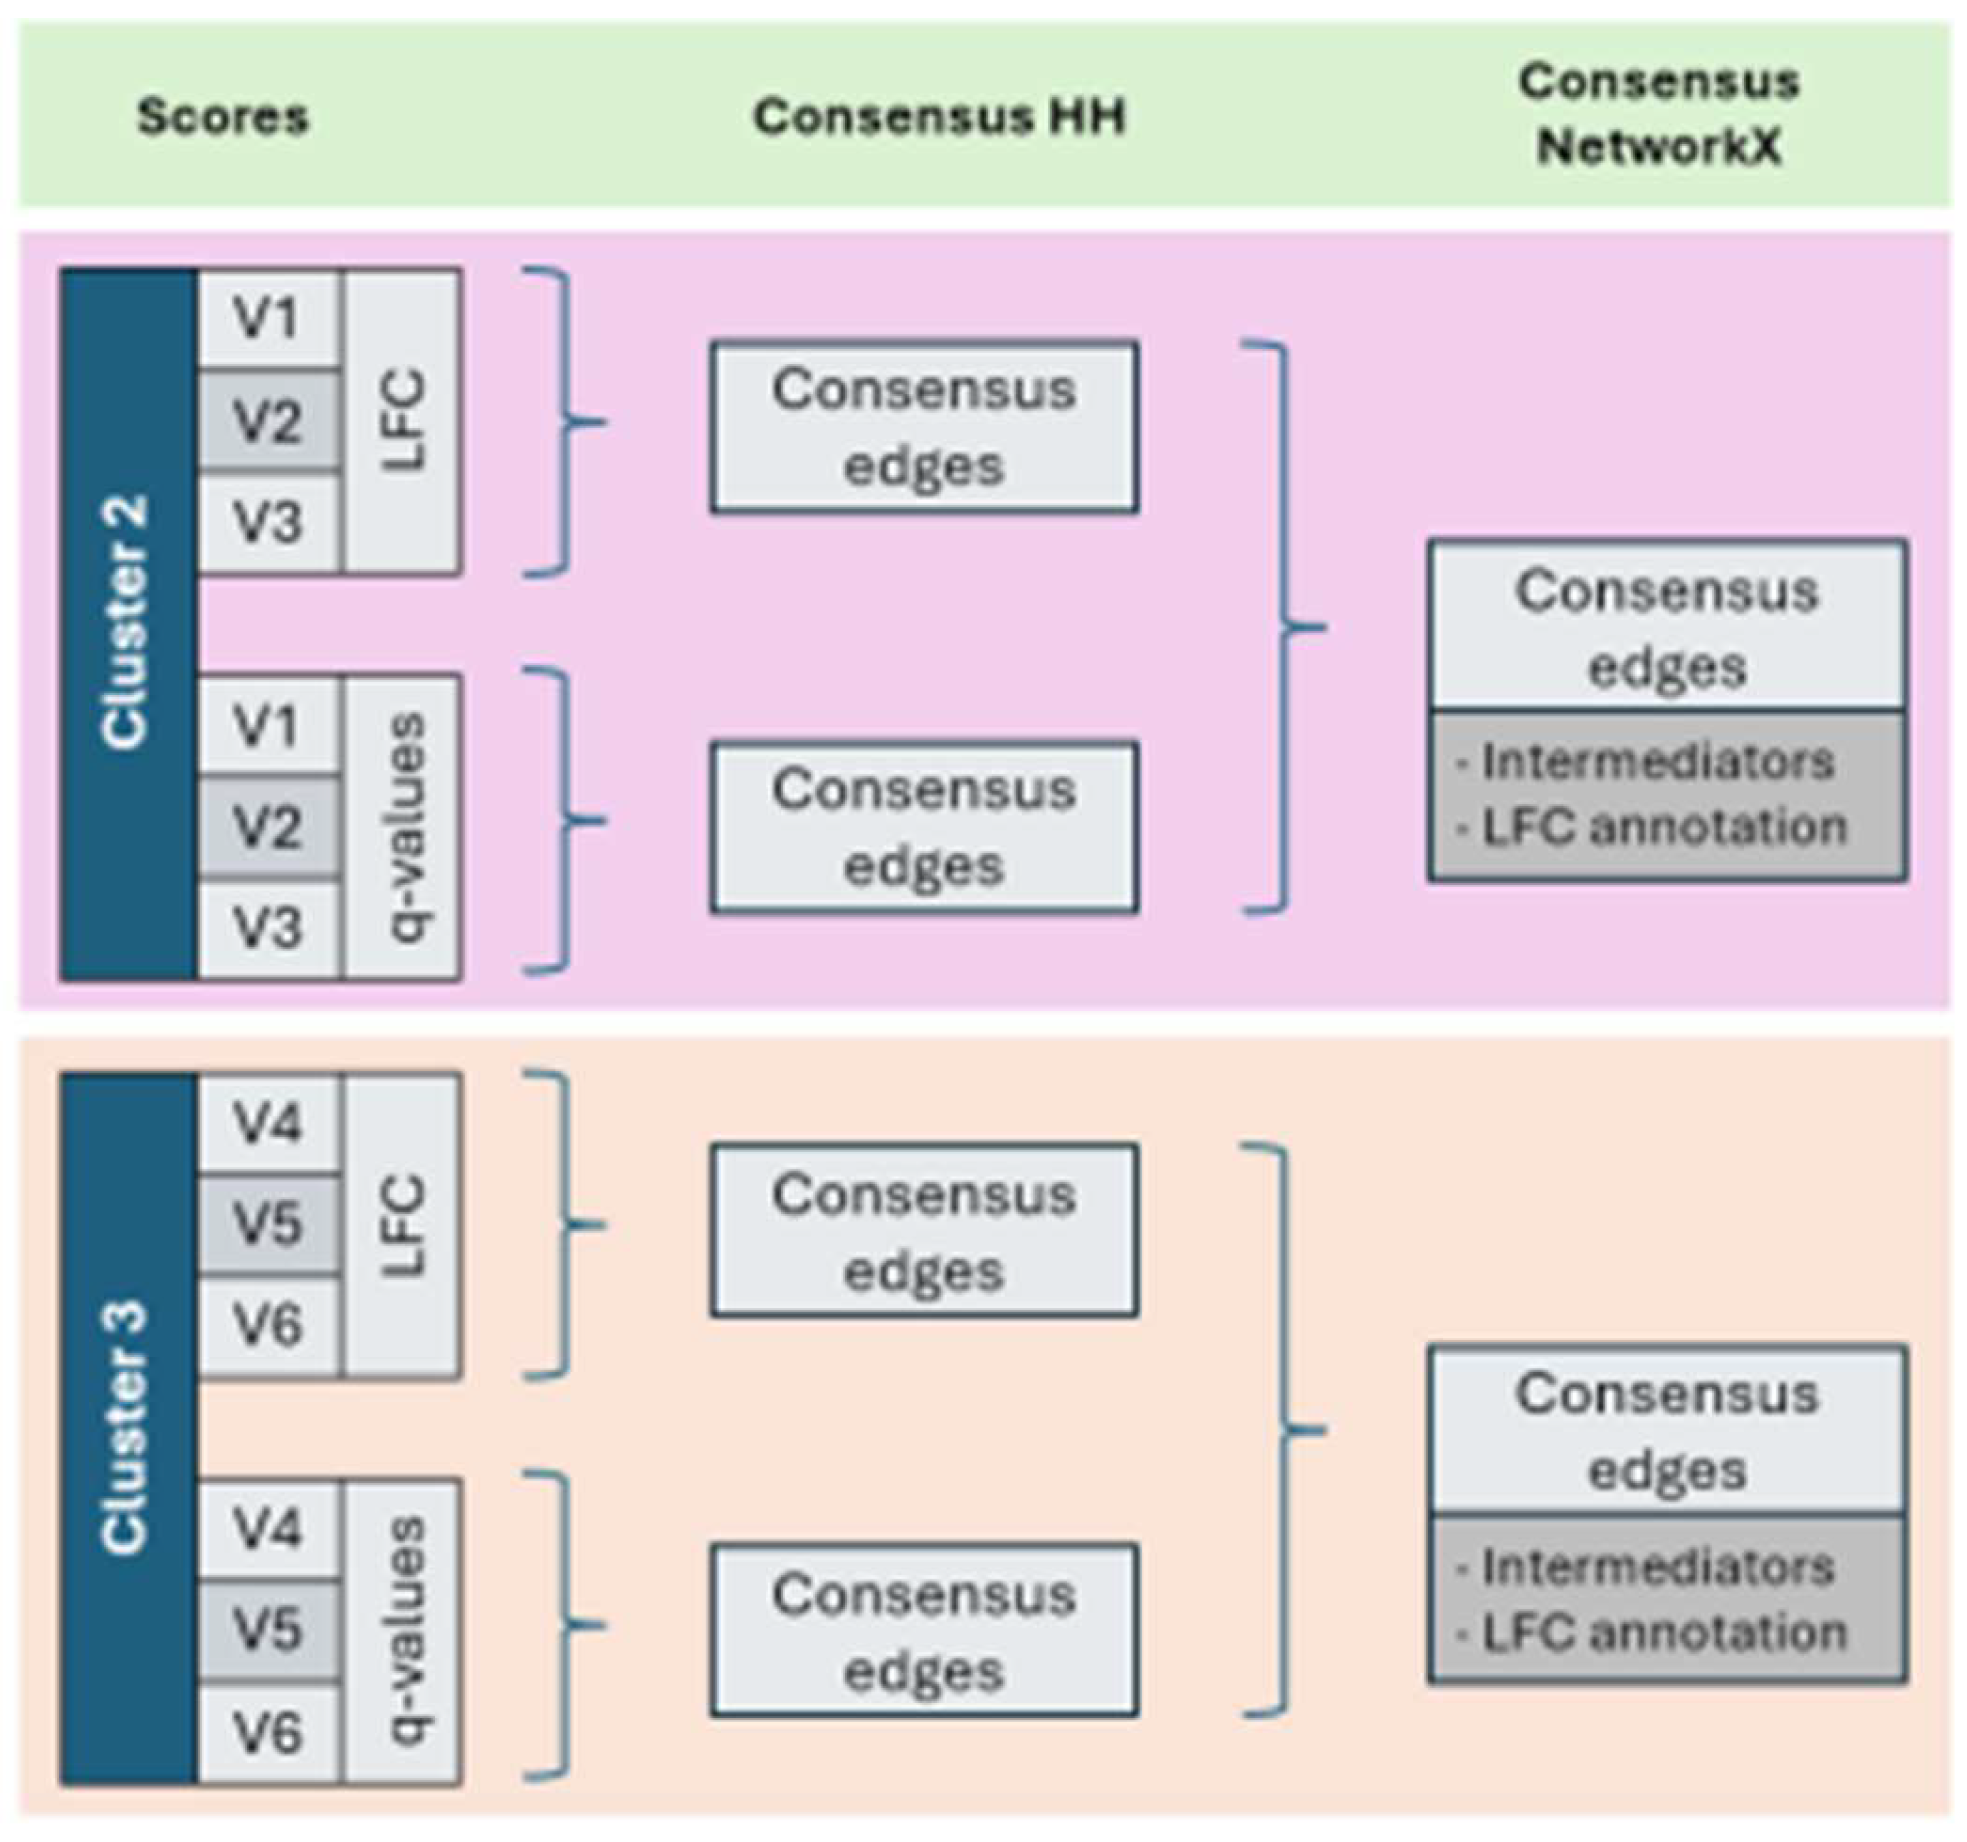
Network-propagation methods are crucial for identifying functional changes, predicting drug targets, and exploring drug synergy in cancers (Liu et al., 2020). These methods operate on an undirected graph to identify significant interactions common among variants within the same cluster.
Given a network or graph G = V , E , w with n = V vertices, m = E edges and scores/weights w v 1 , , w v n on the vertices, many methods address the identification of altered subnetworks. These methods fall into three broad categories: (1) those that define a restricted class of candidate subnetworks and select high-weight subnetworks based on vertex scores (Ideker et al., 2002; Beisser et al., 2010); (2) those that jointly examine vertex scores and network topology to identify subnetworks not apparent from scores or topology alone (Cowen et al., 2017; Chung et al., 2010; Cho et al., 2015; Vanunu et al., 2010; Vandin et al., 2012; Leiserson et al., 2015); (3) and those that incorporate additional information like predefined pathways (Vaske et al., 2010; Dao et al., 2012; Dao et al., 2017; Ciriello et al., 2012; Shrestha et al., 2017).
Even with numerous promising methods available, retrieving accurately disease mechanisms continues to be a challenge. Moreover, many of them are no longer updated with novel methods, and their stated efficacy is questioned when applying cross-validation frameworks (Picart-Armada et al,. 2019). On the other side, studying oncogenic genes usually implies working with hub proteins (proteins that have a high number of interactions), such as TP53 and EGFR, which have numerous high-confidence connections that can introduce bias in heat diffusion models. These highly mutated genes, or "hot nodes," can transfer "heat" to neighbouring genes that may not be biologically relevant, skewing the results of the interactomes (Galindez et al., 2022; Demirel et al., 2022).
The Hierarchical HotNet (HH) has previously proven to predict the highest numbers of candidate cancer genes in comparison to other network-based methods addressing the limitations described (Dittrich et al., 2008; Horn et al., 2018; Cho et al., 2016) by (1) constructing a similarity matrix S = s i j of each pair of vertices v i ,   v j from the vertex-weighted graph G and topology using a random walk-based approach (a specific type of heat diffusion); (2) creating a dendrogram T of high δ that represents a hierarchy of clusters with a high degree of connectedness eliminating the clustering parameter selection (sensitive to the training dataset and computationally expensive to extract), (3) determining the statistical significance of clusters in T, using three null distributions (general randomization, weights randomization and topology randomization) that preserve different features, calculated as the ratio R of the size of the largest observed cluster at δ to the expected size of the largest cluster at δ based on the null distribution, and (4) performing a consensus between clusters from multiple networks reducing artifacts (Reyna et al., 2018).
Here, a Python implementation of HH has been developed for analysing any PPi network without edge weights. Using as basis the connected subnetwork obtained from previous steps, it is possible to create two distinct networks of same topology. Each one possesses a different set of scores derived from DEA, the log 10 q - v a l u e s and absolute LFC values, ensuring positive values for importance increments (Escala-Garcia et al., 2020; Shahamatdar et al., 2020).
For each variant, two sets of altered subnetworks (LFC and q-value types) are identified, and a final consensus is easily performed using NetworkX to integrate these subnetworks across variants within the same cluster (Hagberg et al., 2008). NetworkX is also used to find the shortest paths between disconnected altered subnetworks, revealing key intermediary proteins that bridge separate regions and offering a general view of the affected pathways. As expected, it is shown the hub role of KRAS and TP53. However, the perturbed gene may be manually added if not be included by HH, which occurs when there is a loss-of-function without affecting its normal expression, so LFC and p-value remain invariant. In turn, the rest of nodes are annotated with the mean LFC calculated across variants of the same cluster in which it is reported significantly expressed with a certain frequency, at least twice here to not filter possible key nodes, but considering a reasonable coefficient of variation (CV) under 50% (Figure 15, Figure 16 and Figure 17).
Figure 4. Working flow of HH implementation and NetworkX for TP53 experiment.
Preprints 138066 g004
HH has been used to find significantly mutated modules related to certain cancer types (Escala-Garcia et al., 2020; Liu et al., 2020; Yepes et al., 2020). However, oncogenic genes change completely the cell expression profile, leading HH to reveal major altered subnetworks, which do not represent coherent functional units (Dittrich et al., 2008; Horn et al., 2018; Cho et al., 2016; Barel et al., 2020).
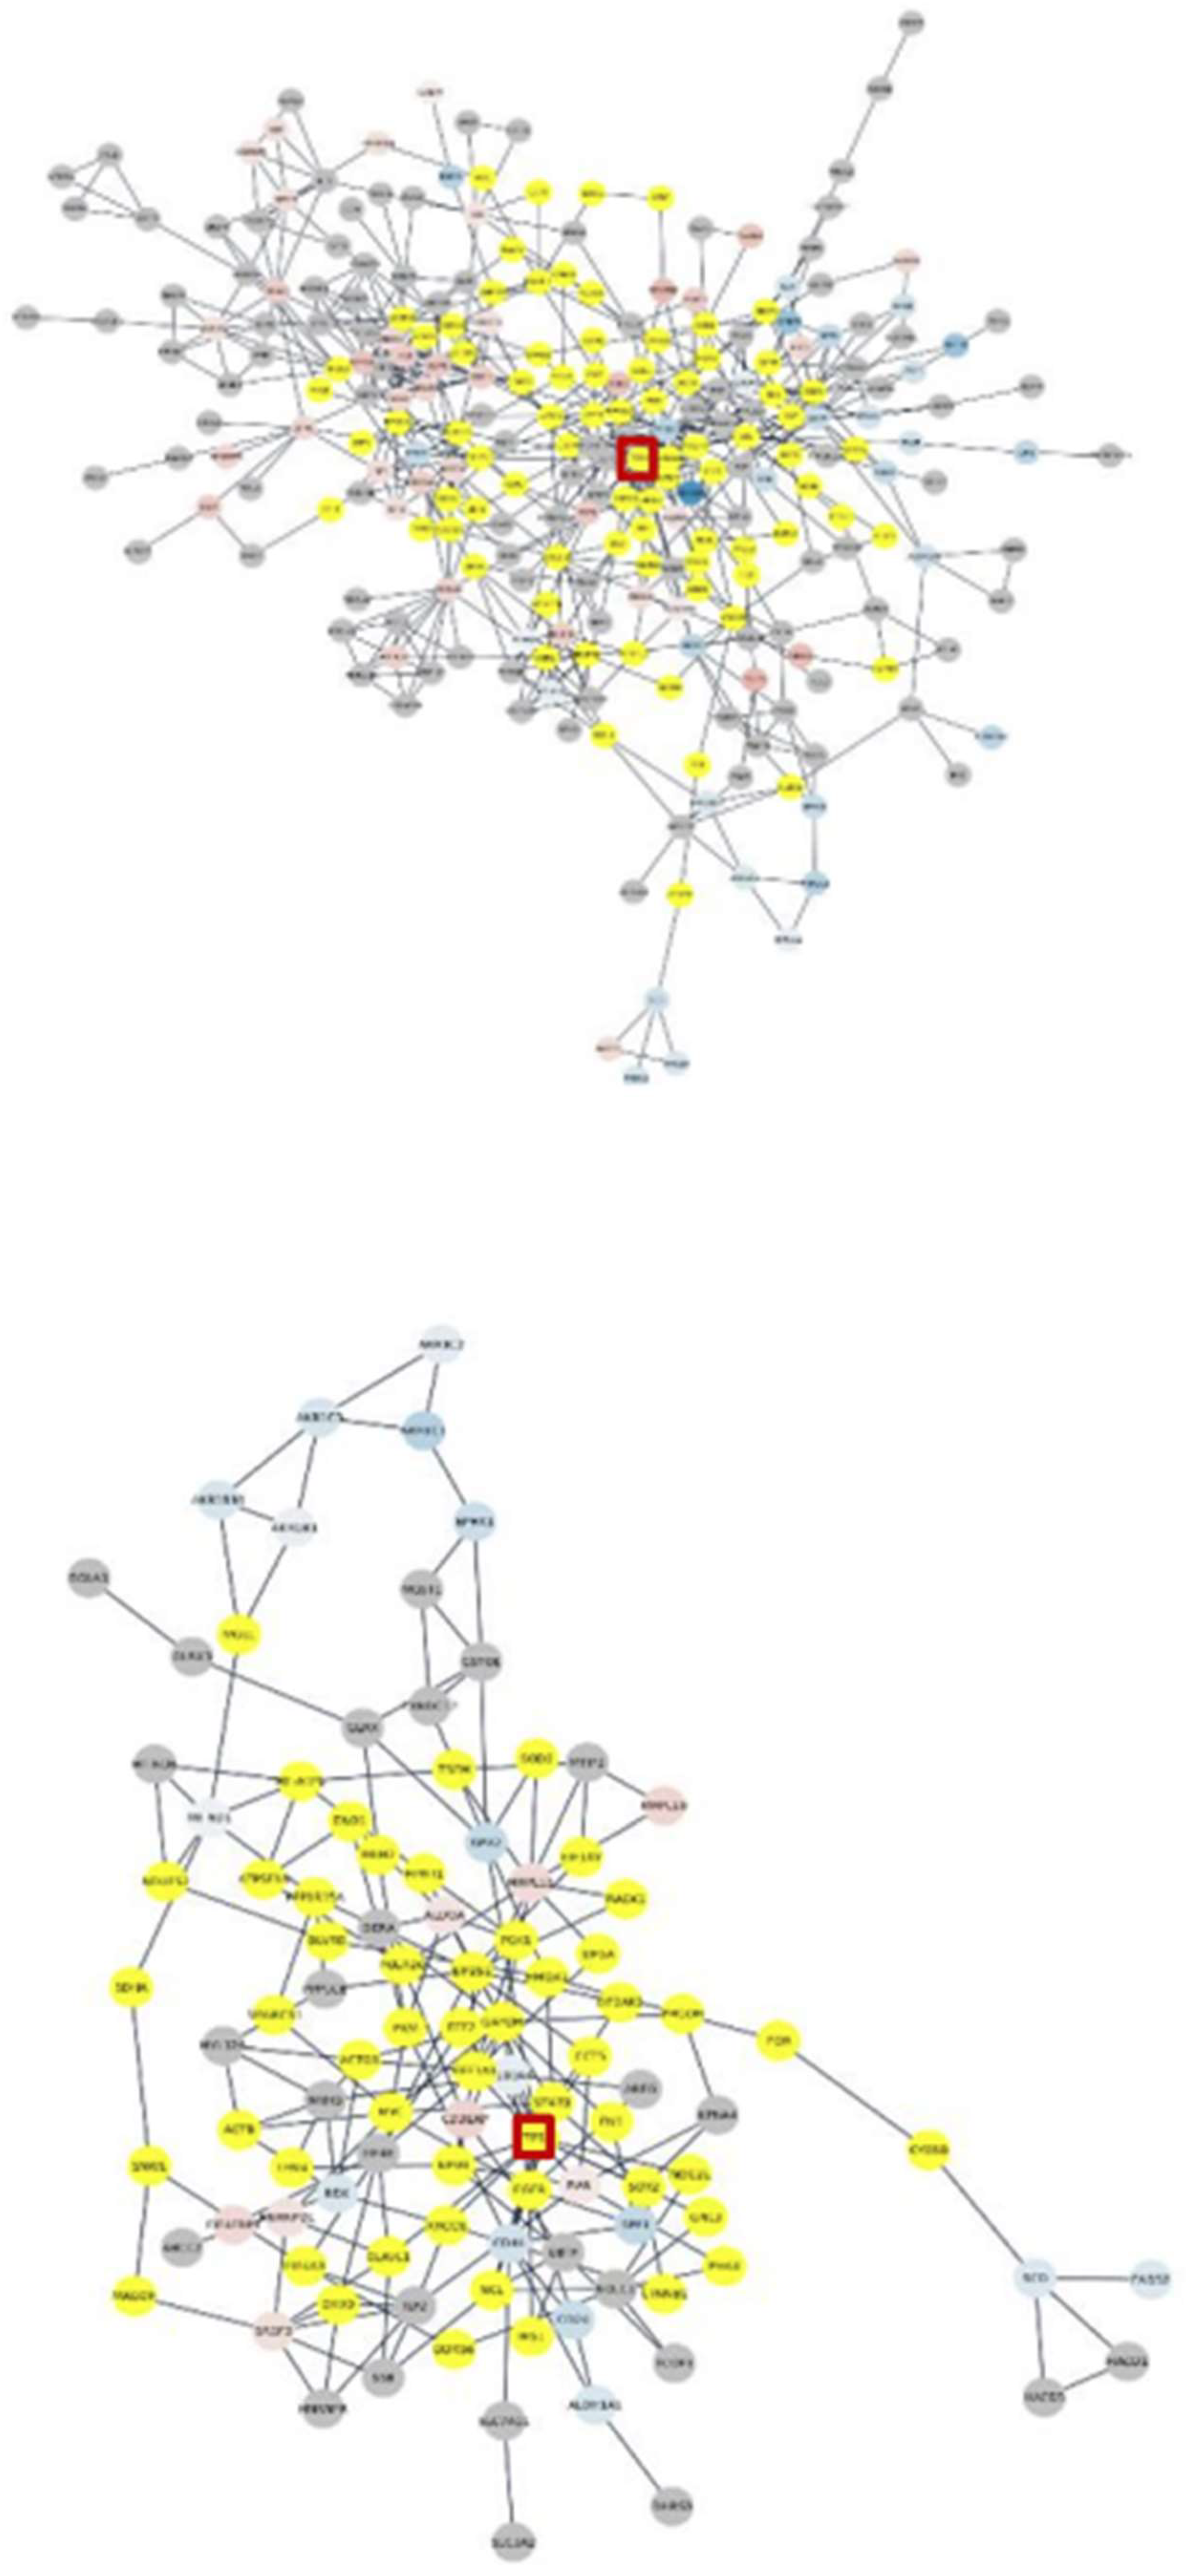
Figure 5. Connected altered subnetworks of clusters 2 (top) and 3 (bottom) of variants with significantly expressed genes continuous mapped in red-blue, added intermediators in yellow, and perturbed TP53 in the red square.
Preprints 138066 g005
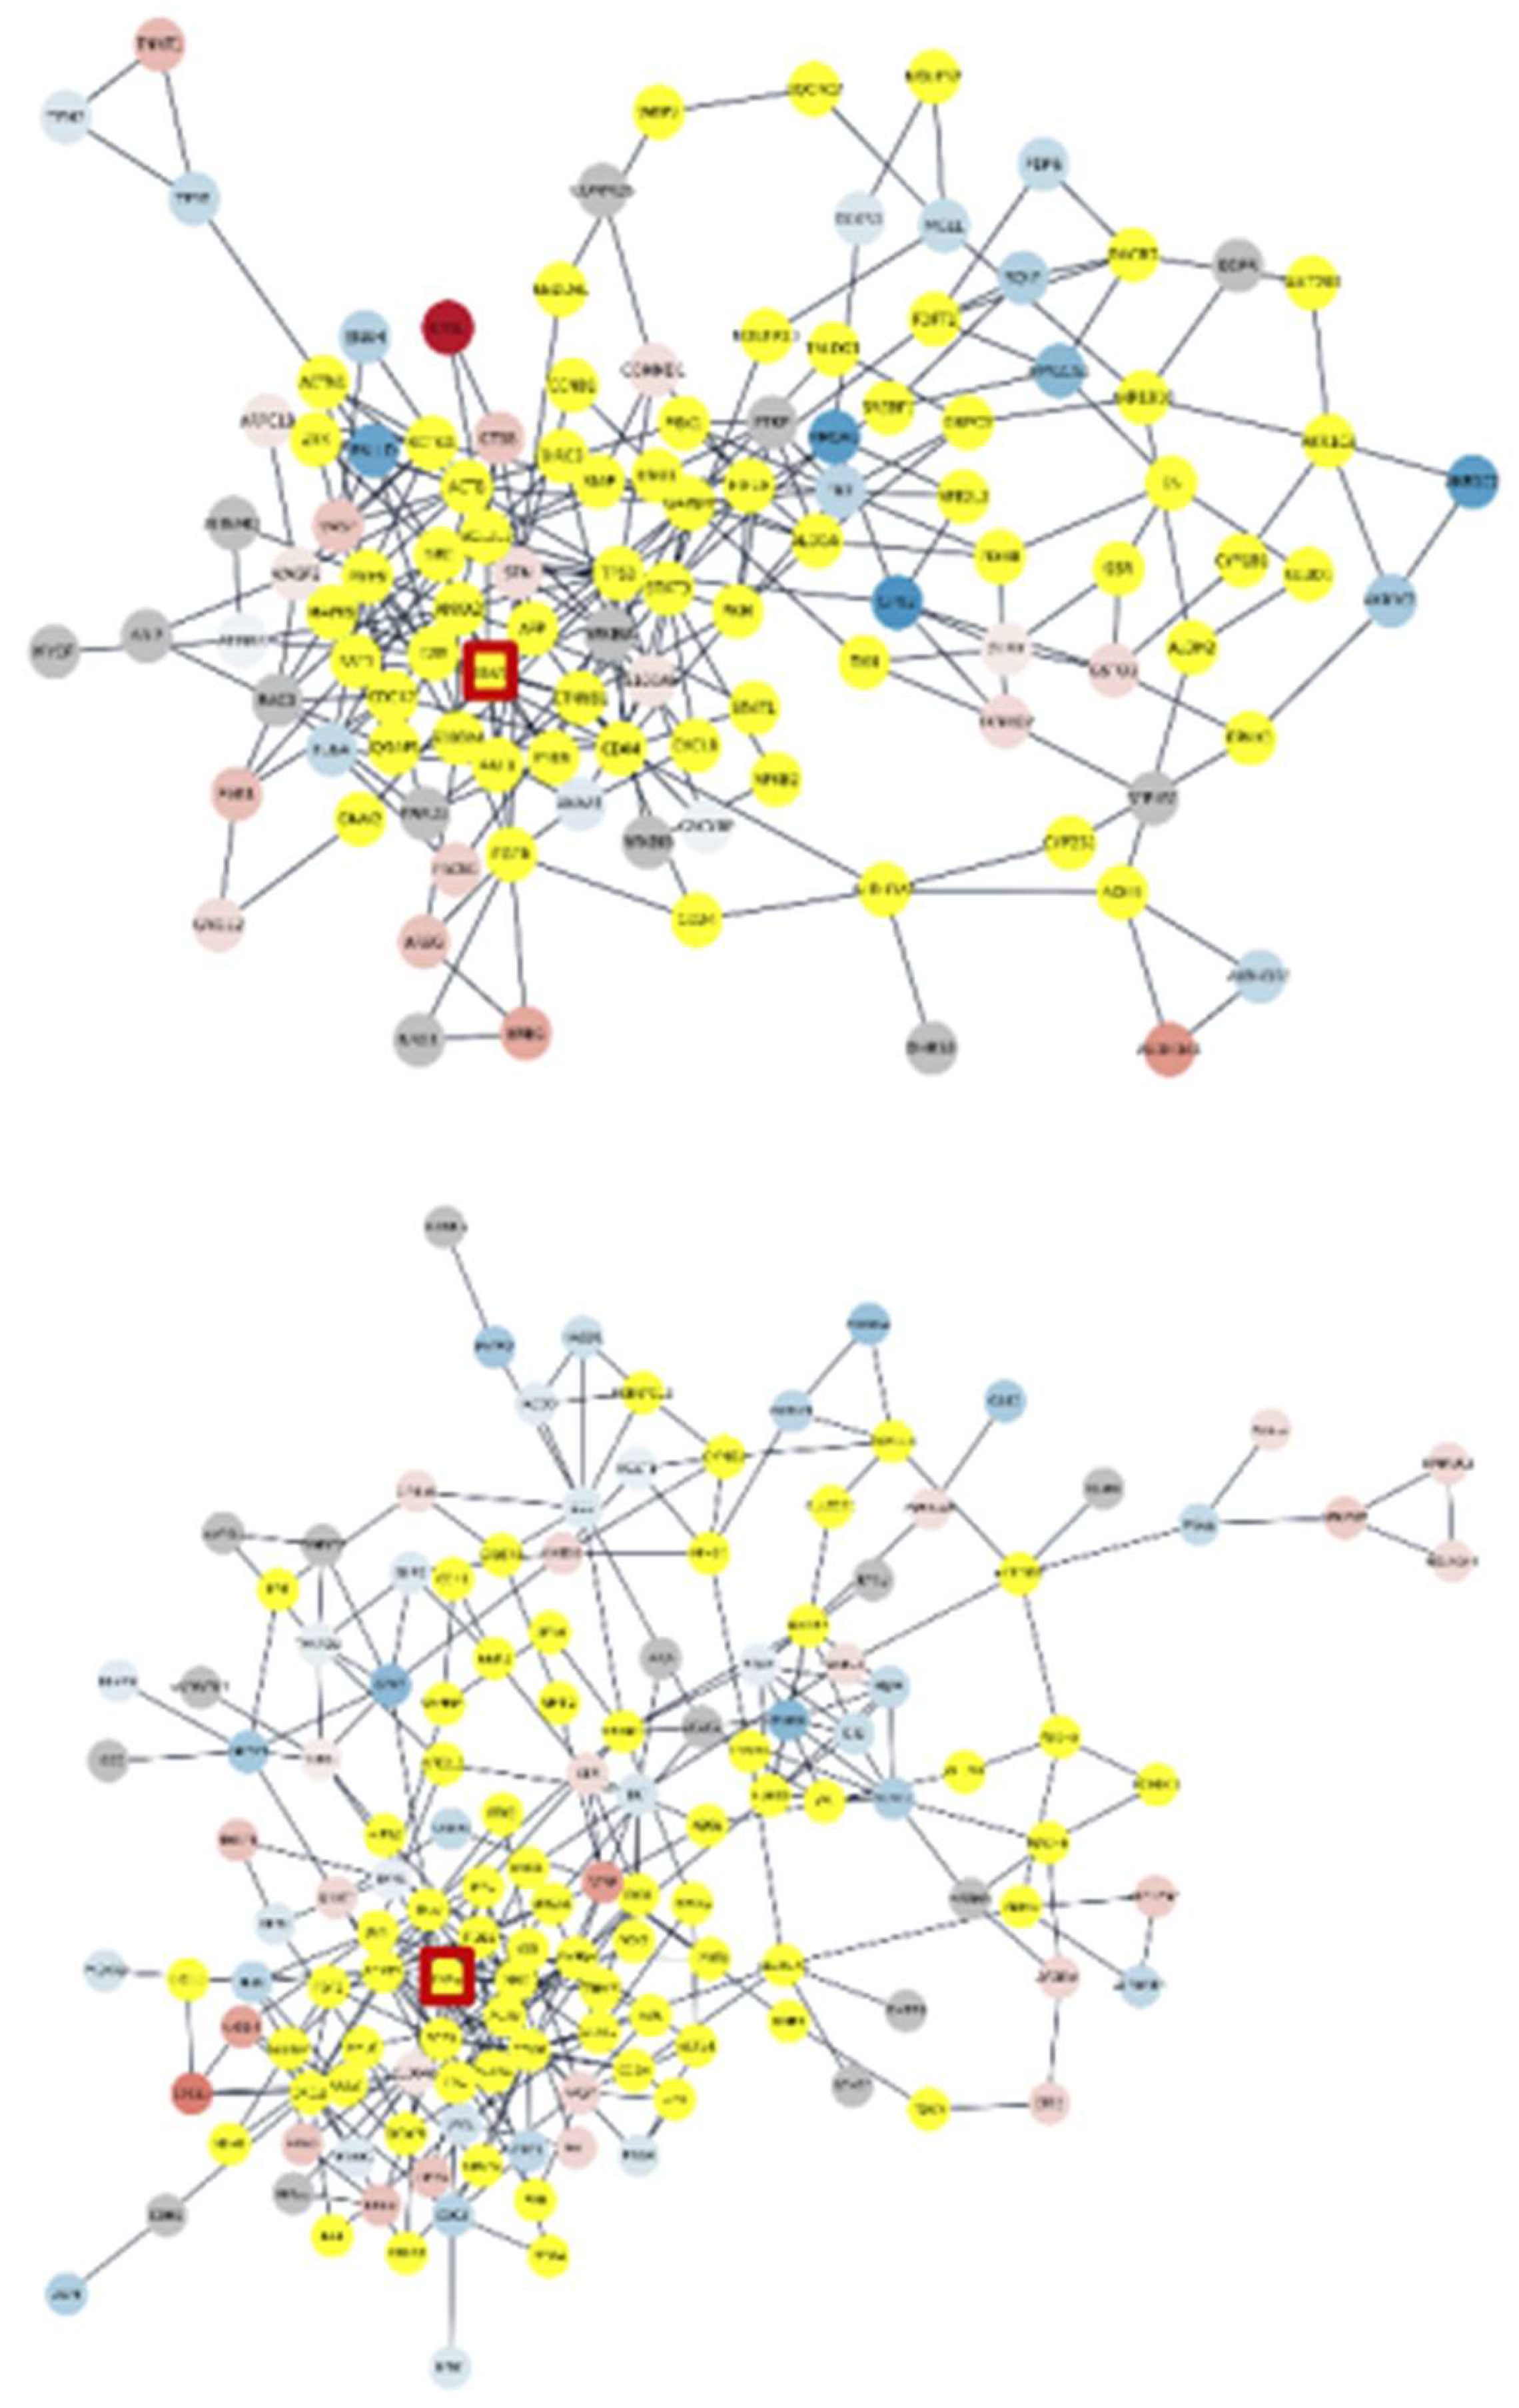
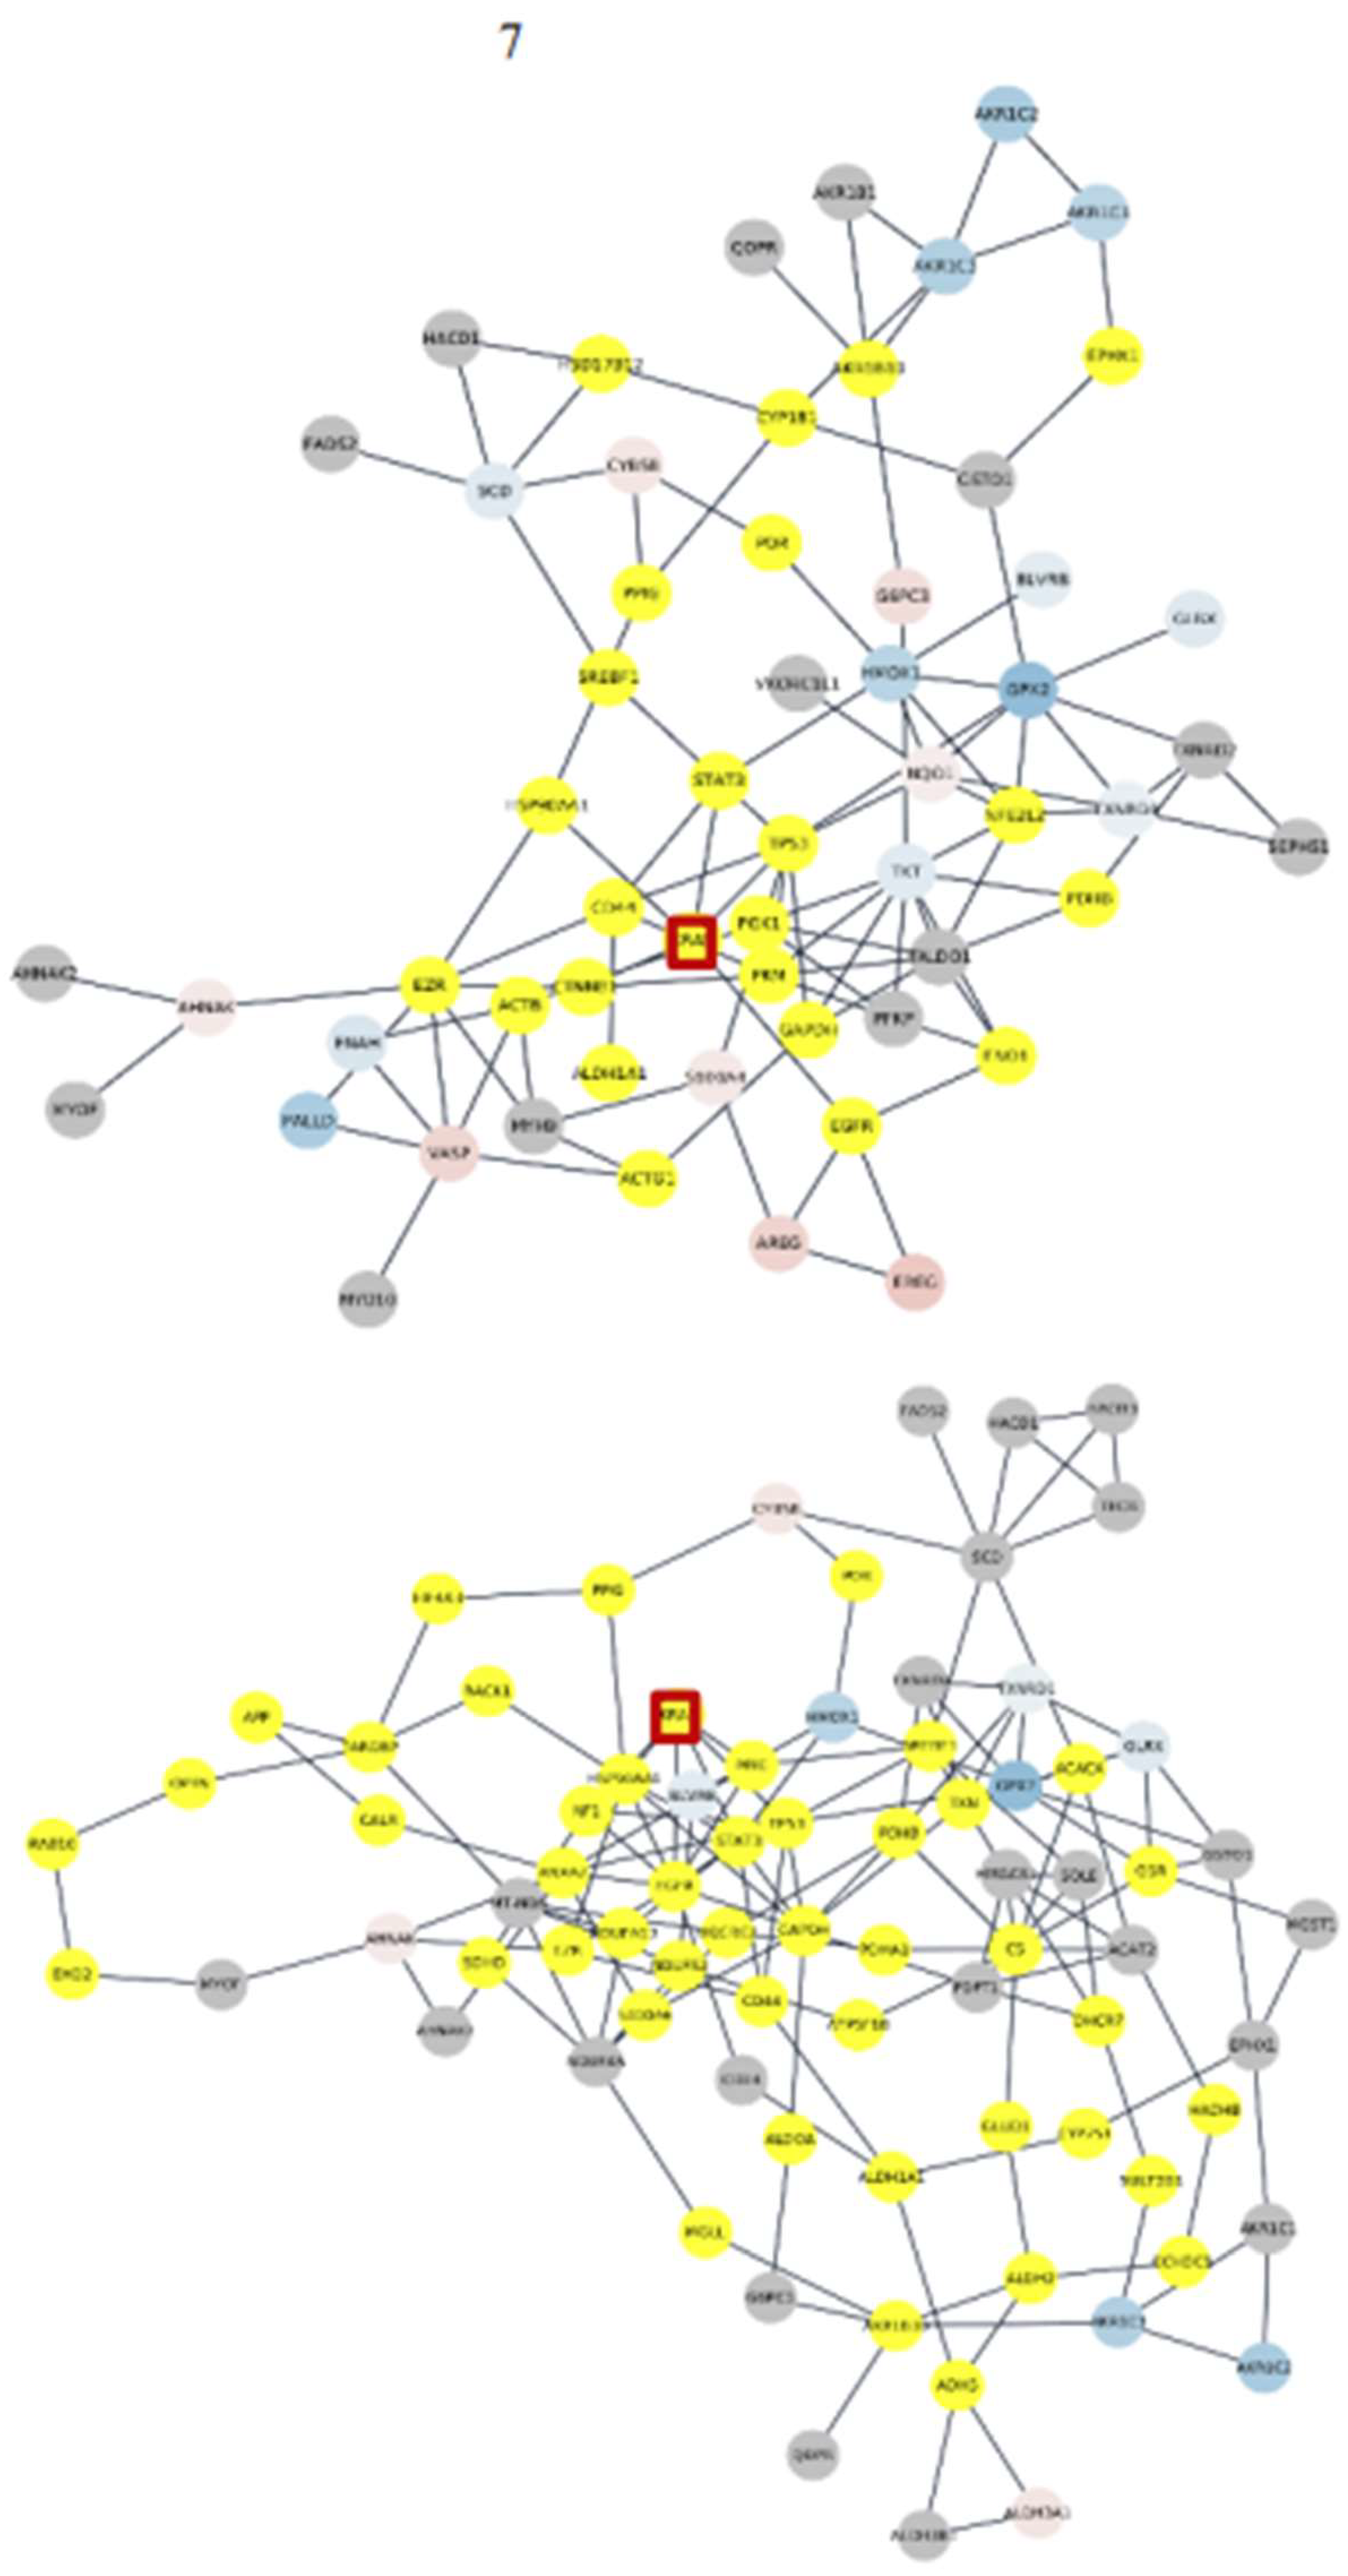
Figure 6. Connected altered subnetworks of clusters 1 (first), 3 (second), 4 (third) and 5 (forth) of variants with significantly expressed genes continuous mapped in red-blue, added intermediators, and perturbed KRAS in the red square.
Preprints 138066 g006aPreprints 138066 g006b
In this context, here it is purposed to apply MCODE in Cytoscape to detect clusters of nodes more densely connected to each other than to the rest of the network, so added intermediaries are maintained (Bader et al., 2003). Parameters used include a degree cutoff of 2, node connectivity score cutoff of 0.2, and exclusion of single-node connections within clusters. Resulting clusters (annex 1) with at least 3 as complex score are selected for further analysis in order to prioritize more confident findings.
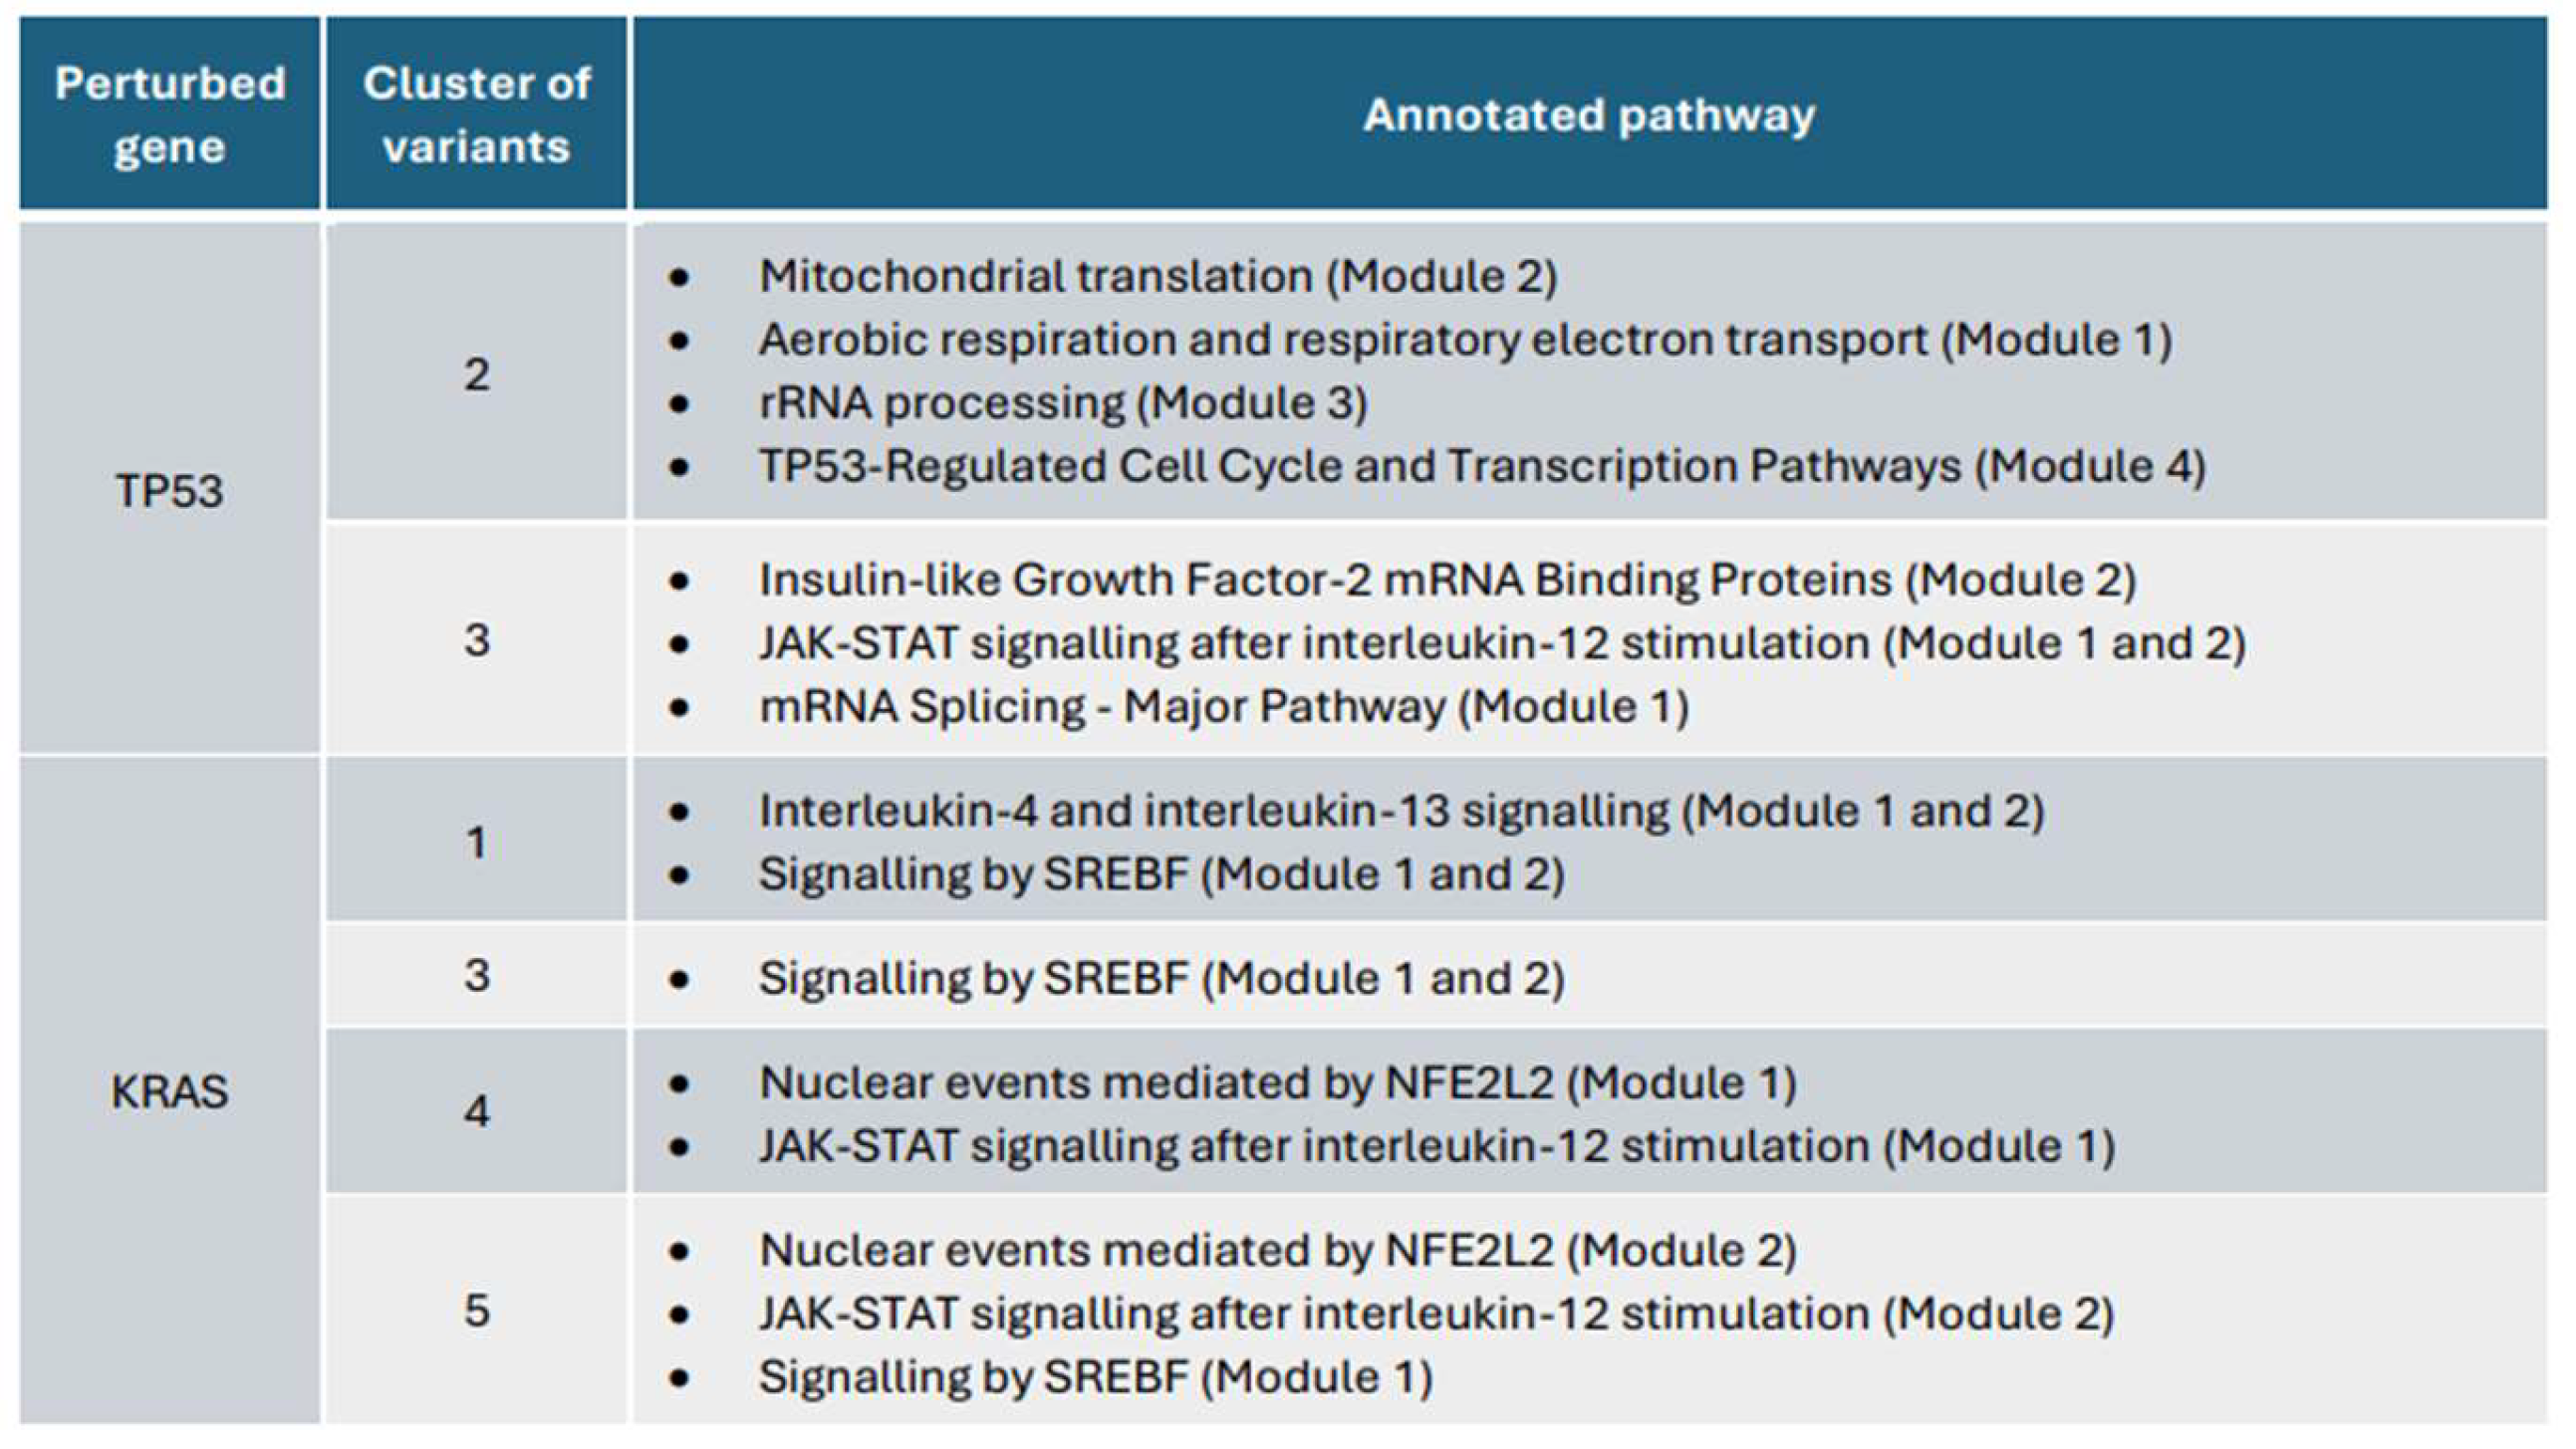
Selected modules (eliminating added interactors) undergo pathway enrichment analysis using Reactome, a highly reliable knowledgebase of human biological pathways (Vastrik et al., 2007). In other words, STRING interactions are cross-validated against Reactome pathways to ensure data reliability (Wu et al., 2010). From all pathway annotations reported by Reactome (anx. 2-7), selected ones (Figure 18) contain an extremely low p-value and FDR, with a reasonable number of entities and reactions found, and coherence with their relevance in lung cancer cells.

3. Results

3.1. Overview of data processing

After data processing and filtering, the proportion of cells and genes retained for the TP53 experiment is 82,963 out of 162,313 cells and 1,902 out of 24,867 genes, while for the KRAS experiment, it is 91,608 out of 150,043 cells and 3,314 out of 24,490 genes.
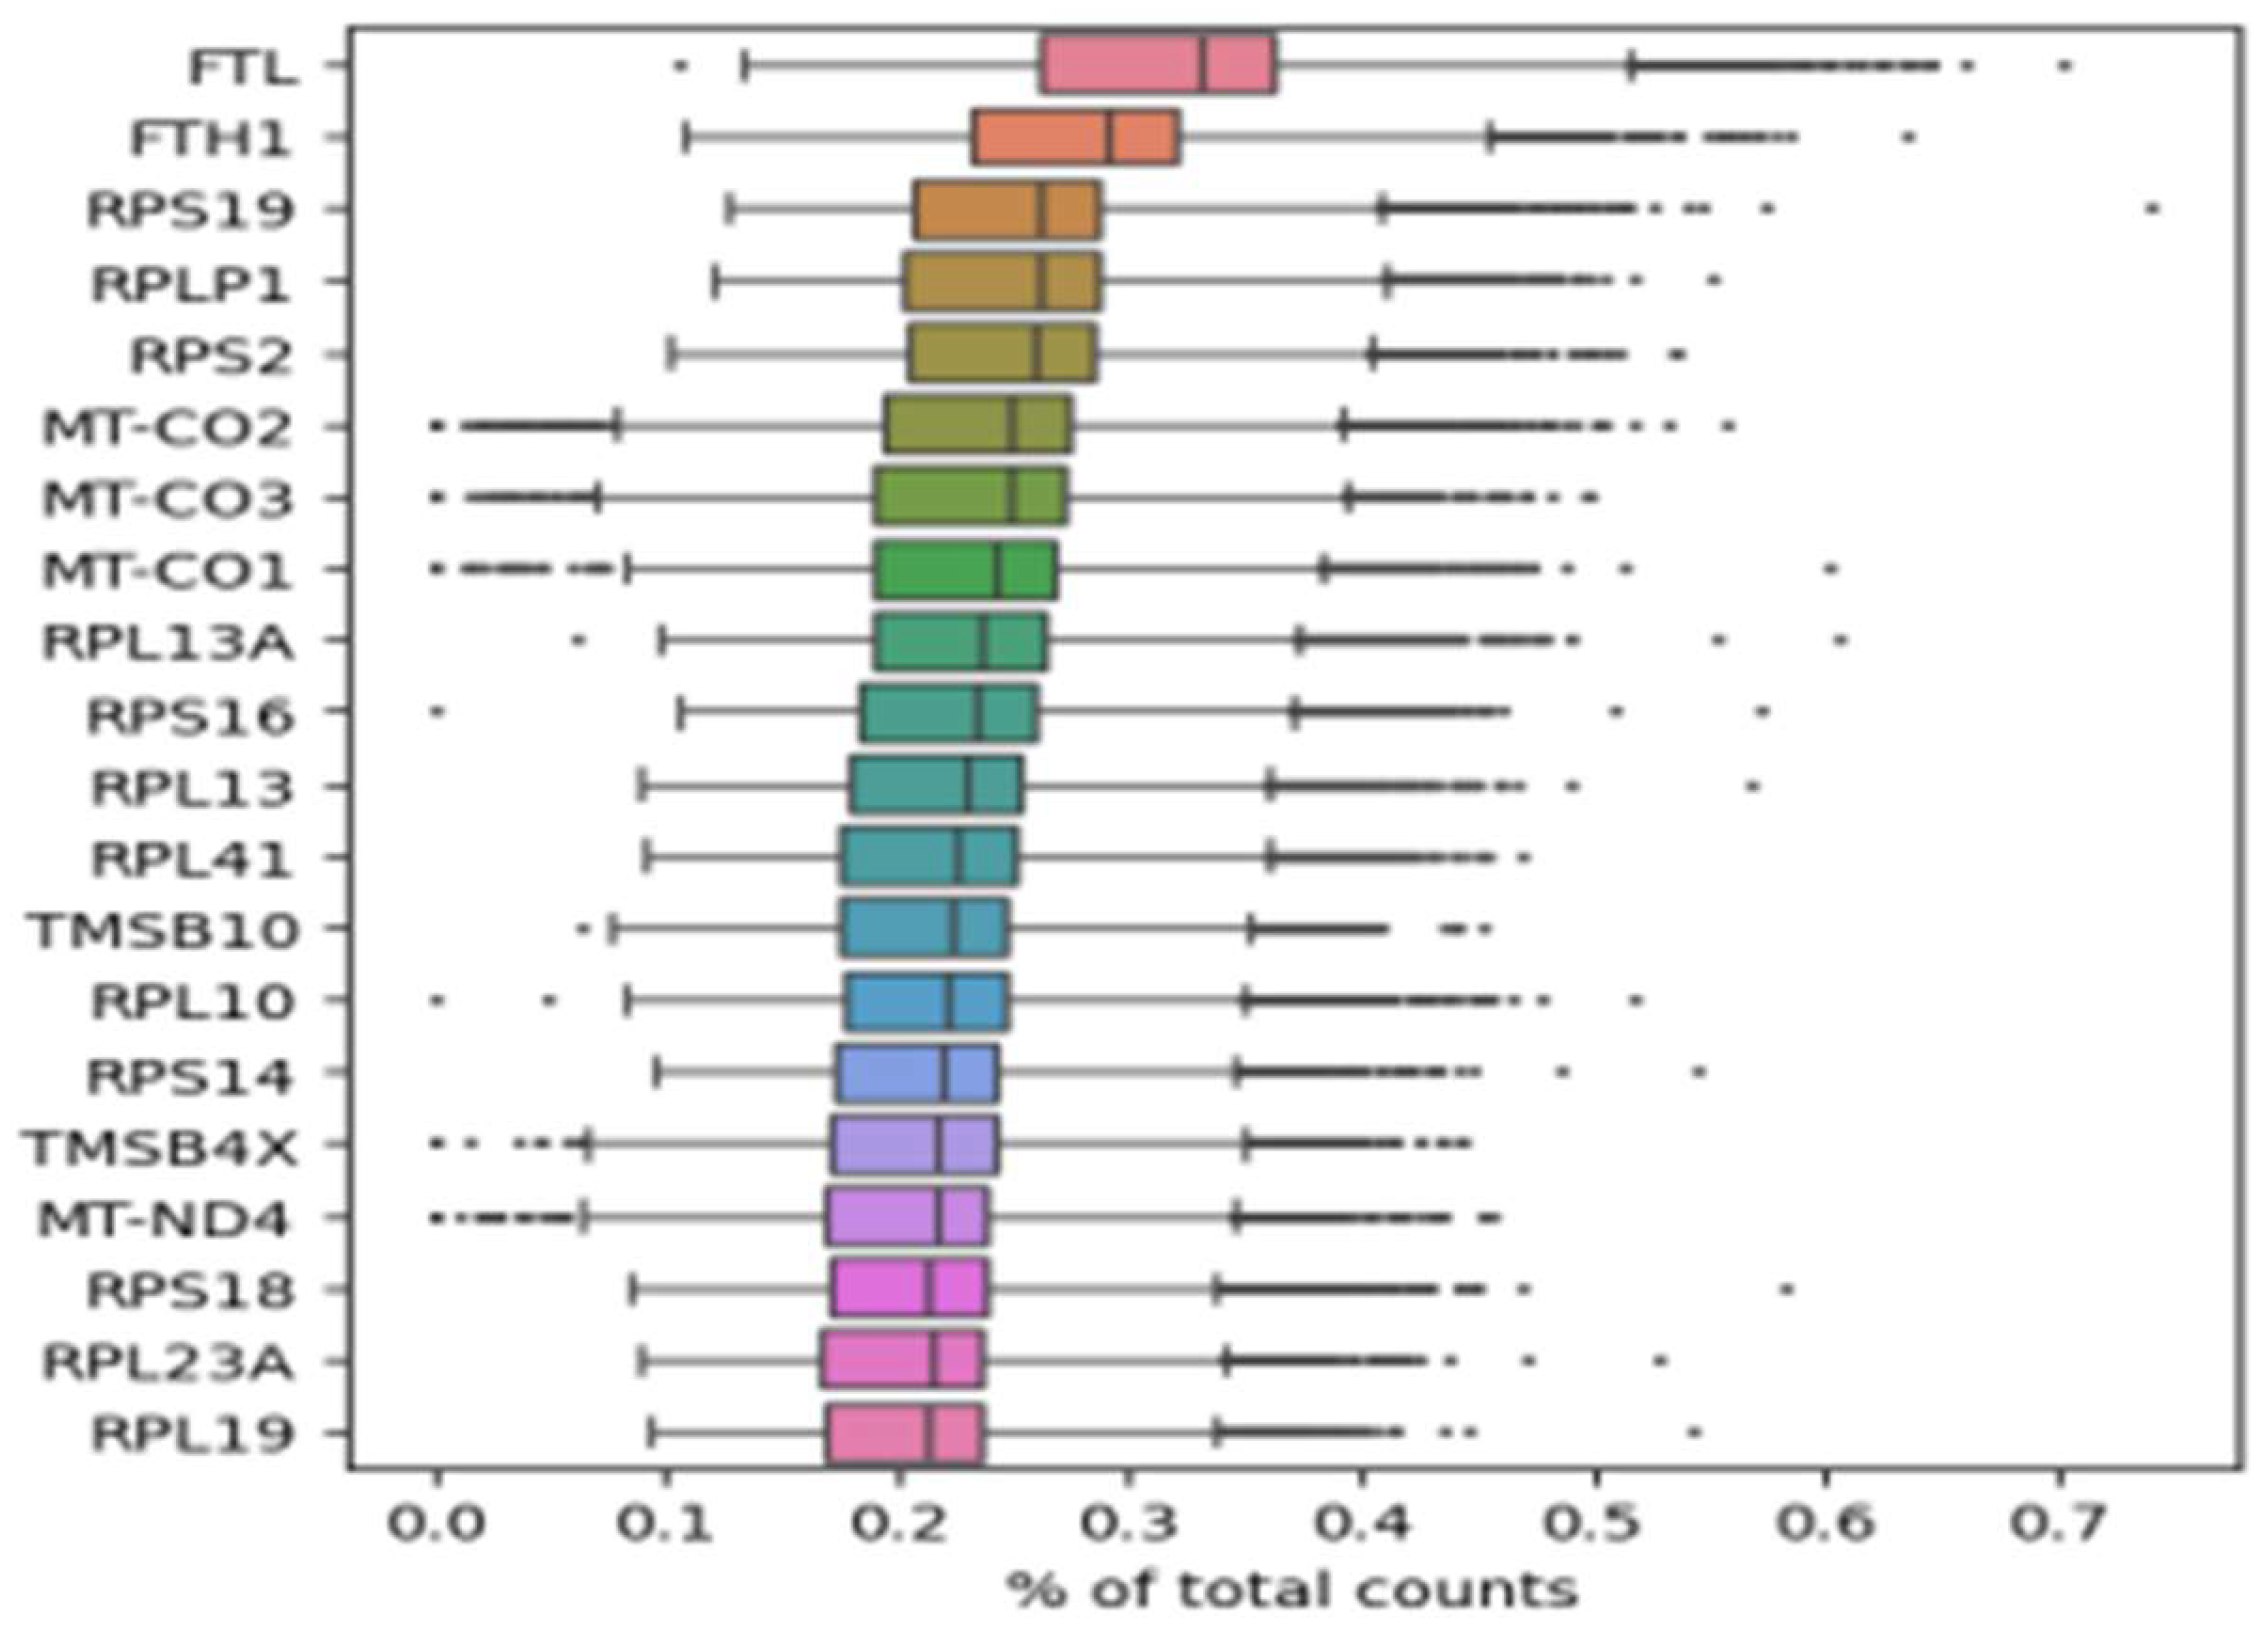
On top of the highest expressed genes, FTH1 and FTL, involved in iron metabolism, are prominent (Figure 7). These genes, along with TF, TfR1, and Fpn, constitute ferritin, the primary intracellular iron storage protein (Bogdan et al., 2016). Ferritin deregulation is observed in most acute myeloid leukemia (AML) patients, likely due to inflammation (Bertoli et al., 2019). On the other hand, these genes are implicated in ferroptosis, a process that leads to lethal lipid peroxidation and non-apoptotic cell death driven by accumulated iron-dependent lipid Reactive Oxygen Species (ROS). While ferroptosis has shown importance in cancer therapeutics, its roles in tumorigenesis and development remain unclear (Chen et al., 2020; Lu et al., 2018).

3.2. Characterization of variant profiles

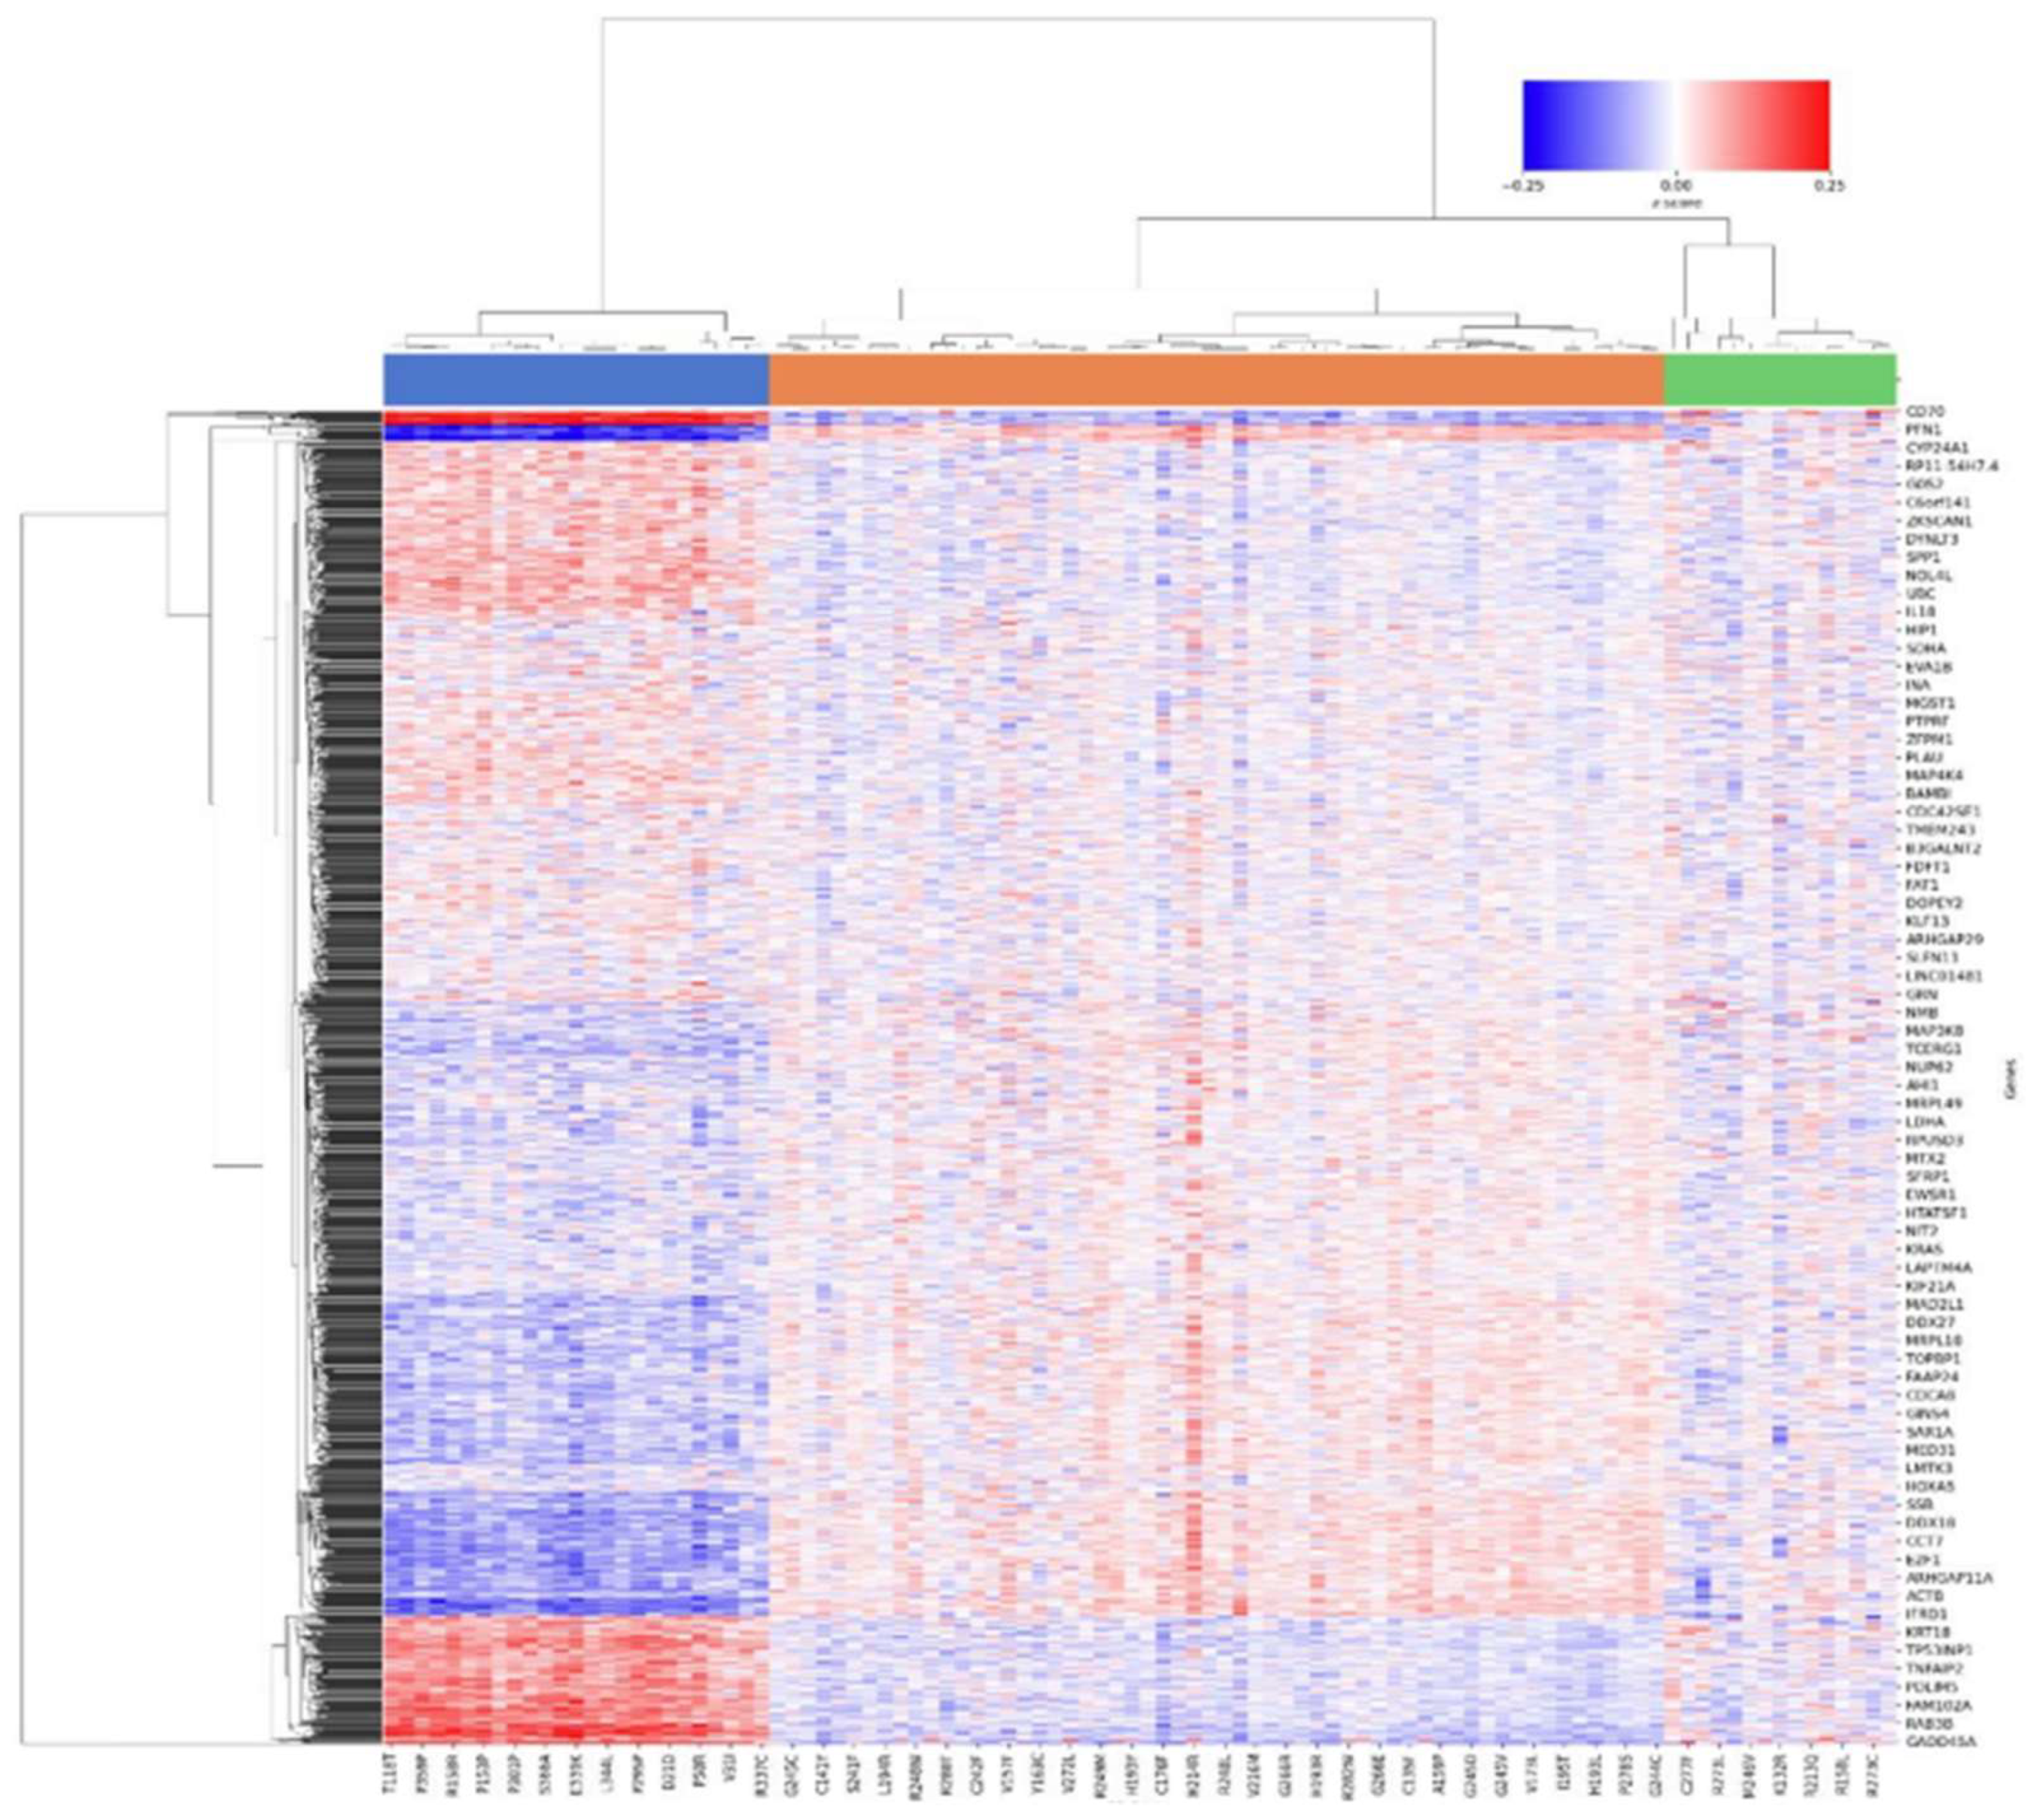
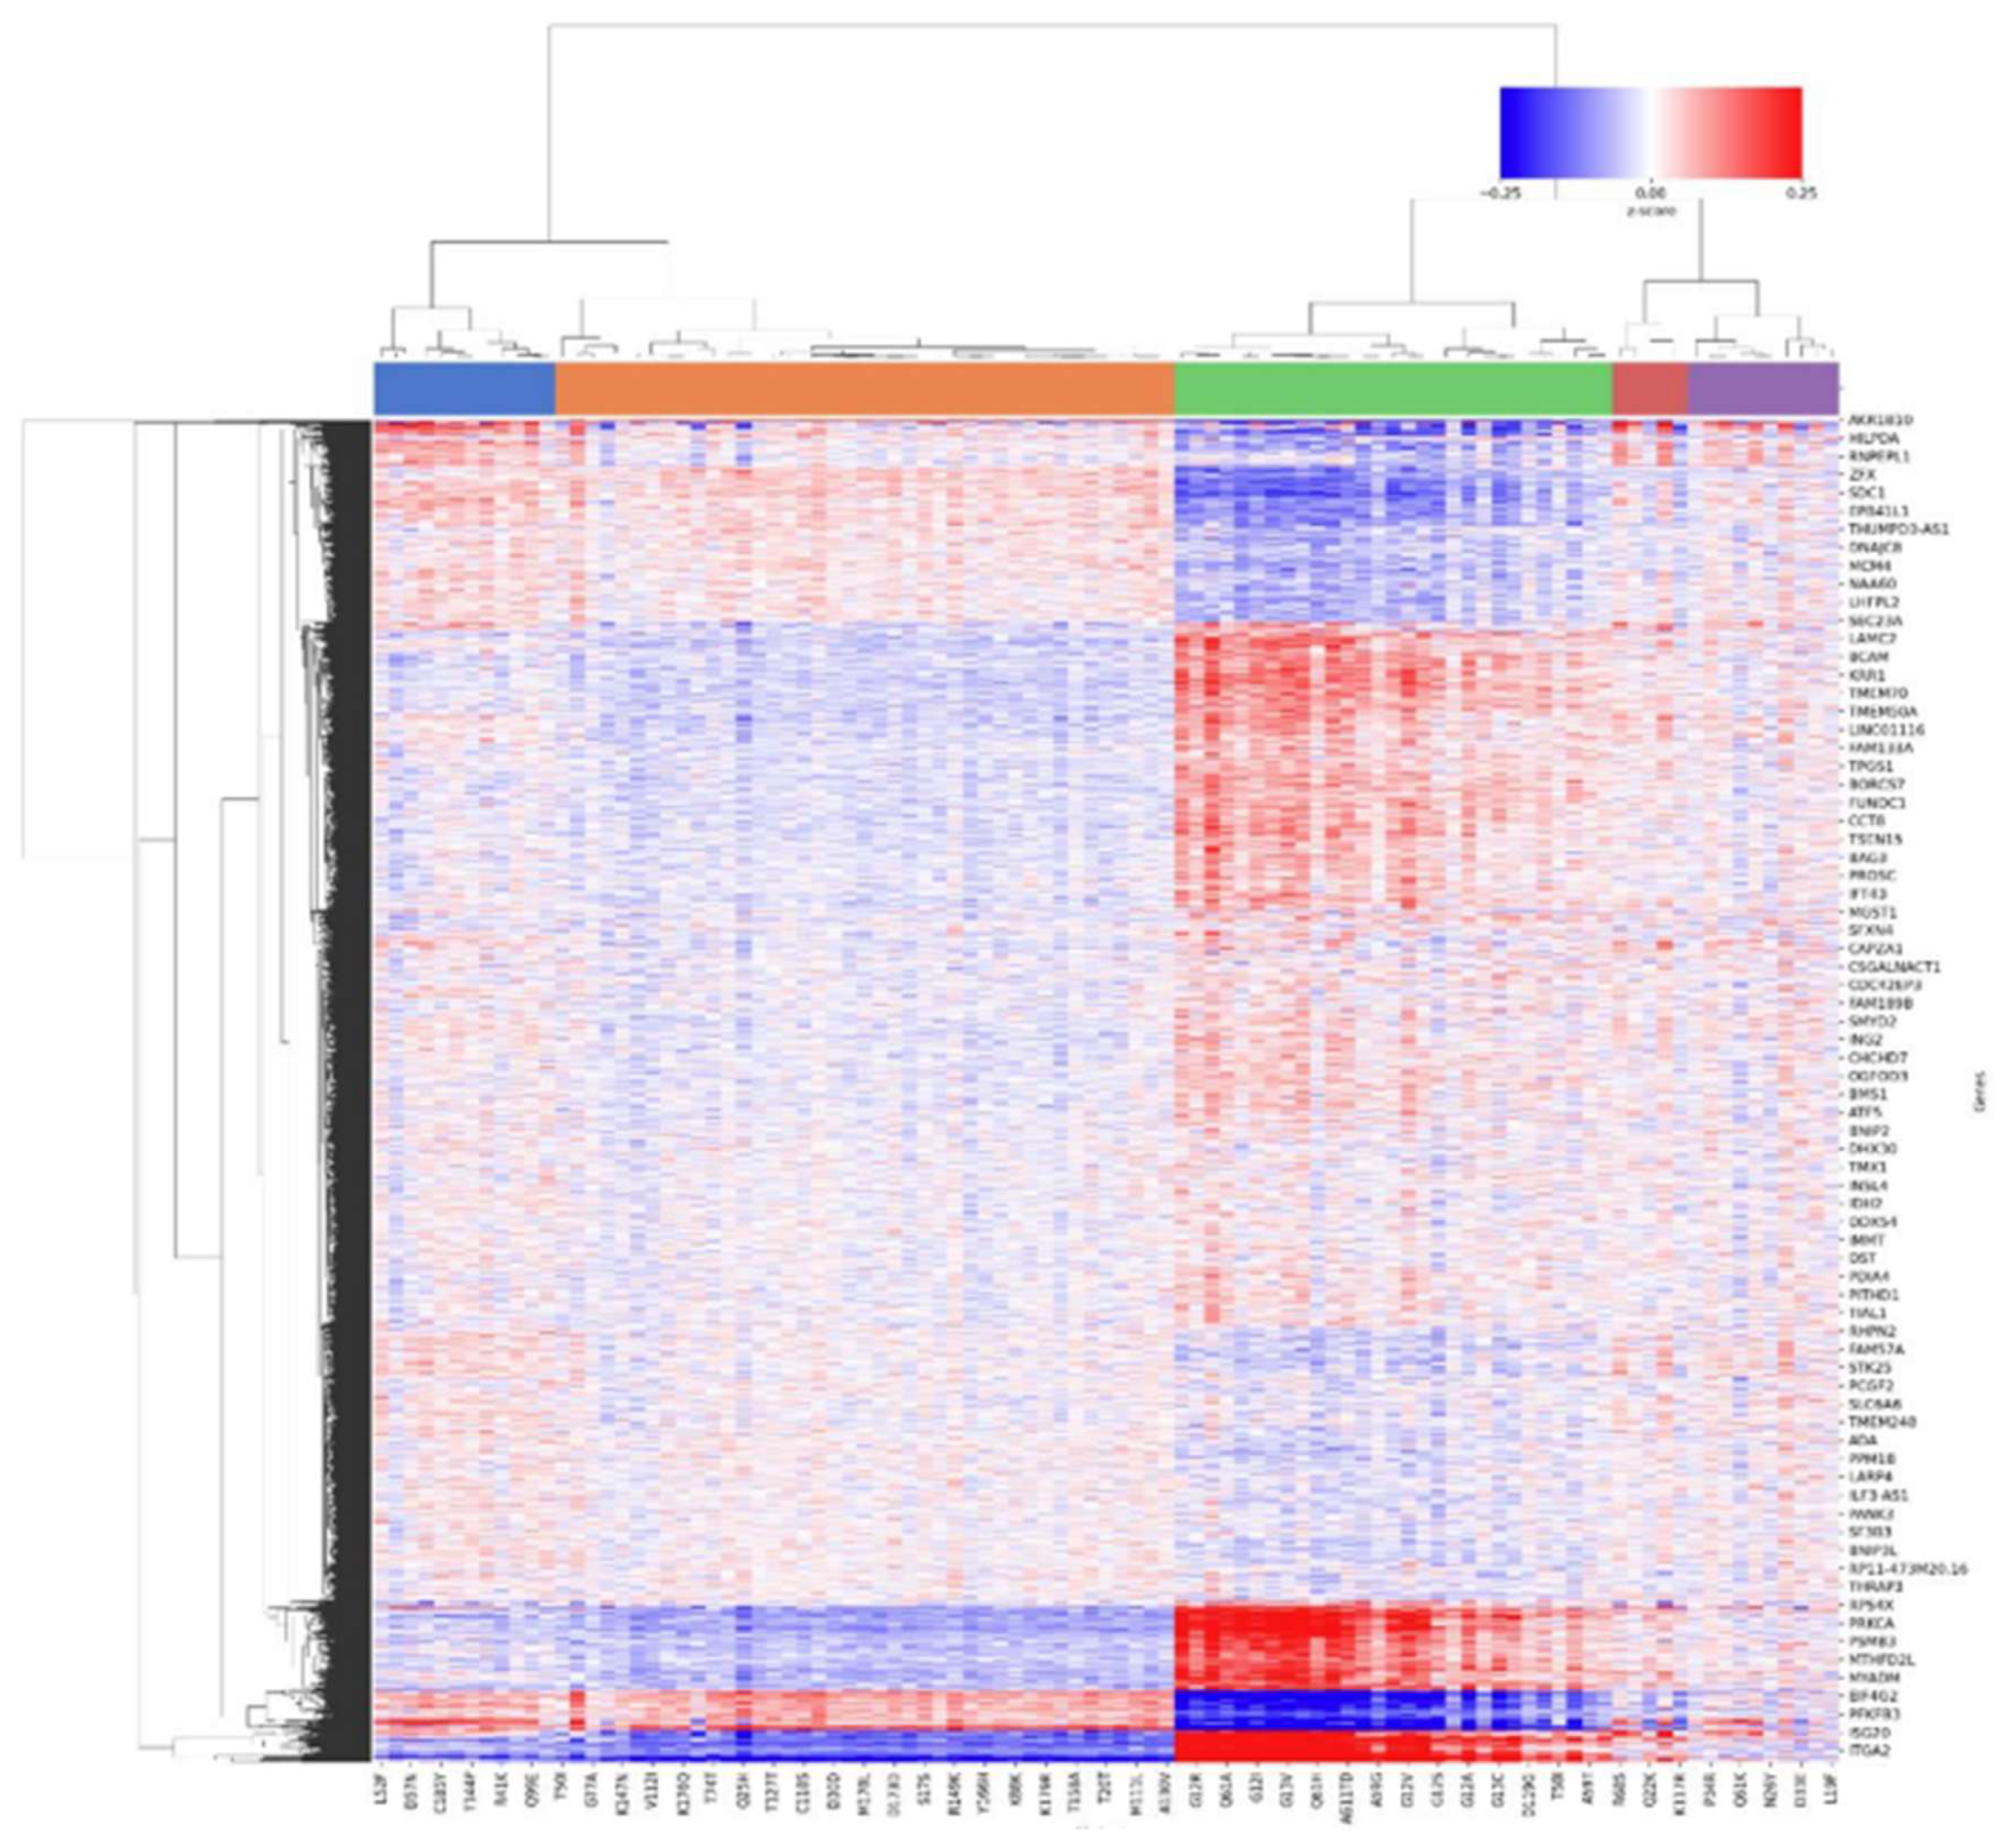
In the TP53 experiment, variants are grouped into three defined classes as shown by the heatmap of the Spearman correlation, with impactful (loss-of-function) variants coloured in black (Figure 8 and 9). Top Hotelling T² scoring variants include E286K, H193L, G245V, and G244C, all missense mutations with high prevalence in breast invasive ductal carcinoma and lung adenocarcinoma, according to the GENIE project of the AACR (AACR Project GENIE Consortium, 2017).
In the KRAS experiments, variants show a continuum of gain-of-function phenotypes, whose functional impact cannot be inferred only by their frequency in patient cohorts as reported (Figure 10 and 11) (Ursu et al., 2022). Top Hotelling T² scoring variants include G13R, K117N, Q61L, and G13E, all missense mutations with high prevalence in lung adenocarcinoma and colon adenocarcinoma (AACR Project GENIE Consortium, 2017).

3.3. Insights from Leiden clustering

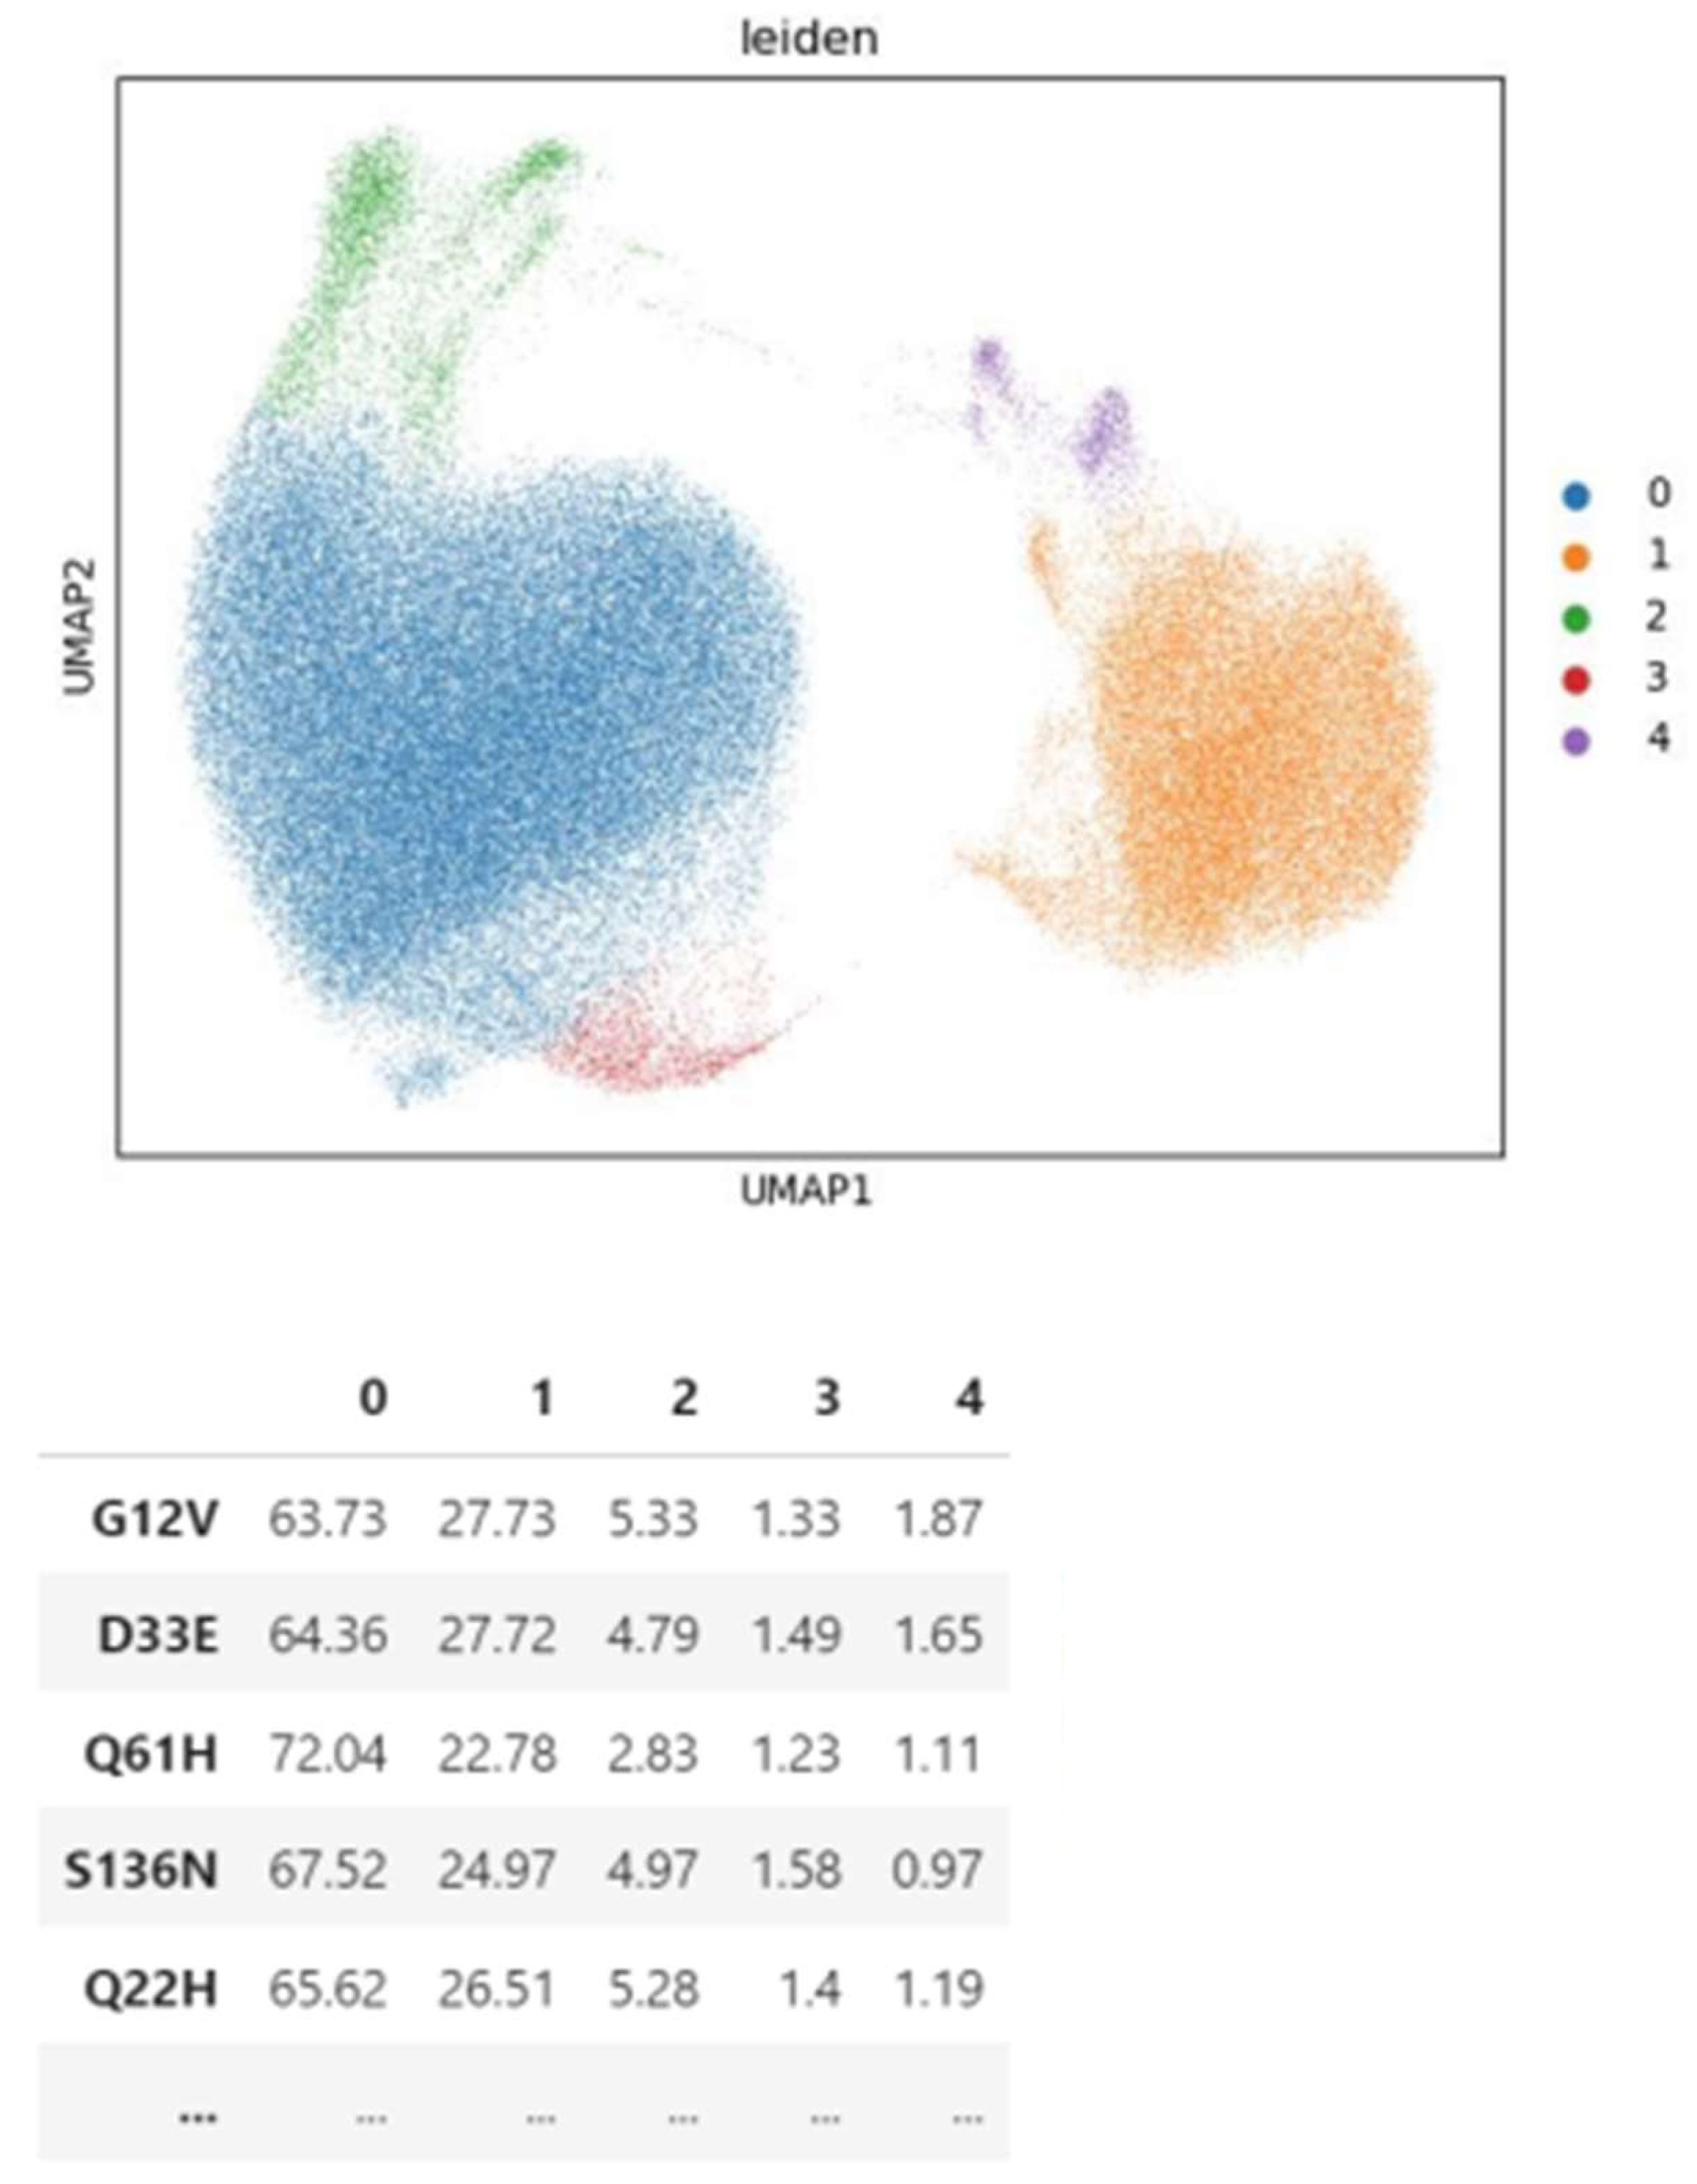
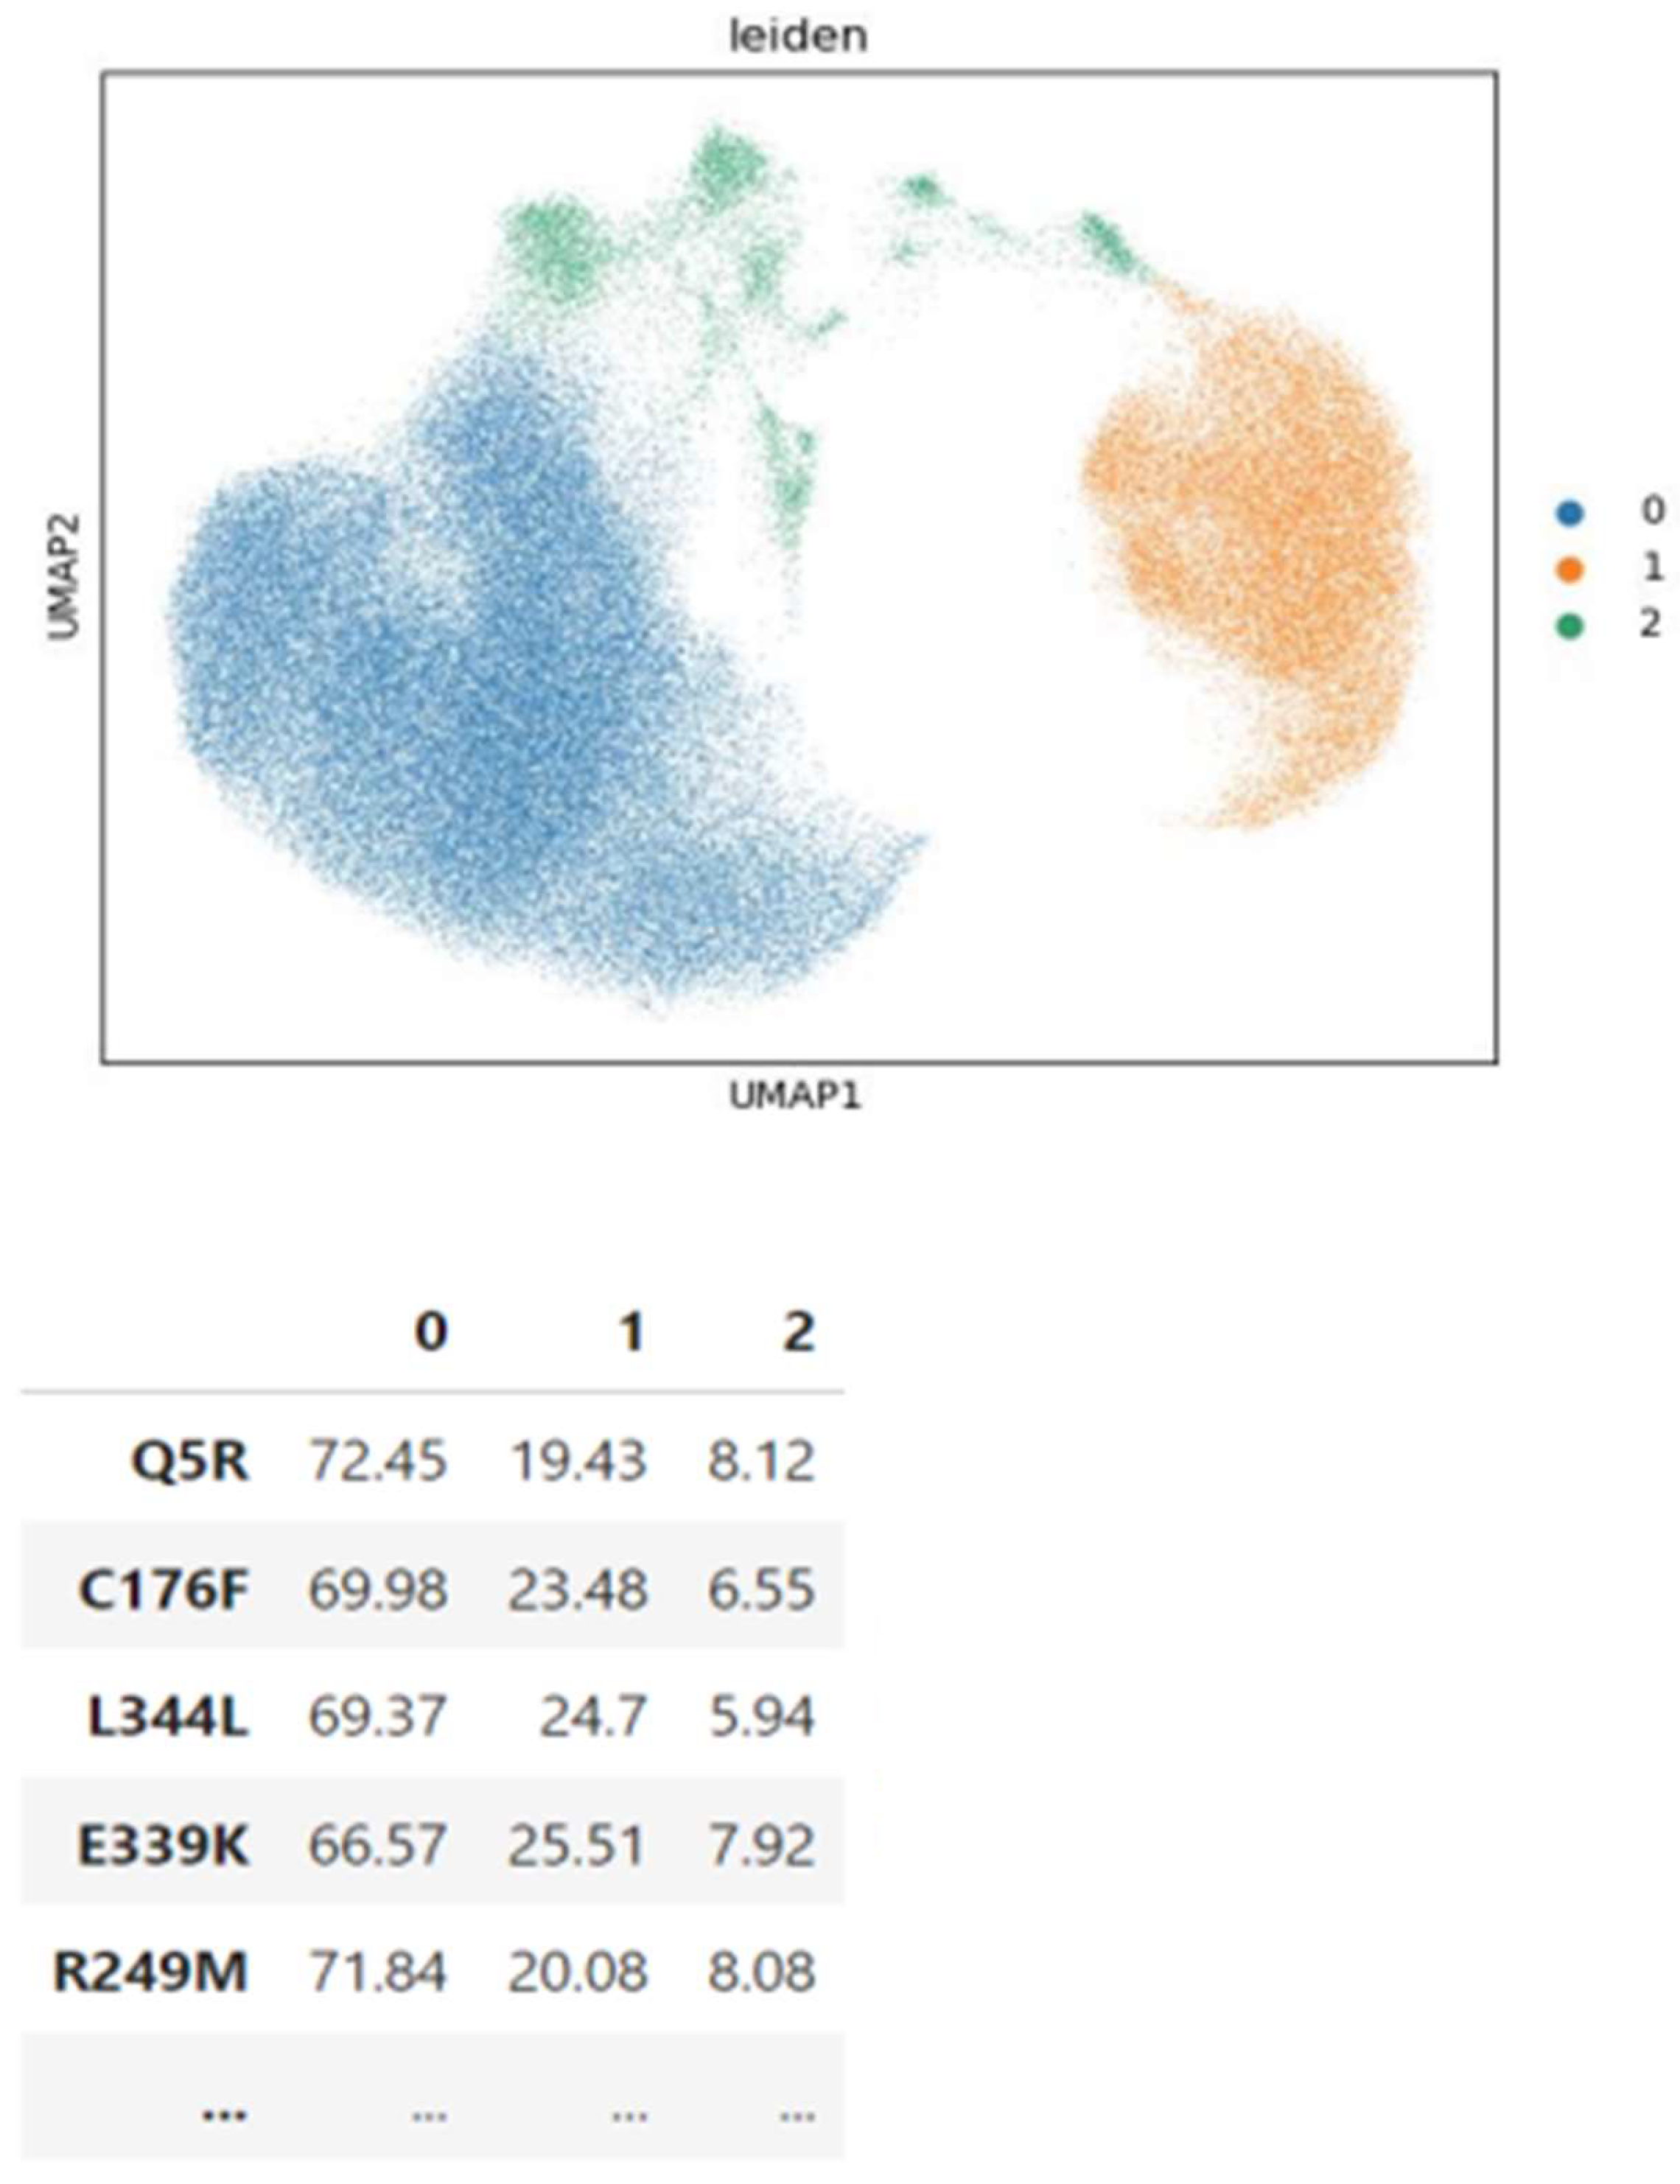
When clustering perturbations based on transcriptional profiles, the Leiden algorithm faces challenges due to cellular plasticity and heterogeneity. Even when adjusting the resolution to produce an equal number of clusters as obtained by the Spearman hierarchy, cells carrying the same variant do not cluster together but rather distribute across clusters in similar proportions between variants (Figure 12-15).
Conversely, for the 15 GPs obtained in TP53 experiment, GP 0 points out an alteration on spliceosome, GP 1 on the TNF signalling pathway, GP 2 on tyrosine kinase inhibitor resistance, GP 3 on proteasome, GP 8 on cell cycle, GP 9 on p53 signalling pathway, GP 11 on IL-17 signalling pathway, GP 12 on cell cycle, GP 13 on ribosome. On the other hand, for the 15 GPs obtained in KRAS experiment, GP 0 on spliceosome, GP 3 on adhesion, GP 4 on chromatin remodelling, GP 5 on p53 signalling pathway, GP 6 on TNF signalling pathways, GP 7 on IL-17 signalling pathway, GP 9 on proteasome, GP 10 on cell cycle, GP 13 on DNA replication.

3.4. DEA insights

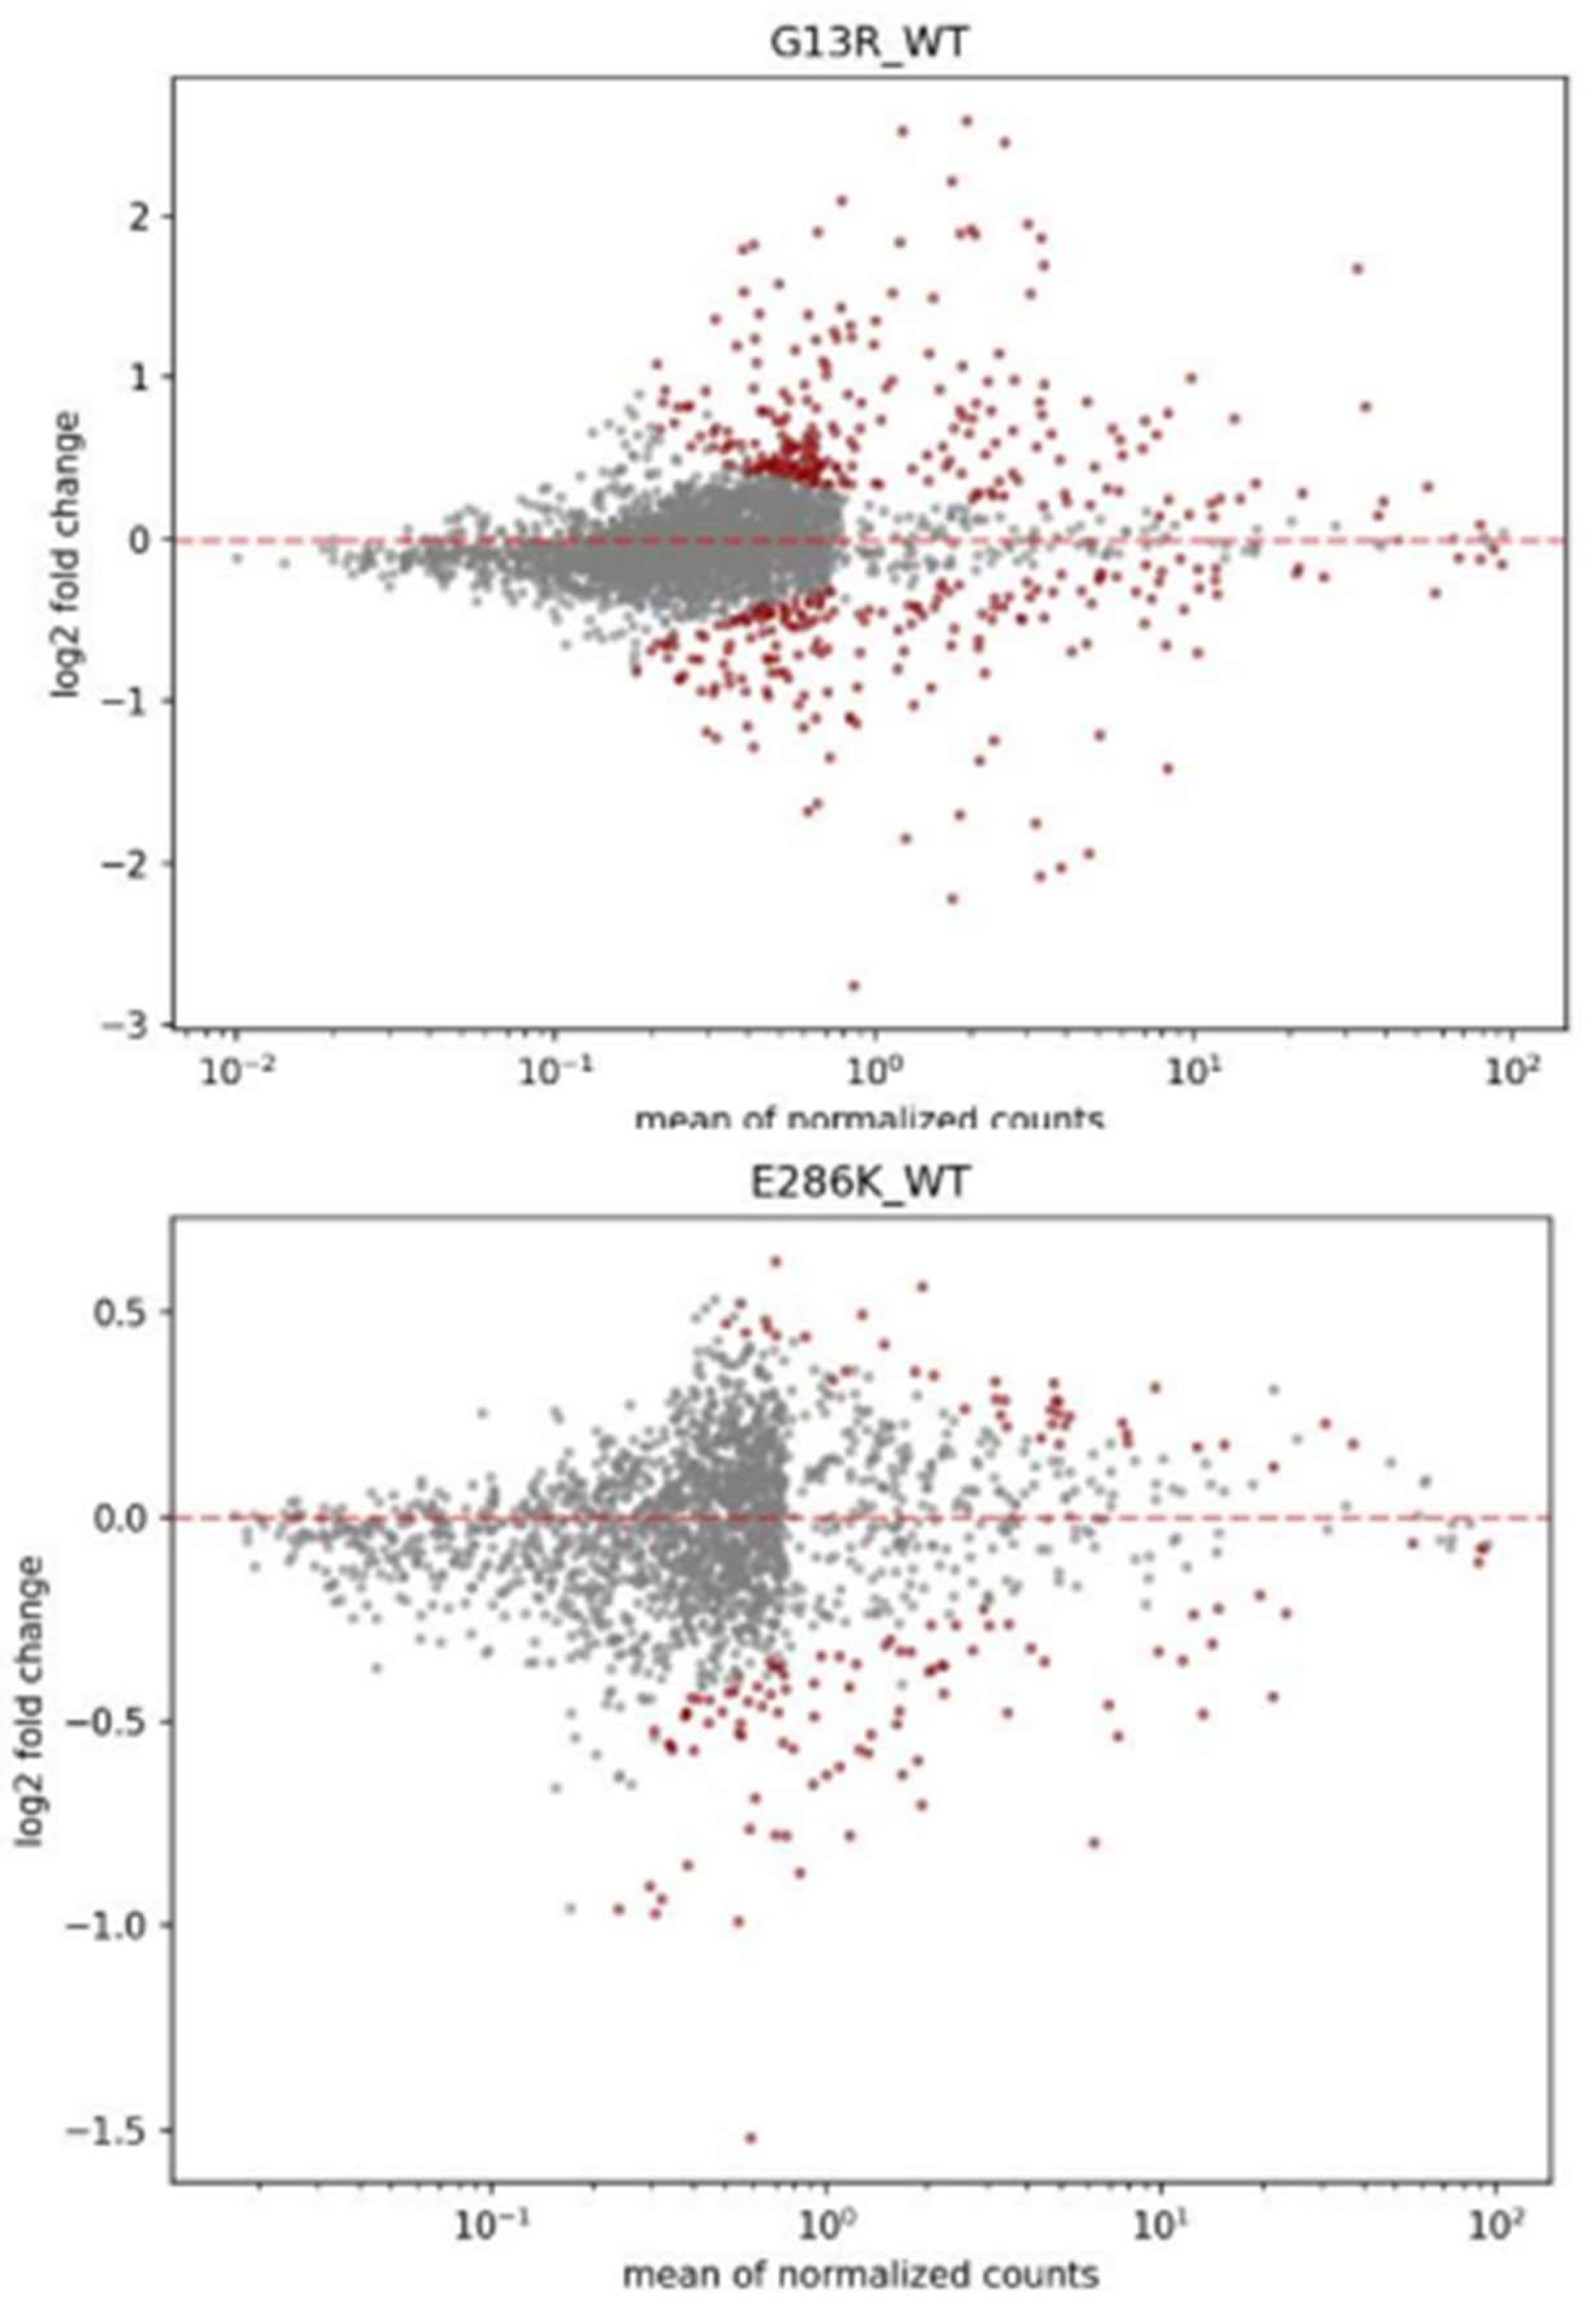
LCFs and q-values dataframes, along with HotellingT2 scores, are particularly useful for determining canonical signatures, such as the underexpression of CDKN1A and RPS27L previously reported in TP53 experiments (Jeay et al,. 2015). Notably, variants E286K, H193L, G245V, and G244C rank high in Hotelling T2 scores for the TP53 experiment, with PyDESeq2 identifying 135, 147, 137, and 147 significantly expressed genes, respectively (Figure 17). Despite other variants having more significantly expressed genes, these top variants likely induce larger changes (high LFC values) in a critical subset of genes, like CDKN1A and RPS27L. A similar pattern is observed in the KRAS experiment.
The integration of LFC and q-values is essential for identifying cancer driver genes and affected pathways, as the impact of a variant cannot be fully measured by the number of significantly expressed genes alone. The focus considered here should be on the magnitude of changes in critical genes to better understand and identify key drivers and pathways in cancer research.

3.4. Subnetworks identification and annotation
In the context of KRAS, despite variations among its clusters, these exhibit similar affected biological processes, reflecting the mentioned continuum of phenotypes. For instance, a common annotation previously reported is that oncogenic KRAS induces the loss of the redox master regulator Nfe2l2/Nrf2 (which regulates mRNA translation) to stimulate pancreatic and lung cancer initiation. Mutated TP53 also has been significantly altering Nfe2l2 pathways (Cancer Genome Atlas Research Network, 2008). Among the significantly expressed genes, HH includes in the altered subnetwork the Nrf2 target genes like NQO1 and HMOX1, as
Figure 8. Hierarchical dendrogram based on Spearman correlation for TP53 experiment. Impactful variants are in black.
Preprints 138066 g008
Figure 9. Heatmap of z-score of most variable genes for TP53 experiment.
Preprints 138066 g009
Figure 10. Hierarchical dendrogram based on Spearman correlation for KRAS experiment. Impactful variants are in black.
Preprints 138066 g010
Figure 11. Heatmap of z-score of most variable genes for TP53 experiment.
Preprints 138066 g011
Figure 12. Leiden clusters of cells represented with UMAP (top) and the distribution of variants on the clusters (left) for KRAS experiment.
Preprints 138066 g012
Figure 13. Leiden clusters of cells represented with UMAP (top) and the distribution of variants on the clusters (left) for TP53 experiment.
Preprints 138066 g013
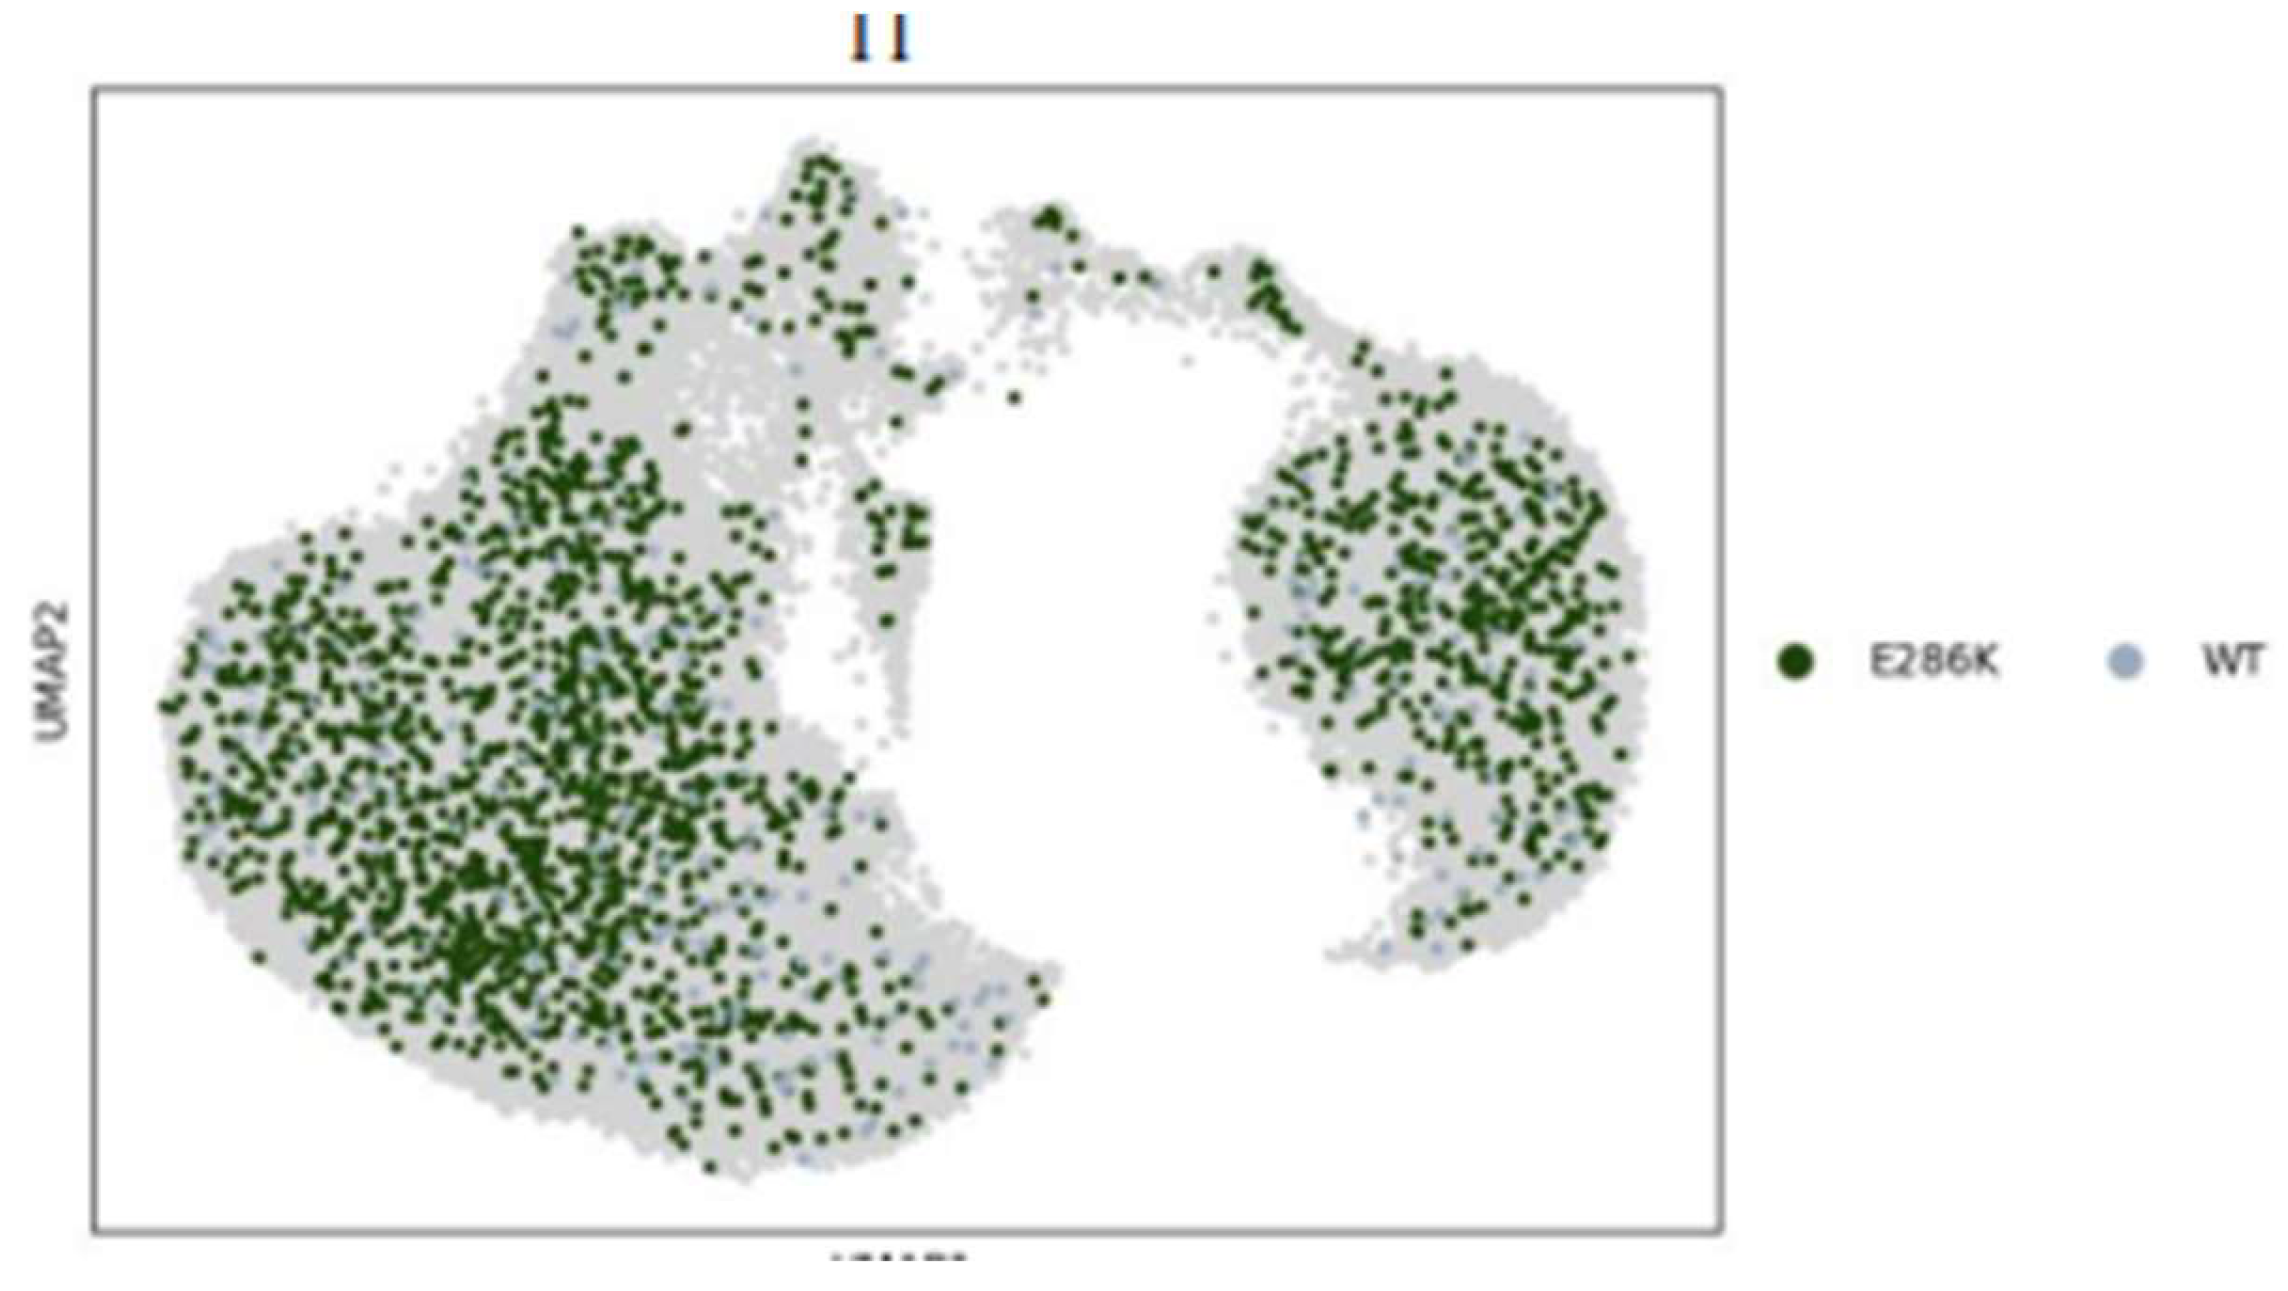
Figure 14. UMAP scatter of E286K variant against WT for TP53 experiment.
Preprints 138066 g014
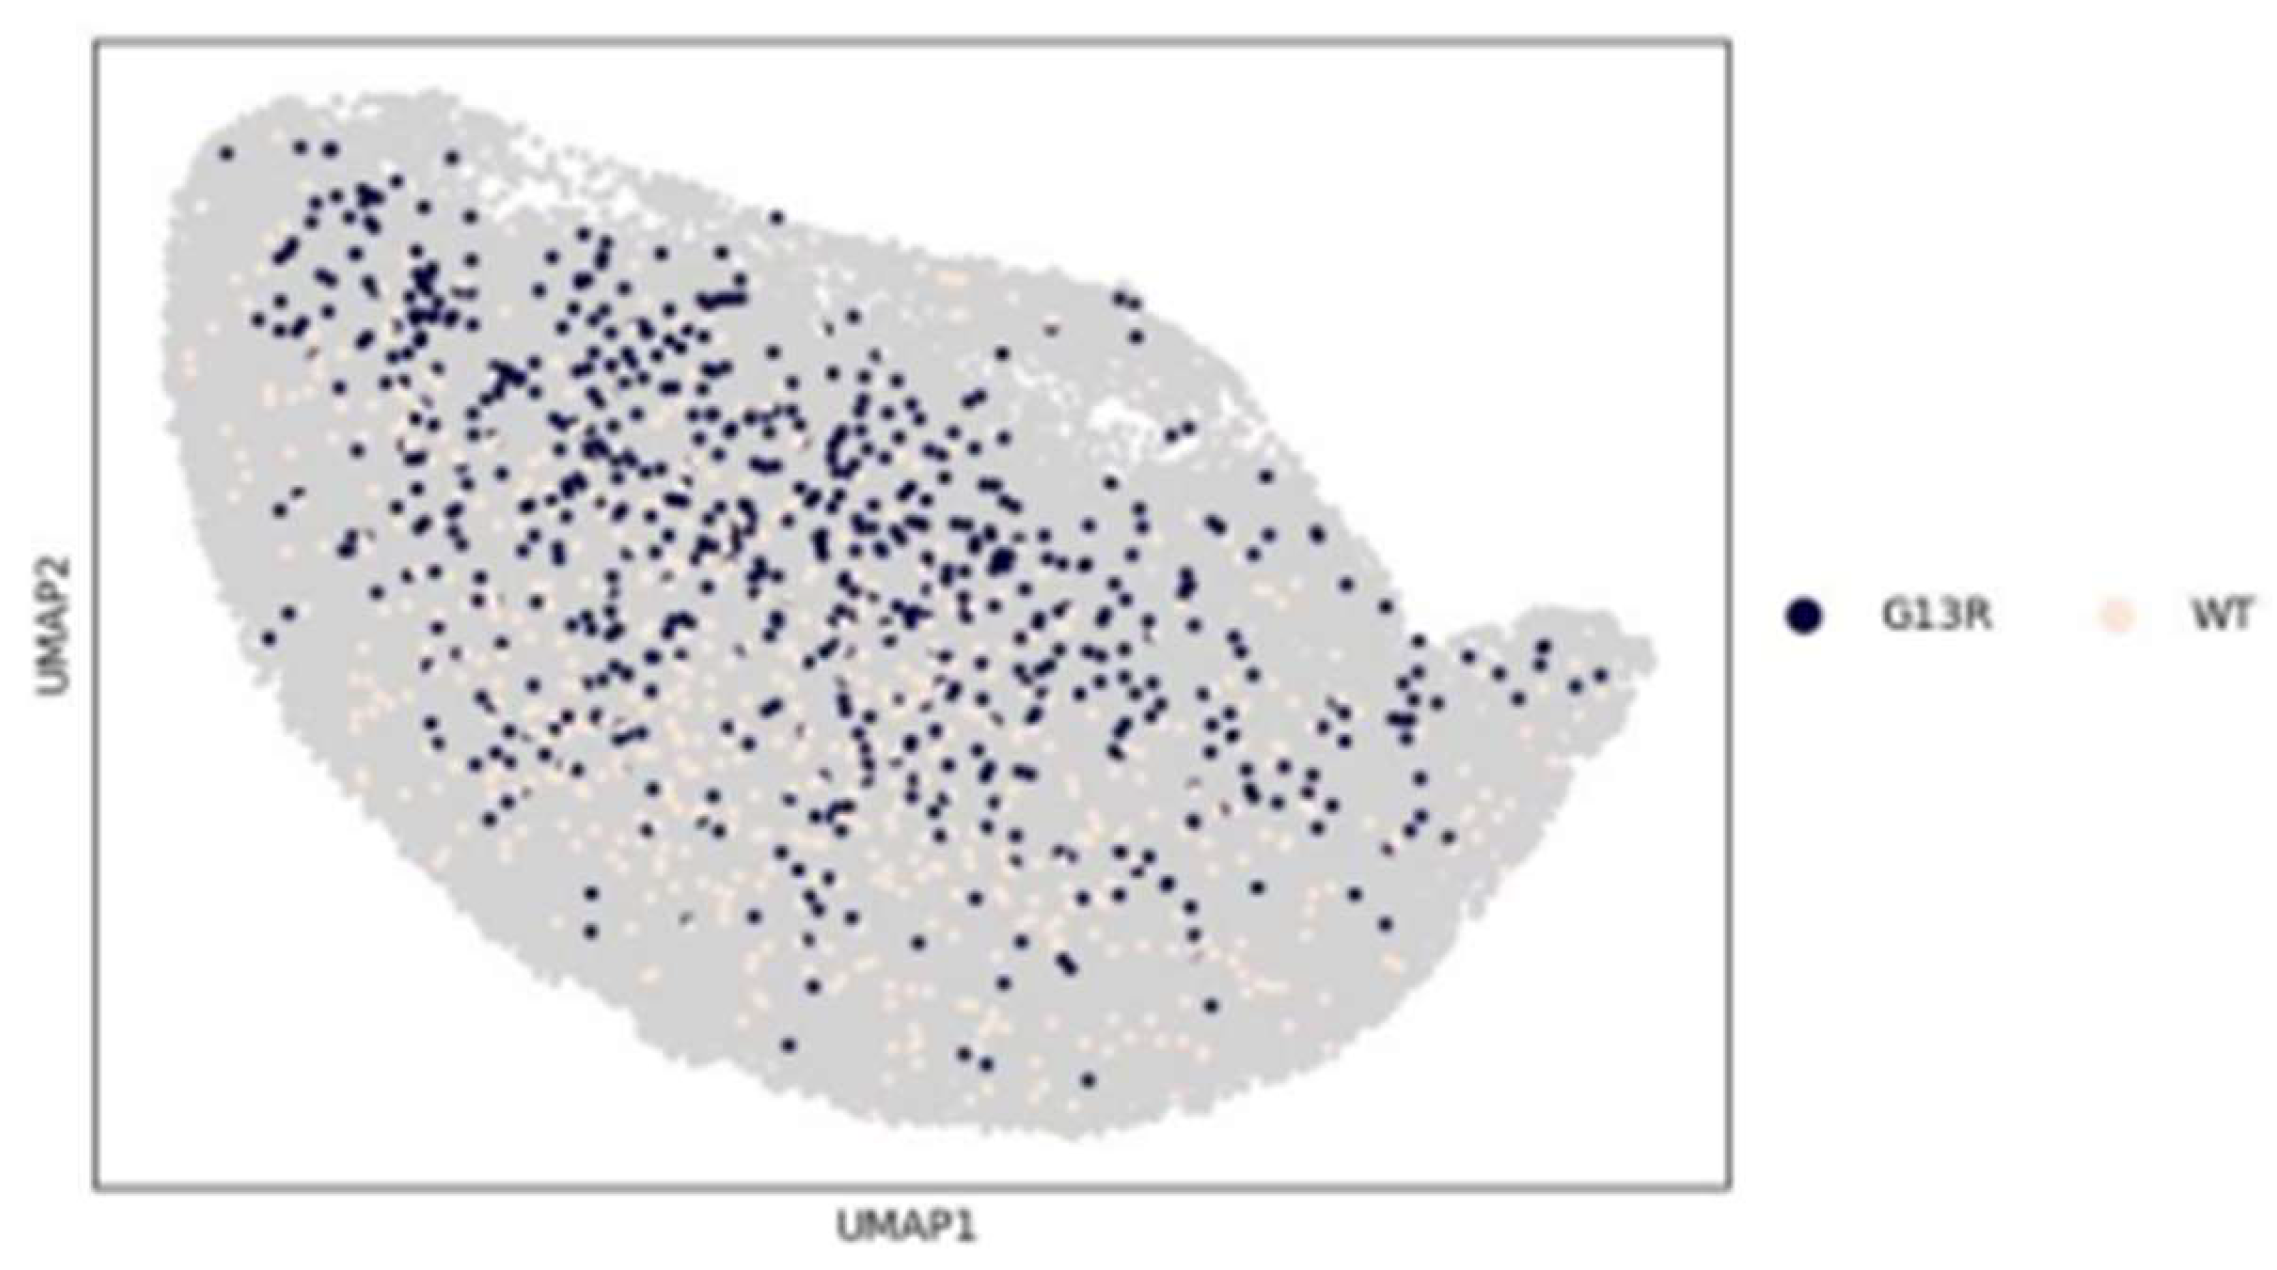
Figure 15. UMAP scatter of G13R variant against WT for KRAS experiment.
Preprints 138066 g015
Figure 16. Leiden clusters of genes represented with UMAP for KRAS (top) and TP53 (bottom) experiments.
Preprints 138066 g016
Figure 17. MA plot with significantly expressed genes in red of G13R variant for KRAS experiment (top) and E286K variant for TP53 experiment (bottom).
Preprints 138066 g017
well as TXNRD1, which serves more as a surrogate marker than a key malignant phenotype determi nant (DeNicola et al,. 2011; Delgobo et al,. 2021). Notably, genes like BCL2L1 and PRDX1, despite being significantly expressed, are not identified by HH, although their relevance in Nrf2 dysregulation according to current literature (Sillars-Hardebol et al,. 2012; Ding et al,. 2017).
Furthermore, oncogenic KRAS induces de novo lipogenesis to promote aberrant growth by activating SREBPs, which are essential in cholesterol synthesis. Significant genes involved in this pathway include SQLE, FDFT1, HMGCS1, IDI1, DHCR7, and FDPS (Ricoult et al,. 2016; De Vusser et al,. 2020), whereas SCD, crucial in growth and metastasis, is not included (Zhao et al,. 2022).
Additionally, type II cytokines such as interleukin-4 and interleukin-13 from Th2 cells in the tumour microenvironment stimulate MYC transcriptional upregulation (included by HH), driving glycolysis (Dey et al,. 2020). Conversely, interleukin-12 triggers JAK/STAT activation, essential for cell survival, proliferation, angiogenesis, invasion, and metastasis, leading to the downregulation of ANXA2, a pro-metastatic gene, the only significantly expressed gene in this pathway detected by HH (Yehia et al,. 2023).
Figure 18. Selected annotated pathways of detected modules for KRAS and TP53 experiments.
Preprints 138066 g018
For the TP53 experiment, mutants of TP53 accumulates in the cytoplasm suppressing ROS production to avoid apoptosis through the respiratory complex, in which NDUFA9, MT-ND6 and MT-ND1 participates and are significantly expressed, all incorporated by HH (Kim et al,. 2014).
Similarly, Insulin-like Growth Factor mRNA Binding Proteins are commonly annotated, with CD44 being well-captured by HH implementation. CD44 plays roles in cytoskeletal organization, cell adhesion, migration, and is associated with cancer metastasis influenced by oncogenic factors like TP53 (Huang et al,. 2018; Bell et al,. 2013). However, IGFBP4 and IGFBP6, though significantly expressed and implicated in tumour suppression, are not included by HH, relieving their not-central role in the subnetwork (Gligorijević et al,. 2022).
Alternative RNA splicing, essential for proteomic diversity, often goes aberrant in cancer. The proto-oncogene SRSF3 (SRp20) is significantly expressed and included by HH, although its exact oncogenic splicing targets remain unclear (Ajiro et al,. 2016).
Lastly, dysregulated translation of mRNAs involved in G1 cell cycle progression and S-phase initiation enhances cell size and proliferation (Miyake et al,. 2012). HH detects significant expression of MRPL10 and MRPL13 in the variants cluster, known to be overexpressed and to promote invasion in cancer (Zeng et al,. 2021).

4. Conclusion

This project introduces a comprehensive pipeline that integrates various bioinformatics tools and methodologies derived from extensive bibliographic research. It leverages high-throughput sequencing to analyse differential gene expression and complex altered PPi subnetworks in cancer variants. The pipeline demonstrates excellent performance, successfully distinguishes impactful, identifies variants with similar expression profiles, and shows promising results for retrieving key affected modules already observed in KRAS and TP53 variants. These promising results indicate the potential of the Perturb-seq approach to become a standard strategy for uncovering not only common significantly expressed genes, but also interactors that could be targeted in future therapeutic strategies. All code to recapitulate the analysis is in https://github.com/jesusch10/perturbseq_analysis along with documentation of pipeline usage.
In contrast, several widely used PPi network databases have been developed, including BioGRID (Oughtred et al., 2019); iRefIndex (Razick et al., 2008): ReactomeFI (Vastrik et al., 2007); and STRING (Szklarczyk et al., 2019). Each database has a distinct topological structure, crucial for identifying candidate driver genes and module structures. However, most existing network-based methods rely on input from a single PPi network, highlighting the need for a method capable of identifying significantly perturbed subnetworks in cancer cells by leveraging multiple PPi networks (Yang et al., 2023).
One way to address this issue is by integrating multiple PPi networks into a single network. Although the HH algorithm applies a consensus approach that combines the topological information of multiple PPi networks, it first identifies subnetworks in individual networks without using information from other networks. This might result in missing structures that could be revealed by considering all PPi networks together (Yang et al., 2023; Reyna et al., 2018). Moreover, HH results depend on the clustering parameter δ, determined by the number of permutations. Despite reducing the number of permutations to 10 to avoid computationally intensive calculations, consistent results are obtained (Ahmed et al., 2020).
Additionally, consensus procedures often assume that every input PPi network has a complete topology covering most interactions (Luck et al., 2020). However, topological information is frequently incomplete, so the integration has been described to produce subnetworks significantly different from the ones obtained with single networks (Swaney et al., 2021). Furthermore, different databases employ diverse procedures, which can describe the same biological reactions quite differently. A more reasonable but labour-intensive approach is manually merging the knowledge from different databases by data curation experts to reduce the fragmentation of knowledge stored in these resources (Wu et al., 2010).
This pipeline effectively reduces experimental complexity and batch effects and decomposes noisy, high-dimensional single-cell data into more interpretable components, enabling the decoupling of common responses to a given group of similar perturbation. By changing the number of modified cells and sequencing depth, next step involves isolating these responses from confounding effects, such as the distribution of variants across cell cycle states, previously assessed as the primary difference between TP53 variants but not KRAS variants (Dixit et al., 2016; Adamson et al., 2016; Ursu et al., 2022). Although this future approach does not determine the mechanism of their impact, it provides hypotheses for them. Perturb-seq can in principle dissect higher order effects, but systematic analysis of genetic interactions remains an ambitious goal to further create an available atlas of variant impact across all key cancer genes and contexts (Ursu et al., 2022). However, in the future it should be considered that there is the possibility by which surface mutations (overall missense mutations under positive selection) could generate a new edge in the network thereby remodelling network architectures (Ozturk et al., 2022).
Despite Perturb-seq significantly reducing time and cost, these still scale linearly with the number of perturbations assayed, whereas the combination space grows exponentially as the order of combinations increases. Nevertheless, Perturb-seq is expected to scale as sequencing costs decrease, making it feasible for targeted screens of a large subset of genes (Dixit et al., 2016). Actually, new approaches for carrying out Perturb-seq involve generating composite samples, either by overloading microfluidics chips to generate droplets containing multiple cells (cell-pooling) or infecting cells with multiple gRNA. These methods lead to substantial cost reductions, maintaining accuracy, increasing the power to detect genetic interaction effects, reducing the number of cells needed for screening, and testing selected combinations (Jaitin et al., 2016; Yao et al., 2023; Wessels et al., 2023). Additionally, costs could be further decreased by advances in long-read scRNA-seq without variant barcoding or using other scRNA-seq methods such as scifi (Lebrigand et al., 2023; Datlinger et al., 2021).

References

  1. AACR Project GENIE Consortium (2017). AACR Project GENIE: Powering Precision Medicine through an International Consortium. Cancer discovery, 7(8), 818–831. [CrossRef]
  2. Adamson, B. , Norman, T. M., Jost, M., Cho, M. Y., Nuñez, J. K., Chen, Y., Villalta, J. E., Gilbert, L. A., Horlbeck, M. A., Hein, M. Y., Pak, R. A., Gray, A. N., Gross, C. A., Dixit, A., Parnas, O., Regev, A., & Weissman, J. S. (2016). A Multiplexed Single-Cell CRISPR Screening Platform Enables Systematic Dissection of the Unfolded Protein Response. Cell, 167(7), 1867–1882.e21. [CrossRef]
  3. Ahmed, R. , Baali, I., Erten, C., Hoxha, E., & Kazan, H. (2020). MEXCOwalk: mutual exclusion and coverage based random walk to identify cancer modules. Bioinformatics (Oxford, England), 36(3), 872–879. [CrossRef]
  4. Aibar, S. , González-Blas, C. B., Moerman, T., Huynh-Thu, V. A., Imrichova, H., Hulselmans, G., Rambow, F., Marine, J. C., Geurts, P., Aerts, J., van den Oord, J., Atak, Z. K., Wouters, J., & Aerts, S. (2017). SCENIC: single-cell regulatory network inference and clustering. Nature methods, 14(11), 1083–1086. [CrossRef]
  5. Ajiro, M. , Jia, R., Yang, Y., Zhu, J., & Zheng, Z. M. (2016). A genome landscape of SRSF3-regulated splicing events and gene expression in human osteosarcoma U2OS cells. Nucleic acids research, 44(4), 1854–1870. [CrossRef]
  6. Babichev, S. , Lytvynenko, V., Korobchynskyi, M., & Sokur, I. (2019). Chapter 23 - Computational Epigenetics in Lung Cancer. In L. K. Wei (Ed.), Computational Epigenetics and Diseases (pp. 397–417). [CrossRef]
  7. Bader, G. D., & Hogue, C. W. (2003). An automated method for finding molecular complexes in large protein interaction networks. BMC bioinformatics, 4, 2. [CrossRef]
  8. Bailey, M. H. , Tokheim, C., Porta-Pardo, E., Sengupta, S., Bertrand, D., Weerasinghe, A., Colaprico, A., Wendl, M. C., Kim, J., Reardon, B., Ng, P. K., Jeong, K. J., Cao, S., Wang, Z., Gao, J., Gao, Q., Wang, F., Liu, E. M., Mularoni, L., Rubio-Perez, C., … Ding, L. (2018). Comprehensive Characterization of Cancer Driver Genes and Mutations. Cell, 173(2), 371–385.e18. [CrossRef]
  9. Barel, G. , & Herwig, R. (2020). NetCore: a network propagation approach using node coreness. Nucleic acids research, 48(17), e98. [CrossRef]
  10. Barrett, T. , Wilhite, S. E., Ledoux, P., Evangelista, C., Kim, I. F., Tomashevsky, M., Marshall, K. A., Phillippy, K. H., Sherman, P. M., Holko, M., Yefanov, A., Lee, H., Zhang, N., Robertson, C. L., Serova, N., Davis, S., & Soboleva, A. (2013). NCBI GEO: archive for functional genomics data sets--update. Nucleic acids research, 41(Database issue), D991–D995. [CrossRef]
  11. Barry, T. , Mason, K., Roeder, K., & Katsevich, E. (2024). Robust differential expression testing for single-cell CRISPR screens at low multiplicity of infection. Genome biology, 25(1), 124. [CrossRef]
  12. Beisser, D. , Klau, G. W., Dandekar, T., Müller, T., & Dittrich, M. T. (2010). BioNet: an R-Package for the functional analysis of biological networks. Bioinformatics (Oxford, England), 26(8), 1129–1130. [CrossRef]
  13. Belk, J. A. , Yao, W., Ly, N., Freitas, K. A., Chen, Y. T., Shi, Q., Valencia, A. M., Shifrut, E., Kale, N., Yost, K. E., Duffy, C. V., Daniel, B., Hwee, M. A., Miao, Z., Ashworth, A., Mackall, C. L., Marson, A., Carnevale, J., Vardhana, S. A., & Satpathy, A. T. (2022). Genome-wide CRISPR screens of T cell exhaustion identify chromatin remodeling factors that limit T cell persistence. Cancer cell, 40(7), 768–786.e7. [CrossRef]
  14. Bell, J. L. , Wächter, K., Mühleck, B., Pazaitis, N., Köhn, M., Lederer, M., & Hüttelmaier, S. (2013). Insulin-like growth factor 2 mRNA-binding proteins (IGF2BPs): post-transcriptional drivers of cancer progression?. Cellular and molecular life sciences : CMLS, 70(15), 2657–2675. [CrossRef]
  15. Berger, A. H. , Brooks, A. N., Wu, X., Shrestha, Y., Chouinard, C., Piccioni, F., Bagul, M., Kamburov, A., Imielinski, M., Hogstrom, L., Zhu, C., Yang, X., Pantel, S., Sakai, R., Watson, J., Kaplan, N., Campbell, J. D., Singh, S., Root, D. E., Narayan, R., … Boehm, J. S. (2016). High-throughput Phenotyping of Lung Cancer Somatic Mutations. Cancer cell, 30(2), 214–228. [CrossRef]
  16. Beroukhim, R. , Mermel, C. H., Porter, D., Wei, G., Raychaudhuri, S., Donovan, J., Barretina, J., Boehm, J. S., Dobson, J., Urashima, M., Mc Henry, K. T., Pinchback, R. M., Ligon, A. H., Cho, Y. J., Haery, L., Greulich, H., Reich, M., Winckler, W., Lawrence, M. S., Weir, B. A., … Meyerson, M. (2010). The landscape of somatic copy-number alteration across human cancers. Nature, 463(7283), 899–905. [CrossRef]
  17. Bertoli, S. , Paubelle, E., Bérard, E., Saland, E., Thomas, X., Tavitian, S., Larcher, M. V., Vergez, F., Delabesse, E., Sarry, A., Huguet, F., Larrue, C., Bosc, C., Farge, T., Sarry, J. E., Michallet, M., & Récher, C. (2019). Ferritin heavy/light chain (FTH1/FTL) expression, serum ferritin levels, and their functional as well as prognostic roles in acute myeloid leukemia. European journal of haematology, 102(2), 131–142. [CrossRef]
  18. Blondel, V.D. , Guillaume, J., Lambiotte, R., & Lefebvre, E. (2008). Fast unfolding of communities in large networks. Journal of Statistical Mechanics: Theory and Experiment, 2008, P10008. [CrossRef]
  19. Bogdan, A. R. , Miyazawa, M., Hashimoto, K., & Tsuji, Y. (2016). Regulators of Iron Homeostasis: New Players in Metabolism, Cell Death, and Disease. Trends in biochemical sciences, 41(3), 274–286. [CrossRef]
  20. Borroto-Escuela, D. O. , Brito, I., Romero-Fernandez, W., Di Palma, M., Oflijan, J., Skieterska, K., Duchou, J., Van Craenenbroeck, K., Suárez-Boomgaard, D., Rivera, A., Guidolin, D., Agnati, L. F., & Fuxe, K. (2014). The G protein-coupled receptor heterodimer network (GPCR-HetNet) and its hub components. International journal of molecular sciences, 15(5), 8570–8590. [CrossRef]
  21. Butterworth, S. , Kordova, K., Chandrasekaran, S., Thomas, K. K., Torelli, F., Lockyer, E. J., Edwards, A., Goldstone, R., Koshy, A. A., & Treeck, M. (2023). High-throughput identification of Toxoplasma gondii effector proteins that target host cell transcription. Cell host & microbe, 31(10), 1748–1762.e8. [CrossRef]
  22. Canale, M. , Andrikou, K., Priano, I., Cravero, P., Pasini, L., Urbini, M., Delmonte, A., Crinò, L., Bronte, G., & Ulivi, P. (2022). The Role of TP53 Mutations in EGFR-Mutated Non-Small-Cell Lung Cancer: Clinical Significance and Implications for Therapy. Cancers, 14(5), 1143. [CrossRef]
  23. Cancer Genome Atlas Research Network (2008). Comprehensive genomic characterization defines human glioblastoma genes and core pathways. Nature, 455(7216), 1061–1068. [CrossRef]
  24. Chen, P. H., Wu, J., Ding, C. C., Lin, C. C., Pan, S., Bossa, N., Xu, Y., Yang, W. H., Mathey-Prevot, B., & Chi, J. T. (2020). Kinome screen of ferroptosis reveals a novel role of ATM in regulating iron metabolism. Cell death and differentiation, 27(3), 1008–1022. [CrossRef]
  25. Chitra, U. , Park, T. Y., & Raphael, B. J. (2022). NetMix2: A Principled Network Propagation Algorithm for Identifying Altered Subnetworks. Journal of computational biology : a journal of computational molecular cell biology, 29(12), 1305–1323. [CrossRef]
  26. Cho, A. , Shim, J. E., Kim, E., Supek, F., Lehner, B., & Lee, I. (2016). MUFFINN: cancer gene discovery via network analysis of somatic mutation data. Genome biology, 17(1), 129. [CrossRef]
  27. Cho, H. , Berger, B., & Peng, J. (2015). Diffusion Component Analysis: Unraveling Functional Topology in Biological Networks. Research in computational molecular biology :... Annual International Conference, RECOMB... : proceedings. RECOMB (Conference : 2005- ), 9029, 62–64. [CrossRef]
  28. Chung, F. , Zhao, W. (2010). PageRank and Random Walks on Graphs. In: Katona, G.O.H., Schrijver, A., Szőnyi, T., Sági, G. (eds) Fete of Combinatorics and Computer Science. Bolyai Society Mathematical Studies, vol 20. Springer, Berlin, Heidelberg. [CrossRef]
  29. Ciriello, G., Cerami, E., Sander, C., & Schultz, N. (2012). Mutual exclusivity analysis identifies oncogenic network modules. Genome research, 22(2), 398–406. [CrossRef]
  30. Cline, M. S., Smoot, M., Cerami, E., Kuchinsky, A., Landys, N., Workman, C., Christmas, R., Avila-Campilo, I., Creech, M., Gross, B., Hanspers, K., Isserlin, R., Kelley, R., Killcoyne, S., Lotia, S., Maere, S., Morris, J., Ono, K., Pavlovic, V., Pico, A. R., … Bader, G. D. (2007). Integration of biological networks and gene expression data using Cytoscape. Nature protocols, 2(10), 2366–2382. [CrossRef]
  31. Cowen, L. , Ideker, T., Raphael, B. J., & Sharan, R. (2017). Network propagation: a universal amplifier of genetic associations. Nature reviews. Genetics, 18(9), 551–562. [CrossRef]
  32. Dao, P. , Kim, Y. A., Wojtowicz, D., Madan, S., Sharan, R., & Przytycka, T. M. (2017). BeWith: A Between-Within method to discover relationships between cancer modules via integrated analysis of mutual exclusivity, co-occurrence and functional interactions. PLoS computational biology, 13(10), e1005695. [CrossRef]
  33. Datlinger, P. , Rendeiro, A. F., Boenke, T., Senekowitsch, M., Krausgruber, T., Barreca, D., & Bock, C. (2021). Ultra-high-throughput single-cell RNA sequencing and perturbation screening with combinatorial fluidic indexing. Nature methods, 18(6), 635–642. [CrossRef]
  34. Datlinger, P. , Rendeiro, A. F., Schmidl, C., Krausgruber, T., Traxler, P., Klughammer, J., Schuster, L. C., Kuchler, A., Alpar, D., & Bock, C. (2017). Pooled CRISPR screening with single-cell transcriptome readout. Nature methods, 14(3), 297–301. [CrossRef]
  35. Davidson, E. H., Rast, J. P., Oliveri, P., Ransick, A., Calestani, C., Yuh, C. H., Minokawa, T., Amore, G., Hinman, V., Arenas-Mena, C., Otim, O., Brown, C. T., Livi, C. B., Lee, P. Y., Revilla, R., Rust, A. G., Pan, Z.j, Schilstra, M. J., Clarke, P. J., Arnone, M. I., … Bolouri, H. (2002). A genomic regulatory network for development. Science (New York, N.Y.), 295(5560), 1669–1678. [CrossRef]
  36. Delgobo, M. , Gonçalves, R. M., Delazeri, M. A., Falchetti, M., Zandoná, A., Nascimento das Neves, R., Almeida, K., Fagundes, A. C., Gelain, D. P., Fracasso, J. I., Macêdo, G. B., Priori, L., Bassani, N., Bishop, A. J. R., Forcelini, C. M., Moreira, J. C. F., & Zanotto-Filho, A. (2021). Thioredoxin reductase-1 levels are associated with NRF2 pathway activation and tumor recurrence in non-small cell lung cancer. Free radical biology & medicine, 177, 58–71. [CrossRef]
  37. Demirel, H. C. , Arici, M. K., & Tuncbag, N. (2022). Computational approaches leveraging integrated connections of multi-omic data toward clinical applications. Molecular omics, 18(1), 7–18. [CrossRef]
  38. DeNicola, G. M. , Karreth, F. A., Humpton, T. J., Gopinathan, A., Wei, C., Frese, K., Mangal, D., Yu, K. H., Yeo, C. J., Calhoun, E. S., Scrimieri, F., Winter, J. M., Hruban, R. H., Iacobuzio-Donahue, C., Kern, S. E., Blair, I. A., & Tuveson, D. A. (2011). Oncogene-induced Nrf2 transcription promotes ROS detoxification and tumorigenesis. Nature, 475(7354), 106–109. [CrossRef]
  39. De Vusser, K., Winckelmans, E., Martens, D., Lerut, E., Kuypers, D., Nawrot, T., & Naesens, M. (2020). Intrarenal arteriosclerosis and telomere attrition associate with dysregulation of the cholesterol pathway. Aging, 12(9), 7830–7847. [CrossRef]
  40. Dey, P. , Li, J., Zhang, J., Chaurasiya, S., Strom, A., Wang, H., Liao, W. T., Cavallaro, F., Denz, P., Bernard, V., Yen, E. Y., Genovese, G., Gulhati, P., Liu, J., Chakravarti, D., Deng, P., Zhang, T., Carbone, F., Chang, Q., Ying, H., … DePinho, R. A. (2020). Oncogenic KRAS-Driven Metabolic Reprogramming in Pancreatic Cancer Cells Utilizes Cytokines from the Tumor Microenvironment. Cancer discovery, 10(4), 608–625. [CrossRef]
  41. Ding, C. , Fan, X., & Wu, G. (2017). Peroxiredoxin 1 - an antioxidant enzyme in cancer. Journal of cellular and molecular medicine, 21(1), 193–202. [CrossRef]
  42. Ding, L., Getz, G., Wheeler, D. A., Mardis, E. R., McLellan, M. D., Cibulskis, K., Sougnez, C., Greulich, H., Muzny, D. M., Morgan, M. B., Fulton, L., Fulton, R. S., Zhang, Q., Wendl, M. C., Lawrence, M. S., Larson, D. E., Chen, K., Dooling, D. J., Sabo, A., Hawes, A. C., … Wilson, R. K. (2008). Somatic mutations affect key pathways in lung adenocarcinoma. Nature, 455(7216), 1069–1075. [CrossRef]
  43. Dittrich, M. T. , Klau, G. W., Rosenwald, A., Dandekar, T., & Müller, T. (2008). Identifying functional modules in protein-protein interaction networks: an integrated exact approach. Bioinformatics (Oxford, England), 24(13), i223–i231. [CrossRef]
  44. Dixit, A. , Parnas, O., Li, B., Chen, J., Fulco, C. P., Jerby-Arnon, L., Marjanovic, N. D., Dionne, D., Burks, T., Raychowdhury, R., Adamson, B., Norman, T. M., Lander, E. S., Weissman, J. S., Friedman, N., & Regev, A. (2016). Perturb-Seq: Dissecting Molecular Circuits with Scalable Single-Cell RNA Profiling of Pooled Genetic Screens. Cell, 167(7), 1853–1866.e17. [CrossRef]
  45. Doncheva, N. T. , Morris, J. H., Holze, H., Kirsch, R., Nastou, K. C., Cuesta-Astroz, Y., Rattei, T., Szklarczyk, D., von Mering, C., & Jensen, L. J. (2023). Cytoscape stringApp 2.0: Analysis and Visualization of Heterogeneous Biological Networks. Journal of proteome research, 22(2), 637–646. [CrossRef]
  46. Escala-Garcia, M. , Abraham, J., Andrulis, I. L., Anton-Culver, H., Arndt, V., Ashworth, A., Auer, P. L., Auvinen, P., Beckmann, M. W., Beesley, J., Behrens, S., Benitez, J., Bermisheva, M., Blomqvist, C., Blot, W., Bogdanova, N. V., Bojesen, S. E., Bolla, M. K., Børresen-Dale, A. L., Brauch, H., … Schmidt, M. K. (2020). A network analysis to identify mediators of germline-driven differences in breast cancer prognosis. Nature communications, 11(1), 312. [CrossRef]
  47. Galindez, G. , Sadegh, S., Baumbach, J., Kacprowski, T., & List, M. (2022). Network-based approaches for modeling disease regulation and progression. Computational and structural biotechnology journal, 21, 780–795. [CrossRef]
  48. Gligorijević, N. , Dobrijević, Z., Šunderić, M., Robajac, D., Četić, D., Penezić, A., Miljuš, G., & Nedić, O. (2022). The Insulin-like Growth Factor System and Colorectal Cancer. Life (Basel, Switzerland), 12(8), 1274. [CrossRef]
  49. Gortzak-Uzan, L. , Ignatchenko, A., Evangelou, A. I., Agochiya, M., Brown, K. A., St Onge, P., Kireeva, I., Schmitt-Ulms, G., Brown, T. J., Murphy, J., Rosen, B., Shaw, P., Jurisica, I., & Kislinger, T. (2008). A proteome resource of ovarian cancer ascites: integrated proteomic and bioinformatic analyses to identify putative biomarkers. Journal of proteome research, 7(1), 339–351. [CrossRef]
  50. Griffiths, J. I. , Chen, J., Cosgrove, P. A., O'Dea, A., Sharma, P., Ma, C., Trivedi, M., Kalinsky, K., Wisinski, K. B., O'Regan, R., Makhoul, I., Spring, L. M., Bardia, A., Adler, F. R., Cohen, A. L., Chang, J. T., Khan, Q. J., & Bild, A. H. (2021). Serial single-cell genomics reveals convergent subclonal evolution of resistance as early-stage breast cancer patients progress on endocrine plus CDK4/6 therapy. Nature cancer, 2(6), 658–671. [CrossRef]
  51. Hagberg, A.A., Schult, D.A. and Swart, P.J. (2008) Exploring network structure, dynamics, and function using NetworkX. In: Varoquaux, G., Vaught, T. and Millman, J., Eds., Proceedings of 7th Python in Science Conference (SciPy2008), 11-15. Available in https://www.osti.gov/biblio/960616.
  52. Hecker, D. , Lauber, M., Behjati Ardakani, F., Ashrafiyan, S., Manz, Q., Kersting, J., Hoffmann, M., Schulz, M. H., & List, M. (2023). Computational tools for inferring transcription factor activity. Proteomics, 23(23-24), e2200462. [CrossRef]
  53. Hein, M. Y. , & Weissman, J. S. (2022). Functional single-cell genomics of human cytomegalovirus infection. Nature biotechnology, 40(3), 391–401. [CrossRef]
  54. Holland, C. H. , Tanevski, J., Perales-Patón, J., Gleixner, J., Kumar, M. P., Mereu, E., Joughin, B. A., Stegle, O., Lauffenburger, D. A., Heyn, H., Szalai, B., & Saez-Rodriguez, J. (2020). Robustness and applicability of transcription factor and pathway analysis tools on single-cell RNA-seq data. Genome biology, 21(1), 36. [CrossRef]
  55. Horn, H. , Lawrence, M. S., Chouinard, C. R., Shrestha, Y., Hu, J. X., Worstell, E., Shea, E., Ilic, N., Kim, E., Kamburov, A., Kashani, A., Hahn, W. C., Campbell, J. D., Boehm, J. S., Getz, G., & Lage, K. (2018). NetSig: network-based discovery from cancer genomes. Nature methods, 15(1), 61–66. [CrossRef]
  56. Hotelling, H. (1992). The Generalization of Student’s Ratio. In: Kotz, S., Johnson, N.L. (eds) Breakthroughs in Statistics. Springer Series in Statistics. Springer, New York, NY. [CrossRef]
  57. Huang, X. , Zhang, H., Guo, X., Zhu, Z., Cai, H., & Kong, X. (2018). Insulin-like growth factor 2 mRNA-binding protein 1 (IGF2BP1) in cancer. Journal of hematology & oncology, 11(1), 88. [CrossRef]
  58. Ideker, T., Ozier, O., Schwikowski, B., & Siegel, A. F. (2002). Discovering regulatory and signalling circuits in molecular interaction networks. Bioinformatics (Oxford, England), 18 Suppl 1, S233–S240. [CrossRef]
  59. Jacob, L. , Neuvial, P., & Dudoit, S. (2012). More power via graph-structured tests for differential expression of gene networks. Annals of Applied Statistics, 6(2), 561–600. [CrossRef]
  60. Jaitin, D. A. , Weiner, A., Yofe, I., Lara-Astiaso, D., Keren-Shaul, H., David, E., Salame, T. M., Tanay, A., van Oudenaarden, A., & Amit, I. (2016). Dissecting Immune Circuits by Linking CRISPR-Pooled Screens with Single-Cell RNA-Seq. Cell, 167(7), 1883–1896.e15. [CrossRef]
  61. Jeay, S. , Gaulis, S., Ferretti, S., Bitter, H., Ito, M., Valat, T., Murakami, M., Ruetz, S., Guthy, D. A., Rynn, C., Jensen, M. R., Wiesmann, M., Kallen, J., Furet, P., Gessier, F., Holzer, P., Masuya, K., Würthner, J., Halilovic, E., Hofmann, F., … Graus Porta, D. (2015). A distinct p53 target gene set predicts for response to the selective p53-HDM2 inhibitor NVP-CGM097. eLife, 4, e06498. [CrossRef]
  62. Jensen, T. I., Mikkelsen, N. S., Gao, Z., Foßelteder, J., Pabst, G., Axelgaard, E., Laustsen, A., König, S., Reinisch, A., & Bak, R. O. (2021). Targeted regulation of transcription in primary cells using CRISPRa and CRISPRi. Genome research, 31(11), 2120–2130. [CrossRef]
  63. Jin, X. , Simmons, S. K., Guo, A., Shetty, A. S., Ko, M., Nguyen, L., Jokhi, V., Robinson, E., Oyler, P., Curry, N., Deangeli, G., Lodato, S., Levin, J. Z., Regev, A., Zhang, F., & Arlotta, P. (2020). In vivo Perturb-Seq reveals neuronal and glial abnormalities associated with autism risk genes. Science (New York, N.Y.), 370(6520), eaaz6063. [CrossRef]
  64. Jones, S., Zhang, X., Parsons, D. W., Lin, J. C., Leary, R. J., Angenendt, P., Mankoo, P., Carter, H., Kamiyama, H., Jimeno, A., Hong, S. M., Fu, B., Lin, M. T., Calhoun, E. S., Kamiyama, M., Walter, K., Nikolskaya, T., Nikolsky, Y., Hartigan, J., Smith, D. R., … Kinzler, K. W. (2008). Core signaling pathways in human pancreatic cancers revealed by global genomic analyses. Science (New York, N.Y.), 321(5897), 1801–1806. [CrossRef]
  65. Kanehisa, M. , Furumichi, M., Sato, Y., Kawashima, M., & Ishiguro-Watanabe, M. (2023). KEGG for taxonomy-based analysis of pathways and genomes. Nucleic acids research, 51(D1), D587–D592. [CrossRef]
  66. Keat Wei, L. , & Au, A. (2017). Chapter 12 - Computational Epigenetics. In T. O. Tollefsbol (Ed.), Handbook of Epigenetics (Second Edition) (Second Edition, pp. 167–190). [CrossRef]
  67. Kim, E. M. , Park, J. K., Hwang, S. G., Kim, W. J., Liu, Z. G., Kang, S. W., & Um, H. D. (2014). Nuclear and cytoplasmic p53 suppress cell invasion by inhibiting respiratory complex-I activity via Bcl-2 family proteins. Oncotarget, 5(18), 8452–8465. [CrossRef]
  68. Kim, P. M. , & Tidor, B. (2003). Limitations of quantitative gene regulation models: a case study. Genome research, 13(11), 2391–2395. [CrossRef]
  69. Kolberg, L. , Raudvere, U., Kuzmin, I., Adler, P., Vilo, J., & Peterson, H. (2023). g:Profiler-interoperable web service for functional enrichment analysis and gene identifier mapping (2023 update). Nucleic acids research, 51(W1), W207–W212. [CrossRef]
  70. Lebrigand, K., Magnone, V., Barbry, P., & Waldmann, R. (2020). High throughput error corrected Nanopore single cell transcriptome sequencing. Nature communications, 11(1), 4025. [CrossRef]
  71. Leiserson, M. D. , Vandin, F., Wu, H. T., Dobson, J. R., Eldridge, J. V., Thomas, J. L., Papoutsaki, A., Kim, Y., Niu, B., McLellan, M., Lawrence, M. S., Gonzalez-Perez, A., Tamborero, D., Cheng, Y., Ryslik, G. A., Lopez-Bigas, N., Getz, G., Ding, L., & Raphael, B. J. (2015). Pan-cancer network analysis identifies combinations of rare somatic mutations across pathways and protein complexes. Nature genetics, 47(2), 106–114. [CrossRef]
  72. Levi, H. , Elkon, R., & Shamir, R. (2021). DOMINO: a network-based active module identification algorithm with reduced rate of false calls. Molecular systems biology, 17(1), e9593. [CrossRef]
  73. Littman, R. , Cheng, M., Wang, N., Peng, C., & Yang, X. (2023). SCING: Inference of robust, interpretable gene regulatory networks from single cell and spatial transcriptomics. iScience, 26(7), 107124. [CrossRef]
  74. Liu, C. , Ma, Y., Zhao, J., Nussinov, R., Zhang, Y.-C., Cheng, F., & Zhang, Z.-K. (2020). Computational network biology: Data, models, and applications. Physics Reports, 846, 1–66. [CrossRef]
  75. Lotfollahi, M. , Klimovskaia Susmelj, A., De Donno, C., Hetzel, L., Ji, Y., Ibarra, I. L., Srivatsan, S. R., Naghipourfar, M., Daza, R. M., Martin, B., Shendure, J., McFaline-Figueroa, J. L., Boyeau, P., Wolf, F. A., Yakubova, N., Günnemann, S., Trapnell, C., Lopez-Paz, D., & Theis, F. J. (2023). Predicting cellular responses to complex perturbations in high-throughput screens. Molecular systems biology, 19(6), e11517. [CrossRef]
  76. Love, M. I. , Huber, W., & Anders, S. (2014). Moderated estimation of fold change and dispersion for RNA-seq data with DESeq2. Genome biology, 15(12), 550. [CrossRef]
  77. Lu, B., Chen, X. B., Ying, M. D., He, Q. J., Cao, J., & Yang, B. (2018). The Role of Ferroptosis in Cancer Development and Treatment Response. Frontiers in pharmacology, 8, 992. [CrossRef]
  78. Luck, K. , Kim, D. K., Lambourne, L., Spirohn, K., Begg, B. E., Bian, W., Brignall, R., Cafarelli, T., Campos-Laborie, F. J., Charloteaux, B., Choi, D., Coté, A. G., Daley, M., Deimling, S., Desbuleux, A., Dricot, A., Gebbia, M., Hardy, M. F., Kishore, N., Knapp, J. J., … Calderwood, M. A. (2020). A reference map of the human binary protein interactome. Nature, 580(7803), 402–408. [CrossRef]
  79. Margolin, A. A. , Nemenman, I., Basso, K., Wiggins, C., Stolovitzky, G., Dalla Favera, R., & Califano, A. (2006). ARACNE: an algorithm for the reconstruction of gene regulatory networks in a mammalian cellular context. BMC bioinformatics, 7 Suppl 1(Suppl 1), S7. [CrossRef]
  80. Martínez-Jiménez, F. , Muiños, F., Sentís, I., Deu-Pons, J., Reyes-Salazar, I., Arnedo-Pac, C., Mularoni, L., Pich, O., Bonet, J., Kranas, H., Gonzalez-Perez, A., & Lopez-Bigas, N. (2020). A compendium of mutational cancer driver genes. Nature reviews. Cancer, 20(10), 555–572. [CrossRef]
  81. McInnes, L, Healy, J. (2018). UMAP: Uniform Manifold Approximation and Projection for Dimension Reduction, ArXiv e-prints 1802.03426,. [CrossRef]
  82. Meyers, S. , Demeyer, S., & Cools, J. (2023). CRISPR screening in hematology research: from bulk to single-cell level. Journal of hematology & oncology, 16(1), 107. [CrossRef]
  83. Miyake, N. , Chikumi, H., Takata, M., Nakamoto, M., Igishi, T., & Shimizu, E. (2012). Rapamycin induces p53-independent apoptosis through the mitochondrial pathway in non-small cell lung cancer cells. Oncology reports, 28(3), 848–854. [CrossRef]
  84. Muzellec, B. , Teleńczuk, M., Cabeli, V., & Andreux, M. (2023). PyDESeq2: a python package for bulk RNA-seq differential expression analysis. Bioinformatics (Oxford, England), 39(9), btad547. [CrossRef]
  85. Otto, J. E. , Ursu, O., Wu, A. P., Winter, E. B., Cuoco, M. S., Ma, S., Qian, K., Michel, B. C., Buenrostro, J. D., Berger, B., Regev, A., & Kadoch, C. (2023). Structural and functional properties of mSWI/SNF chromatin remodeling complexes revealed through single-cell perturbation screens. Molecular cell, 83(8), 1350–1367.e7. [CrossRef]
  86. Oughtred, R. , Stark, C., Breitkreutz, B. J., Rust, J., Boucher, L., Chang, C., Kolas, N., O'Donnell, L., Leung, G., McAdam, R., Zhang, F., Dolma, S., Willems, A., Coulombe-Huntington, J., Chatr-Aryamontri, A., Dolinski, K., & Tyers, M. (2019). The BioGRID interaction database: 2019 update. Nucleic acids research, 47(D1), D529–D541. [CrossRef]
  87. Ozturk, K., & Carter, H. (2022). Predicting functional consequences of mutations using molecular interaction network features. Human genetics, 141(6), 1195–1210. [CrossRef]
  88. Ozturk, K. , Panwala, R., Sheen, J., Ford, K., Payne, N., Zhang, D. E., Hutter, S., Haferlach, T., Ideker, T., Mali, P., & Carter, H. (2023). Interface-guided phenotyping of coding variants in the transcription factor RUNX1 with SEUSS. bioRxiv : the preprint server for biology, 2023.08.03.551876. [CrossRef]
  89. Pacalin, N. M. , Steinhart, Z., Shi, Q., Belk, J. A., Dorovskyi, D., Kraft, K., Parker, K. R., Shy, B. R., Marson, A., & Chang, H. Y. (2024). Bidirectional epigenetic editing reveals hierarchies in gene regulation. Nature biotechnology, 10.1038/s41587-024-02213-3. Advance online publication. [CrossRef]
  90. Papalexi, E. , Mimitou, E. P., Butler, A. W., Foster, S., Bracken, B., Mauck, W. M., 3rd, Wessels, H. H., Hao, Y., Yeung, B. Z., Smibert, P., & Satija, R. (2021). Characterizing the molecular regulation of inhibitory immune checkpoints with multimodal single-cell screens. Nature genetics, 53(3), 322–331. [CrossRef]
  91. Parsons, D. W., Jones, S., Zhang, X., Lin, J. C., Leary, R. J., Angenendt, P., Mankoo, P., Carter, H., Siu, I. M., Gallia, G. L., Olivi, A., McLendon, R., Rasheed, B. A., Keir, S., Nikolskaya, T., Nikolsky, Y., Busam, D. A., Tekleab, H., Diaz, L. A., Jr, Hartigan, J., … Kinzler, K. W. (2008). An integrated genomic analysis of human glioblastoma multiforme. Science (New York, N.Y.), 321(5897), 1807–1812. [CrossRef]
  92. Pataky T., C. (2012). One-dimensional statistical parametric mapping in Python. Computer methods in biomechanics and biomedical engineering, 15(3), 295–301. [CrossRef]
  93. Picart-Armada, S., Barrett, S. J., Willé, D. R., Perera-Lluna, A., Gutteridge, A., & Dessailly, B. H. (2019). Benchmarking network propagation methods for disease gene identification. PLoS computational biology, 15(9), e1007276. [CrossRef]
  94. Pratapa, A. , Jalihal, A. P., Law, J. N., Bharadwaj, A., & Murali, T. M. (2020). Benchmarking algorithms for gene regulatory network inference from single-cell transcriptomic data. Nature methods, 17(2), 147–154. [CrossRef]
  95. Rath, S. , Sharma, R., Gupta, R., Ast, T., Chan, C., Durham, T. J., Goodman, R. P., Grabarek, Z., Haas, M. E., Hung, W. H. W., Joshi, P. R., Jourdain, A. A., Kim, S. H., Kotrys, A. V., Lam, S. S., McCoy, J. G., Meisel, J. D., Miranda, M., Panda, A., Patgiri, A., … Mootha, V. K. (2021). MitoCarta3.0: an updated mitochondrial proteome now with sub-organelle localization and pathway annotations. Nucleic acids research, 49(D1), D1541–D1547. [CrossRef]
  96. Razick, S. , Magklaras, G., & Donaldson, I. M. (2008). iRefIndex: a consolidated protein interaction database with provenance. BMC bioinformatics, 9, 405. [CrossRef]
  97. Replogle, J. M. , Saunders, R. A., Pogson, A. N., Hussmann, J. A., Lenail, A., Guna, A., Mascibroda, L., Wagner, E. J., Adelman, K., Lithwick-Yanai, G., Iremadze, N., Oberstrass, F., Lipson, D., Bonnar, J. L., Jost, M., Norman, T. M., & Weissman, J. S. (2022). Mapping information-rich genotype-phenotype landscapes with genome-scale Perturb-seq. Cell, 185(14), 2559–2575.e28. [CrossRef]
  98. Reyna, M. A. , Leiserson, M. D. M., & Raphael, B. J. (2018). Hierarchical HotNet: identifying hierarchies of altered subnetworks. Bioinformatics (Oxford, England), 34(17), i972–i980. [CrossRef]
  99. Ricoult, S. J. , Yecies, J. L., Ben-Sahra, I., & Manning, B. D. (2016). Oncogenic PI3K and K-Ras stimulate de novo lipid synthesis through mTORC1 and SREBP. Oncogene, 35(10), 1250–1260. [CrossRef]
  100. Robinson, M. D. , McCarthy, D. J., & Smyth, G. K. (2010). edgeR: a Bioconductor package for differential expression analysis of digital gene expression data. Bioinformatics (Oxford, England), 26(1), 139–140. [CrossRef]
  101. Safari-Alighiarloo, N., Taghizadeh, M., Rezaei-Tavirani, M., Goliaei, B., & Peyvandi, A. A. (2014). Protein-protein interaction networks (PPi) and complex diseases. Gastroenterology and hepatology from bed to bench, 7(1), 17–31. Available in https://pubmed.ncbi.nlm.nih.gov/25436094/.
  102. Saint-Antoine, M. , & Singh, A. (2023). Benchmarking Gene Regulatory Network Inference Methods on Simulated and Experimental Data. bioRxiv : the preprint server for biology, 2023.05.12.540581. [CrossRef]
  103. Saki, K., Mansouri, V., Abdi, S., Fathi, M., Razzaghi, Z., & Haghazali, M. (2021). Assessment of common and differentially expressed proteins between diabetes mellitus and fatty liver disease: a network analysis. Gastroenterology and hepatology from bed to bench, 14(Suppl1), S94–S101. Available in https://pubmed.ncbi.nlm.nih.gov/35154608/.
  104. Schnitzler, G. R. , Kang, H., Fang, S., Angom, R. S., Lee-Kim, V. S., Ma, X. R., Zhou, R., Zeng, T., Guo, K., Taylor, M. S., Vellarikkal, S. K., Barry, A. E., Sias-Garcia, O., Bloemendal, A., Munson, G., Guckelberger, P., Nguyen, T. H., Bergman, D. T., Hinshaw, S., Cheng, N., … Engreitz, J. M. (2024). Convergence of coronary artery disease genes onto endothelial cell programs. Nature, 626(8000), 799–807. [CrossRef]
  105. Schraivogel, D. , Gschwind, A. R., Milbank, J. H., Leonce, D. R., Jakob, P., Mathur, L., Korbel, J. O., Merten, C. A., Velten, L., & Steinmetz, L. M. (2020). Targeted Perturb-seq enables genome-scale genetic screens in single cells. Nature methods, 17(6), 629–635. [CrossRef]
  106. Sedgwick, P. (2014). Spearman's rank correlation coefficient. BMJ (Clinical research ed.), 349, g7327. [CrossRef]
  107. Shahamatdar, S. , He, M. X., Reyna, M. A., Gusev, A., AlDubayan, S. H., Van Allen, E. M., & Ramachandran, S. (2020). Germline Features Associated with Immune Infiltration in Solid Tumors. Cell reports, 30(9), 2900–2908.e4. [CrossRef]
  108. Shannon, P. , Markiel, A., Ozier, O., Baliga, N. S., Wang, J. T., Ramage, D., Amin, N., Schwikowski, B., & Ideker, T. (2003). Cytoscape: a software environment for integrated models of biomolecular interaction networks. Genome research, 13(11), 2498–2504. [CrossRef]
  109. Shrestha, R. , Hodzic, E., Sauerwald, T., Dao, P., Wang, K., Yeung, J., Anderson, S., Vandin, F., Haffari, G., Collins, C. C., & Sahinalp, S. C. (2017). HIT'nDRIVE: patient-specific multidriver gene prioritization for precision oncology. Genome research, 27(9), 1573–1588. [CrossRef]
  110. Sillars-Hardebol, A. H. , Carvalho, B., Beliën, J. A., de Wit, M., Delis-van Diemen, P. M., Tijssen, M., van de Wiel, M. A., Pontén, F., Fijneman, R. J., & Meijer, G. A. (2012). BCL2L1 has a functional role in colorectal cancer and its protein expression is associated with chromosome 20q gain. The Journal of pathology, 226(3), 442–450. [CrossRef]
  111. Soranzo, N. , Bianconi, G., & Altafini, C. (2007). Comparing association network algorithms for reverse engineering of large-scale gene regulatory networks: synthetic versus real data. Bioinformatics (Oxford, England), 23(13), 1640–1647. [CrossRef]
  112. Spisak, S. , Chen, D., Likasitwatanakul, P., Doan, P., Li, Z., Bala, P., Vizkeleti, L., Tisza, V., De Silva, P., Giannakis, M., Wolpin, B., Qi, J., & Sethi, N. S. (2024). Identifying regulators of aberrant stem cell and differentiation activity in colorectal cancer using a dual endogenous reporter system. Nature communications, 15(1), 2230. [CrossRef]
  113. Sunshine, S. , Puschnik, A. S., Replogle, J. M., Laurie, M. T., Liu, J., Zha, B. S., Nuñez, J. K., Byrum, J. R., McMorrow, A. H., Frieman, M. B., Winkler, J., Qiu, X., Rosenberg, O. S., Leonetti, M. D., Ye, C. J., Weissman, J. S., DeRisi, J. L., & Hein, M. Y. (2023). Systematic functional interrogation of SARS-CoV-2 host factors using Perturb-seq. Nature communications, 14(1), 6245. [CrossRef]
  114. Swaney, D. L. , Ramms, D. J., Wang, Z., Park, J., Goto, Y., Soucheray, M., Bhola, N., Kim, K., Zheng, F., Zeng, Y., McGregor, M., Herrington, K. A., O'Keefe, R., Jin, N., VanLandingham, N. K., Foussard, H., Von Dollen, J., Bouhaddou, M., Jimenez-Morales, D., Obernier, K., … Krogan, N. J. (2021). A protein network map of head and neck cancer reveals PIK3CA mutant drug sensitivity. Science (New York, N.Y.), 374(6563), eabf2911. [CrossRef]
  115. Szklarczyk, D. , Gable, A. L., Lyon, D., Junge, A., Wyder, S., Huerta-Cepas, J., Simonovic, M., Doncheva, N. T., Morris, J. H., Bork, P., Jensen, L. J., & Mering, C. V. (2019). STRING v11: protein-protein association networks with increased coverage, supporting functional discovery in genome-wide experimental datasets. Nucleic acids research, 47(D1), D607–D613. [CrossRef]
  116. Tian, R. , Gachechiladze, M. A., Ludwig, C. H., Laurie, M. T., Hong, J. Y., Nathaniel, D., Prabhu, A. V., Fernandopulle, M. S., Patel, R., Abshari, M., Ward, M. E., & Kampmann, M. (2019). CRISPR Interference-Based Platform for Multimodal Genetic Screens in Human iPSC-Derived Neurons. Neuron, 104(2), 239–255.e12. [CrossRef]
  117. Traag, V. A. , Waltman, L., & van Eck, N. J. (2019). From Louvain to Leiden: guaranteeing well-connected communities. Scientific reports, 9(1), 5233. [CrossRef]
  118. Ursu, O. , Neal, J. T., Shea, E., Thakore, P. I., Jerby-Arnon, L., Nguyen, L., Dionne, D., Diaz, C., Bauman, J., Mosaad, M. M., Fagre, C., Lo, A., McSharry, M., Giacomelli, A. O., Ly, S. H., Rozenblatt-Rosen, O., Hahn, W. C., Aguirre, A. J., Berger, A. H., Regev, A., … Boehm, J. S. (2022). Massively parallel phenotyping of coding variants in cancer with Perturb-seq. Nature biotechnology, 40(6), 896–905. [CrossRef]
  119. Vandin, F., Clay, P., Upfal, E., & Raphael, B. J. (2012). Discovery of mutated subnetworks associated with clinical data in cancer. Pacific Symposium on Biocomputing. Pacific Symposium on Biocomputing, 55–66. [CrossRef]
  120. Vanunu, O., Magger, O., Ruppin, E., Shlomi, T., & Sharan, R. (2010). Associating genes and protein complexes with disease via network propagation. PLoS computational biology, 6(1), e1000641. [CrossRef]
  121. Vaske, C. J. , Benz, S. C., Sanborn, J. Z., Earl, D., Szeto, C., Zhu, J., Haussler, D., & Stuart, J. M. (2010). Inference of patient-specific pathway activities from multi-dimensional cancer genomics data using PARADIGM. Bioinformatics (Oxford, England), 26(12), i237–i245. [CrossRef]
  122. Vastrik, I. , D'Eustachio, P., Schmidt, E., Gopinath, G., Croft, D., de Bono, B., Gillespie, M., Jassal, B., Lewis, S., Matthews, L., Wu, G., Birney, E., & Stein, L. (2007). Reactome: a knowledge base of biologic pathways and processes. Genome biology, 8(3), R39. [CrossRef]
  123. Vogelstein, B., & Kinzler, K. W. (2004). Cancer genes and the pathways they control. Nature medicine, 10(8), 789–799. [CrossRef]
  124. Walhout A., J. (2006). Unraveling transcription regulatory networks by protein-DNA and protein-protein interaction mapping. Genome research, 16(12), 1445–1454. [CrossRef]
  125. Wessels, H. H. , Méndez-Mancilla, A., Hao, Y., Papalexi, E., Mauck, W. M., 3rd, Lu, L., Morris, J. A., Mimitou, E. P., Smibert, P., Sanjana, N. E., & Satija, R. (2023). Efficient combinatorial targeting of RNA transcripts in single cells with Cas13 RNA Perturb-seq. Nature methods, 20(1), 86–94. [CrossRef]
  126. Wolf, F. A. , Angerer, P., & Theis, F. J. (2018). SCANPY: large-scale single-cell gene expression data analysis. Genome biology, 19(1), 15. [CrossRef]
  127. Wood, L. D., Parsons, D. W., Jones, S., Lin, J., Sjöblom, T., Leary, R. J., Shen, D., Boca, S. M., Barber, T., Ptak, J., Silliman, N., Szabo, S., Dezso, Z., Ustyanksky, V., Nikolskaya, T., Nikolsky, Y., Karchin, R., Wilson, P. A., Kaminker, J. S., Zhang, Z., … Vogelstein, B. (2007). The genomic landscapes of human breast and colorectal cancers. Science (New York, N.Y.), 318(5853), 1108–1113. [CrossRef]
  128. Wu, D. , Poddar, A., Ninou, E., Hwang, E., Cole, M. A., Liu, S. J., Horlbeck, M. A., Chen, J., Replogle, J. M., Carosso, G. A., Eng, N. W. L., Chang, J., Shen, Y., Weissman, J. S., & Lim, D. A. (2022). Dual genome-wide coding and lncRNA screens in neural induction of induced pluripotent stem cells. Cell genomics, 2(11), 100177. [CrossRef]
  129. Wu, G., Feng, X., & Stein, L. (2010). A human functional protein interaction network and its application to cancer data analysis. Genome biology, 11(5), R53. [CrossRef]
  130. Yachie-Kinoshita, A. , & Kaizu, K. (2019). Cell Modeling and Simulation. In S. Ranganathan, M. Gribskov, K. Nakai, & C. Schönbach (Eds.), Encyclopedia of Bioinformatics and Computational Biology (pp. 864–873). [CrossRef]
  131. Yang, L., Chen, R., Goodison, S., & Sun, Y. (2021). An efficient and effective method to identify significantly perturbed subnetworks in cancer. Nature computational science, 1(1), 79–88. [CrossRef]
  132. Yang, L. , Chen, R., Melendy, T., Goodison, S., & Sun, Y. (2023). Identifying Significantly Perturbed Subnetworks in Cancer Using Multiple Protein-Protein Interaction Networks. Cancers, 15(16), 4090. [CrossRef]
  133. Yao, D. , Binan, L., Bezney, J., Simonton, B., Freedman, J., Frangieh, C. J., Dey, K., Geiger-Schuller, K., Eraslan, B., Gusev, A., Regev, A., & Cleary, B. (2023). Scalable genetic screening for regulatory circuits using compressed Perturb-seq. Nature biotechnology, 10.1038/s41587-023-01964-9. Advance online publication. [CrossRef]
  134. Yehia, A. M. , Elsakka, E. G. E., Abulsoud, A. I., Abdelmaksoud, N. M., Elshafei, A., Elkhawaga, S. Y., Ismail, A., Mokhtar, M. M., El-Mahdy, H. A., Hegazy, M., Elballal, M. S., Mohammed, O. A., El-Husseiny, H. M., Midan, H. M., El-Dakroury, W. A., Zewail, M. B., Abdel Mageed, S. S., Moustafa, Y. M., Mostafa, R. M., Elkady, M. A., … Doghish, A. S. (2023). Decoding the role of miRNAs in multiple myeloma pathogenesis: A focus on signaling pathways. Pathology, research and practice, 248, 154715. [CrossRef]
  135. Yepes, S. , Tucker, M. A., Koka, H., Xiao, Y., Jones, K., Vogt, A., Burdette, L., Luo, W., Zhu, B., Hutchinson, A., Yeager, M., Hicks, B., Freedman, N. D., Chanock, S. J., Goldstein, A. M., & Yang, X. R. (2020). Using whole-exome sequencing and protein interaction networks to prioritize candidate genes for germline cutaneous melanoma susceptibility. Scientific reports, 10(1), 17198. [CrossRef]
  136. Yu, X. , Abbas-Aghababazadeh, F., Chen, Y. A., & Fridley, B. L. (2021). Statistical and Bioinformatics Analysis of Data from Bulk and Single-Cell RNA Sequencing Experiments. Methods in molecular biology (Clifton, N.J.), 2194, 143–175. [CrossRef]
  137. Zeng, Y. , Shi, Y., Xu, L., Zeng, Y., Cui, X., Wang, Y., Yang, N., Zhou, F., & Zhou, Y. (2021). Prognostic Value and Related Regulatory Networks of MRPL15 in Non-Small-Cell Lung Cancer. Frontiers in oncology, 11, 656172. [CrossRef]
  138. Zhao, Q. , Lin, X., & Wang, G. (2022). Targeting SREBP-1-Mediated Lipogenesis as Potential Strategies for Cancer. Frontiers in oncology, 12, 952371. [CrossRef]
  139. Zheng, G. X. , Terry, J. M., Belgrader, P., Ryvkin, P., Bent, Z. W., Wilson, R., Ziraldo, S. B., Wheeler, T. D., McDermott, G. P., Zhu, J., Gregory, M. T., Shuga, J., Montesclaros, L., Underwood, J. G., Masquelier, D. A., Nishimura, S. Y., Schnall-Levin, M., Wyatt, P. W., Hindson, C. M., Bharadwaj, R., … Bielas, J. H. (2017). Massively parallel digital transcriptional profiling of single cells. Nature communications, 8, 14049. [CrossRef]
  140. Zheng, X. , Wu, B., Liu, Y., Simmons, S. K., Kim, K., Clarke, G. S., Ashiq, A., Park, J., Wang, Z., Tong, L., Wang, Q., Xu, X., Levin, J. Z., & Jin, X. (2023). Massively parallel in vivo Perturb-seq reveals cell type-specific transcriptional networks in cortical development. bioRxiv : the preprint server for biology, 2023.09.18.558077. [CrossRef]
  141. Zhou, Y. H., Xia, K., & Wright, F. A. (2011). A powerful and flexible approach to the analysis of RNA sequence count data. Bioinformatics Oxford, 27(19), 2672–2678. [CrossRef]
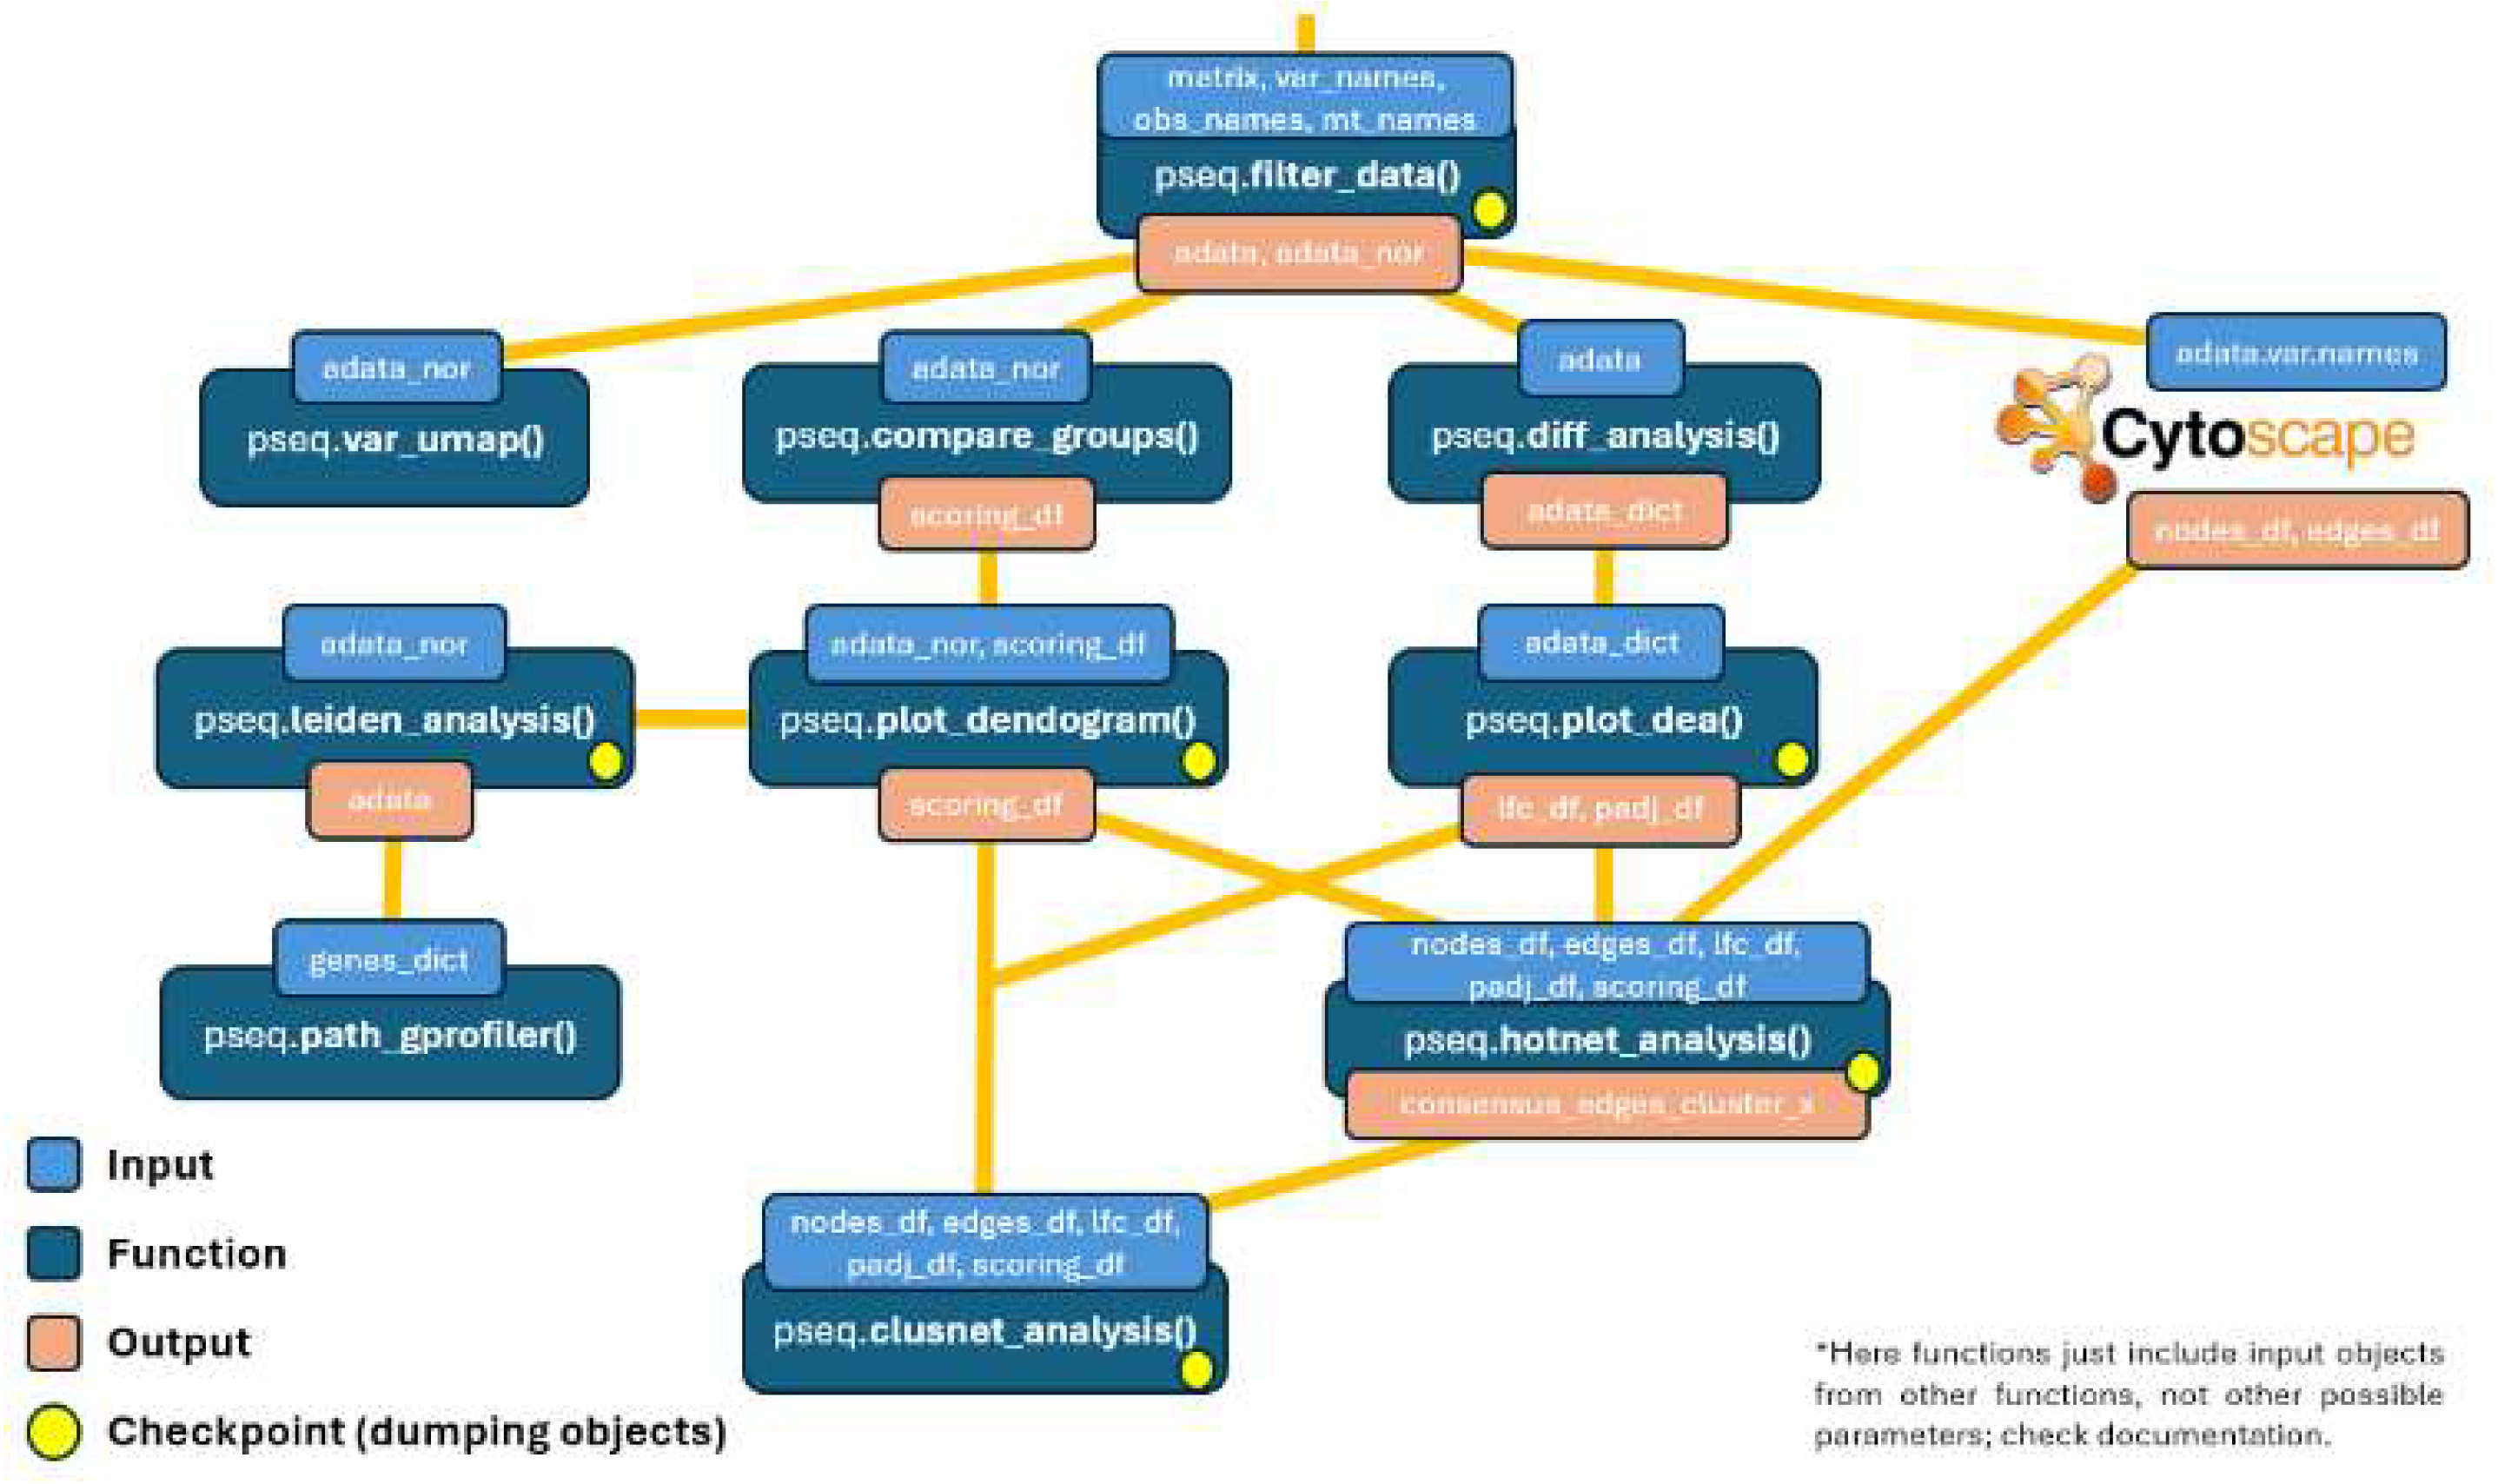
Figure 1. An overview of the purposed pipeline.
Preprints 138066 g001
Figure 2. Number of genes with non-zero counts against the total number of reads in each cell coloured by the percentage of total mitochondrial genes for KRAS (top) and TP53 (bottom) experiments.
Preprints 138066 g002
Figure 3. PCs variance ratio from KRAS (top) and TP53 (bottom) experiments.
Preprints 138066 g003
Figure 7. Top 20 of highest expressed genes in KRAS (top) and TP53 (bottom) experiments.
Preprints 138066 g007
Disclaimer/Publisher’s Note: The statements, opinions and data contained in all publications are solely those of the individual author(s) and contributor(s) and not of MDPI and/or the editor(s). MDPI and/or the editor(s) disclaim responsibility for any injury to people or property resulting from any ideas, methods, instructions or products referred to in the content.
Copyright: This open access article is published under a Creative Commons CC BY 4.0 license, which permit the free download, distribution, and reuse, provided that the author and preprint are cited in any reuse.
Alerts
Prerpints.org logo

Preprints.org is a free preprint server supported by MDPI in Basel, Switzerland.

Subscribe

© 2025 MDPI (Basel, Switzerland) unless otherwise stated