1. Introduction
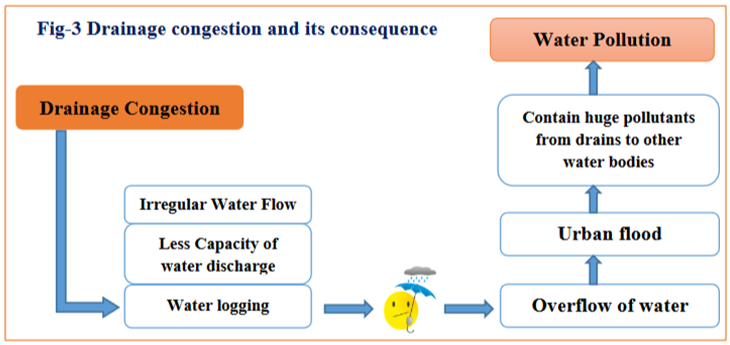
Chittagong is Bangladesh’s second largest and busiest maritime port city. It is situated on the bank of the river Karnaphuly in the south-east part of the country (Saha, 2020). In order to remove excess water volume, drainage is a necessary component of many environments, including urban, rural, forest and agricultural (Parkinson, 2003). According to CDA Existing Plan-1995, there are twelve drainage areas in Chattogram city that discharges the water from the city to the river, Karnaphuly. There are also three types of drainage system that exists in the Chattogram city as, primary drainage system or Primary Khals, secondary drainage system and Tertiary Drainage system (CDA, 1995). The drainage congestion is the most susceptible aspect of Chattogram’ s drainage system. Every year during the rainy season, the roadways and low-lying regions in Chattogram City are submerged, causing water logging and urban flood which make life difficult for the residents. Urban flooding and water logging thus emerged as one of the port city's main issues. Water logging occurs frequently in the city's low-lying sections after normal rainfall. The inhabitants of Chittagong's low-lying neighborhoods suffer as a result (Kamal, 2003). Urban drainage includes the extraction of unanticipated water from urban environments, such as storm water, sewerage, and gray and household wastewater (McInerney & Magar, 2014) On the other hand, road drainage, which is intended to divert water into ditches beside roadways, accounts for the majority of drainage systems in urban regions. These drainage systems are prone to erosion, which can lead to issues with sedimentation in adjacent bodies of water (Pidwirny, 2006). Water Pollution is one of the most significant phenomena to concern about in present world. According to a recent study, the intensity of the city's rainfall has also grown. For example, 1.5 hours of intense rainy weather can produce 4 million cubic meters of runoff, which the city's poor drainage system is sadly not equipped to handle (Hoque, Nandi, & Palit, 2012). Drainage congestion is a matter to concern about as water pollution is much more related to this. Drainage congestion causes the overflow of water which later gets connected with the other water bodies by the urban flood (Kamal, 2003). Bangladesh, one of the most populous countries in the third world, is suffering from severe water pollution and scarcity, just like the rest of the world. Even though 97% of people have access to water, there is always doubt about the quality of the water (WHO, Sustainable Development & Healthy Environment, 2018). A drinking water's microbiological and several crucial physiochemical tests, like pH, BOD, COD, Color, temperature, TDS, and metal concentration, can determine the water's quality. Because of the implications for public health, the detection of bacterial contamination and its physicochemical characteristics has garnered significant attention globally (WHO, Guidelines for drinking water quality, 1993). Over 28 billion disease episodes occur each year in poor nations due to ten primary water-borne diseases; in these countries, diarrheal diseases are the leading cause of death, particularly in newborns, and they are also highly endemic (Classen, Schmidt, Rabie, Roberts, & Cairncross, 2007). One of Bangladesh's main cities in development is Chittagong. Beyond the fact that Chittagong City Corporation provides them with a portion of purified water, the majority of people use groundwater as their primary source for residential requirements. Merely 1% of the land can be used for transportation, garbage disposal, agricultural, drinking, and industrial consumption (Ahmed, et al., 2013; Rahman, 2002). This research aims to determine the drainage congestion as the causal factor of urban flood and urban flood is the cause of water pollution. This research also aims to assess the impacts of water pollution on the urban neighborhood of the port city, Chattogram.
2. Methodology
2.1. Study Area
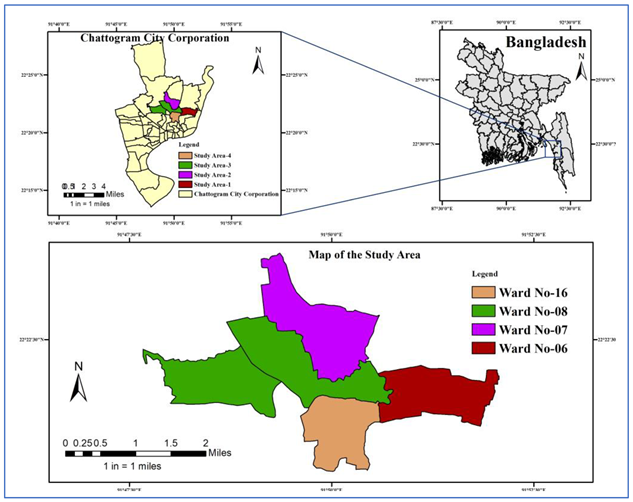
Geographically Chattogram city is located on the bank of the river Karnaphuly and Bay-of-Bengal. At present Chattogram city stuck with the drainage congestion problem which makes the irregular discharge of water. Urban flood is a common occurrence in this port city. Water pollution and its impacts are beggar description. There are 41 wards in this port city. Among them Ward No-06 (Eaast-Sholoshohor), Ward No-07 (West-Sholoshohor), Ward No-08 (Sholokbohor) & Ward No-16 (Chawk Bazar) have been selected as the study area to meet up the aims and objectives of this present research.
| Map-1 Study Area Map |
 |
2.2. Methodology of the Study
This research comprises of both primary and secondary data sources. The primary data sources are: 200 Questionnaire survey, 4 Focus Group Discussions (FGDs), 4 Expert Opinion Survey, 8 Water samples. The secondary data sources are: Previous published and unpublished articles, journals, reports, web sites etc.
2.3. Sampling Design
2.3.1. Questionnaire Survey Design
Table 1.
Questionnaire Survey design.
Table 1.
Questionnaire Survey design.
| Ward No. |
Ward Name |
No. of Respondents |
| Ward No-06 |
East-Sholoshohor |
50 |
| Ward No-07 |
West-Sholoshohor |
50 |
| Ward No-08 |
Sholokbohor |
50 |
| Ward No-16 |
Chawkbazar |
50 |
| Total |
|
200 |
2.3.2. Focus Group Discussion Design
Table 2.
Focus group discussion design.
Table 2.
Focus group discussion design.
| Ward No. |
Ward Name |
No. of FGD |
| Ward No-06 |
East-Sholoshohor |
1 |
| Ward No-07 |
West-Sholoshohor |
1 |
| Ward No-08 |
Sholokbohor |
1 |
| Ward No-16 |
Chawkbazar |
1 |
2.3.3. Expert Opinion Survey Design
- (1)
WASA Official,
- (2)
Local Ward Councilor office respondent,
- (3)
CDA official Respondent
- (4)
Local teacher, educated persons, civil societies etc.
2.3.4. Water Sample Collection
Table 3.
Water sample collection design.
Table 3.
Water sample collection design.
| Sample No. |
Location Name |
Ward Name/No. |
Location |
| 1 |
2 No gate-Drain |
Sholokbohor/08 |
Latitude: 22.3673 N
Longitude: 91.8230 E
|
| 2 |
Mayor Goli- Drain |
Sholokbohor/08 |
Latitude: 22.3687 N
Longitude: 91.8219 E
|
| 3 |
Hamzarbug |
West-Sholoshohor/07 |
Latitude: 22.3825 N
Longitude: 91.8273 E
|
| 4 |
Ameen Jute Mill |
West-Sholoshohor/07 |
Latitude: 22.3845 N
Longitude: 91.8262 E
|
| 5 |
Baraipara |
East-Sholoshohor/06 |
Latitude: 22.3652 N
Longitude: 91.8538 E
|
| 6 |
Bahaddarhat |
East-Sholoshohor/06 |
Latitude: 22.3625 N
Longitude: 91.8566 E
|
| 7 |
Chaktai Khal |
Chawkbazar/16 |
Latitude: 22.3567 N
Longitude: 91.8406 E
|
| 8 |
Chaktai Khal |
Chawkbazar/16 |
Latitude: 22.3560 N
Longitude: 91.8401 E
|
In total 8 water samples were tested at two different labs (Environmental Lab, Department of Geography and Environmental Studies, Chattogram, Bangladesh & Chemical Lab, Department of Pharmaceutical Sciences, North South University, Dhaka, Bangladesh.
3. Result and Analysis
3.1. Main Sources of Water Pollution
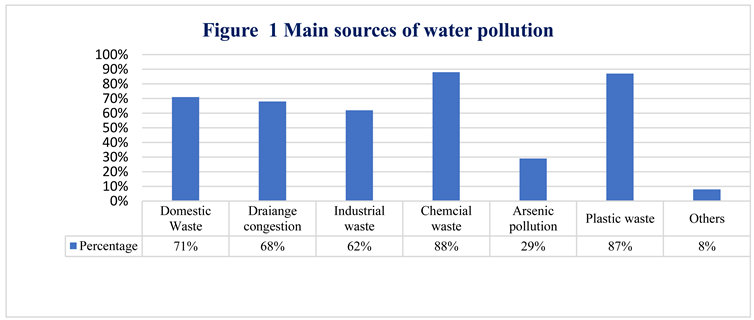
In Figure 1 it is seen that; there are some sources of water pollution addressed by the respondents. Among them, domestic waste, drainage congestion, industrial waste, chemical waste, arsenic pollution, plastic waste and some other reasons addressed by the respondents.
3.2. Effects of Drainage Congestion
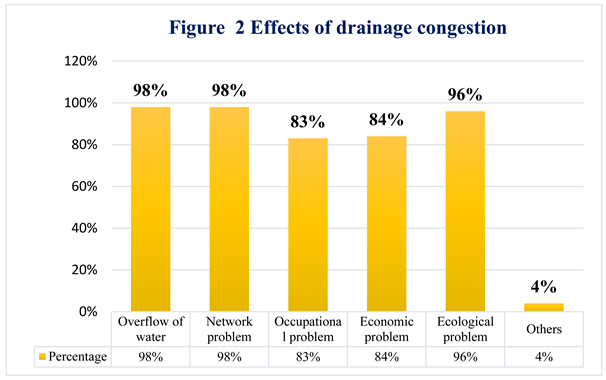
Findings highlight that overflow of water is one of the causes of drainage congestion (Figure 2). A few hours of rain results in urban flood for the overflow of water. This also ends in some other problems like, network problem, occupational problem, economic problem, ecological problem and some other problems.
Urban flood is the common occurrence in the study area. This is because the existing drainage system is not well enough for the water discharge. The drainage system is linked with the industries, households, hotels, market waste disposals etc. So the water of the drains must be polluted. If there is normal flow of water in the drains, the water is less polluted in comparison to the drains of regular water flow. Thus the pollutants from the drainage system is carried by the urban flood to the other water bodies of the study area i.e. Karnaphuly river, Khals, Lakes, Ponds etc. Therefore, the people of Chattogram City Corporation (CCC) directly or indirectly fall a victim to the water pollution.
3.3. Water Quality Parameters of the Drainage Water
3.3.1. PH Measurement
Table 4.
PH Value of the water samples.
Table 4.
PH Value of the water samples.
| Sample No. |
Area |
PH Value |
| 01 |
2No gate |
3.6 |
| 02 |
Mayor Goli |
2.8 |
| 03 |
Hamzarbug |
2.6 |
| 04 |
Amin Jute Mills |
2.9 |
| 05 |
Bahaddarhat |
2.8 |
| 06 |
Bahaddarhat |
2.7 |
| 07 |
Chawkbazar |
2.5 |
| 08 |
Arakan Road |
2.7 |
It is seen that (Table-1); the PH value of the water sample ranges from 2.5 to 3.6. The optimum value of PH of the normal water is: 6.5 to 8.5
A substance's acidity or alkalinity is determined using the PH scale. The range of the scale is 0–14. Seven is the neutral PH. A PH of 7 or more is basic, whereas a pH of less than 7 is acidic. The PH of pure water is 7.0, making it neutral. Water and chemicals can combine to produce a mixture that is partially alkaline or partially acidic. Ammonia and washing detergents are alkaline, whereas vinegar and lemon juice are acidic. So, it can be said the water of the all the samples were acidic. Acidic water is not suitable for the living beings of the water bodies. It creates damages to the other water bodies if it somehow gets mixed with the other water bodies.
3.3.2. BOD Measurement
Table-5.
BOD (Biological Oxygen Demand) of the water sample.
Table-5.
BOD (Biological Oxygen Demand) of the water sample.
| Sample No. |
Area |
BOD (mg/L) |
| 01 |
2No. gate |
8.10 |
| 02 |
Mayor Goli |
10.20 |
| 03 |
Hamzarbug |
15.80 |
| 04 |
Amin Jute Mills |
15.20 |
| 05 |
Bahaddarhat |
12.10 |
| 06 |
Bahaddarhat |
6.20 |
| 07 |
Chawkbazar |
8.50 |
| 08 |
Arakan Road |
7.30 |
Table 6.
Normal BOD (mg/L) level in water.
Table 6.
Normal BOD (mg/L) level in water.
| BOD (mg/L) |
Water Quality |
| 1-2 |
Very Good: There will not be much organic matter present in the water supply. |
| 3-5 |
Fair: Moderately clean. |
| 6-9 |
Poor: Somewhat polluted, usually indicates that organic matter present and microorganisms are decomposing that waste |
| 10 or more |
Very Poor: Very polluted, contains organic matter |
By analyzing the BOD level of the water samples it can be concluded that, 4 out of 8 samples’ quality were very poor. It means those were very polluted and contains organic matter. Rest of the water samples quality was poor. They are somewhat polluted and organic matters also present in that and microorganisms were also decomposed. The water discharges into the Karnaphuly river and the other waterbodies that surrounded the Chattogram city. Due to this, those water bodies are at high risk of being polluted as the water contains very poor BOD level which contains huge amount of organic matters. Moreover, when water inundation occurs in the city the water from the drains also get mixed with the water bodies of the surroundings in the study area. Thus those water bodies are at risk. Besides, organic matters that are contained by the drains may also create health risk and vulnerabilities to the urban people and to the urban environment. They may cause Acid Rain as the chemical organic matters may get in touch with the rain through the atmosphere.
3.3.3. COD Measurement
Table 7.
COD (Chemical Oxygen Demand) of the water sample.
Table 7.
COD (Chemical Oxygen Demand) of the water sample.
| Sample No. |
Area |
COD (mg/L) |
| 01 |
2No gate |
|
| 02 |
Mayor Goli |
|
| 03 |
Hamzarbug |
|
| 04 |
Amin Jute Mills |
|
| 05 |
Bahaddarhat |
|
| 06 |
Bahaddarhat |
|
| 07 |
Chawkbazar |
|
| 08 |
Arakan Road |
|
3.3.4. DO Measurement
Table 8.
DO value of the water sample.
Table 8.
DO value of the water sample.
| Sample No. |
Area |
DO (mg/L) |
| 01 |
2No gate |
0.1 |
| 02 |
Mayor Goli |
0.2 |
| 03 |
Hamzarbug |
0.6 |
| 04 |
Amin Jute Mills |
0.3 |
| 05 |
Bahaddarhat |
0.2 |
| 06 |
Bahaddarhat |
0.4 |
| 07 |
Chawkbazar |
0.3 |
| 08 |
Arakan Road |
0.1 |
Both aquatic vegetation and the atmosphere provide oxygen to bodies of water. In comparison to motionless water found in ponds or lakes, running water, like that found in swift-moving streams, dissolves more oxygen. DO (Dissolved Oxygen) test of the water sample were done to understand the dissolved oxygen level in the water. To live in this world, the animal and organisms need oxygen to live on. The water that can’t contain the optimum value of the Dissolved Oxygen level is not considered as the suitable place for the water animals like fish, some other organisms.
According to Atlas Scientific, the normal value of DO in the water is Above 6.5 – 8 mg/L.
But the water samples that were collected from the congested part of the drains showing that the DO level is too much poor. Here the DO ranges from 0.1 to 0.6 which is very small in amount. It is the indicator that the water of the congested drain is going through a much crisis. They are not suitable enough for the fish, different kinds of zoo planktons, Phytoplankton and other living organisms. The final destination of those polluted water is the river or the lake or the canals that are existed in the study area. Now the thinking may arise how much vulnerable they are for those water bodies. This may create the organisms and fish resources of those areas die.
3.3.5 Temperature Measurement
Table 9.
Temperature of the water sample.
Table 9.
Temperature of the water sample.
| Sample no |
Area
|
Temp. (Degree
Celsius) |
| 01 |
2No gate |
30 deg. |
| 02 |
Mayor Goli |
29 deg. |
| 03 |
Hamzarbug |
31 deg. |
| 04 |
Amin Jute Mills |
30 deg. |
| 05 |
Bahaddarhat |
32 deg. |
| 06 |
Bahaddarhat |
28 deg. |
| 07 |
Chawkbazar |
31 deg. |
| 08 |
Arakan Road |
deg. |
Lower temperature water should have higher Percentage of DO and more mg/L of dissolved oxygen. Warmer, contaminated waters, however, will have lower mg/L and percentage of DO. The temperature of the water sample ranges from 28-32 degree Celsius. The value of the normal water temperature is around 25 degrees Celsius. The more the water temperature the higher the possibility of BOD and the lower the possibility of DO.
3.3.6. Water Quality Parameter Tested on Field Observation
Table 10.
Water quality parameter tested on field observation.
Table 10.
Water quality parameter tested on field observation.
Sample No.
|
Area
|
Turbidity |
Odor |
Color |
Visible orga-
nisms |
Mosquito
germs |
| 01 |
2No gate |
Yes |
Yes |
Dark Black |
Yes |
Yes
|
| 02 |
Mayor Goli |
Yes |
Yes |
Dark Grey |
No |
Yes
|
| 03 |
Hamzarbug |
Yes |
Yes |
Dark Black |
No |
Yes |
| 04 |
Amin Jute Mills |
Yes |
Yes |
Dark Black |
No |
Yes |
| 05 |
Bahaddarhat |
Yes |
Yes |
Dark grey |
No |
No |
| 06 |
Bahaddarhat |
Yes |
Yes |
Dark Grey |
Yes |
No |
| 07 |
Chawkbazar |
Yes |
Yes |
Dark Black |
No |
Yes |
| 08 |
Arakan Road |
Yes |
Yes |
Dark Black |
Yes |
No |
The above testes were based on the field observation during the field survey. From the table it is seen that the water is not clean at all. There were odors in all the places from where water samples that were collected from the study area. The odor was so high that they were totally unbearable for the human being. This indicates the households near the drain side are at highest risk of it. The color of the water samples are darkest grey / Darkest black. This indicates the color of the polluted water. Visible organisms were found in three samples among the eight samples. Mosquito germs were found in the five areas during the water sample collection. The field survey also found that, the higher the drainage congestion the higher the possibility of mosquito growing. Recently Chattogram facing a great crisis due to Dengue, Chikonguniya, Malaria etc. A huge number of patient are seen get themselves admitted in to the hospitals by analyzing the literature survey.
As a whole it can be said that, the water of the drainage system of the Chattogram city is the another cause of water pollution that creates vulnerability and impacts on the urban neighborhood like urban infrastructure, urban aesthetic beauties, urban environment, urban water bodies, human health etc. specially the water bodies and the people who live besides the drainage area is at high risk of the possible impacts of this. This is the vital problem and vulnerabilities of the urban neighborhood. If there were natural water flow in the drains, the water quality parameter may not be so much poor.
3.4. Statistical correlation of Drainage Congestion with Water Pollution
Table 11.
Correlation of drainage congestion with water pollution.
Table 11.
Correlation of drainage congestion with water pollution.
Independent variable |
Dependent Variable
(Reasons of Water Pollution) |
Compound
value of ‘r’ |
|
| Comment |
|---|
Causes of Drainage Congestion |
Domestic waste |
0.250* |
Low positive significant
correlation |
| Industrial Waste |
0.533** |
Moderate positive significant Correlation |
| Plastic waste |
0.273** |
Low positive significant Correlation |
| Chemical waste |
0.433** |
Moderate positive significant Correlation |
| Arsenic Pollution |
0.114 NS
|
Very low positive Correlation but not statistically significant |
| Human Induced waste |
0.756** |
High positive significant correlation
|
| Overflow of drainage water |
0.533** |
Moderate positive Significant correlation |
3.5. Drainage Congestion and Its Consequence
3.6. Impacts of Water Pollution in the Study Area
3.6.1. Water Related Disease Faced by the Respondents
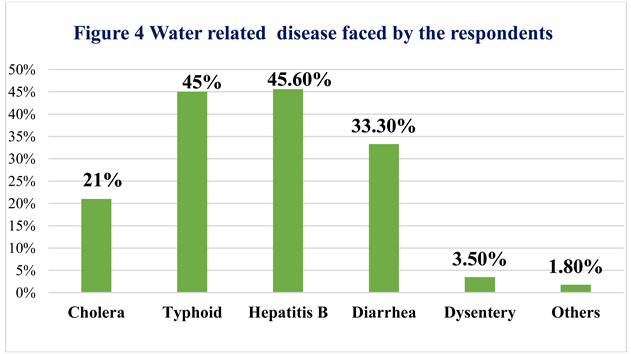
In Figure 4 some water related diseases faced by the respondents are: Cholera (21%), Typhoid (45%), Hepatitis B (45.6%), Diarrhea (33.3%), Dysentery (3.5%) and Others like Cancer, Premature death, Arsenic affect etc. (1.8%).
3.6.2. Impacts of Water Pollution on Human Health
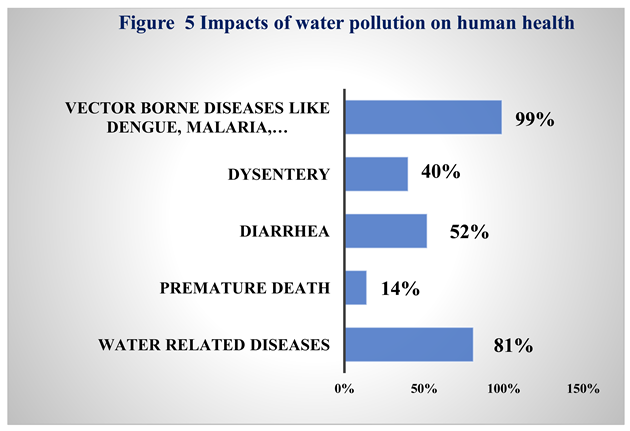
In Figure 5 it is found that; water pollution has he impacts on human health mentioned by the respondents. Some impacts that were investigated are: Vector borne diseases like Dengue, Chikonguniya, Malaria (99%), Dysentery (40%), Diarrhea (52%), Premature death (14%), other water related diseases like Jaundice, typhoid (81%).
3.6.3. Impacts of Water Pollution on Urban Neighborhood
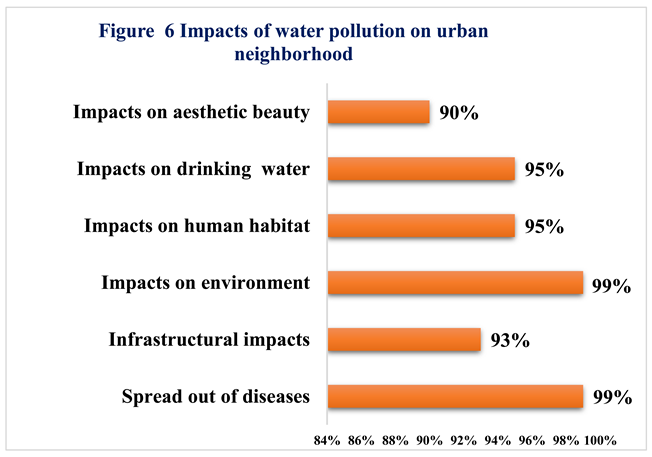
Water pollution results in some of the impacts on urban neighborhood. In Figure 6, it is seen that there are some impacts mentioned by the respondents due to water pollution. The impacts on urban neighborhood are as impacts on aesthetic beauty (90%), impacts on drinking water (95%), impacts on human habitat (95 %), impacts on environment of the surrounding (99%), infrastructural impacts (93%), Spread out of diseases (99%).
3.6.4. Impacts of Water Pollution on the Environment
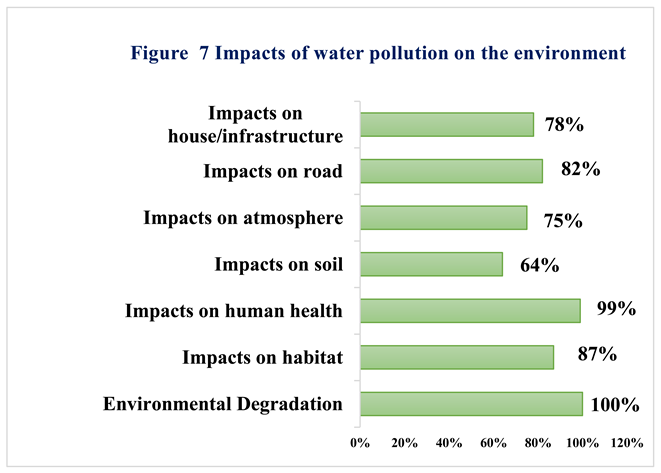
Water pollution plays a negative role in the environment of the urban area. It can be said (Figure 7) that; there are some of the impacts on environment by the water pollution. The impacts are: impacts on house/infrastructure (78%), impacts on road (82%), impacts on atmosphere (75%), impacts on soil (64%), impacts on human health (99%), impacts on habitat for both human and wildlife (87%), environmental degradation (100%). So the impacts of water pollution are seen in both natural and social environments in the study area.
4. Recommendations
The port city of Bangladesh is well known for its thriving ecosystem, dynamic culture and creative economy. But its water bodies are seriously threatened by the industrialization and urbanization that is happening too quickly. At present there are some challenges that need to be identified to mitigate the problem like drainage water logging, sewage problem, solid waste, industrial discharge, climate change effect, heavy rainfall etc. the problem must be mitigated soon. To mitigate the problem there need some conservation initiative. They are: legal protection of the water bodies, stop plastic throwing in the drains, industrial regulations, water bodies culture, proper education to the residents of the city, community engagement and collaborative approaches are mostly needed. To consume the impacts of water pollution industrial effluent control, public awareness, regulation and enforcement of environmental law, collaborative approach, community participation, investment in more research is crying need for the port city Chattogram, Bangladesh. To effectively solve Chattogram city’s water pollution, implementing the mentioned things would involve coordinated efforts from a variety of stakeholders, including government agencies, non-government agencies, business and the general public.
5. Conclusions
Water pollution is the most vital issue in the aspect of Chattogram city. Drainage congestion is one of the causes of water pollution as the drainage congestion make the overflow of water. The overflow of water makes urban flood which carries number pollutants from the drainage water to the other water bodies lies in the study area. The water samples of the drainage water highlights that the water are much more polluted than it should be. Drainage water must be polluted, but if there was normal flow of water, the pollutants would be less in amount. Congested drains create more pollutants as it helps the pollutants to get together. It also helps to grow the mosquito germs which make the vector borne diseases in the study area. Statistical analysis also found the significant correlation between drainage congestion and water pollution. However, water pollution came up with some impacts on the study area. It creates diseases in human body. It also impacts on the urban natural and social environment and urban neighborhood of the study area. It’s time people should understand the fact and to be aware about the water pollution.
References
- Ahmed, W., Yusuf, R., Hasan, I., Goonetilleke, A., Toze, S., & Gradener, T. (2013). Fecal indicators and bacterial pathogens in bottled water from Dhaka, Bangladesh. Braz J Microbiol, 44(1), 97-103. [CrossRef]
- CDA. (1995). CDA Master Plan-1995. Chattogram: Chattogram Development Authority.
- Classen, T., Schmidt, W., Rabie, T., Roberts, I., & Cairncross, S. (2007). Interventions to improve water quality for preventing diarrhoea: systematic review and meta-analysis. BMJ, 334, 759-782. [CrossRef]
- Hoque, M., Nandi, K., & Palit, S. (2012). Overflowing of Mirza Khal and Its Effect on Road and Drainage System. Chattogram, Bangladesh: B.Sc. ENg. Thesis Civil Engineering Department, CUET.
- Kamal, A. (2003). Attitude and opinion of the profile regarding water supply: A casae study of slum dwellers, Water and Sanitation for Cities. Dhaka, Bangladesh: Bangladesh Institute of Planners ( BIP) & Center for Urban Studies (CUS).
- McInerney, B., & Magar, R. (2014). Urban Environmental Challenges and Poverty alleviation. Bangladesh.
- Parkinson, J. (2003). Drainage and storm water management strategies for low-income urban communities. Environment and Urbanization, 15(2), 115-126. [CrossRef]
- Pidwirny, M. (2006). Causes of Climate Change, Fundamentals of Physical Geography (2nd ed.). Retrieved from https://www.physicalgeography.net/fundamentals/7y.html.
- Rahman, M. (2002). Arsenic and Contamination of Drinking-water in Bangladesh: A Public- health Perspective. Center for Health and Population Research, 20(3), 193-197.
- Saha, N. (2020). Retrieved May 24, 2024, from https://www.adpc.net/igo/contents/iPrepare/ipreparenews_id.asp?ipid=236#:~:text=One%20of%20the%20smallest%20yet,travel%20from%20place%20to%20place.
- WHO. (1993). Guidelines for drinking water quality. Geneva: WHO.
- WHO. (2018). Sustainable Development & Healthy Environment. Geneva: World Health Organization . Retrieved from http://www.whoban.org/sust_dev_mental_env.html.
|
Disclaimer/Publisher’s Note: The statements, opinions and data contained in all publications are solely those of the individual author(s) and contributor(s) and not of MDPI and/or the editor(s). MDPI and/or the editor(s) disclaim responsibility for any injury to people or property resulting from any ideas, methods, instructions or products referred to in the content. |
© 2024 by the authors. Licensee MDPI, Basel, Switzerland. This article is an open access article distributed under the terms and conditions of the Creative Commons Attribution (CC BY) license (http://creativecommons.org/licenses/by/4.0/).


