Preprint
Article

Automated Vision-Based Crack Detection for Reinforced Concrete Bridges Using Matlab Algorithms

Submitted:

31 October 2024

Posted:

01 November 2024

You are already at the latest version

Abstract
Measuring the crack width is one of the important defect properties to estimate the bridge’s health. Cracks may develop into catastrophic failures with expensive consequences for both human life and the economy if they are ignored and are allowed to get worse. Nevertheless, the traditional tools to measure crack width are suffering from time-consuming and some limitations related to subjectivity and uncertainty. In view of this, this paper presented a model based on image processing techniques to measure crack width. The proposed technique relies on developing a model that is used for crack detection to be able to measure their maximum width. Two types of datasets are used in the presented models, and these images were taken from two different types of cameras. The precision and recall for the crack detection achieved 98.32% and 99.43% respectively. Accordingly, 87 concrete crack widths are measured by traditional tools and compared with model results. The comparison shows that the minimum crack width measured by the model is 0.5 mm and the mean absolute error is 0.046 mm. The model is compared with previous studies and demonstrated its effectiveness in measuring crack width. The results show the adequacy of the crack measurement method for safety bridge assessments and to avoid working in hazardous conditions for a long time.
Keywords: 
Subject: 
Engineering  -   Civil Engineering

1. Introduction

Systems supporting civil infrastructure gradually deteriorate over time. They may be divided into four categories: roads, bridges, structures, and water and sewer networks. The bridge classifications can be categorized into steel, reinforced concrete, and pre-stressed concrete with supporting and structural elements. The bridge elements, such as deck, abutment, foundation, expansion joints, railings, bearings, etc., might all be damaged. The fundamental difficulty in bridge inspection programs is the variety of elements that influence RC bridge degradation and cause various problems. Delamination, scaling, spalling, efflorescence, and cracking are various types of bridge degradation that may cause fatigue deterioration. Determining the kind, quantity, breadth, and length of flaws on bridges reveals the early stages of deterioration and avoids these kinds of incidents. Detecting and evaluating the degree of defect is an important process that may affect the structure’s capacity in its current stage or in the future [1]. The main form of assessing the physical and functional conditions of civil infrastructure is the manual visual inspection. The main advantage of visual inspection is that it includes an extensive evaluation of the entire bridge and is not restricted to the detection or assessment of a particular type of damage or a component of the bridge. Its cost amount is determined based on the characteristics of the bridge and the level of inspection details and frequency. The main elements of the visual inspection costs are traffic management and labor [2]. This technique of inspection still mainly relies on human eye observation. It is required that an expert maintenance engineer be on the field to decide whether the maintenance condition is required. It needs a lot of preparation on both inspection planning and expertized identification. Actually, the number of specialists in the field is inadequate compared to the number of bridges to be inspected. Thus, it is suffering from many drawbacks that have a potential threat to personal safety and caused a lot of accidents.
However, current inspection practices depend on visual inspection and basic tools, such as hammer sounding and chain drag, to determine subsurface defects such as delamination [3]. These techniques suffer from some limitations, such as time-consuming, subjectivity, uncertainty, and the inability to detect all subsurface defects [4]. Therefore, numerous authorities tend to use computer vision-based methods in the inspection process to evaluate concrete surface structures. This technology improves the inspection process and speed and eliminates the need for traffic disruption or total lane closure. It is not only used for defect detection but also to evaluate their severity [5]. Recently, image acquisition applications are used by expert assistance and cameras to capture the image of bridge components and then send it to the server of the Department of Highways in order for the expert to verify in the office. Nevertheless, image acquisition applications still need human observation to check images one by one [6]. It is worth mentioning that crack is one of the concrete defects that requires attention to understand their reasons and the remedial action that should be taken against it. It is a laborious process to manually identify, characterize, and record the cracks due to their enormous and wide variety. The development and propagation of cracks may tend to reduce the effective loading area and eventually lead to the failure of the concrete or other structures. Cracks allow dangerous and corrosive substances to enter a structure, especially one made of concrete, which compromises the structural integrity and aesthetics of the component. Crack detection is not sufficient in the inspection process. It requires extracting crack properties such as length, width, and angles. The information about cracks can be utilized to diagnose problems and choose the best rehabilitation strategy to fix damaged buildings and avoid catastrophic failure [7,40,41,42,43]. ACI 201.1R [8] expressed the severity of cracking as fine, medium, and wide, based on crack width, which is shown in Table 1.
The manual measurement is a common approach that is conducted by a technician with measuring tools such as crack comparator cards, gauges, and callipers. This comparator card is designed as a ruler marked in inch and millimetre with a range of graded lines, and each line is specified as the width of the crack as shown in Figure 1a. The limitation about those measuring is low accuracy and difficulties in recording data [10]. A digital pachymeter (digital calliper) with higher accuracy is another instrument that requires knowledge by the technician to choose and insert the metallic blade in the crack opening. Another problem that can be raised is the uncertainty associated with the handling of the instrument by a technician. These factors required higher repetitive measures to gain more accuracy [11]. Battery microscope magnification is designed for measuring concrete crack width range (4 mm) in (0.02 mm) divisions as shown in Figure 1b. It is built into an adjustable light source powered by batteries. It can also be found as an electric microscopic, but it’s more difficult to use than the battery one. These instruments not only suffered from inconsistent measurement but also required the staff member to stay in hazardous condition during the period of inspection [12].
Image binarization, which is commonly used for text recognition and medical images, is highly suited for usage in crack detection and width measurement. This is due to the similarities between texts and cracks in terms of their linear and curved features [7]. Digital imaging techniques combined with image processing methods are widely recommended for both crack detection and extraction tier properties because they are nondestructive methods.
There is a growing interest in the field of crack identification and characterization of concrete surface distresses, as evidenced by the number of recently published articles in this area. Methods based on visual inspection assist transportation organizations in identifying shortcomings and making decisions that are more accurate and objective [13]. However, without eliminating various types of noise from images that are associated with diverse sources, such as concrete blebs, stains, uneven contrast, and shading, an image-based technique cannot be useful [14,15]. Performing various image processing methods to enhance image inspection makes it simpler to spot problems in inspection images. Many approaches have been applied for crack automated detection and width measurement. Noh et al. [16] suggested utilizing fuzzy C-means clustering in segmentation to find 0.3 mm fractures in images. In this approach, a series of processes including segmentation, morphology, and filtering is used to improve the visibility of fracture features and eliminate background noise. First, fuzzy C-means is used for image segmentation. Second, morphological dilation is used to reveal fracture characteristics, after which manually calibrated masks for filtering are made. Finally, related noise locations are located and removed using a Grassfire search. In comparison to existing edge detection-based approaches, it is emphasized that the developed method achieves greater recall and precision. Another automated approach is developed by Jain and Sharma [14] to determine the severity of cracks. The pre-processing of the images includes contrast boosting and histogram equalization. The K-means clustering technique is then used to segment the data. The images are segmented using this approach using various K-means clustering parameters, and it is discovered that a random initialization with Euclidean distance works best. Finally, a crack detection technique using fuzzy inference is utilized to provide a risk score that displays the proportion of dangerous cracks. Zhao et al. [17] presented an inspection technique for bridge maintenance. The first part was built to determine the type of bridges, e.g., suspension, cable-stayed bridges, by using AlexNet. Second, a Faster-RCNN is trained to classify the bridge components (e.g., tower, deck). Finally, GoogLeNet was used for concrete crack detection. Nevertheless, this proposed method is suffering from a lack of discussions of the connections between the three previous components. A platform for the automatic identification and severity evaluation of spalling in reinforced concrete bridges is introduced by Abdelkader et al. [18] The first module dealt with the preparation of images. The second module is created to automatically identify spalling. With the use of a single-objective particle swarm optimization (PSO) model that tries to increase the image Tsallis entropy, spalling images are segmented using bi-level thresholding. This module produces a single threshold T that divides the image pixels into the spalling (foreground) and surface classes (background). The third module is the feature extraction process, which separates the collected images into high-pass and low-pass filters using Daubechie’s discrete wavelet transform. The automatic assessment of spalling severities is the final module. With reference to the artificial neural network, the suggested produced spalling evaluation model (ANN-PSO) decreases the prediction errors by percentages ranging from 71.43% to 76.65%. Additionally, in contrast to the created prediction model, the Otsu algorithm is unable to discern spalling pixels in the image. Li and others [19] used the fully convolutional network and a Naive Bayes data fusion (NB-FCN) for crack detection, followed by a skeletonization process to extract crack properties: width and length, with a mean error less than 0.03 mm for width and 92.8% for length accuracy. Ong et al. [20] produce a hybrid method combining the shortest method and the orthogonal projection method to measure pavement crack width with irregular boundaries or high curvature. In comparison to the shortest technique and the orthogonal projection method, the hybrid method yields the highest correlation coefficient (0.956) and the least average absolute deviation (1.769). Cardellicchio et al. [21] introduce an approach through machine learning for defect detection of reinforced concrete bridge elements. The study divided the defects into seven groups: (1) corroded/oxidized steel reinforcement, (2) cracks, (3) deteriorated concrete, (4) honeycombs, (5) moisture spots, (6) pavement degradation, and (7) shrinkage cracks. The neural network was trained to classify single defect vs. all defect. InceptionV3 and ResNet50V2 as classic models, and DenseNet121, MobileNetV3, and NASNetMobile were used for network training. However, the approach required to increase and improved the data quality and enhance the hyper parameter optimization. Yu [22] Introduced a proposed model for crack detection based on a Generative Adversarial Network (GAN). The accuracy result was 24.78%, and the recall rate was 19.64%, which was lower than other deep learning types. de León et al. [23] presented a methodology for crack segmentation based on the theory of minimal path selection combined with a region-based approach obtained through the segmentation of texture features extracted using Gabor filters. An equalization of brightness and shadows is a pre-processing step to improve the detection of local minima. To improve the coverage of the cracks, these local minimal are constrained by a minimum distance between adjacent points. Subsequently, two areas are identified using a region-based segmentation technique, which establishes the threshold values for rejection. Lastly, a geometrical thresholding step is presented, which enables the exclusion of small, isolated cracks and rounded areas. Bae & An [24] established a computer vision-based crack quantification algorithm incorporated with the deep semantic segmentation network. The crack width is calculated as the range value depending on the statistical confidence interval with a normal distribution of the maximum width. Two cases of crack area were examined to find the maximum width based on the average widths measured at each spotted point along the crack area for each image. The average difference for each case is, respectively, -41.43% and -11.14%. The model fixed the type of structuring element used in morphological operations, which cannot be generalized because of the different patterns of cracks in several images. Kao et al. [25] used YOLOv4 deep learning, which is the integration of the development architecture YOLOv3 for the crack detection process. The images were taken by UAV from distance 1 m. Canny and morphological edge detectors were applied to extract the crack edges. Then, planar markers and measurement feature points were used to measure the crack width in images with an accuracy of 92%. Tran et al. [26] applied You Only Look Once version 7 (YOLOv7), a deep learning network, which outperformed both Faster RCNN and RetinaNet with both ResNet50 and ResNet101 in speed and accuracy. Then, the method is used to measure the crack length and width to achieve an average accuracy of 92.38% and 91%, respectively.
Most of the previous studies concentrated on a deep learning model that required computational cost because it needed huge data for training and special resources with large memory. Additionally, the common nature of deep learning is the “black box” that keeps users blind and prevents them from changing any parameters. Also, most studies focused on defect detection, and less of them concentrated on retrieving their properties for safety assessment. Nevertheless, the previous studies have measured crack width in pixels units, and there are still significant limitations with this unit of measurement. This is because it is more accurate to measure the severity of concrete crack width in millimeters rather than pixels; hence, knowing the width of cracks in pixels does not yield useful information for field applications. Therefore, this paper focusses on retrieving crack width measures in millimeters that are associated with estimating condition assessment for concrete structures. The proposed method was applied to different concrete surfaces for crack detection and could be used as a supportive tool for authorities in the inspection process [27]. As a result, the presented model aims to develop a crack detection model that can detect cracks on various concrete surfaces for measuring the crack width of reinforced concrete bridges. It is built based on image processing techniques that include pre-processing, thresholding, and several morphological operations and is finalized with applying Euclidean distance to measure the crack width. The main characteristics of the proposed model are the transparency of workflow and saving time in crack width measuring. The model required low costs compared with deep learning models that require huge amounts of data for learning and high computational costs. The significance of this model is related to its fast and reliability in measuring the crack width to assess the bridge condition rating. In addition, the presented model overcomes the shortcoming related to human errors caused by applying traditional tools and time-consuming for the inspection process.The research methodology, results, discussions, and limitations are presented in the following sections, followed by the conclusion.

2. Materials and Methods

2.1. Overview of Developed Method

The presented method is focusing on measuring crack widths for reinforced concrete bridges and compares it with actual results measured by a battery microscope in the field. Once the model detected the crack, the maximum width are measured in millimeters The current method is based on image processing techniques, which can be an alternative low-cost method for structure inspection and assessment. An overview of the developed methodology is shown in the flowchart in Figure 1.

2.2. Experimental Setup and Data Acquisition

The presented model that is built based on image processing techniques is tested on 540 images from two different datasets: 240 images from different parts of reinforced concrete bridge and 300 random images of bridge decks from the existing dataset SDNET 2018 . The 240 images of reinforced concrete bridge are taken according to accessibility to reach the defected area of the bridge and also the permissions taken from the authorities for taking images for the bridge. The iPhone 7 Plus is used to take images, which has dual 12-megapixel wide-angle and telephoto cameras. The wide angle for the primary camera is 56 mm lens and ƒ/1.8 aperture, while the secondary camera is telephoto with a 28 mm lens and ƒ/2.8 aperture. The digital camera resolution is 3024 x 4032 pixels. The crack in the screen should be vertical during shooting. They are labelled manually into 139 cracked images and 101 unckraked. The size of the crack width ranges from 0.5 mm to 4 mm. The 300 random images of the bridge deck from SDNET 2018 were taken by a 16 MP Nikon camera, and the image resolution was 4068 × 3456 px. They are divided into 180 cracked images and 120 unckracked.The range of their crack size is from 0.06 mm (narrow) to 25 mm (wide), [28].

2.3. Determining Ground Truth and Labelling Images

Cracks from the original pictures were manually recognized, and the region of interest was traced by hand using MATLAB (R2021a). Curves were evolved towards object boundaries using the active contour function. A ground truth was then created by masking the region of interest with a white layer and placing it on a black background. This procedure was then carried out for every image in the dataset. Since the tracing is done by hand, pixel by pixel, the user-defined ground truths offer a dependable approximation of the real crack position and size, even though they are not 100% exact. The images of bridge deck from the dataset of SDNET2018 were previously labelled as cracks or uncracks [28]. The other images taken from a reinforced concrete bridge by mobile phone are labelled manually through visual inspection.

2.4. Algorithm Development

2.4.1. Image Pre-Processing

Image preprocessing is one of the important steps to enhance the images properties and to extract their features with high quality. There are several types of image preprocessing such as resizing, rotation, corrected illumination, enhancement contrast, filtering, and others [27]. In the current study, the cracked images of the bridge are taken by an iPhone 7 pulse with 3024×4032 pixels. The image sizes are modified to not more than half their sizes to reduce the running time of the model without impacting its performance.

Bilateral Filter Pre-Processing

A bilateral filter is a combination for both smoothing and denoising, although it’s preserving edges. Geometric closeness and photometric similarity of neighbouring pixels are considered during the filtering process. The bilateral filter technique depends on replacing each pixel intensity with a weighted average of intensity values from neighbouring pixels [27,29,30].

Subtraction Processing Pre-Processing

The non-uniform illumination is one of the challenge conditions that may affect the outdoor picked images. Therefore, this step is important to remove shadows and to uniform the illuminations on the images. The local thresholds Niblack and Sauvola are applied to extract cracks from the background because they are effective in an image that has a complex background [27,31].

2.4.2. Image Thresholding

Image thresholding is a method adopted to distinguish an object from the image background. This technique is used widely for object tracking, pattern recognition, computer vision, object detection, and others. This method converts the grey image into a binary image that can be described as follows: White pixels referred to logic 1, while black pixels relate to logic 0. The technique relied on choosing the proper threshold (T) of the crack grey image to determine which pixel relates to the background and which others relate to the crack area. The grey image is binarized due to the function g(x,y) after the operation, as shown in Equation (1) [12].
g x , y = 1             f x , y > T 0             f x , y T
where g(x,y) is the threshold image and f(x,y) is the grey level pixel. The fastest and simplest segmentation is the global thresholding, which is associated with the equalisation of the histogram to select a single value of the threshold for the greyscale image. Local threshold is another type where the value of threshold is assigned to each pixel to determine if it refers to foreground or background. Otsu and valley-emphasis methods are another type of segmentation to determine threshold value [32].

2.4.3. Morphological Operation

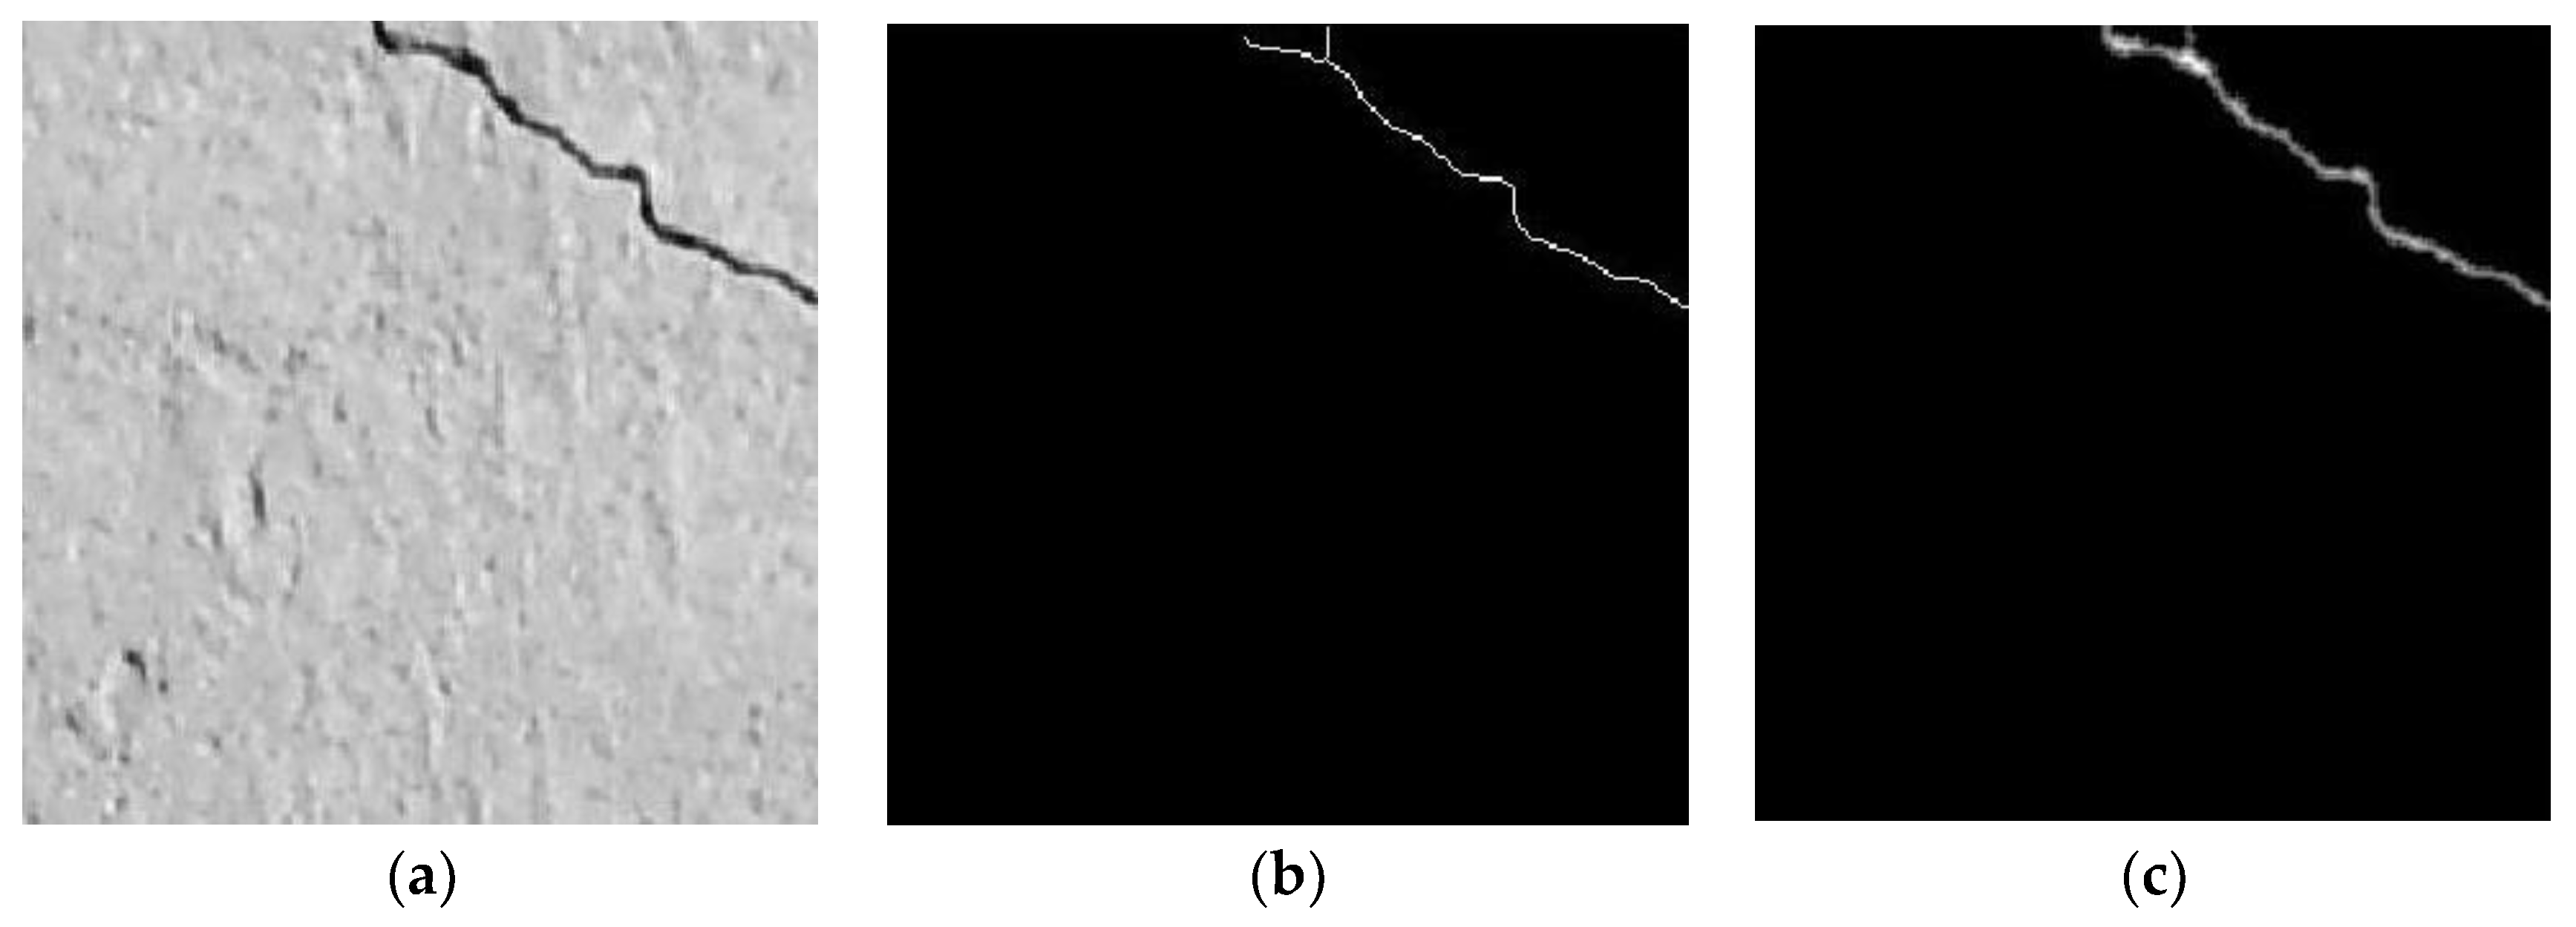
Morphology is an important tool to extract different features to describe and characterize an entire image. The image’s pixels are adjusted in this operation according to the values of their neighbouring pixels. The common examples of morphological process are dilation, erosion, opening, closing, and filling [27]. Additionally, skeletonizing (also known as thinning) is a type of morphological operation. The process of “skeletonizing” cracks, transforming pixel-by-pixel cracks to create representations that are only one pixel wide, makes the geometry of the crack easily visible without changing its structure. Generally, skeletonization process extracts the crack boundaries that can be described as linear connectivity between adjacent pixels as shown in Figure 3b [33].

2.4.4. Euclidean Distance Transform

The distance transform is applied to a binary image to measure the distance from the featured pixel to non-featured pixels. Measuring the distance values between featured and non-featured pixels is computed based on its neighbours. There are four types of algorithms to measure transform distance, which are: the Manhattan or City Block Distance, the Chessboard Distance, and the Euclidean Distance. In this research, the Euclidean distance transformation is applied, which is a straight line distance between two points. Assume that two points (X1, Y1) and (X2, Y2) are given, then the distance is defined as Equation 2 and shown in Figure 3c [34].
D = ( X 1 X 2 ) ( X 1 X 2 ) + ( Y 1 Y 2 ) ( Y 1 Y 2 )

2.5. Implementation Crack Width Measurement Model

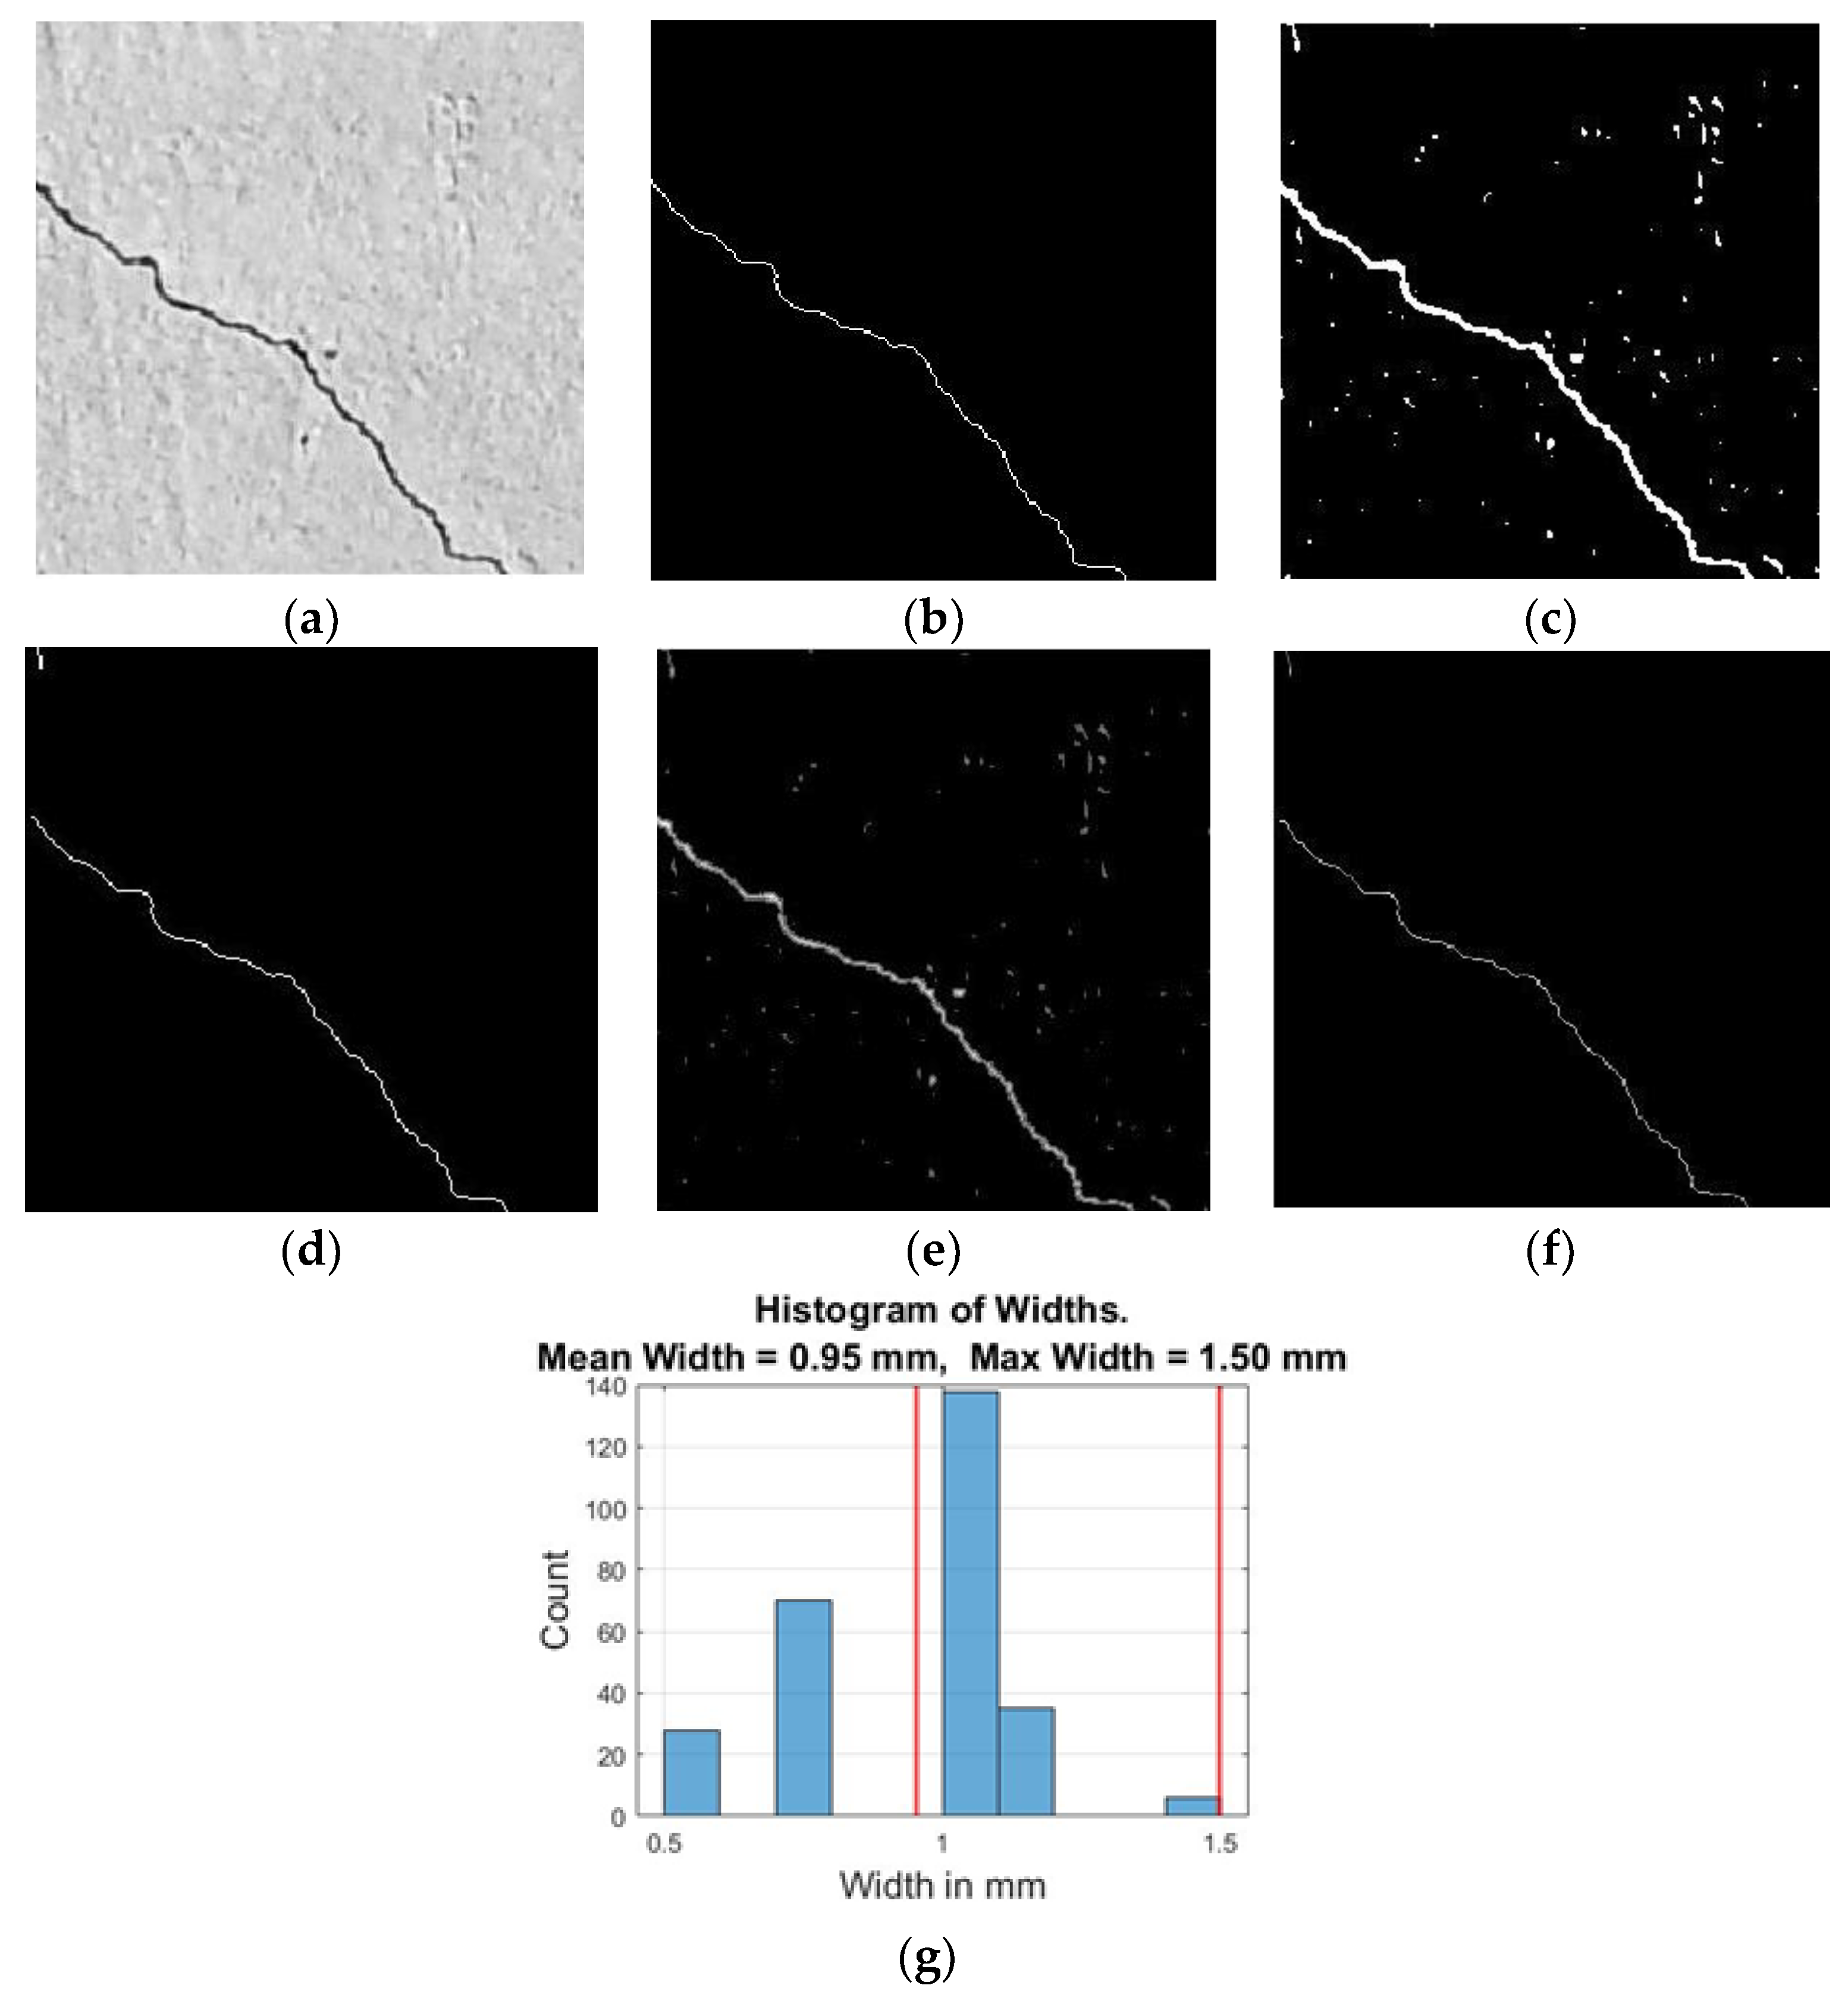
The proposed method was implemented by MATLAB (R2021a) on a desktop PC (Intel(R) Core(TM) i7-8550U CPU @ 1.80GHz 1.99GHz, 64-bit operating system). The first step in the presented model is to convert the RGB image into greyscale. The threshold (T) value is determined manually based on the trial-and-error method [35]. Determination of the threshold depends on the histogram to select the best value of (T) for the grey-level image to enhance the crack area. The bilateral filter will be applied to the input image if it is full of noise and dents to remove them. Then, the Sauvola threshold is applied to the output greyscale image to binarize it. The bridge, which is a type of morphological function, is carried out on unconnected pixels. A pixel is given a value of 1 rather than 0 if it has two unconnected nonzero neighbors [27]. Then, the fill holes function is used, followed by the skeletonize function to allow only those crack boundaries to be extracted that physically reflect the linear connectivity between neighboring pixels. Then apply the regionprops function, which can be defined as a more cleaning process that casts out areas with a less certain number of pixels. Subsequently, apply the Euclidean distance to get the crack width. Multiply the skeleton image by the result from the Euclidean distance function to get an image where the only pixels in the image are along the skeleton and their value is the radius. Multiply the radius image by 2 to get the diameter image (crack width), as shown in Figure 4.

3. Results

3.1. Crack Detection

The crack detection approach performance was measured in the previous work [27]. However, measuring the crack width must be followed the detection process. Thus, the performance measure precision and recall for cracked and uncracked samples for detection step is applied. If the model accurately identified the crack based on the experimental results, it is recognized as true positive (TP). Similarly, a sample is deemed to be a true negative (TN) if it is uncracked (N) and the model accurately detects it. A false negative (FN) is indicated if the model failed to identify crack pixels. Lastly, the pixels may considered as false positive (FP) if the model wrongly identifies a crack pixel. As a result, some of assessment factors for binary classification are given below [36].
The precision is the percentage of accurately identified positive samples from the detected results, as shown in Equation (3)
P r e c i s i o n = T P T P + F P
Recall is defined as the percentage of correctly identified pixels over all existing positive samples, as shown in Equation (4).
R e c a l l   o r   s e n s i t i v e = T P T P + F N
Specificity is the percentage of correctly identified negative samples from the detected results, as shown in Equation (5).
S p e c i f i c i t y = T N T N + F P
The accuracy is defined as the ratio of successfully categorised images to the total number of images, introducing the overall efficiency of the classifier as shown by Equation (6).
A c c u r a c y = T P + T N T P + T N + F N + F P
F-Score is a combination measure of both precision and recall, as shown in Equation (7).
F s c o r e = 1 + α 2 P r e c i s i o n × R e c a l l α 2 P r e c i s i o n + R e c a l l
When =1, the F1 is the common type of F-score, which indicates that a higher F1 is a more effective performance model, as shown in Equation (8).
F 1   S c o r e = 2 × P r e c i s i o n × R e c a l l P r e c i s i o n + R e c a l l
Intersection over Union (IoU): The ratio of the intersection of the ground truth and predictions to the total area of the ground truth and predictions, as shown in Equation (9)
I o U = T P T P + F P + F N
Intersection over Union (IoU) is applied to the detected model to compare between the prediction result and the ground truth. The value is closer to one when the prediction is better and closer to zero when it is poorer [37,38,39]. An IOU value of 0.5 is used, as shown below [27];
  • Ÿ True Positive (TP): If detection with IOU ≥ 0.5, which means a correct detection
  • Ÿ False Positive (FP): If an IOU < 0.5, which means a wrong detection. Additionally, the prediction can be considered as FP
  • Ÿ A wrong detection. Detection with an IOU < 0.5. Additionally, if the object is spotted by the model even though it is not in the picture, the prediction is considered false positive (FP).
  • Ÿ False Negative (FN): A ground truth not detected [if IOU with ground truth = 0, wrong detection].
False Negative (FN): A ground truth not detected [if IOU with ground truth = 0, wrong detection].
Precision, recall, and intersection over union (IoU) are the most important metrics that relate to the positive categories. They are more appropriate to measure the performance of the crack detection model because they relied on the TP values. The poor detection performance will result in poor model output. It is worth mentioning that a large amount of TN will be found in all approaches. Specificity and accuracy are very sensitive to TN, which would give an indication of corrected uncraked pixels. The accuracy will achieve 100% because there are just too many true negatives. Therefore, it will not demonstrate any noticeable variations between the various approaches.
The precisions for the two datasets: SDNET 2018 and from the field of existing reinforced concrete bridge are 98.32% and 63.5%, respectively. Also, the F1 score measure for images taken by 16 MP Nikon is better than by iPhone 7 Plus: 98.87% and 77%, respectively. Table 2. shows the remaining other performance measure for the crack detection model.

3.2. Crack Width Measurement

When examining and assessing bridges, the most important metric is the maximum crack width. Therefore, the width of 139 cracked images taken from reinforced concrete bridge is measured by a battery microscope. The proposed model detected correctly 87 cracked images from 139 samples. The current study considers three types of crack width based on ACI 201.1R and ACI 345.1R [8,9], as shown in Table 1. The crack that lies in the middle or at the corner is considered in the measurement. The actual maximum crack width is compared with the results of the proposed method, and the crack width root mean squared (RMS) and other statistical measures are calculated based on equations (10) to (16) and summarized in Table 3 and Table 4. The minimum crack width measured manually is 0.5 mm, while the maximum is 4 mm. Table 3 shows that the minimum crack width measured by the model is 0.5 mm, while the maximum is 4.233 mm. The largest absolute error for the model is 0.233 mm The mean errors for maximum crack width are 0.03075 mm, and the root mean square error in millimetres and percentages are, respectively, 0.069 mm and 4.55%, as shown in Table 4. Also the mean absolute error (MAE) is 0.0469 mm which means that the proposed method will typically measure cracks width ±0.0469 mm away from the actual value. The model takes an average of 16 seconds to run for a single image with 667 by 738 pixels and 12.331 seconds for 256 by 256 pixels.The results give an indication that the automated measurement made based on image pixels is close to the manual traditional methods.
e t = Y t       d t
where:
et: Error
Yt: predicted model width
dt: Actual measured width
B i a s = 1   n n e t
M S E = 1 n e t 2
R M S E =   1 n e t 2
M A E = 1 n e t  
M A P E = 1 n       e t   A c t u a l   w i d t h
R M S E % =   1 n e t 2 M e a n   A c t u a l   w i d t h
e t = Y t       d t
where:
et: Error
Yt: predicted model width
dt: Actual measured width
B i a s = 1   n n e t
M S E = 1 n e t 2
R M S E =   1 n e t 2
M A E = 1 n e t  
M A P E = 1 n       e t   A c t u a l   w i d t h
R M S E % =   1 n e t 2 M e a n   A c t u a l   w i d t h
In addition, the table 5 shows the result for detection crack width according to the classification based on ACI 201.1R and ACI 345.1R [8,9].

4. Discussion

The current study has developed a detection approach model to not only detect concrete cracks but also to measure the crack width. The algorithm is carried out for detection on two datasets with different cameras. The recall performance for the two datasets is high, which is evidence that the model is successfully detecting the cracks. While the precision and F1 score for the images of the bridge deck from SDNET 2018 are better than the other dataset. Also, a high deviation from the precision and recall is shown on the images taken from the reinforced concrete bridge: 63.5% and 97.75%, respectively, due to their inversely proportional. The 63.5% precision means that the algorithm categorized crack pixels as uncracked (background). The large variance in recall and precision is associated with the low F1-score (77%).
Since the model aims to measure the concrete crack width, the performance of the developed model to measure crack width is validated by applying it on 87 cracked images detected successfully by the model. The method verified its effectiveness by root mean square error (0.0690 mm). Table 5 gives an indication of the model ability to measure medium and wide cracks more than the fine width less than 0.5 mm.
It is worth mentioning that some cracks are always obvious to the naked eye, although they are not captured clearly in pictures and affected negatively on the model outputs. The errors in measurement can be related to many reasons, such as the mobile camera resolution. The model performance is highly affected with the resolution that impacts the detection and subsequently measurement of crack width. The higher resolution, the better results which is sufficiently clear with 16 MP Nikon camera. While the low resolution will reduce the ability to detect and measure the width of some cracks with complex shape or less than one pixel. Also, some images are full of dents and noise that required special processing and sometimes needs special sensing devices.
Moreover, a comparison between the width measurement results based on applying bilateral filter, wiener filter, and median filter is applied on five cracked samples and the result is shown in Table 6. The comparison shows that the type of applied filter may affect the measurement results because it depends on its ability to detect the cracks clearly in the image. Also, the bilateral filter gives less mean absolute error (MAE) than the wiener and median filters.
Additionally, the presented model is characterized as transparency workflow compared with deep learning method that required computational cost and longer time for training. The presented method is compared with other models in Table 7 that shows most of the literature used a small number of validated samples compared with the proposed model. Thus, the presented model gives the best results.

5. Conclusions

This study developed an automatic system based on image processing techniques for crack detection to measure their maximum width. The proposed model is implemented by Matlab (R 2021a) on two types of datasets and two different cameras. The first dataset is 300 cracked and uncracked bridge deck images from SDNET 2018. The second dataset is 240 images from different parts of an existing reinforced concrete bridge, taken by mobile phone. The model achieved for precision and F1-score 98.32% and 98.87%, respectively, for the images taken by 16 MP Nikon, which reflects the importance of high-resolution cameras in the proposed model. Then, 87 cracked images detected correctly taken from reinforced concrete bridges are used in validation for width measurement. The size of the crack width ranges from 0.5 mm to 4 mm, measured manually by a battery microscope. The minimum crack width measured by the model is 0.5 mm, while the maximum is 4.233 mm. The mean errors for maximum crack width are 0.03075 mm, and the root mean square error is 0.069 mm. The results of the performance evaluation and comparison with previously published work showed that the suggested methodology has enhanced overall performance, especially for the crack width measurement process. Also, the method shows that the performance of the bilateral filter is higher than the median and Wiener filters. The produced model needed low cost and a shorter time for training compared with a deep learning model that requires thousands of data for training and computational resources. The present model is applied to 2D images; therefore, it is recommended to develop the model to be applied to 3D images to extract more crack features. Additionally, the model could be developed to detect other types of defects, such as delamination and spalling, and retrieve their properties to assess the bridge condition. Also, the future works should retrieve other properties such as length, angle, and crack density. The crack properties will be used to establish a model able to estimate the bridge condition rating to determine the suitable repair action.

Author Contributions

Conceptualization, Ahmed Mohammed Abdelalim, Gamal Ebrahim and Mohamed Badawy; Data curation, Ahmed Mohammed Abdelalim, Yasmin Shalaby , Gamal Ebrahim and Mohamed Badawy; Formal analysis, Ahmed Mohammed Abdelalim, Yasmin Shalaby , Gamal Ebrahim and Mohamed Badawy; Funding acquisition, Ahmed Mohammed Abdelalim, Mohamed Salem and Manal Al-Adwani; Investigation, Ahmed Mohammed Abdelalim, Yasmin Shalaby , Mohamed Salem, Gamal Ebrahim and Mohamed Badawy; Methodology, Ahmed Mohammed Abdelalim, Yasmin Shalaby and Mohamed Badawy; Project administration, Ahmed Mohammed Abdelalim, Gamal Ebrahim and Mohamed Badawy; Resources, Ahmed Mohammed Abdelalim; Software, Ahmed Mohammed Abdelalim, Yasmin Shalaby and Mohamed Badawy; Supervision, Ahmed Mohammed Abdelalim, Gamal Ebrahim and Mohamed Badawy; Validation, Ahmed Mohammed Abdelalim, Yasmin Shalaby , Mohamed Salem, Manal Al-Adwani and Mohamed Badawy; Visualization, Ahmed Mohammed Abdelalim, Yasmin Shalaby , Mohamed Salem, Manal Al-Adwani and Mohamed Badawy; Writing – original draft, Ahmed Mohammed Abdelalim, Yasmin Shalaby and Mohamed Badawy; Writing – review & editing, Ahmed Mohammed Abdelalim, Yasmin Shalaby , Mohamed Salem, Manal Al-Adwani and Mohamed Badawy.

Funding

This research received no external funding.

Institutional Review Board Statement

Not applicable.

Informed Consent Statement

Not applicable.

Data Availability Statement

Any data used during the study can be accessed when requested.

Conflicts of Interest

The authors declare no conflict of interest.

References

  1. Abdelalim, A.M. Quantitive Assessment of Deteriorated Rc Structures due to Reinforcing Steel Corrosion. Int. Conf. Civ. Arch. Eng. 2012, 9, 1–12. [Google Scholar] [CrossRef]
  2. Omar, T.; Nehdi, M.L. Condition Assessment of Reinforced Concrete Bridges: Current Practice and Research Challenges. Infrastructures 2018, 3, 36. [Google Scholar] [CrossRef]
  3. Agdas, D.; Rice, J.A.; Martinez, J.R.; Lasa, I.R. Comparison of Visual Inspection and Structural-Health Monitoring As Bridge Condition Assessment Methods. J. Perform. Constr. Facil. 2016, 30. [Google Scholar] [CrossRef]
  4. Abdelkhalek, S.; Zayed, T. Comprehensive Inspection System for Concrete Bridge Deck Application: Current Situation and Future Needs. J. Perform. Constr. Facil. 2020, 34, 03120001. [Google Scholar] [CrossRef]
  5. Abdelkader, E.M.; Moselhi, O.; Marzouk, M.; Zayed, T. Hybrid Elman Neural Network and an Invasive Weed Optimization Method for Bridge Defect Recognition. Transp. Res. Rec. J. Transp. Res. Board 2020, 2675, 167–199. [Google Scholar] [CrossRef]
  6. Kruachottikul, P., N. Cooharojananone, G. Phanomchoeng, T. Chavarnakul, K. Kovitanggoon, D. Trakulwaranont, and K. Atchariyachanvanich. Bridge Sub Structure Defect Inspection Assistance by using Deep Learning. Proc., 2019 IEEE 10th International Conference on Awareness Science and Technology, Morioka, Japan, IEEE, New York, 2019.
  7. Hoang, N.-D. Detection of Surface Crack in Building Structures Using Image Processing Technique with an Improved Otsu Method for Image Thresholding. Adv. Civ. Eng. 2018, 2018. [Google Scholar] [CrossRef]
  8. ACI 201-1R Guide for making a Condition Survey of Concrete in Service.
  9. ACI 345R-91 Guide for Concrete Highway Bridge Deck Construction.
  10. Barkavi, T. & Chidambarathanu, N. (2019). Processing digital image for measurement of crack dimensions in concrete. Civil Engineering Infrastructures Journal, 52(1), 11-22.
  11. Koch, C.; Georgieva, K.; Kasireddy, V.; Akinci, B.; Fieguth, P. A review on computer vision based defect detection and condition assessment of concrete and asphalt civil infrastructure. Adv. Eng. Informatics 2015, 29, 196–210. [Google Scholar] [CrossRef]
  12. Yang, G.; Wu, J.; Hu, Q. Rapid detection of building cracks based on image processing technology with double square artificial marks. Adv. Struct. Eng. 2018, 22, 1186–1193. [Google Scholar] [CrossRef]
  13. Abdelkader, E.M. On the hybridization of pre-trained deep learning and differential evolution algorithms for semantic crack detection and recognition in ensemble of infrastructures. Smart Sustain. Built Environ. 2021, 11, 740–764. [Google Scholar] [CrossRef]
  14. Jain, R. , & Sharma, R. S. (2018, July). Predicting Severity of Cracks in Concrete using Fuzzy Logic. In 2018 International Conference on Recent Innovations in Electrical, Electronics & Communication Engineering (ICRIEECE) (pp. 2976-2976). IEEE.
  15. Mohan, A.; Poobal, S. Crack detection using image processing: A critical review and analysis. Alex. Eng. J. 2018, 57, 787–798. [Google Scholar] [CrossRef]
  16. Noh, Y.; Koo, D.; Kang, Y.-M.; Park, D.; Lee, D. Automatic crack detection on concrete images using segmentation via fuzzy C-means clustering. 2017 International conference on applied system innovation (ICASI), Sapporo, Japan, May 13–17, 2017; pp. 877–880. [CrossRef]
  17. Zhao, X.; Li, S.; Su, H.; Zhou, L.; Loh, K.J. (2018, September). Image-based comprehensive maintenance and inspection method for bridges using deep learning. In Smart Materials, Adaptive Structures and Intelligent Systems (Vol. 51951, p. V002T05A017). American Society of Mechanical Engineers.
  18. Abdelkader, E. M. Moselhi, O., Marzouk, M., & Zayed, T. (2020). Evaluation of Spalling in Bridges Using Machine Vision Method. In ISARC. Proceedings of the International Symposium on Automation and Robotics in Construction (Vol. 37, pp. 1136-1143). IAARC Publications.
  19. Li, G.; Liu, Q.; Zhao, S.; Qiao, W.; Ren, X. Automatic crack recognition for concrete bridges using a fully convolutional neural network and naive Bayes data fusion based on a visual detection system. Meas. Sci. Technol. 2020, 31, 075403. [Google Scholar] [CrossRef]
  20. Ong, J.C.; Ismadi, M.-Z.P.; Wang, X. A hybrid method for pavement crack width measurement. Measurement 2022, 197. [Google Scholar] [CrossRef]
  21. Cardellicchio, A. , Ruggieri, S., Nettis, A., Patruno, C., Uva, G., & Renò, V. (2022, May). Deep learning approaches for image-based detection and classification of structural defects in bridges. In International Conference on Image Analysis and Processing (pp. 269-279). Cham: Springer International Publishing.
  22. Yu, H. Research on Bridge Condition Monitoring Based on Image Processing Technology and Bridge Crack Detection Algorithm. In 2023 2nd International Conference on 3D Immersion, Interaction and Multi-sensory Experiences (ICDIIME) (pp. 412-416). IEEE.
  23. de León, G.; Fiorentini, N.; Leandri, P.; Losa, M. A New Region-Based Minimal Path Selection Algorithm for Crack Detection and Ground Truth Labeling Exploiting Gabor Filters. Remote. Sens. 2023, 15, 2722. [Google Scholar] [CrossRef]
  24. Bae, H.; An, Y.-K. Computer vision-based statistical crack quantification for concrete structures. Measurement 2023, 211. [Google Scholar] [CrossRef]
  25. Kao, S.-P.; Chang, Y.-C.; Wang, F.-L. Combining the YOLOv4 Deep Learning Model with UAV Imagery Processing Technology in the Extraction and Quantization of Cracks in Bridges. Sensors 2023, 23, 2572. [Google Scholar] [CrossRef]
  26. Tran, T.S.; Nguyen, S.D.; Lee, H.J.; Tran, V.P. Advanced crack detection and segmentation on bridge decks using deep learning. Constr. Build. Mater. 2023, 400. [Google Scholar] [CrossRef]
  27. Shalaby, Y.M.; Badawy, M.; Ebrahim, G.A.; Abdelalim, A.M. Condition assessment of concrete structures using automated crack detection method for different concrete surface types based on image processing. Discov. Civ. Eng. 2024, 1, 1–16. [Google Scholar] [CrossRef]
  28. Dorafshan, S.; Thomas, R.J.; Maguire, M. SDNET2018: An annotated image dataset for non-contact concrete crack detection using deep convolutional neural networks. Data Brief 2018, 21, 1664–1668. [Google Scholar] [CrossRef]
  29. Tomasi C, Manduchi R. Bilateral fltering for gray and color images. In Sixth international conference on computer vision (IEEE Cat. No. 98CH36271). 1998, January; 839–846. IEEE.
  30. Pham TQ, Van Vliet LJ. Separable bilateral fltering for fast video preprocessing. In 2005 IEEE International Conference on Multimedia and Expo. 2005, July; 4. IEEE.
  31. Saxena, LP. Niblack’s binarization method and its modifcations to real-time applications: a review. Artif Intell Rev. 2019;51(4):673–705.
  32. Ji, X.; Miao, Z.; Kromanis, R. Vision-based measurements of deformations and cracks for RC structure tests. Eng. Struct. 2020, 212, 110508. [Google Scholar] [CrossRef]
  33. Jang, K. , An, Y. K., Kim, B., & Cho, S. (2021). Automated crack evaluation of a high-rise bridge pier using a ring-type climbing robot. Computer-Aided Civil and Infrastructure Engineering, 36(1), 14-29.
  34. Peddireddy, R. P. R. , & Semwal, S. K. (2018). Implementation of Distance Transformation in the Processing Language.
  35. Image Analyst. Thresholding an image. 2024. https://www.mathworks.com/matlabcentral/fleexchange/29372-thresholding-an-image. MATLAB Central File Exchange. Accessed 14 July 2024.
  36. Sokolova, M.; Lapalme, G. A systematic analysis of performance measures for classification tasks. Inf. Process. Manag. 2009, 45, 427–437. [Google Scholar] [CrossRef]
  37. Ogwok, D. & Ehlers, E. M. (2022, November). Jaccard Index in Ensemble Image Segmentation: An Approach. In Proceedings of the 2022 5th International Conference on Computational Intelligence and Intelligent Systems (pp. 9-14).
  38. Yang, G.; Wu, J.; Hu, Q. Rapid detection of building cracks based on image processing technology with double square artificial marks. Adv. Struct. Eng. 2018, 22, 1186–1193. [Google Scholar] [CrossRef]
  39. Zhang, Z.; Shen, Z.; Liu, J.; Shu, J.; Zhang, H. A Binocular Vision-Based Crack Detection and Measurement Method Incorporating Semantic Segmentation. Sensors 2023, 24, 3. [Google Scholar] [CrossRef] [PubMed]
  40. Nyathi, M.A.; Bai, J.; Wilson, I.D. Concrete Crack Width Measurement Using a Laser Beam and Image Processing Algorithms. Appl. Sci. 2023, 13, 4981. [Google Scholar] [CrossRef]
  41. Abdelalim, A.M. A novel diagnostic prognostic approach for rehabilitated RC structures based on integrated probabilistic deterioration models. Int. J. Decis. Sci. Risk Manag. 2019, 8, 119. [Google Scholar] [CrossRef]
  42. Mohamed, N.A.; Abdel-Alim, A.M.; Ghith, H.H.; Sherif, A.G. Assessment and Prediction Planning of R.C Structures Using BIM Technology. Eng. Res. J. 2020, 167, 394–403. [Google Scholar] [CrossRef]
  43. Abdelalim,A.M., Nahla Ali Mohamed fahmy, Hatem Hamdy Ghith, Alaa Gamal sheriff (2020). Condition Assessment and Deterioration Prediction of RC Structures, International Journal of Civil and Structural Engineering Research, 8(1), 173-181, available at: https://www.researchpublish.com/papers/condition-assessment-and-deterioration-prediction-of-rc-structures.
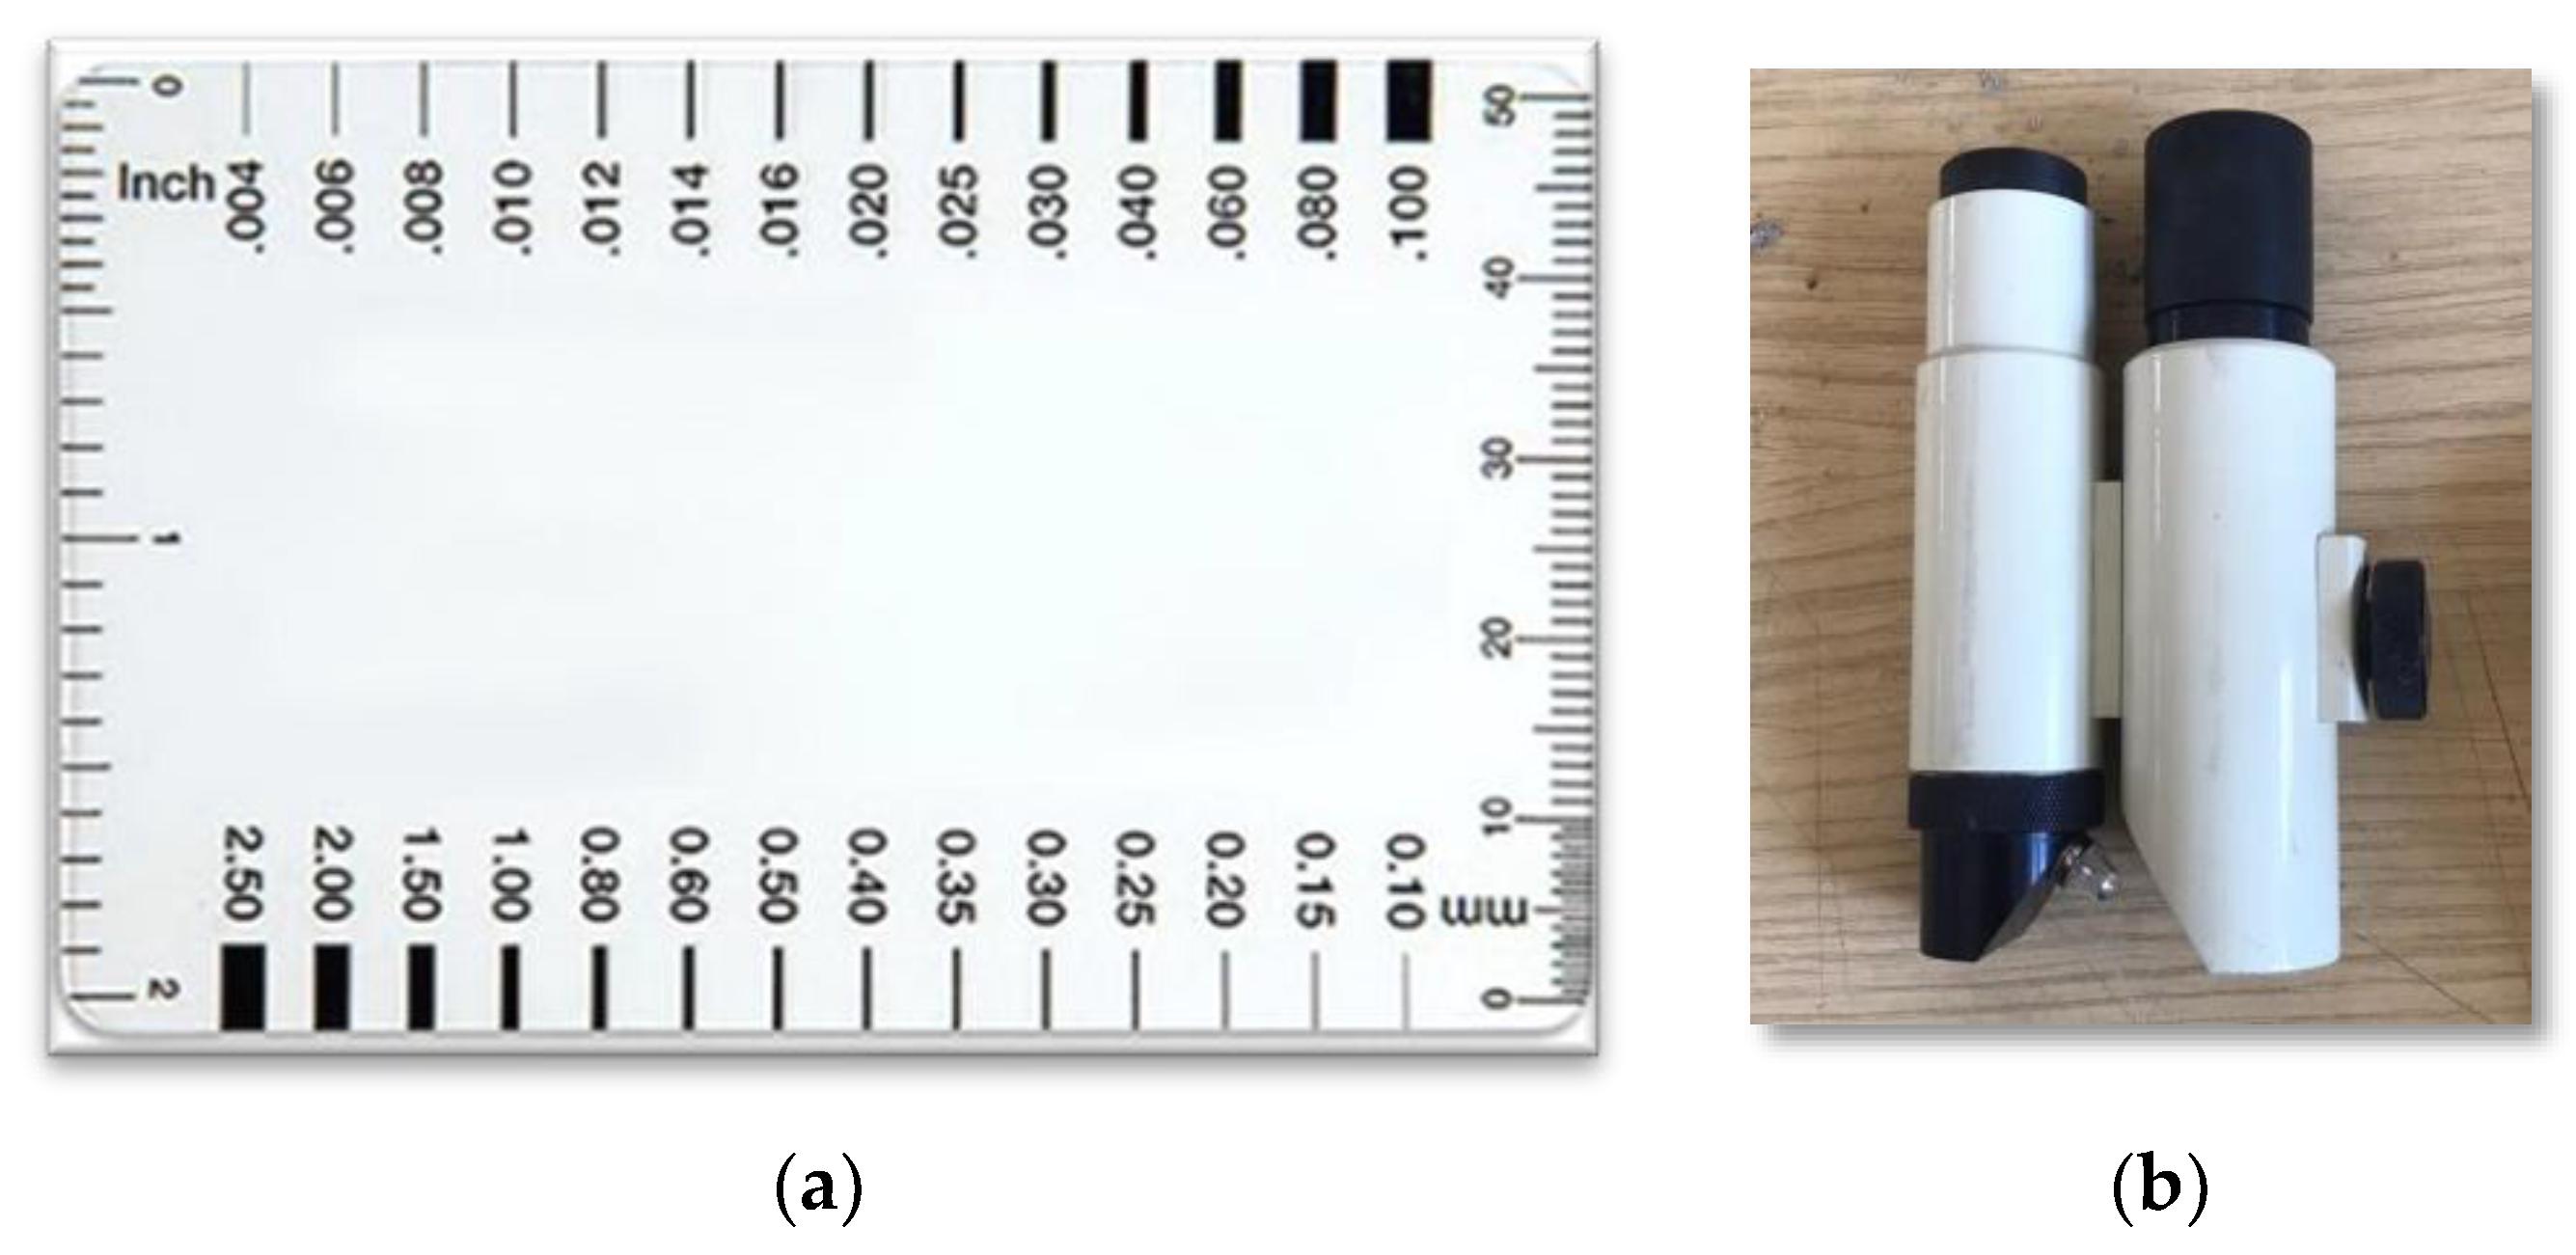
Figure 1. (a) Comparator Cards; (b) battery microscope magnification.
Preprints 138204 g001
Figure 2. Framework for the suggested model’s procedure.
Preprints 138204 g002
Figure 3. (a) Original image (bridge deck image taken from SDNET, 2018) [33]; (b) Skeletonized image; (c) Applying Euclidean distance transform on skeletonized image.
Preprints 138204 g003
Figure 4. The ground truth and the output results from the proposed model : (a) Original image[28]; (b) GroundTruth image; (c) applying filling holes function; (d)Applying skeletonize function; (e) Applying Euclidean Distance; (f) Multiplying radius image by 2 to get diameter (width); and (g) A histogram to show maximum and mean width in mm.
Preprints 138204 g004
Table 1. Cracks criteria based on ACI 201.1R & ACI 345.1R [8,9].
Classification Description
Fine Generally less than ( lmm ) wide.
Medium Between (lmm) and (2mm) wide.
Wide Over (2mm) wide
Table 3. Width measurement comparison for an 87 cracked image.
Variable Mean SE Mean St.Dev Minimum Q1 Median Q3 Maximum
Actual (mm) 1.5167 0.0719 0.6705 0.5000 1.0000 1.5000 2.0000 4.0000
Model (mm) 1.5474 0.0744 0.6942 0.5000 1.0583 1.5800 2.1000 4.2330
Error 0.03075 0.00667 0.06220 -0.100 0 0.00500 0.06600 0.23300
Abs Error 0.04696 0.00546 0.05093 0 0 0.04080 0.0800 0.23300
MAPE% 3.010 0.273 2.551 0 0 4.125 5.333 7.143
Squared Error ( e t 2 ) 0.00477 0.00107 0.0099 0 0 0.00166 0.006400 0.05429
Table 4. Statistical measures for 87 cracks width.
Bias (mm) 0.03075
MAE (mm) 0.04696
MAPE% 3.01%
RMSE (mm) 0.0690
RMSE% 4.55%
Table 5. Classification of crack width for 87 cracked concrete samples.
Classification Fine Medium Wide Total
Fine 11 11 0 22
Medium 0 43 5 48
Wide 0 0 17 17
Total 11 54 22 87
Table 2. The crack detection model's performance measure.
Data Source. Type of camera Precision Recall Specificity Accuracy F1-Score
Bridge Deck (SDNET 2018) 16 MP Nikon camera 98.32% 99.43% 95.83% 97% 98.87%
Existing RC Bridge iPhone 7 Plus 63.5% 97.75% 96.04% 76.66% 77.00%
Table 6. Comparison between the bilateral, wiener, and median filter on the measurement of crack width.
Image No actual width (mm) Bilateral filter Absolute error Median filter Absolute error Wiener filter Absolute error
1 0.7 0.8 0.1 0.8 0.1 0.8 0.1
2 2 2.3 0.3 2.4 0.4 2.6 0.6
3 2 1.9 0.1 1.3 0.7 1.7 0.3
4 1.6 1.3 0.3 1.6 0 1.8 0.2
5 1.5 2 0.5 1.9 0.4 1.7 0.2
MAE (mm) 0.166 0.205 0.179
Table 7. Performance comparison with other previous methods.
Authors Absolute error Relative error No. validated samples
[38] - 0.02% to 1.44% 12
[39] - -3.9% to 36% 4
[40] 0.02 to 0.57 1% to 2% 8
Proposed model 0 to 0.233 -5% to 5.82% 87
Disclaimer/Publisher’s Note: The statements, opinions and data contained in all publications are solely those of the individual author(s) and contributor(s) and not of MDPI and/or the editor(s). MDPI and/or the editor(s) disclaim responsibility for any injury to people or property resulting from any ideas, methods, instructions or products referred to in the content.
Copyright: This open access article is published under a Creative Commons CC BY 4.0 license, which permit the free download, distribution, and reuse, provided that the author and preprint are cited in any reuse.
Alerts
Prerpints.org logo

Preprints.org is a free preprint server supported by MDPI in Basel, Switzerland.

Subscribe

© 2025 MDPI (Basel, Switzerland) unless otherwise stated