Submitted:
01 November 2024
Posted:
01 November 2024
You are already at the latest version
Abstract
Keywords:
1. Introduction
2. Results
2.1. Subsection
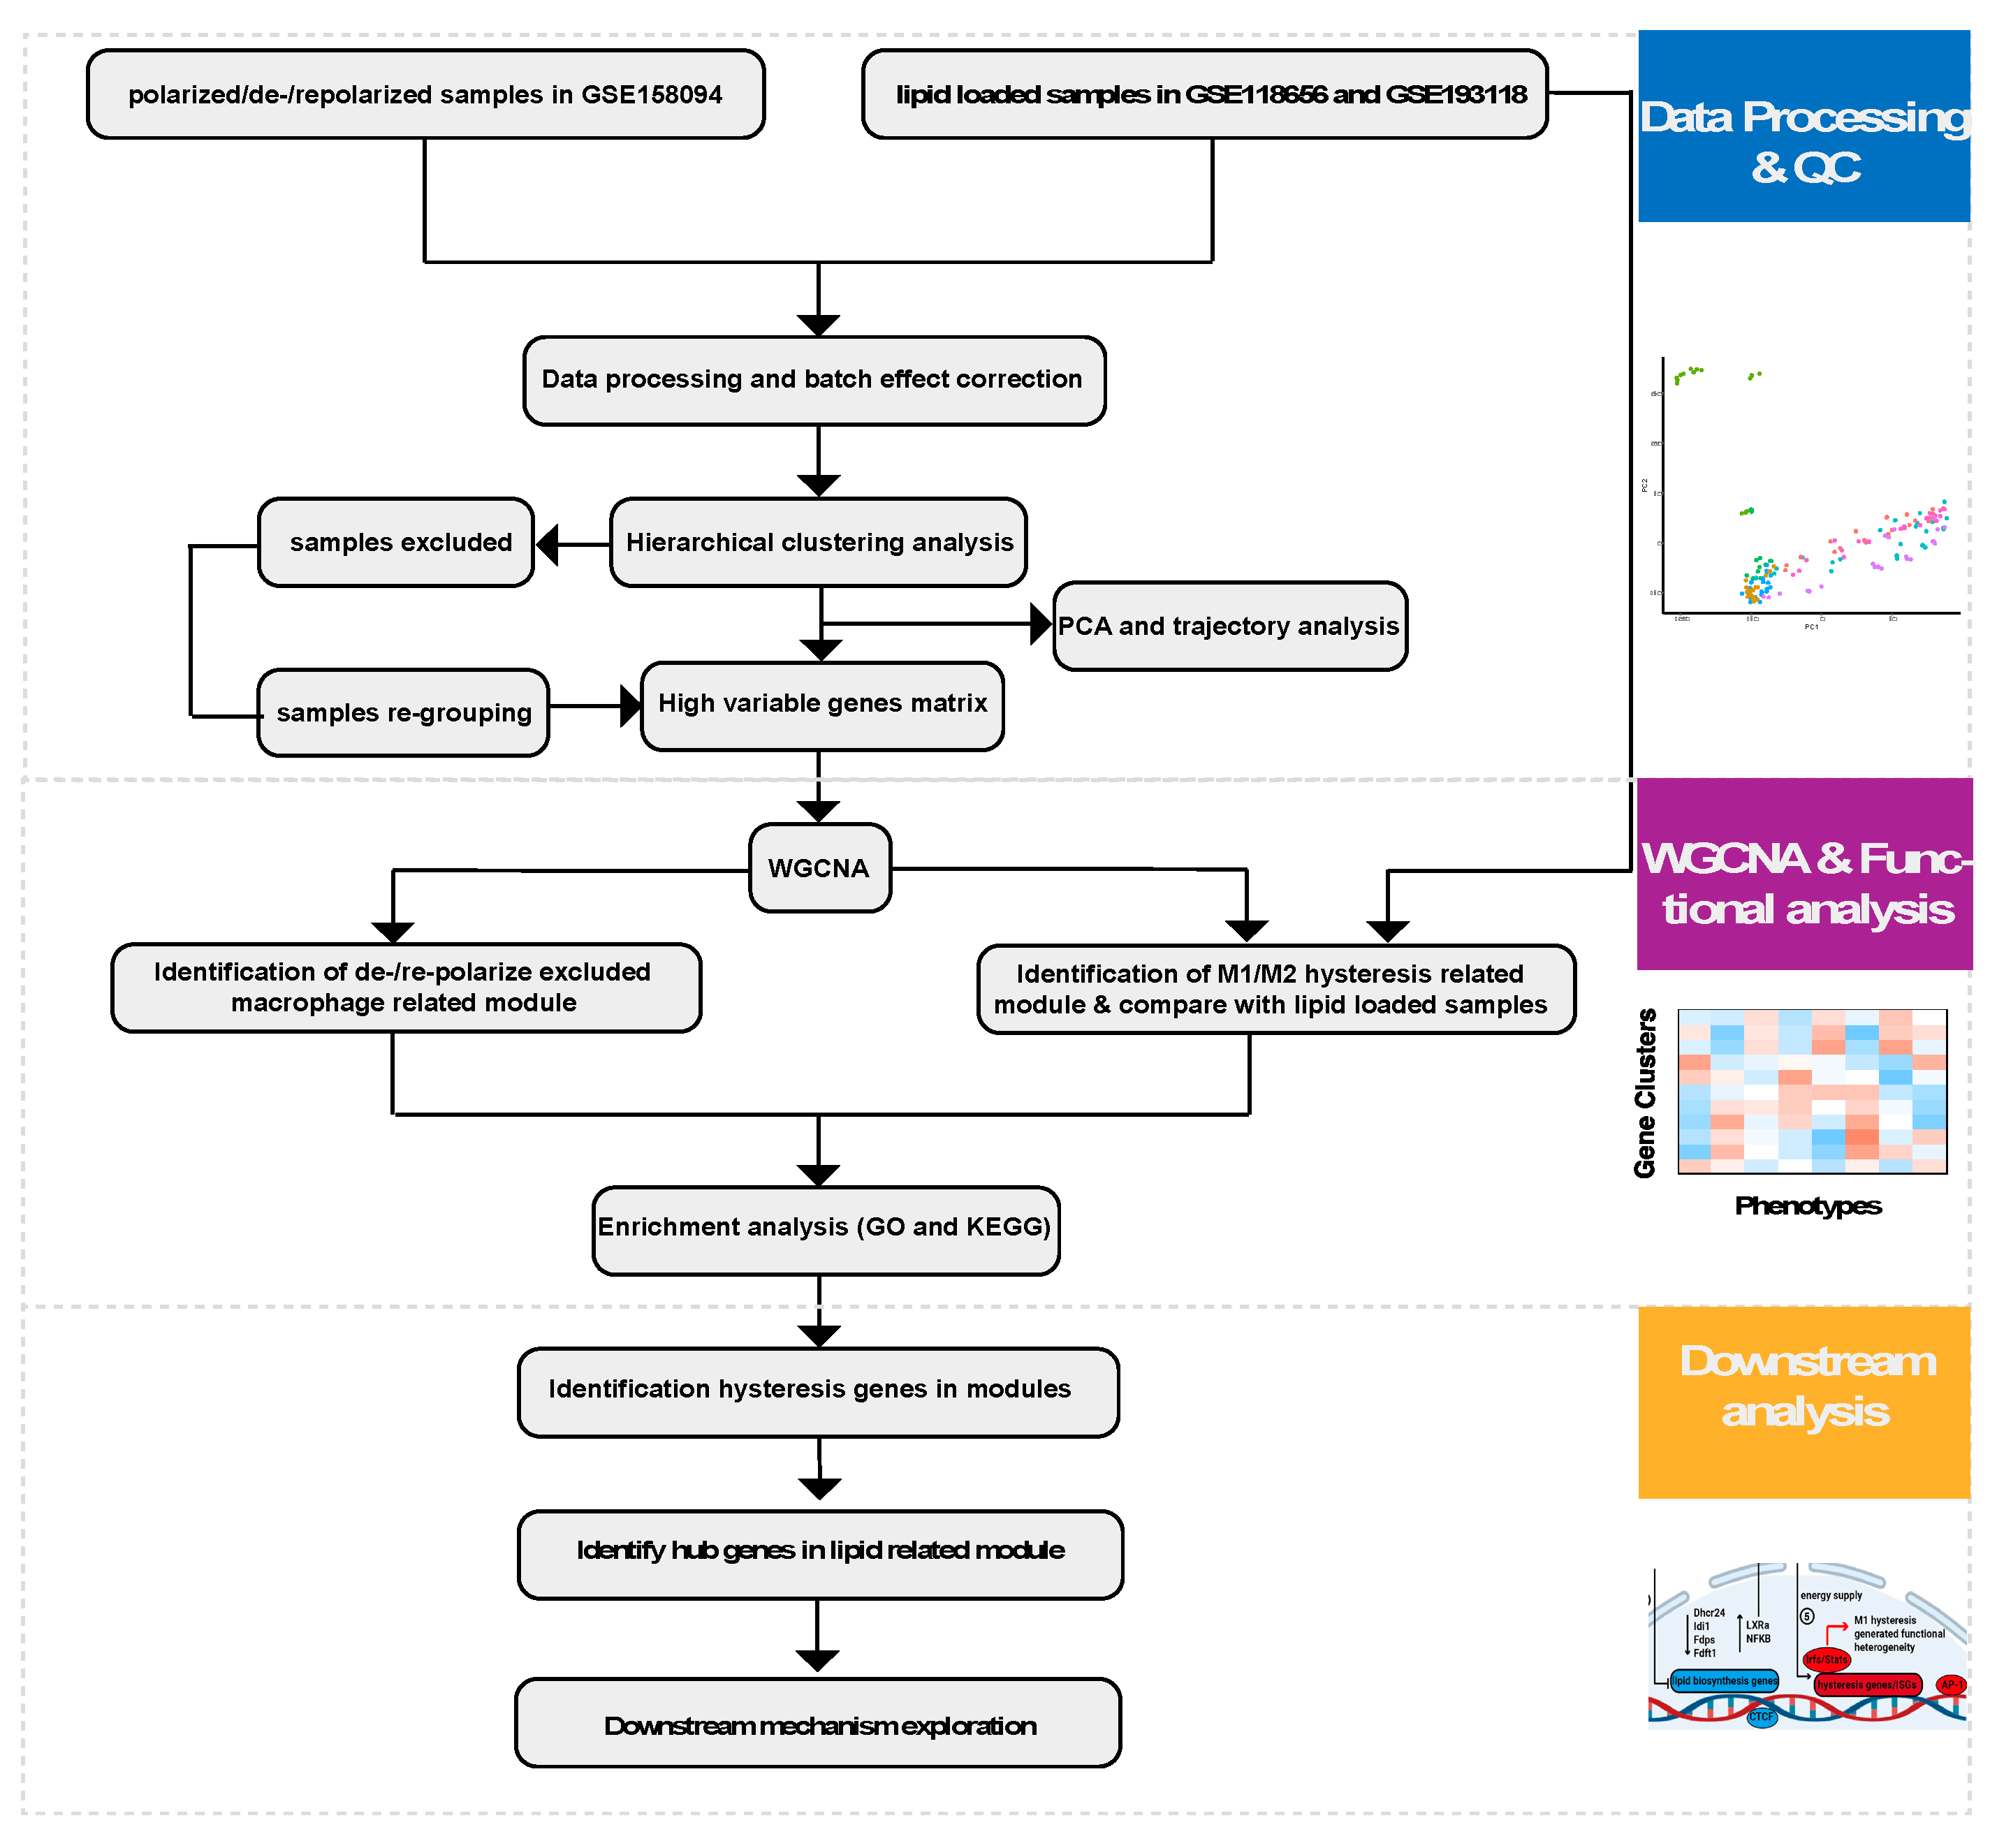
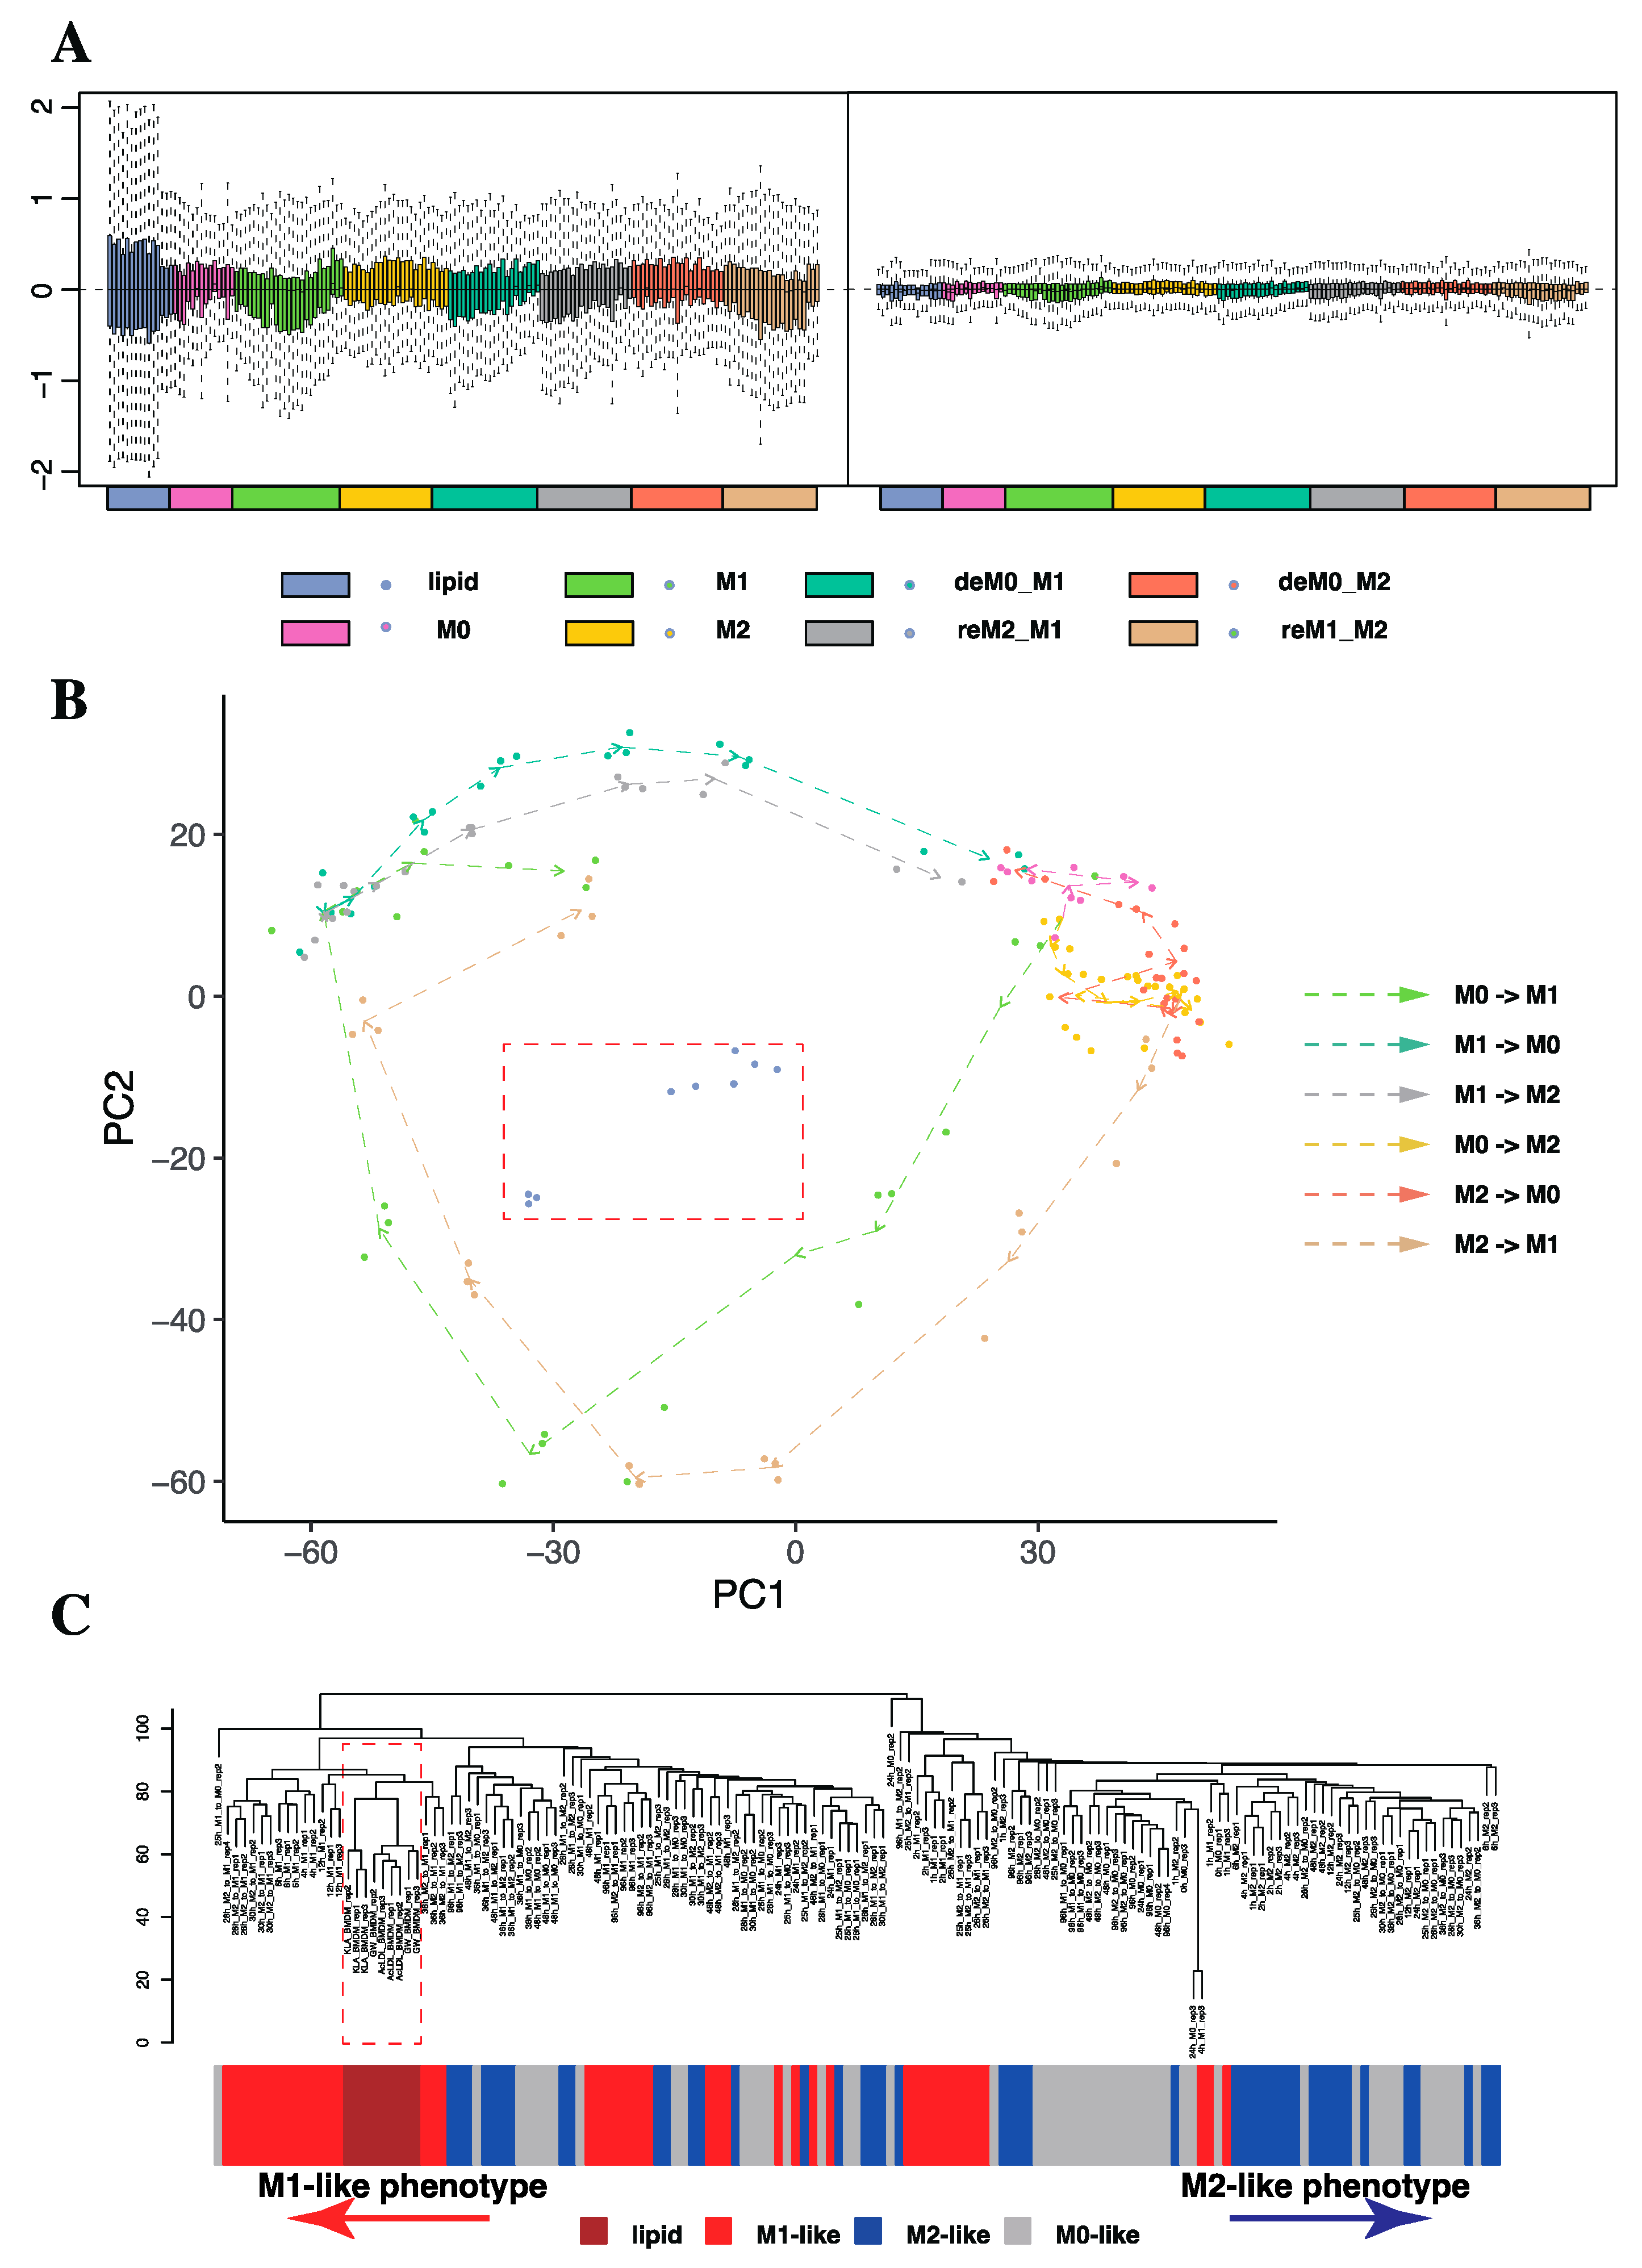
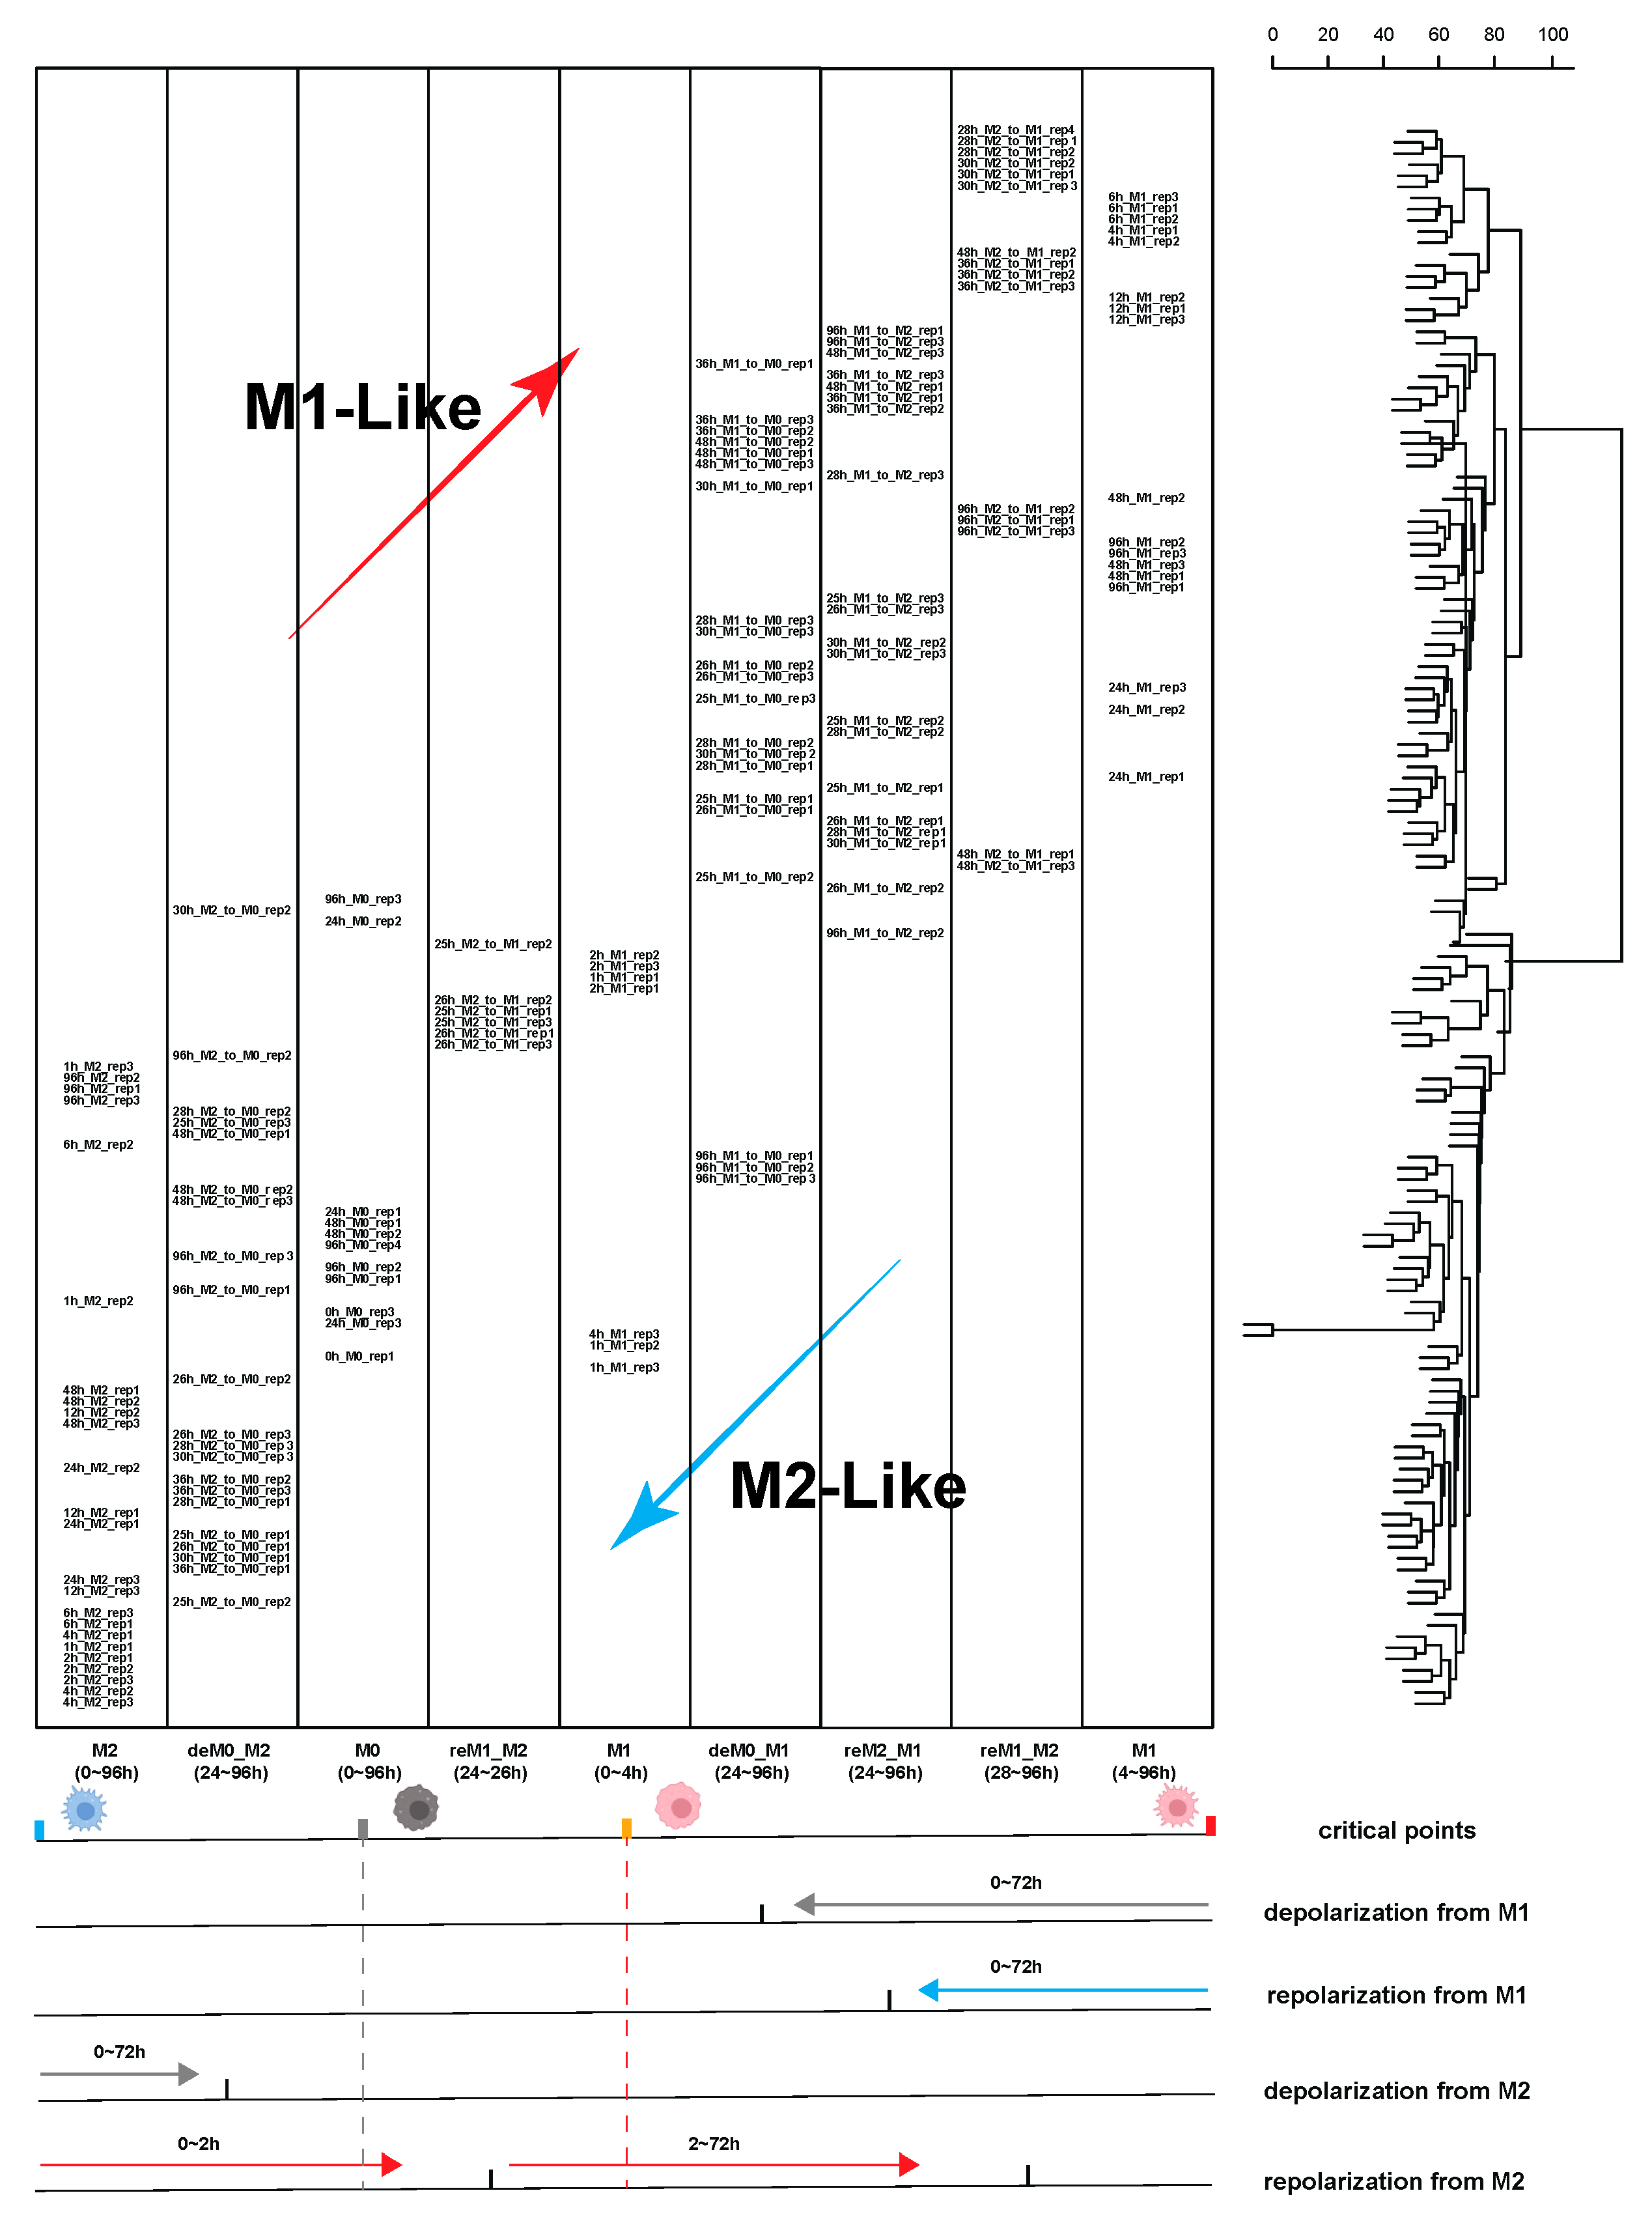
2.1.1. Trajectory Analysis and Hierarchical Clustering Confirmed the High Sensitivity of Macrophages to the Time of Stimulation
2.1.2. Considering the Stimulation Time Factor Significantly Improved the Accuracy of Sample Classification for Downstream Analysis
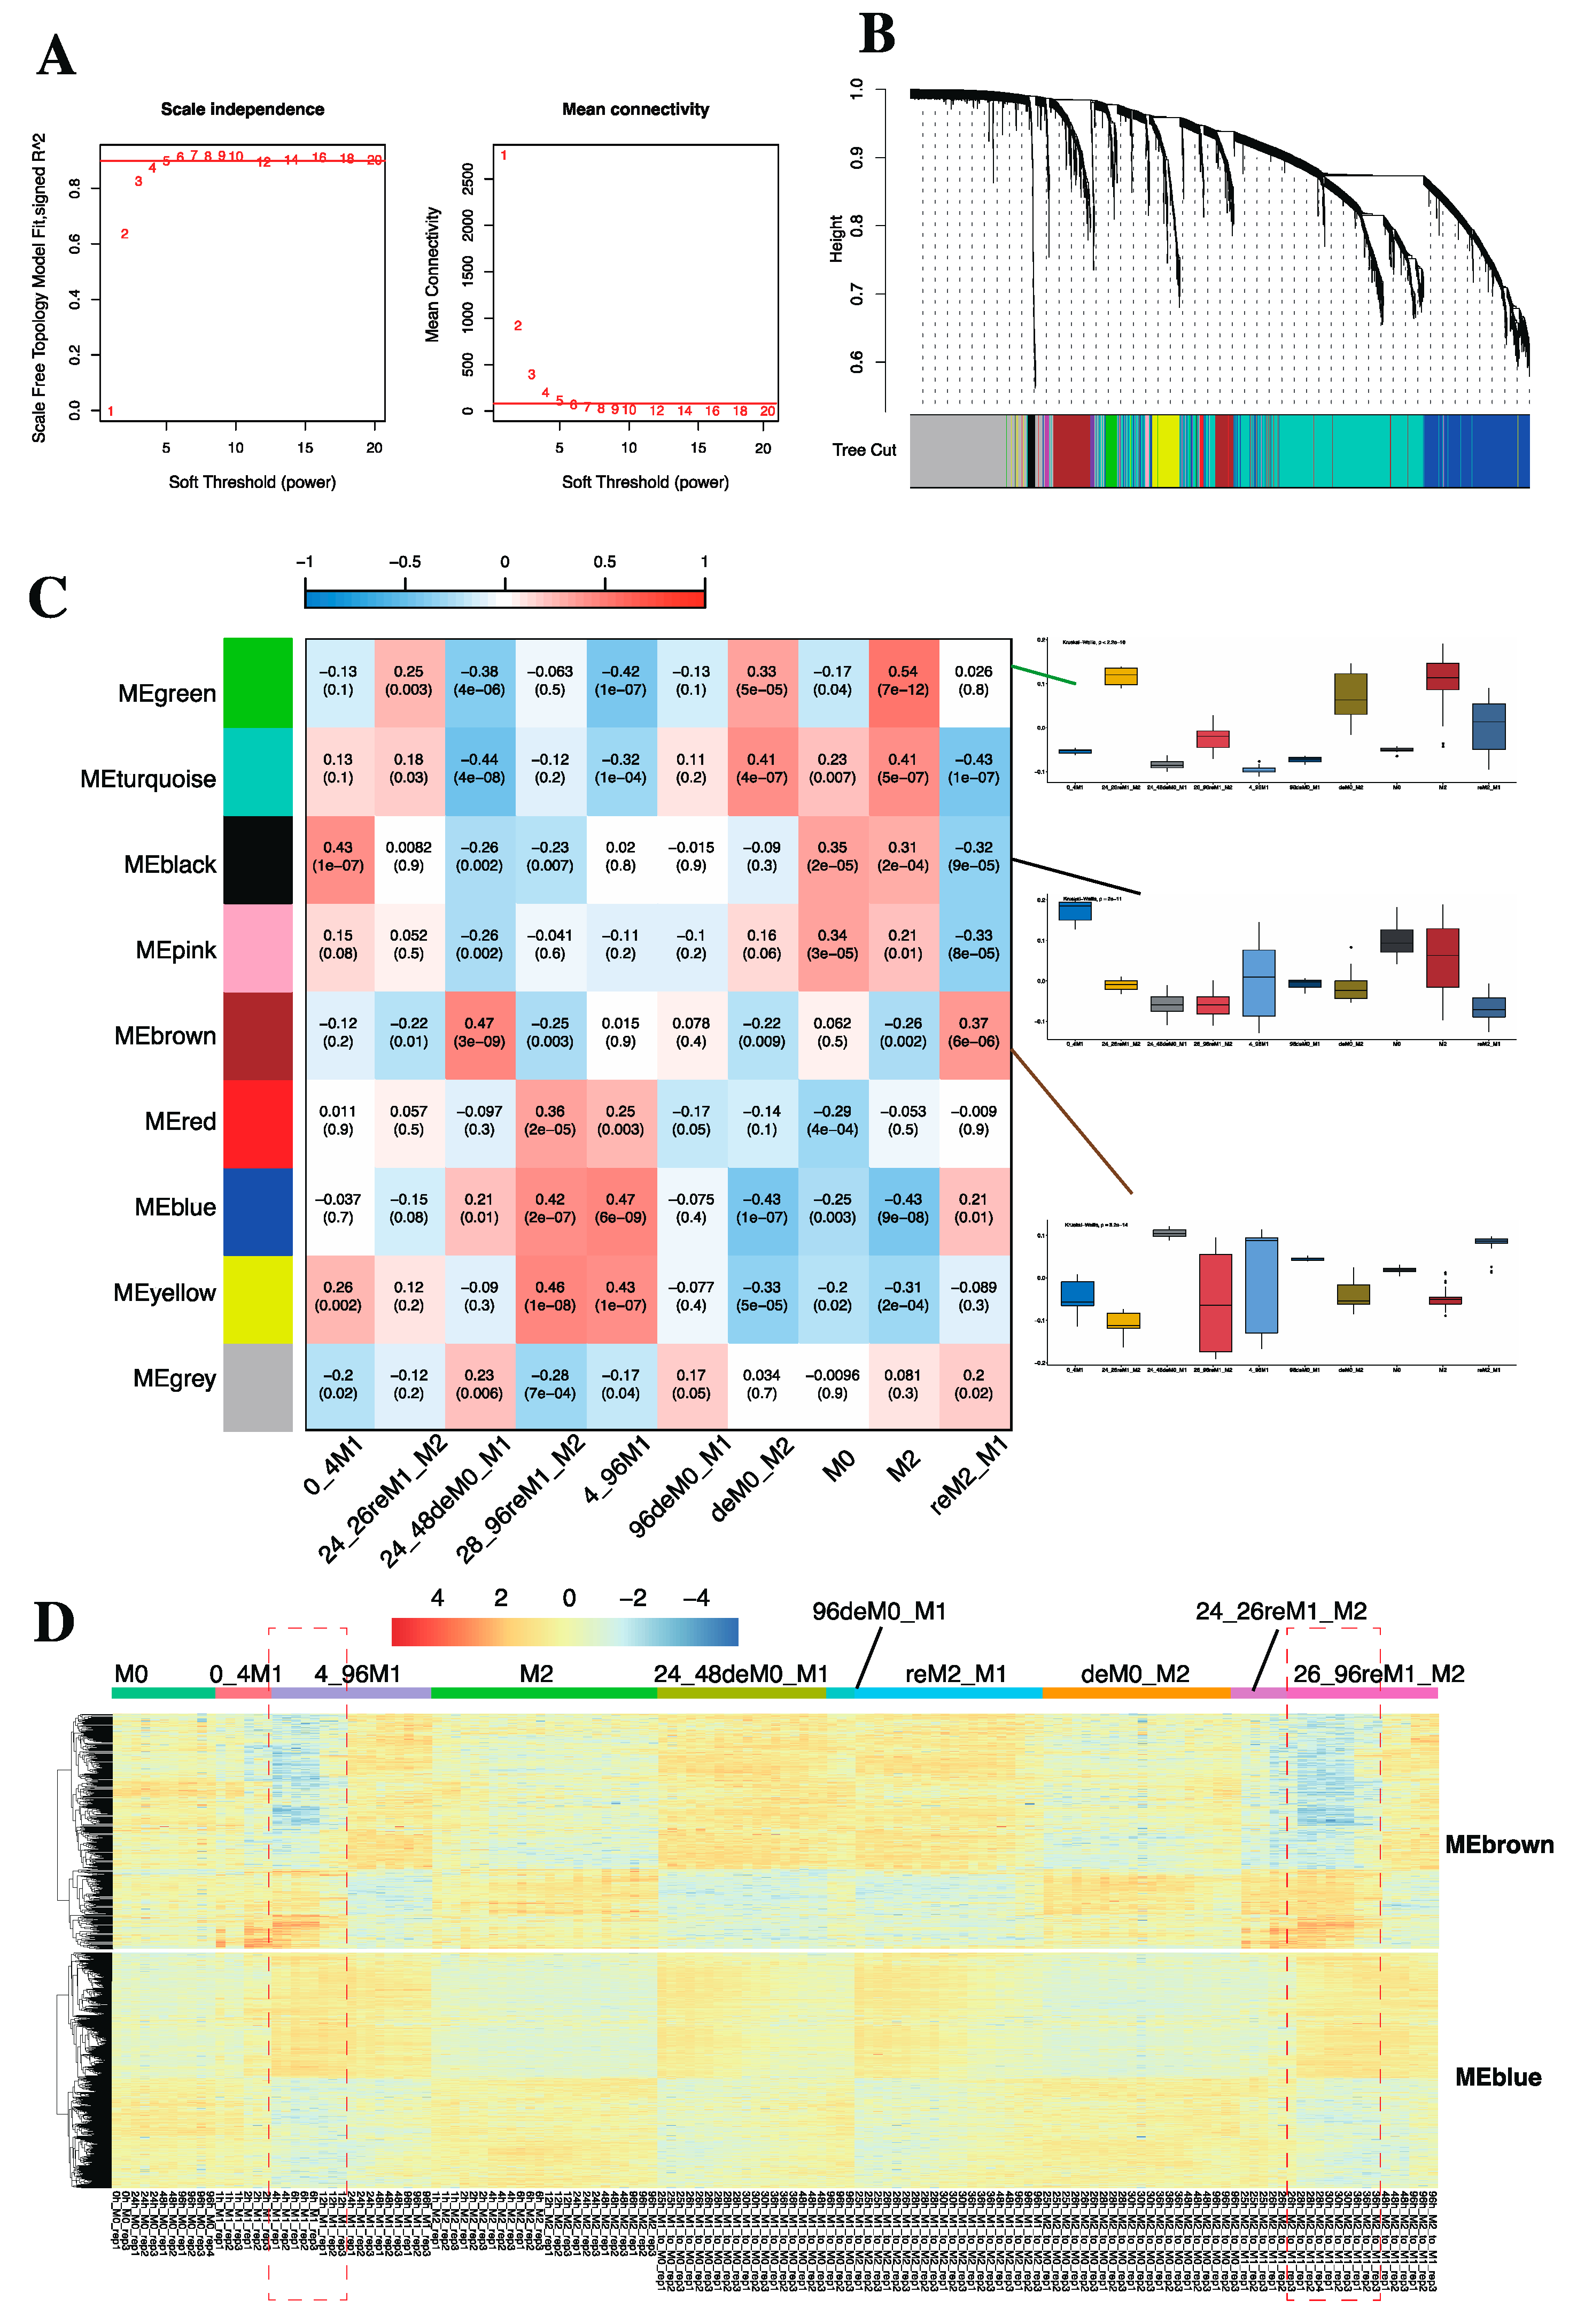
2.1.3. WGCNA Revealed Specific Gene Modules Associated with Macrophage Phenotypes
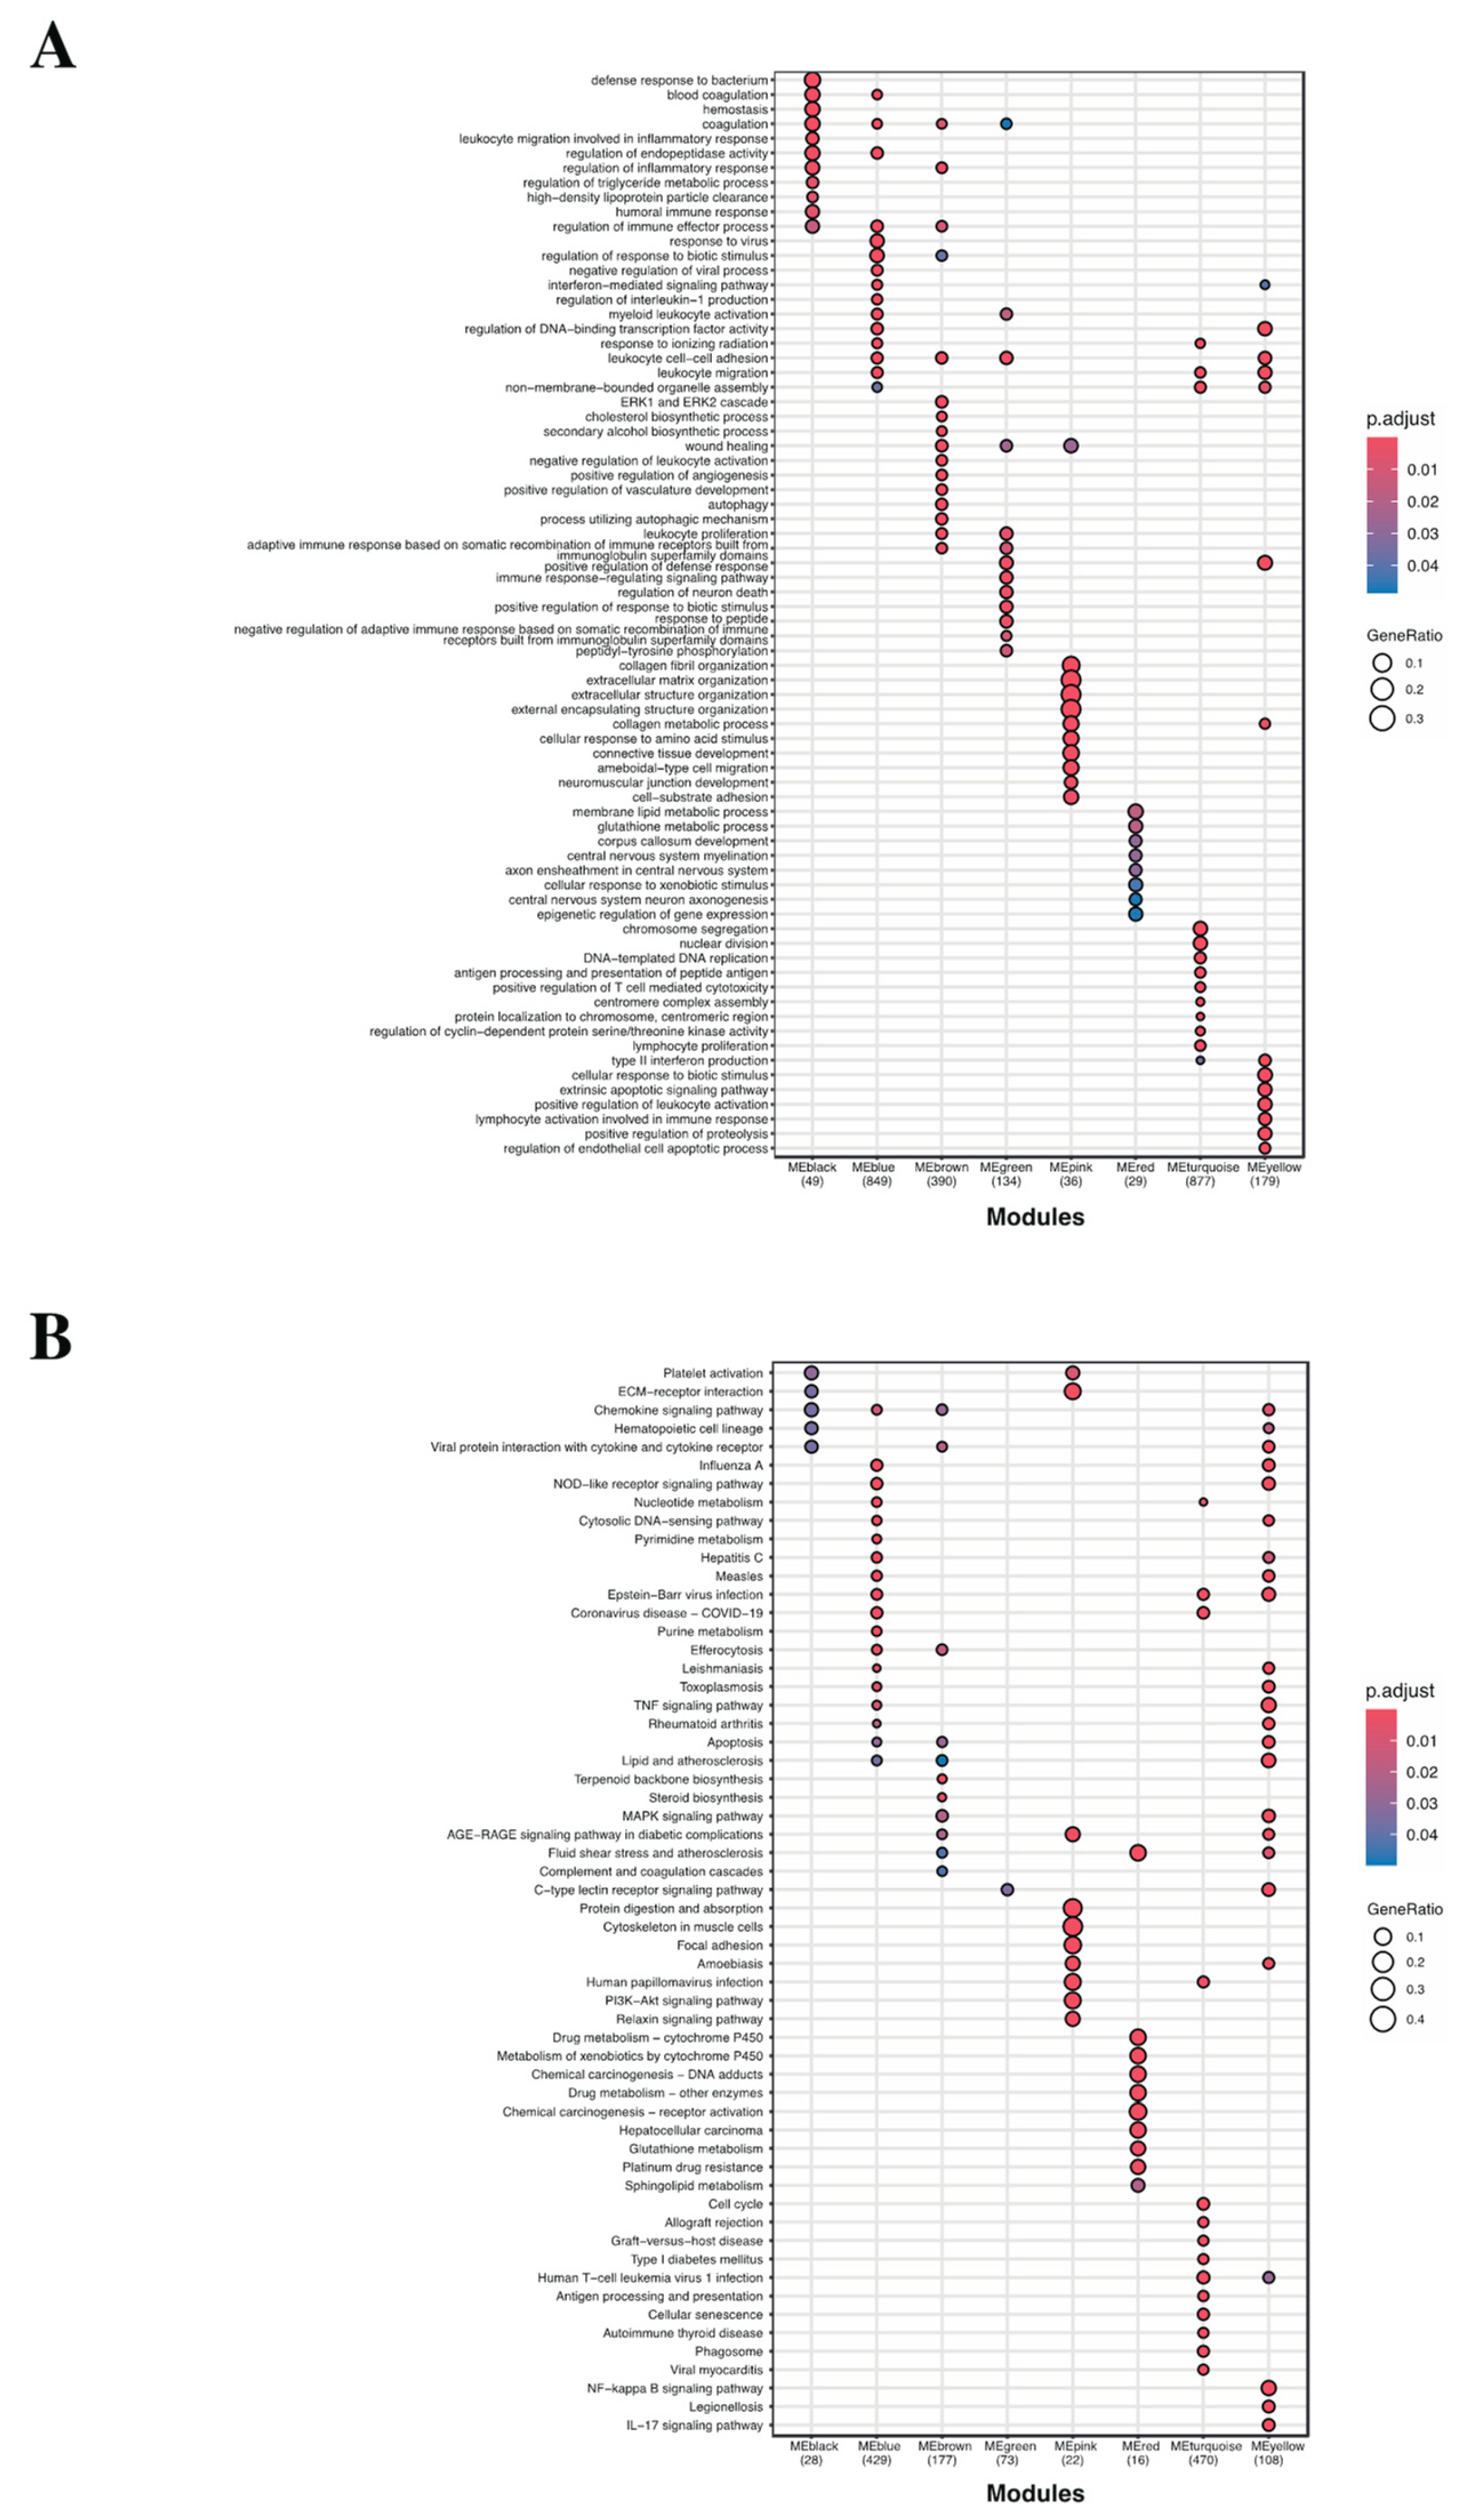
2.1.4. GO Term and KEGG Enrichment Analysis Unveiled the Functions of Identified Gene Modules
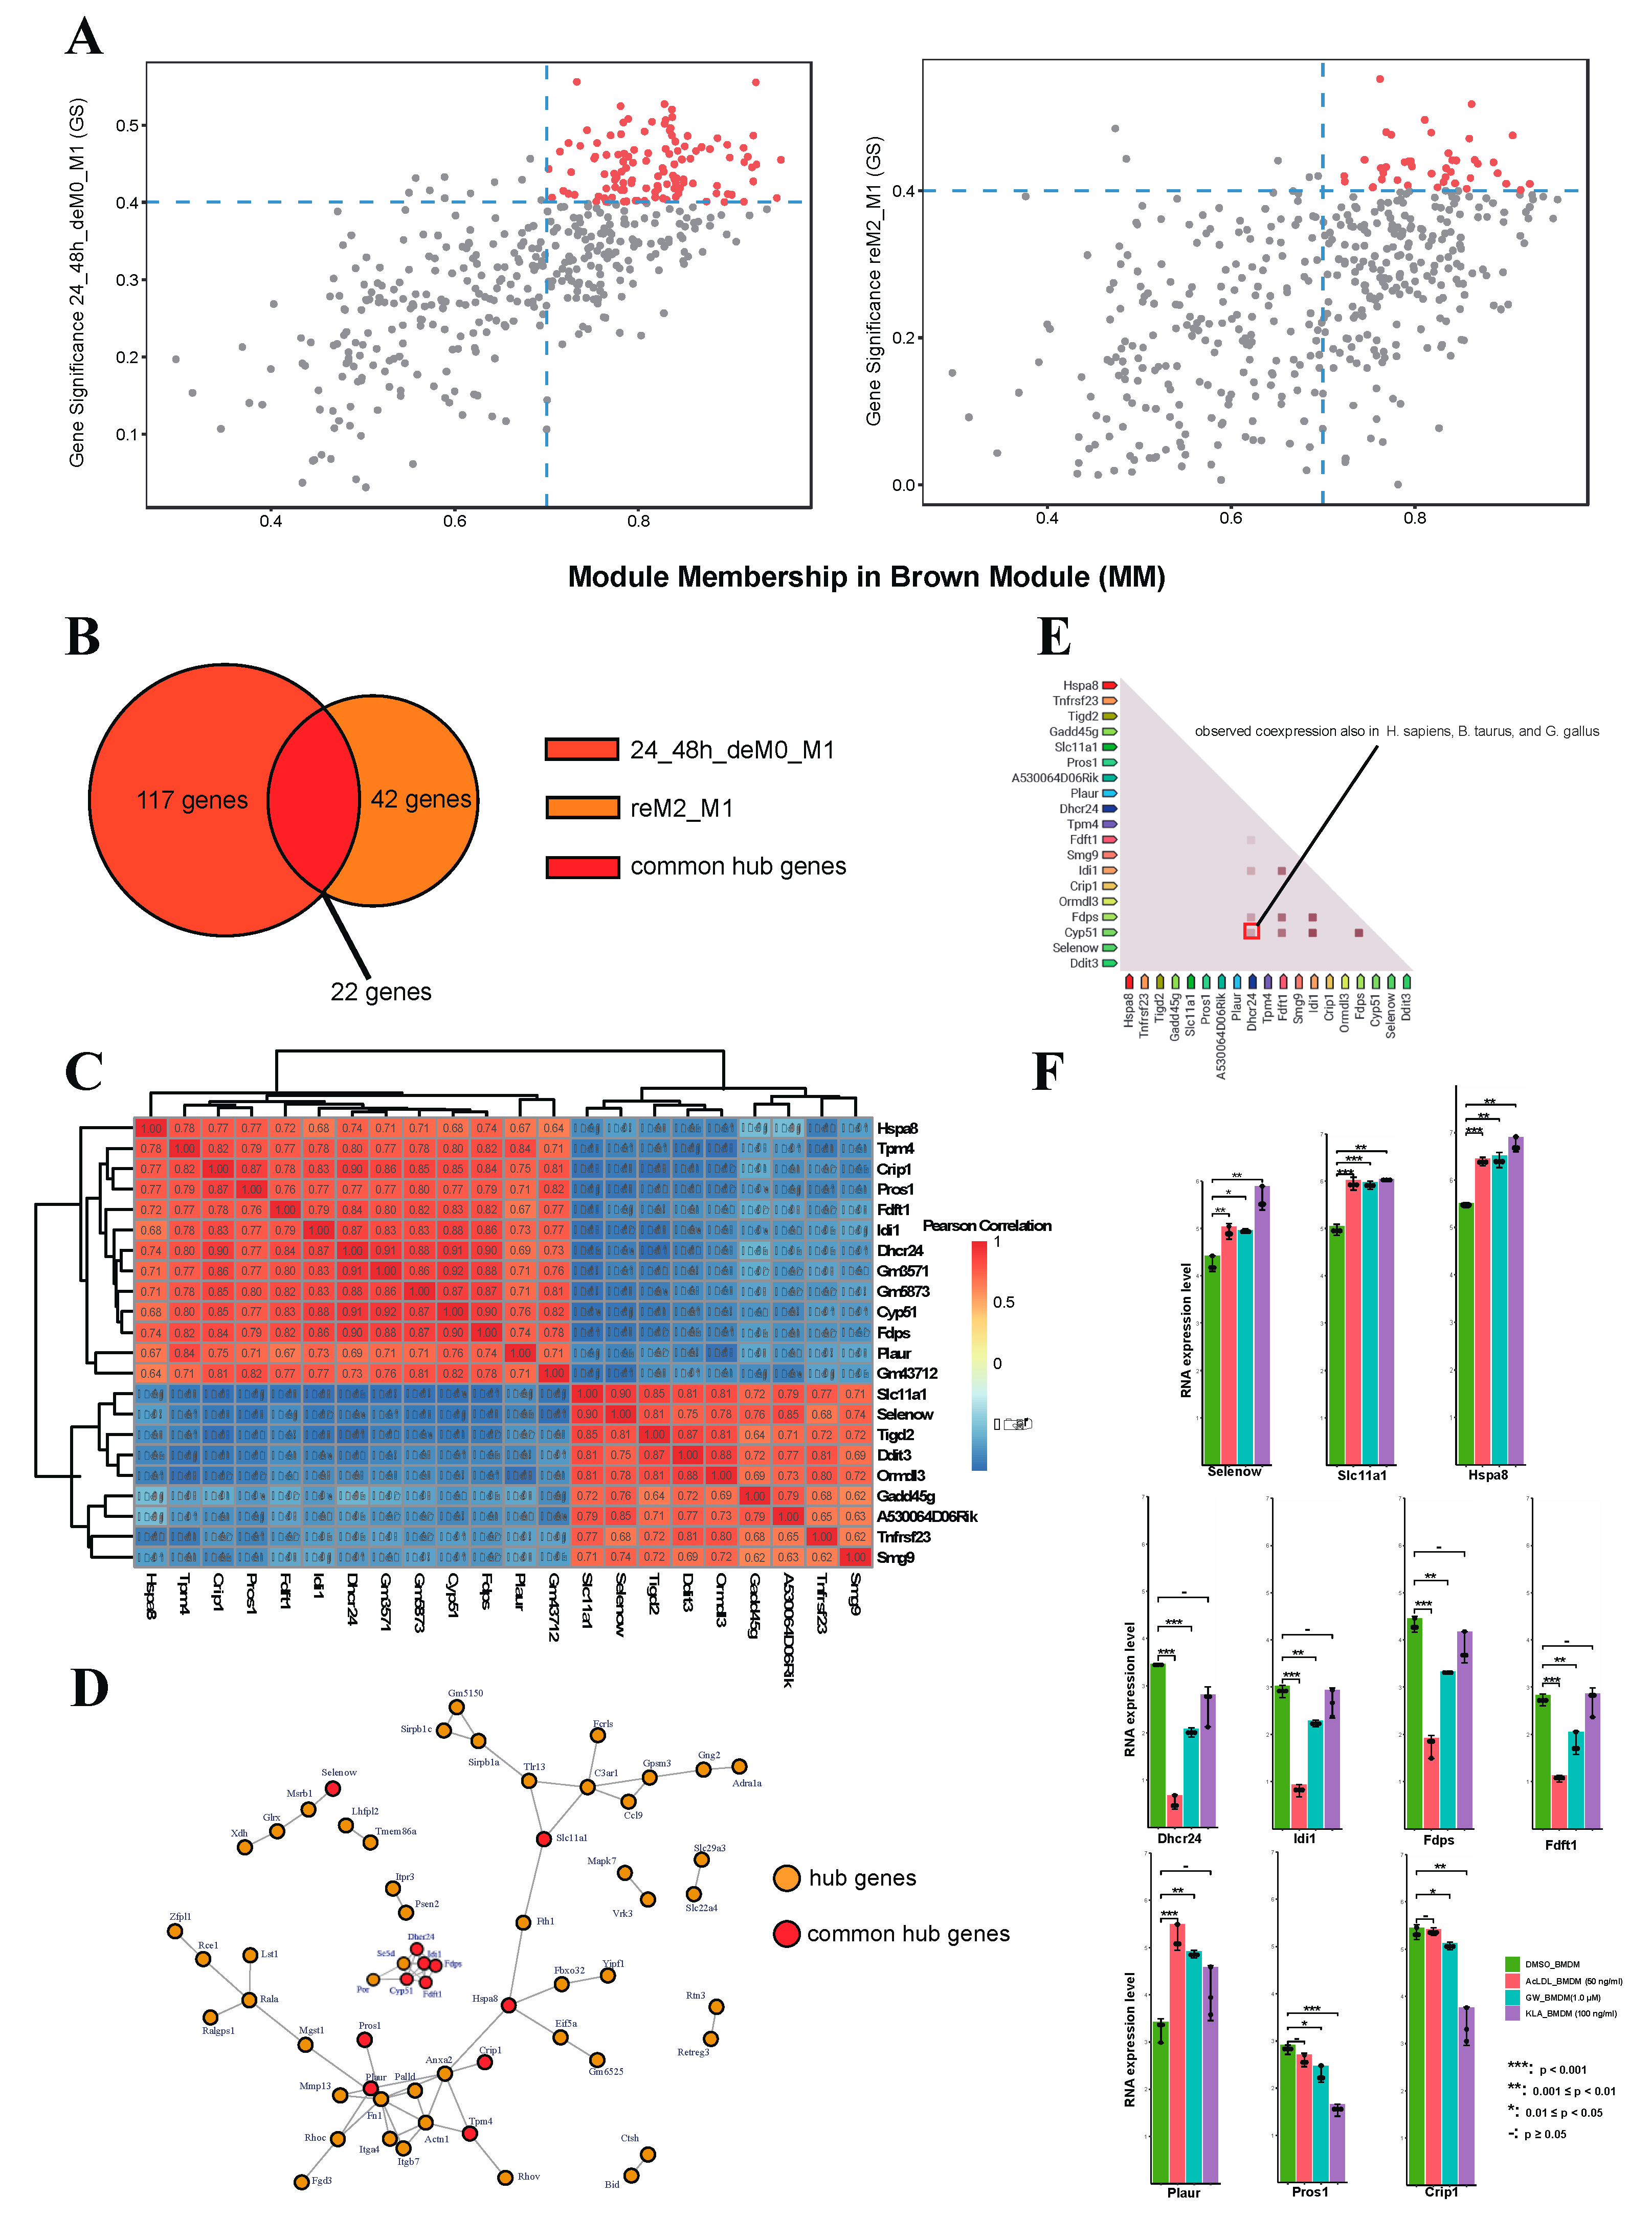
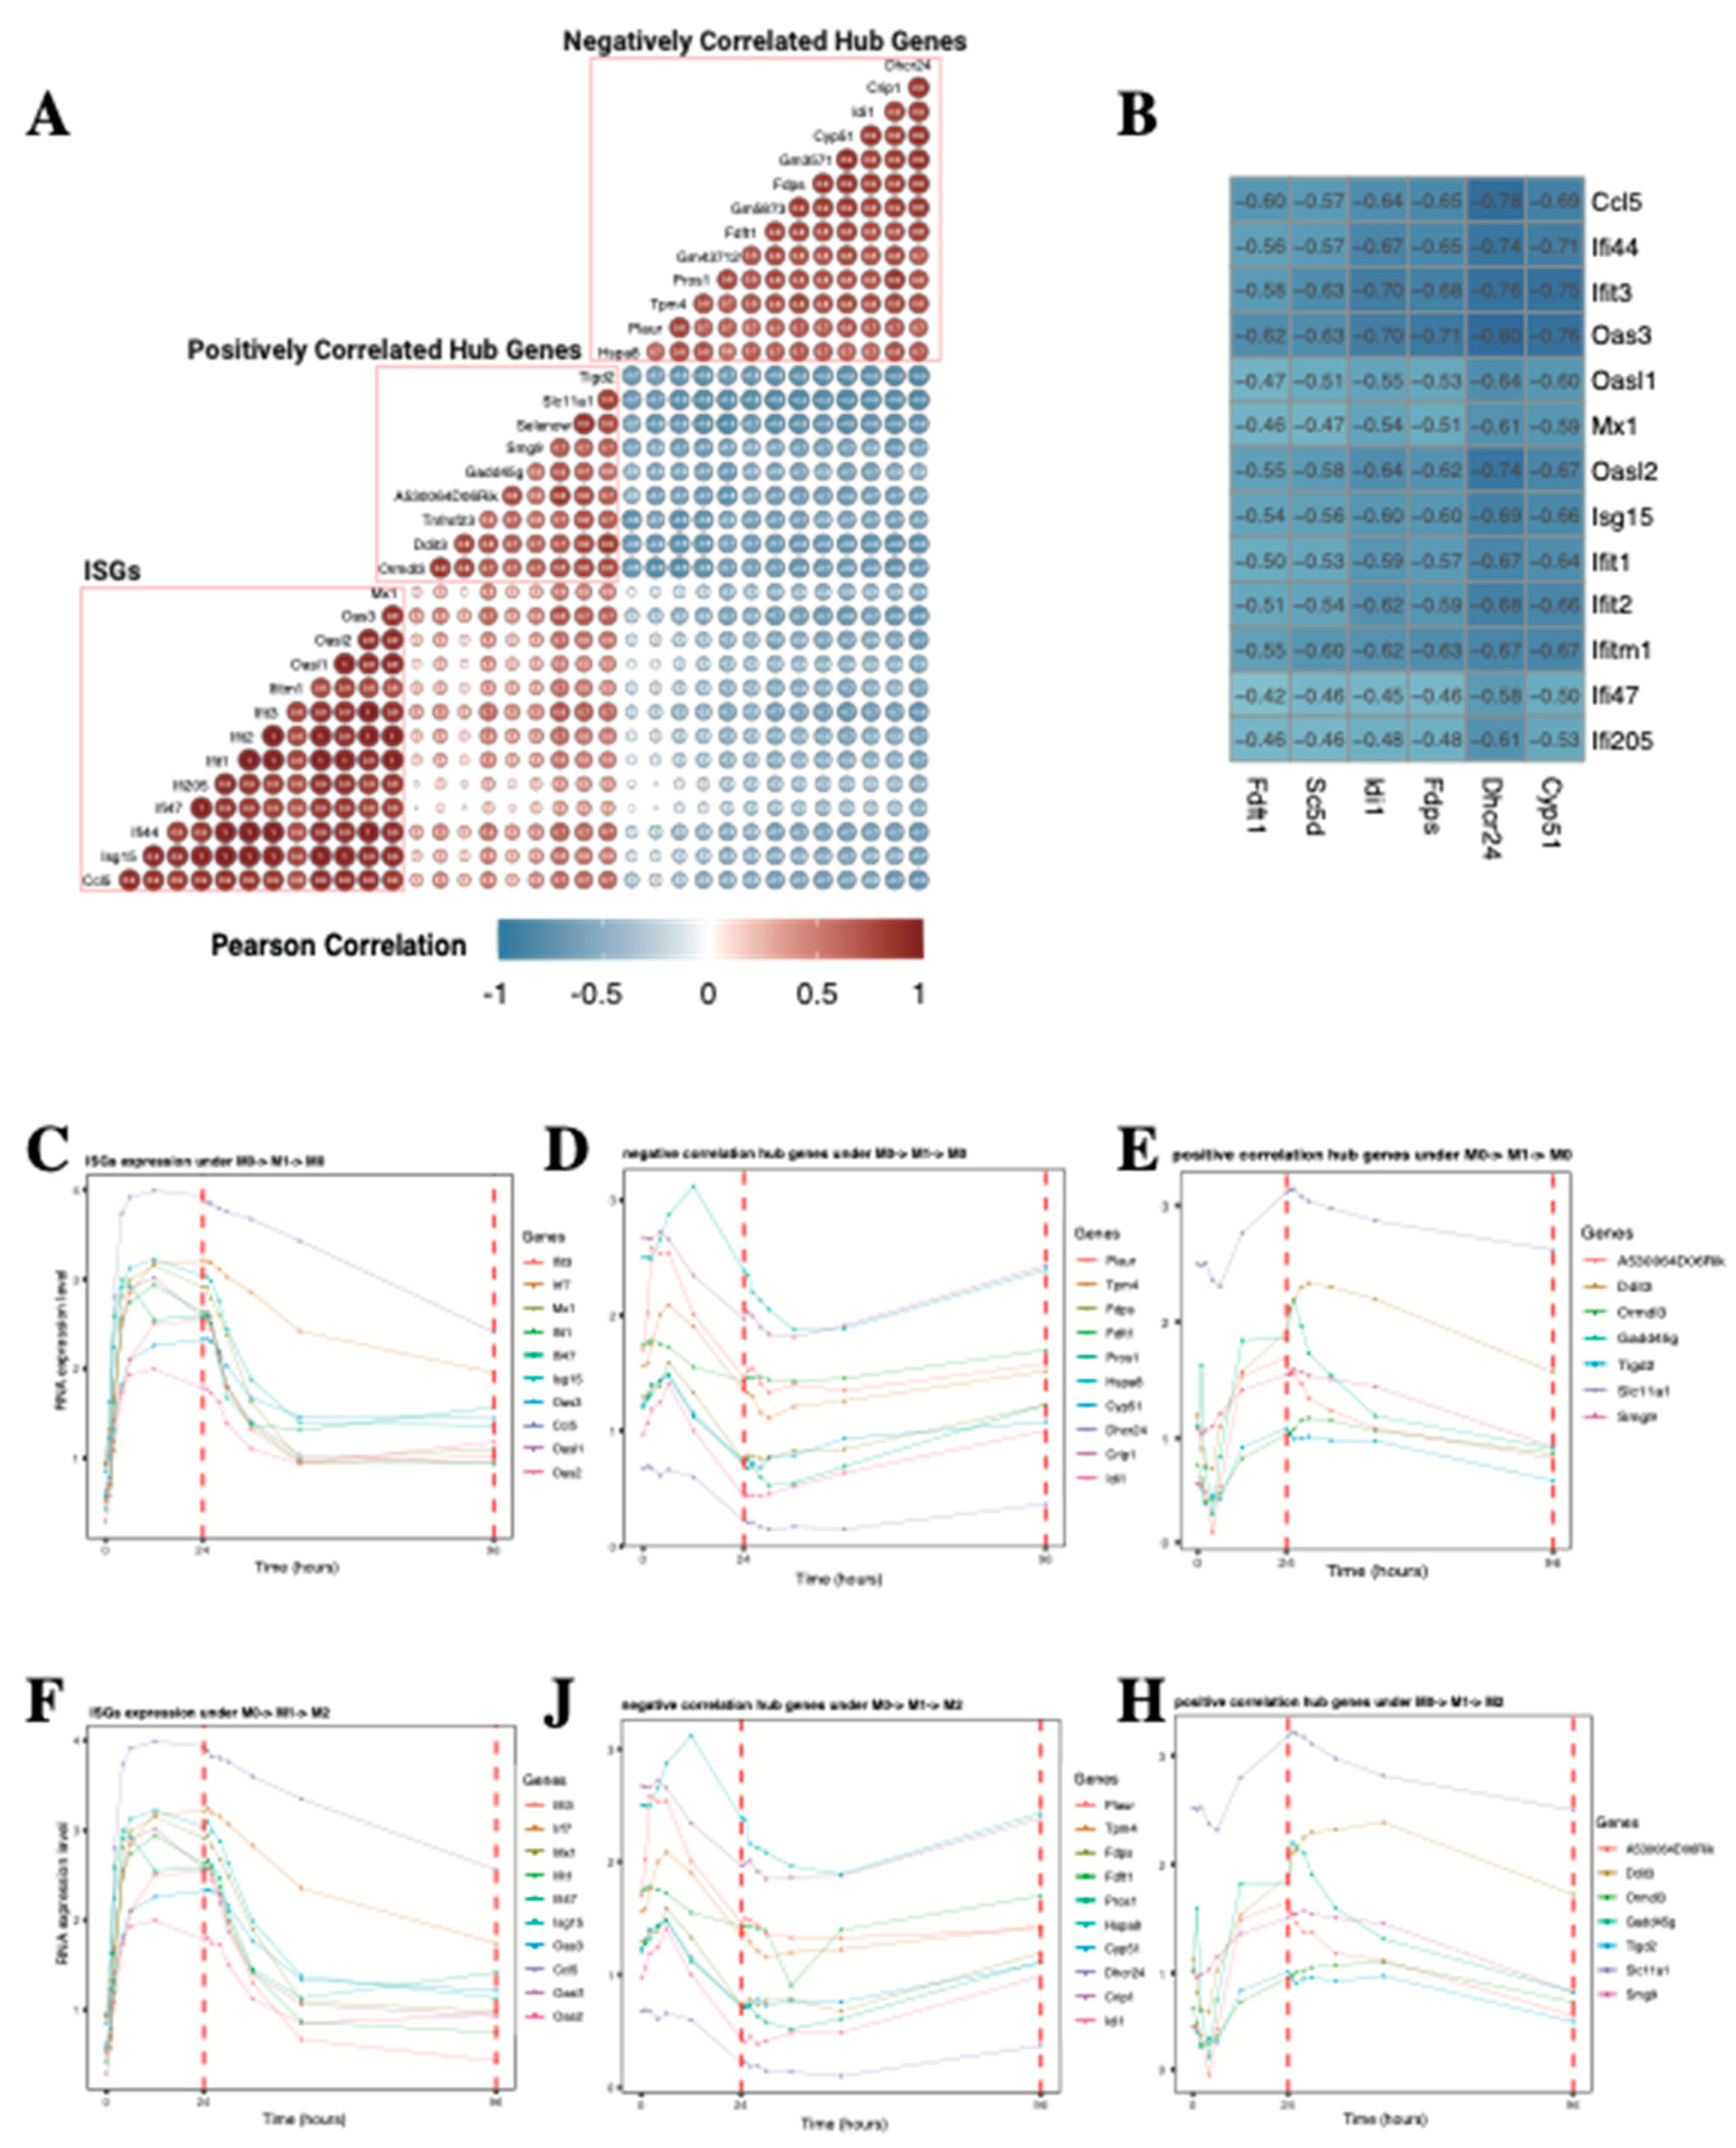
2.1.5. Lipid Biosynthesis-Related Genes Drive the Expression of MEbrowm to Influence Macrophage Function in Lipid Metabolism
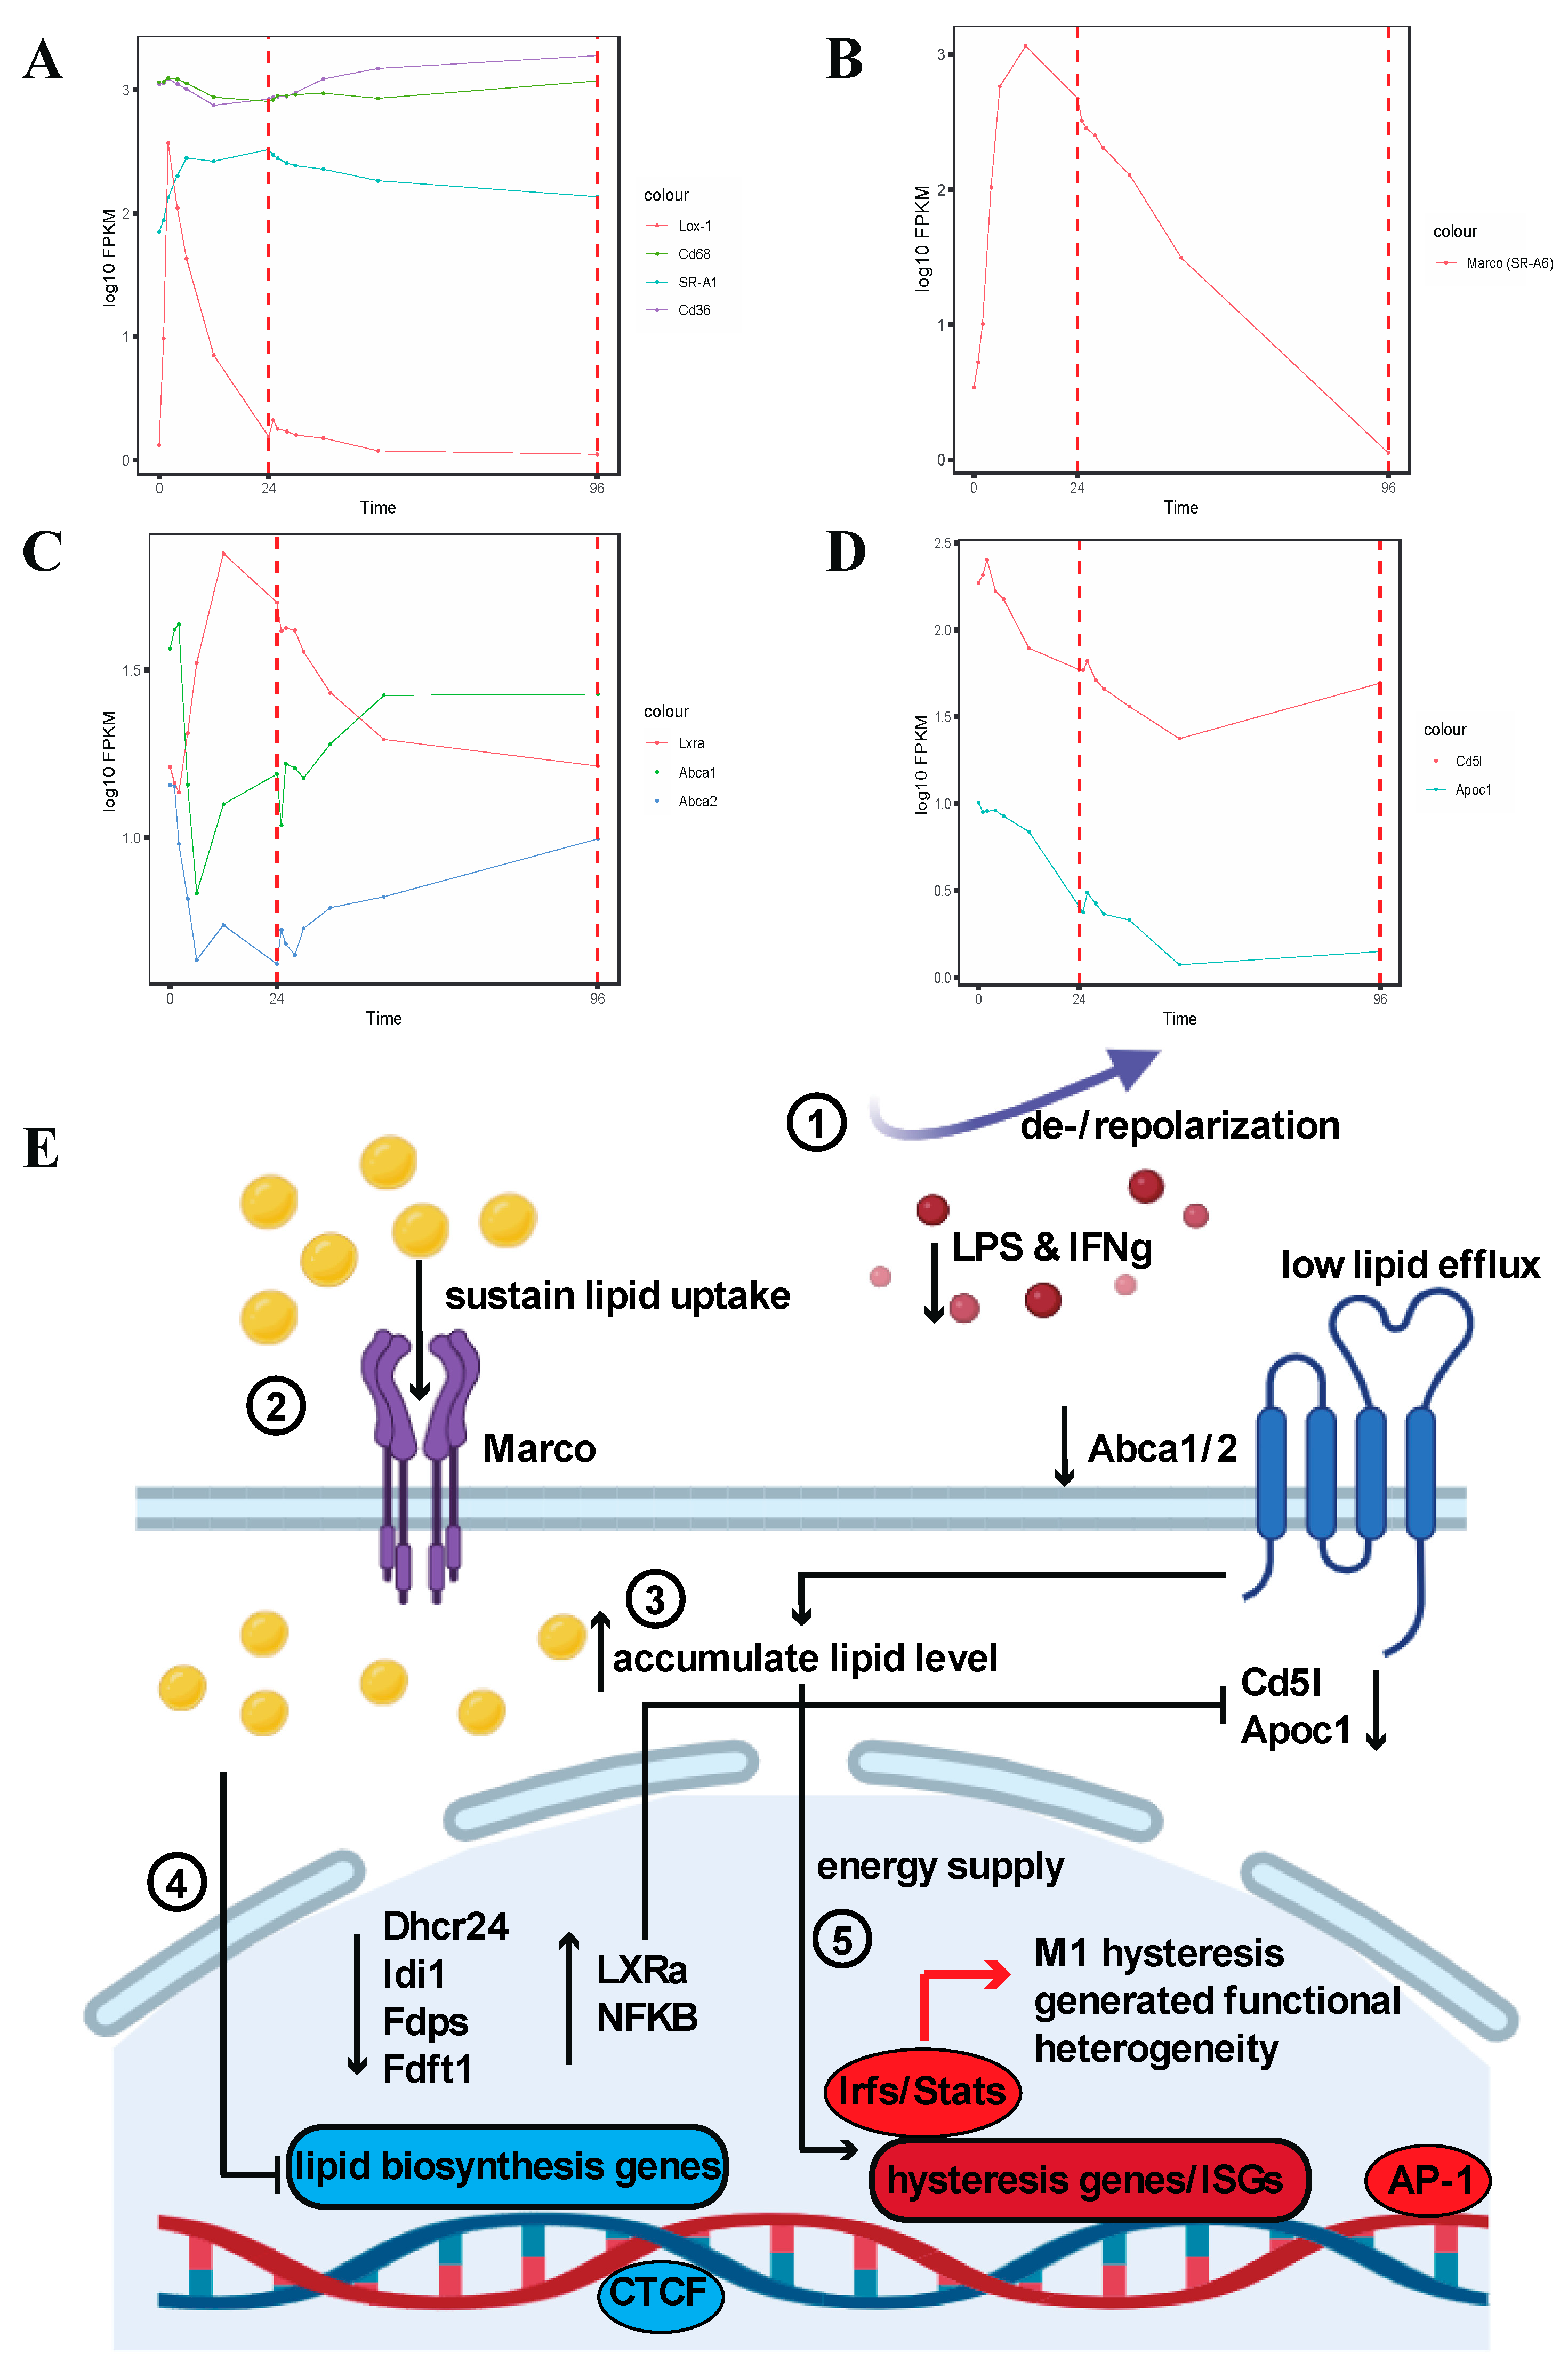
2.1.6. Hysteresis of Marco (SR-A6) and Abca1/Abca2 Results in Elevated Intracellular Lipid Levels and Suppression of Lipid Biosynthesis-Related Genes
3. Discussion
4. Materials and Methods
4.1. Data Preparation
4.2. Sequencing Data Preprocessing
4.3. Batch Effect Correction, Quality Control, and Data Processing
4.4. Weighted Gene Co-Expression Network Analysis (WGCNA)
4.5. Gene Ontology Analysis and Pathway Analysis
4.6. Other Bioinformatics Analysis and Statistical Analysis
5. Conclusions
Supplementary Materials
Author Contributions
Funding
Institutional Review Board Statement
Informed Consent Statement
Data Availability Statement
Acknowledgments
Conflicts of Interest
References
- Davies LC, Rosas M, Jenkins SJ, Liao C-T, Scurr MJ, Brombacher F, et al. Distinct bone marrow-derived and tissue-resident macrophage lineages proliferate at key stages during inflammation. Nat Commun. 2013;4:1886. [CrossRef]
- Martinez FO, Gordon S. The M1 and M2 paradigm of macrophage activation: time for reassessment. F1000Prime Rep. 2014;6:13. [CrossRef]
- Sica A, Mantovani A. Macrophage plasticity and polarization: in vivo veritas. J Clin Invest. 2012;122:787–95. [CrossRef]
- Ivashkiv LB. Epigenetic regulation of macrophage polarization and function. Trends Immunol. 2013;34:216–23. [CrossRef]
- Ando M, Ito M, Srirat T, Kondo T, Yoshimura A. Memory T cell, exhaustion, and tumor immunity. Immunol Med. 2020;43:1–9.
- Liu Q, Sun Z, Chen L. Memory T cells: strategies for optimizing tumor immunotherapy. Protein Cell. 2020;11:549–64. [CrossRef]
- Seifert M, Küppers R. Human memory B cells. Leukemia. 2016;30:2283–92.
- Bekkering S, Domínguez-Andrés J, Joosten LAB, Riksen NP, Netea MG. Trained Immunity: Reprogramming Innate Immunity in Health and Disease. Annu Rev Immunol. 2021;39:667–93. [CrossRef]
- Zhang Y, Yang W, Kumagai Y, Loza M, Zhang W, Park S-J, et al. Multi-omics computational analysis unveils the involvement of AP-1 and CTCF in hysteresis of chromatin states during macrophage polarization. Frontiers in Immunology. 2023;14. [CrossRef]
- Jeljeli M, Riccio LGC, Doridot L, Chêne C, Nicco C, Chouzenoux S, et al. Trained immunity modulates inflammation-induced fibrosis. Nat Commun. 2019;10:5670. [CrossRef]
- Van Belleghem JD, Bollyky PL. Macrophages and innate immune memory against Staphylococcus skin infections. Proceedings of the National Academy of Sciences. 2018;115:11865–7. [CrossRef]
- Weavers H, Evans IR, Martin P, Wood W. Corpse Engulfment Generates a Molecular Memory that Primes the Macrophage Inflammatory Response. Cell. 2016;165:1658–71. [CrossRef]
- Xing Z, Afkhami S, Bavananthasivam J, Fritz DK, D’Agostino MR, Vaseghi-Shanjani M, et al. Innate immune memory of tissue-resident macrophages and trained innate immunity: Re-vamping vaccine concept and strategies. J Leukoc Biol. 2020;108:825–34. [CrossRef]
- Netea MG, Joosten LAB. Trained Immunity and Local Innate Immune Memory in the Lung. Cell. 2018;175:1463–5. [CrossRef]
- Vuscan P, Kischkel B, Joosten LAB, Netea MG. Trained immunity: General and emerging concepts. Immunol Rev. 2024. [CrossRef]
- Hardy TM, Tollefsbol TO. Epigenetic diet: impact on the epigenome and cancer. Epigenomics. 2011;3:503–18. [CrossRef]
- Donohoe DR, Bultman SJ. Metaboloepigenetics: interrelationships between energy metabolism and epigenetic control of gene expression. J Cell Physiol. 2012;227:3169–77. [CrossRef]
- Hata M, Andriessen EMMA, Hata M, Diaz-Marin R, Fournier F, Crespo-Garcia S, et al. Past history of obesity triggers persistent epigenetic changes in innate immunity and exacerbates neuroinflammation. Science. 2023;379:45–62. [CrossRef]
- Willemsen L, Chen H-J, van Roomen CPAA, Griffith GR, Siebeler R, Neele AE, et al. Monocyte and Macrophage Lipid Accumulation Results in Down-Regulated Type-I Interferon Responses. Front Cardiovasc Med. 2022;9:829877. [CrossRef]
- Vogel A, Brunner JS, Hajto A, Sharif O, Schabbauer G. Lipid scavenging macrophages and inflammation. Biochimica et Biophysica Acta (BBA) - Molecular and Cell Biology of Lipids. 2022;1867:159066.
- Liu SX, Gustafson HH, Jackson DL, Pun SH, Trapnell C. Trajectory analysis quantifies transcriptional plasticity during macrophage polarization. Sci Rep. 2020;10:12273. [CrossRef]
- Liebergall SR, Angdisen J, Chan SH, Chang Y, Osborne TF, Koeppel AF, et al. Inflammation Triggers Liver X Receptor-Dependent Lipogenesis. Mol Cell Biol. 2020;40:e00364-19.
- Chen X, Xiao C, Liu Y, Li Q, Cheng Y, Li S, et al. HUB genes transcriptionally regulate lipid metabolism in alveolar type II cells under LPS stimulation. Heliyon. 2023;9:e19437. [CrossRef]
- Gao S, Soares F, Wang S, Wong CC, Chen H, Yang Z, et al. CRISPR screens identify cholesterol biosynthesis as a therapeutic target on stemness and drug resistance of colon cancer. Oncogene. 2021;40:6601–13. [CrossRef]
- Porter TD, Banerjee S, Stolarczyk EI, Zou L. Suppression of Cytochrome P450 Reductase (POR) Expression in Hepatoma Cells Replicates the Hepatic Lipidosis Observed in Hepatic POR-Null Mice. Drug Metab Dispos. 2011;39:966–73. [CrossRef]
- Sugawara T, Fujimoto Y, Ishibashi T. Molecular cloning and structural analysis of human sterol C5 desaturase. Biochim Biophys Acta. 2001;1533:277–84. [CrossRef]
- Remmerie A, Scott CL. Macrophages and lipid metabolism. Cell Immunol. 2018;330:27–42. [CrossRef]
- Taban Q, Mumtaz PT, Masoodi KZ, Haq E, Ahmad SM. Scavenger receptors in host defense: from functional aspects to mode of action. Cell Communication and Signaling. 2022;20:2. [CrossRef]
- Masetti M, Carriero R, Portale F, Marelli G, Morina N, Pandini M, et al. Lipid-loaded tumor-associated macrophages sustain tumor growth and invasiveness in prostate cancer. Journal of Experimental Medicine. 2021;219:e20210564. [CrossRef]
- Sukhorukov VN, Khotina VA, Chegodaev YS, Ivanova E, Sobenin IA, Orekhov AN. Lipid Metabolism in Macrophages: Focus on Atherosclerosis. Biomedicines. 2020;8:262. [CrossRef]
- Rayner KJ, Suárez Y, Dávalos A, Parathath S, Fitzgerald ML, Tamehiro N, et al. MiR-33 contributes to the regulation of cholesterol homeostasis. Science. 2010;328:1570–3. [CrossRef]
- Najafi-Shoushtari SH, Kristo F, Li Y, Shioda T, Cohen DE, Gerszten RE, et al. MicroRNA-33 and the SREBP host genes cooperate to control cholesterol homeostasis. Science. 2010;328:1566–9. [CrossRef]
- Calpe-Berdiel L, Zhao Y, de Graauw M, Ye D, van Santbrink PJ, Mommaas AM, et al. Macrophage ABCA2 deletion modulates intracellular cholesterol deposition, affects macrophage apoptosis, and decreases early atherosclerosis in LDL receptor knockout mice. Atherosclerosis. 2012;223:332–41. [CrossRef]
- Fuior EV, Gafencu AV. Apolipoprotein C1: Its Pleiotropic Effects in Lipid Metabolism and Beyond. Int J Mol Sci. 2019;20:5939. [CrossRef]
- Yan J, Horng T. Lipid Metabolism in Regulation of Macrophage Functions. Trends Cell Biol. 2020;30:979–89. [CrossRef]
- Infantino V, Iacobazzi V, Palmieri F, Menga A. ATP-citrate lyase is essential for macrophage inflammatory response. Biochem Biophys Res Commun. 2013;440:105–11.
- Horton JD, Goldstein JL, Brown MS. SREBPs: activators of the complete program of cholesterol and fatty acid synthesis in the liver. J Clin Invest. 2002;109:1125–31.
- Shimano H, Sato R. SREBP-regulated lipid metabolism: convergent physiology — divergent pathophysiology. Nat Rev Endocrinol. 2017;13:710–30. [CrossRef]
- Cell-intrinsic lysosomal lipolysis is essential for alternative activation of macrophages | Nature Immunology. https://www.nature.com/articles/ni.2956. Accessed 28 Jun 2024.
- Schlager S, Vujic N, Korbelius M, Duta-Mare M, Dorow J, Leopold C, et al. Lysosomal lipid hydrolysis provides substrates for lipid mediator synthesis in murine macrophages. Oncotarget. 2017;8:40037–51. [CrossRef]
- Zhang H. Lysosomal acid lipase and lipid metabolism: new mechanisms, new questions, and new therapies. Curr Opin Lipidol. 2018;29:218–23. [CrossRef]
- Houten SM, Wanders RJA. A general introduction to the biochemistry of mitochondrial fatty acid β-oxidation. J Inherit Metab Dis. 2010;33:469–77. [CrossRef]
- The biophysics and cell biology of lipid droplets | Nature Reviews Molecular Cell Biology. https://www.nature.com/articles/nrm3699. Accessed 28 Jun 2024.
- JCI - Regulation and mechanisms of macrophage cholesterol efflux. https://www.jci.org/articles/view/16391. Accessed 28 Jun 2024.
- Hsieh W-Y, Zhou QD, York AG, Williams KJ, Scumpia PO, Kronenberger EB, et al. Toll-Like Receptors Induce Signal-Specific Reprogramming of the Macrophage Lipidome. Cell Metab. 2020;32:128-143.e5. [CrossRef]
- Oishi Y, Spann NJ, Link VM, Muse ED, Strid T, Edillor C, et al. SREBP1 Contributes to Resolution of Pro-inflammatory TLR4 Signaling by Reprogramming Fatty Acid Metabolism. Cell Metab. 2017;25:412–27. [CrossRef]
- Blanc M, Hsieh WY, Robertson KA, Watterson S, Shui G, Lacaze P, et al. Host defense against viral infection involves interferon mediated down-regulation of sterol biosynthesis. PLoS Biol. 2011;9:e1000598. [CrossRef]
- Funk CD. Prostaglandins and leukotrienes: advances in eicosanoid biology. Science. 2001;294:1871–5. [CrossRef]
- van der Laan LJ, Döpp EA, Haworth R, Pikkarainen T, Kangas M, Elomaa O, et al. Regulation and functional involvement of macrophage scavenger receptor MARCO in clearance of bacteria in vivo. J Immunol. 1999;162:939–47. [CrossRef]
- Palecanda A, Paulauskis J, Al-Mutairi E, Imrich A, Qin G, Suzuki H, et al. Role of the Scavenger Receptor MARCO in Alveolar Macrophage Binding of Unopsonized Environmental Particles. J Exp Med. 1999;189:1497–506. [CrossRef]
- The Scavenger Receptor MARCO Modulates TLR-Induced Responses in Dendritic Cells | PLOS ONE. https://journals.plos.org/plosone/article?id=10.1371/journal.pone.0104148. Accessed 28 Jun 2024.
- Scavenger receptor A mediates H2O2 production and suppression of IL-12 release in murine macrophages - Józefowski - 2004 - Journal of Leukocyte Biology - Wiley Online Library. https://jlb.onlinelibrary.wiley.com/doi/full/10.1189/jlb.0504270. Accessed 28 Jun 2024.
- Dorrington MG, Roche AM, Chauvin SE, Tu Z, Mossman KL, Weiser JN, et al. MARCO is required for TLR2- and Nod2-mediated responses to Streptococcus pneumoniae and clearance of pneumococcal colonization in the murine nasopharynx. J Immunol. 2013;190:250–8. [CrossRef]
- Su P, Wang Q, Bi E, Ma X, Liu L, Yang M, et al. Enhanced Lipid Accumulation and Metabolism Are Required for the Differentiation and Activation of Tumor-Associated Macrophages. Cancer Res. 2020;80:1438–50. [CrossRef]
- Eisinger S, Sarhan D, Boura VF, Ibarlucea-Benitez I, Tyystjärvi S, Oliynyk G, et al. Targeting a scavenger receptor on tumor-associated macrophages activates tumor cell killing by natural killer cells. Proc Natl Acad Sci U S A. 2020;117:32005–16. [CrossRef]
- La Fleur L, Botling J, He F, Pelicano C, Zhou C, He C, et al. Targeting MARCO and IL37R on Immunosuppressive Macrophages in Lung Cancer Blocks Regulatory T Cells and Supports Cytotoxic Lymphocyte Function. Cancer Res. 2021;81:956–67.
- Dong Y, D’Mello C, Pinsky W, Lozinski BM, Kaushik DK, Ghorbani S, et al. Oxidized phosphatidylcholines found in multiple sclerosis lesions mediate neurodegeneration and are neutralized by microglia. Nat Neurosci. 2021;24:489–503. [CrossRef]
- Sun X, Seidman JS, Zhao P, Troutman TD, Spann NJ, Que X, et al. Neutralization of Oxidized Phospholipids Ameliorates Non-alcoholic Steatohepatitis. Cell Metab. 2020;31:189-206.e8. [CrossRef]
- Serbulea V, Upchurch CM, Schappe MS, Voigt P, DeWeese DE, Desai BN, et al. Macrophage phenotype and bioenergetics are controlled by oxidized phospholipids identified in lean and obese adipose tissue. Proc Natl Acad Sci U S A. 2018;115:E6254–63. [CrossRef]
Disclaimer/Publisher’s Note: The statements, opinions and data contained in all publications are solely those of the individual author(s) and contributor(s) and not of MDPI and/or the editor(s). MDPI and/or the editor(s) disclaim responsibility for any injury to people or property resulting from any ideas, methods, instructions or products referred to in the content. |
© 2024 by the authors. Licensee MDPI, Basel, Switzerland. This article is an open access article distributed under the terms and conditions of the Creative Commons Attribution (CC BY) license (http://creativecommons.org/licenses/by/4.0/).


