1. Introduction
Self-driving and autonomous vehicles have been a focal point of development for some time. Waymo, the company spun out of Google’s self-driving car research, launched a commercial autonomous level 4 taxi service by late 2018, along with parallel competitive solutions [
1]. Autonomous level 4 means otherwise full autonomous operations, but the driver should always be able to take over the driving. Even today, nofully autonomous level 5 system is in operative use, but various deployments of autonomous operative vehicle with monitoring person onboard exists. Autonomous driving in motorways is widely studied and tested as well and the special demands towards the road infrastructure have been evaluated in [
2].
As there are multiple solutions for autonomous driving, there are also many solutions for sensor systems in autonomous traffic. Positioning systems along with vehicle radars, LiDARs, sonar systems and traditional video cameras are the most common approaches for sensors, along with the combined solutions [
3,
4]. Radar and LiDAR sensors operation in different weather conditions has been estimated in [
5]. Autonomous driving operation in winter conditions, when road surface markings etc. are not visible, has been studied and evaluated [
6].
Current technical solutions for autonomous vehicles already provide precision and reliability sufficient for many applications. However, there are still many limitations considering the detection of varying weather conditions and in the use of real-time observations of the environment. Autonomous vehicles are sensing the environment in an entirely different way than a human driver and are critically more sensitive in some special weather conditions. Thus, autonomous vehicles require specially tailored road weather forecasts for situations where the sensors are not expected to work properly. There is a need for a real-time dynamic information environment that includes the adaptation to weather conditions. Moreover, incorporating knowledge about road traffic accidents is pertinent because vehicular crashes pose a fundamental safety risk, especially during the winter months when roads tend to accumulate with snow and ice. Having a deeper understanding of how the probability of a road incident varies with certain meteorological and spatiotemporal factors is useful to increase awareness of weather-related road safety.
In the 6G Visible (Seeing Invisible as a 6G infrastructure Service for Autonomous Vehicles) project [
7], Finnish Meteorological Institute (FMI) and University of Oulu are joining forces to improve intelligent traffic road weather services for autonomous driving. The key objective of the project is dynamic real-time modelling of the environment and obstacle detection for autonomous or semi-autonomous vehicles, but FMI will focus especially on road weather related goals in this context. How could we enrich the road weather services to better aid autonomous driving? Could we consider the different sensors’ vulnerability for certain weather conditions, and provide more accurate warnings? And could we use autonomous vehicle’s sensors as a source of road weather information?
To answer these research questions, we are focusing in this paper on the following issues; 1) Evaluation of LiDAR and camera sensors used in autonomous vehicles to estimate their sensitivity to different weather conditions and especially seeking vulnerabilities, 2) evaluation of V2X communication systems used in Intelligent traffic to find best ways to provide autonomous vehicles with up-to-date weather warnings and collect data of road conditions, 3) road weather forecast adjusted for autonomous vehicles and enriched with short-term nowcasting forecast to offer enhanced safety, 4) route-planning with knowledge modelling based on weather and other parameters, and finally 5) predictive modelling of weather-related crashes for building statistical background for the services. These issues are considered in the following chapters of this paper, finally supplemented with evaluation of methods and concluding remarks.
2. Evaluation of autonomous vehicle LiDAR- and camera sensor sensitivity to harsh weather
To estimate the autonomous vehicle sensor sensitivity for harsh weather, we have composed a fixed measurement system for our winter testing track. Sod5G test track is in Sodankylä, Northern Finland, and is used as a testing and development environment for intelligent traffic, autonomous vehicles, and road weather services [
8]. The test track is supplemented with a multitude of communication systems, e.g., vehicle-to-vehicle(V2V) radios for ITS-G5 and C-V2X, WiFi6 hotspot and 5G test networks. All FMIs special instrumentation and knowledge related to intelligent traffic road weather services are employed as part of the 6GVisible development architecture.
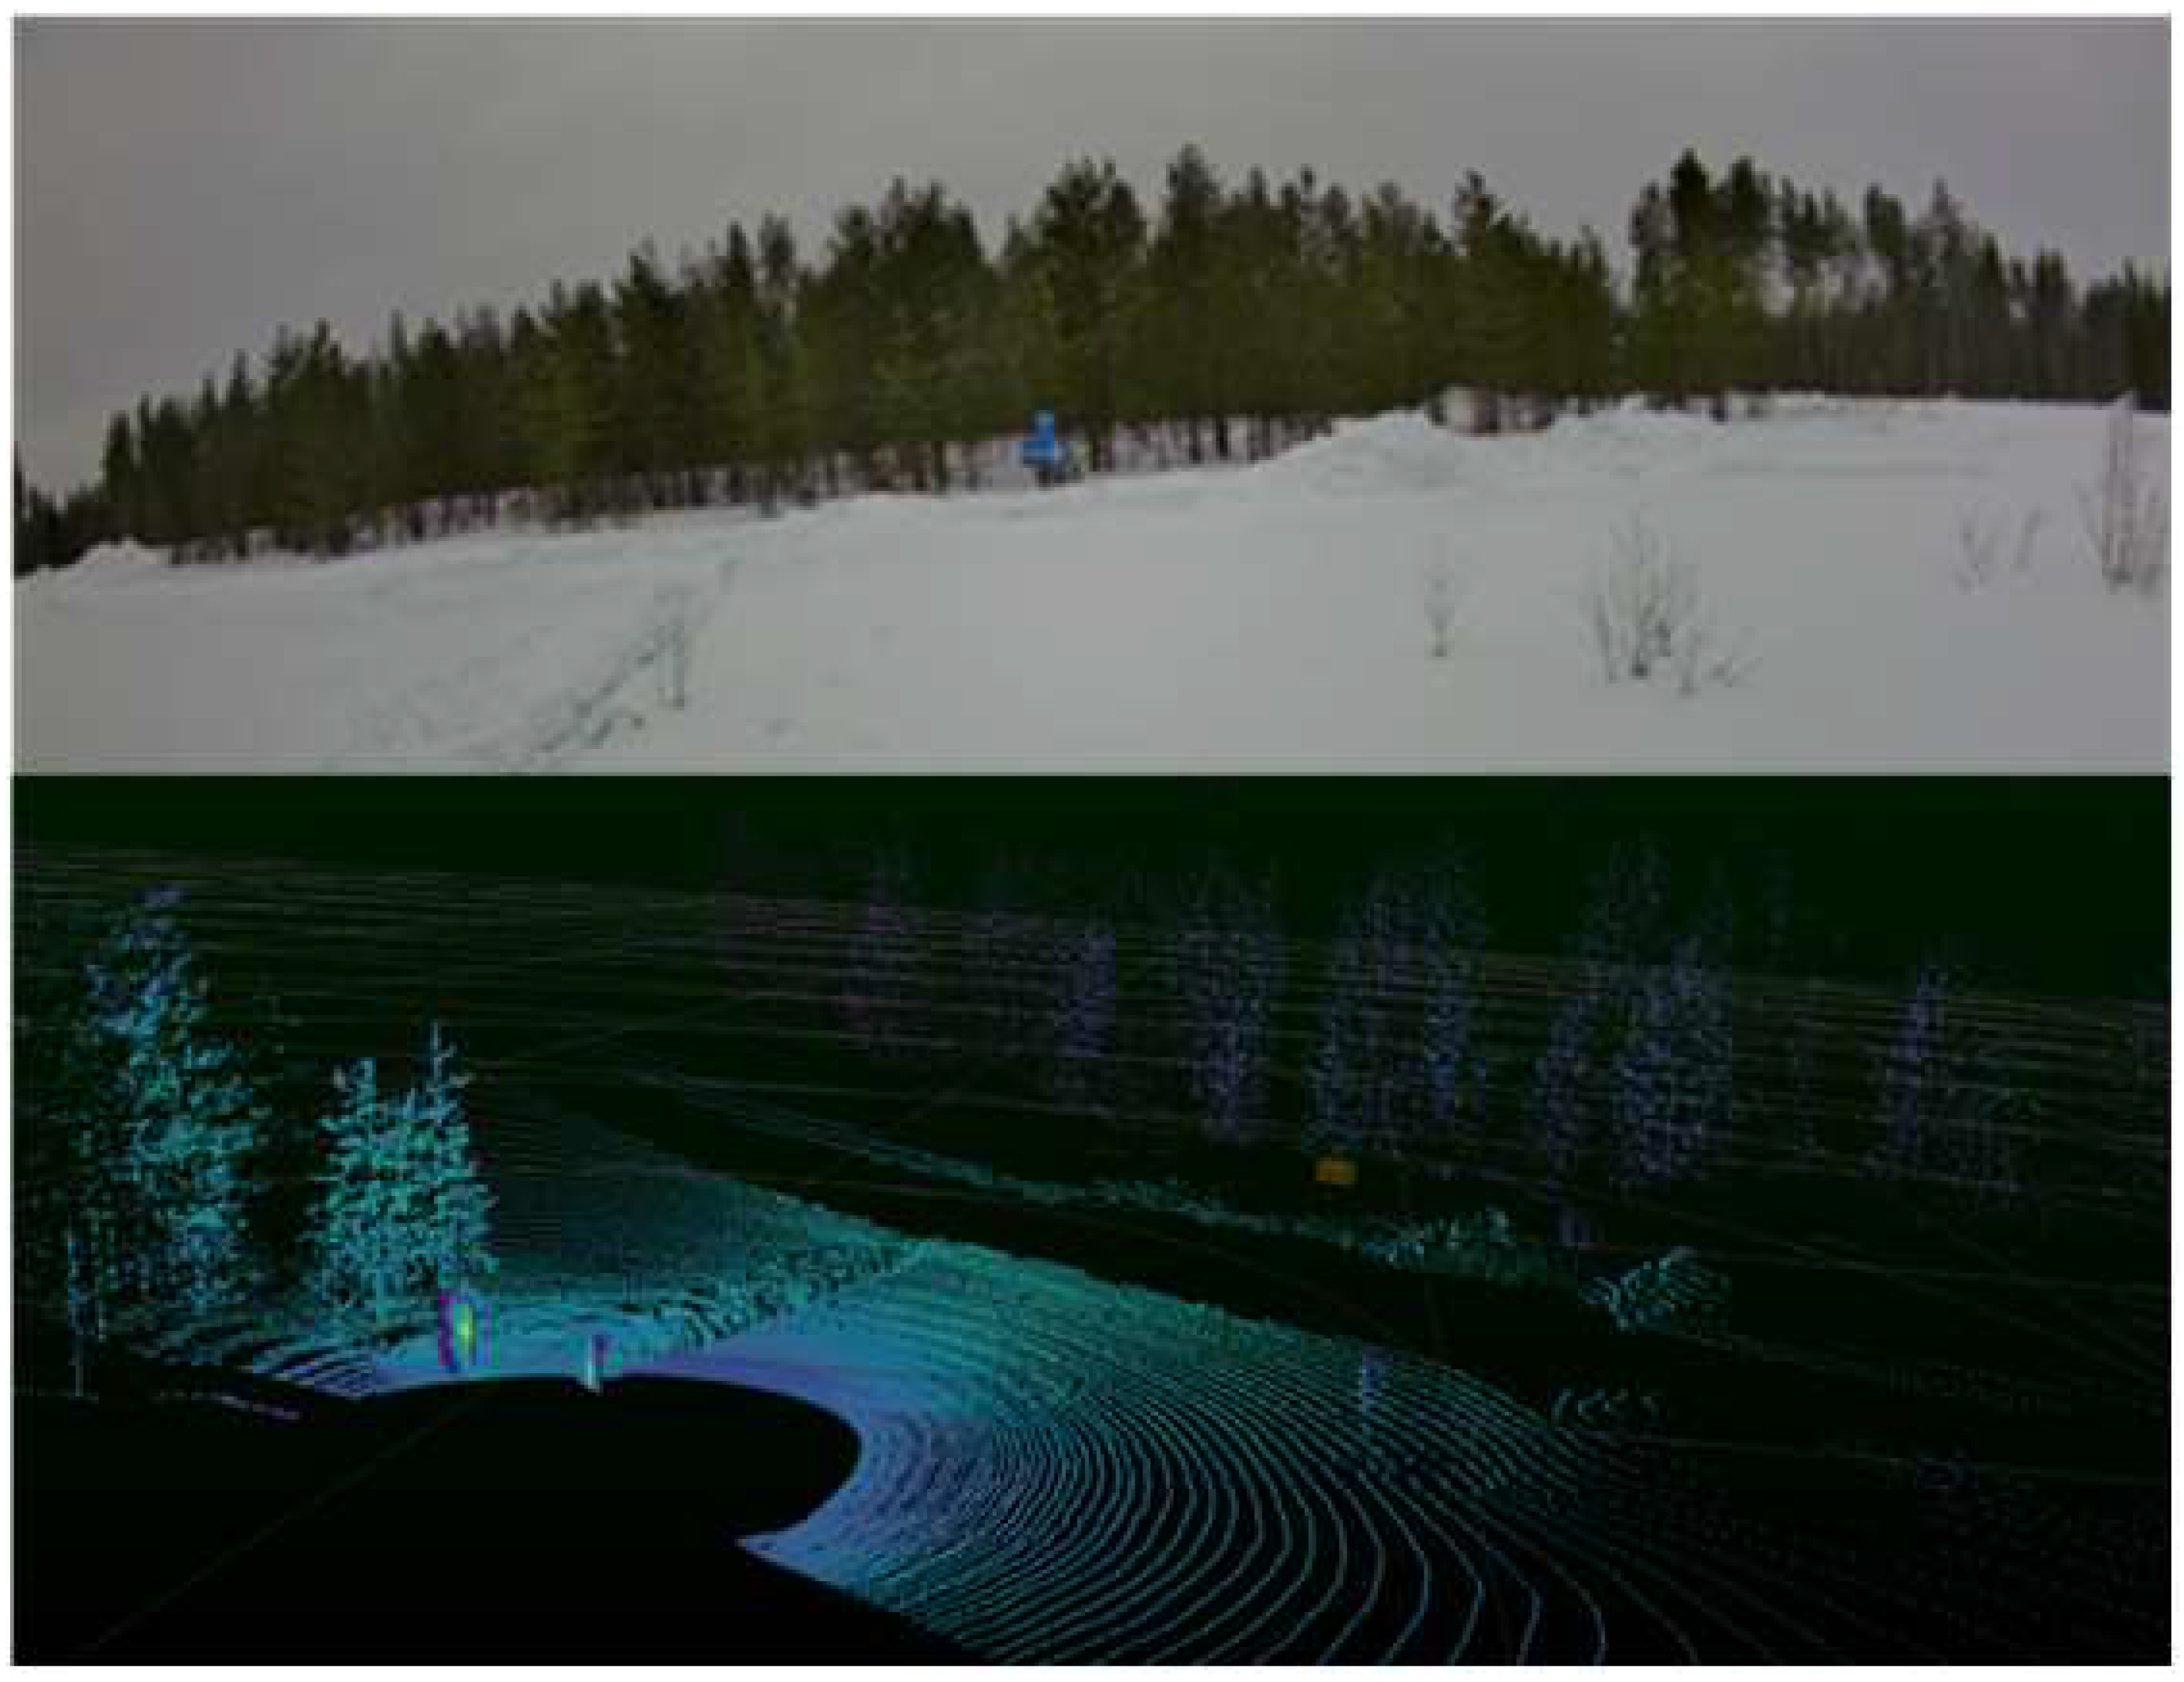
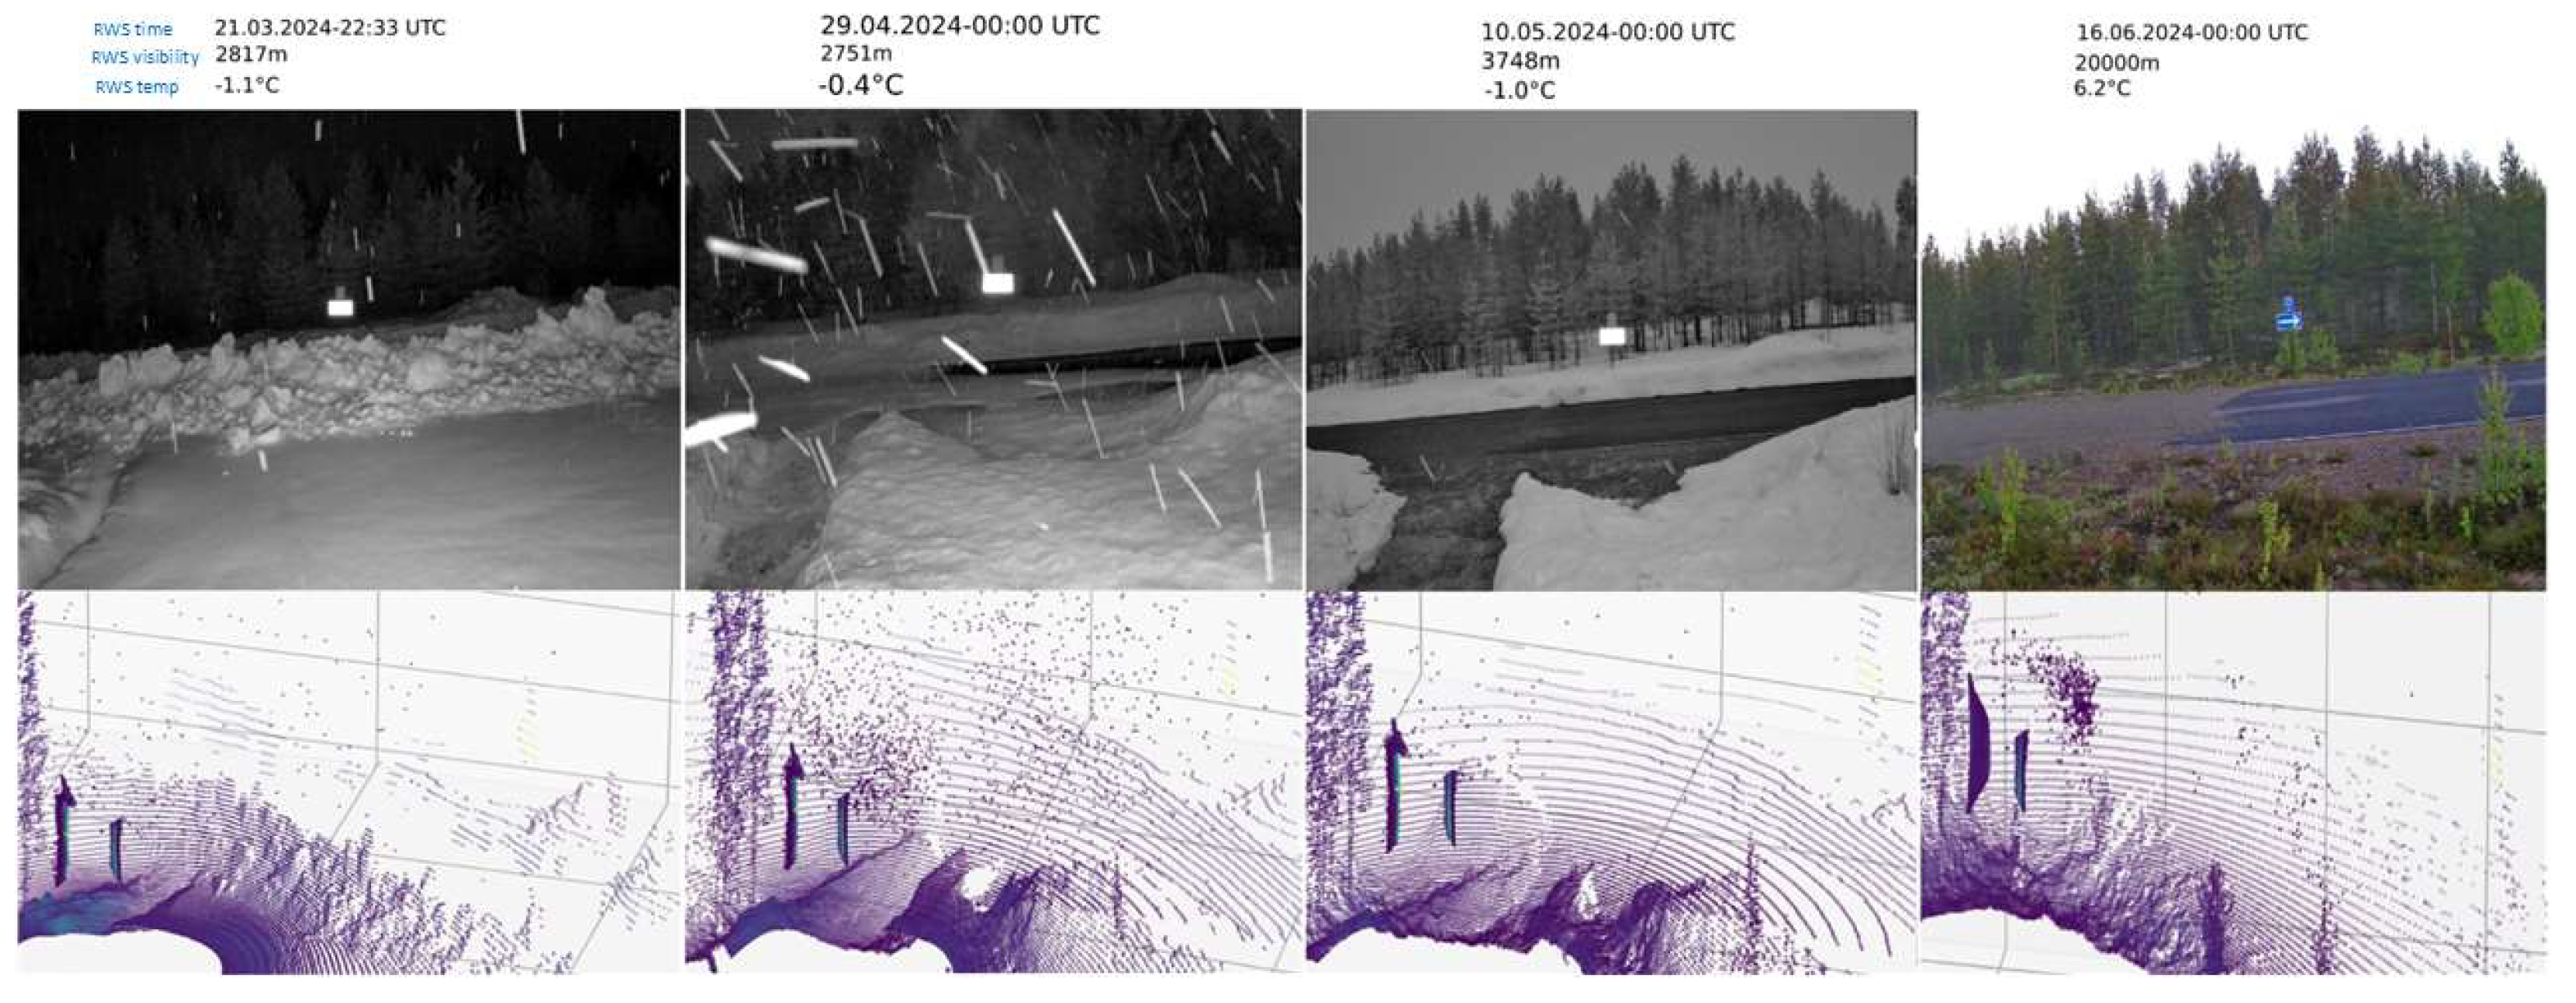
In this work, autonomous vehicles’ sensor systems are being evaluated for their sensitivity to harsh weather conditions. For this purpose, FMI is employing a self-built small autonomous robotic platform to study the instrumentation used on autonomous vehicles. However, to evaluate the weather dependency, we are interested to have measurements in fixed environment, with all environmental parameters known. Special focus will be on LiDAR- and camera sensor instruments and vehicular radar systems are part of the future work. We are studying LiDAR vulnerability to weather in the tasks of 1) road sign recognition, 2) identifying snow cover, and 3) snowbank height monitoring. LiDAR and camera are installed into the wall of the hub (
Figure 1) and monitor the same location on the track, where two traffic signs, snow cover and snowbank height are all visible. Parallel images from LiDAR and camera are viewed in
Figure 2. in their test locations. The LiDAR is also used in our miniature autonomous vehicle platform to perform on-board measurements and 3D-mapping of the test track, but the weather vulnerability evaluation is based on fixed installation only.
The measurement system collects the parallel measurements from LiDAR and camera in one minute interval, into the temporary storage. Whenever the weather conditions turn challenging for some imaging system, the images in case will be saved to permanent storage. In addition, the road weather information collected from test track road weather stations and local road weather forecast information are stored as well [
8]. As soon as we have comprehensive material from different harsh conditions, we can conduct the estimation of vulnerability of our sensors.
3. Communication with autonomous traffic
To export sensor data from autonomous traffic (as well as any other vehicles) and import real-time weather and safety-related warnings (presented later in this paper), proper communication system available within the whole traffic entity is required. Cellular communication with 5G is nowadays commonly available in Finland and therefore considered as the primary approach. However, there are also methodologies especially designed for short range traffic entity communication, called V2X (Vehicle-to-Everything) communication based on European ITS-G5, inherited from IEEE 802.11p standard and C-V2X [
9]. These approaches can also be used in parallel as a hybrid communication system. Such kind of approaches within the delivery of road weather and safety services has been studied in [
10].
Naturally, general Wi-Fi communication can be employed, as well as satellite communication, at least as a complementary communication system for 5G cellular networking. All these communication systems are available in Sod5G test track, evaluated as candidate communication entities for the 6G Visible operational entity. The primary approach is to rely on commercially available communication system with adequate coverage within the public road network, which is in our case 5G cellular networking, with supplemental 4G cellular networking in some (rural) areas where 5G is not available. However, the alternate solutions with ITS-G5 and C-V2X are studied in the test network area, as they present considerable alternative approach if required service availability through specified user density in the public traffic can be achieved.
4. Road weather forecasts and precipitation Nowcasting
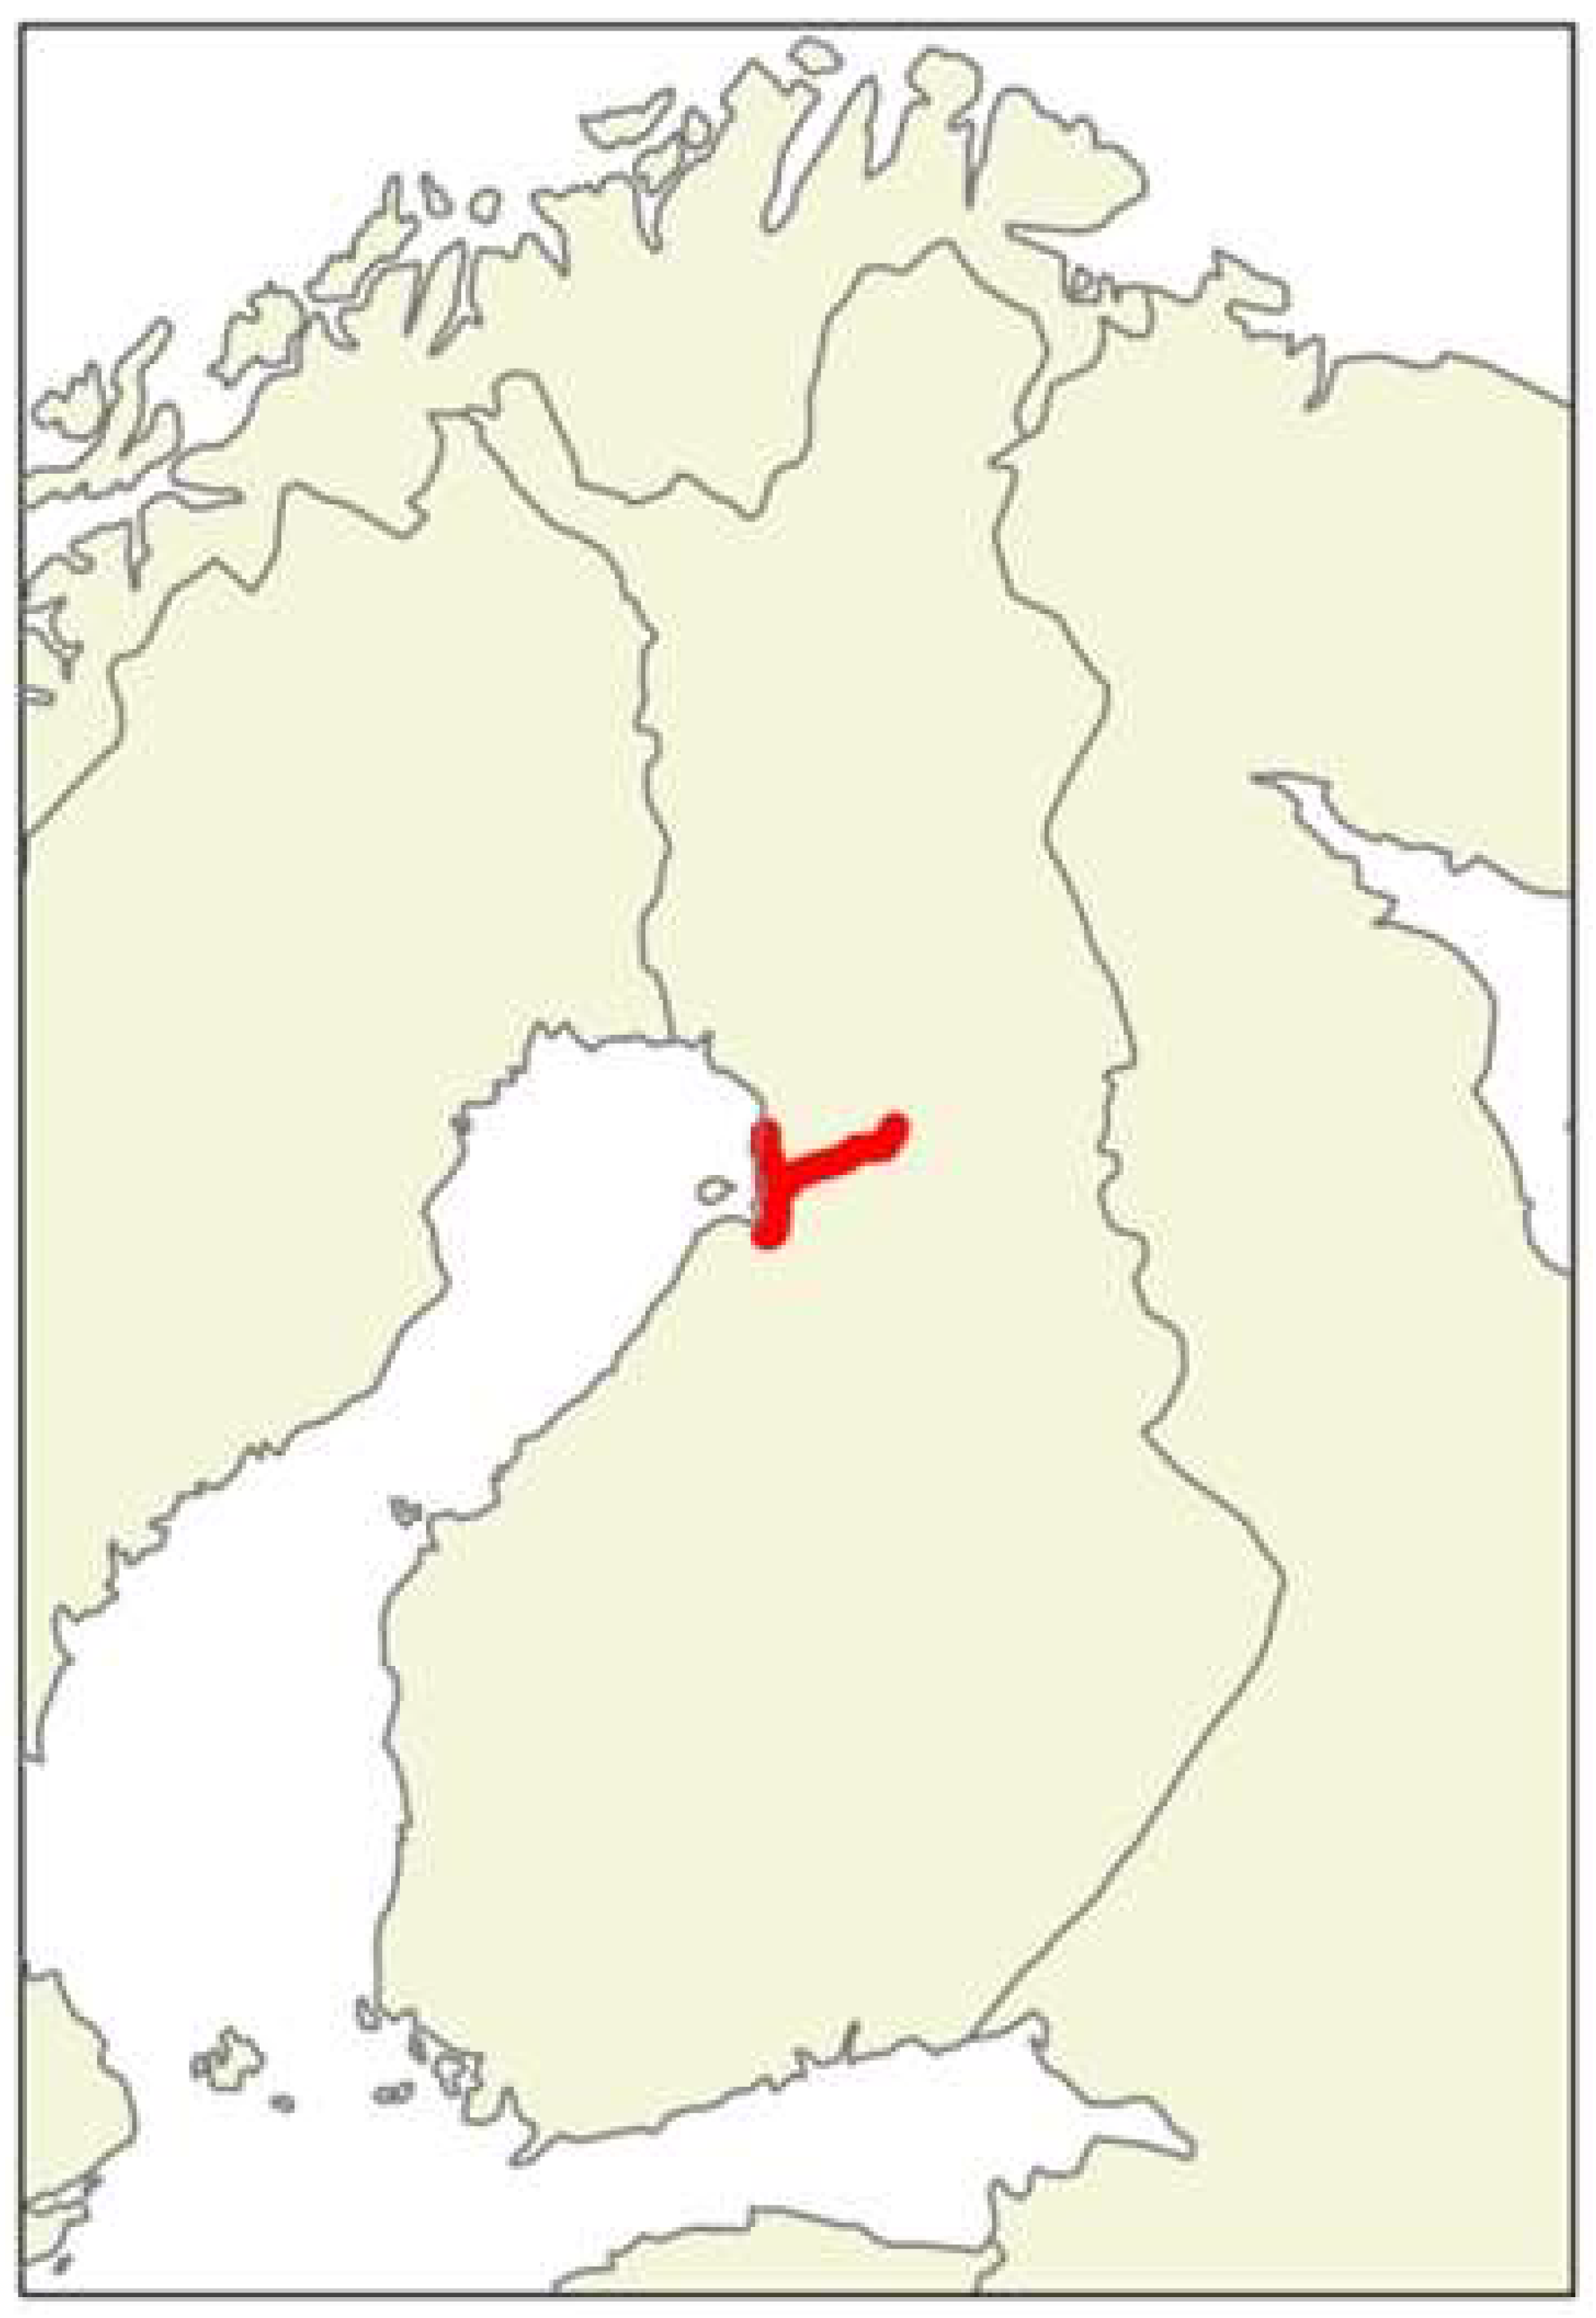
FMI produces road weather forecasts during the project to the Oulu pilot area (
Figure 3). The forecasts are generated with FMI road weather model RoadSurf [
11]. It is one-dimensional heat balance model and forecasts road surface temperature, friction and road condition (wet, icy, snowy…). As input, the road weather model requires atmospheric forecast data from a numerical weather prediction model. Data from MEPS (MetCoOp Ensemble Prediction System) [
12] control member is used as input to the model in this project. The road weather forecast points are in 50 meters intervals along the major roads. The forecasts are updated every hour.
Laser scanning data produced by national land survey of Finland has been used to determine the sky view factors to each forecast point. Sky view factor means the area of the sky that is visible from the road point. Road points on open fields have larger sky view factors than road points surrounded by forests. RoadSurf uses sky view factor to adjust the incoming and outgoing radiation [
13]. In addition, laser scanning data was used to determine local horizon angles to each direction in the forecast points. These were used by the shadowing algorithm in the road weather model. If the local horizon angle is larger than the sun elevation angle at the direction of the sun, then the road point is in shadow, and the direct solar radiation is set zero in the model.
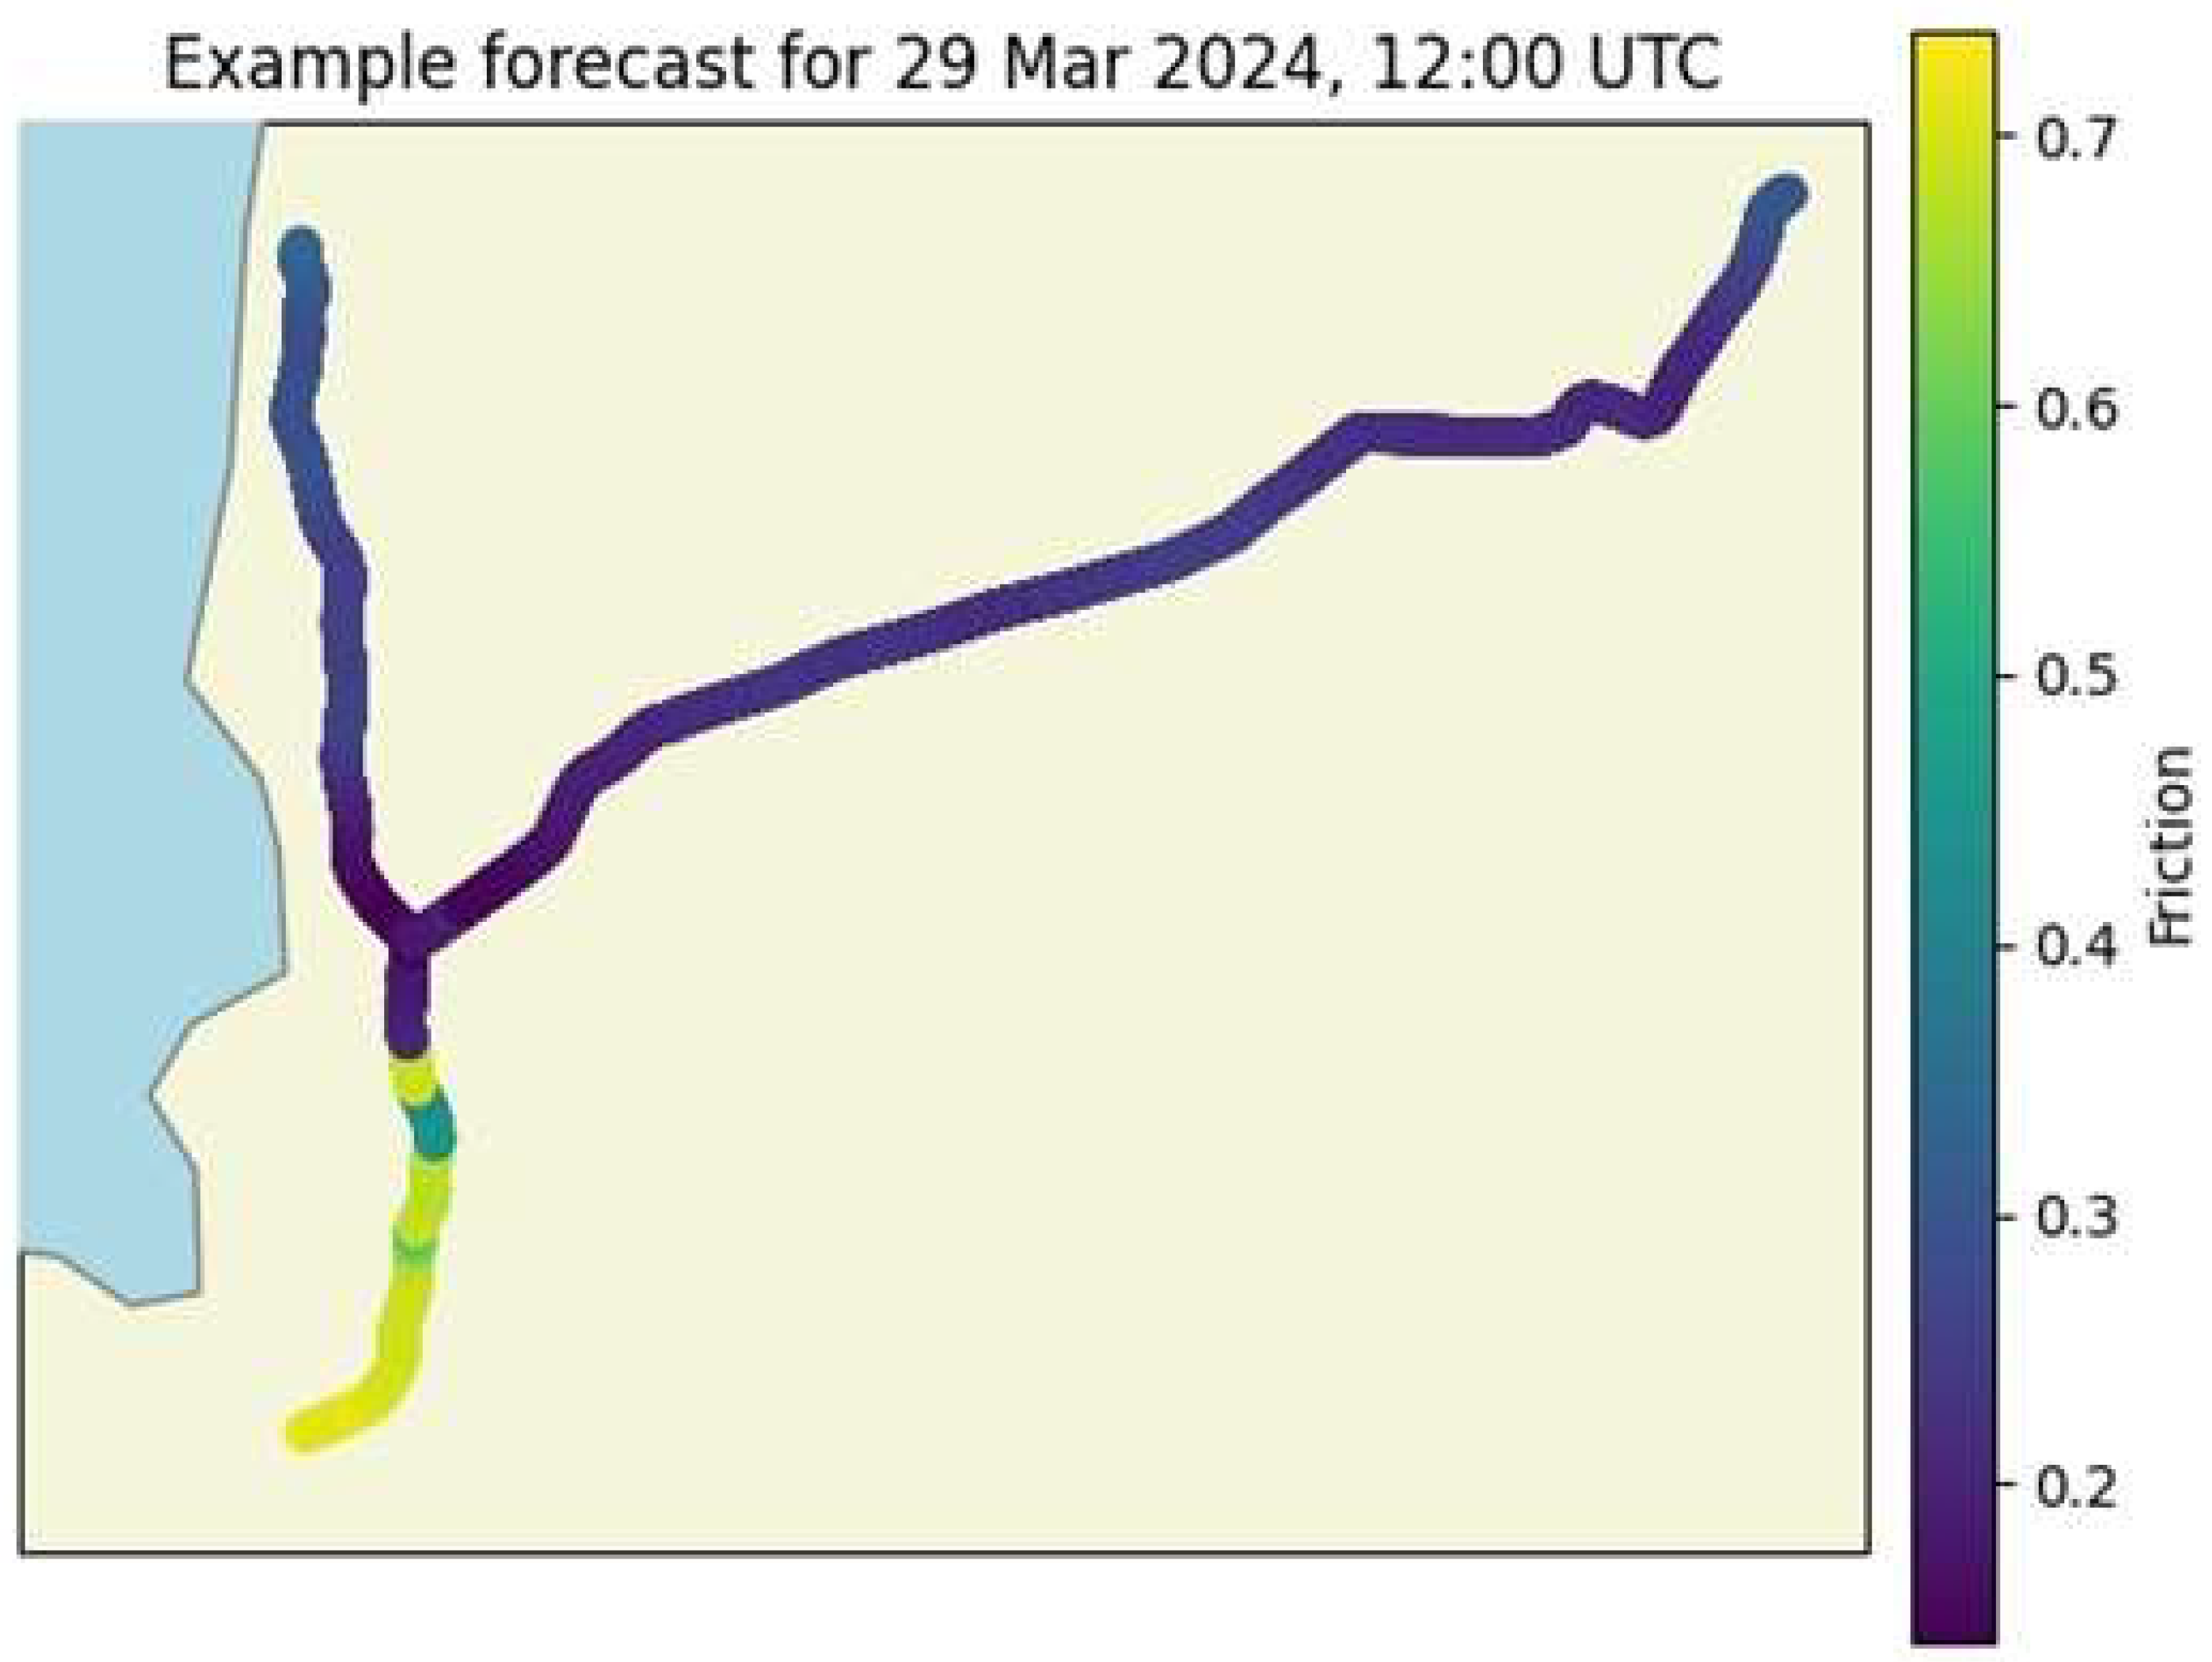
Figure 4 shows example friction forecast to the pilot area on 29 March 2024. Snow on the road causes low friction values except in the southern part of the area.
Future work in this project includes developing road weather forecast products to meet the needs of different autonomous vehicles. Some autonomous vehicles might rely mostly on camera data, while others can have LiDARs and/or RADARs installed. Weather affects different instruments in different ways [
14], so the forecasts should be tailored for each type of autonomous vehicle. The forecasts products will use an estimate of the vehicles’ ability to detect the surroundings in certain weather conditions together with road friction to give suggestions of lowering speed and whether a human should take over.
Precipitation nowcasts (concept better known as Nowcasting) are produced by Pysteps, which is an open-source Python library [
15]. The nowcasts are based on extrapolation of radar observations along the motion field estimated from past observations.
Nowcasting based on radar extrapolation provides better results than NWP based models on short time ranges, that is, 0-6 hours. Nowcasting models can produce reliable predictions of large scale stratiform rainfall up to 6 hours and convective rainfall up to the next 30-60 minutes. However, forecasting snowfall by using weather radars is still a challenging task. It is important to provide accurate information about precipitation for autonomous vehicles, as snowfall and heavy rainfall affect road conditions and the sensors’ ability to observe the surroundings. In this project, we are developing a precipitation nowcasting web application to show results from a radar extrapolation algorithm in the Linnanmaa region in Oulu. The precipitation nowcast will be also given as input data to the road weather model to produce better road condition forecasts.
Figure 5 shows an example of a precipitation Nowcast for southern Finland.
5. Route planning with knowledge modelling
Knowledge graphs (KGs) are knowledge structures that consist of multiple entities and their relations. They are used in many Artificial Intelligence (AI) systems [
16]. Part of the 6GVisible project is to test using knowledge modelling with knowledge graphs for automatic route planning [
7].
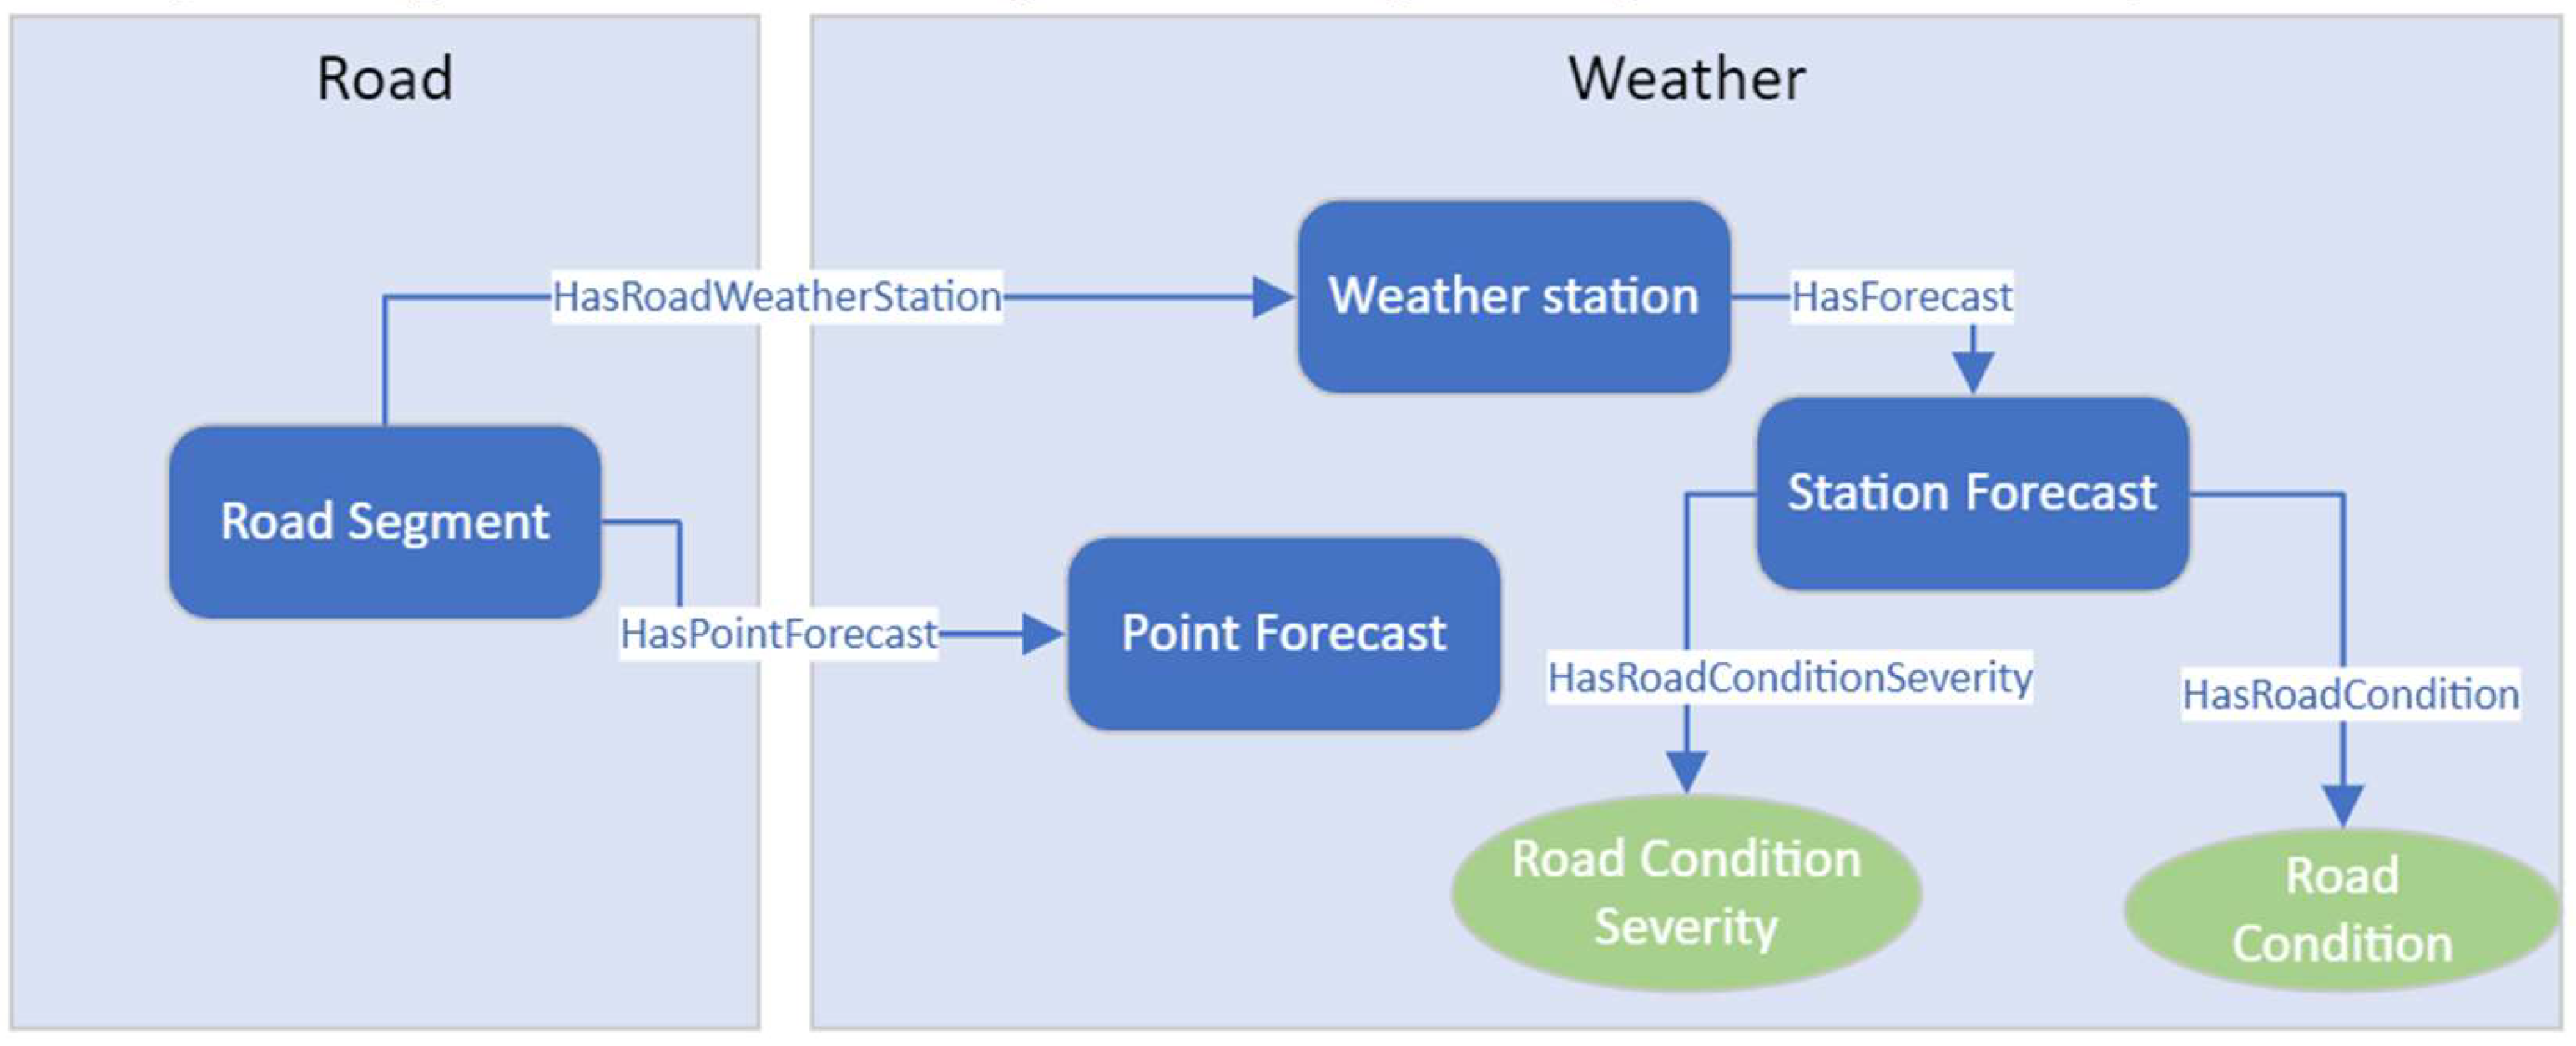
Figure 6 shows a part of an ontology created in the project. Ontologies are semantic data models that define the base for knowledge graphs. In the project, real-time weather and forecast data will be integrated with KGs. In addition, traffic congestion and accident data will be used if possible. The knowledge modelling will be tested in driving scenario where there are three alternative routes, and the system should automatically decide the best route. The routes start at a neighbourhood to the south of Oulu city and end at the Oulu University campus to the north. The distance is about 20 km along the shortest route. The first route goes along the highway across the city, the second route goes through the city centre and the third route bypasses both the city and the highway. There is one road weather station on the city centre route and one on the highway route. Currently, there are forecasts points only along the highway route, but additional forecast points can be added to the other routes. The forecast points on the highway are every 50 meters.
6. Predictive modelling of weather-related crashes
Vehicular crashes present inherent spatial and temporal trends, and the ability to explain crash risk patterns in southwestern Finland has been a key focus in the first stages of this 6G Visible task. The output of road crash modelling allows traffic authorities to implement targeted safety interventions when, and where, needed. By initially developing an explanatory model, we can better grasp the overall crash mechanism and its determinants, which lays the necessary foundation for the subsequent implementation of an optimal route planning in terms of safety.
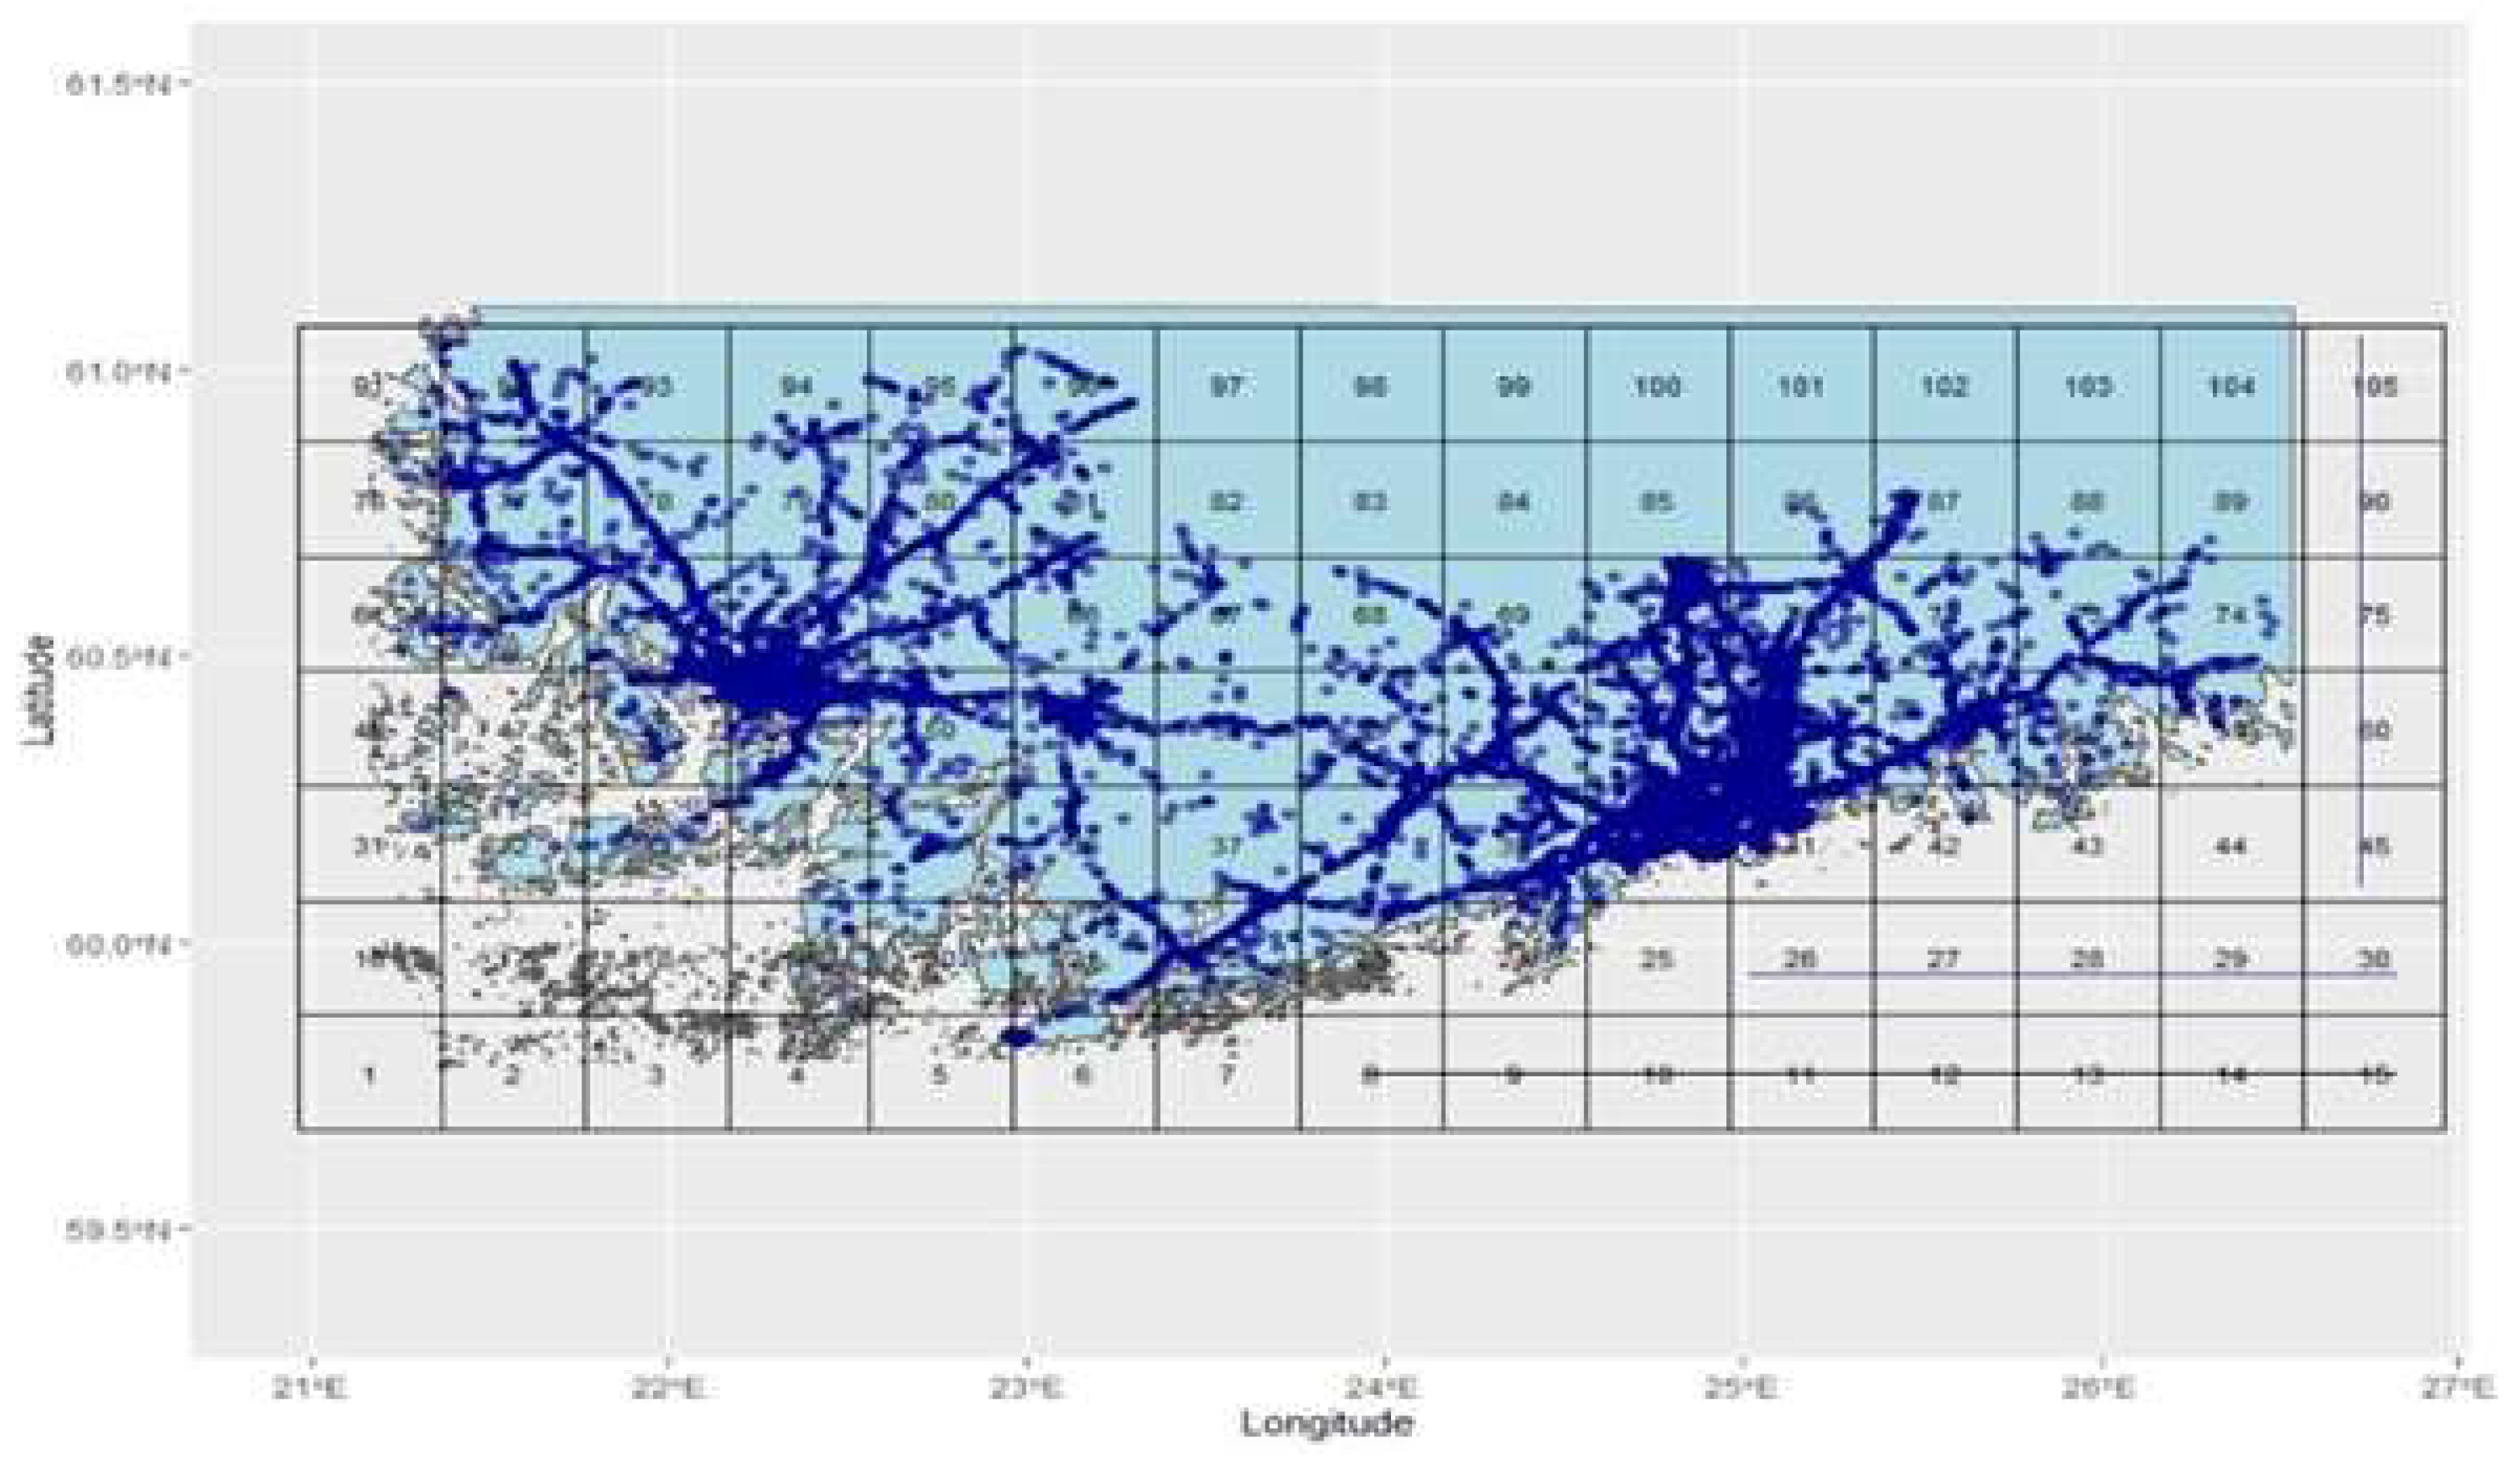
To build the model, crash data are obtained from the Finnish Transport Infrastructure Agency for the years 2017-2021 inclusive, and the model uses forecasted MEPS data as explanatory variables. The timescale of the analysis is at the hourly resolution to account for the heterogeneity in road traffic density that exists throughout a given day. The spatial extent of the study includes the regions of Uusimaa and Varsinais-Suomi, and a grid consisting of smaller spatial cells based on fixed latitude and longitude increments is overlaid on top of these regions to explicitly define the spatial unit, as illustrated in
Figure 7. A spatiotemporal join is then conducted to determine whether a crash has precisely occurred in each cell at a given hour.
A spatiotemporal generalized additive model (GAM) with a logit link function has been used to assign fitted probabilities of a car crash occurring at a combination of hourly and spatial units. GAMs are a powerful modelling tool for spatiotemporal analyses; they can uncover non-linear functional relationships between the predictor variables and the response, and their construction using a rich variety of different spline functions makes them flexible to capture trends in space and time [
17]. The advantage of modelling probabilities is that they have a direct interpretation in terms of the crash risk level.
Henceforth, future directions involve extending this baseline explanatory model into one that can generate predictions within a 24-hour window. A major task when developing this predictive model will involve assessing the accuracy of its predictions. Ultimately, we seek a collaboration in a data-driven decision theory framework between the road user and AI, whereby users can be informed about imminent weather-related driving risks on the road when planning a route between two points. To accomplish this, we will first aggregate the data into larger clusters that represent various combinations of meteorological parameters which are set to fixed and well-defined values to create an overall weather profile. Then, we will integrate the output of the predictive model into the knowledge graph construction, illustrating how the crash risk level depends on different temporal, spatial, and weather characteristics.
7. Results
Due to the early stage of the work, we haven’t been able to evaluate route planning with knowledge modelling, nor the route-planning related precipitation nowcasting web application as its early development stage. Therefore, preliminary tests and evaluation work focuses primarily on vehicle LiDAR- and camera sensor sensitivity to harsh weather and communication measurements with alternative V2X radio systems. The initial results concerning the data analysis and modelling of weather-related road crashes are also briefly presented.
7.1. Weather sensitivity analysis
LiDAR and web camera have been installed into the fixed position in the test track environment, regularly monitoring road area with two traffic signs. Web camera is kept in the same position all the time, while LiDAR instrument is used for occasional vehicle on-board measurements as well. To ensure comparability of measurements, the LiDAR instrument position is carefully adjusted each time plugged in to the measurement system. As the monitoring system has been operative only since spring 2024, we haven’t yet achieved collective results from all kinds of difficult weather conditions. In the
Figure 8, the preliminary comparison of several different conditions is presented. On the top, there is parallel camera and LiDAR images with time stamp and road weather station temperature and visibility measurement. The traffic sign visibility remains good in every camera image and LiDAR image, even in snowing conditions observed on 29.4.2024. Snow depth has not been evaluated, as the measurement started when snow cover already existed. More measurements are required for the complete evaluation.
7.2. V2X communications
The primary communication method between autonomous vehicles and service core of route planning and road weather services in general level and especially in Oulu pilot is assumed to be commercial 4G/5G communication. In our communication tests in Sodankylä test track, viewed in
Figure 9, we have also considered the possibility of delivering the service data with short range vehicular networking (in our case ITS-G5 and C-V2X) along with 5G communication tests. Our objective has been to evaluate the service operability in case of short-range vehicular networking capabilities would be available in the public roads as well, but also to evaluate the performance of different V2X communication methods in our special use cases.
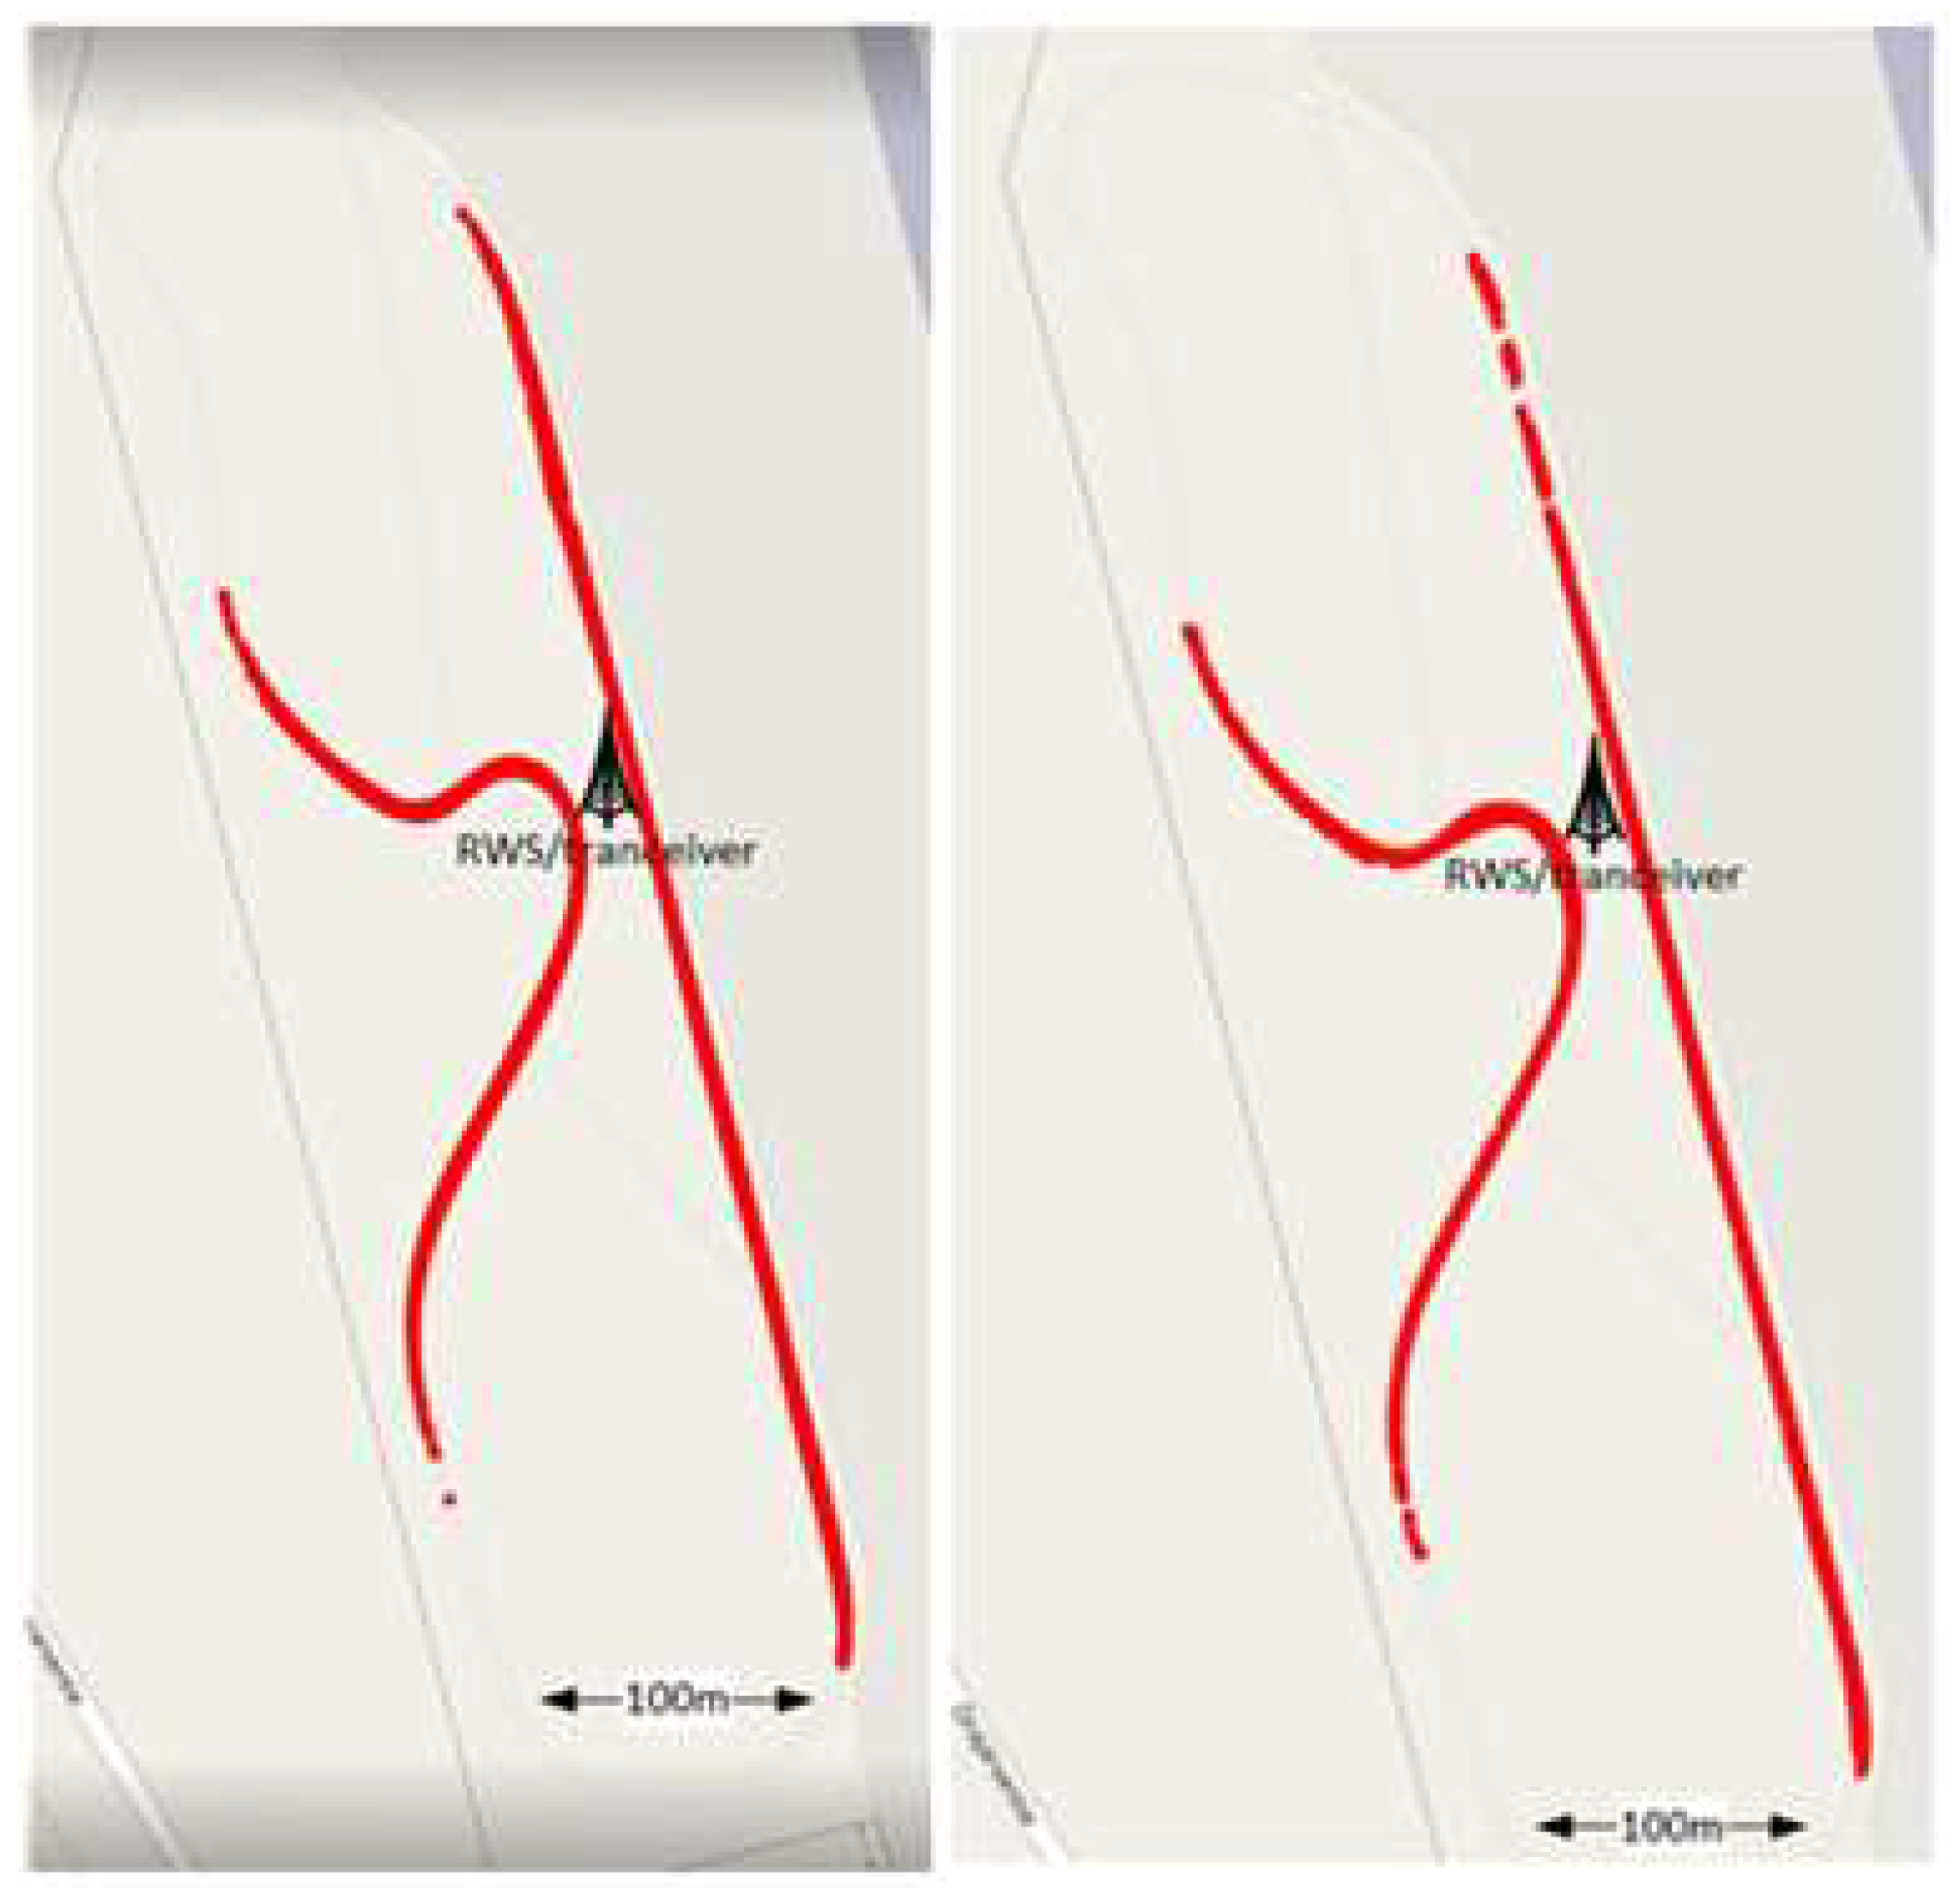
In ITS-G5 and C-V2X communication tests we had the same procedure; (autonomous) vehicle circles the test track and receives simple route and road weather data packet sent from transceiver located in RWS, whenever in the range of transceiver. Naturally, the procedure was the same with 5G measurements, but in this case, communication range is not an issue, as the test network covers the whole test track entirely. The range of communication for both ITS-G5 and C-V2X tests is presented in
Figure 10, consisting of “red dots” indicating single communication point where data packet received, forming continuous red line when lot of overlapping dots from consecutive test laps. There is no difference between the ranges of ITS-G5 and C-V2X. As stated earlier, 5G network has complete coverage throughout the track. In ITS-G5 communication tests we were able to measure both the communication throughput and latency in separate tests. The throughput test consisted of four drive laps, presented as rows in
Table 1 below. The latency test consisted of ten drive laps, presented in
Table 2. In C-V2X communication tests, we could not capture the throughput of communication due to the black box nature of C-V2X entity. By calculating just the number of transmitted packets and their size is not giving fair estimate of the throughput, as the exact size of transmitted C-V2X packet is not known. Therefore, we were only able to measure the latency in C-V2X communication, presented in
Table 3. Finally, 5G communication test results are shown in
Table 4, both throughput and latency presented in this single table as laps were not separated in this test (due to the continuous connectivity separating laps is not relevant).
In our tests ITS-G5 communication achieved average 4,24 Mbps throughput, compared to 6,16 Mbps in 5G. In 5G test network the uplink bandwidth is limited to 10 Mbps, explaining the relatively low throughput (compared to 5G theoretical capacity). The communication capacity is well enough to properly deliver route and road weather data even with ITS-G5, as well as with C-V2X (even if we could not define accurate throughput values). The latency tests presented 5,49 ms average latency for ITS-G5, 29,11 ms latency for C-V2X and 35,11 ms with 5G communication. 5G test network suffers from the structure of our test network, the core being in VTT facilities in 350 km single-direction distance and behind several routers, causing serious additional round-trip delays. Having network core (or edge) in our test track facilities is expected to drop the latency down to the same level as ITS-G5.
As stated above, the capacity of all evaluated networks is adequate for the service data delivery of route planning and road weather services. However, if we consider the idea of collecting continuous LiDAR and/or camera from autonomous vehicles, generally every communication system fails to provide enough capacity. Even our relatively simple LiDAR imaging presented in
Figure 2 requires 18 Mbps uplink rate to collect from a vehicle or roadside.
And we are talking about just one vehicle. Such kind of data collection from a traffic entity of multiple vehicles can only be realized by 1) packing/pre-processing the data in vehicle before sending or 2) capturing only burst of data e.g., when passing road weather station entity with high-capacity local networking.
7.3. Predictive modelling of weather-related crashes
So far, the model in its basic form has corroborated the well-established results from the existing literature [
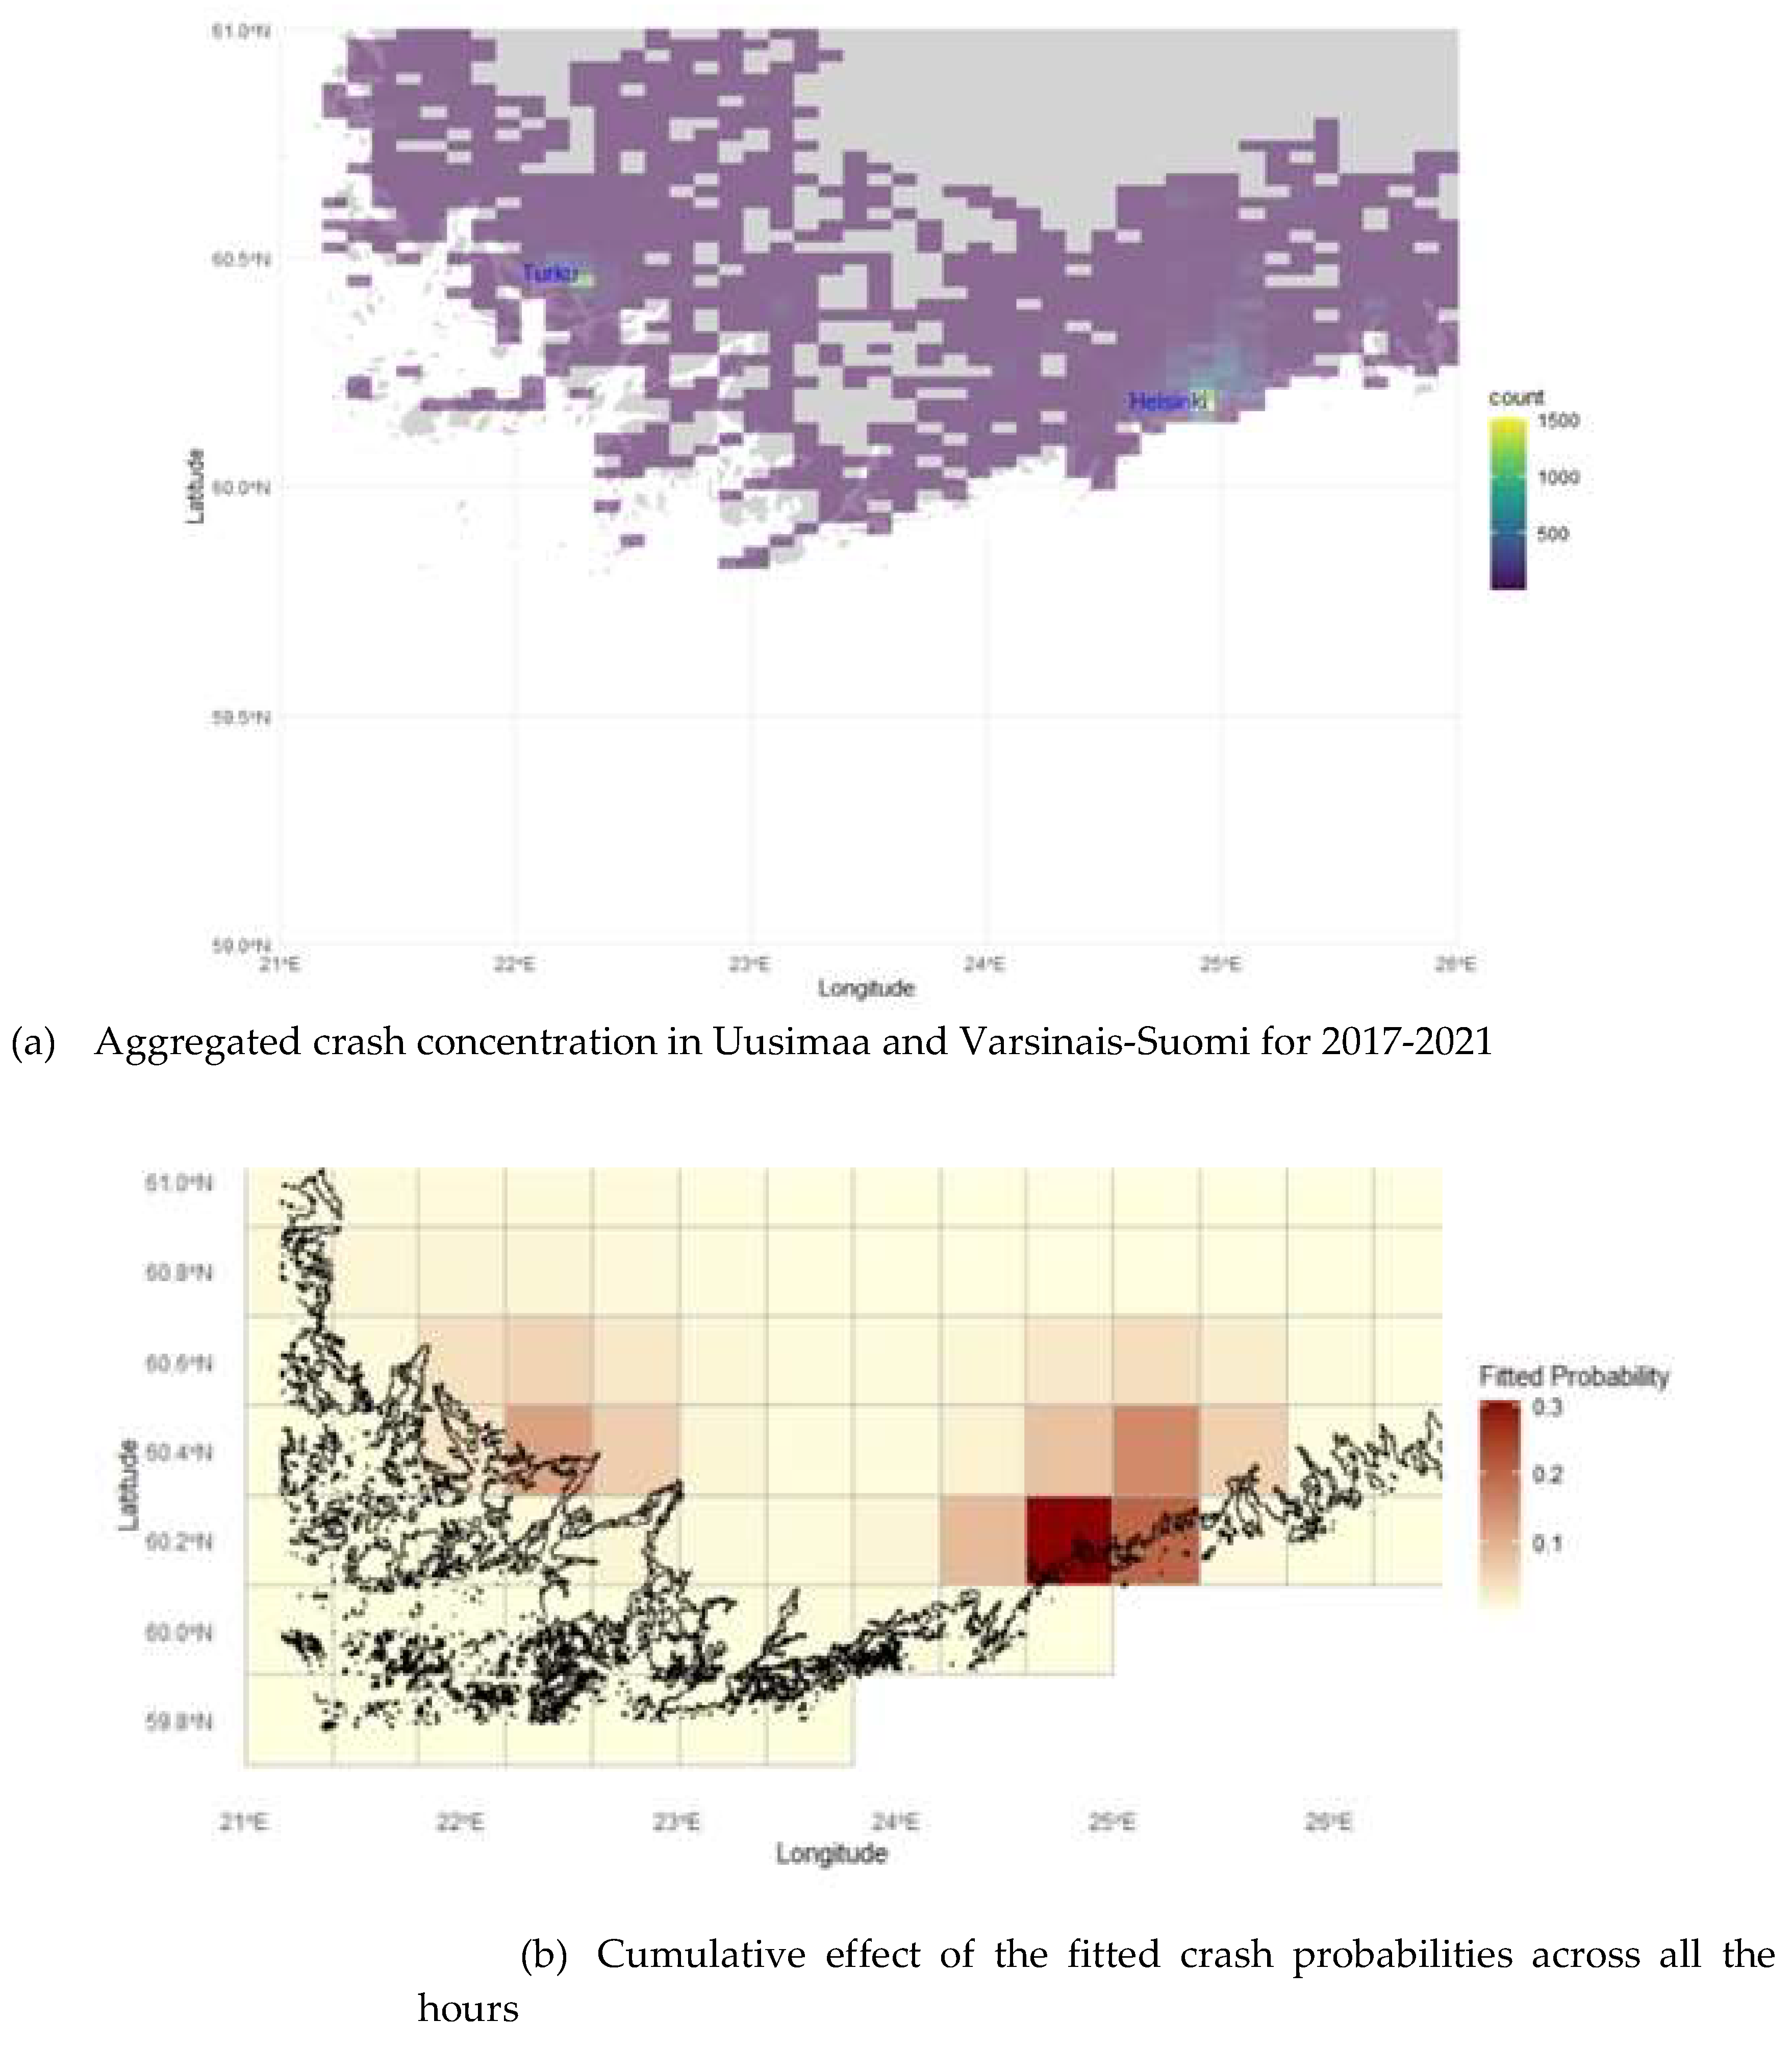
18]. Namely, the model establishes that precipitation falling as snow or sleet amplifies the risk of a car crash. Driving during the morning and late afternoon hours, as well as following the commuting flows into the urban areas of Helsinki and Turku, all increase the probability of an accident. In
Figure 11, panel (b) precisely depicts this spatial pattern since the highest fitted crash probability happens in the spatial cell containing the city of Helsinki. There is a clear distance-decay effect, whereby the risk of an accident gradually decreases as one moves away from the city. The same is true for the zones around Turku. Additionally, panel (b) supports the information presented in panel (a), establishing that the fitted probabilities generated by the model have a direct correspondence with the spatial crash concentration.
The proposed spatiotemporal GAM also acknowledges that crashes cannot be viewed as independent events, and the likelihood of a crash increases if another crash happened within the vicinity in the previous two hours. To aid in future predictions, temporal trends such as particular holiday periods will continue to be important in the model development. Right now, the model indicates that the period spanning the Christmas holidays results in a decreased crash risk. Finally, it is essential to consider that driver unpreparedness in terms of unexpected weather conditions also adds an important safety risk.
8. Conclusions
6GVisible project develops 6G-era service and architecture solutions utilizing autonomous and semi-autonomous driving, Finnish Meteorological Institute focusing on weather and safety related services for autonomous vehicles. The target is to tailoring road weather services for the special needs of autonomous driving, by adjusting weather warnings based on autonomous vehicle sensor sensitivity, especially LiDAR sensor, by combining road weather forecast and Nowcasting short-term precipitation forecast, specific route-planning with knowledge modelling based on weather and other parameters, and predictive modelling of weather-related crashes for building statistical background for the services. Intelligent traffic communication systems are evaluated as necessary data exchange platforms, in our project pilot as well as in expected future deployment.
This paper provides the first stage results of the project, to be supplemented in the following latter half of the project.
Author Contributions
Conceptualization, Timo Sukuvaara and Virve Karsisto; methodology, Timo Sukuvaara, Kari Mäenpää, Heikki Myllykoski, Virve Karsisto and Etienne Sebag; software, Kari Mäenpää, Hannu Honkanen, Ari Pikkarainen, Heikki Myllykoski and Virve Karsisto.; validation, Hannu Honkanen, Ari Pikkarainen, Heikki Myllykoski, Virve Karsisto and Etienne Sebag; formal analysis, Timo Sukuvaara, Virve Karsisto and Etienne Sebag; writing—original draft preparation, Timo Sukuvaara; writing—review and editing, Virve Karsisto; visualization, Timo Sukuvaara, Kari Mäenpää, Ari Pikkarainen, Heikki Myllykoski, Virve Karsisto and Etienne Sebag.; supervision, Timo Sukuvaara.; project administration, Timo Sukuvaara.; funding acquisition, Timo Sukuvaara. All authors have read and agreed to the published version of the manuscript.
Acknowledgments
The support provided by the Business Finland’s 6G Bridge program is gratefully acknowledged. Authors also want to thank all the colleagues participated to this work both in University of Oulu and Finnish Meteorological Institute, especially Pertti Seppänen, Nada Sanad and Anna Teern in the University of Oulu and Pyry Myllymäki and Seppo Pulkkinen in Finnish Meteorological Institute. Work related to the section "Predictive modelling of weather-related crashes" was carried out in the Master's thesis (unpublished) of Etienne Sebag, and was supervised jointly by Sangita Kulathinal, Department of Mathematics and Statistics, University of Helsinki, and Virve Karsisto, Finnish Meteorological Institute.
Conflicts of Interest
The authors declare no conflicts of interest.
References
- Ross, P.E. “Taxis without drivers-or steering wheels”, IEEE Spectrum, Vol. 56, No: 1, pp-33-34. 19, IEEE. [CrossRef]
- Automated Driving on Motorways (AUTOMOTO), FTIA publications 21/2021, Finnish Transport Infrastructure Agency, Helsinki, Finland, 2021.
- Marti, E., de Miguel M. A., Garcia F. and Perez J., "A Review of Sensor Technologies for Perception in Automated Driving," in IEEE Intelligent Transportation Systems Magazine, vol. 11, no. 4, pp. 94-108, winter 2019. [CrossRef]
- Xiang, C. Feng, C., Xie X., Shi B., Lu H., Lv Y., Yang M., and Niu Z., “"Multi-Sensor Fusion and Cooperative Perception for Autonomous Driving: A Review," in IEEE Intelligent Transportation Systems Magazine, vol. 15, no. 5, pp. 36-58, Sept.-Oct. 2023. [CrossRef]
- Bilik, I., "Comparative Analysis of Radar and Lidar Technologies for Automotive Applications," in IEEE Intelligent Transportation Systems Magazine, vol. 15, no. 1, pp. 244-269, Jan.-Feb. 2023. [CrossRef]
- Ruotsalainen, L., Renaudin V., Pei L., Piras M., Marais J., Cavalheri E. and Kaasalainen S., “Toward Autonomous Driving in Arctic Areas”, IEEE Intelligent Transportation Systems Magazine, vol. 12, no. 3, pp. 10-24, Fall 2020. [CrossRef]
- Karsisto, V., Hippi M., Honkanen H., Myllykoski H., Mäenpää K., Pulkkinen S., Sanad N., Sebag E., Seppänen P., Sukuvaara T. and Teern A., ”6G VISIBLE. Intelligent Mobility for autonomous driving”, 21st International Road Weather Conference 11.-13.6.2024, SIRWEC2024, Amsterdam, Netherlands.
- Sukuvaara, T., Mäenpää K., Stepanova D. and Karsisto V.,”Vehicular Networking Road Weather Information System Tailored for Arctic Winter Conditions”, International Journal of Communication Networks and Information Security (IJCNIS) Vol. 12, No. 2, 20, pp. 281-288.
- Saad M., M., Khan M. T. R., Shah S. H. A. and Kim, D., "Advancements in Vehicular Communication Technologies: C-V2X and NR-V2X Comparison," in IEEE Communications Magazine, vol. 59, no. 8, pp. 107-113, 21. [CrossRef]
- Ojanperä, T., Scholliers J., Sukuvaara T., Yastrebova A., Miekkala T., Pyykönen P.,Mäenpää K., Salkari I., Laakso J., Huuskonen O., Zhang H., Kinawi H.,Nyrhinen H. and Eloranta P., “Piloting and Evaluation of 5G-Enabled Road Safety and Cybersecurity Services”, EUCNC/6G Summit, 6-, Gothenburg, Sweden.
- Karsisto, V. “RoadSurf 1.1: open-source road weather model library”, Geoscientific Model Development. 2024 Jun 20;17(12):4837-53.
- Frogner, I.-L.; et al. ”HarmonEPS-The HARMONIE ensemble prediction system”, Wea. Forecasting, 34, 1909–1937 2019. [CrossRef]
- Karsisto, V. and Horttanainen M., “Sky View Factor and screening impacts on the forecast accuracy of road surface temperatures in Finland”, Journal of Applied Meteorology and Climatology, 62(2), 121-138. [CrossRef]
- Vargas, J., Alsweiss, S., Toker, O., Razdan, R. and Santos, J., 2021. An overview of autonomous vehicles sensors and their vulnerability to weather conditions. Sensors, 21(16), p.5397.
- Pulkkinen, S.; et al. “Pysteps: an open-source Python library for probabilistic precipitation nowcasting (v1.0)”, Geoscientific Model Development, 12(10), 4185-4219, 2019. [CrossRef]
- Chen Z., et al., “Knowledge graph completion: A review”, Ieee Access, 8, pp.192435-192456. [CrossRef]
- C. Feng, “Spatial-temporal generalized additive model for modeling COVID-19 mortality risk in Toronto, Canada,” Spatial Statistics, vol. 49, p. 100526, Jun. 2022. [Online]. Available: https://www.ncbi.nlm.nih.gov/pmc/articles/PMC8257405/.
- N. Becker, H. W. Rust, and U. Ulbrich, “Weather impacts on various types of road crashes: a quantitative analysis using generalized additive models,” European Transport Research Review, vol. 14, no. 1, p. 37, Aug. 2022. [Online]. [CrossRef]
|
Disclaimer/Publisher’s Note: The statements, opinions and data contained in all publications are solely those of the individual author(s) and contributor(s) and not of MDPI and/or the editor(s). MDPI and/or the editor(s) disclaim responsibility for any injury to people or property resulting from any ideas, methods, instructions or products referred to in the content. |
© 2024 by the authors. Licensee MDPI, Basel, Switzerland. This article is an open access article distributed under the terms and conditions of the Creative Commons Attribution (CC BY) license (http://creativecommons.org/licenses/by/4.0/).


