1. Introduction
The history of the development of flood events and infrastructure development in Jakarta has been recorded from 1963 to the present. Even though the development of flood control infrastructure continues to be added, the locations where floods occur continue to increase in new locations. There are several reasons why this happens. First, it is caused by an increase in rain intensity from year to year, for example in 1932 the intensity of rain that caused flooding was 96 mm/day, but in 2020 the intensity of rain is 377 mm/day. Second, there are changes in land use which have an impact on the growth of the drainage coefficient value. Third, the use of old channels is no longer capable of handling the existing flood load.
The flood problem in Jakarta is a combination of the problems of pluvial floods and fluvial floods. Geographically, there has been an increase in changes in flood locations, which previously existed right on the edge of the river, moving to urban areas which tend to be further away from the river. This indicates the phenomenon of change from fluvial floods to pluvial floods. Pluvial flooding presents a major challenge to urban areas globally, requiring comprehensive risk assessments, mitigation strategies, and infrastructure development to increase resilience and reduce the impact of increasingly frequent and severe flooding events. Based on various literature [
1,
2,
3] which compares the two floods, the author defines pluvial floods as follows: Pluvial floods are floods that occur immediately after high rainfall intensity that exceeds the infiltration capacity of the soil and the drainage capacity of urban channels over a considerable distance from river with a flood water height of less than 1 meter and a flood duration of less than 1 day [
4]. In addition, pluvial floods pose a high risk threat to the economy and human safety, so they require mitigation strategies and systems for flood control to increase resilience and the impact of flood events. The pluvial flood control system studied in this research uses mobile pumps and weather prediction tools.
There has been a lot of research on fluvial floods in Jakarta with normalization, sodetan and polder solutions [
5,
6,
7,
8,
9], however there has been no research on pluvial floods in Jakarta and solutions to the problem to reduce the risk of pluvial floods. The novelty of this research is by answering the main question, namely how to use mobile pumps and weather prediction tools to reduce the risk of pluvial floods in Jakarta. With the limited mobile pumps available in Jakarta, the priority of selecting locations that are prone to flooding is a separate consideration in this research.
According to Law of the Republic of Indonesia number 3 year 2022 concerning the nation’s capital, there will be a transfer of the capital of Indonesia, which was originally Jakarta, to East Kalimantan in 2024, thus Jakarta will no longer be the capital of the country. Furthermore, with the Republic of Indonesia Law concerning the Special Region of Jakarta, Jakarta has become a global city and the center of the largest agglomeration economy in Indonesia. South Jakarta is a city that has the largest trade and economic zone in Jakarta. The impact of pluvial flooding will hamper the economic process in South Jakarta. Thus, the problem of pluvial flooding in South Jakarta remains an issue that needs to be resolved.
From field observations in South Jakarta, flooding can occur even with a rain intensity of 15 mm/day. This happened around the location of the Lemigas station on June 6 2023. South Jakarta, based on the author’s research in 2024, has an average drainage coefficient of 0.57 [
4] which can be said to have a relatively high value so that it can illustrate the lack of soil infiltration capacity in South Jakarta.
Due to the rampant development, the land for making channels is very limited so that the dimensions of the drainage that can be built are not able to accept the planned rain load with a return period of 5 years. For example, a precast channel that can easily be installed is a small channel with dimensions of width and height of 40 cm x 40 cm. However, this channel will not be effective in carrying water over a 5 year return period because this channel only has a capacity of 0.16 m3/s. The channel capacity that corresponds to the return period is with dimensions of width and height of 100 cm x 100 cm which has a capacity of 1.02 m3/s, but channels with these dimensions are very difficult to build in Jakarta due to limited land available.
Due to limited land, the best solution for pluvial flooding is to use a mobile pump and its equipment. There are 4 types of mobile pumps that can be used in South Jakarta with a total capacity of 5.2 m3/s and 14 units are currently being used in several flood-prone locations in South Jakarta. The details of the mobile pump are as follows: 1. Capacity 0.1 m3/s (2 units), 2. Capacity 0.25 m3/s (2 units), 3. Capacity 0.4 m3/s (5 units), and 4. Capacity 0.5 m3/s (5 units).
Research on the problem of pluvial flooding using a non-structural mobile pump approach and its equipment is very important to reduce the risk of pluvial flooding throughout urban areas. Mobile pump research that has been carried out previously is related to the materials of the mobile pump truck/trailer [
10,
11], the energy efficiency of the pump [
12], and stationary pumps [
13,
14,
15,
16,
17], there has been no previous research regarding the use of mobile pump on pluvial floods either in South Jakarta or in any other cities in the world so that this research has innovation in it’s field, especially the development of water resources engineering.
The aim of this research is to optimize mobile pumps and their equipment for pluvial floods in South Jakarta using hydrological analysis methods compared with the hydraulic capabilities of existing channels, correlation of rainfall intensity (R) and flood depth (D) and analysis of hazard risks through the impact of depth. flooding and duration of flooding. It is hoped that the use of this method can be applied to overcome pluvial floods in South Jakarta and other urban areas in Indonesia and even in other countries affected by pluvial floods.
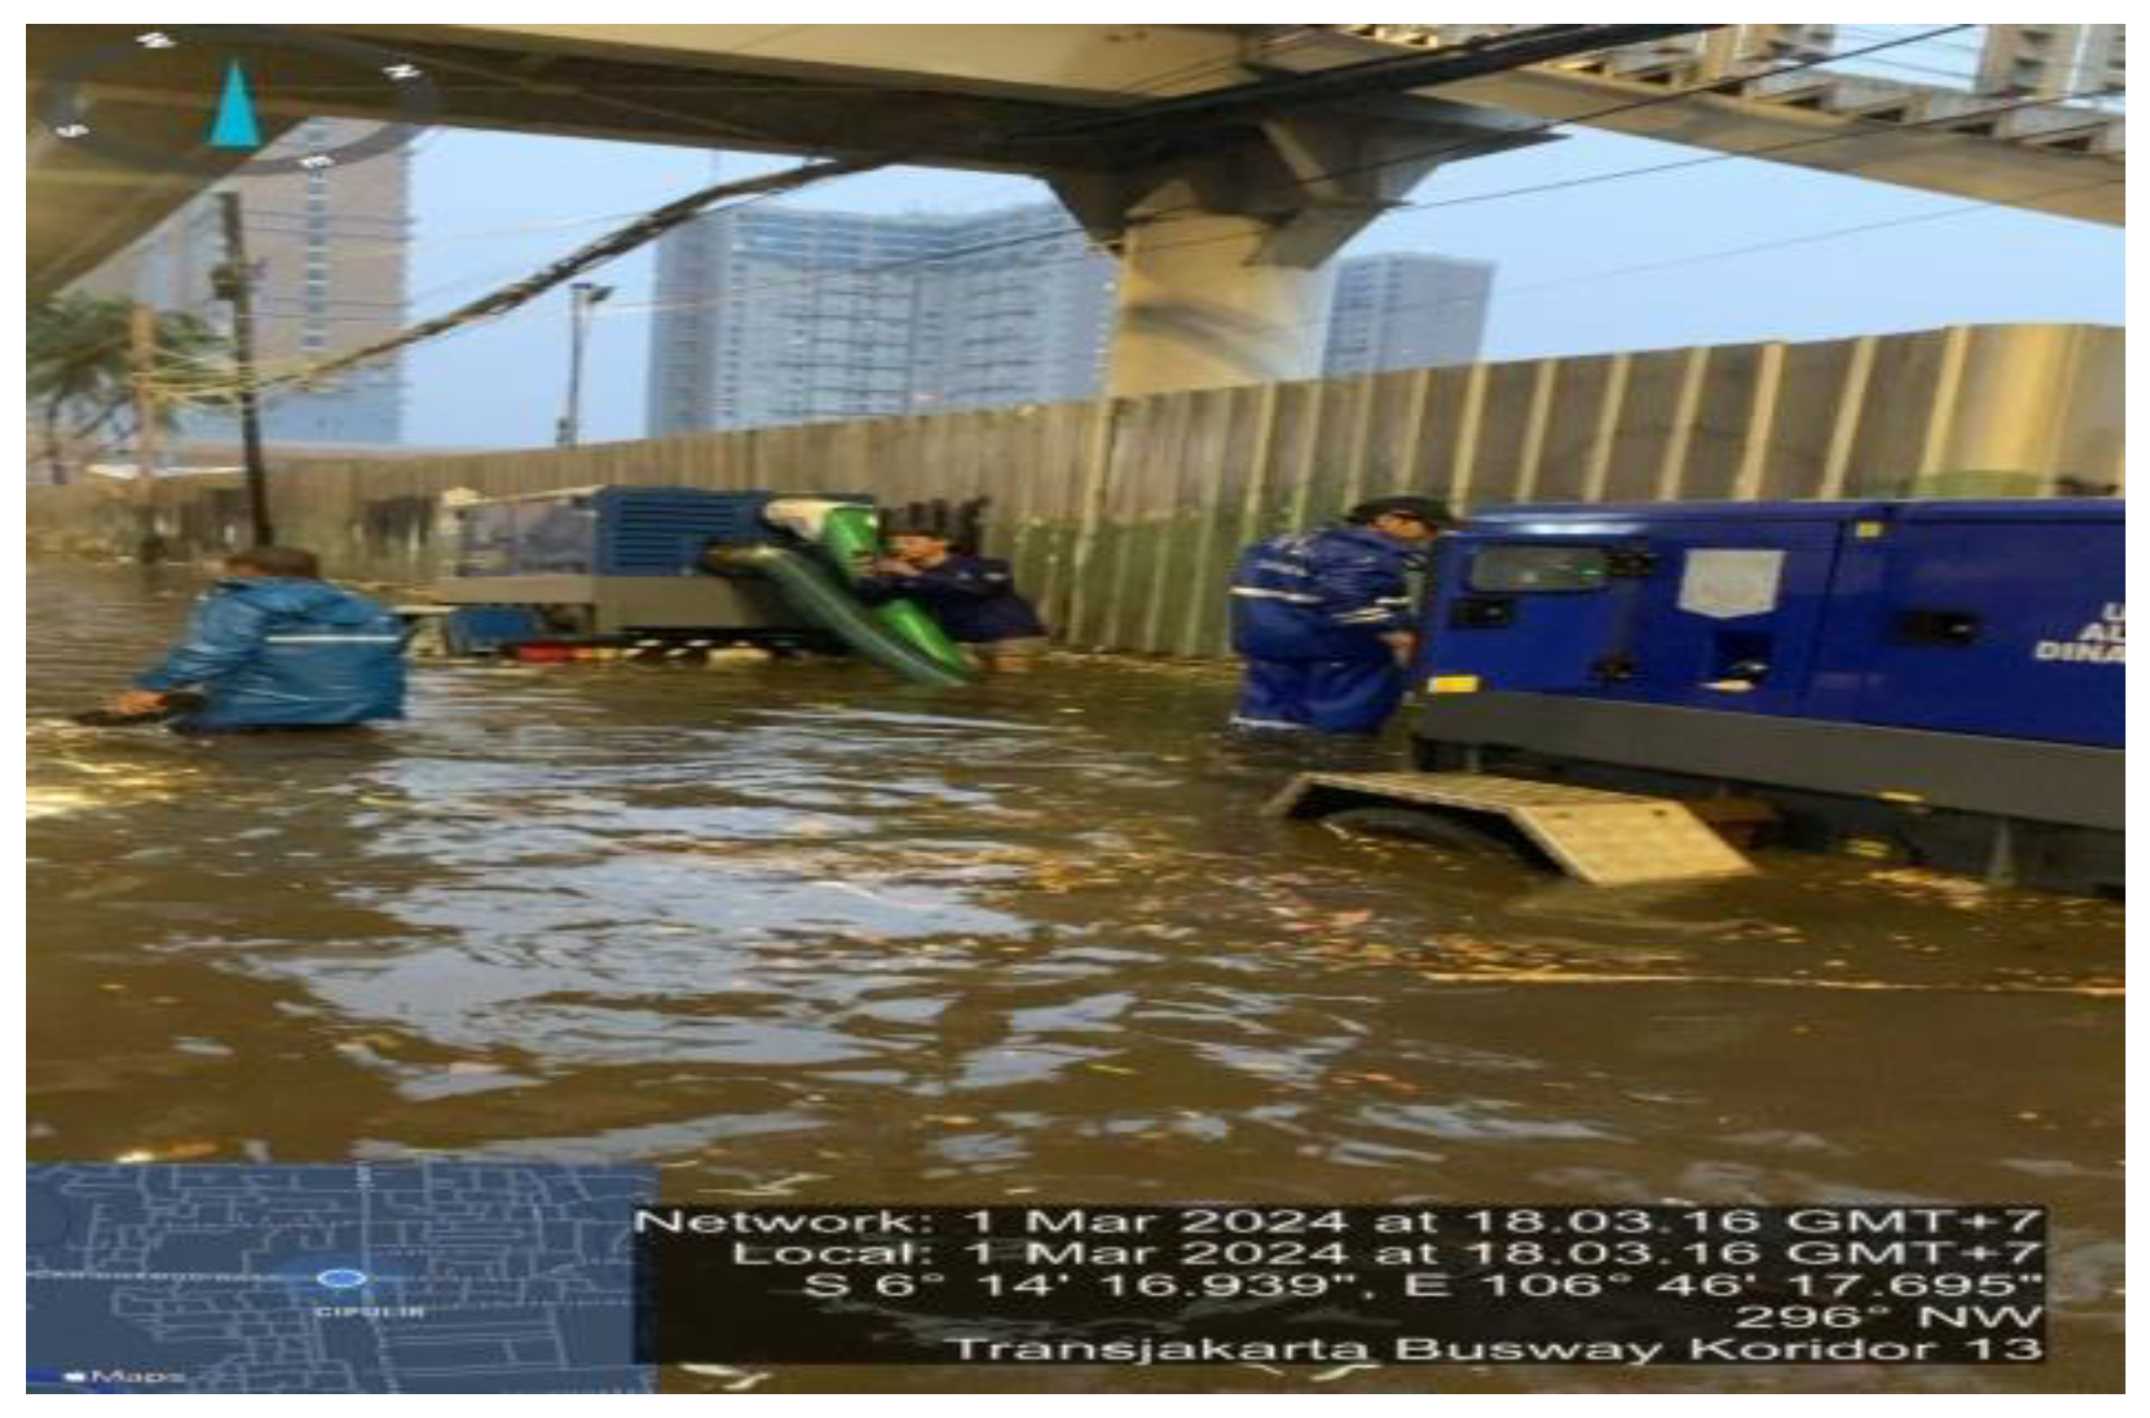
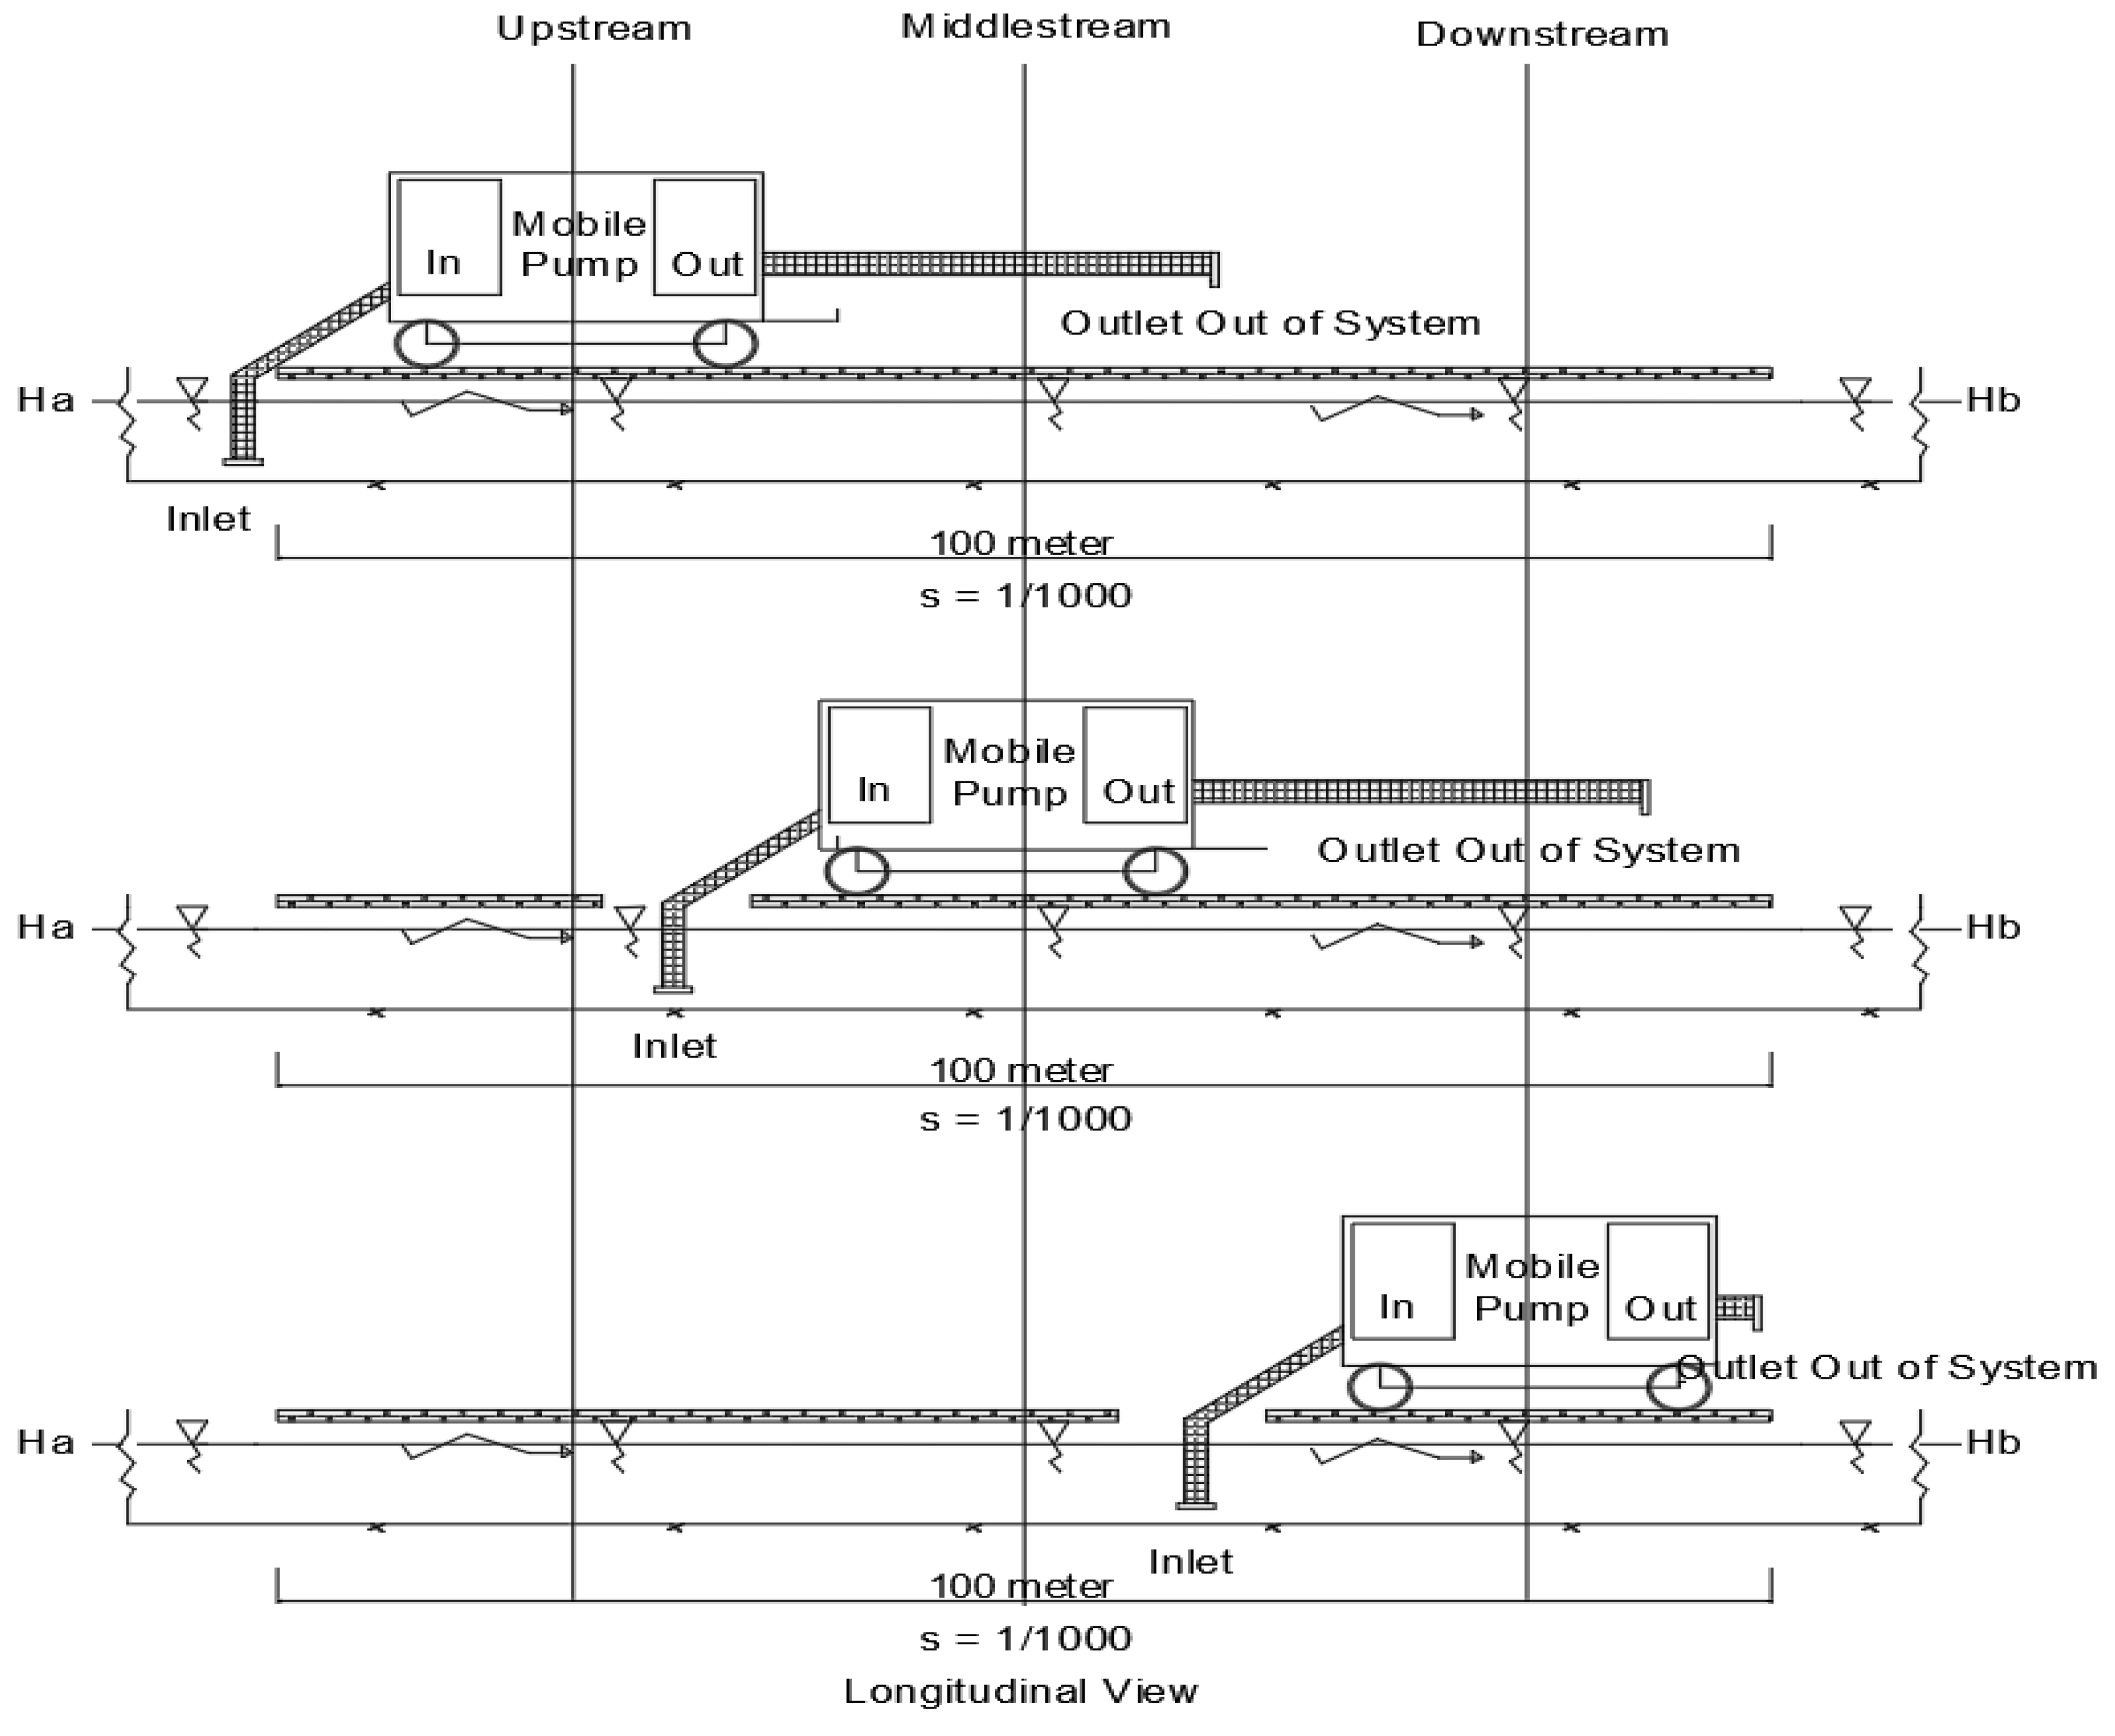
Figure 1.
Pump Mobile Operation in Reducing Flood.
Figure 1.
Pump Mobile Operation in Reducing Flood.
Through this research, researchers founded the conclusion that optimizing mobile pumps and their equipment can reduce the risk of pluvial flooding in South Jakarta. The results of this research can be used in other urban areas those affected by pluvial floodings.
2. Materials and Methods
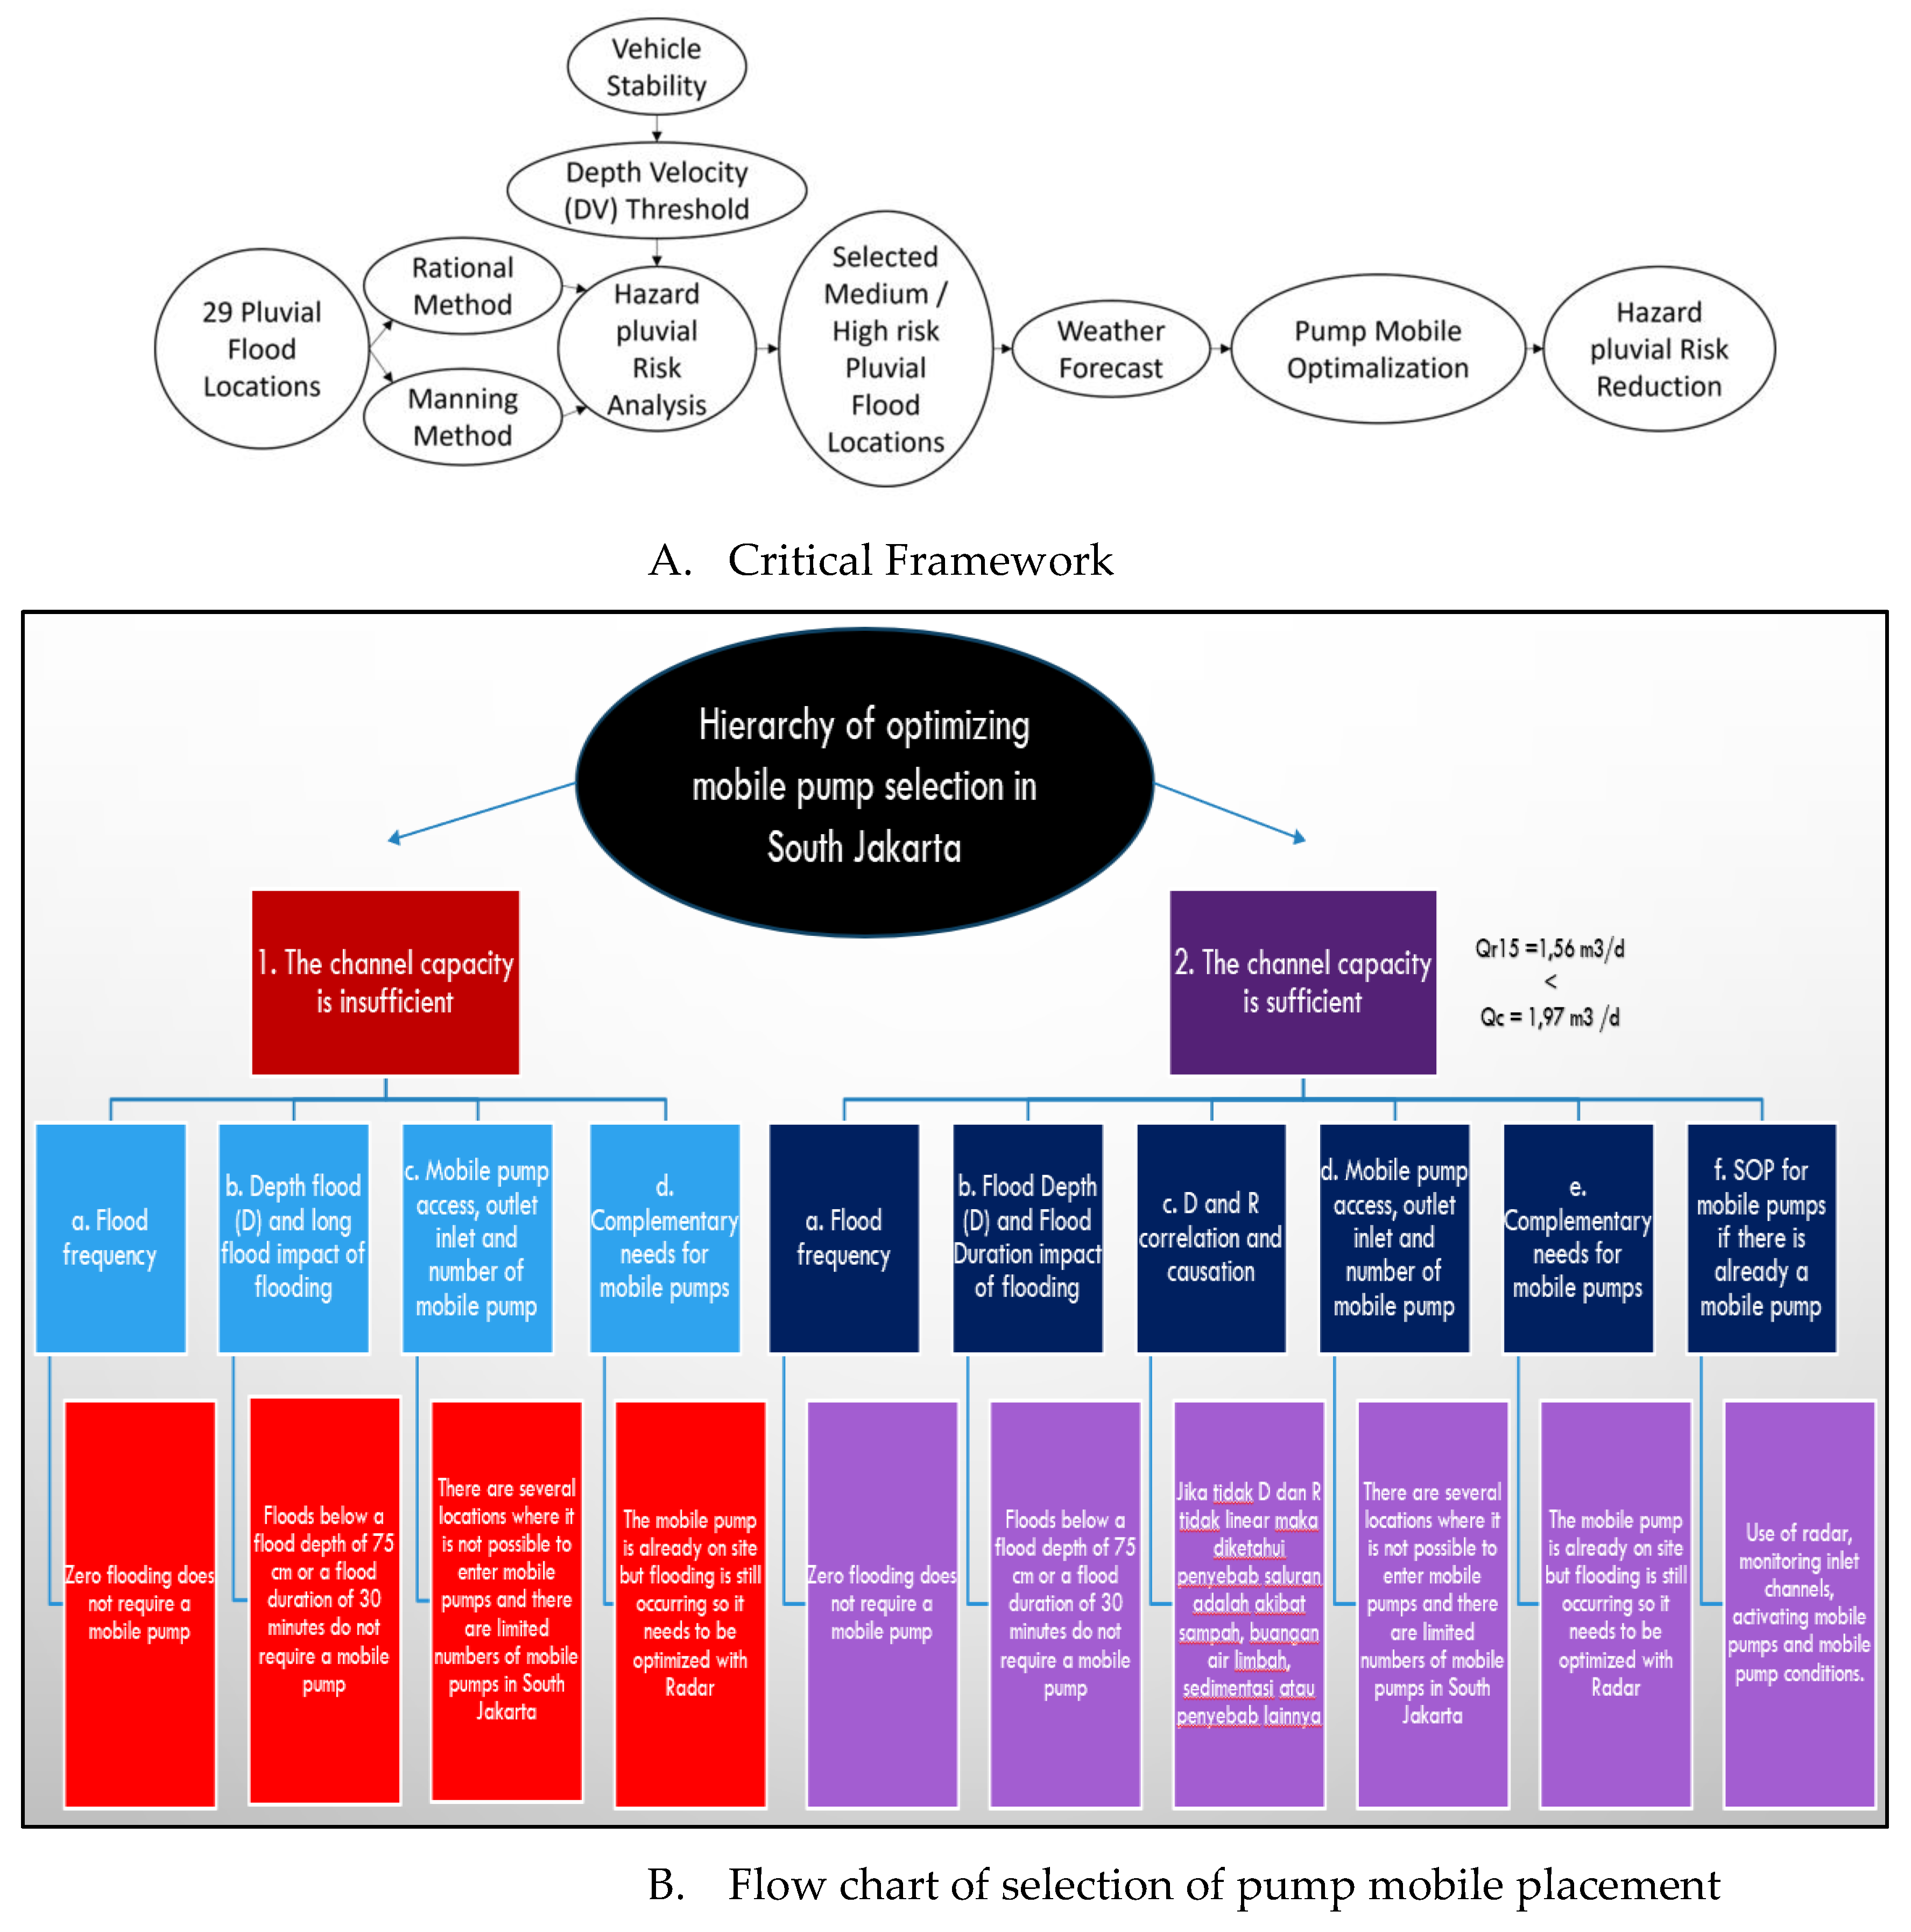
In general, this research is structured based on a framework of thinking as shown in
Figure 2. The method used in this research is to first compare the planned flood discharge load with the existing channel capacity. The planned flood discharge used is with a rain intensity of 15 mm/hour using the rational method calculation.
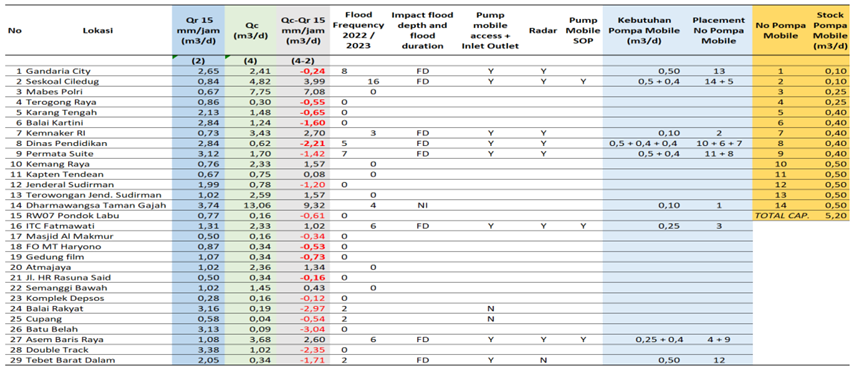
Table 1 shows the results of comparative calculations between the two and the frequency of occurrence in 2022 and 2023.
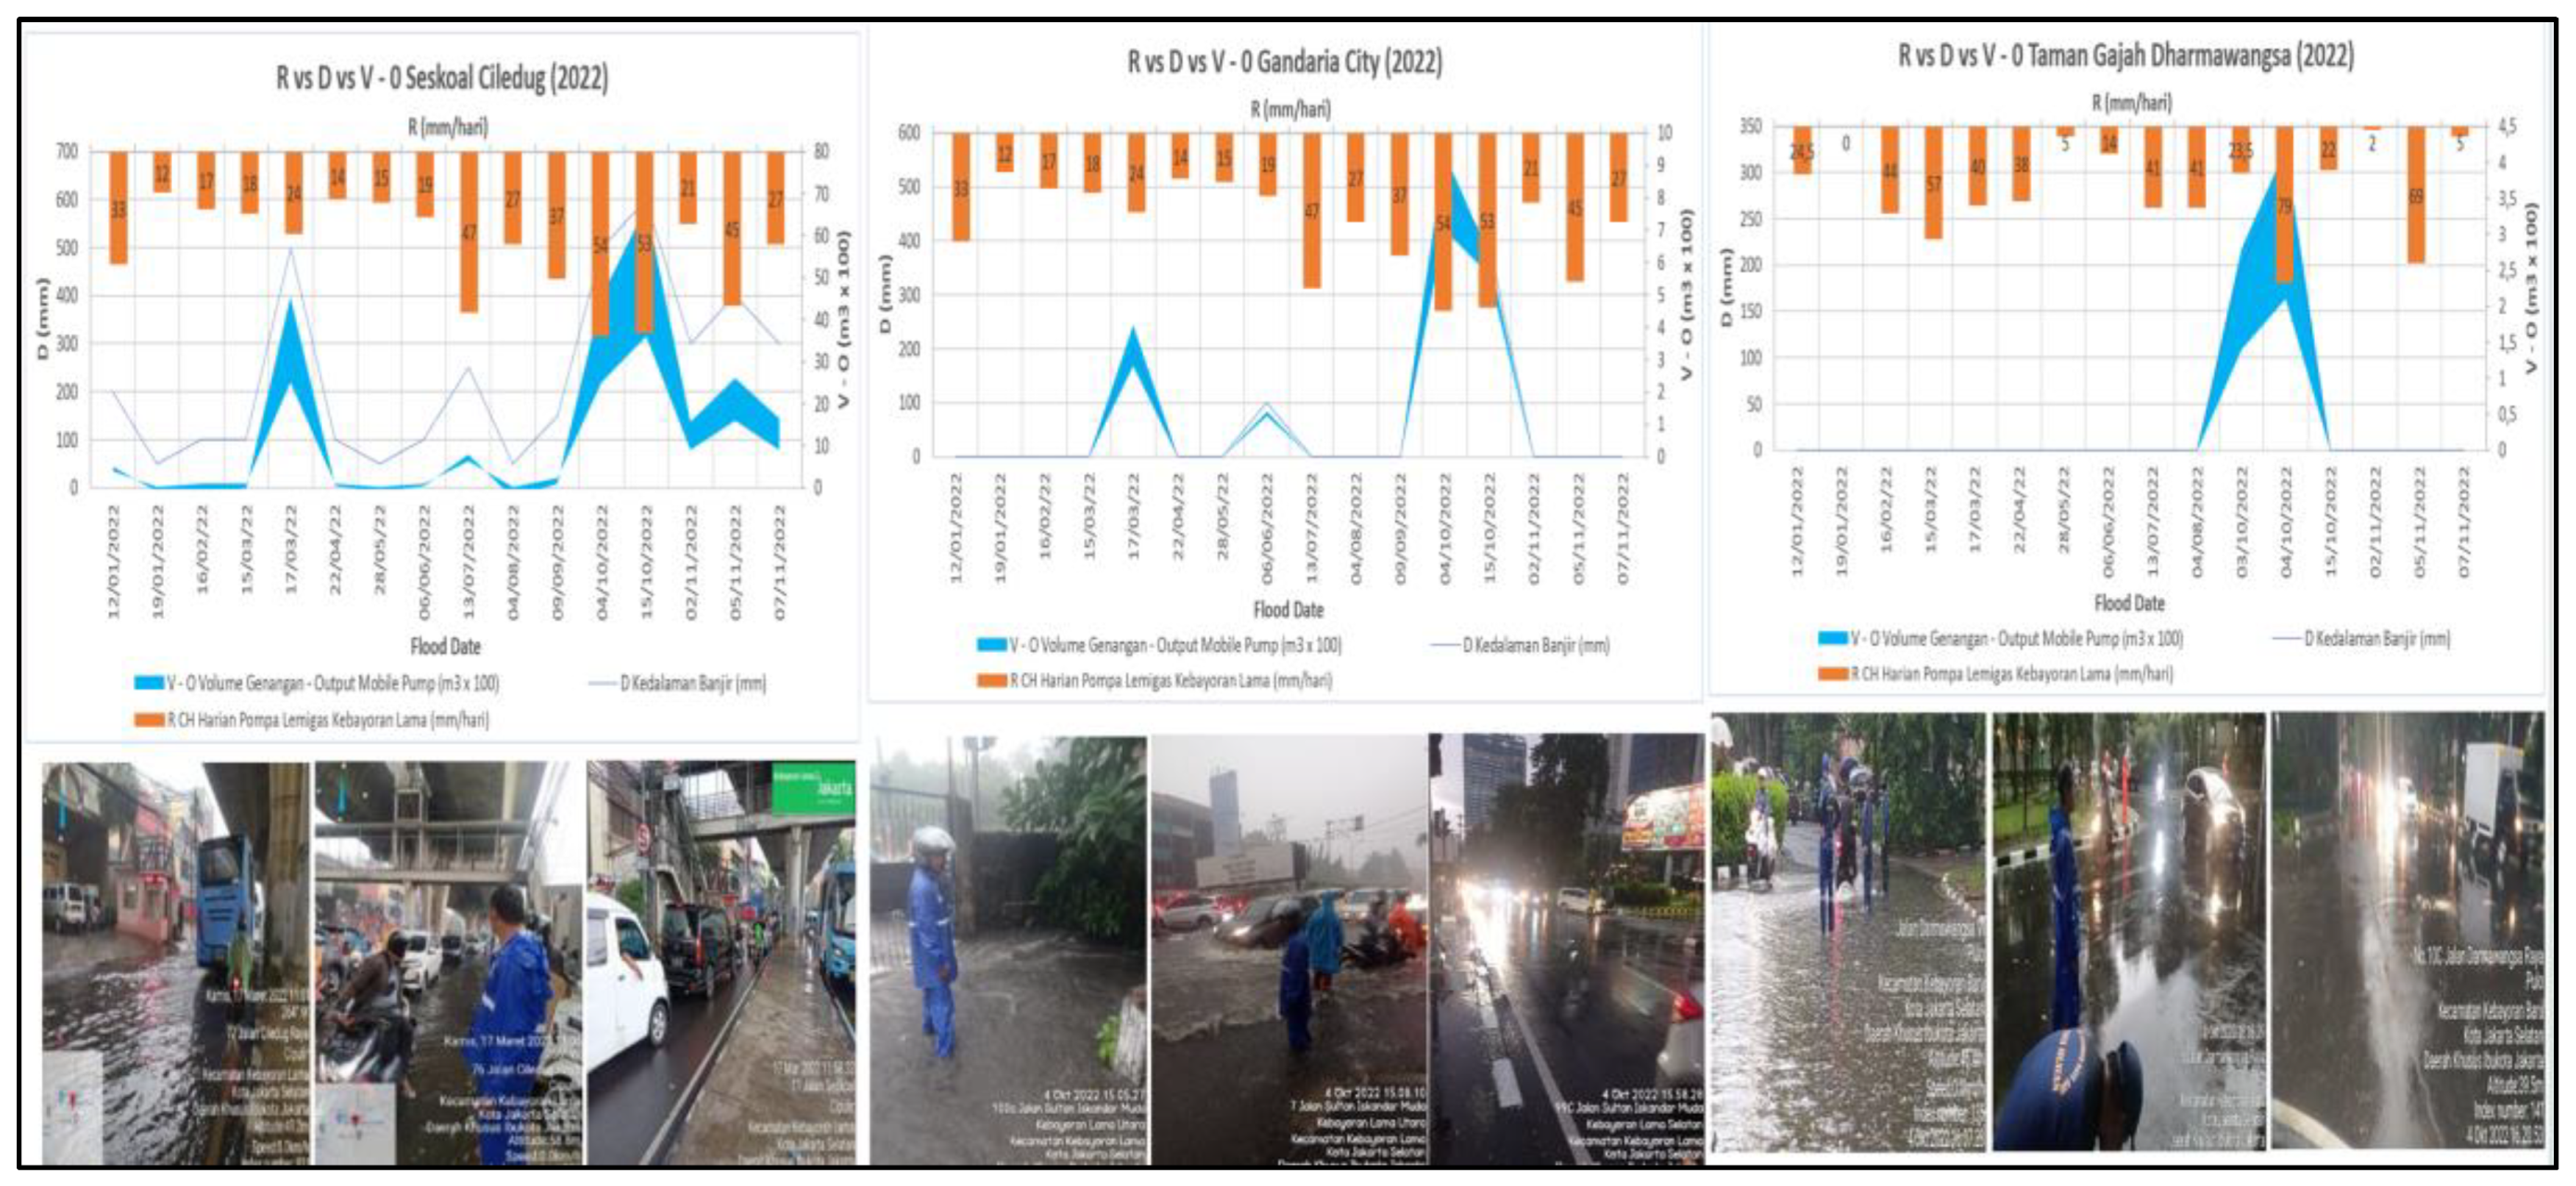
Next, to determine the characteristics of the flood, a comparison of the values of rain intensity, flood depth, flood volume with or without a mobile pump is carried out, which are adjusted to the presence of a mobile pump at that location. This is done first to determine the significant influence of the presence of a mobile pump at the flood location. The image is shown in figure below.
The next step is to use samples to create a quadrant relationship between flood area (A), flood depth (D) and Rainfall Intensity (R). Determination of coordinates is based on video data from 4 different flood events. From this quadrant (
Figure 6), a comparison is made between these parameters as shown in
Figure 7.
Table 2 shows the results of the closest correlation between these parameters and then plotted based on the flood height risk limit of 75 cm which was carried out in previous research. The plot results are shown in
Figure 7.
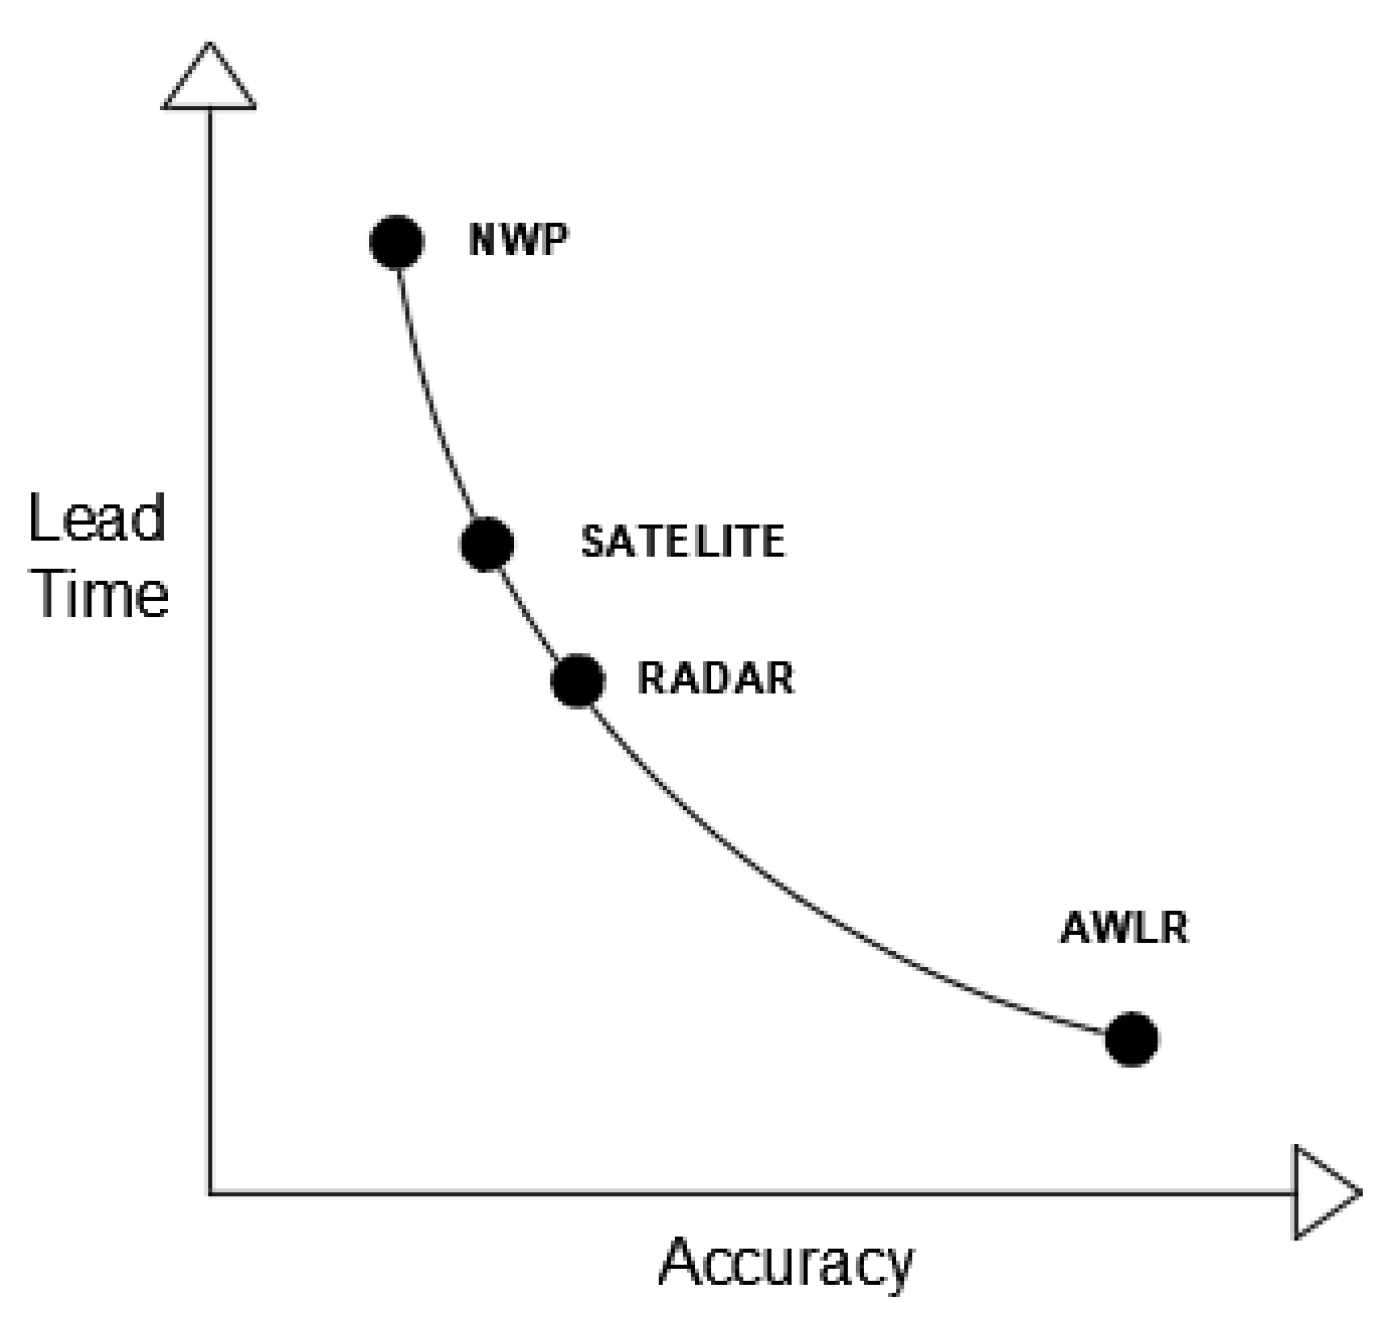
Before the final step is taken, the next step is selecting a tool for weather forecasting. This needs to be done to get lead time before operating the mobile pump. There are several ways to predict weather. The first is to observe ground rain data, namely the Automatic Rain Gauge (ARG) and Automatic Water Level Recorder (ALWR), the second is to use radar, the third is satellite and the fourth is to use the Indonesian Agency for Meteorological, Climatological and Geophysics (BMKG) application. The first method based on the level of accuracy has the highest accuracy, but the data it has is limited. The second to fourth methods are available on the BMKG website with a level of accuracy based on the method number sequence above. This research compares the second and third methods because based on the availability of information, it is easy to obtain and the accuracy is quite good [
18,
19,
20,
21,
22]. Here a comparison summary of the four weather prediction tools is shown in
Figure 3. To integrate weather predictions with mobile pumps, the Supervisory Control and Data Acquisition (SCADA) system can be used. SCADA including Sensors, Programmable Logic Controllers (PLC) and Human Machine Interface (HMI) can overcome water management problems with real time [
23,
24,
25,
26].
The final step taken was to plot 4 types of mobile pumps at all 29 locations pluvial flood locations in South Jakarta. Capacity selection is made based on the results of calculations in
Table 1. From this selection, the impact of flood depth and duration of flooding on channels that have insufficient capacity and channels that have sufficient capacity is categorized with explanation below.
Stationary pumps have the same function as mobile pumps (Yosua et al., 2023). However, the two differ in storage volume. When installed in flood locations, mobile pumps only have a very minimal storage volume. Usually, the storage used is a local micro channel. This is caused by limited free land in urban areas. Thus, in the cumulative flood volume curve using the cumulative distribution function (CDF), the flood volume storage that need to be discharged is searched for with the smallest storage by setting a large mobile pump capacity. Even though choosing the largest mobile pump capacity, still have to pay attention to head requirements, efficiency, and inlet and outlet conditions.
To select a mobile pump, a system characteristic curve and a pump performance curve are required. The meeting point between these two lines is called the pump operating point. The operating point of the pump is plotted on the y-axis which is the head and the x-axis which is the capacity. So the need for head value and capacity will determine the selection of the mobile pump to be used. The selection of head and capacity is based on the following energy conservation equation:
where:
( ) = Head different between inlet and outlet in meter
() = Velocity head different between inlet and outlet in meter
( = Head loss due frictional and contraction in meter
Here is the illustration of mobile pump with inlet and outlet in a urban drainage case. In this figure both water level at inlet and outlet are the same, means (HB – HA) equals to zero. In urban drainage especially Jakarta, it is common to see this phenomenon because of the low level of land slope. However, sometimes due the same exist location both inlet and outlet that lay at the same catchment area and hydrology system, the outlet water level (HB) could be higher than inlet water level (HA). If this condition happens then Head of Pump (Hpump) has to be cope with it. Backwater from the outlet to the inlet mainly happen in this condition. Otherwise, the location of the outlet should be changed. It is possible also an outlet has different water hydrology system with inlet but head loss should be considerate. Inlet mobile pump location is also important. Beside head inlet water level should be higher or equals to outlet water level (HA – HB ≥ 0), inlet location has to be free from solid particle, garbage, sedimentation etc because it can fail pump mobile mechanism to flow the water. So in this paragraph it can be emphasized that outlet and inlet location should consider pump head, water hydrology system and clean from solid particle.
Figure 4.
Ilustration of pump mobile with inlet and outlet.
Figure 4.
Ilustration of pump mobile with inlet and outlet.
In channels with less capacity, a mobile pump with a capacity that adjusts the deficit from the hydraulic analysis calculations is certainly needed. The consideration factor for access to the mobile pump is also taken into account. On roads that have a road width of less than 3 meters, mobile pumps cannot be brought to that location. If through an analysis of the impact of the depth of the flood or the length of time the flood exceeds its limits, apart from the mobile pump, other equipment is needed, namely a weather prediction tool, all of this is carried out on channels that are not capable of being loaded by the planned flood.
In channels that have sufficient capacity, an initial analysis needs to be carried out first, namely the correlation between rain intensity (R) and flood depth (D), this is to determine the cause of the flood. Furthermore, if there is a mobile pump at that location then what needs to be done is the Standard Operating Procedure (SOP) for using the mobile pump. Next is the addition of a mobile pump to adjust the flood depth (75 cm) and the allowable flood time (30 minutes) in a location prone to flooding. Just as with channels that have insufficient capacity, the assistance of weather prediction tools, namely mobile pump equipment, is needed as a complement if the maximum flood that occurs exceeds the depth limit and duration of the flood. The final product of mobile pump optimization at 29 locations prone to pluvial flooding in South Jakarta is plotted in
Table 3.
3. Results and Discussion
The results of the planned flood discharge calculation assuming a rain intensity of 15 mm/hour and the results of the hydraulic analysis calculations are shown in the following table.
There are several methods for calculating planned flood discharge, but the method used in this research is the rational method which requires run off coefficient (C), daily rainfall intensity (I) and catchment area (A). The drainage coefficient is obtained through calculating the average (C Equivalent). This is because a catchment area has a different coefficient from one another, for example there are residential areas, roads and parks. This method was chosen because it is suitable for analyzing planned flood calculations with a small catchment area (less or equal to 1 km2). The flow coefficient value for each is different so the calculation needs to be adjusted based on the area of each area. Specifically regarding the problem of pluvial floods. Flood forecasting is particularly difficult and uncertain for small drainage basins. One reason for this is due to inadequate temporal and spatial hydrological input variables for model-based flood predictions Mobile Crowd Sensing of Water Level to Improve Flood Forecasting in Small Drainage Areas. The choice of intensity of 15 mm/hour in the flood discharge calculation is the smallest intensity capable of causing flooding at the Seskoal Ciledug location with a planned flood of 0.84 m3/s. In general, based on hydrological analysis calculations using rational methods at a rain intensity of 15 mm/hour, the minimum planned flood discharge is 0.50 m3/s and a maximum of 4.33 m3/s with an average of 1.57 m3/s.
In general, through hydraulic analysis calculations using Manning’s empirical calculations, the channel capacity in 29 locations prone to flooding in all South Jakarta locations is a minimum of 0.16 m3/s, a maximum of 13.06 m3/s with the average capacity of channels prone to flooding in South Jakarta is 1.94 m3/s. If we compare the average value of the planned flood discharge intensity of 15 mm/hour (1.57 m3/s) with the average value of the channel capacity above (1.94 m3/s), it can be concluded that the average channel in a vulnerable location pluvial flood in South Jakarta are able to accommodate the planned discharge with an intensity of 15 mm/hour.
The conclusion that can be drawn at Gandaria City location above is that the channel capacity is only capable of flowing water of 2.41 m3/s, while the peak planned discharge is 2.65 m3/s, so there is a discharge of 0.24 m3/s which has the potential to becomes flooded at the peak of the hydrograph. Therefore, at this location a mobile pump with a capacity of 0.25 m3/s is needed to reduce the depth of the flood and the duration of the flood that will occur. This mobile pump can be optimized by combining weather prediction tools, SCADA, storage and standard operational procedures (SOP) depending on the impact of the flood which includes the depth of the flood and the duration of the flood. However, based on hydraulic calculations, it can be ascertained that at this location additional channel capacity is needed which raises the next problem, namely land availability which is also a problem in pluvial flooding. What can be done is to use a mobile pump. So mobile pumps are a solution to the problem of pluvial flooding, especially in South Jakarta.
Figure 5 below shows each flood event date which includes daily rainfall intensity, flood depth and cumulative flood volume using a mobile pump. The thicker the blue area, the greater the untreated flood volume. Rain intensity, depth and volume of flooding along with pump intervention were compared at the Seskoal Ciledug, Gandaria City and Dharmawangsa Gajah Park locations. Several things can be seen in this curve. First, by monitoring the pump station, the distribution of rain is not uniform in South Jakarta, this is because at the Pondok Pumpkin pump station, the high rain intensity of 69.5 mm/day did not cause flooding, while the rain intensity of 23.5 mm/day did cause flooding. location of the Dharmawangsa Elephant Park. Both data occurred on the same date. Another thing that might cause this is the accumulation of sedimentation and rubbish when the rain intensity is 23.5 mm / day. Second, the intervention of mobile pumps can effectively reduce flood heights. However, activating the mobile pump at the right time and configuring the right location can differentiate the height of the flood as shown by the curve at the Gandaria City location with rainfall of 24 mm/day which has a greater inundation volume compared to rainfall of 47 mm/day. Thus, to maximize the use of mobile pumps, a Standard Operating Procedure (SOP) for mobile pumps is needed.
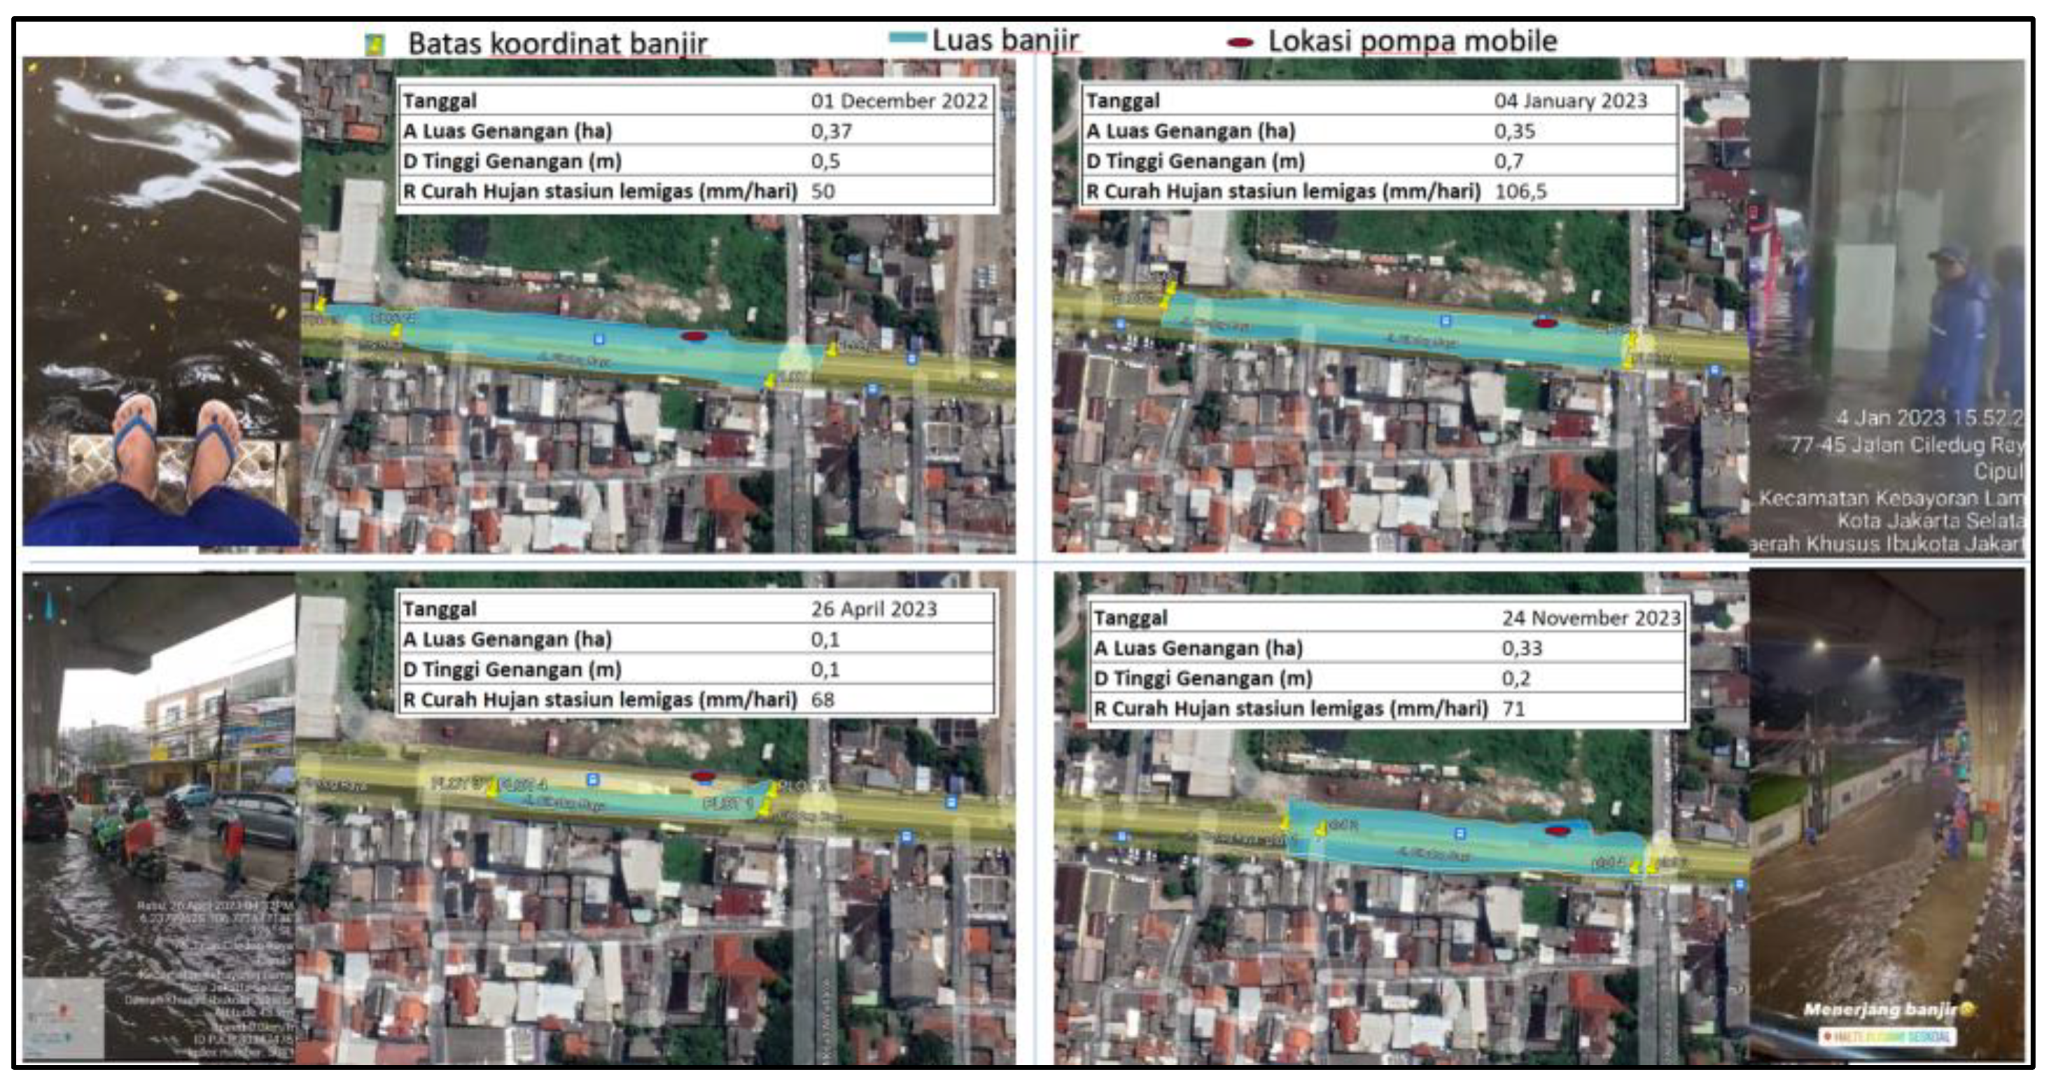
The relationship between depth of flood (D) and area of flood (A) is very necessary to determine the level of danger in a location affected by flooding. In the following image, 4 flood events at the Seskoal Ciledug location on different dates are compared. The date chosen is based on the completeness of the video and rainfall data at the Lemigas pump station. The dates of the flood events are 1 December 2022, 4 January 2023, 26 April 2023 and 24 November 2023. Based on the existing video, a field survey was carried out to plot the coordinate position of each end of the flood area coordinates. Coordinates are determined using Google Earth to store the coordinates for each coordinate per area. Every 4 coordinates of a flood area on a certain date are plotted on Google Earth to determine the area. The following is a quadrant plot image of the extent of flood inundation at the Seskoal Ciledug location.
Figure 6.
Quadrant A, D, R Flood.
Figure 6.
Quadrant A, D, R Flood.
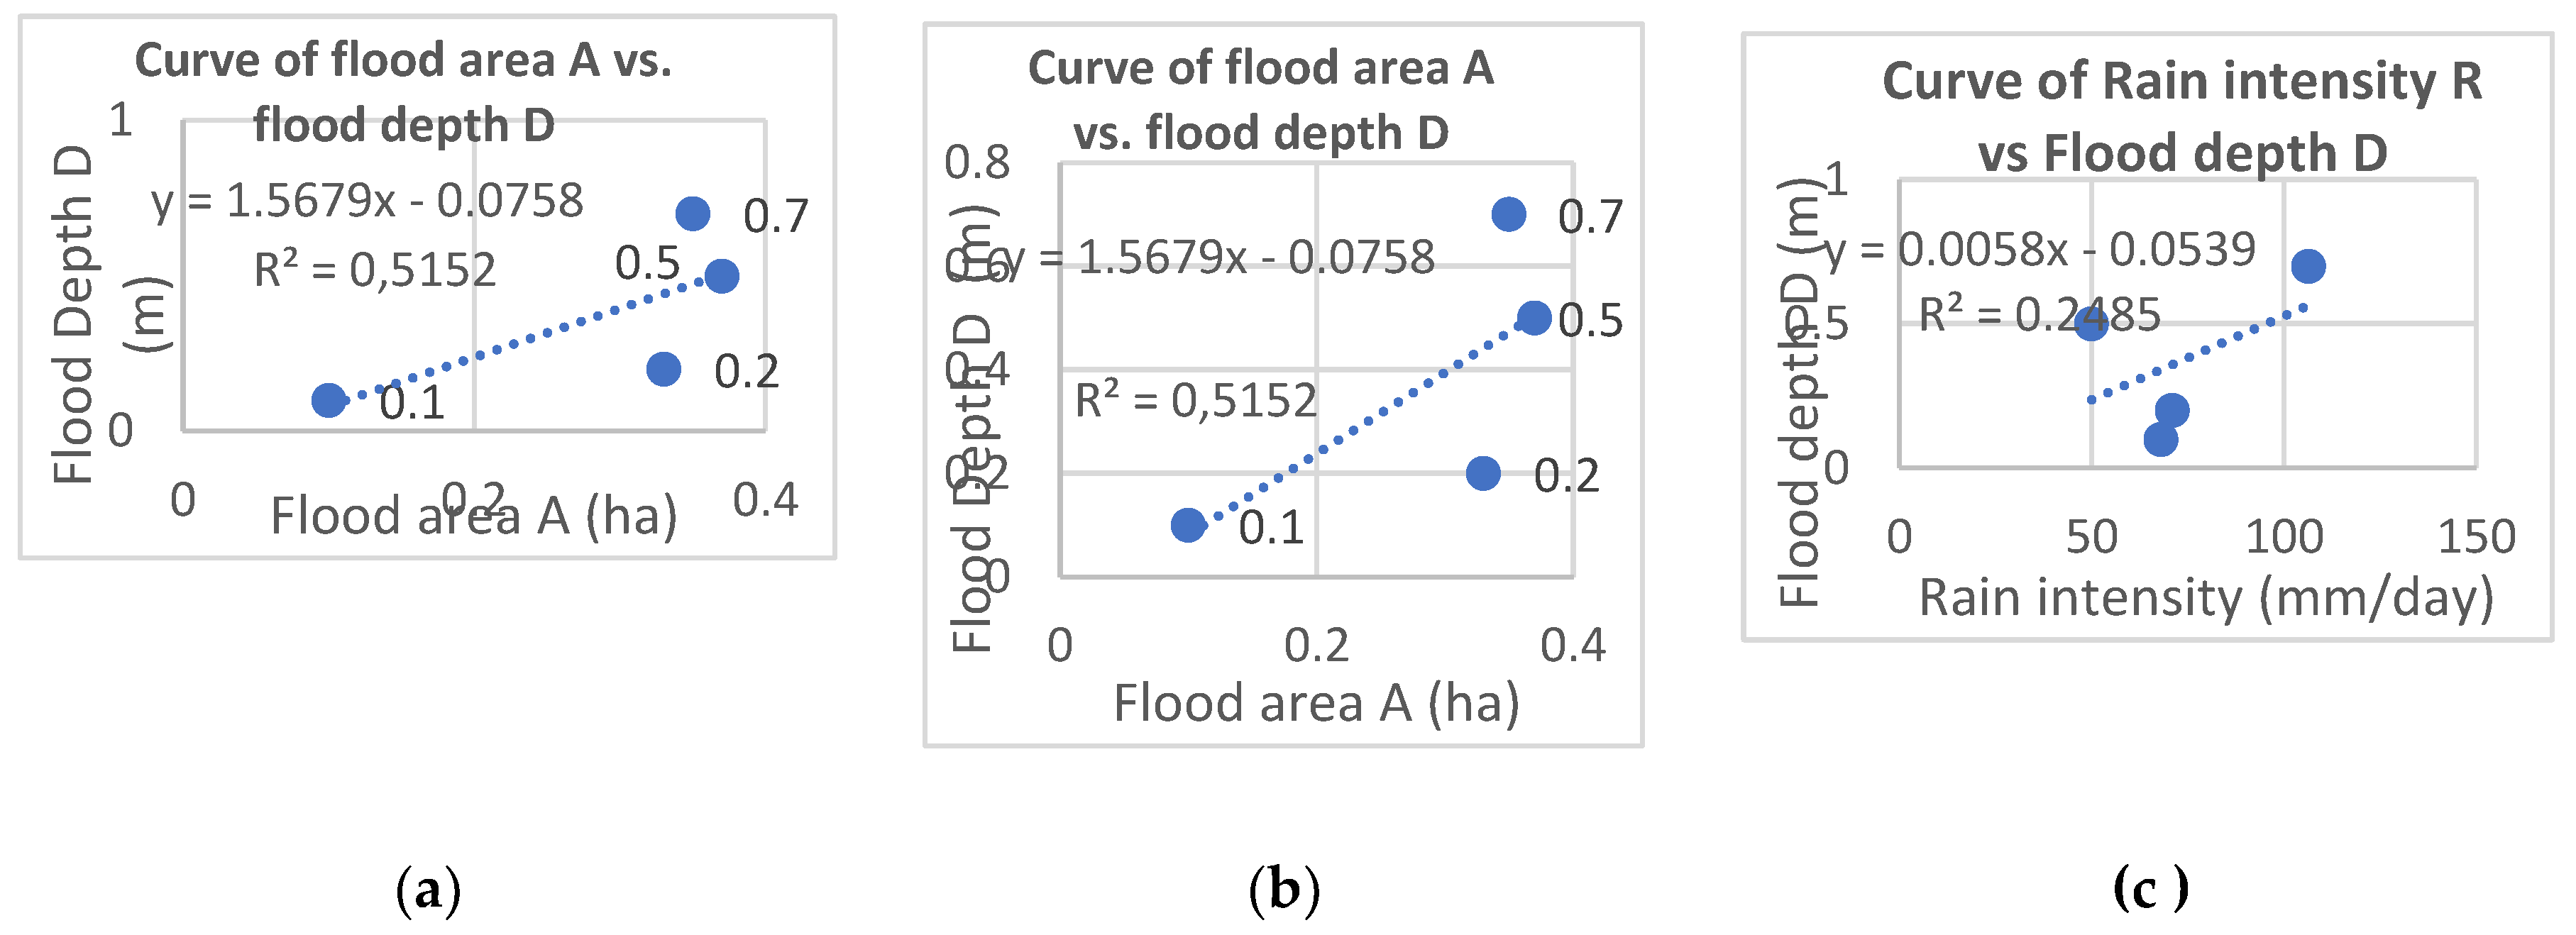
The problem of pluvial flooding has its own characteristics which are different from each other. This is related to the site plan and rainfall which is not evenly distributed to each other. Of the four parameters of the flood image at the Seskoal Ciledug location, the relationship is sought as in the following image. In the relationship between parameters, the equation is determined by Microsoft Excel to draw conclusions about the relationship, in this case all use a linear regression correlation relationship.
Figure 7.
Comparison Flood Area (a), Depth of Flood (b) and Rainfall Intensity (c).
Figure 7.
Comparison Flood Area (a), Depth of Flood (b) and Rainfall Intensity (c).
From the picture, the relationship between flood date and inundation area (A), inundation height (D) and daily rainfall (R) at the Ciledug Seskoal flood location which has the most linear similarity is between inundation area (A) and rainfall (R), but if broken down one by one, the parameters that are closest to each other linearly are the area of the puddle (A) and the height of the puddle (D). This is obtained using the linear equation, namely y = 1.5679 x – 0.0758. This difference is caused by non-uniform rain and the calculation of flood depth (D) which is not done accurately, such as using a meter and not using certain estimates.
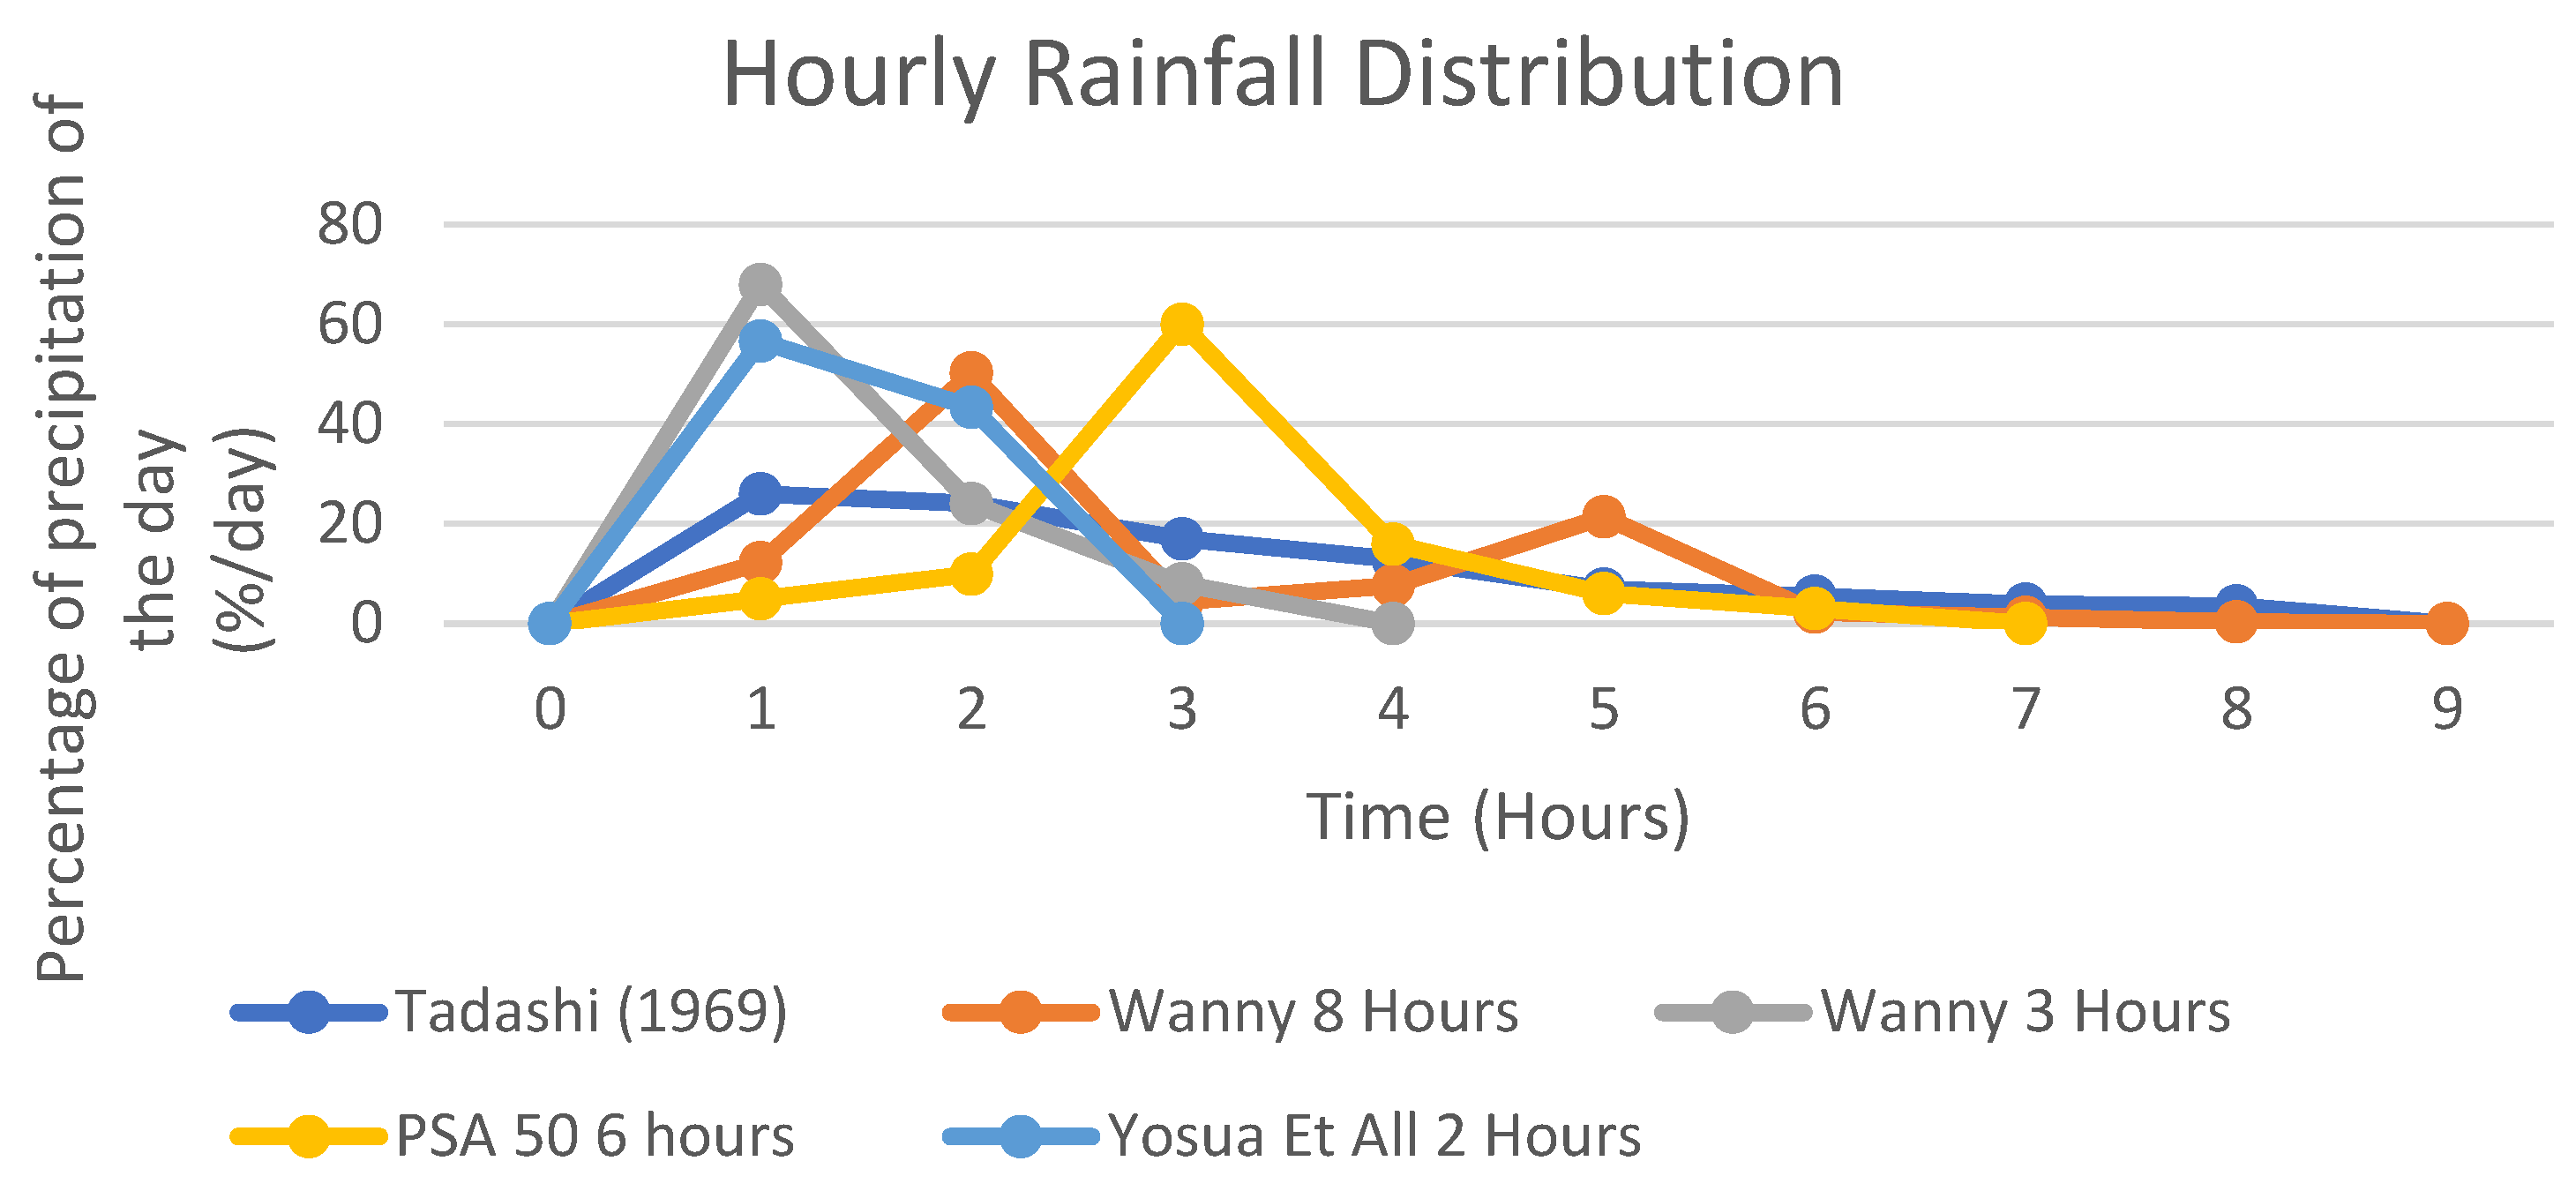
One of the characteristics of pluvial floods is that they occur very quickly. Thus, in this research it is also necessary to know the distribution of rain by hour, especially for the research area, namely South Jakarta. There are several hourly rain distribution patterns developed in Indonesia, namely Tadasi Tanimoto in 1969 on the island of Java with 8 hours rain distribution, Wanny in West Java with 3 and 8 hours rain distribution and products from the Directorate General of Water Resources PSA 50 6 hours rain distribution [
28,
29]. In this study, research was also carried out regarding the hourly distribution pattern of rain that occurred in Jakarta through several data on the rain that caused flooding in South Jakarta. Inundation data uses data recorded in the Automatic Rainfall Record at the Gunung sub-district station between 2022 and 2024. Based on the analysis results, it was found that the hourly rain distribution pattern in South Jakarta was in the first 2 hours with a percentage weight of 56.6% in the 1st hour and 43.4% in the 2nd hour (
Figure 8). With the large composition of rain that occurs in South Jakarta in the first 2 hours after the rain, the need for mobile pumps to catch lead time in handling floods in South Jakarta is very necessary.
For locations that are at risk, as assessed by the high impact of flooding and the duration of flooding, mobile pump equipment is needed, namely a weather prediction tool. This research focuses on comparing the two prediction tools that already exist on the BMKG website, namely Citra Radar and Satellite Himawari. In the box to the left is a weather radar image while in the box to the right is Satellite. According to BMKG, radar images depict the potential intensity of rainfall detected by weather radar. Measurement of the intensity of rainfall (precipitation) by weather radar is based on how much radar energy is reflected back by water droplets in the clouds and is described using the Reflectivity product which has units of dBZ (decibel). The greater the reflected energy received by the radar, the greater the dBZ value, and the greater the dBZ reflectivity value indicates the greater the intensity of the rain that occurs. The farthest/maximum range of the Reflectivity product from the BMKG radar is around 240 km from the radar location. The dBZ scale in the legend ranges from 5 - 75 which is expressed in a gradation of sky blue to light purple. If the color gradation is towards purple, the higher the intensity of the rain.
The second prediction tool that can be easily obtained from the BMKG website in the image box is Satellite. The Himawari-9 EH product shows the cloud top temperature obtained from radiation observations at a wavelength of 10.4 micrometers which is then classified with a certain coloring, where black or blue indicates there is not a lot of cloud formation (brighter), whereas the cooler the cloud top temperature, the where the color is close to orange to red, indicating significant cloud growth and the potential for the formation of Cumulonimbus clouds. From the comparison of the two, based on statistics, the author recommends BMKG Radar Image as the main choice for rain detection.
Based on model lab tests carried out at the Bandung Institute of Technology’s model test laboratory in 2024, it was found that the limit for flood depth at risk of floating is 75 cm. From the correlation between R and D, D is plotted as high as 75 cm and we get R of 138.6 mm/day, this is a return period of between 2 – 5 years. It can be said that a puddle height of 75 cm has a 20-50% chance of occurring.
Figure 9.
Radar and Satelite of BMKG Logistic Regression at different floods time.
Figure 9.
Radar and Satelite of BMKG Logistic Regression at different floods time.
In this research, the impacts considered are depth of flood and duration of flood. In the previous explanation, the risk of a flood depth of more than or equal to 75 cm occurs at a rain intensity of 138 mm/day with a chance of occurrence of 20-50%, which is quite a large chance of occurrence. With the chance of a large depth of flood occurring, of course the duration of flood also has a greater chance. This is assessed from the impact due to a duration of flood of more than 30 minutes which is more certain to occur compared to a depth of flood of 75 cm. So, to have a good impact on the depth of flood, let alone the duration of flood, mobile pump equipment is needed, one of which is a weather prediction tool.
From the Recursive Feature Elimination (RFE) method, which is a feature selection technique commonly used in machine learning to select the most important features for predictive models. The result of the RFE is a ranking of which variables (features) have the most influence on the equation relationship. As in the image of the running results in Jupyter Notebook, Radar has a ranking of 1 and Satellite has a ranking of 2. Apart from that, using the correlation method provided, the relationship between each variable and the weather prediction, whether raining (1) or not raining (0), is also compared. From the correlation results as shown in the image above, it was found that the Radar - Weather correlation (0.760069) was greater than the Satellite - Weather correlation (0.105467). Thus, based on these 2 methods, in this research the choice of weather prediction tool used was the BMKG Radar. Based on the conservation energy equation (3), the increase in pump head can be caused by the following influences:
Elevation difference between mobile pump inlet and outlet. In urban areas, the difference between one channel and another is considered not to be much.
The effect of mobile pump inlet and outlet hose friction. Influence of hose roughness, length and diameter of hose.
The effect of bending, contraction and widening of the mobile pump hose.
With an increase in pump head due to the influence of the above, the pump characteristic curve with just one pump will result in a smaller pump capacity. In this way, the pump efficiency will also be smaller. Because of the inverse relationship between pump efficiency and pump power, the pump power required will be greater. So it can be concluded that increasing the pump head by using rough hoses, lengthening the hose, bending the hose and using hose connections will require greater pump power.
Table 3 below is the result of optimizing the mobile pump and its equipment based on a hierarchy starting with a comparison of hydrological and hydraulic analysis calculations which are sorted into the following 2 conditions.
Insufficient channel capacity
-
Flood frequency
Zero flooding does not require a mobile pump.
-
Impact of flood depth and flood duration
Floods below a flood depth of 75 cm or a flood duration of 30 minutes do not require a mobile pump.
-
Inlet, storage and outlet condition c
A Pump selection require head, capacity and efficiency for design. This is depend on inlet, pump location (storage) and outlet.
-
Mobile pump entry access and number of mobile pump
There are several locations where it is not possible to enter mobile pumps and there are limited numbers of mobile pumps in South Jakarta.
-
Mobile pump equipment requirements e
The presence of a mobile pump but flooding still occurs needs to be optimized with Radar
Sufficient channel capacity
-
Flood frequency
Zero flooding does not require a mobile pump.
-
Impact of flood depth and flood duration
Floods below a flood depth of 75 cm or a flood duration of 30 minutes do not require a mobile pump.
-
Correlation of D and R
If D and R are not linear then the possible cause of flooding is due to rubbish, waste water discharge, sedimentation or other causes
-
Mobile pump entry access and number of mobile pumps
There are several locations where it is not possible to enter mobile pumps and there are limited numbers of mobile pumps in South Jakarta.
-
Mobile pump equipment requirements
The presence of a mobile pump but flooding still occurs needs to be optimized with Radar
-
SOP Pompa mobile
If there is a mobile pump, the SOP for the mobile pump that needs to be created is the use of radar, monitoring the inlet channel, activating the mobile pump and the condition of the mobile pump.
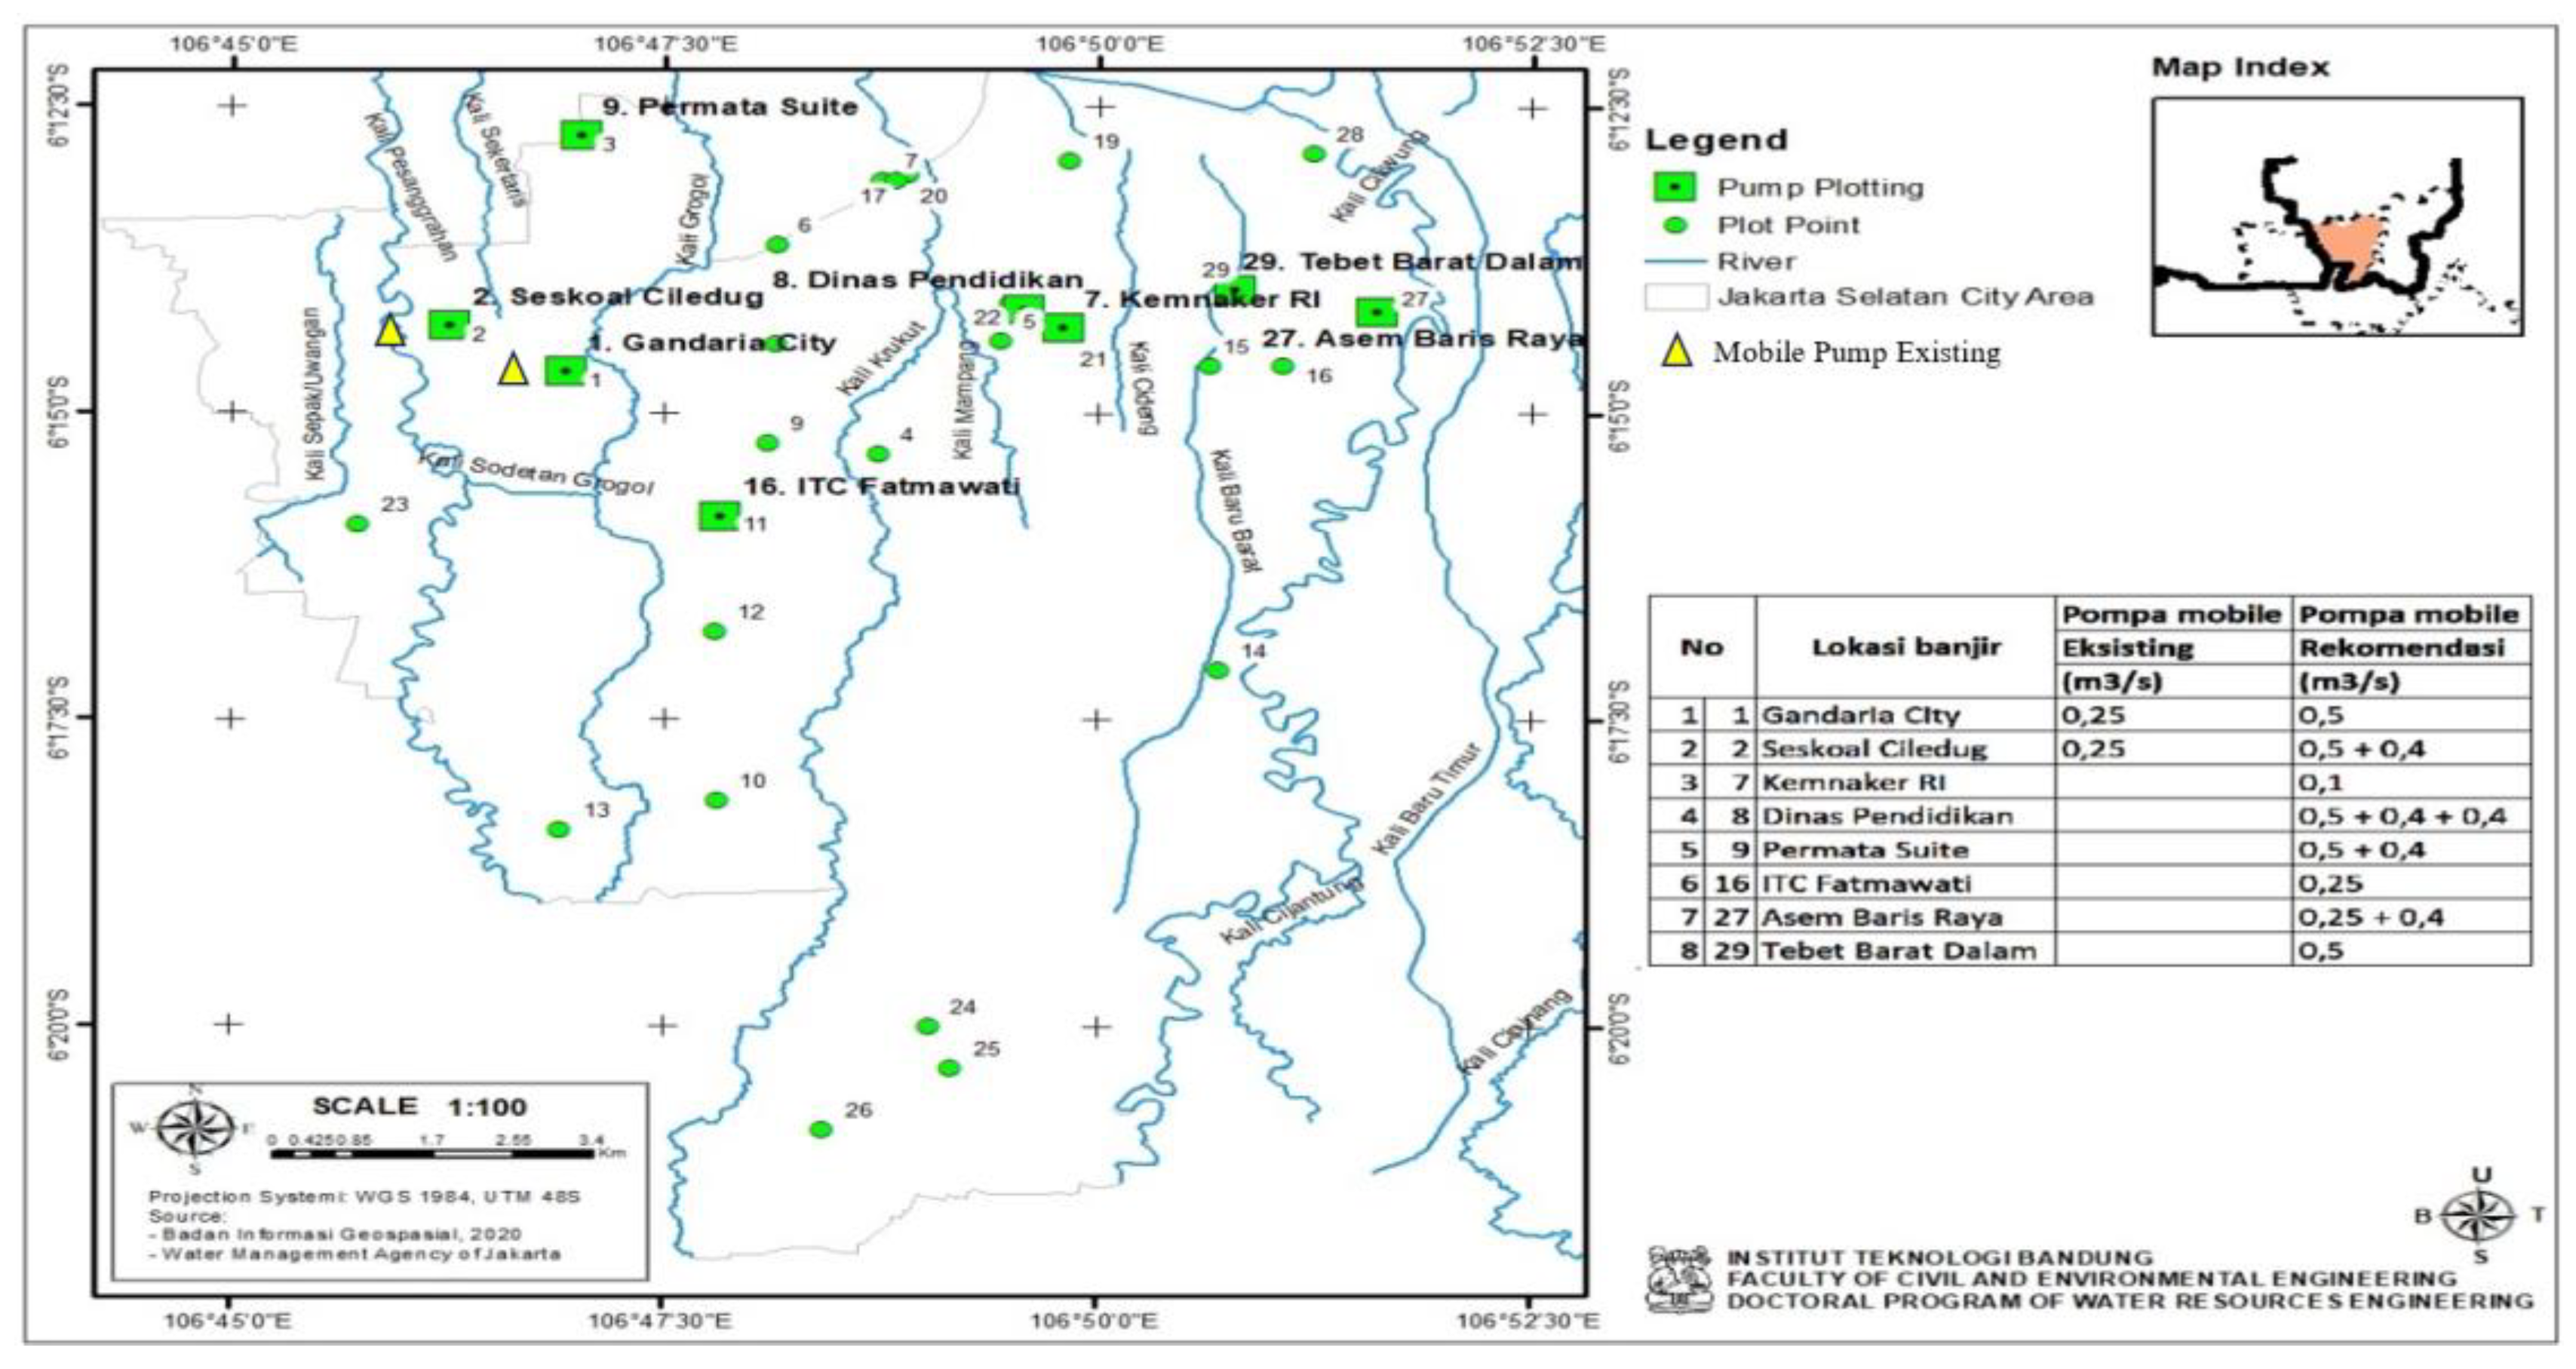
Figure 10.
Mobile pump distribution after optimization.
Figure 10.
Mobile pump distribution after optimization.
From the table above, through the selection explained in the pump selection flowchart above, initially there were 10 locations based on the frequency of flood events in 2022 and 2023. Although these ten locations had no impact on flood height because the flood height was never more than 75 cm However, in terms of the impact of the flood duration, Flood Duration (FD) has a flood duration of more than 30 minutes, so it is analyzed based on the next criteria, namely access to the mobile pump and inlet - outlet conditions. The Balai Rakyat and Betta locations have roads that are less than 3 meters wide, so it is not possible to access mobile pumps to these locations. In this way, a total of 8 locations are obtained that require mobile pumps and it is possible to install these mobile pumps. Of the eight locations, 4 are channels with insufficient capacity and the remaining four have sufficient channel capacity but still require a mobile pump. Some locations require more than 1 mobile pump. This is because these locations still lack the capacity to use only one pump. Apart from that, several locations have inlets and outlets that are less effective in conveying water, so additional mobile pumps are needed to compensate for the head characteristics of the system. For example, at the Seskoal Ciledug location, the channel turns 90 degrees twice. The first turn is at the inlet, the second turn is so that additional pump head is required.
After optimizing the placement of mobile pumps among the 29 pluvial flood locations above, the optimization was then focused on one of the locations that had been selected based on the analysis above. The location chosen is a small seskoal with a mobile pump modeled on HEC-RAS with a capacity of 0.5 m
3/s. The optimization of the mobile pump is carried out by analyzing the configuration of the mobile pump placement analyzed on the channel cross-section as shown in
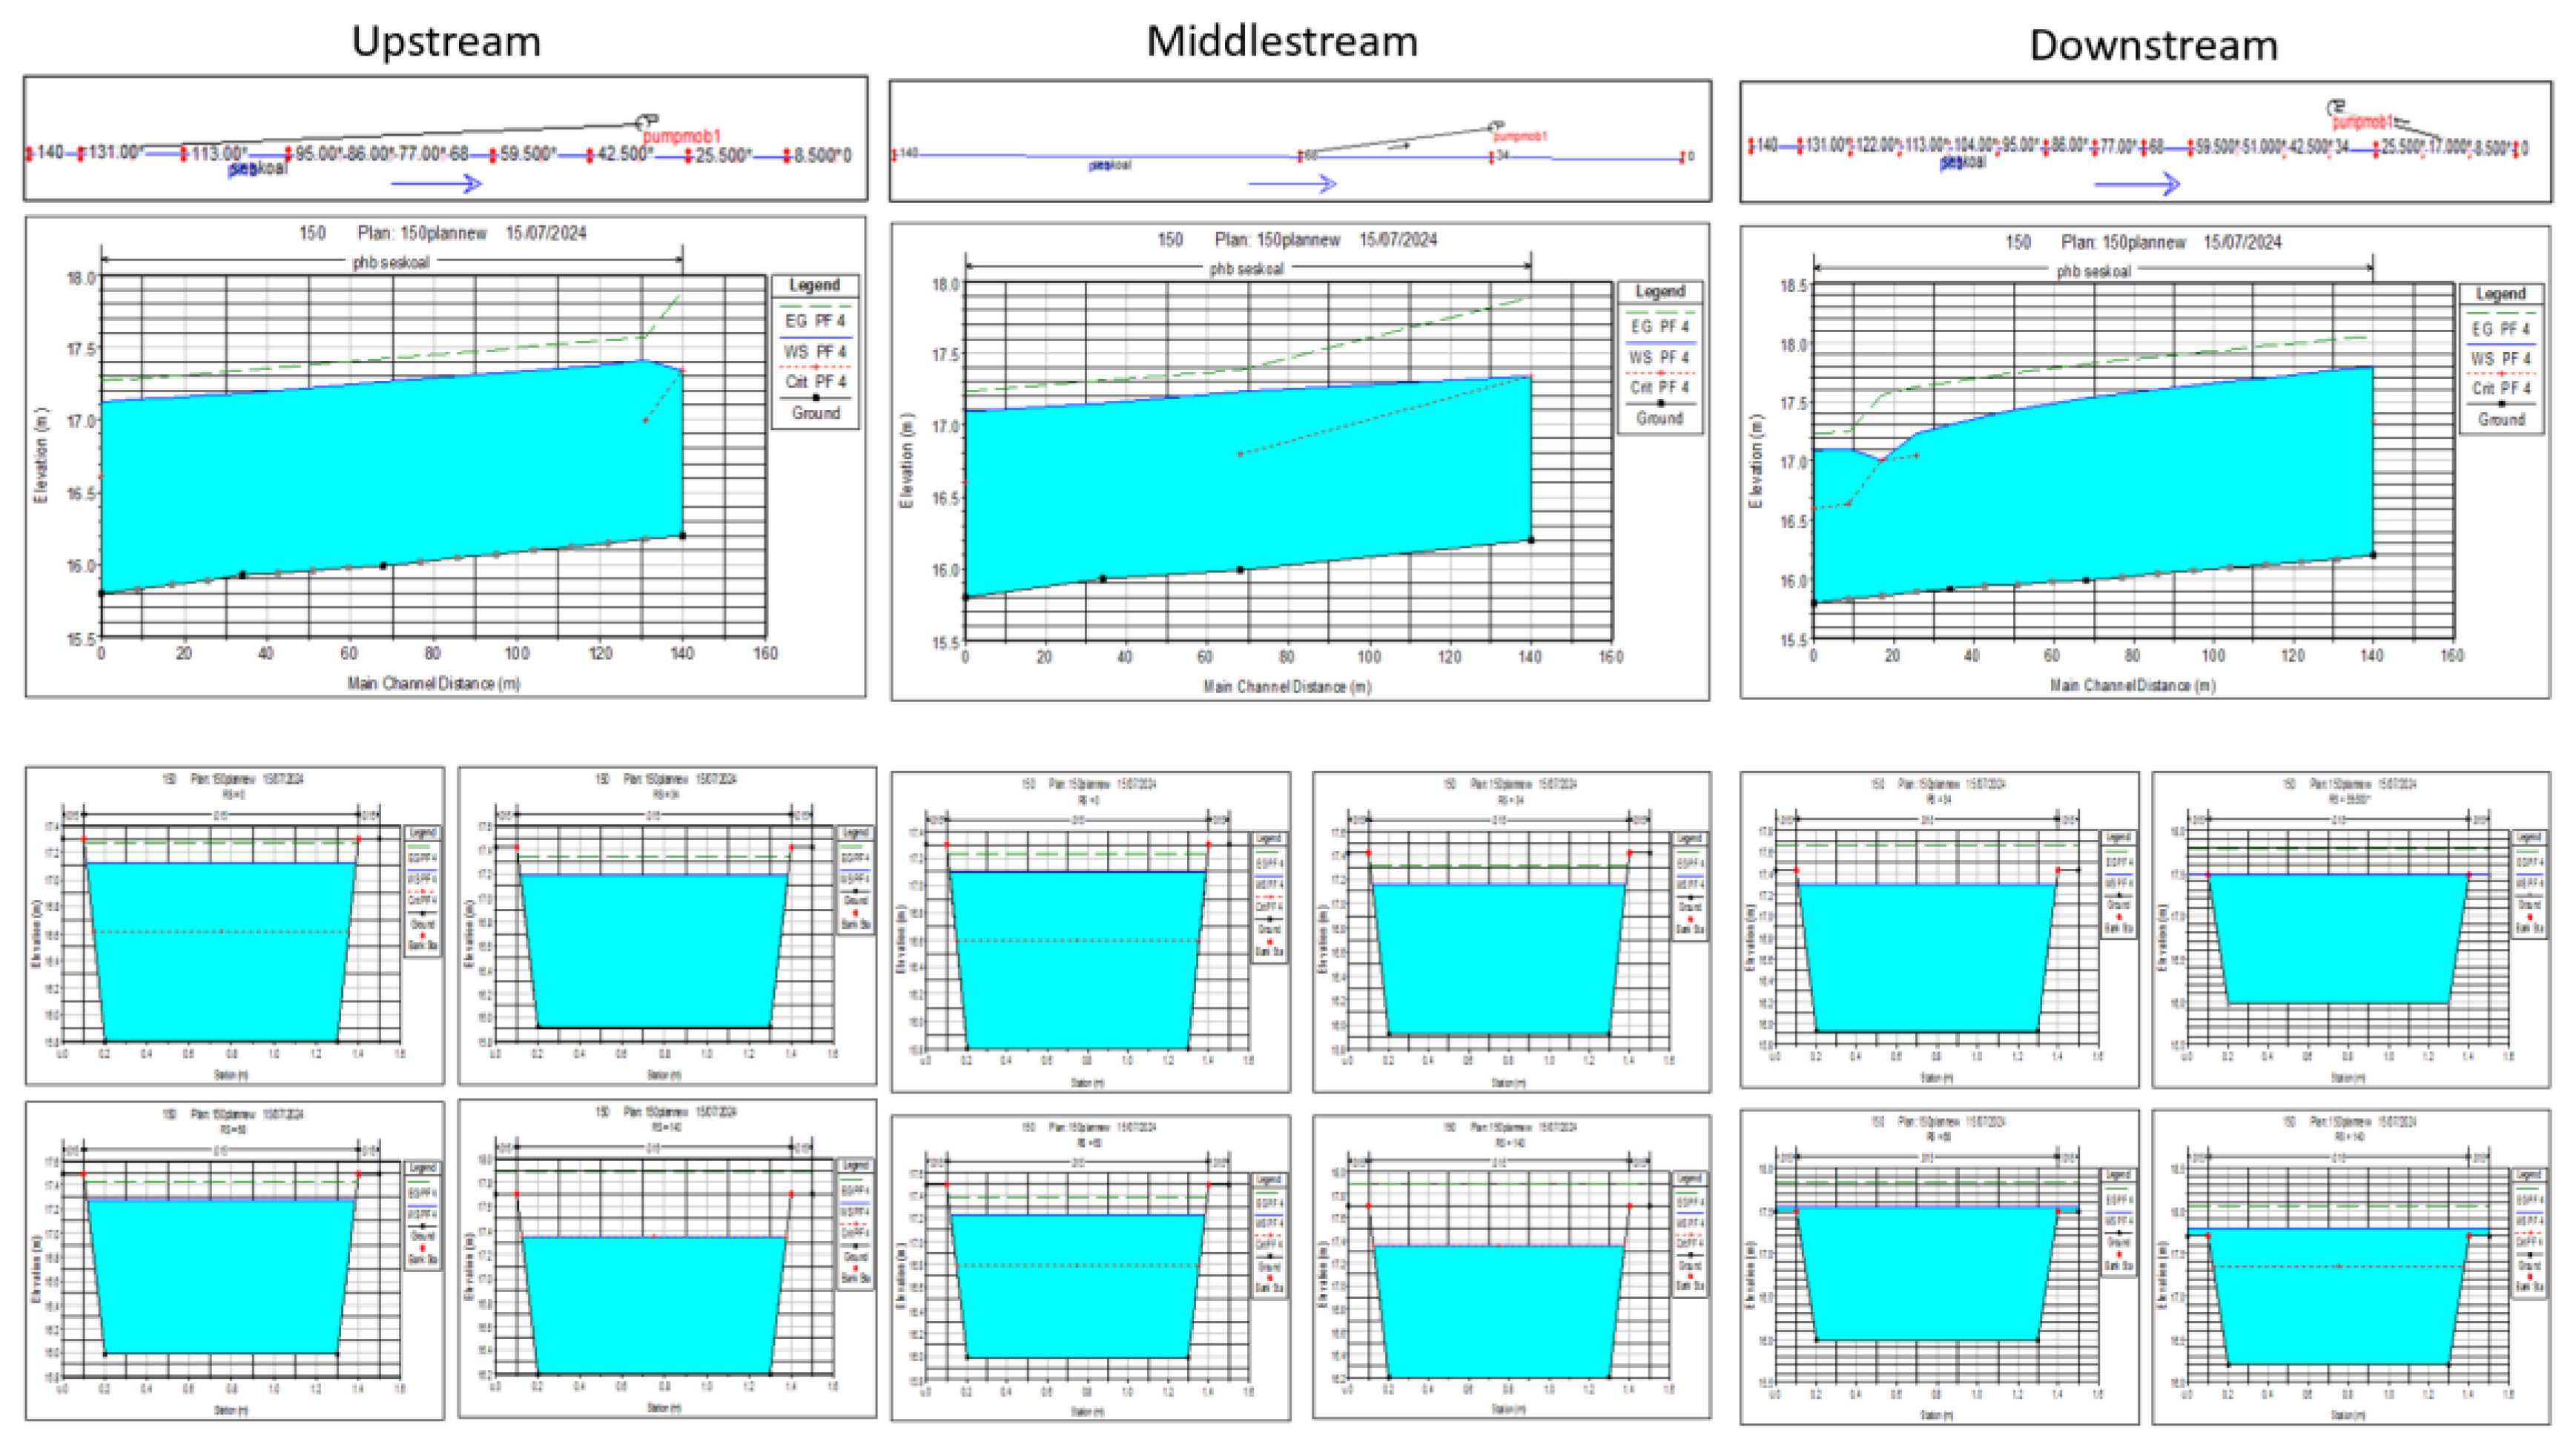
Figure 11. The analysis was carried out by simulation using HEC-RAS. The assumed outlet characteristic of a mobile pump is that the inlet and outlet are not in the same channel (out of system). This is to support the previous assumption that has also been made in the manual calculation in the methodology chapter that the outgoing discharge has no relationship with the capacity that is in the same channel. From the simulation results, it was found that the configuration heading to the upstream of the flooded channel cross-section showed the most optimal results (
Figure 12). The calculation of the water level based on HEC-RAS is recorded as shown in
Table 4. The most optimal drop is because the mobile pump is able to trim the flood hydrograph from the beginning, namely in the flooded upstream. The main obstacle in optimizing this configuration is finding the closest but different channel network in the watershed, especially with very limited land in the city.
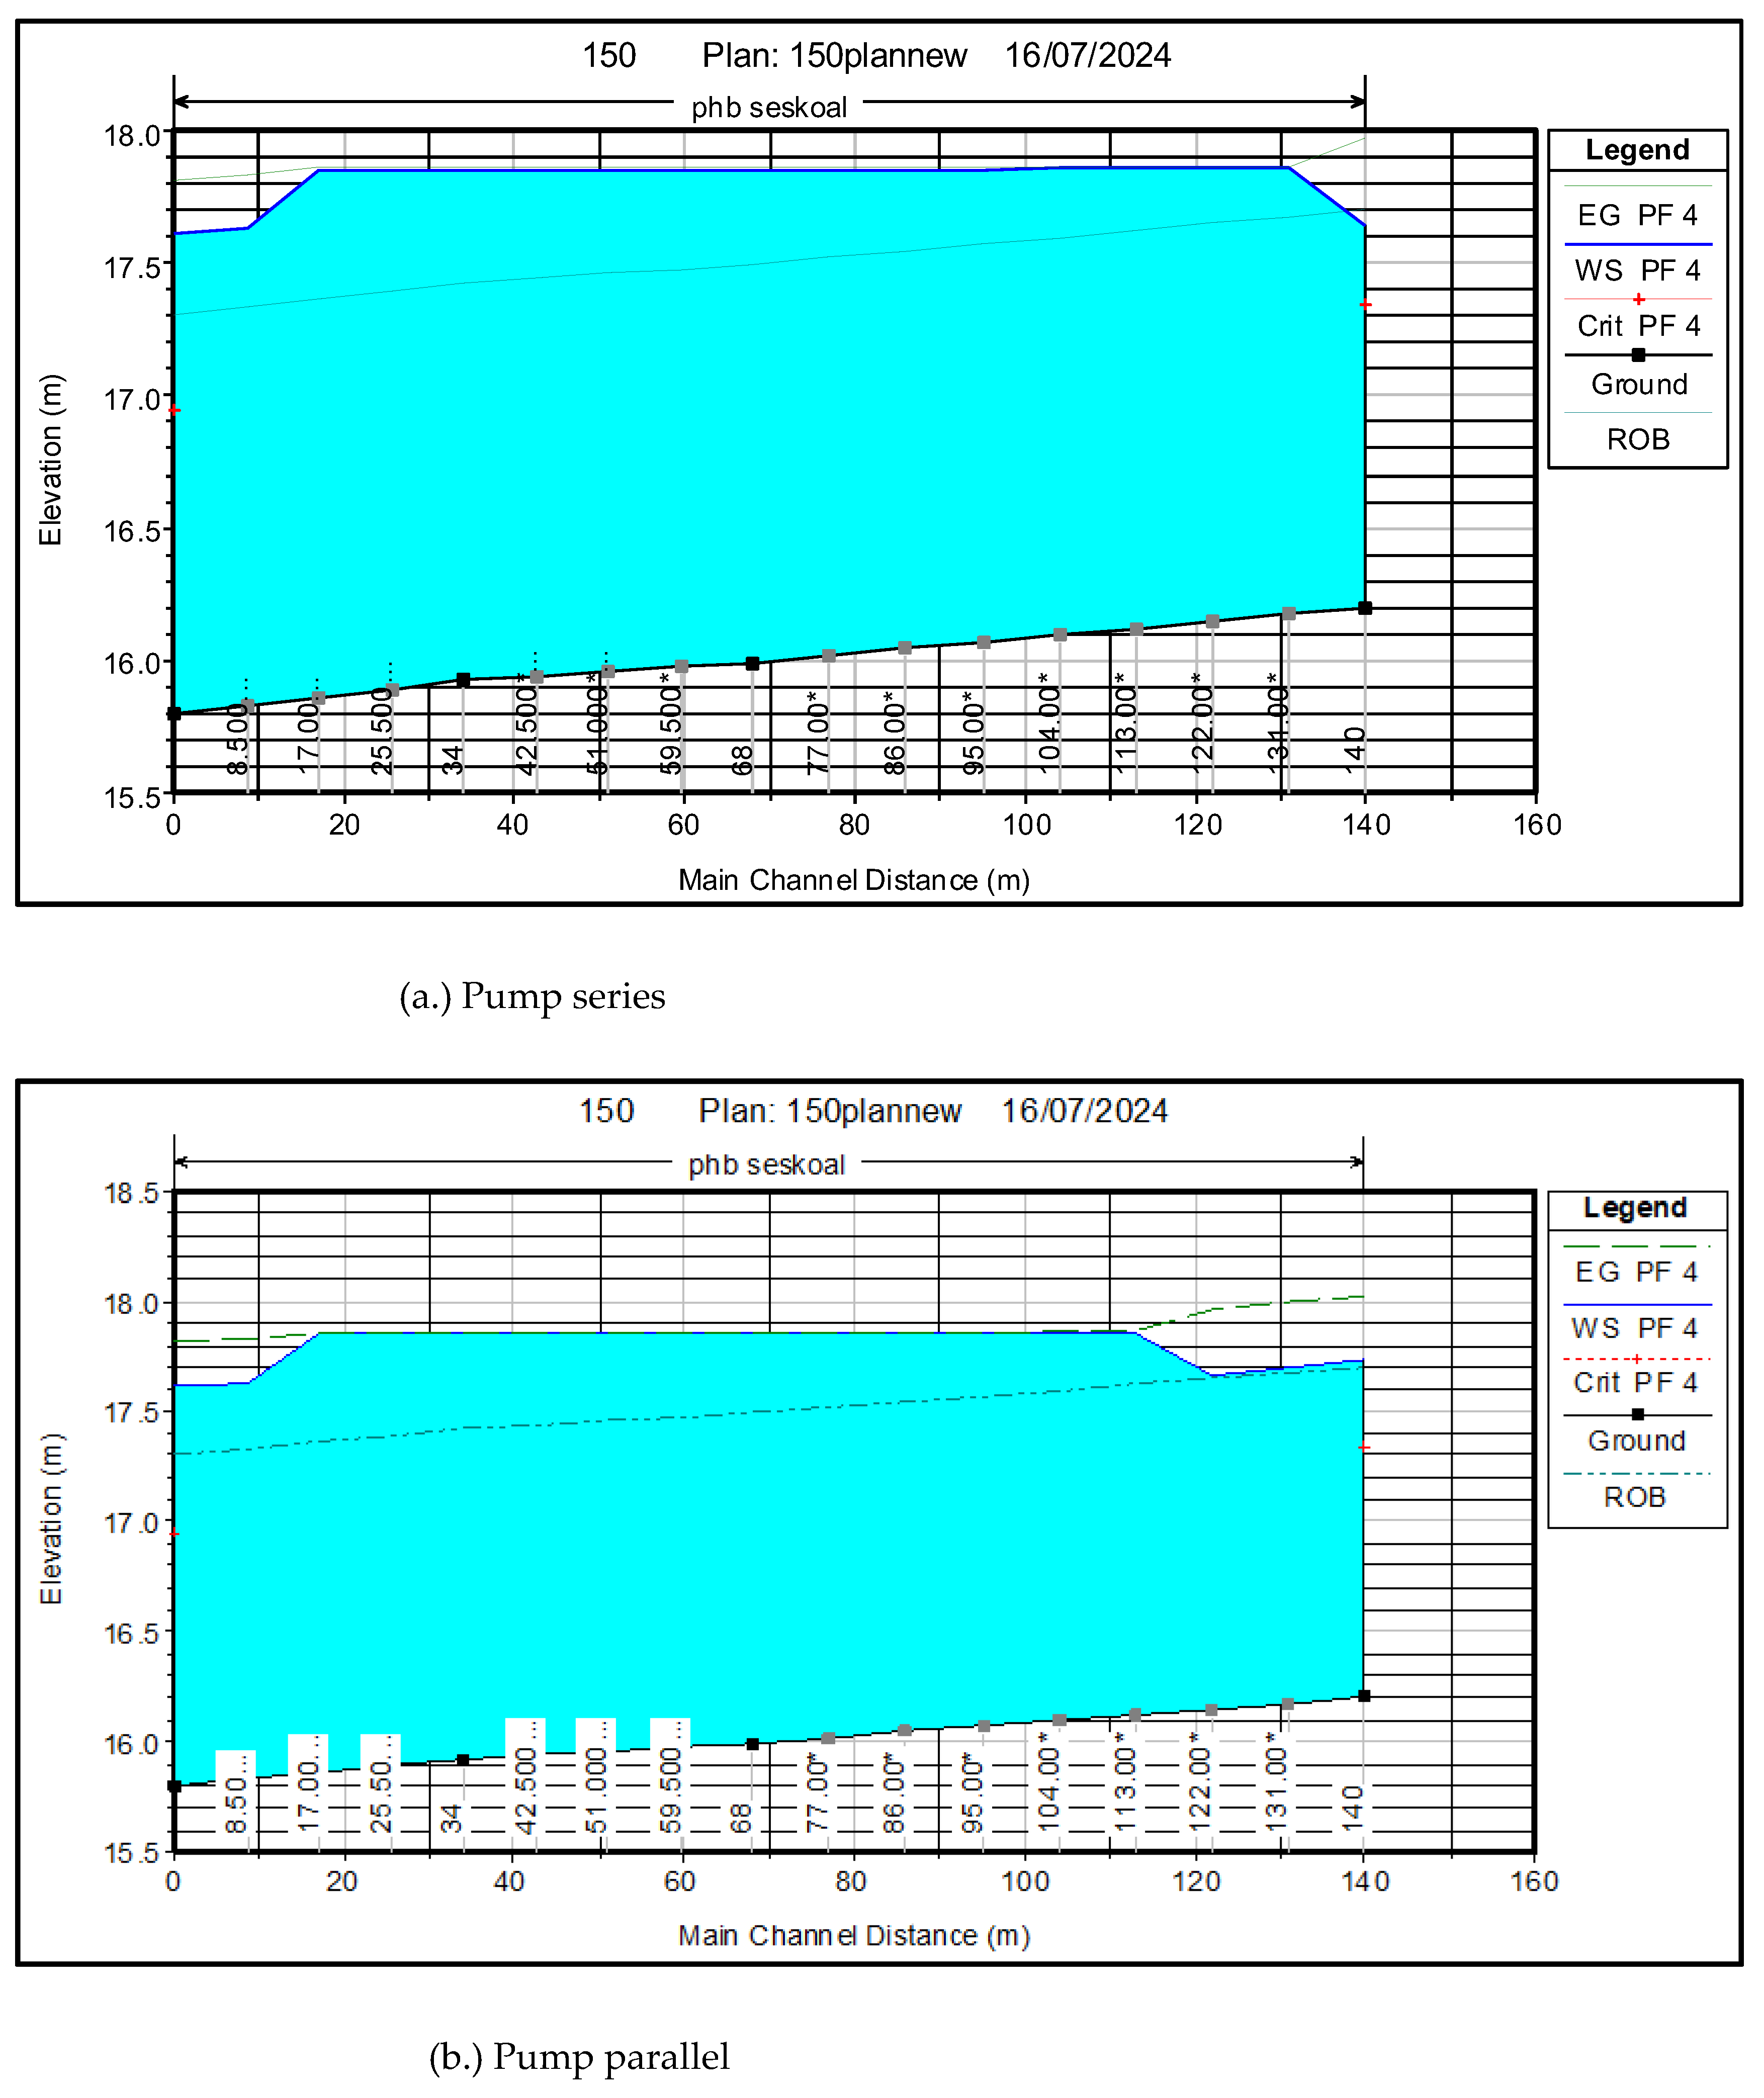
The use of more than 1 mobile pump on site can be done in series or parallel. Simulations with HECRAS were also carried out by comparing the two series. Through the simulation, it was found that mobile pumps with parallel use were more optimal compared to series installation. This can be explained that by using parallel mobile pumps, the discharge that comes out will increase, this is reversed with a series that is added with several pumps, then the discharge will remain the same. The use of 1 pump unit is also compared to 2 pumps in parallel in the upstream section of the channel. From the simulation results (
Figure 13), it was found that the use of more than 1 pump unit in parallel had more optimal results.
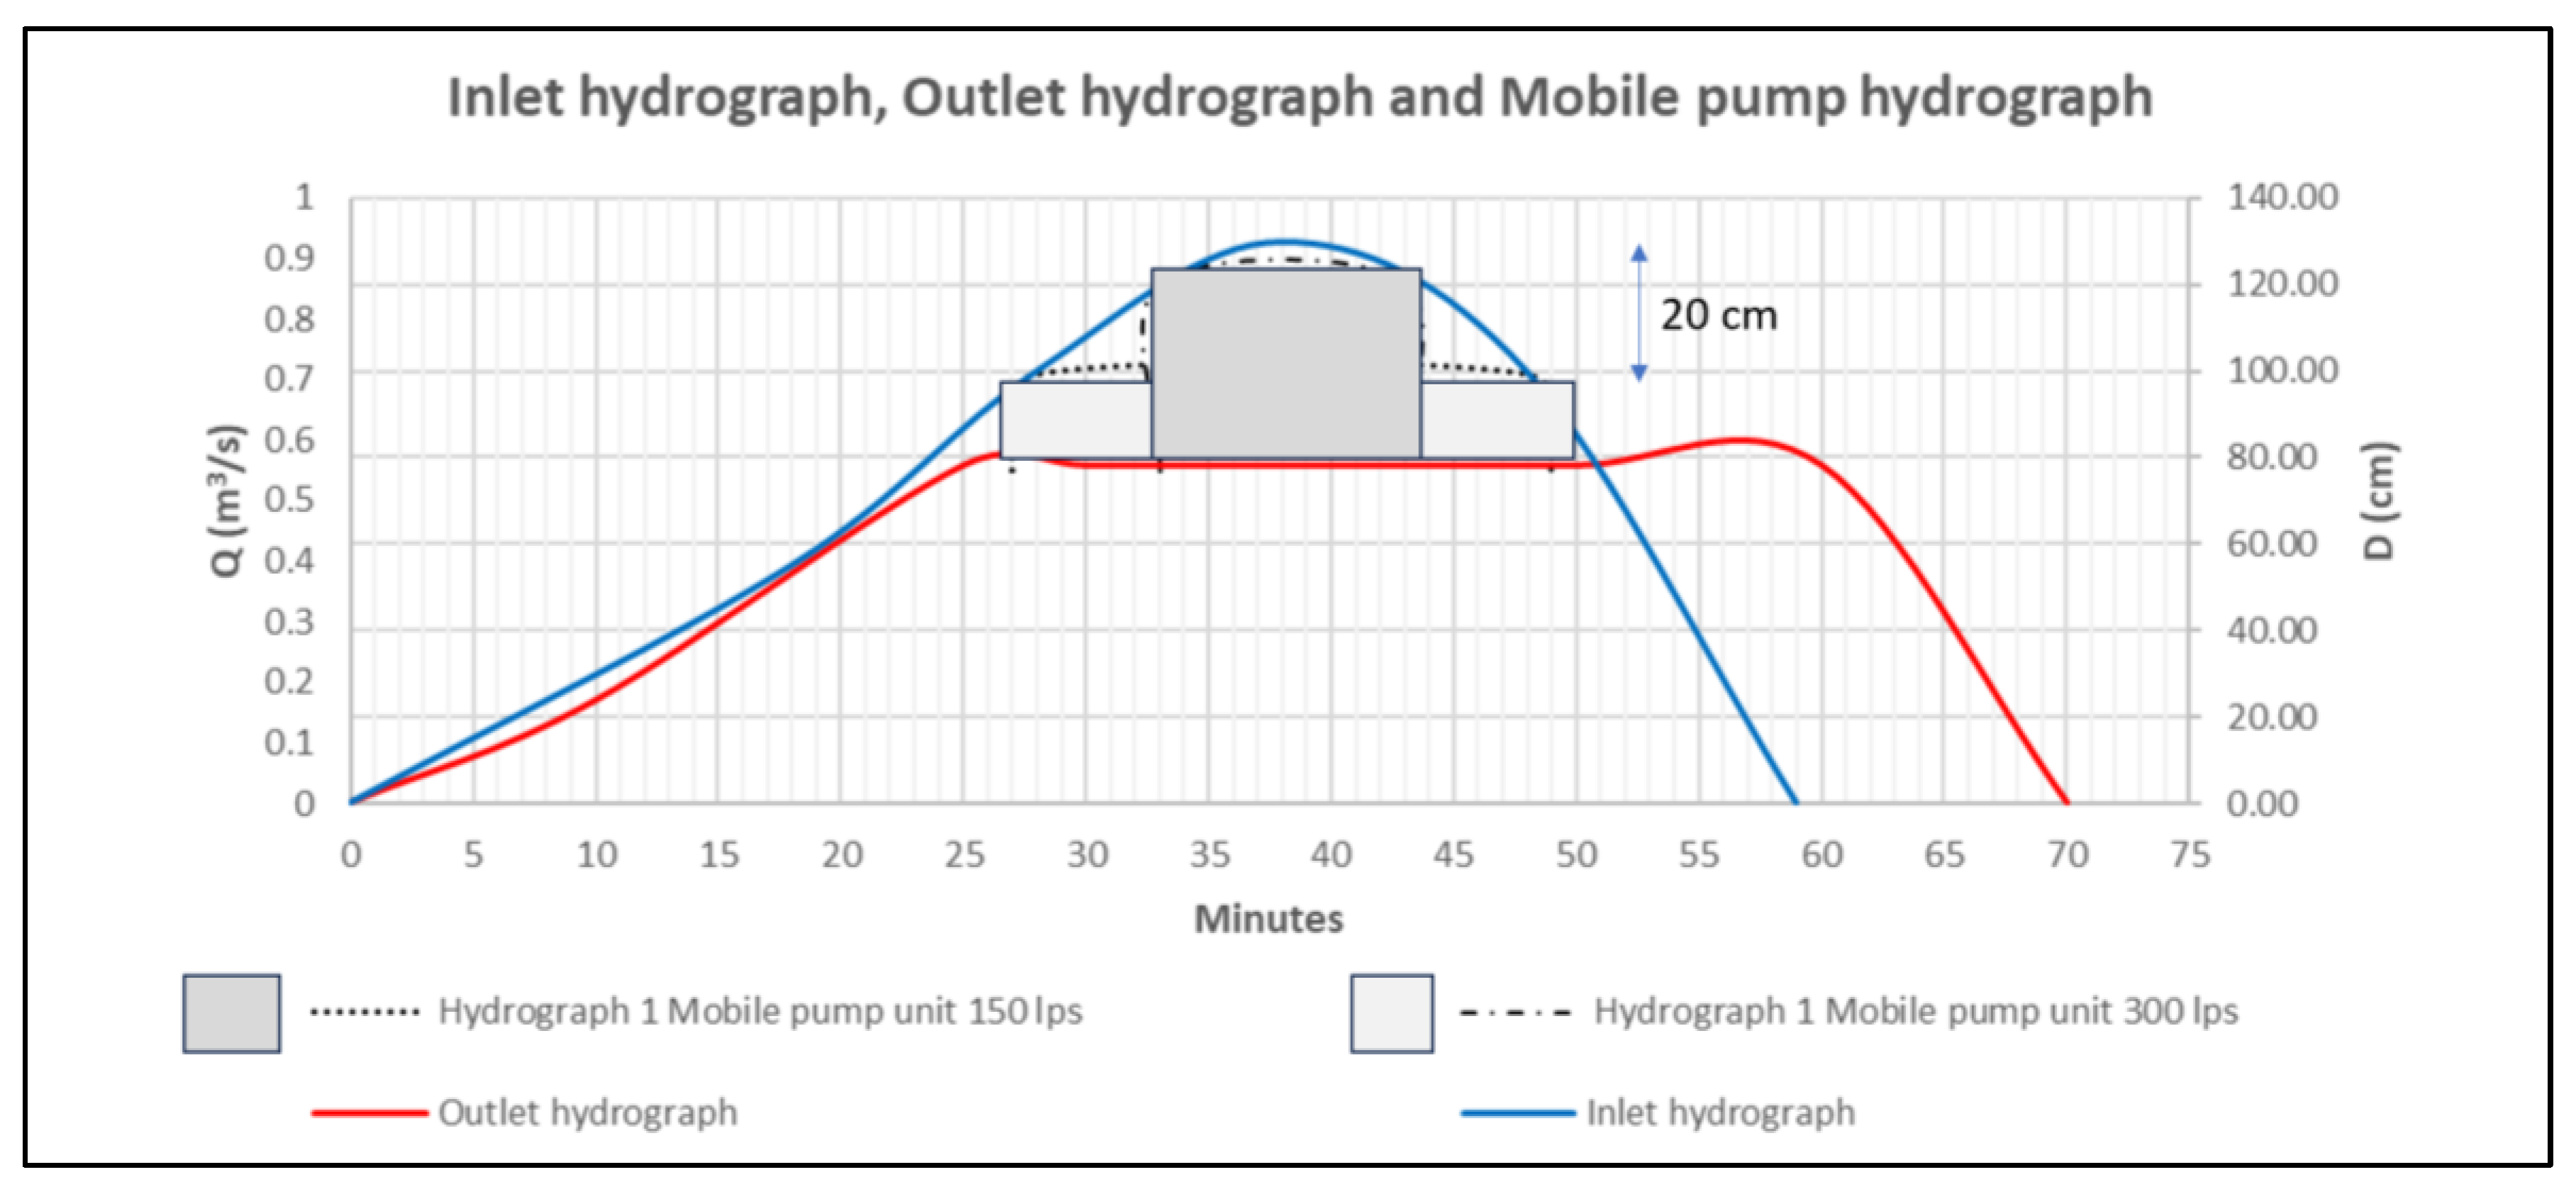
Apart from the configuration of the placement of mobile pumps above, optimization in the number of mobile pumps is also carried out as shown in the following figure 14. The occurrence of floods is due to inflow discharges that exceed outflow discharges. The use of mobile pumps is ideally by taking into account the difference between the inflow discharge and the outflow discharge. In the example above, the difference between inflow and outflow discharge is 0.33 m3/s, with a flood height of 50 cm. The mobile pump that can be used is a mobile pump with a capacity of 0.3 m3/s as much as 1 unit. At the same discharge, the mobile pump is equivalent to the use of 2 units of mobile pumps with a capacity of 0.15 m3/s. With the limited number and capacity of mobile pumps, the optimization carried out in this study is to use a mobile pump with a smaller discharge.
In the example above, using 1 unit of mobile pump size 0,15 m3/s can reduce the height of the flood up to 30 cm so that based on the danger index, the vehicle is allowed to be able to pass through the flooded road. The mobile pump is indeed used for a longer time, namely 20 minutes (the pump starts operating at the 28th minute and stops operating at the 48th minute) compared to using a mobile pump of 0.3 m3/s, which is 10 minutes (the pump starts operating at the 33rd minute and stops operating at the 43rd minute). The mobile pump with a capacity of 0.15 m3/s and a capacity of 0.3 m3/s determined based on the difference in inflow – outflow discharge can be moved to other flood locations that require mobile pumps. Thus, the efficiency of the number of mobile pumps in this example is included in the optimization of mobile pumps in this study.
In optimizing the use of mobile pumps, mobile pump equipment is required, including mobile pump fittings and mobile pump SOPs. The mobile pump equipment is a weather prediction tool, namely a radar connected to a SCADA system. Of the eight locations, there is 1 location that does not require radar, this is because the location is a dead end road which does not result in queues of vehicles that cause traffic jams. The location is inner west Tebet. SOP Mobile pumps are needed in locations that have inlets or outlets that have a lot of rubbish. Apart from that, the presence of a lot of rubbish in the inlet will cause the mobile pump to be prone to damage, so an SOP is needed. There are 3 locations that have a lot of waste based on the linearity relationship R and D so they require a mobile pump SOP, these locations are Seskoal Ciledug, ITC Fatmawati and Asembaris.
