1. Introduction
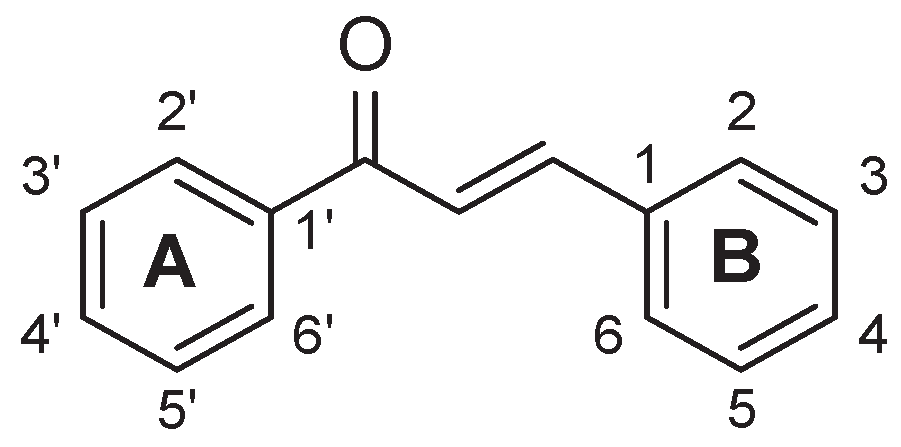
Chalcones are a large and substantial group of bioactive compounds among the leading categories of the flavonoid family. They consist of two aromatic rings (A and B) connected by a α,β-unsaturated carbonyl system (
Scheme 1). Chalcones possess a broad spectrum of biological activities such as antioxidant, antidiabetic, anti-inflammatory, neuroprotective, antiviral, antimalarial, antimicrobial, antifungal activity etc. [
1,
2,
3,
4,
5,
6]
Scheme 1.
General structure and numbering scheme of chalcones.
Scheme 1.
General structure and numbering scheme of chalcones.
Chalcones have been extensively used as lead compounds for the discovery of new drugs in medicinal chemistry and studies have shown that the free hydroxyl groups present at the aromatic rings A and B are essential to increase their biological activity.[
4]
2’-hydroxy-chalcones are characterized by a hydroxyl group (-OH) attached to the second carbon atom of the A ring. The presence of the hydroxyl group can influence the chemical properties and biological activities of these compounds.[
7] 2´-hydroxy-chalcones have been studied for various biological activities, including among others anti-inflammatory,[
6,
8] anticancer,[
9] antioxidant,[
3,
4,
7] properties as well as for their potential use as inhibitors of lipoxygenases (LOXs)[
3,
4]. Studies of compounds with LOX inhibition activity highlight their potential as valuable pharmacological agents.
LOX are iron-containing enzymes widely found in plants, and animals. They catalyze the oxygenation of polyunsaturated fatty acids such as arachidonic acid (in mammals) and linoleic acid (in plants) generating lipid hydroperoxides. LOX inhibitors are of great interest due to the implication of the enzyme to various pathophysiological conditions. Therefore, LOX consists a potential target for the rational drug design and discovery of inhibitors for the treatment of variety of disorders.[
3,
10,
11]
In continuation of previous findings regarding the ability of various 2´-hydroxy-chalcones to act as soybean LOX inhibitors[
3,
4,
12], in this work, two 2´-hydroxy-chalcones possessing a 4-methyl and a 4-chloro substituent at ring B (
Scheme 2, chalcones
1 and
2) were selected to be further studied implementing a combination of NMR spectroscopy and computational analysis.
Scheme 2.
Structures of chalcones 1 and 2.
Scheme 2.
Structures of chalcones 1 and 2.
These studies were conducted in an effort to identify the effect of different structural characteristics that possibly contribute to the inhibition of LOX-1, LOX-5 and LOX-15 activity. According to the literature, the activity of 2´-hydroxy-chalcones is enhanced by introducing substituents such as a chloro or a methoxy group at position 4 of ring B.[
13]
Thus, in an effort to study the effect of the presence of heteroatoms on the aromatic ring B, in the present study, two chalcones with different substitution on position 4 of ring B were synthesized. Specifically, chalcone 1 possesses an electron-donating methyl group on position 4 of the ring B, while chalcone 2 bears an electron withdrawing Cl group at the same position.
The interaction profile of the studied chalcones with LOXs were revealed through Saturation Transfer Difference (STD) NMR (Nuclear Magnetic Resonance) and molecular docking and molecular dynamics simulations. The conformational analysis was carried out using density functional theory (DFT) calculations. Finally, the in vitro activity at LOX-1 and LOX-15 of the synthesized chalcones was evaluated.
These studies are important for determining the compounds’ ability to bind and remain stable within the enzyme’s active site. Additionally, the findings of the present work can provide a more comprehensive understanding for designing new chalcones with optimized LOX inhibition activity.
2. Materials and Methods
General Procedure for the Synthesis of Chalcones
2′-Hydroxy-chalcones
1 &
2 (
Scheme 2) were synthesized via the Claisen– Schmidt condensation reaction between 2-hydroxy-acetophenone and the appropriate benzaldehydes in basic conditions according to previously published procedure.[
3]
More specifically, in an ethanolic solution of the 2-hydroxy-acetophenone (1 equiv) and a substituted benzaldehyde (1 equiv) was added 20% w/v aqueous KOH solution. The mixture was stirred at room temperature for 24 h and then the reaction mixture was cooled to 0 oC and acidified with a 10% aqueous HCl solution. A yellow precipitate was formed, which was filtered and washed with 10% aqueous HCl solution. The compounds were further purified by recrystallization.
2′-Hydroxy-4-methyl-chalcone (1) Prepared following the general procedure starting from 2-hydroxy-acetophenone (265 μL, 2.20 mmol) and p-methyl-benzaldehyde (259 μL mg, 2.20 mmol), dissolved in 5.4 mL ethanol and KOH (20% aqueous solution, 1.8 mL). The product was obtained after recrystallization from hexane/ethyl acetate as a yellow powder. Yield: 385.4 mg (70%). M.p. 117–119 °C (Ref.[
3] 116-117).
1H NMR (400MHz, CDCl3): δ (ppm) 12.90 (s,1H, OH),7.95 (m, 2H, H6´&HB), 7.65 (d,1H, J=15.4 Hz, HA), 7.59 (d, 2H, J=8.0 Hz, H2&H6), 7,52 (ddd, 1H, J=8.6, 7.2, 1.6 Hz, H4´), 7.27 (d, 2H, J=8.6 Hz, H3&H5), 7.05 (dd, 1H, J=8.4, 1.2 Hz, H3´), 6.97 (ddd, 1H, J=7.87, 0.73 Hz, H5´), 2.42 (s, 3H,-CH3).
2′-Hydroxy-4-chloro-chalcone (2) Prepared following the general procedure starting from 2-hydroxy-acetophenone (354 μL, 2.94 mmol) and p-chlorobenzaldehyde (413.2 mg, 2.94 mmol), dissolved in 7.2 mL ethanol and KOH (20% aqueous solution, 2.4 mL). The product obtained after recrystallization from methanol as a yellow-orange solid. Yield: 620.4 mg (78%). M.p. 148–151
oC (Ref.[
3] 153-156).
1H NMR (400MHz, CDCl3): δ (ppm) 12.75 (s,1H, OH), 7.91 (d, 1H, J=8.0 Hz, H6´), 7.87 (d, 1H, J=15.5 Hz, HB), 7.65-7.59 (m, 3H, H2, H6 & HA), 7,51 (t, 1H, J=7.8 Hz, H4´), 7.42 (d, 2H, J=8.1 Hz, H3&H5), 7.04 (d, 1H, J=8.4 Hz, H3´), 6.95 (t, 1H, J=7.6 Hz, H5´).
Structure Assignment
The structure identification of the three molecules was conducted utilizing 600 and 850 MHz spectrometers (Bruker Avance Spectrometer, Billerica, MA, USA) located at the National and Kapodistrian University of Athens, the National Institute of Chemistry in Ljubljana and at the University of Helsinki. This involved employing 1D and 2D homonuclear and heteronuclear experiments. The pulse sequences utilized were found from the spectrometer’s library. Finally, the spectra were processed and examined using the MestreNova (Santiago de Compostela, Spain) and TopSpin 4.2.0 software packages.[
14,
15,
16,
17,
18]
Saturation Transfer Difference (STD) NMR
For STD experiments, NMR samples were prepared by dissolving each chalcone in DMSO, followed by addition of potassium phosphate buffer pH 7.2 in D
2O, resulting in a total volume of 600 µL with a concentration of 20 mM buffer and pH 7.2 in 99.9% D2O. Specifically, chalcone
1 was dissolved in 192 uL and chalcone
2 in 206 uL of DMSO. The concentration of each compound in the NMR tube (600 µL) was 0.1 mM, while the protein (soybean LOX-1 and LOX-5) concentration was 1 uM, yielding a protein-ligand ratio of 1:100. The final concentration in the NMR tube (600 uL) was 1000 uM for the ligand and 1 uM for the enzyme yielding a protein-ligand ratio 1:1000. These samples were then subjected to STD experiments at 25°C.[
2,
19,
20,
21]
Induced Fit Docking
Induced fit docking was utilized to explore potential binding interactions between and the active site of LOX-1, 15-LOX and 5-LOX enzymes. These enzymes were chosen as a potential target due to findings from our literature review suggesting that chalcones substructures could act as potent enzyme inhibitors.[
26,
27] Additionally, analysis with the Swiss Target webtool identified LOX as a promising target for the two molecules. The crystal structures used for the computational studies was PDB ID 5T5V[
28], 2POM[
29] and 3O8Y[
30].
In silico calculations were carried out using the Protein Preparation Wizard in the Schrödinger Suite to process the crystal structure. To address computational challenges related to LOX as a metalloprotein, the presence of the Fe3+ cation in its active site was managed using the “create zero-order bonds to metals” tool in Schrödinger’s Maestro platform. This tool breaks pre-existing bonds to metals and forms new zero-order bonds between the metals and nearby atoms, while adjusting formal charges to align with the coordination geometry obtained from X-ray data. The four compounds were then sketched in Schrödinger’s Maestro molecular modeling platform and minimized using Macromodel.[
31] and DFT calculations. LigPrep was employed for 3D model preparation, considering stereochemistry features, and the “add metal binding states” option was chosen to ensure successful binding. Optimization of geometries with MacroModel retained proper chiralities. OPLS2005[
32] force field was used for minimization and consideration of protonation states at physiological pH. Chemically accurate 3D models were created using the Hammett and Taft methods combined with an ionization tool. The ligand structures were then minimized with water as the solvent and OPLS2005 as the chosen force field. To explore energetically favorable conformations, a mixed-torsional/low-sampling conformational search was conducted, with the most stable conformation selected for docking studies. The Induced Fit Docking (IFD) approach in the Schrödinger Suite was employed for these docking calculations. The ligand was docked using five energetically favorable conformations generated by Macromodel. Prior to docking, protein preparation involved constrained refinement, which included automatic trimming of side chains based on B-factor and Prime refinement of the protein’s side chains. The Glide/XP docking tool was used, with the active site’s dielectric constant set to 80 and crystallographic waters retained during the docking process.
Molecular Dynamics
The MD studies[
33] were done with SPC/E-modeled water molecules surrounding the drug-protein complex. The solution was neutralized using sodium (Na⁺) and chloride (Cl⁻) ions until the salt concentration reached 0.150 M NaCl. The N-terminal of the protein was modified with an acetyl group, while the C-terminal was left uncapped due to its role in the protein’s active site. Protein-ligand interactions were simulated with the OPLS2005 force field, and long-range electrostatic interactions were accounted for using the particle mesh Ewald (PME) technique[
34,
35] and a grid spacing of 0.8 Å. Van der Waals and short-range electrostatic interactions were smoothly truncated at 9.0 Å. Temperature was maintained using the Nose-Hoover thermostat[
36], and pressure was controlled using the Martyna-Tobias-Klein[
35] method. Periodic boundary conditions were applied, and the simulation box dimensions were (10.0 × 10.0 × 10.0) Å. The equations of motion were integrated using the multistep RESPA integrator[
37] with an inner time step of 2 fs for bonded interactions and non-bonded interactions within a cutoff of 9 Å. An outer time step of 6.0 fs was used for non-bonded interactions beyond the cutoff. Each system underwent equilibration using the default protocol provided by Desmond.[
38] The system was initially relaxed using Brownian dynamics simulation within the NVT ensemble at 310 K, applying restraints on the heavy atoms of the solute. This was followed by a relaxation step in the NPT ensemble without restraints for 1.0 ns, after which the production phase of the molecular dynamics (MD) simulation was initiated, lasting 200 ns to ensure sufficient data for analyzing the molecule’s binding to the protein cavity. The MD simulations were performed on workstations utilizing GPU-accelerated MD codes, with simulation performance evaluated by examining the RMSD convergence of the protein backbone’s Cα atoms and the ligand’s RMSD.
Theoretical Absorption and Fluorescence Spectra
UV-vis absorption and fluorescence spectra were computed by employing the TD-DFT method at the BP86/def2-SVP and B3LYP[
39,
40]/def2-SVP level of theory. Specifically, for the UV-vis absorption spectra, 10 singlet excited states were calculated for the free molecules optimized at DFT level and encapsulated at LOX-5 and 1-LOX using the MD geometry. For the calculation of the emission spectra, the molecules were geometry optimized for the 1
st and second excited state. It has been shown that the used functional, i.e., B3LYP, can provide accurate results on absorption and emission spectra.[
41] All calculations and the visualization of the results was carried out via Gaussian 16[
42] and ORCA.
Enzyme inhibition studies
Activity assay: The h-15LOX1 was expressed in BL21 (DE3)
E. coli cells and the cell lysate was used for the activity assay, as described before.[
43,
44,
45,
46] Briefly, the conversion of linoleic acid to 13S-hydroperoxy-9Z,11E-octadecadienoic acid (13(S)-HpODE) was observed through UV absorbance at 234 nm over time with a ThermoFisher Varioskan Plate Reader and a Greiner Bio-One F-Bottom 96-well plate. The measurement took place for 20 min with an interval time of 20 sec. Only the linear part was used for the determination of the enzymatic activity, typically extending over the first 1-5 min depending on the enzyme concentration. After that, the conversion rate slows down due to the consumption of the substrate. The activity assay was used for the determination of the optimum concentration of the cell lysate (x200 times dilution in assay buffer: 50 mM HEPES, 50 mM NaCl, pH 7.5). Linoleic acid (Sigma Aldrich, L1376) was diluted in ethanol. The same experimental approach was used for the determination of the optimal concentration of soybean Lipoxidase (Sigma Aldrich, L7395) (x16,000 times dilution in assay buffer: 50 mM Tris, 50 mM NaCl, pH 7.5).
Screening UV assay: For the evaluation of the inhibitory potency of the compounds the same experimental approach based on the absorption of 13(S)-HpODE at 234 nm was used. All the compounds were dissolved in DMSO at a final concentration of 4 mM. Then, they were diluted with assay buffer and tested at 100 μΜ. Each compound was mixed with the diluted cell lysate/soybean Lipoxidase and after a 10-minute incubation at RT, the linoleic acid was added at a final concentration of 25 μΜ. All the values were normalized by setting as 100% the absence of the inhibitor. Compounds in test samples with enzyme activity less than 50% were considered as hits. Each measurement was performed in triplicate and all data were processed with Microsoft Excel Professional Plus 2021 and GraphPad Prism 9.0.0 software.
3. Results
Structure elucidation of chalcones 1 and 2

The identification for chalcone
1 started from the two doublets at 7.83 and 8.05 ppm, which correspond to H
A and H
B, as has been previously reportedin the literature.[
3] Through 2D-NOESY, H2 and H3 are identified, because H
B has a correlation with H2. Through 2D-HSQC, the corresponding carbons are also identified, because they exhibit
1J
C-H coupling with the corresponding protons. A correlation was then observed in 2D-NOESY between H
A and a proton at 8.25 ppm. This corresponds to H6′, because it is the only proton which is in close vicinal proximity to H
A and shows a doublet because it correlates to one proton. Through 2D-NOESY from H6′ the remaining protons were identified. Through 2D-HSQC, the corresponding carbons are also identified, because they show
1J
C-H coupling with the corresponding protons. From the two-dimensional spectrum
13C-
1H 2D HSQC of the studied molecule, all the carbons of the molecule are identified except for the quaternary and carbonyl carbons. The remaining carbons can be identified via
13C-
1H 2D HMBC. In particular, it is observed that H
A showed
2J
C-H correlation with C1, H2 showed
3J
C-H correlation with C4 and H6′ showed
3J
C-H correlation with C2′ and
2J
C-H correlation with C1′. With this approach, the comprehensive assignment of every proton and carbon atom of chalcone
1 was successfully accomplished.
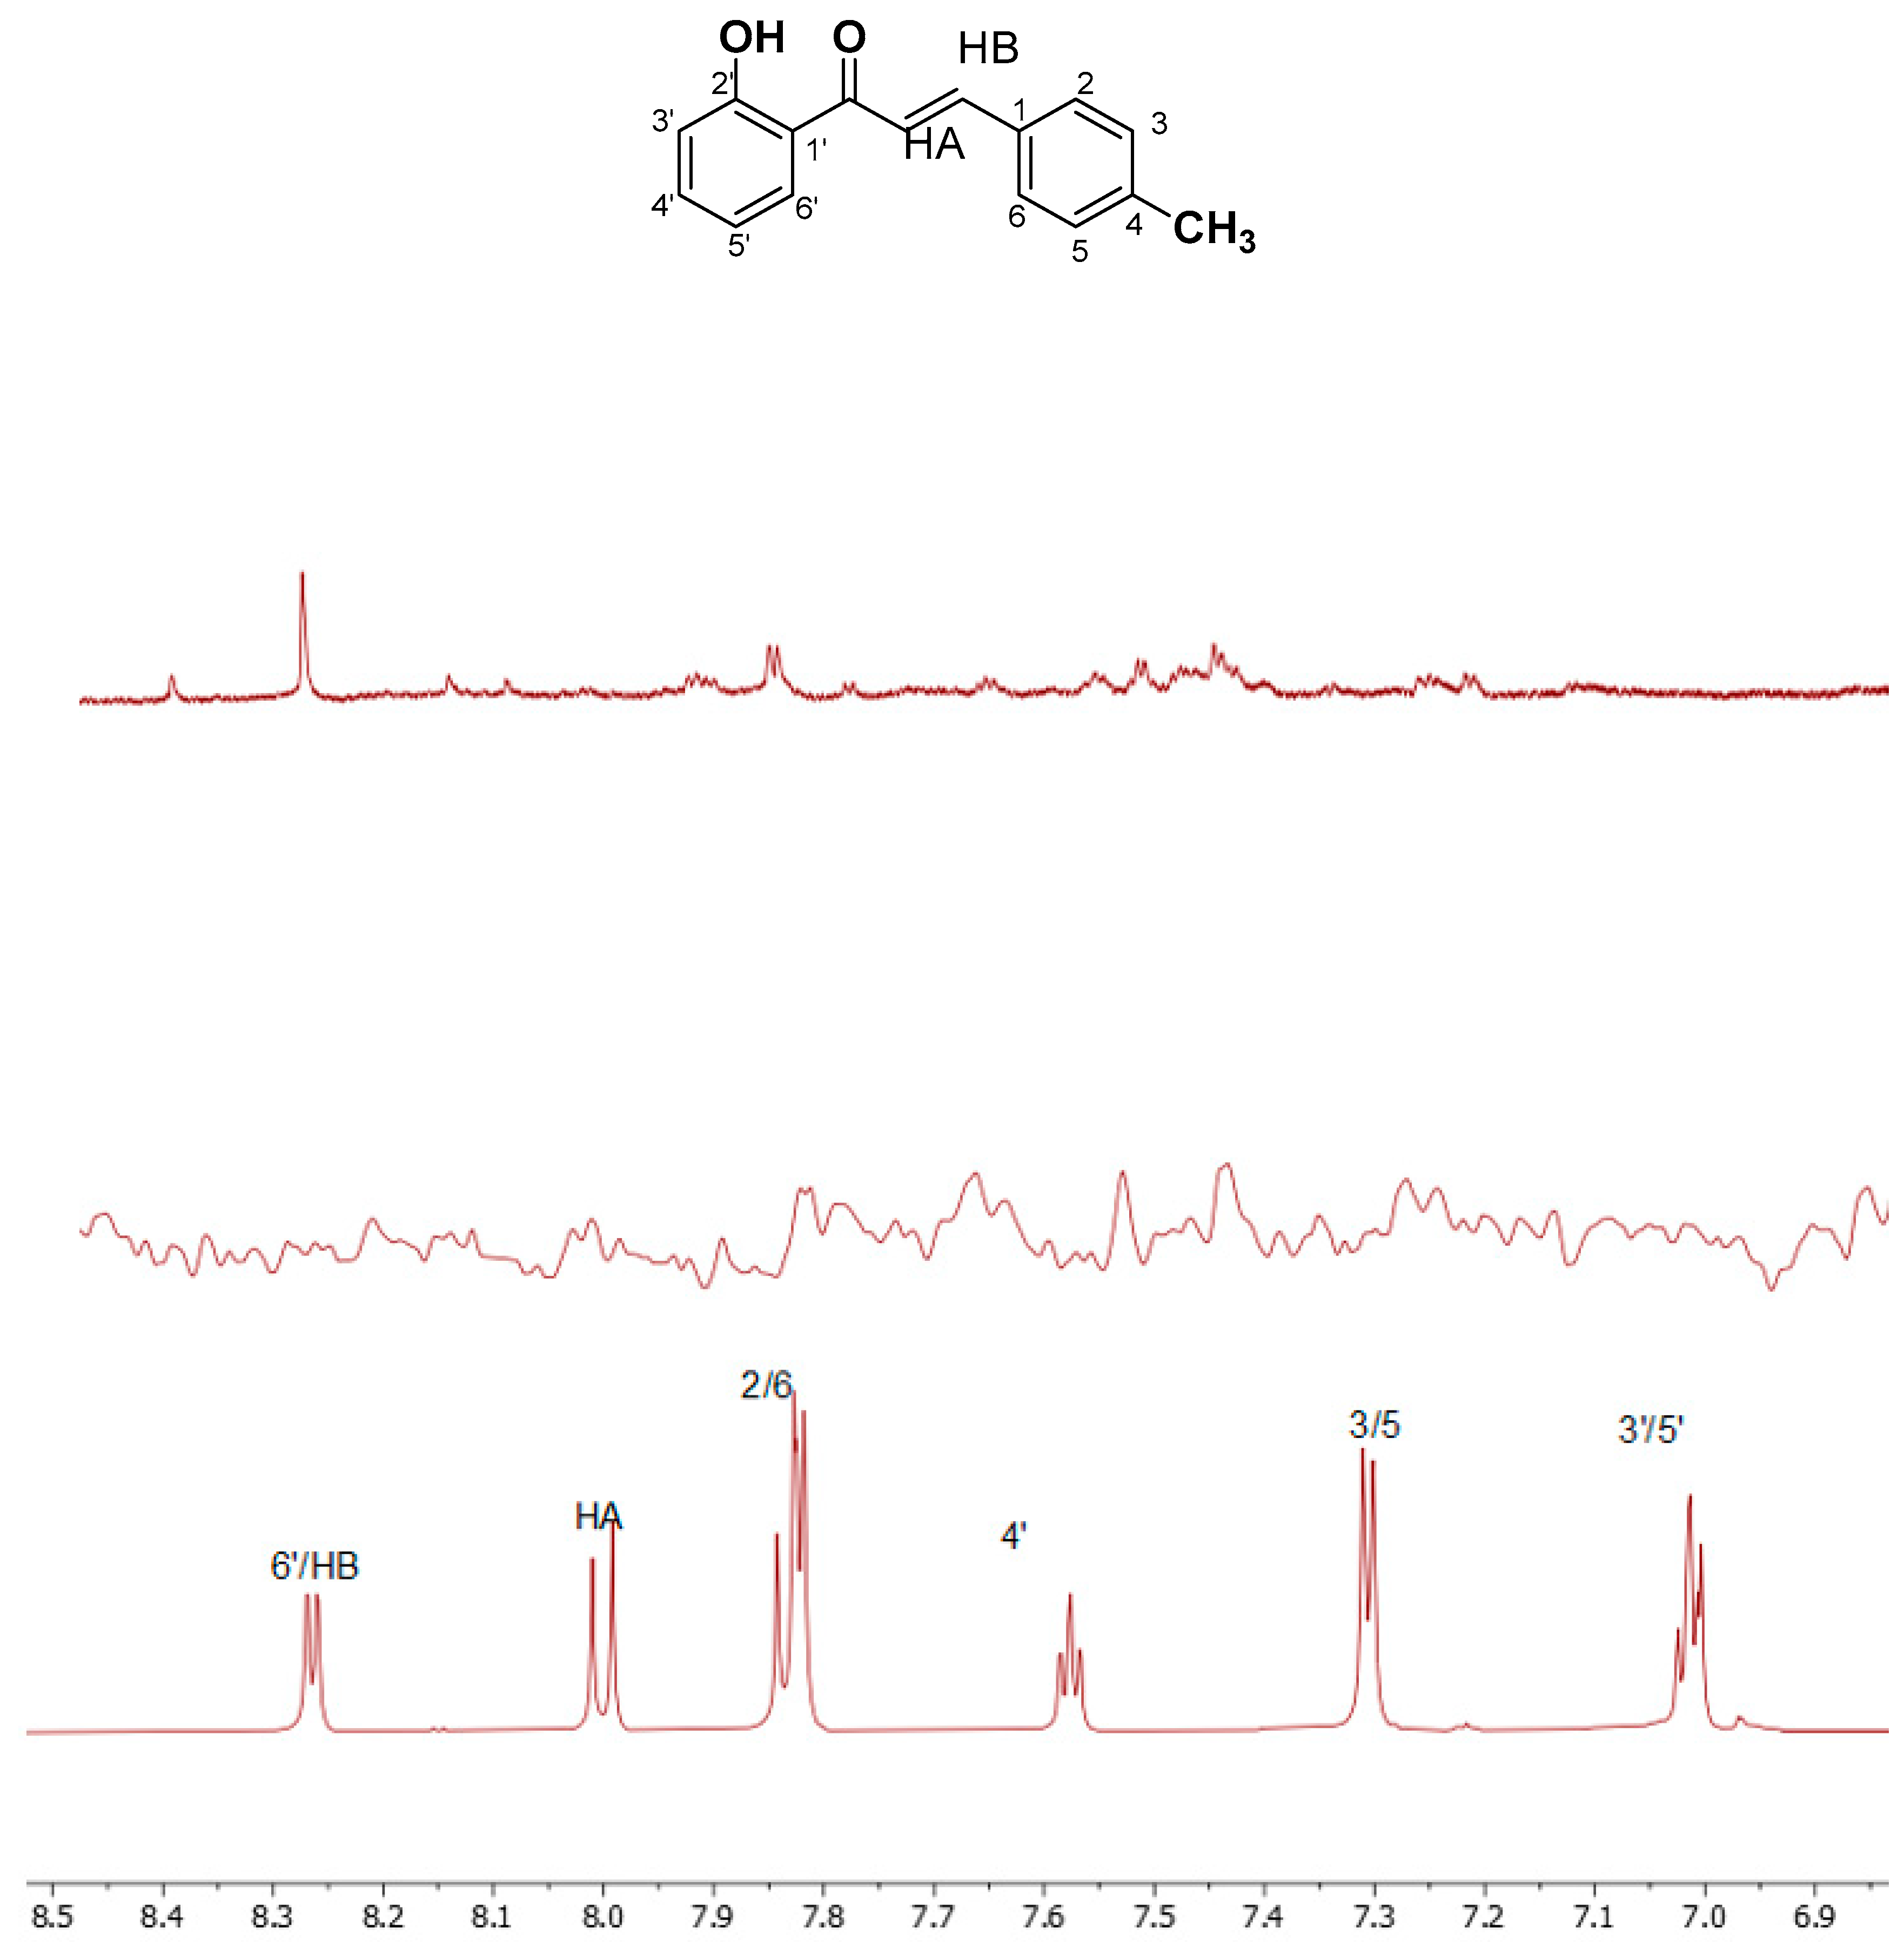
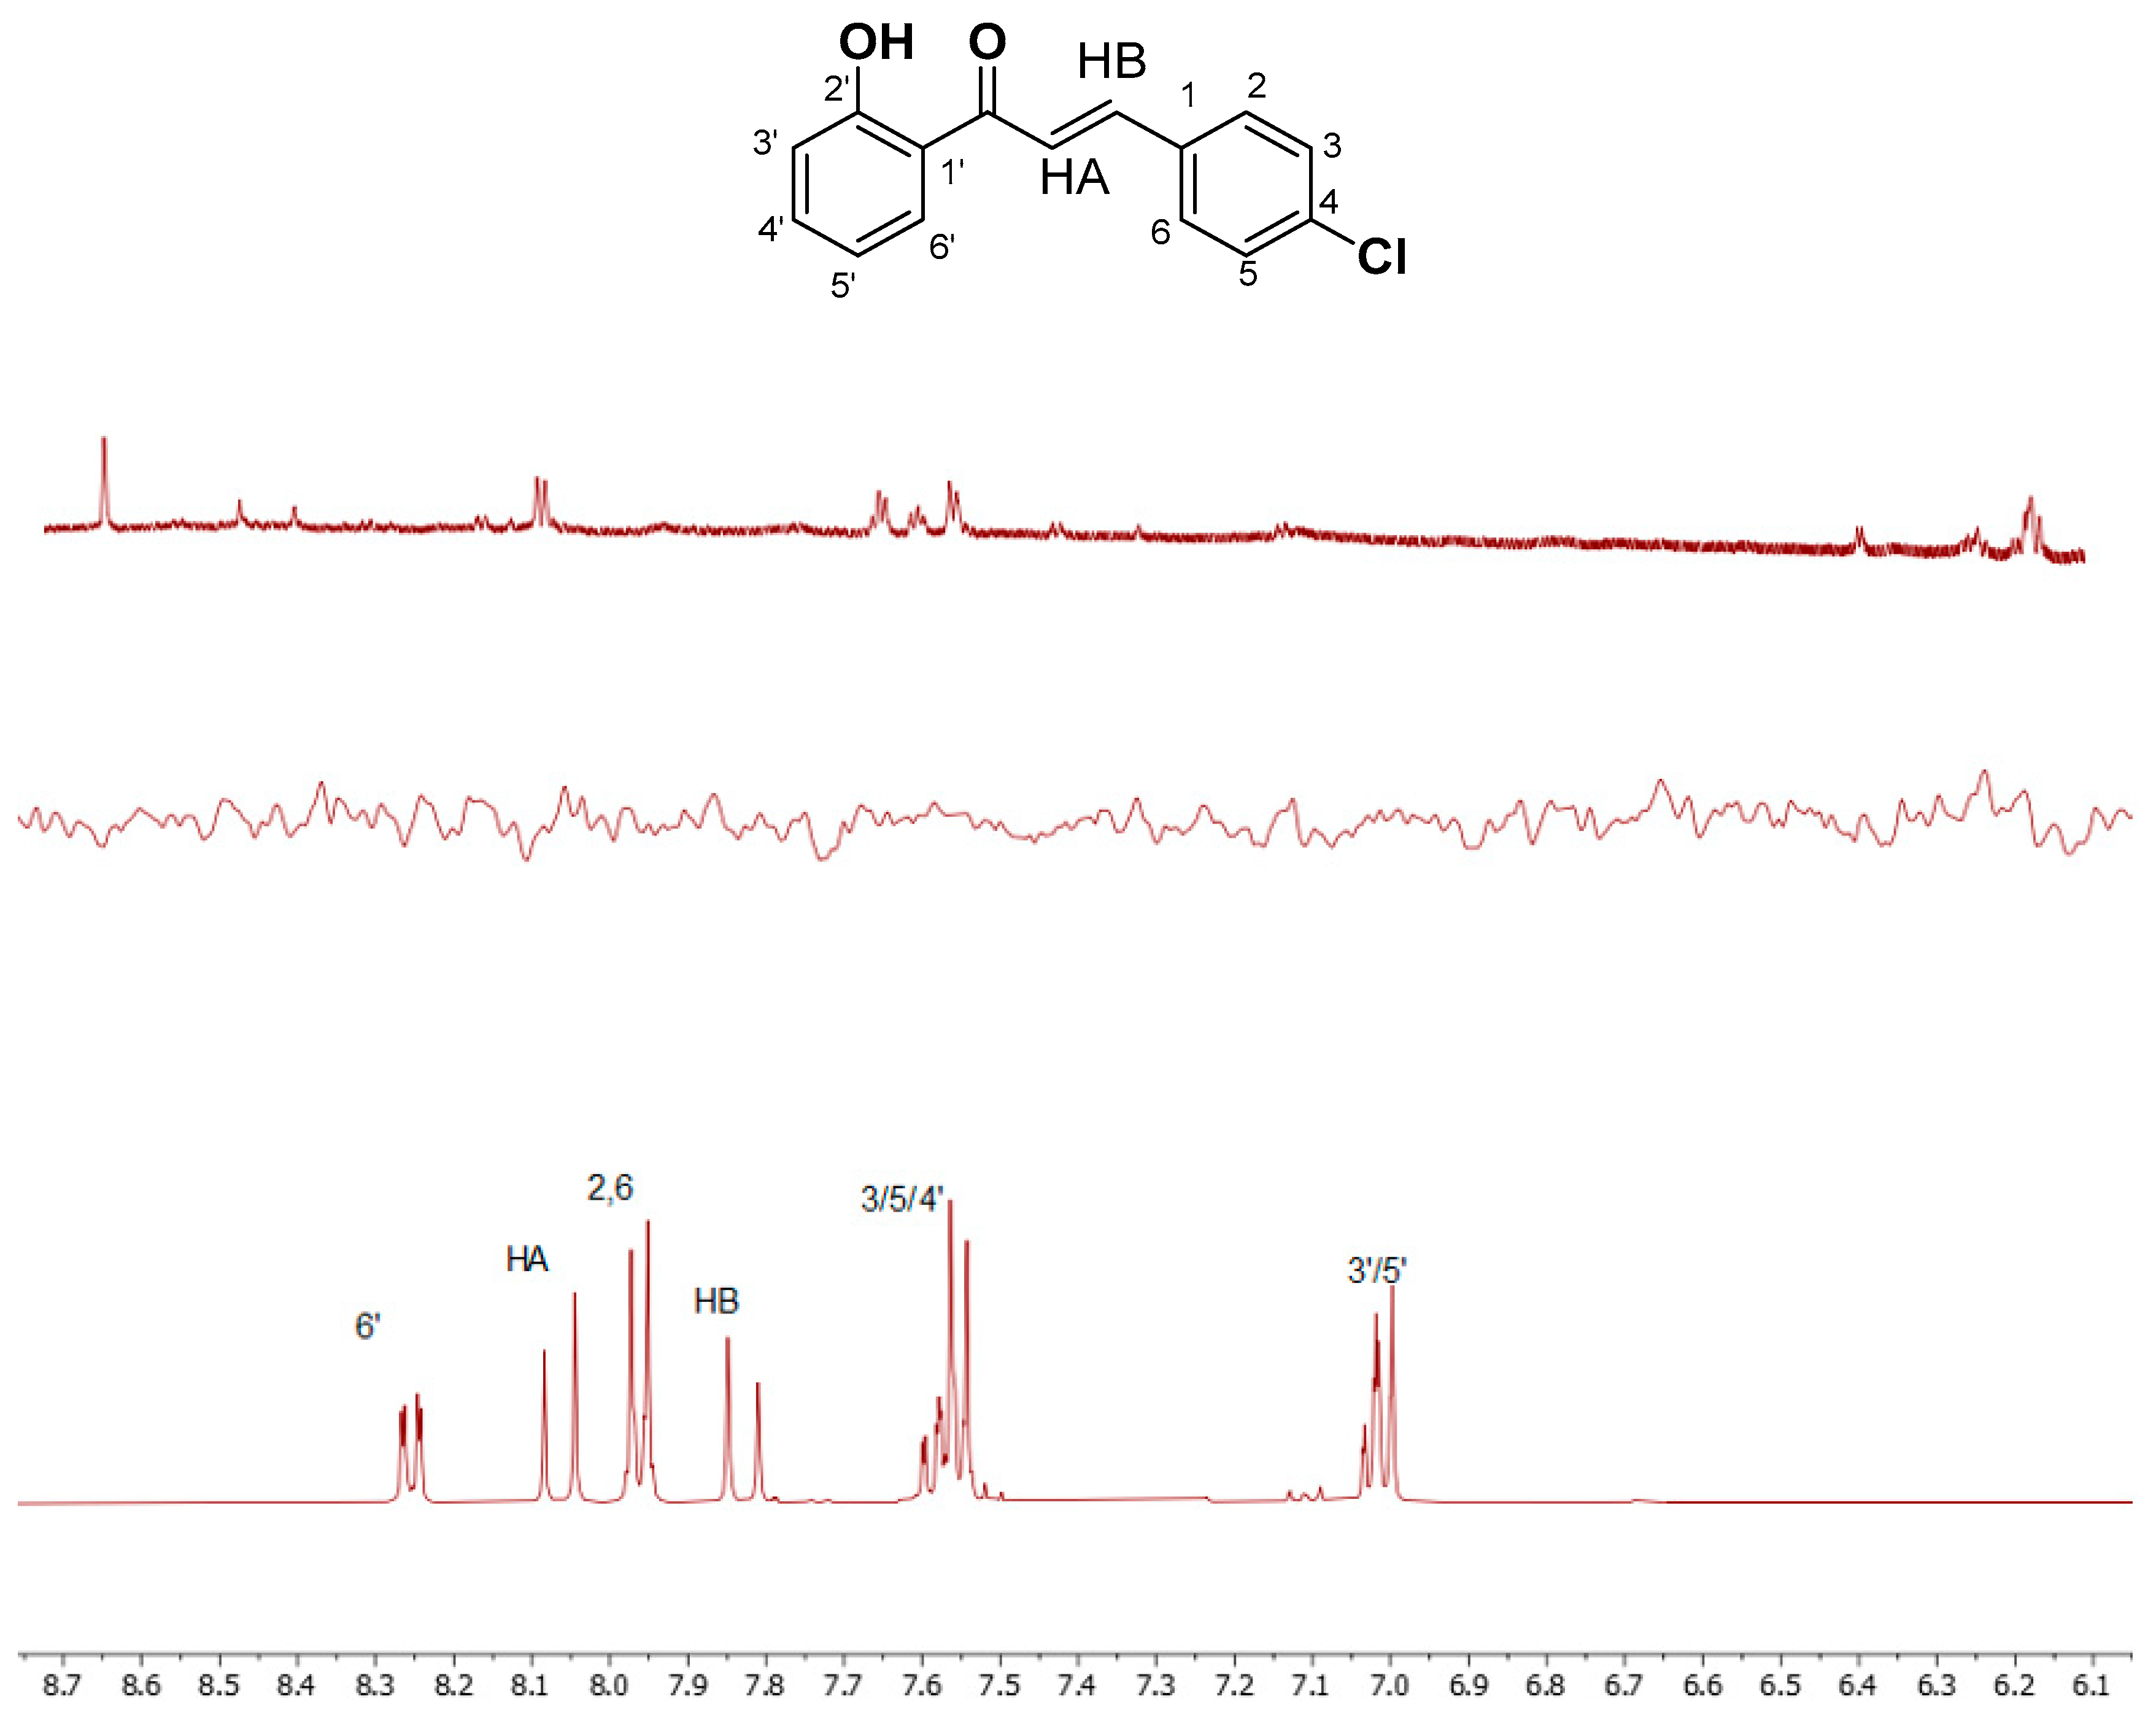
A similar procedure was carried out for chalcone 2. All the calculations were performed in DMSO-d6. The two proton spectra of each compound are shown in Figure 1. Moreover, Table 1 with the chemical shifts of the two compounds is shown below.
Figure 1.
1H NMR spectra in DMSO of (a) 1 and (b) 2. The spectra were recorded in DMSO-d6 on a Bruker AC 850 MHz spectrometer at 25 oC.
Figure 1.
1H NMR spectra in DMSO of (a) 1 and (b) 2. The spectra were recorded in DMSO-d6 on a Bruker AC 850 MHz spectrometer at 25 oC.
Table 1.
Assignment of the experimental 1H NMR spectra of 1 and 2 in DMSO-d6.
Table 1.
Assignment of the experimental 1H NMR spectra of 1 and 2 in DMSO-d6.
Hydrogen
1
|
Chemical shift (ppm) |
Hydrogen
1
|
Chemical shift (ppm) |
Hydrogen
1
|
Chemical shift (ppm) |
| CH3
|
2.36 |
HA |
8.01 |
5′ |
6.96 |
| 2,6 |
7.82 |
HB |
8.25 |
4′ |
7.57 |
| 3,5 |
7.29 |
3′ |
7.05 |
6′ |
8.27 |
| OH |
12.56 |
|
|
|
|
Hydrogen
2
|
Chemical shift (ppm) |
Hydrogen
2
|
Chemical shift (ppm) |
Hydrogen
2
|
Chemical shift (ppm) |
| 2,6 |
7.96 |
HB |
7.83 |
4′ |
7.58 |
| 3,5 |
7.55 |
3′ |
7.01 |
6′ |
8.25 |
| HA
|
8.05 |
5′ |
7.01 |
|
|
| OH |
12.43 |
|
|
|
|
Docking Calculations
Using the Glide/XP algorithm for induced fit docking (IFD), numerous conformations were generated for the docking of these three molecules in LOX-1, 15-LOX and 5-LOX, sorted based on the decreasing IFD Score scoring function (Table 3). This scoring function considers not only the strength of the ligand’s binding to the protein’s cavity but also the Prime energy of the protein in all protein-ligand complexes.
Conformers with the lowest energy were selected as the optimal docking pose for subsequent MD simulations. This conformation was preferred because it exhibits direct interaction of the ligand with the active site, and its low IFD Score value indicates that the protein-ligand complex is the most stable. Additionally, both energetically and structurally, this cluster of conformers shows no significant differences in their binding mode.
Table 3.
Docking results between the molecules and macromolecules.
Table 3.
Docking results between the molecules and macromolecules.
| Compound |
IFD docking score
(5-LOX) |
IFD docking score (LOX-1) |
IFD docking score (15-LOX) |
1
|
-10.778 |
-9.657 |
-7.581 |
2
|
-11.630 |
-10.256 |
-7.634 |
From the calculated binding energies, all the molecules bind strongly to the active center of 5-LOX and LOX-1. Specifically,
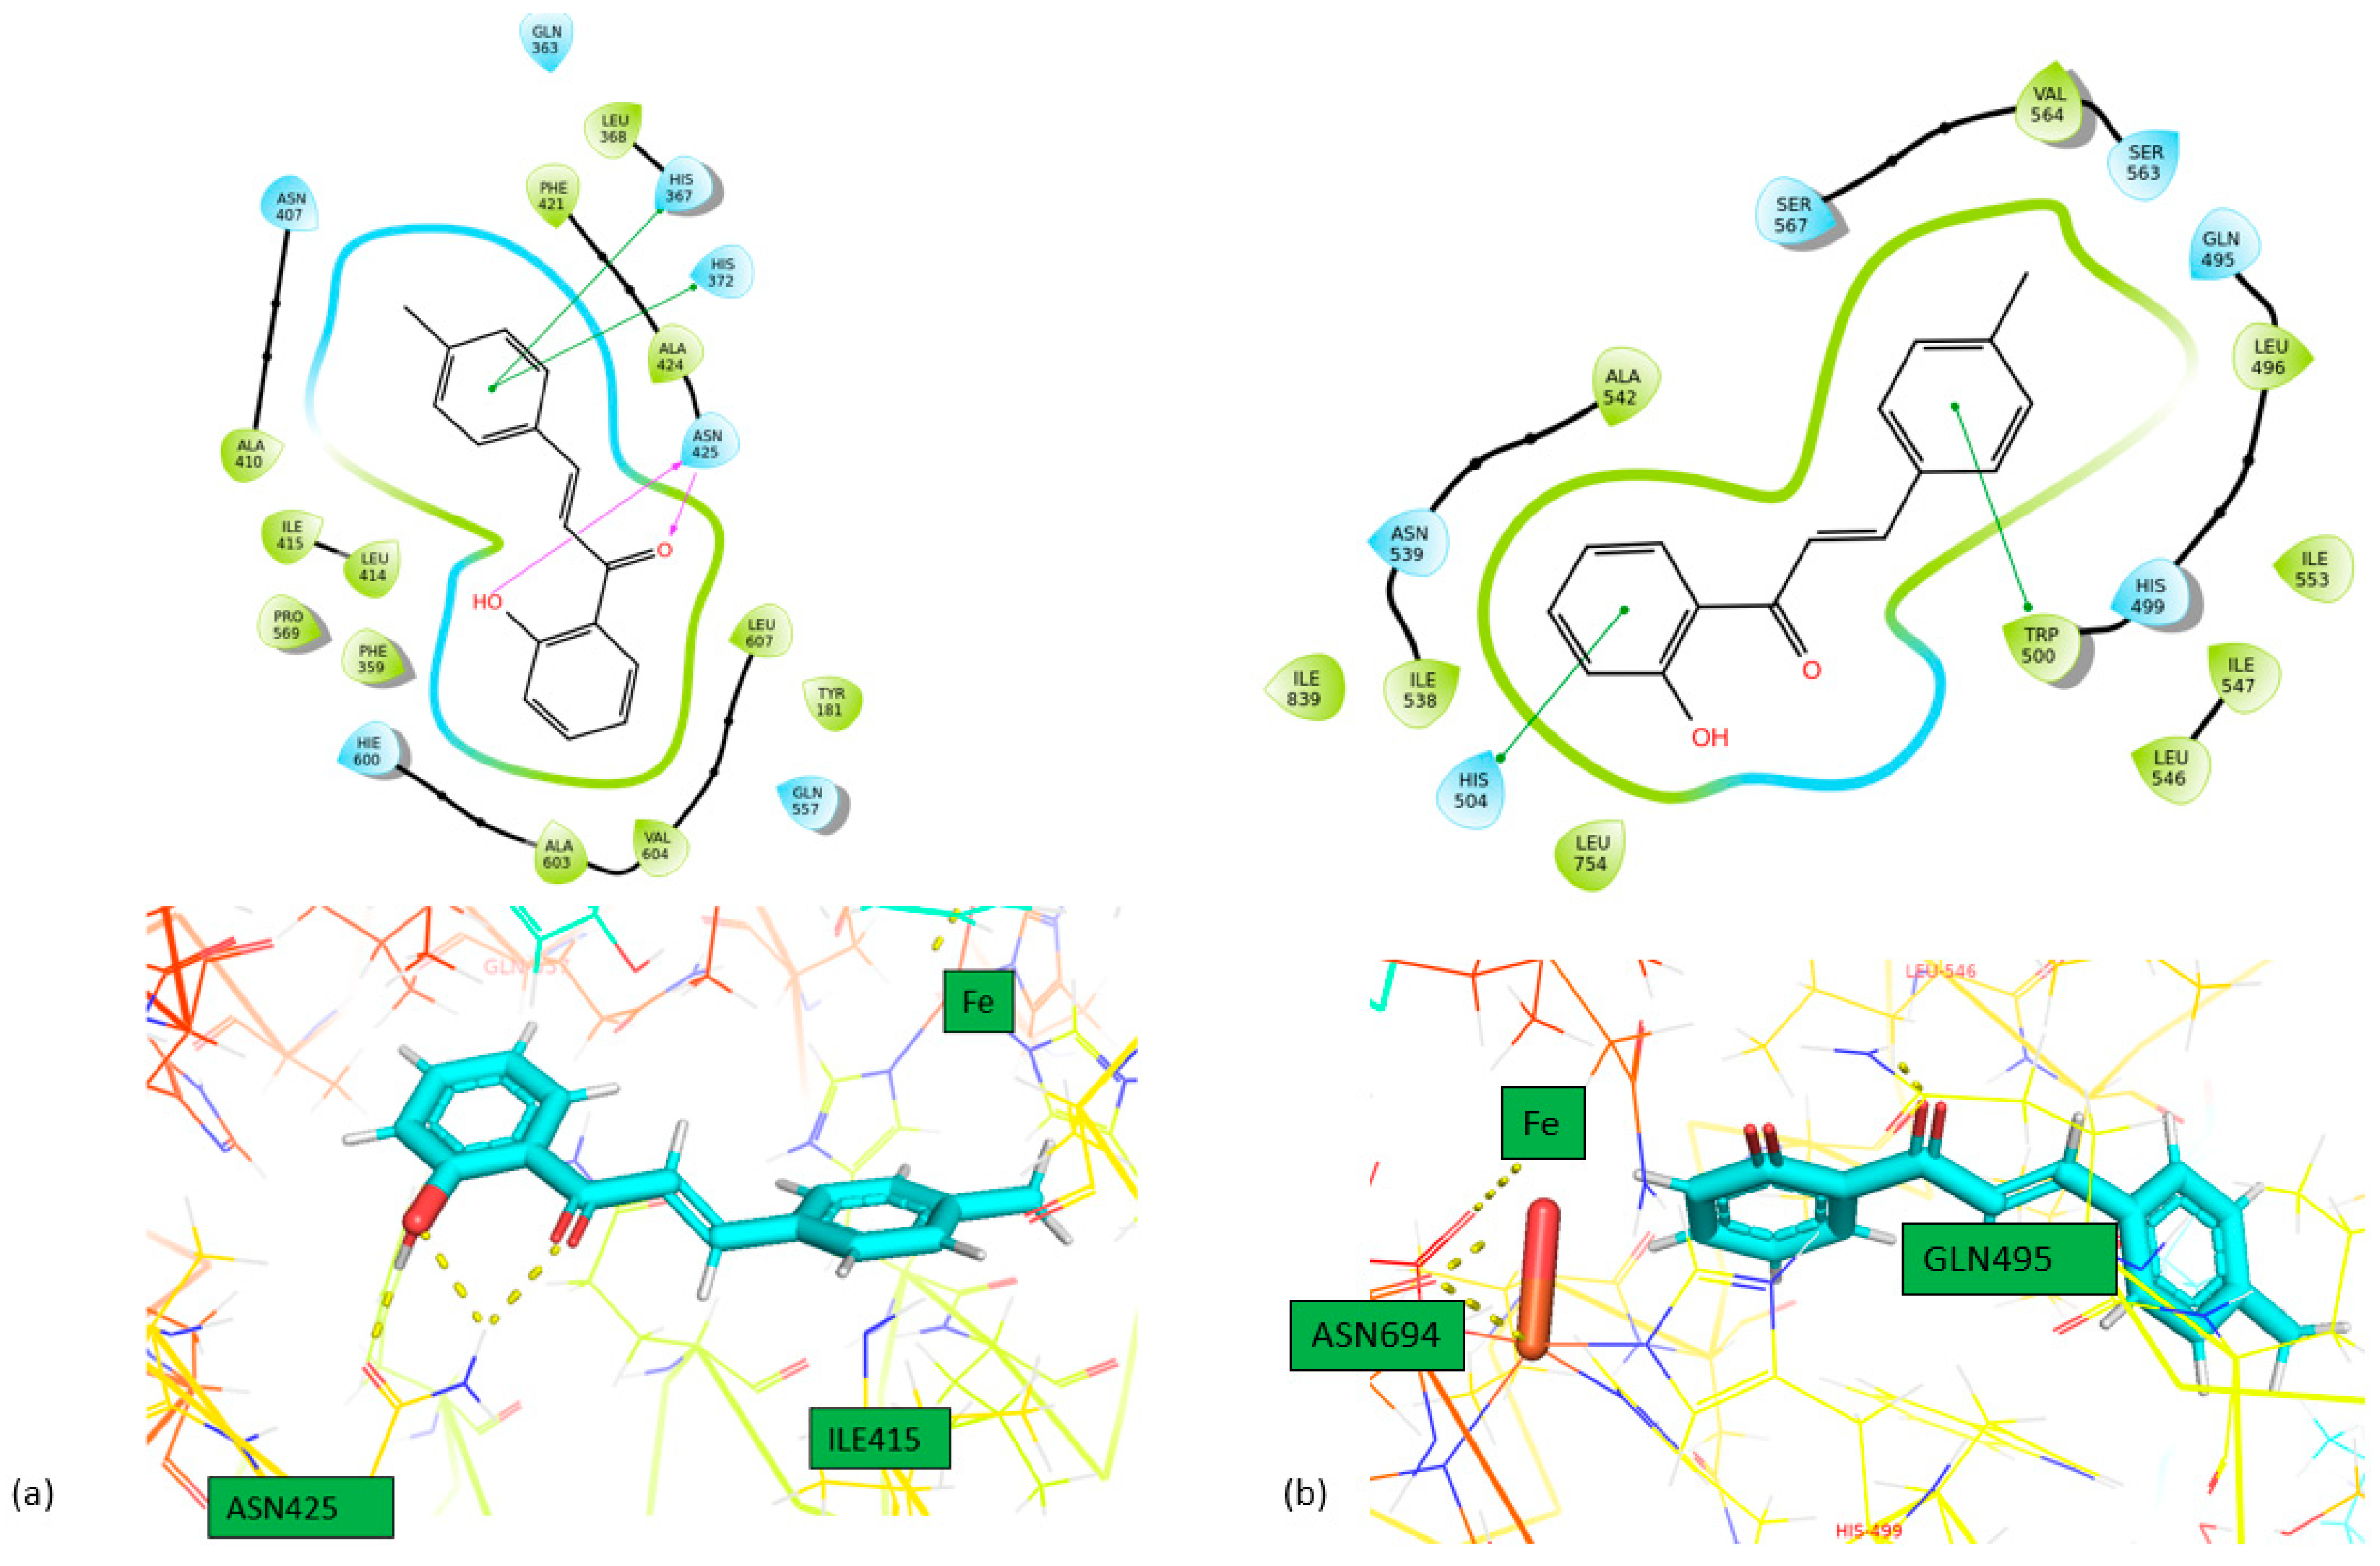
1 forms three hydrogen bonds between the hydroxyl and carbonyl group and ASN425 amino acid in LOX-5 and also two π-π stacking with HIS367 and HIS372 amino acids. In LOX-1,
1 forms two π-π stacking interactions with HIS504 and TRP500 amino acids. Finally,
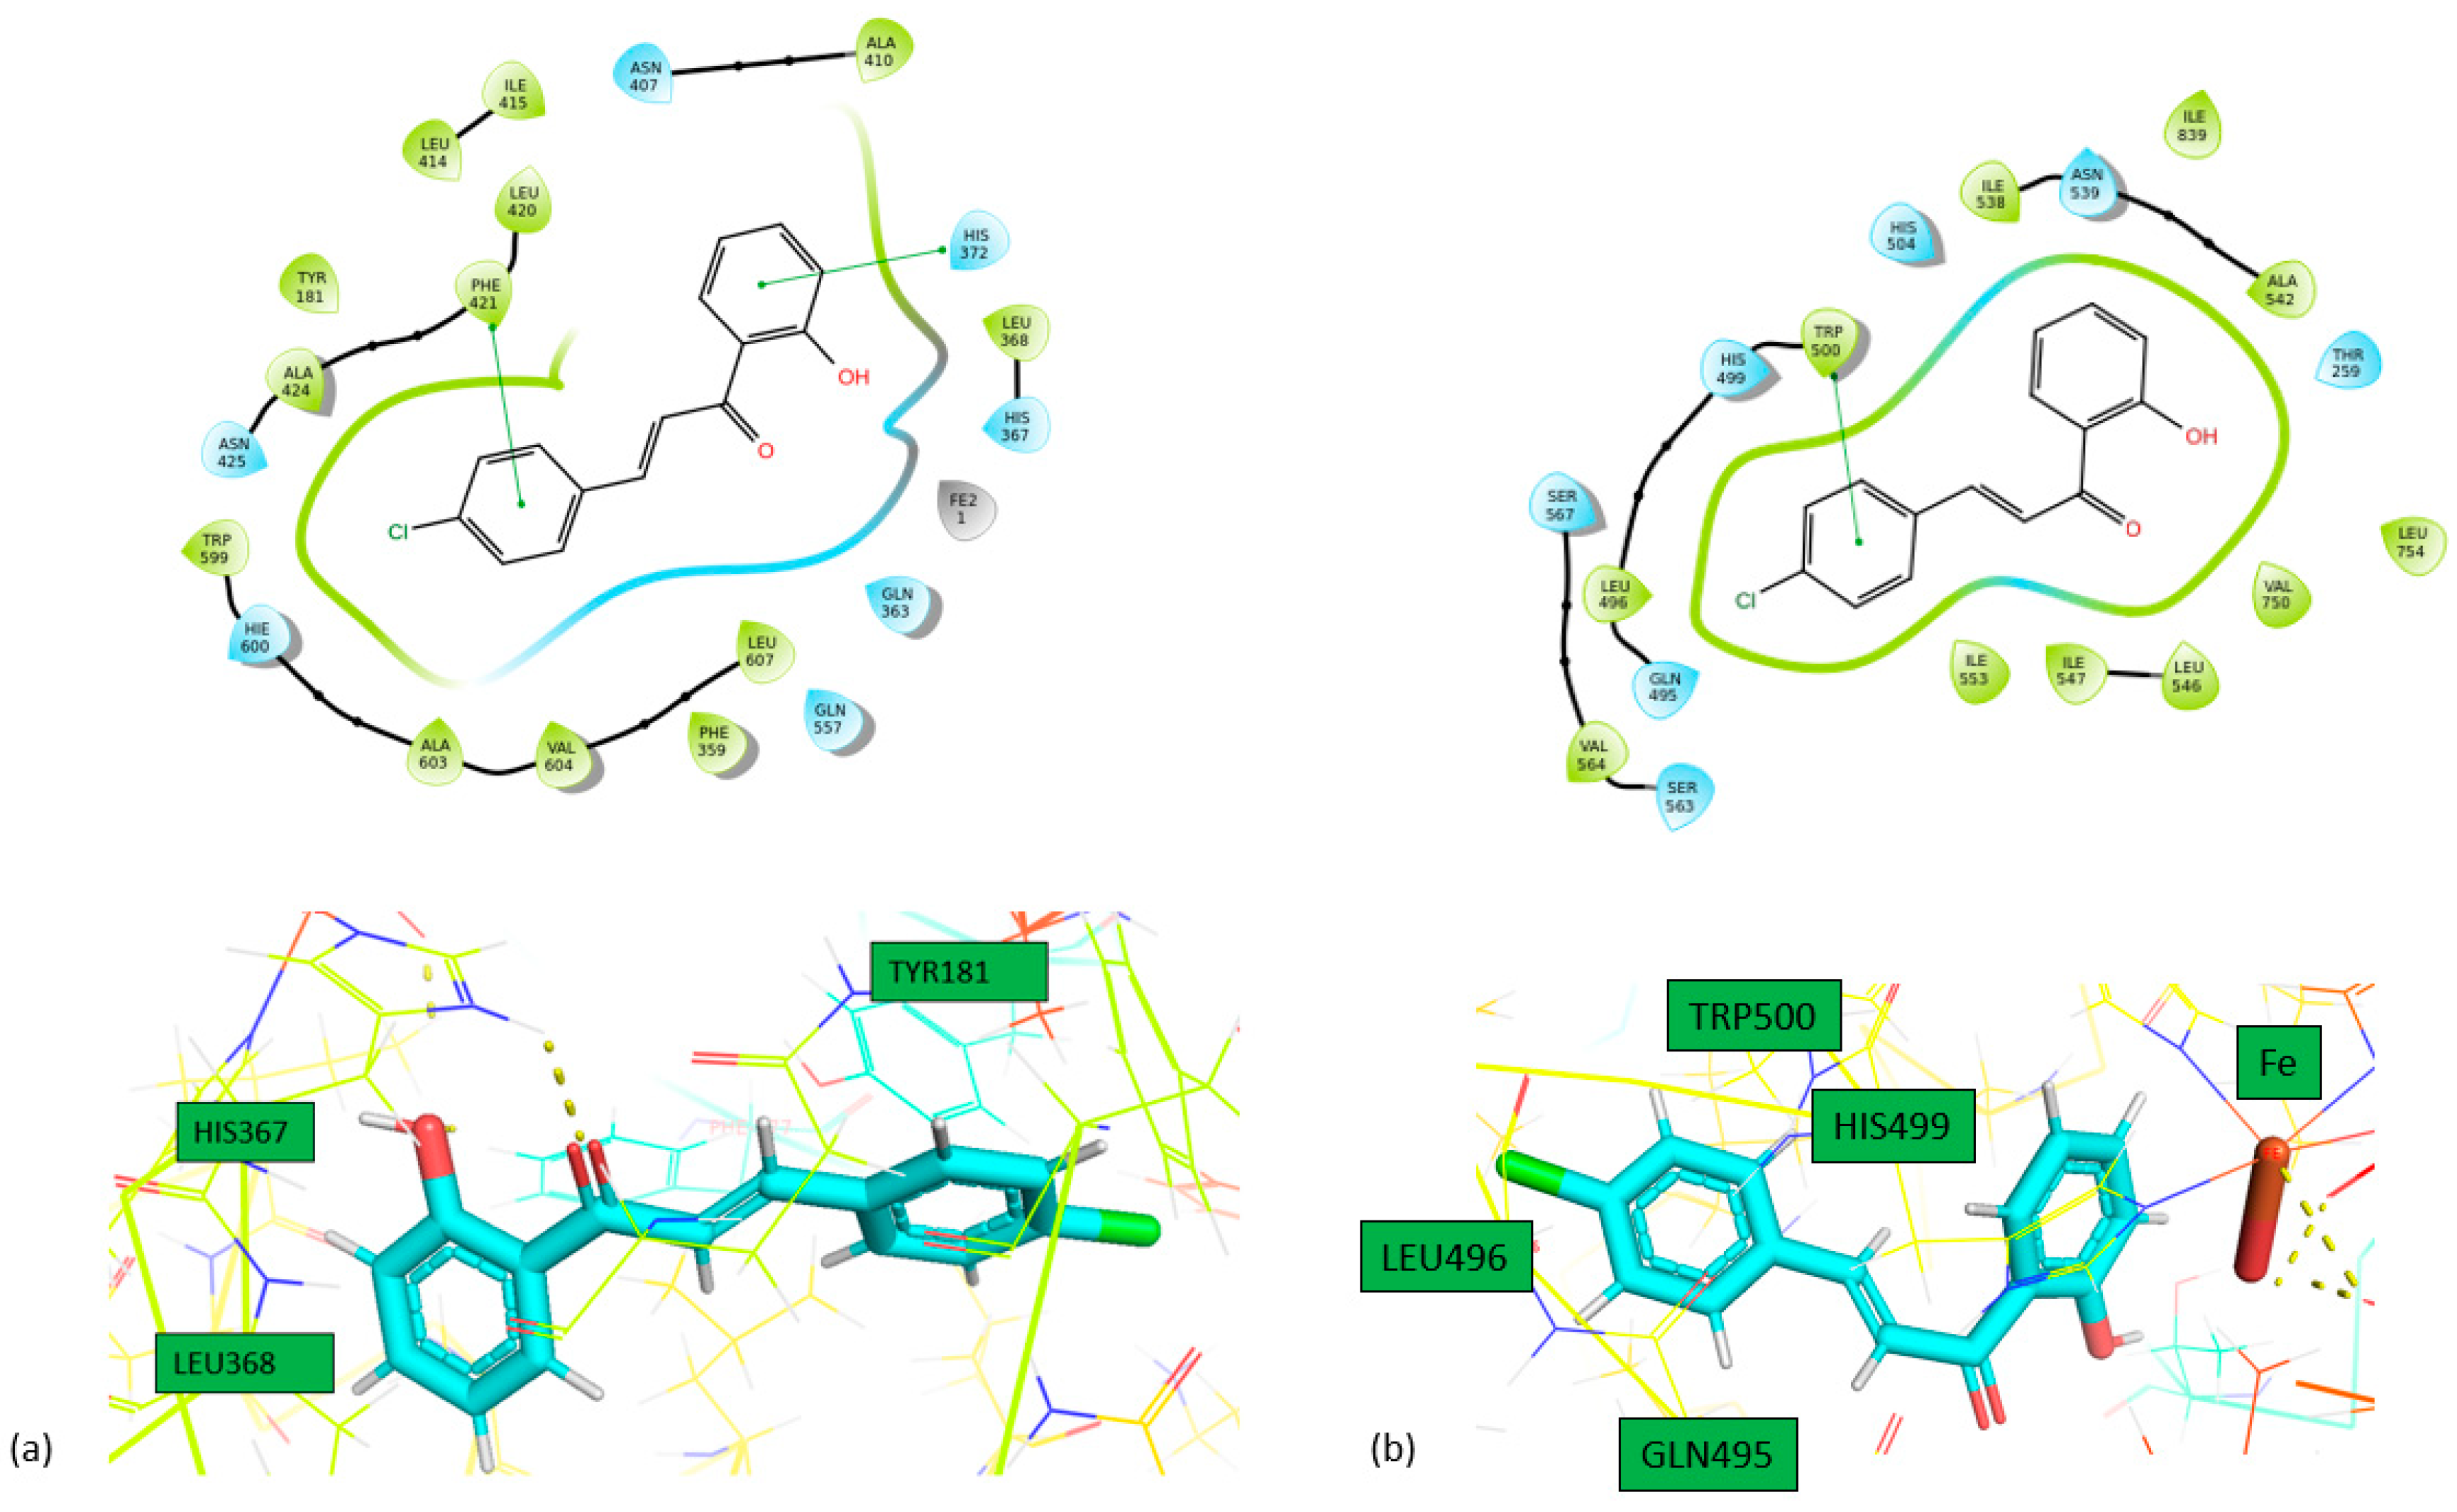
2 forms two hydrogen bonds between carbonyl group and HIS367 amino acids and two π-π interactions with HIS372 and PHE421 amino acids. Moreover, in LOX-1, it forms one π-π interaction with TRP500 amino acid. On the other hand, both compounds don’t bind so strong in the active center of 15-LOX. Specifically, compound
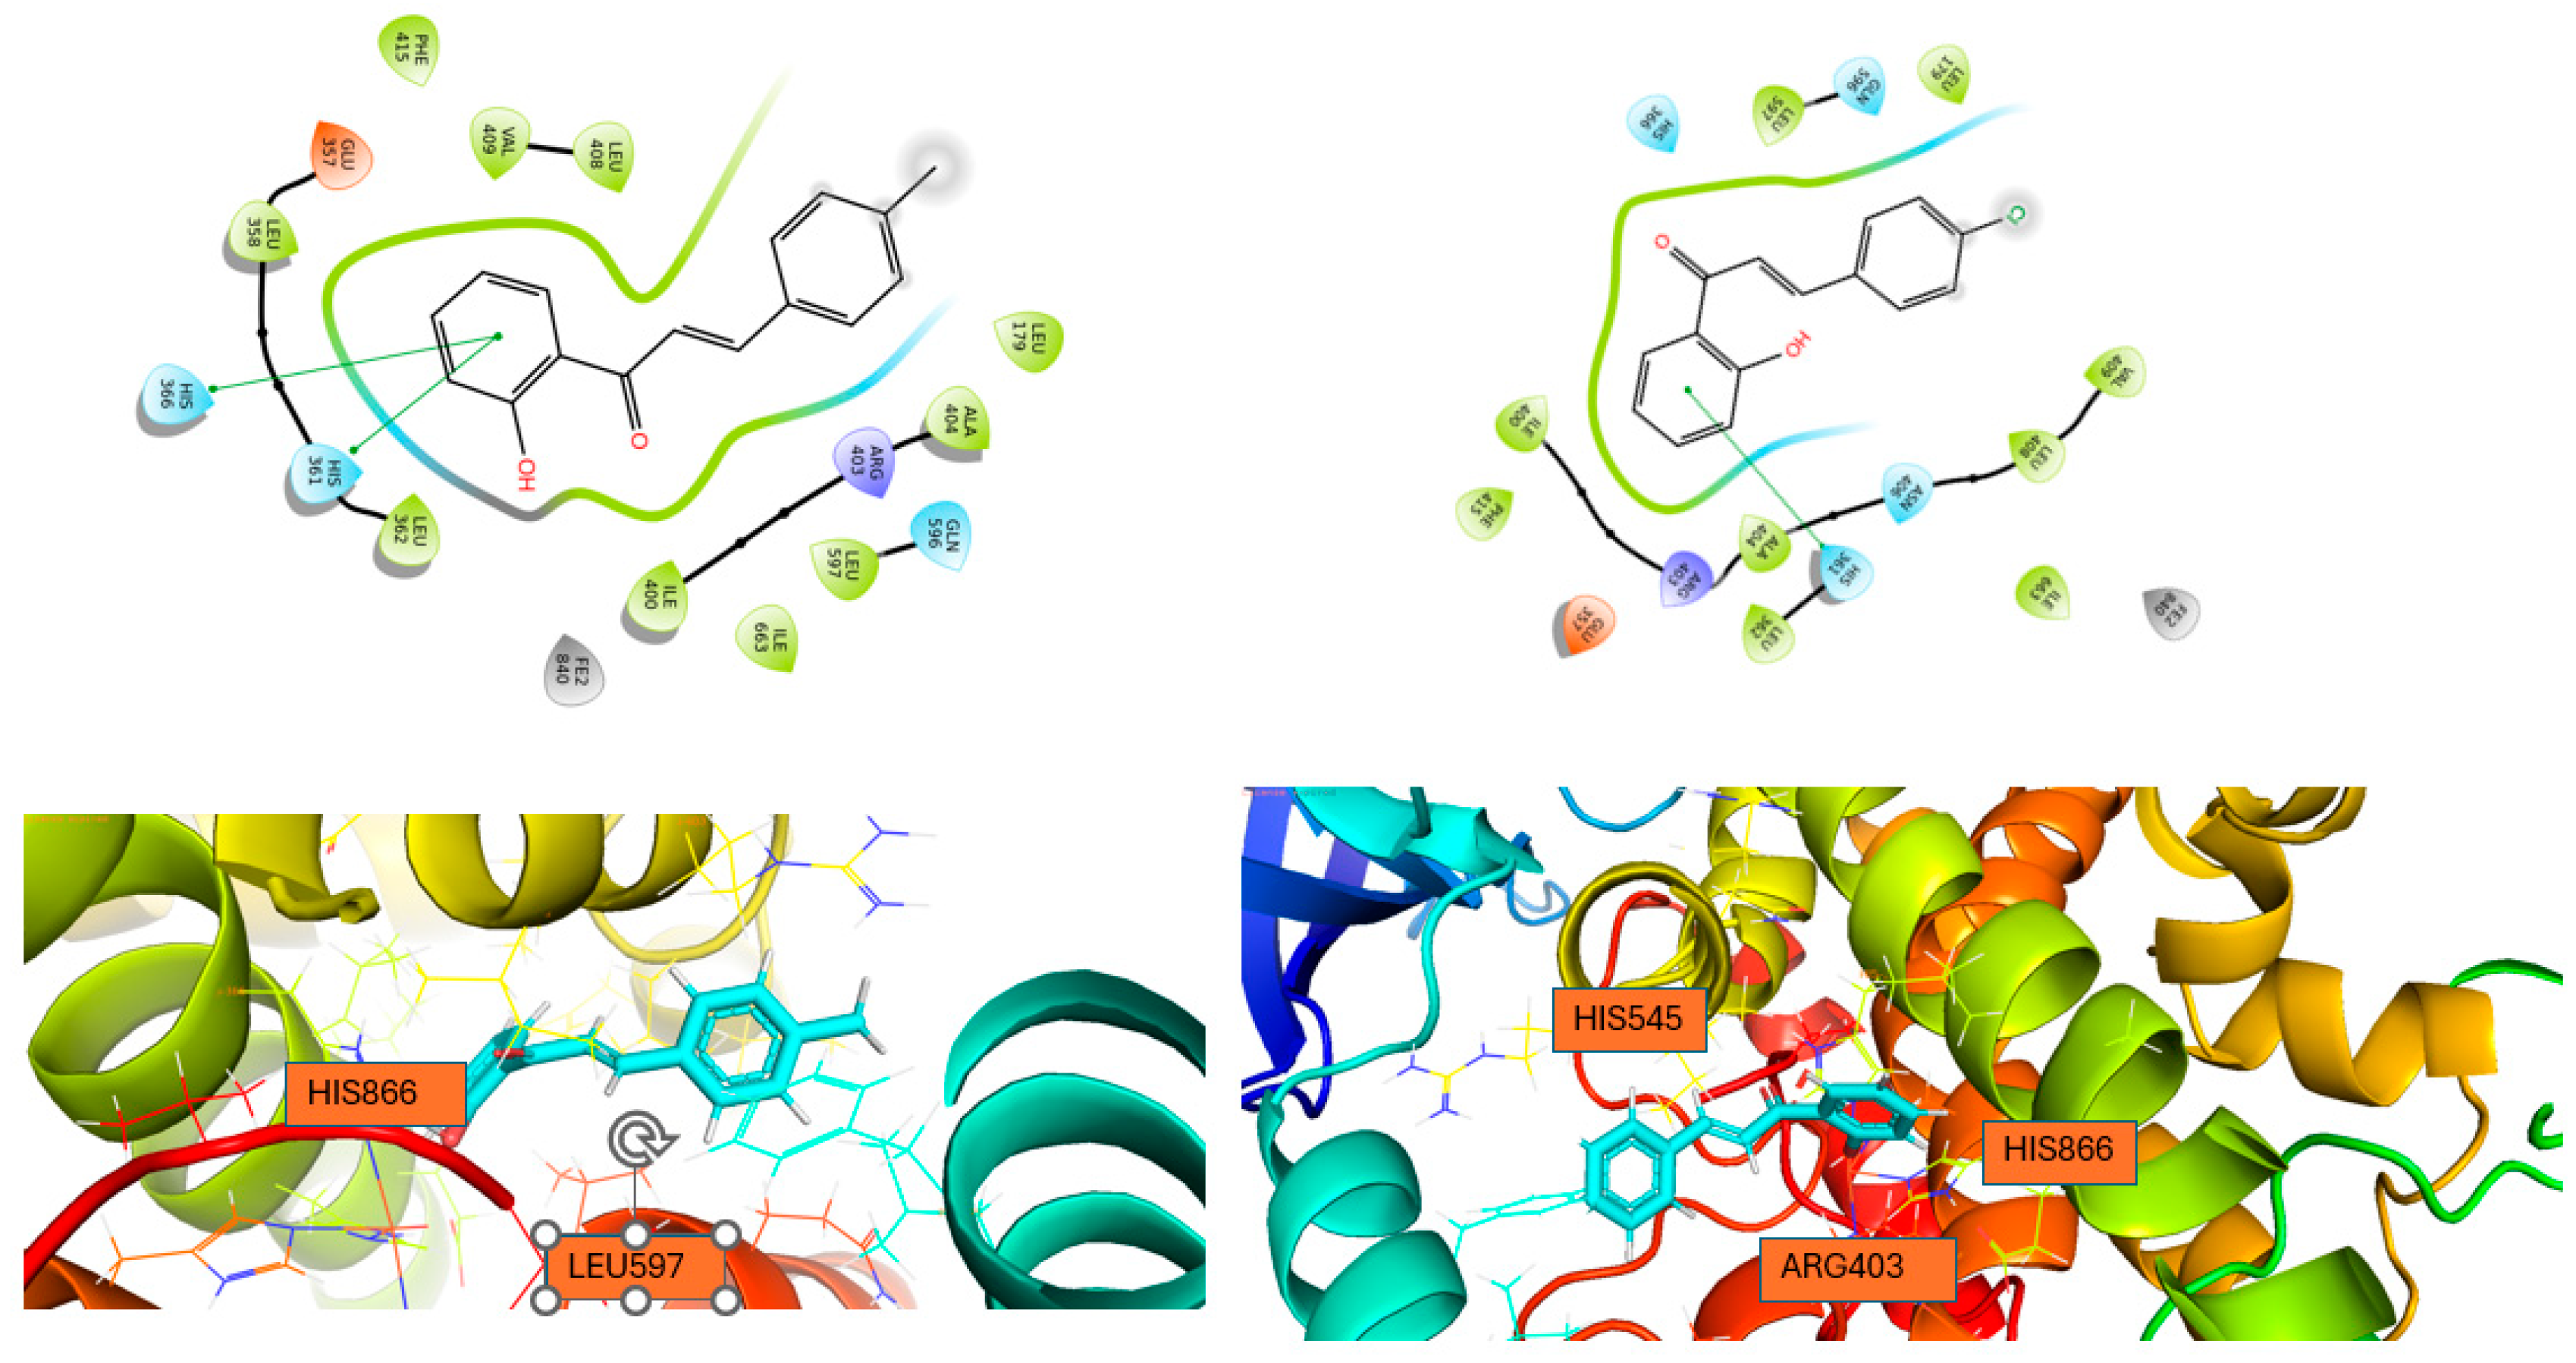
1 forms two pi-pi interactions with HIS361 and HIS366 and compound
2 one pi-pi interaction with HIS361 amino acid. This is the reason why we didn’t proceed for STD experiments to 15-LOX. All the interactions of these two molecules with the enzymes are shown in
Table 4. Our study reveals that the studied chalcones exhibit significantly stronger inhibition of LOX-1 compared to other chalcones previously studied. This superior inhibitory activity suggests that our chalcone has a more effective interaction with the LOX-1 binding site, likely due to its unique structural features. As a result, it may offer greater potential as a therapeutic agent targeting LOX-1-related pathways.[
26]
Table 4.
Interactions of the molecules with the enzymes.
Table 4.
Interactions of the molecules with the enzymes.
| Compound |
Enzyme |
Hydrogen bonds |
π-πstacking
|
| 1 |
5-LOX |
ASN425 |
HIS367, HIS372 |
| |
LOX-1 |
|
HIS504, TRP500 |
| |
15-LOX |
|
HIS361, HIS366 |
| 2 |
5-LOX |
|
HIS372, PHE421 |
| |
LOX-1 |
|
TRP500 |
| |
15-LOX |
|
HIS361 |
Figure 3.
Interactions of 1 with (a) 5-LOX and (b) 1-LOX in 2D (above) and 3D (bottom) format.
Figure 3.
Interactions of 1 with (a) 5-LOX and (b) 1-LOX in 2D (above) and 3D (bottom) format.
Figure 4.
Interactions of 2 with (a) 5-LOX and (b) 1-LOX in 2D (above) and 3D (bottom) format.
Figure 4.
Interactions of 2 with (a) 5-LOX and (b) 1-LOX in 2D (above) and 3D (bottom) format.
Figure 5.
Interactions of 1 with (a) 15-LOX and 2 with (b) 15-LOX in 2D (above) and 3D (bottom) format.
Figure 5.
Interactions of 1 with (a) 15-LOX and 2 with (b) 15-LOX in 2D (above) and 3D (bottom) format.
Molecular Dynamics
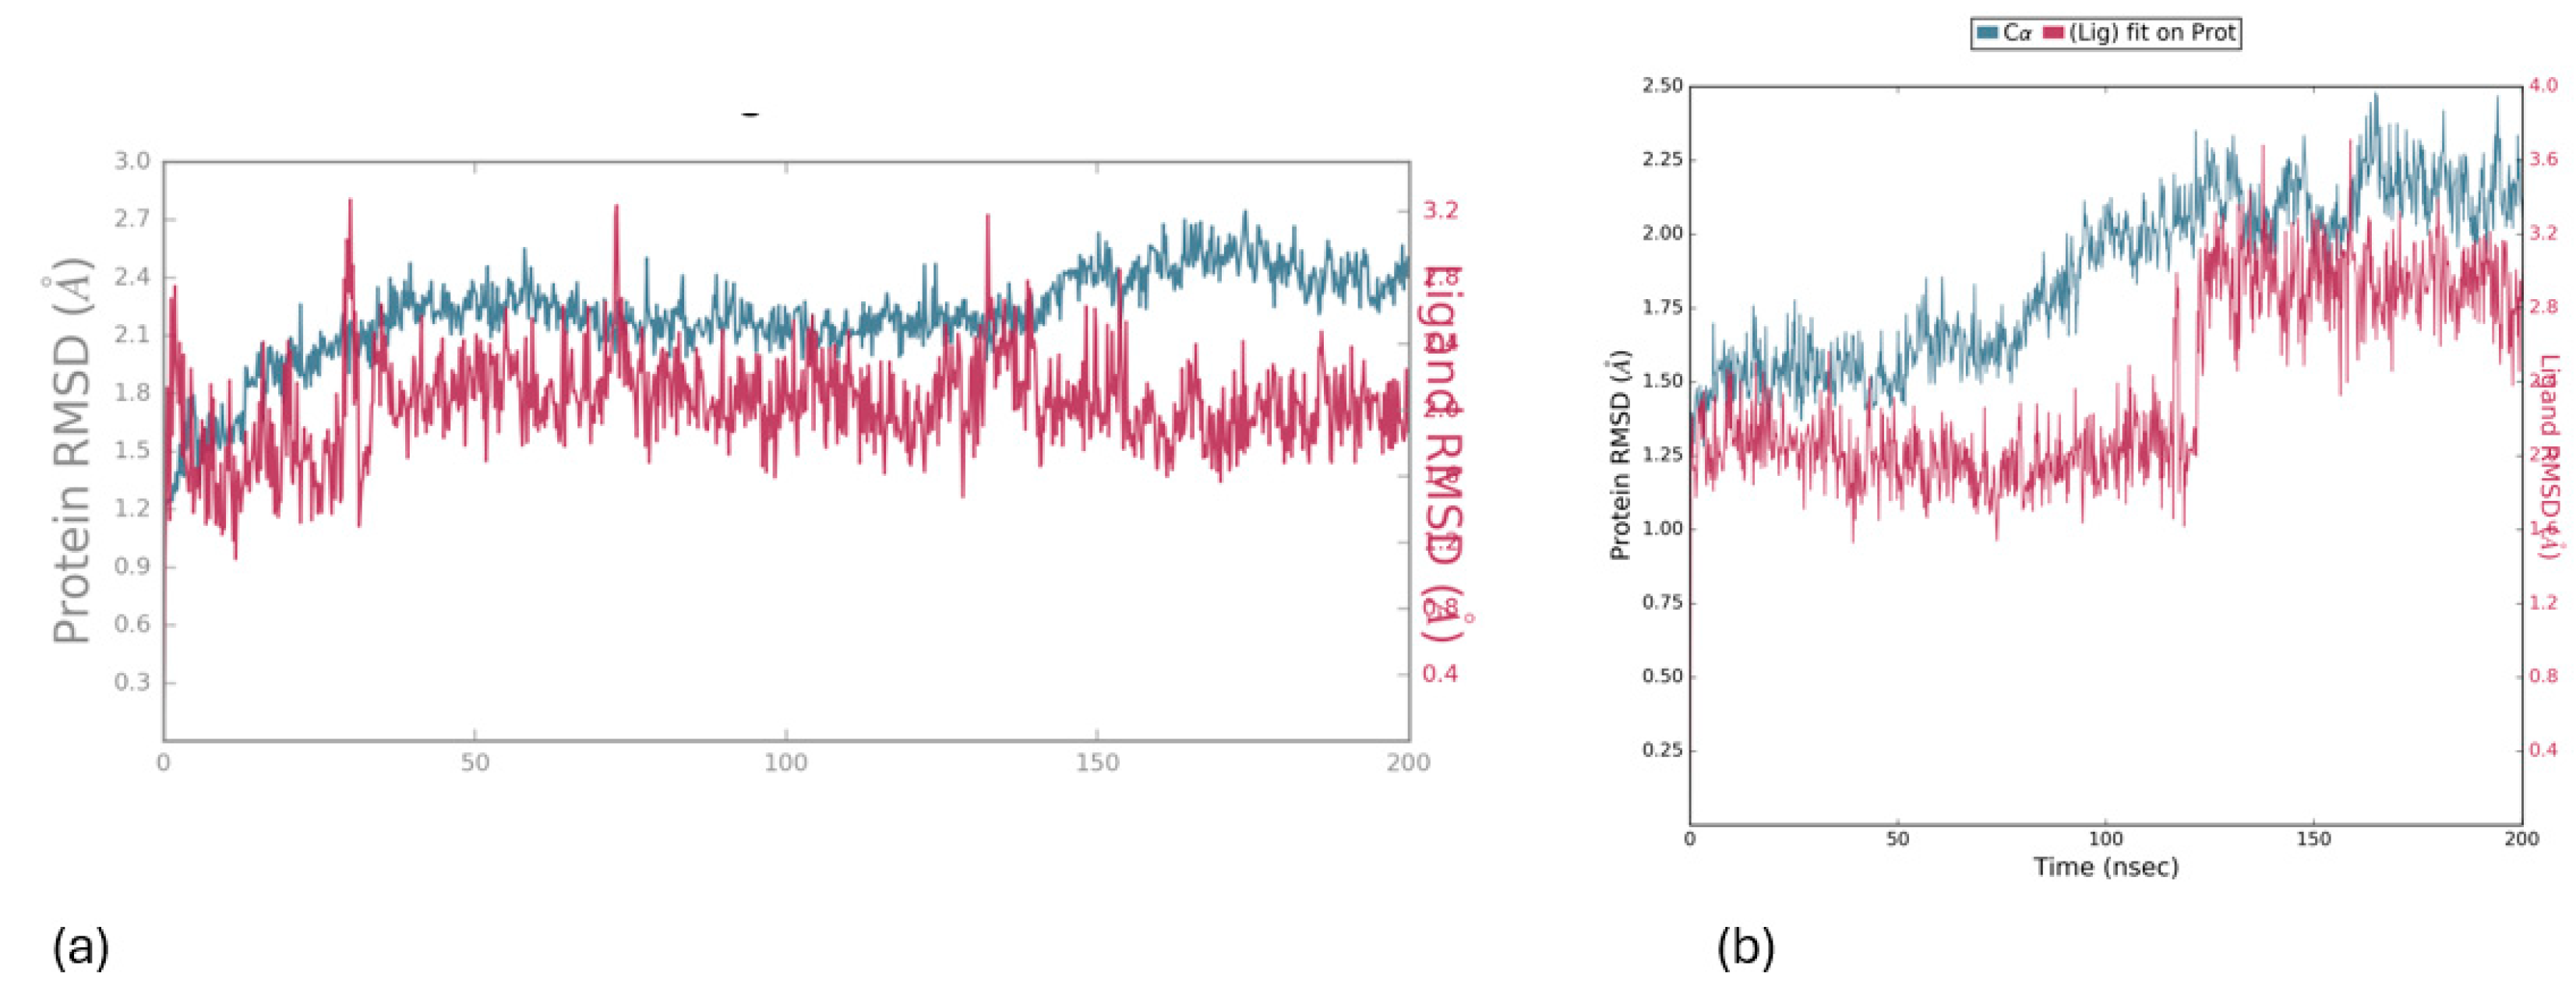
Molecular Dynamics simulations were carried out to assess the stability of compounds’ orientation as suggested by the docking studies. The results of the MD simulation for the protein-ligand complex demonstrated the stable binding of all the compounds within the cavity of LOX. To quantify this finding, the Root Mean Square Deviation (RMSD) of each ligand was calculated concerning its initial docking position. Over the course of the 200 ns simulation, each ligand remained bound to the binding site of both enzymes. The sustained binding of each compound within the cavity throughout the simulation confirms our docking predictions, indicating that they could serve as inhibitors to LOX and holds promise as a potential LOX inhibitor.
In Figure 6, the protein’s Ca atoms demonstrate a low RMSD value (<4.0 Å), indicating favorable convergence of the system, while the RMSD of the ligand is also depicted for the 200 ns duration of MD simulation. The initial docking pose, served as the reference for measuring the RMSD of the ligand’s heavy atoms. Throughout the entire simulation period, the ligand exhibits remarkable stability, with an RMSD value of approximately (<4.0 Å), as illustrated in Figure 6.
Figure 6.
RMSD values for the protein (5-LOX) (depicted in green) and the ligand 1 (a) and 2 (b) (depicted in magenta) were calculated over a 200 ns simulation period, with the initial docking pose serving as the reference structure (upper image).
Figure 6.
RMSD values for the protein (5-LOX) (depicted in green) and the ligand 1 (a) and 2 (b) (depicted in magenta) were calculated over a 200 ns simulation period, with the initial docking pose serving as the reference structure (upper image).
In Figure 7, the protein’s Ca atoms demonstrate a low RMSD value (<4.0 Å), indicating favorable convergence of the system, while the RMSD of the ligand is also depicted for the 200 ns duration of MD simulation. The initial docking pose, served as the reference for measuring the RMSD of the ligand’s heavy atoms. Throughout the entire simulation period, the ligand exhibits remarkable stability, with an RMSD value of approximately (<4.0 Å), as illustrated in Figure 7.
Figure 7.
RMSD values for the protein (LOX-1) (depicted in green) and the ligand 1 (a) and 2 (b) (depicted in magenta) were calculated over a 200 ns simulation period, with the initial docking pose serving as the reference structure (upper image).
Figure 7.
RMSD values for the protein (LOX-1) (depicted in green) and the ligand 1 (a) and 2 (b) (depicted in magenta) were calculated over a 200 ns simulation period, with the initial docking pose serving as the reference structure (upper image).
In Figure 8, the protein’s Ca atoms demonstrate a low RMSD value (<4.0 Å), indicating favorable convergence of the system, while the RMSD of the ligand is also depicted for the 200 ns duration of MD simulation. The initial docking pose, served as the reference for measuring the RMSD of the ligand’s heavy atoms. Throughout the entire simulation period, the ligand exhibits remarkable stability, with an RMSD value of approximately (<4.0 Å), as illustrated in Figure 8.
Figure 8.
RMSD values for the protein (15-LOX) (depicted in green) and the ligand 1 (a) and 2 (b) (depicted in magenta) were calculated over a 200 ns simulation period, with the initial docking pose serving as the reference structure (upper image).
Figure 8.
RMSD values for the protein (15-LOX) (depicted in green) and the ligand 1 (a) and 2 (b) (depicted in magenta) were calculated over a 200 ns simulation period, with the initial docking pose serving as the reference structure (upper image).
Charting Compounds - LOX-1/5-LOX Interaction Through Saturation Transfer Difference (STD) NMR Experiment
After establishing the effectiveness of compounds in inhibiting LOX-1 and 5-LOX, our aim was to delve deeper into its direct interaction and precisely identify the epitope involved in binding with soybean LOX-1 and 5-LOX. To investigate this interaction, we employed Saturation Transfer Difference (STD) NMR, a technique capable of assessing a ligand’s potential interaction with a pharmaceutical target and pinpointing the specific protons involved in the molecular binding process.
The results of the STD NMR analysis depicting the interaction between LOX-1 and 5-LOX are depicted in
Figure 9 and
Figure 10. Examination of the difference spectrum reveals that the peaks corresponding to both the aromatic and aliphatic protons of each compound exhibit decreased intensity compared to the reference
1H-NMR spectrum. This observation provides further confirmation of the interaction between the ligands and LOX-1 and 5-LOX. Furthermore, when examining the aromatic regions, the comparison between the
1H NMR spectrum of the complex formed by the compounds and soybean LOX-1 and the STD difference spectrum indicates that all aromatic protons, engage with the protein’s binding site. The reduced intensity of peaks in the STD difference spectrum, in comparison to the reference spectrum with no ligand, confirms the presence of binding interaction.
These findings align with our in silico results, showing that the aromatic rings of both molecules interact with 5-LOX. Furthermore, in
1, most of the aromatic protons of both rings interact with 5-LOX and the same occurs in
2. On the other hand, in LOX-1 enzyme, the protons only in
1 seem to interact with the enzyme and only the protons in aromatic ring (
Figure 8 middle). The Saturation Transfer Difference (STD) spectrum did not show any detectable peaks, probably due to the poor solubility of the compounds in D₂O. This limited solubility may have prevented adequate interaction between the compounds and the solvent, thus hindering the observation of any STD effects. The absence of some signals in the spectrum may be due to the low binding interactions between the ligand and the active site of a protein as it can be shown further in
in vitro results.[
47,
48]
Absorption and Emission Spectra
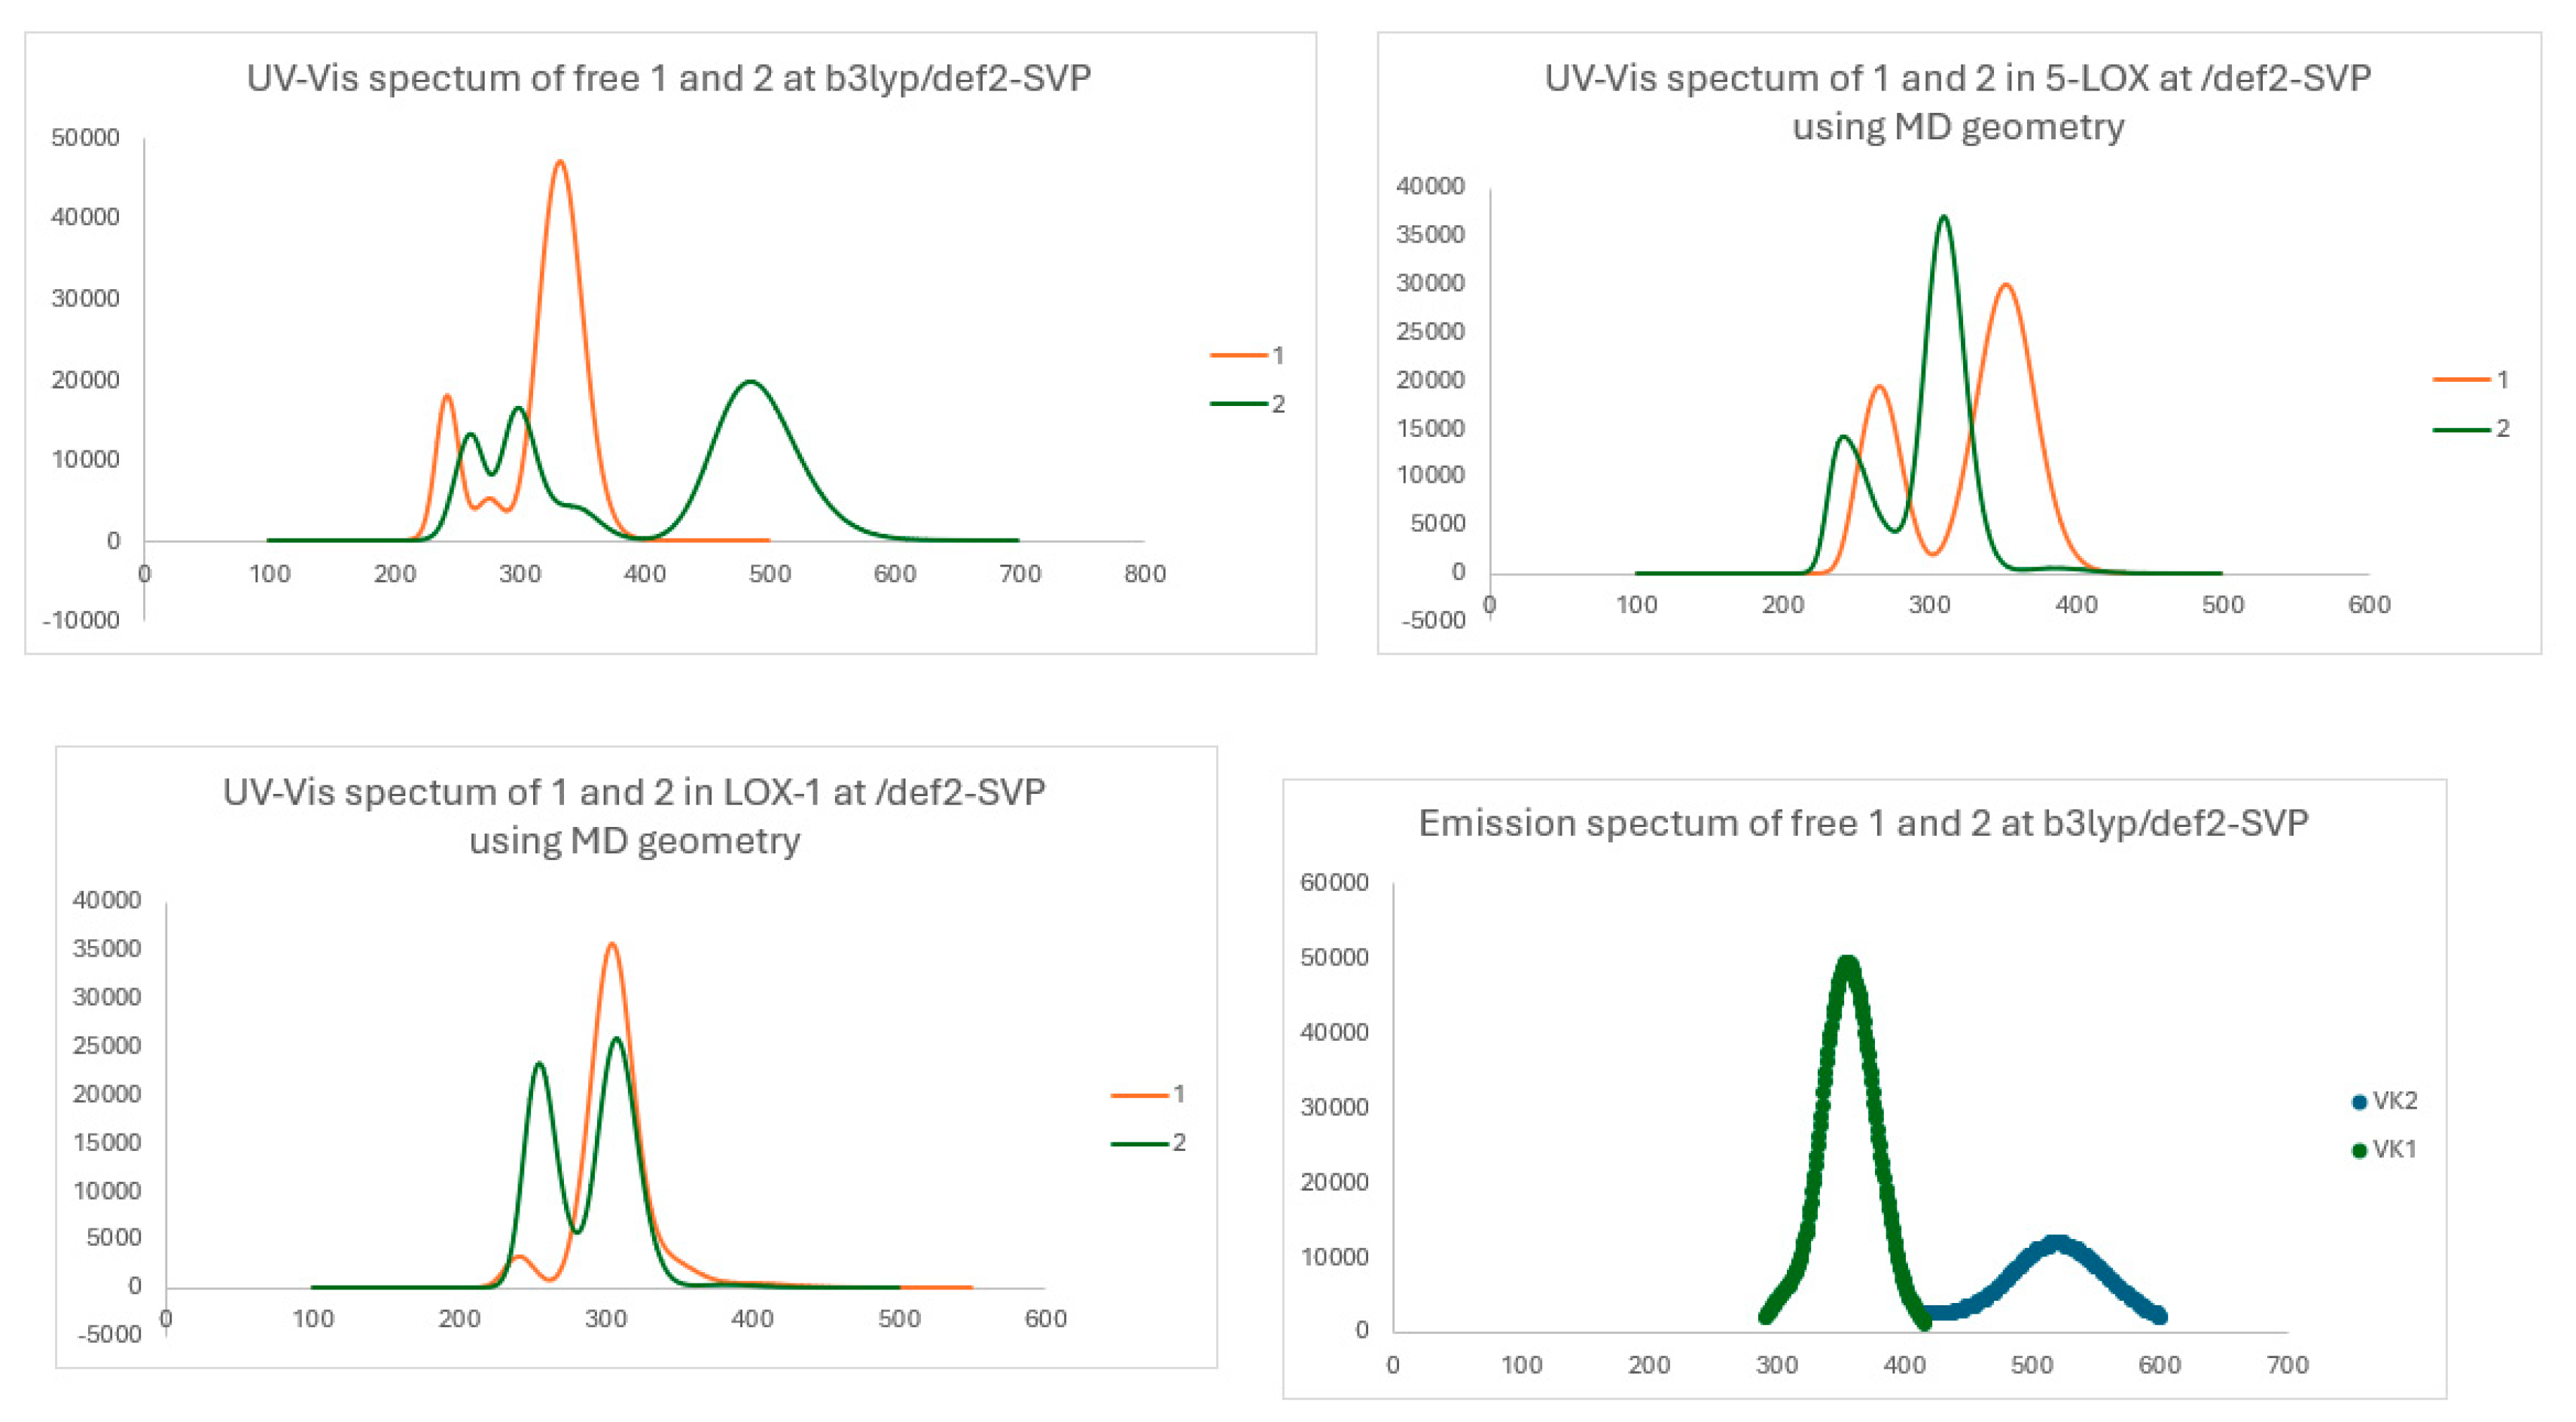
Table 5 provides the λ values, energy difference, and oscillator strength values for the primary peaks observed in the visible-ultraviolet absorption spectra of the free chalcone molecules and encapsulated within each of the enzyme calculated via MD simulations. Meanwhile, Figure 12 illustrates their absorption spectra. Table 6 provides λ values, energy difference, and oscillator strength values of the UV-vis fluorescence spectra of the free chalcone molecules and encapsulated within each of the enzyme calculated via MD simulations.
Table 5.
The λ (nm), energy difference ΔЕ (eV), f-values of the main and selected UV-vis absorption peak excitation of the free compound and the encapsulated ones within LOX-5 and 1-LOX at the B3LYP/def2-SVP method.
Table 5.
The λ (nm), energy difference ΔЕ (eV), f-values of the main and selected UV-vis absorption peak excitation of the free compound and the encapsulated ones within LOX-5 and 1-LOX at the B3LYP/def2-SVP method.
| |
State |
λ |
ΔΕ |
f |
| |
|
|
|
|
| 1 |
S1
|
383.5 |
3.755 |
0.3485 |
|
1_LOX-1 |
S1
|
403.1 |
3.076 |
0.0059 |
|
1_LOX-1 |
S3
|
306.3 |
4.048 |
0.4806 |
|
1_5-LOX |
S1
|
385.6 |
3.215 |
0.0005 |
| |
|
|
|
|
| 2 |
S1
|
485.3 |
2.555 |
0.2922 |
|
2_LOX-1 |
S1
|
380.8 |
3.256 |
0.0043 |
|
2_LOX-1 |
S3
|
305.2 |
4.062 |
0.2364 |
|
2_5-LOX |
S1
|
386.1 |
3.211 |
0.0081 |
Table 6.
The λ (nm), energy differences ΔЕ (eV), f-values, of the S1→S0 de-excitation of the emission spectra of the free compounds at the B3LYP/def2-SVP method.
Table 6.
The λ (nm), energy differences ΔЕ (eV), f-values, of the S1→S0 de-excitation of the emission spectra of the free compounds at the B3LYP/def2-SVP method.
| |
λ |
ΔΕ |
f |
| 1 |
532.5 |
2.328 |
0.0000 |
| a |
431.9 |
2.871 |
0.0030 |
| |
337.2 |
3.677 |
0.5410 |
| 2 |
521.0 |
2.379 |
0.1712 |
| a |
459.4 |
2.699 |
0.0299 |
Regarding the absorption spectra of the compounds, the first main UV-vis absorption peak of 1 and 2 are observed at 384 and 485 nm respectively, i.e., they differ by about 100 nm. The peak of 2 is at visible region and in blue color. The absorption excitation at about 485 nm is often associated with π-π* transitions involving conjugated systems present in the chalcone structure.
The UV-vis absorption spectra of the encapsulated compounds were calculated at their geometries obtained via MD calculations on the compounds@5-LOX and @LOX-1 molecular complexes. For both encapsulated compounds at 5-LOX, their first absorbance band appeared at 386 nm, which is almost the same with that for the free
1, but in the case of chalcone
2, the encapsulation at 5-LOX results in a significant blue shift of the band. In LOX-1, the first UV-vis absorption band is observed at 403 nm for the encaspulated
1 and at 380 nm for the encapulated
2. The shifts of the first absorption bands are due to interaction of the chalcones derivatives with the 5-LOX and LOX-1. Overall, the corresponding energy differences of the absorption S
0 →S
1 of the encapsulated chalcones ranges from 3.08 to 3.26 eV. Regarding the UV-vis emission spectrum (
Figure 11), the first emission S
1→S
0 deexcitation of
1 and
2 are observed at 533 and 521 nm. However, for chalcone
1, the oscillator strength is zero
. Chalcone
1 presents an intence emission peak at 337 nm. Organic compounds with fluorescence spectra in this area can be utilized as fluorescent labels and tags in biological imaging, diagnostics, and labeling applications.[
49,
50] These compounds can be conjugated to biomolecules or nanoparticles to selectively label specific cellular structures or biomarkers for visualization and detection purposes.[
51]
Figure 11.
Absorption spectra of the free calculated compounds and encapsulated in 5-LOX and in LOX-1 at the B3LYP/def2-SVP method. Emission spectra of the free calculated compounds at the B3LYP/def2-SVP method. The geometries of encapsulated complexes structures obtained via MD calculations.
Figure 11.
Absorption spectra of the free calculated compounds and encapsulated in 5-LOX and in LOX-1 at the B3LYP/def2-SVP method. Emission spectra of the free calculated compounds at the B3LYP/def2-SVP method. The geometries of encapsulated complexes structures obtained via MD calculations.
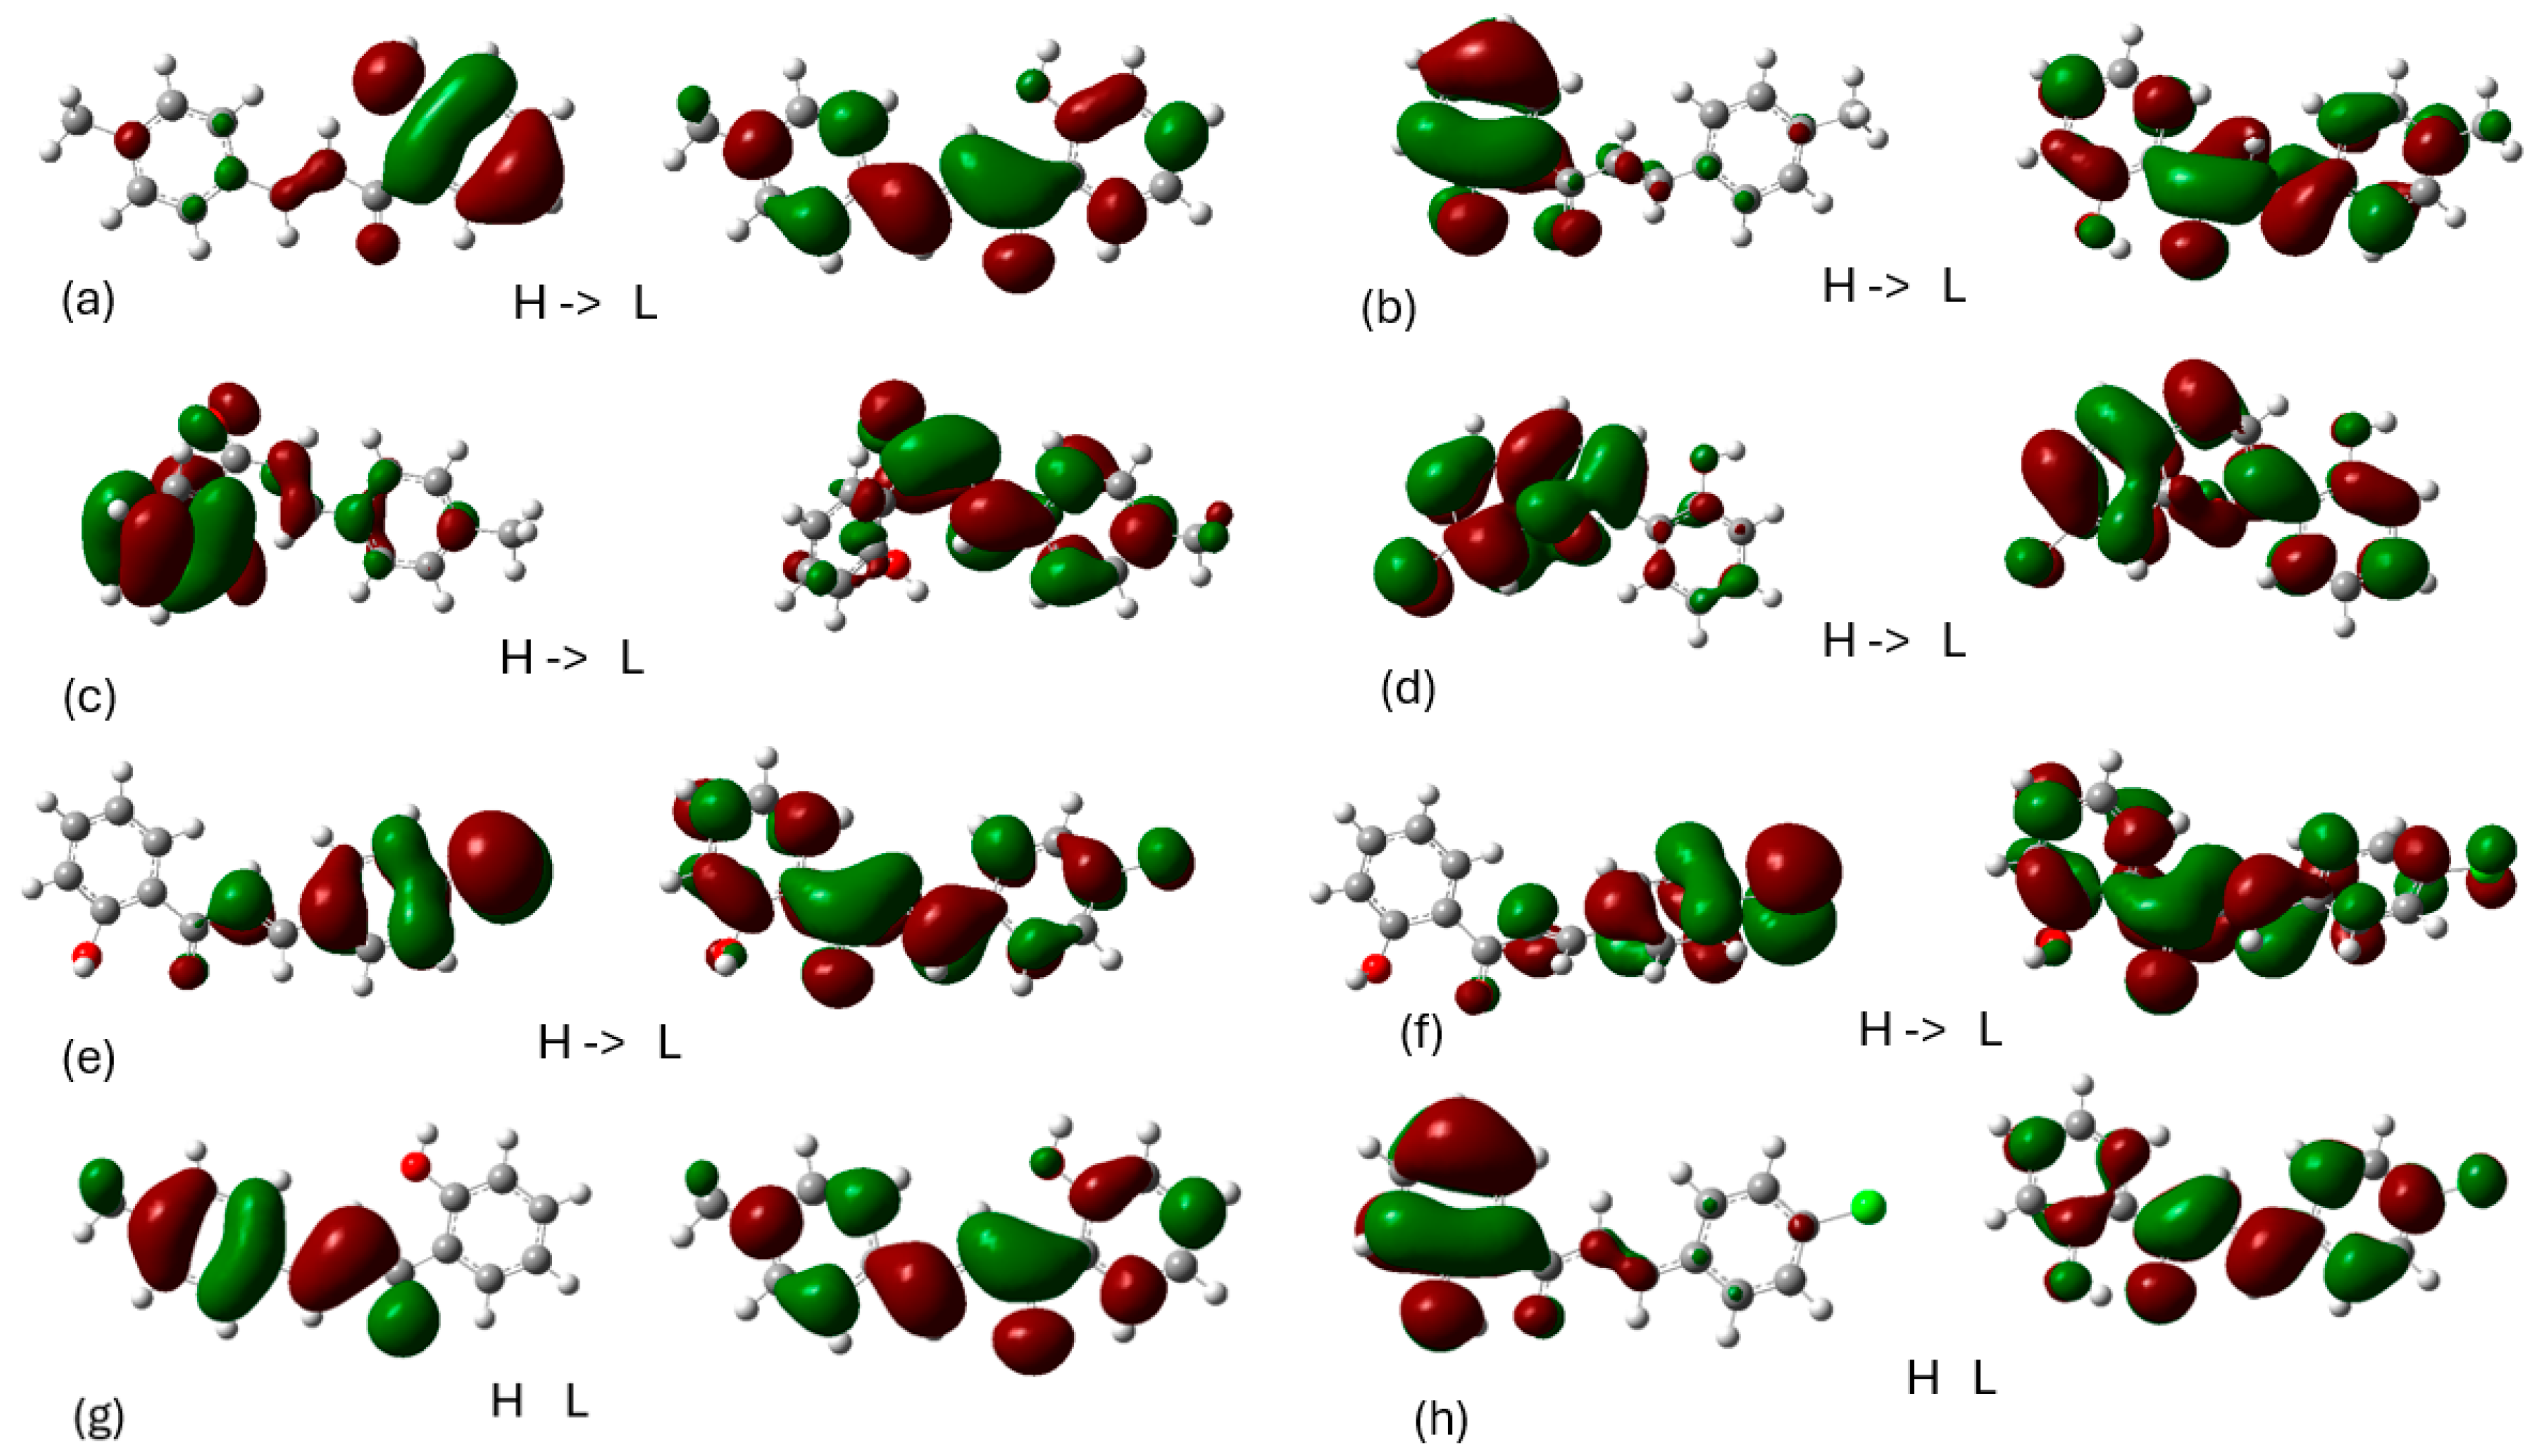
The frontier molecular orbitals involved in main UV-vis absorption peaks and fluorescence peaks are shown in the Figure 12. Regarding the absorption spectra, the HOMO and LUMO orbitals of the ground state are localized to the aromatic rings. Specifically, for compound 1, the HOMO orbital is localized to the one aromatic ring, while the LUMO orbital is localized to the aromatic ring next to methyl. Furthermore, in free chalcone 2, the HOMO orbital is localized to the aromatic ring with chloride, while when it is complexed is localized to the other aromatic ring. In all cases, the LUMO orbital is localized in the whole molecule. This phenomenon is a result of the molecular structure and the electronic environment surrounding the molecule. Regarding the emission spectrum, the HOMO orbital is localized in other ring in contrast with those of absorption. The LUMO orbital is localized in the whole molecule like the absorption spectrum. The frontier orbitals are essential to understant the molecular electronic structure, the nature of conjugation, and the interaction of the molecule with light, which are fundamental to predict reactivity, stability, and optical properties of organic compounds. Finally, the emission data allow us to understand the excited-state dynamics and relaxation pathways, which are key to designing molecules with specific light-emitting or light-absorbing characteristics.
Figure 12.
Frontier Molecular orbitals (HOMO on the left and LUMO on the right) involved in the S1 absorption peak of the (a) free 1, (b) 1 complexed with 5-LOX, (c) 1 complexed with LOX-1 after MD, (d) free 2, (e) 2 complexed with 5-LOX, (f) 2 complexed with LOX-1 and Frontier Molecular orbitals involved in the S1 S0 fluorescence peak of the, (g) free 1 and (h) free 2.
In Vitro Evaluation Against Human 15-LOX-1 and Lipoxidases Enzymes
Finally, we investigate the inhibitory potency of the newly synthesized compounds against human 15-LOX-1 and Lipoxidase, which are isoenzymes of the LOX family. Our aim was to evaluate the selectivity profile of the compounds and identify any inhibition to the enzymes at μΜ concentrations (100 μΜ). As shown in
Figure 13, the compounds exhibited minor inhibition, indicating binding to the proteins. However, none of the tested compounds proved to be very potent, as enzyme activity remained above 85% in both cases.
ThioLox is a known inhibitor of human 15-LOX1 and was used as a control.[
43] This is also in agreement with the STD results, because also there no clear peaks in LOX-1 were observed.
Figure 13.
Compounds tested (at 100 μΜ) against human 15-LOX-1 and Lipoxidase.
Figure 13.
Compounds tested (at 100 μΜ) against human 15-LOX-1 and Lipoxidase.
