Submitted:
03 November 2024
Posted:
04 November 2024
You are already at the latest version
Abstract
Keywords:
1. Introduction
2. Materials and Methods
2.1. Mice Breeding
2.2. PGE2-EP2/4 Signaling and Inflammatory Gene Expression Detection Using RT-Q-PCR for 4-Week-Old Mice
2.3. Measurement of Prostaglandin 2 (PGE2) Using Enzyme Linked Immunosorbent Assay (ELISA)
2.4. Immunofluorescence Staining
2.5. Muscle Histology
2.6. Mice Treatment with EP2 Antagonist PF04418948
2.7. Micro-CT Scanning and Analysis
2.8. Bone Histology Analysis and Immunohistochemistry
2.9. Muscle Histology Analysis
2.10. Q-PCR Analysis of the Thigh Muscle Tissues for PF04418948 Treated and Vehicle Treated DKO-Hom Mice
2.11. Statistical Analysis
3. Results
3.1. PGE2/EP2/4signaling Pathway Components all Significantly Up-Regulated in DKO-Hom Mice
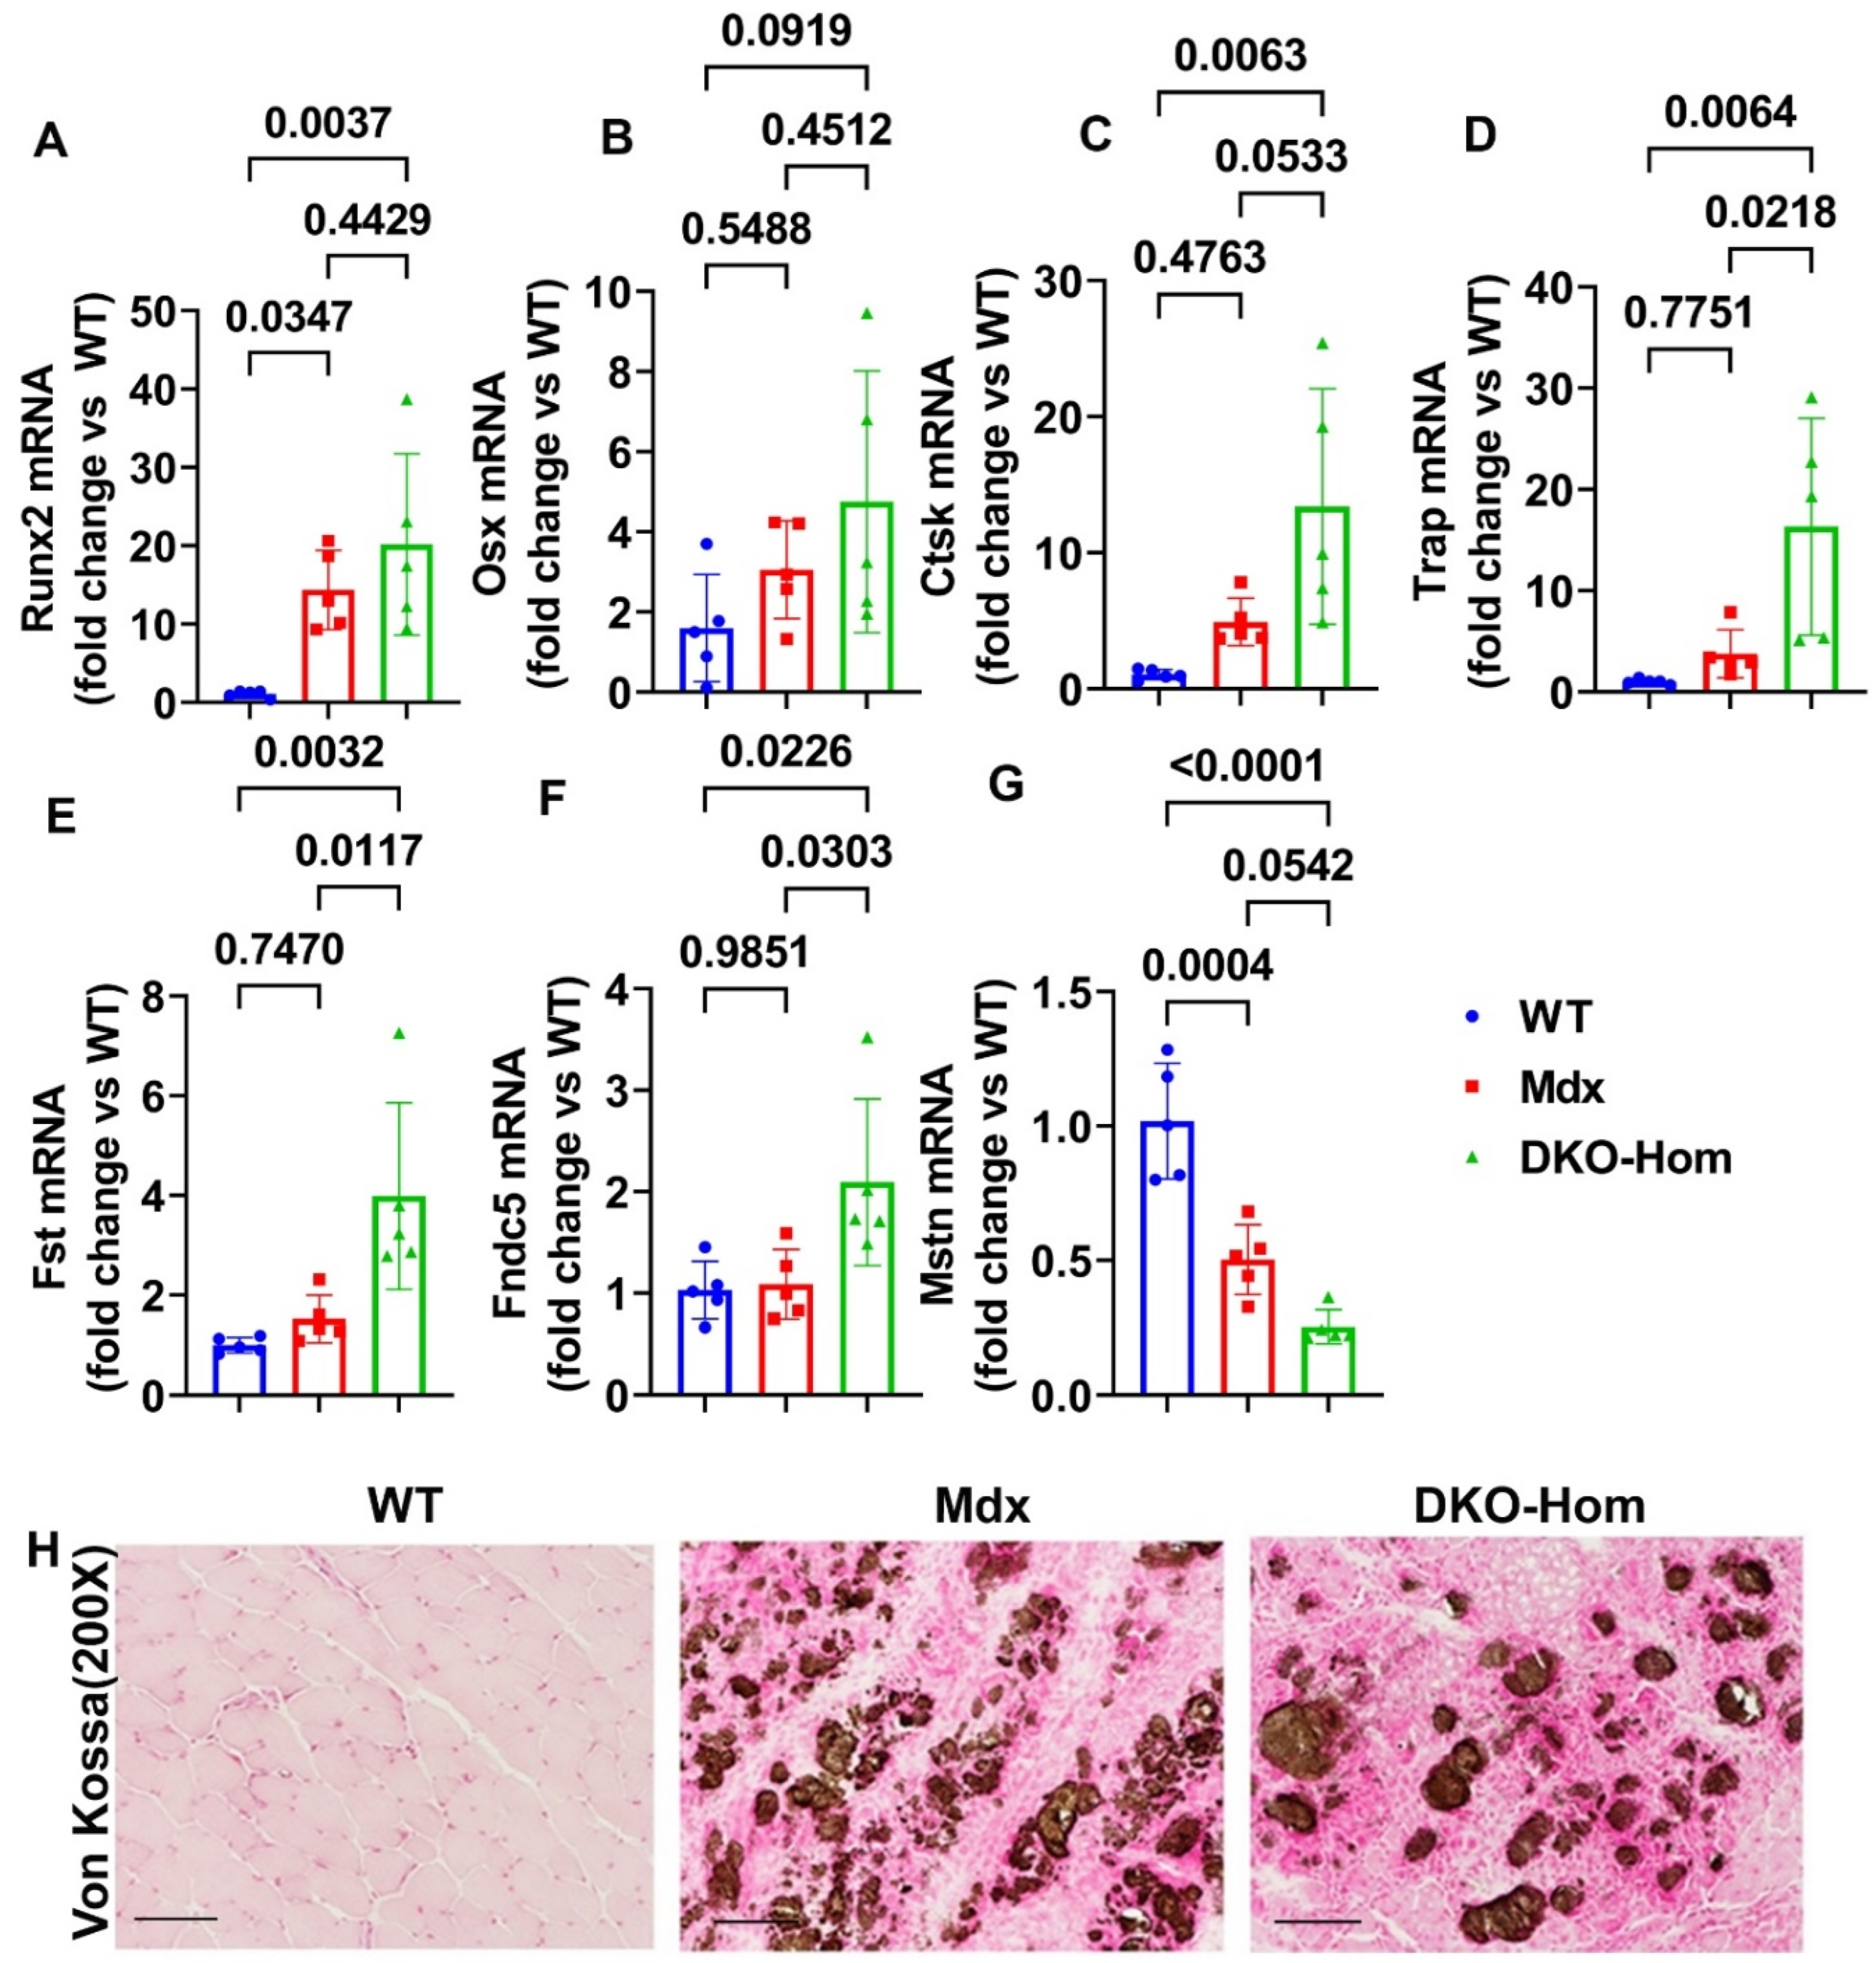
3.2. Increased Osteogenic-Related Genes Correlated with HO in the Muscle Tissues of DKO-Hom Mice
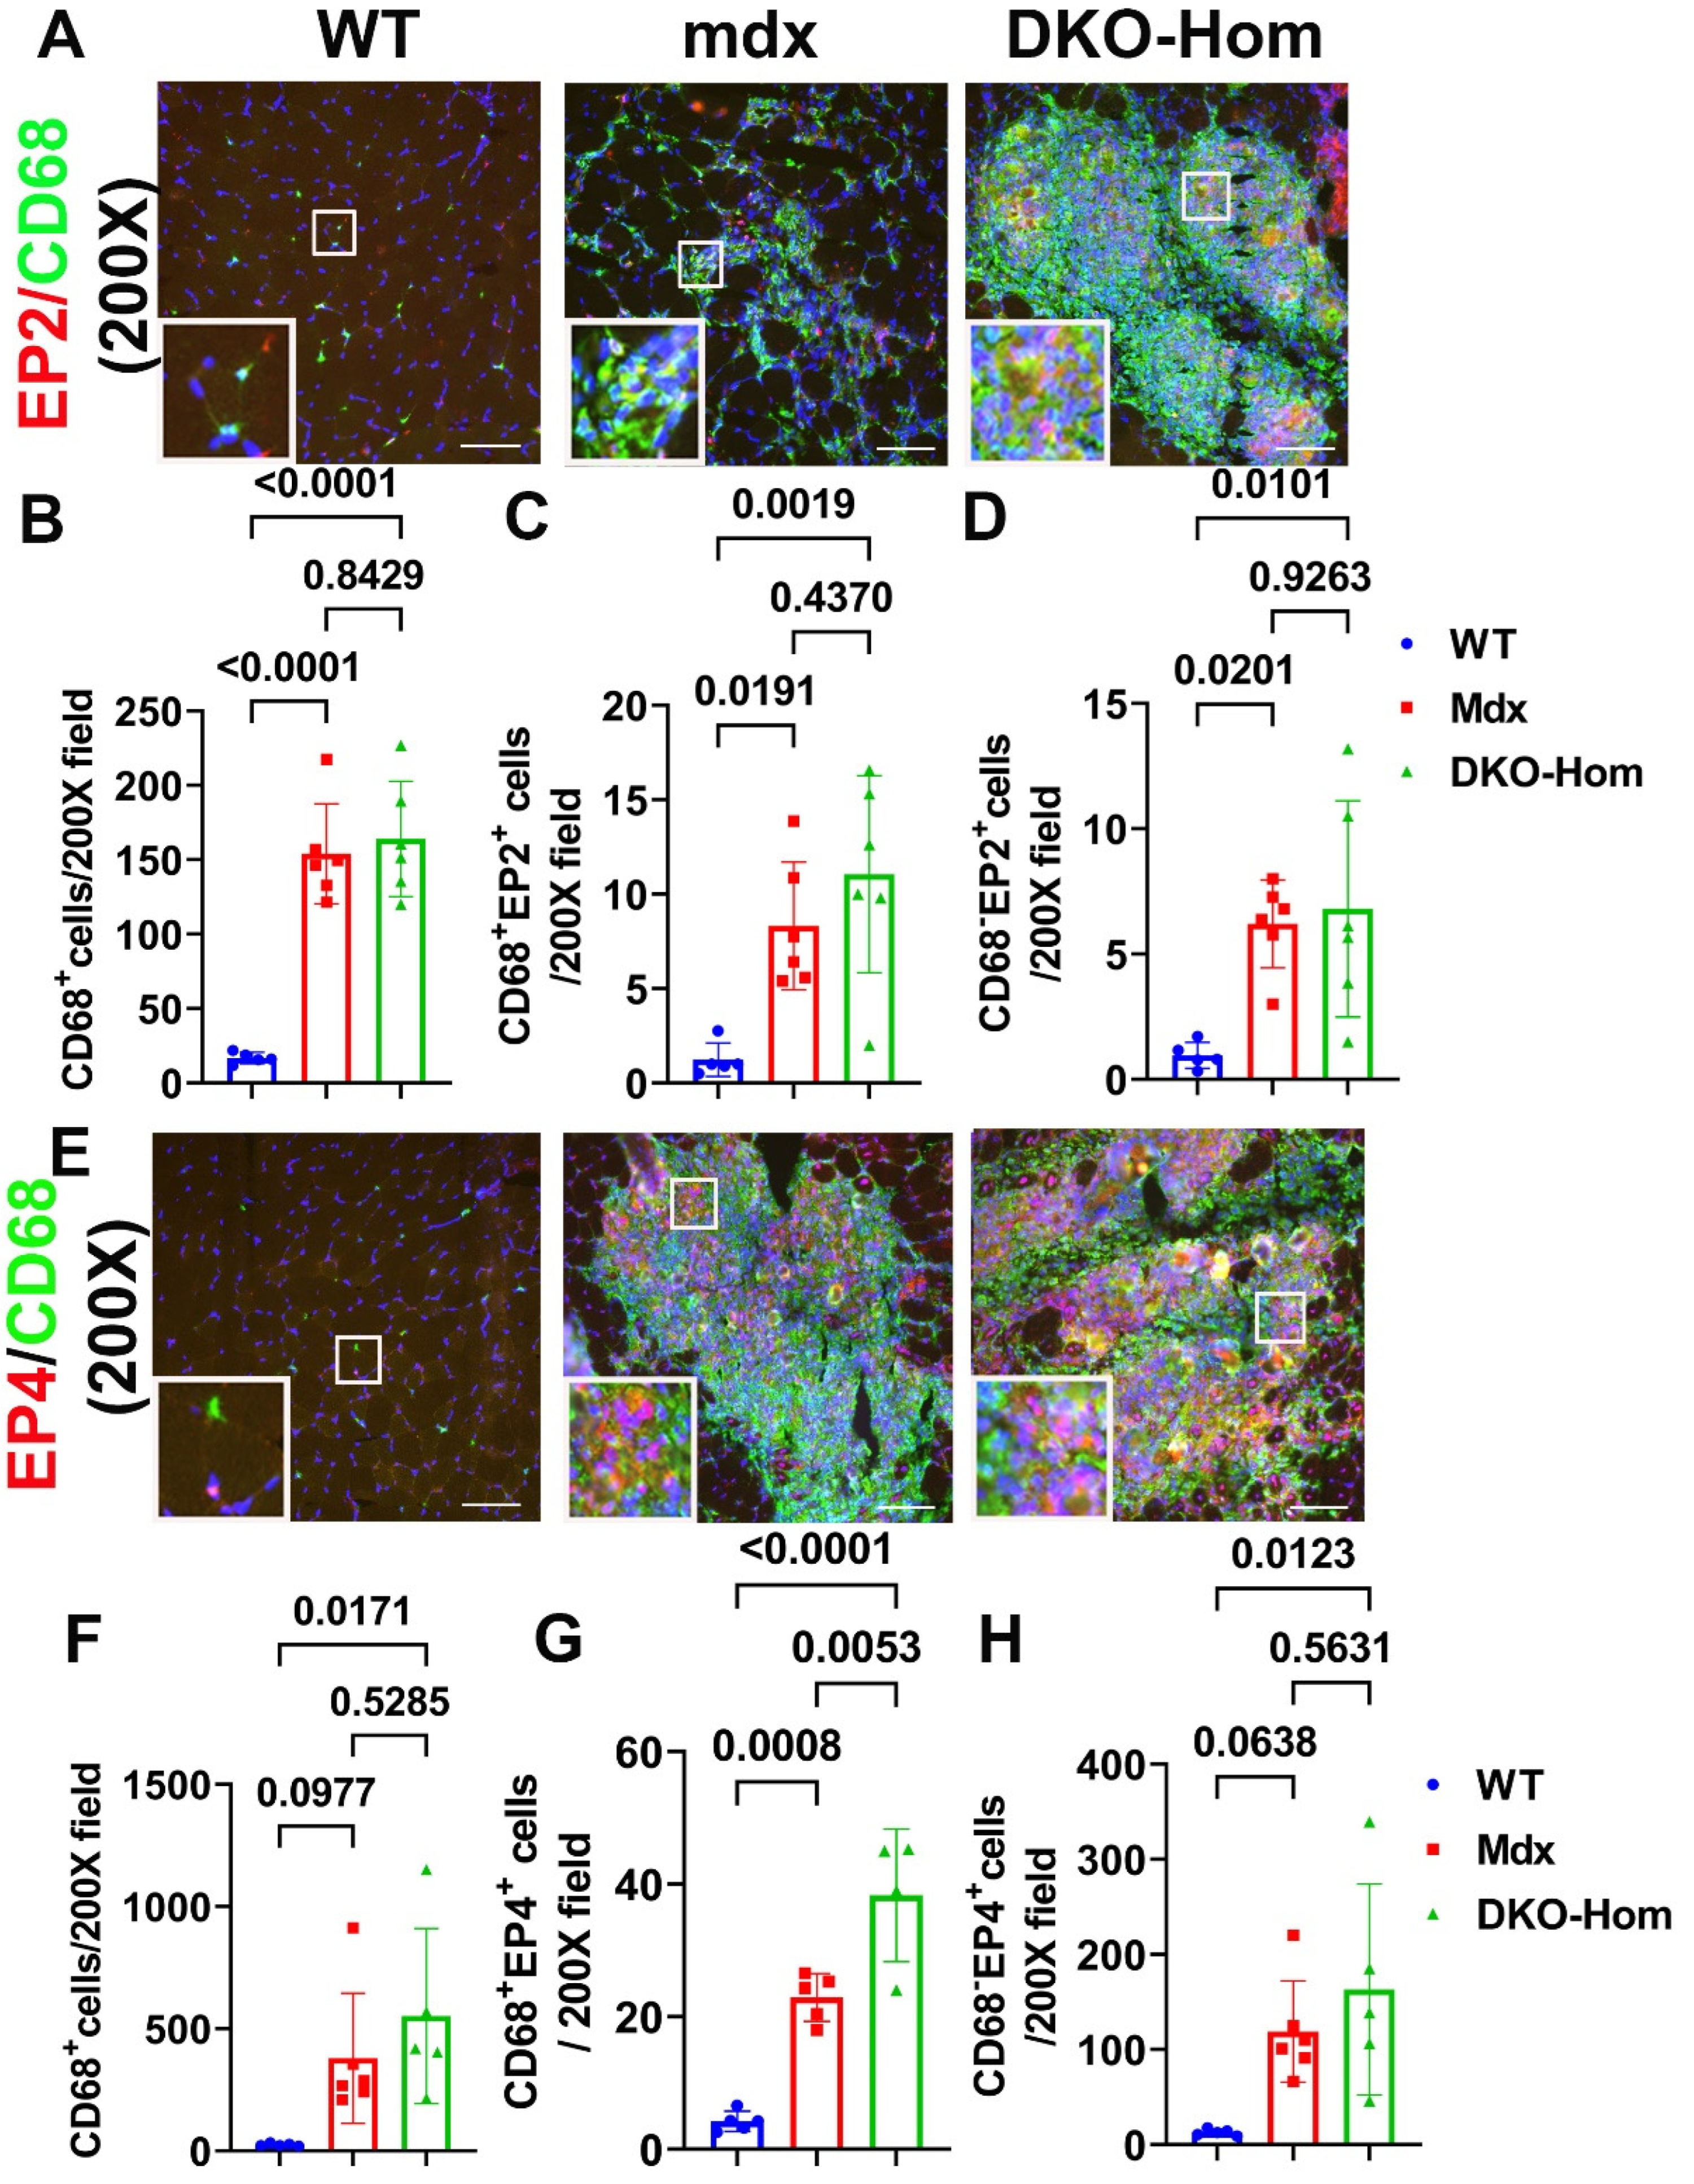
3.3. EP2/EP4 Expression in the Muscle Tissues Are Predominately in the Macrophages
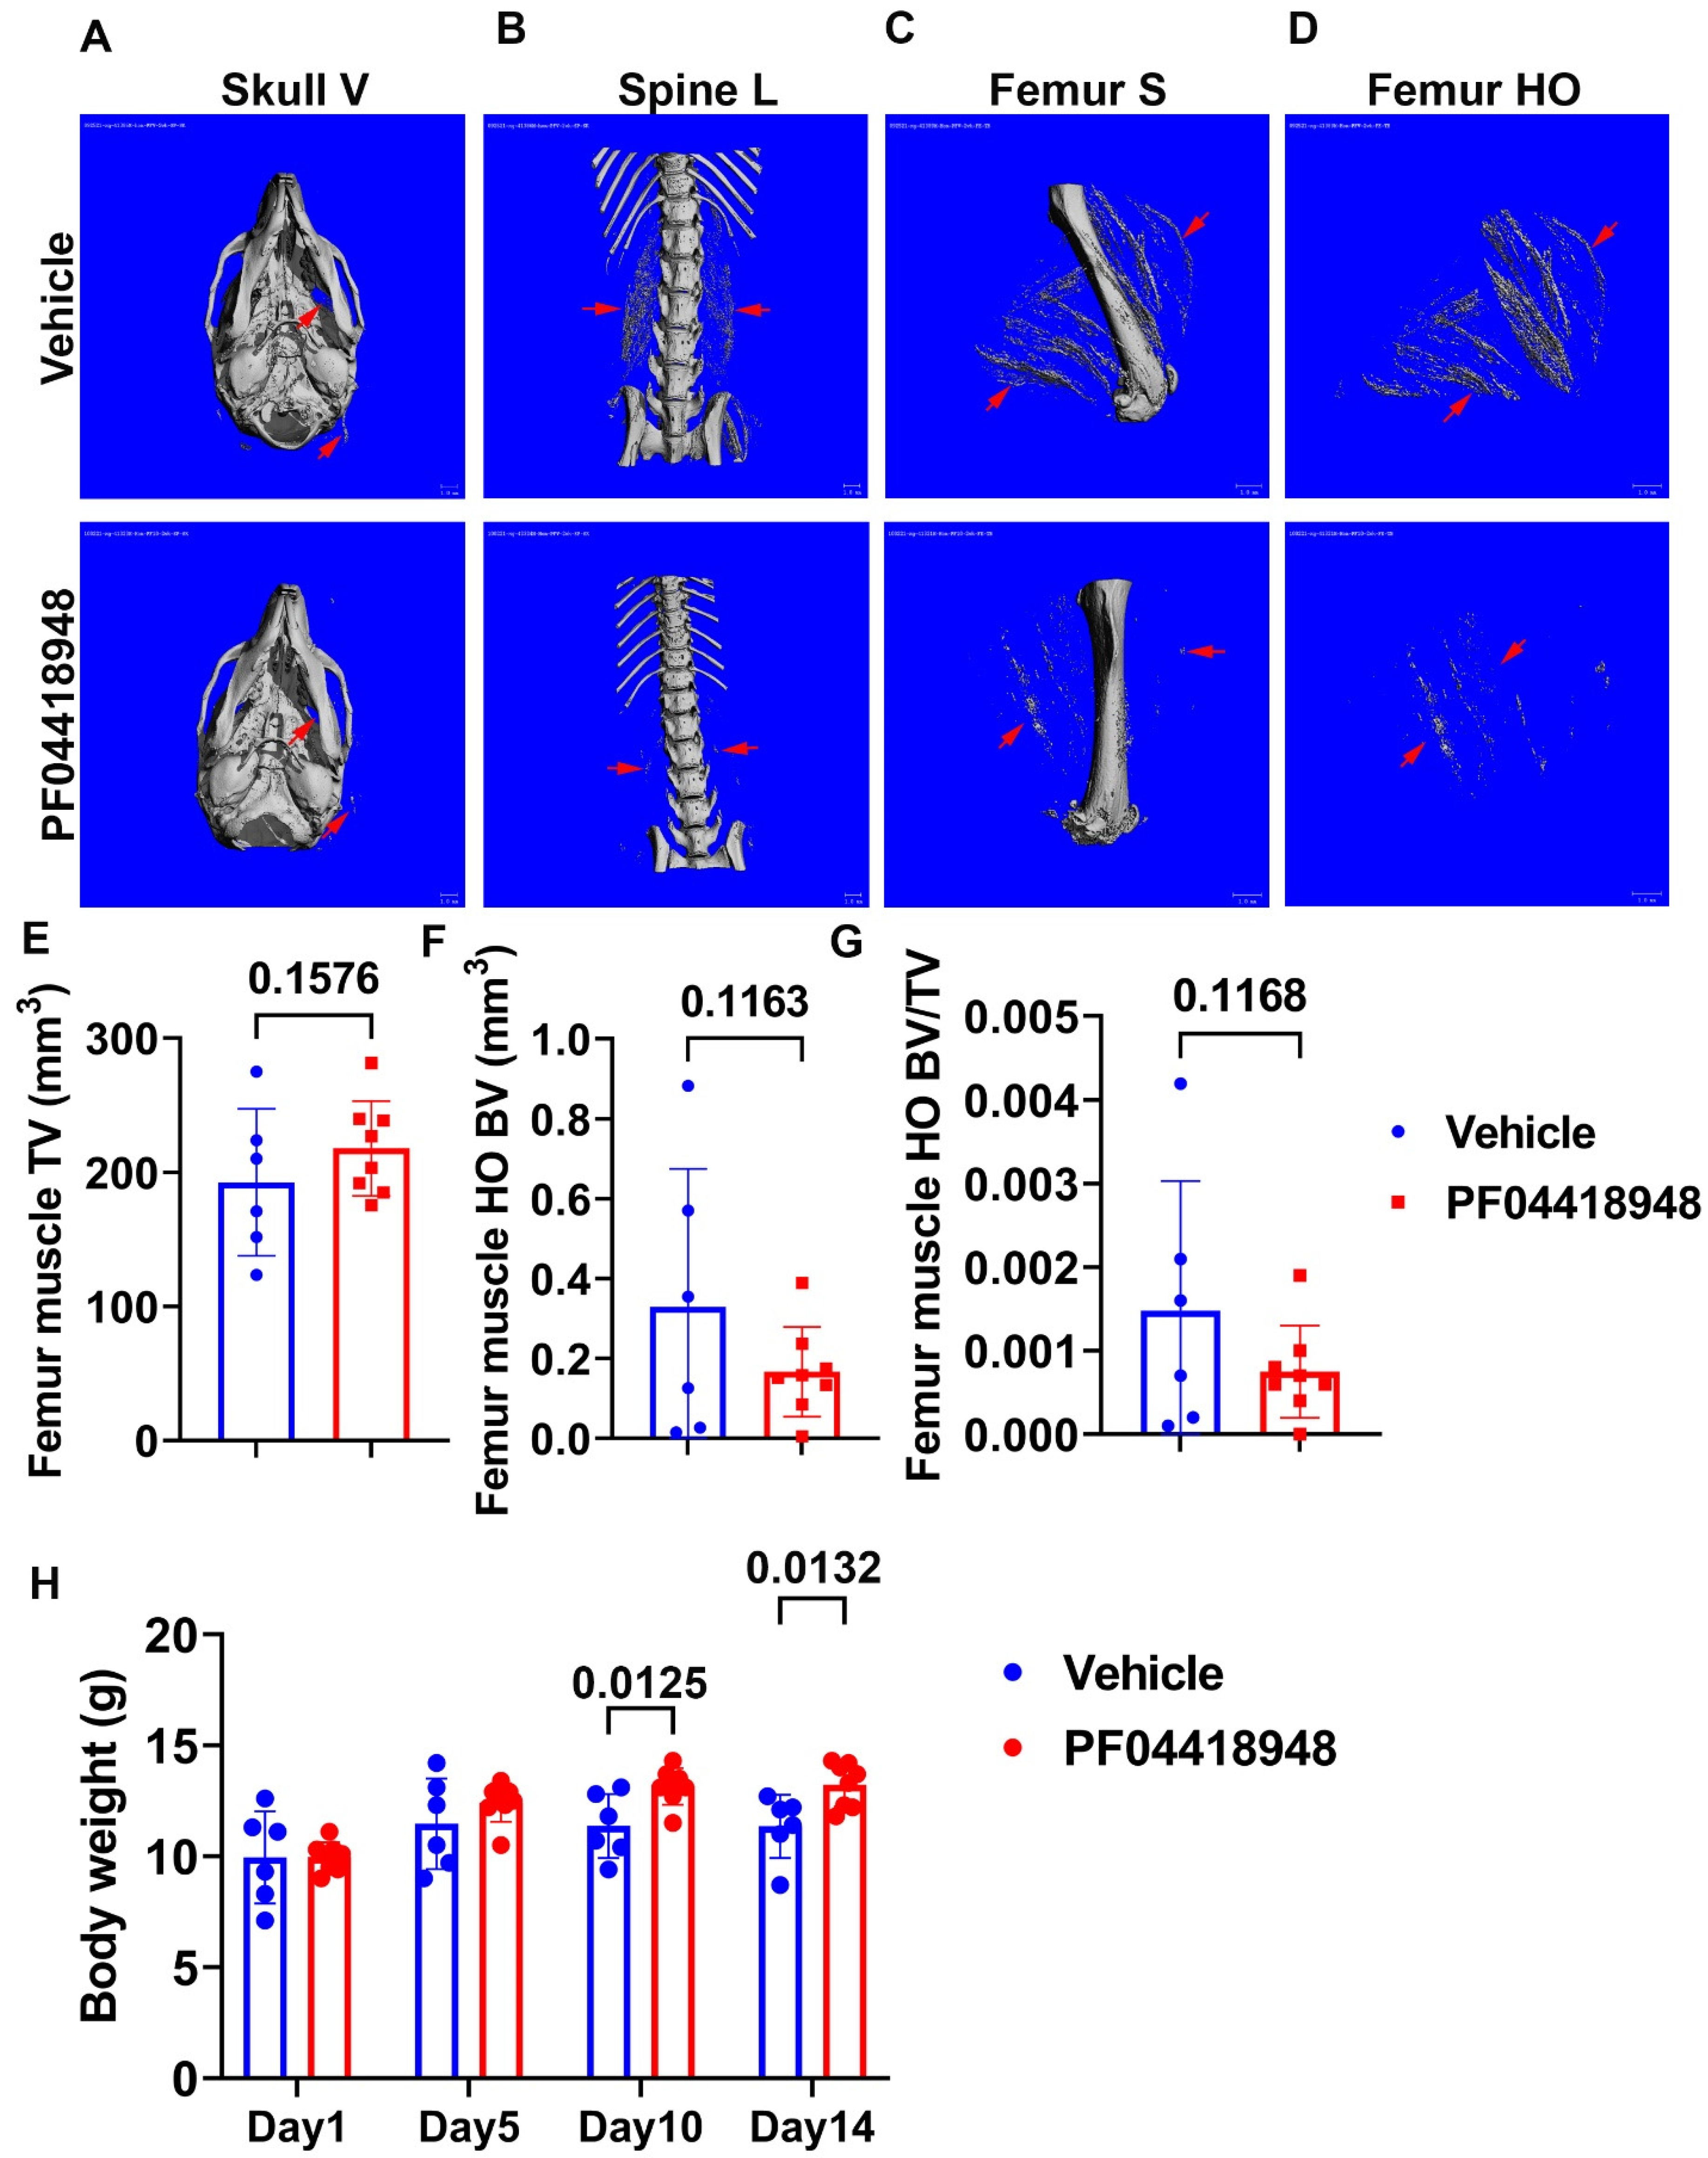
3.4. Treatment with EP2 Antagonist PF04418948 Decreased HO in the Muscle Tissues
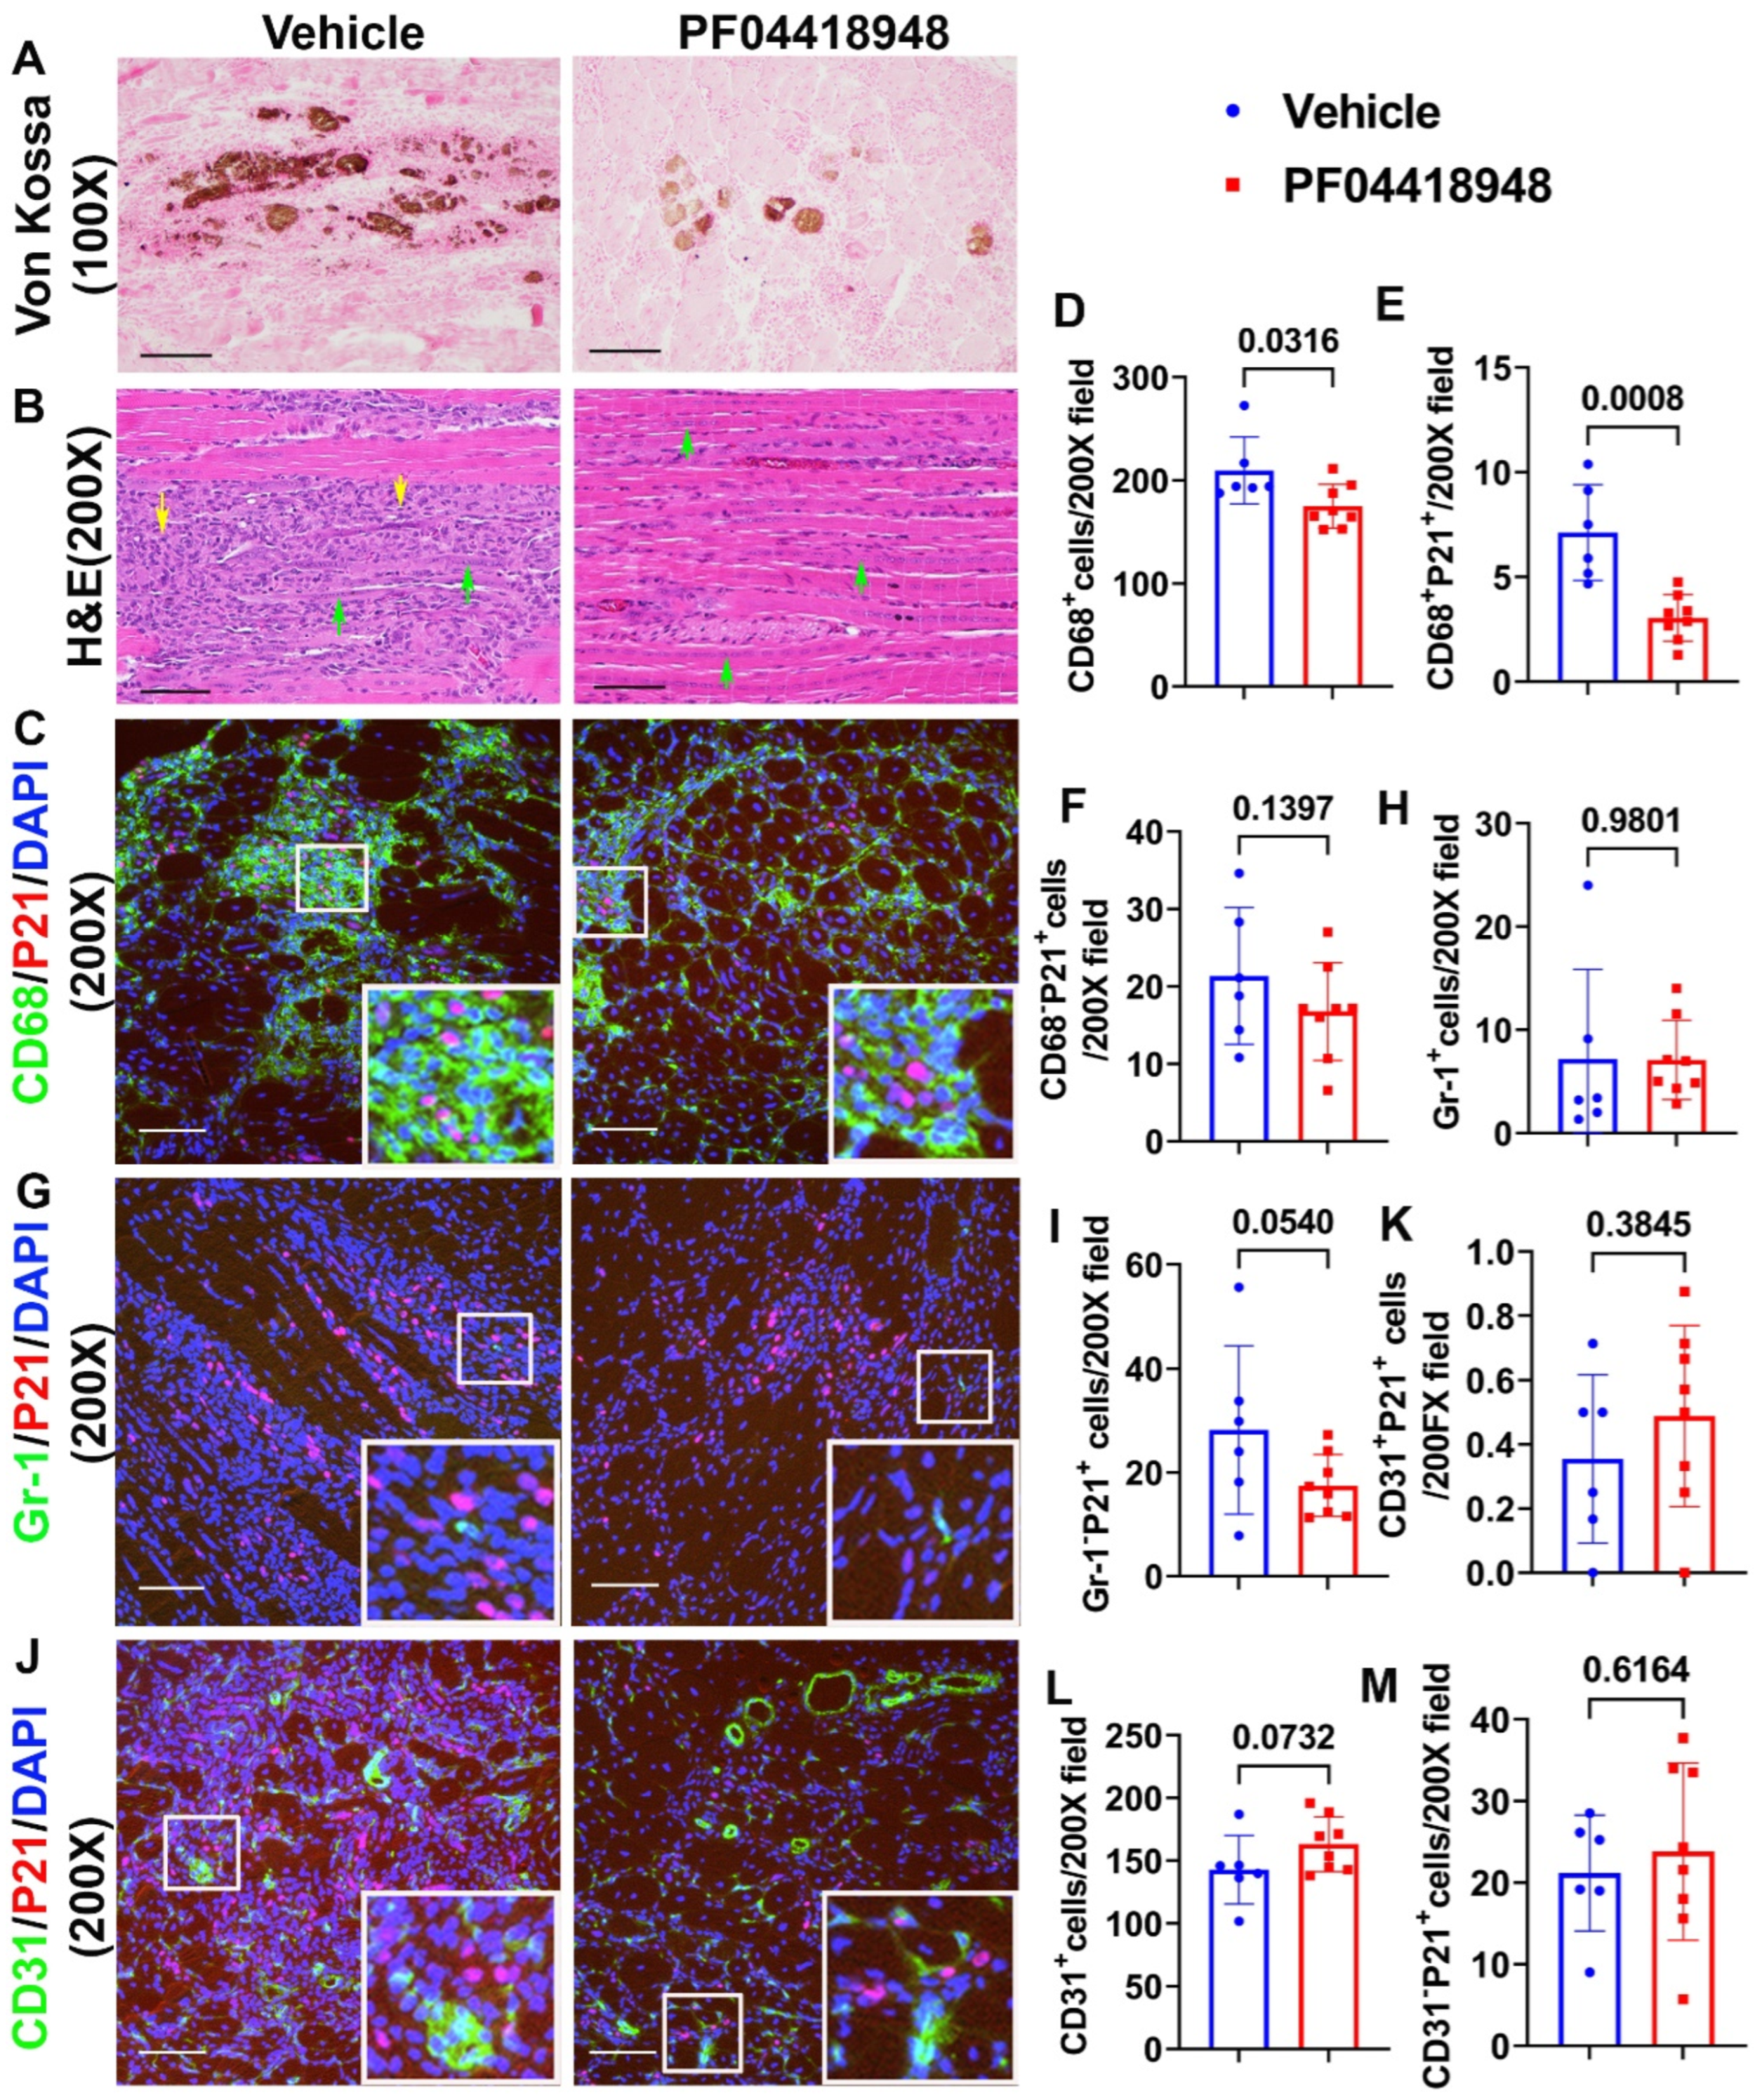
3.5. PF04418948 Treatment Improved Muscle Pathology
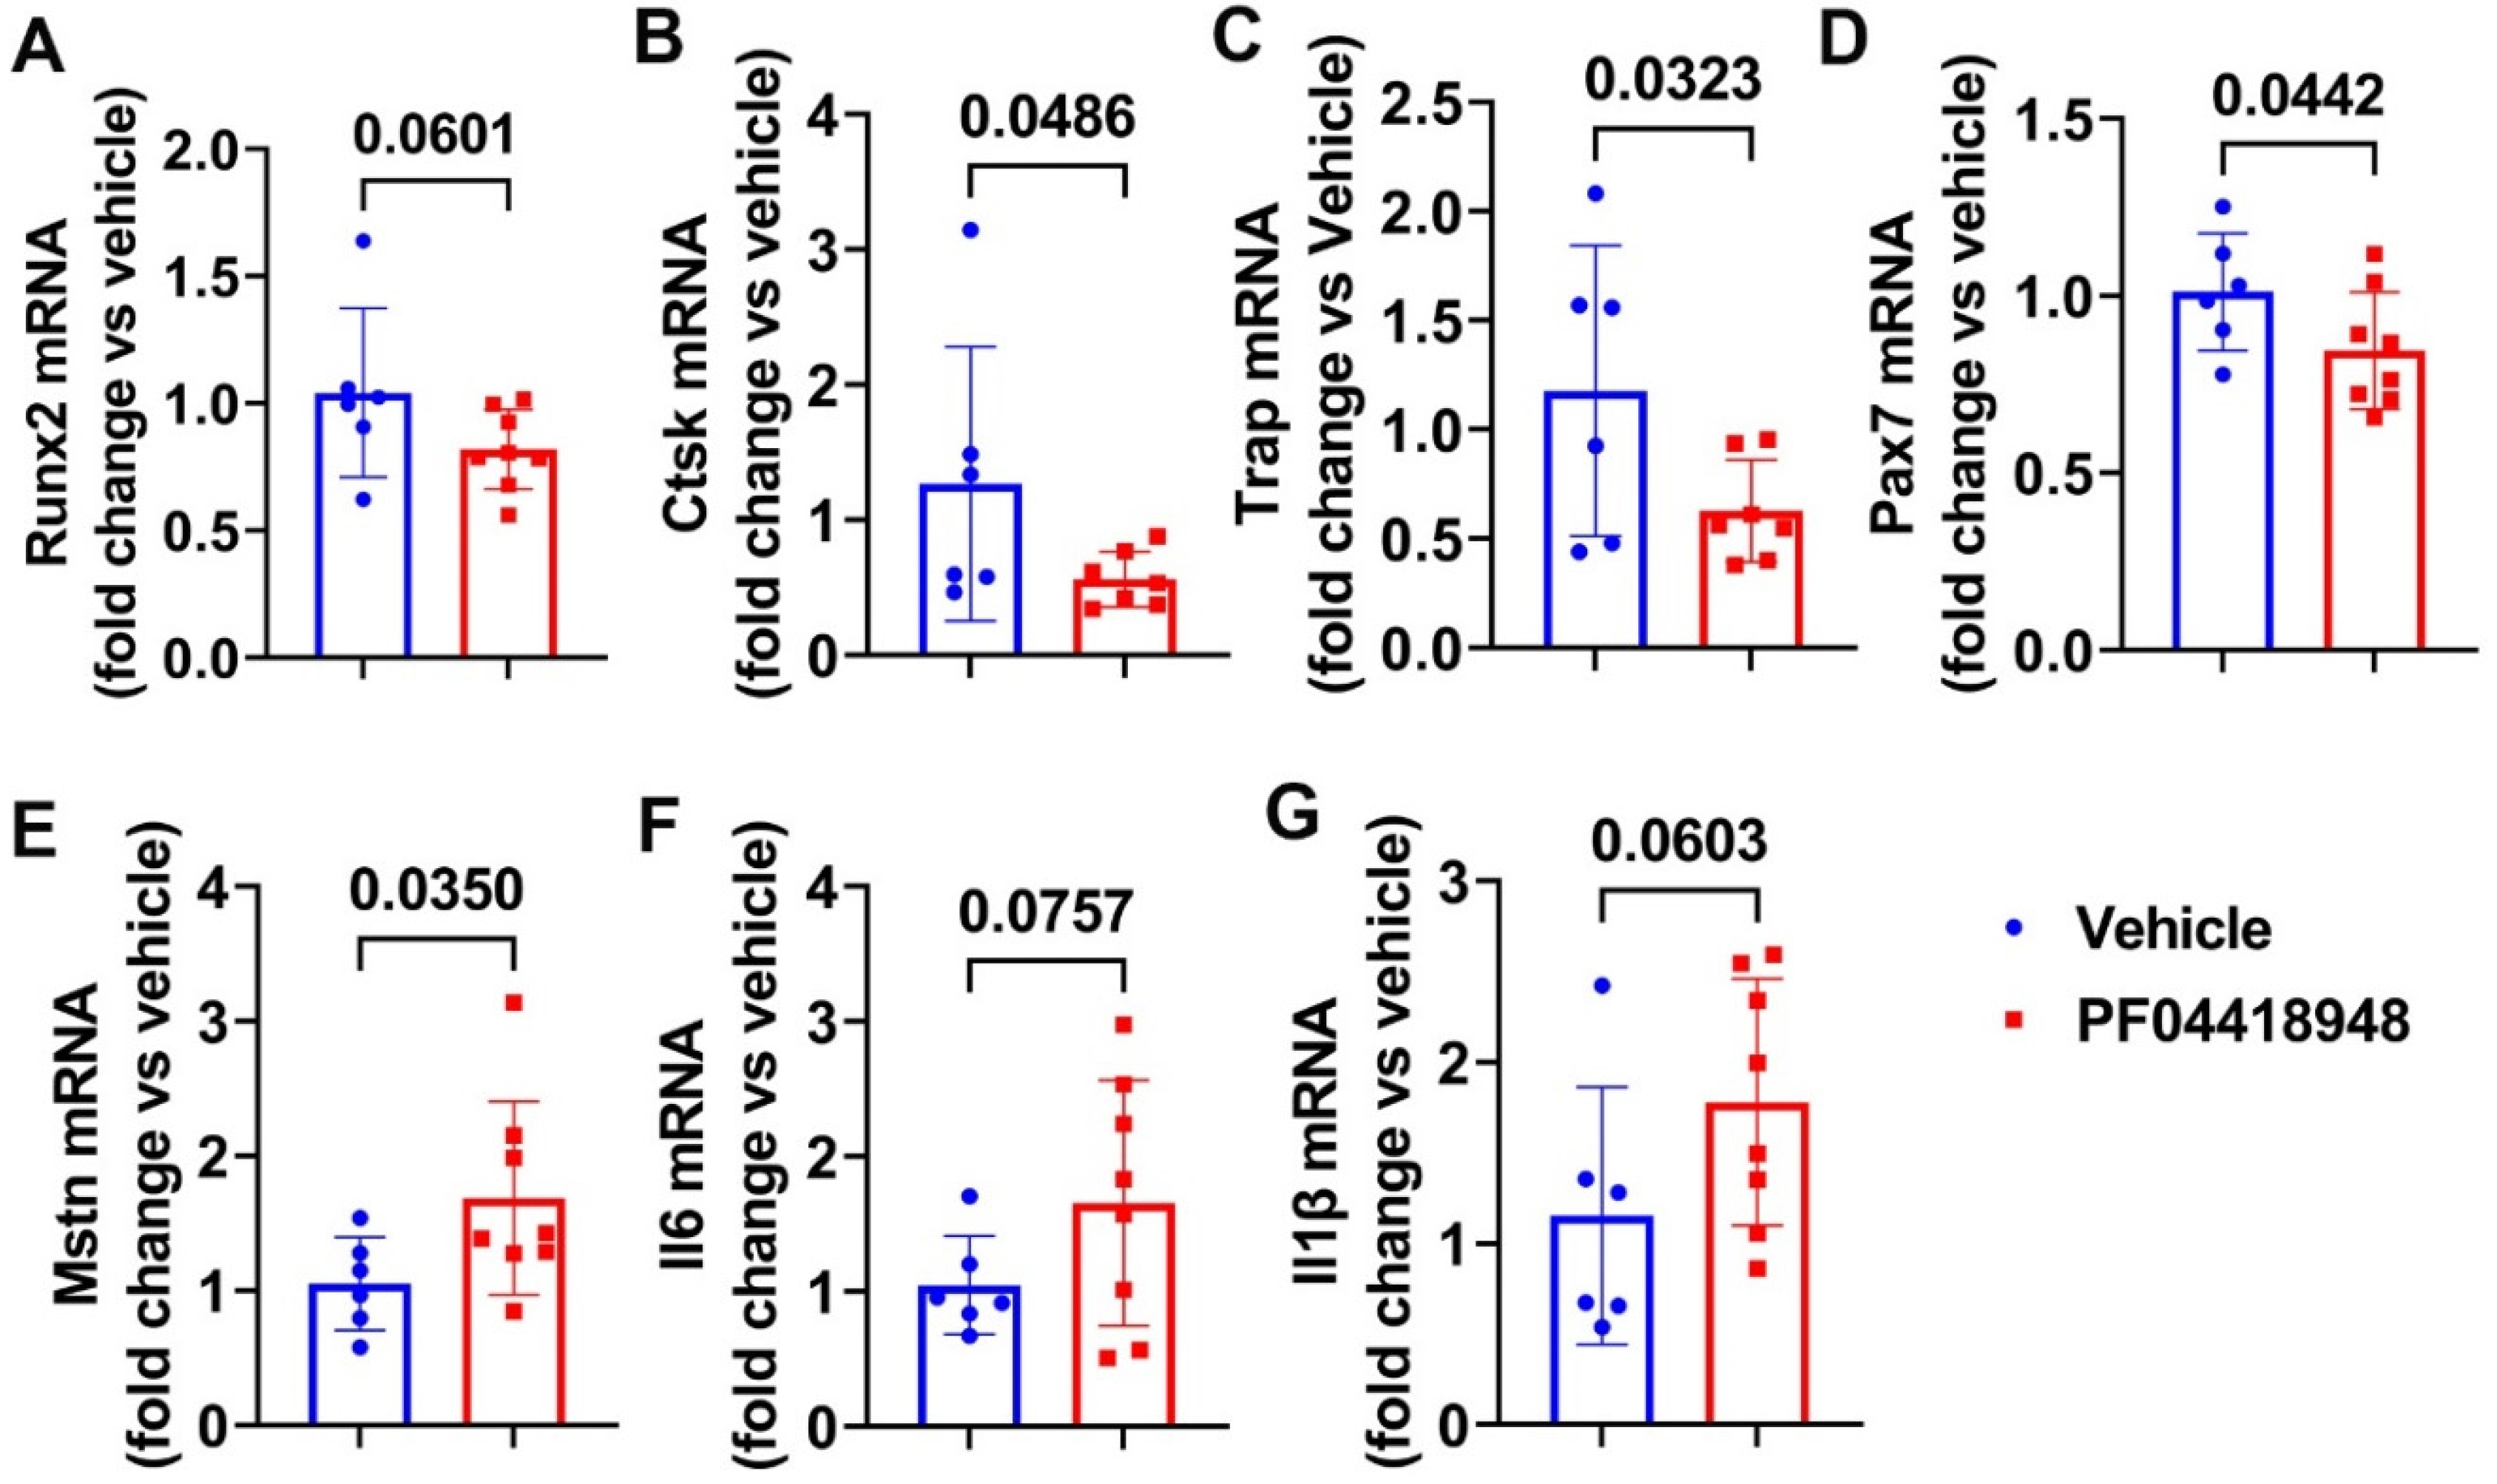
3.6. PF04418948 Treatment Changed HO Related Genes, Myokine, and Inflammatory Genes
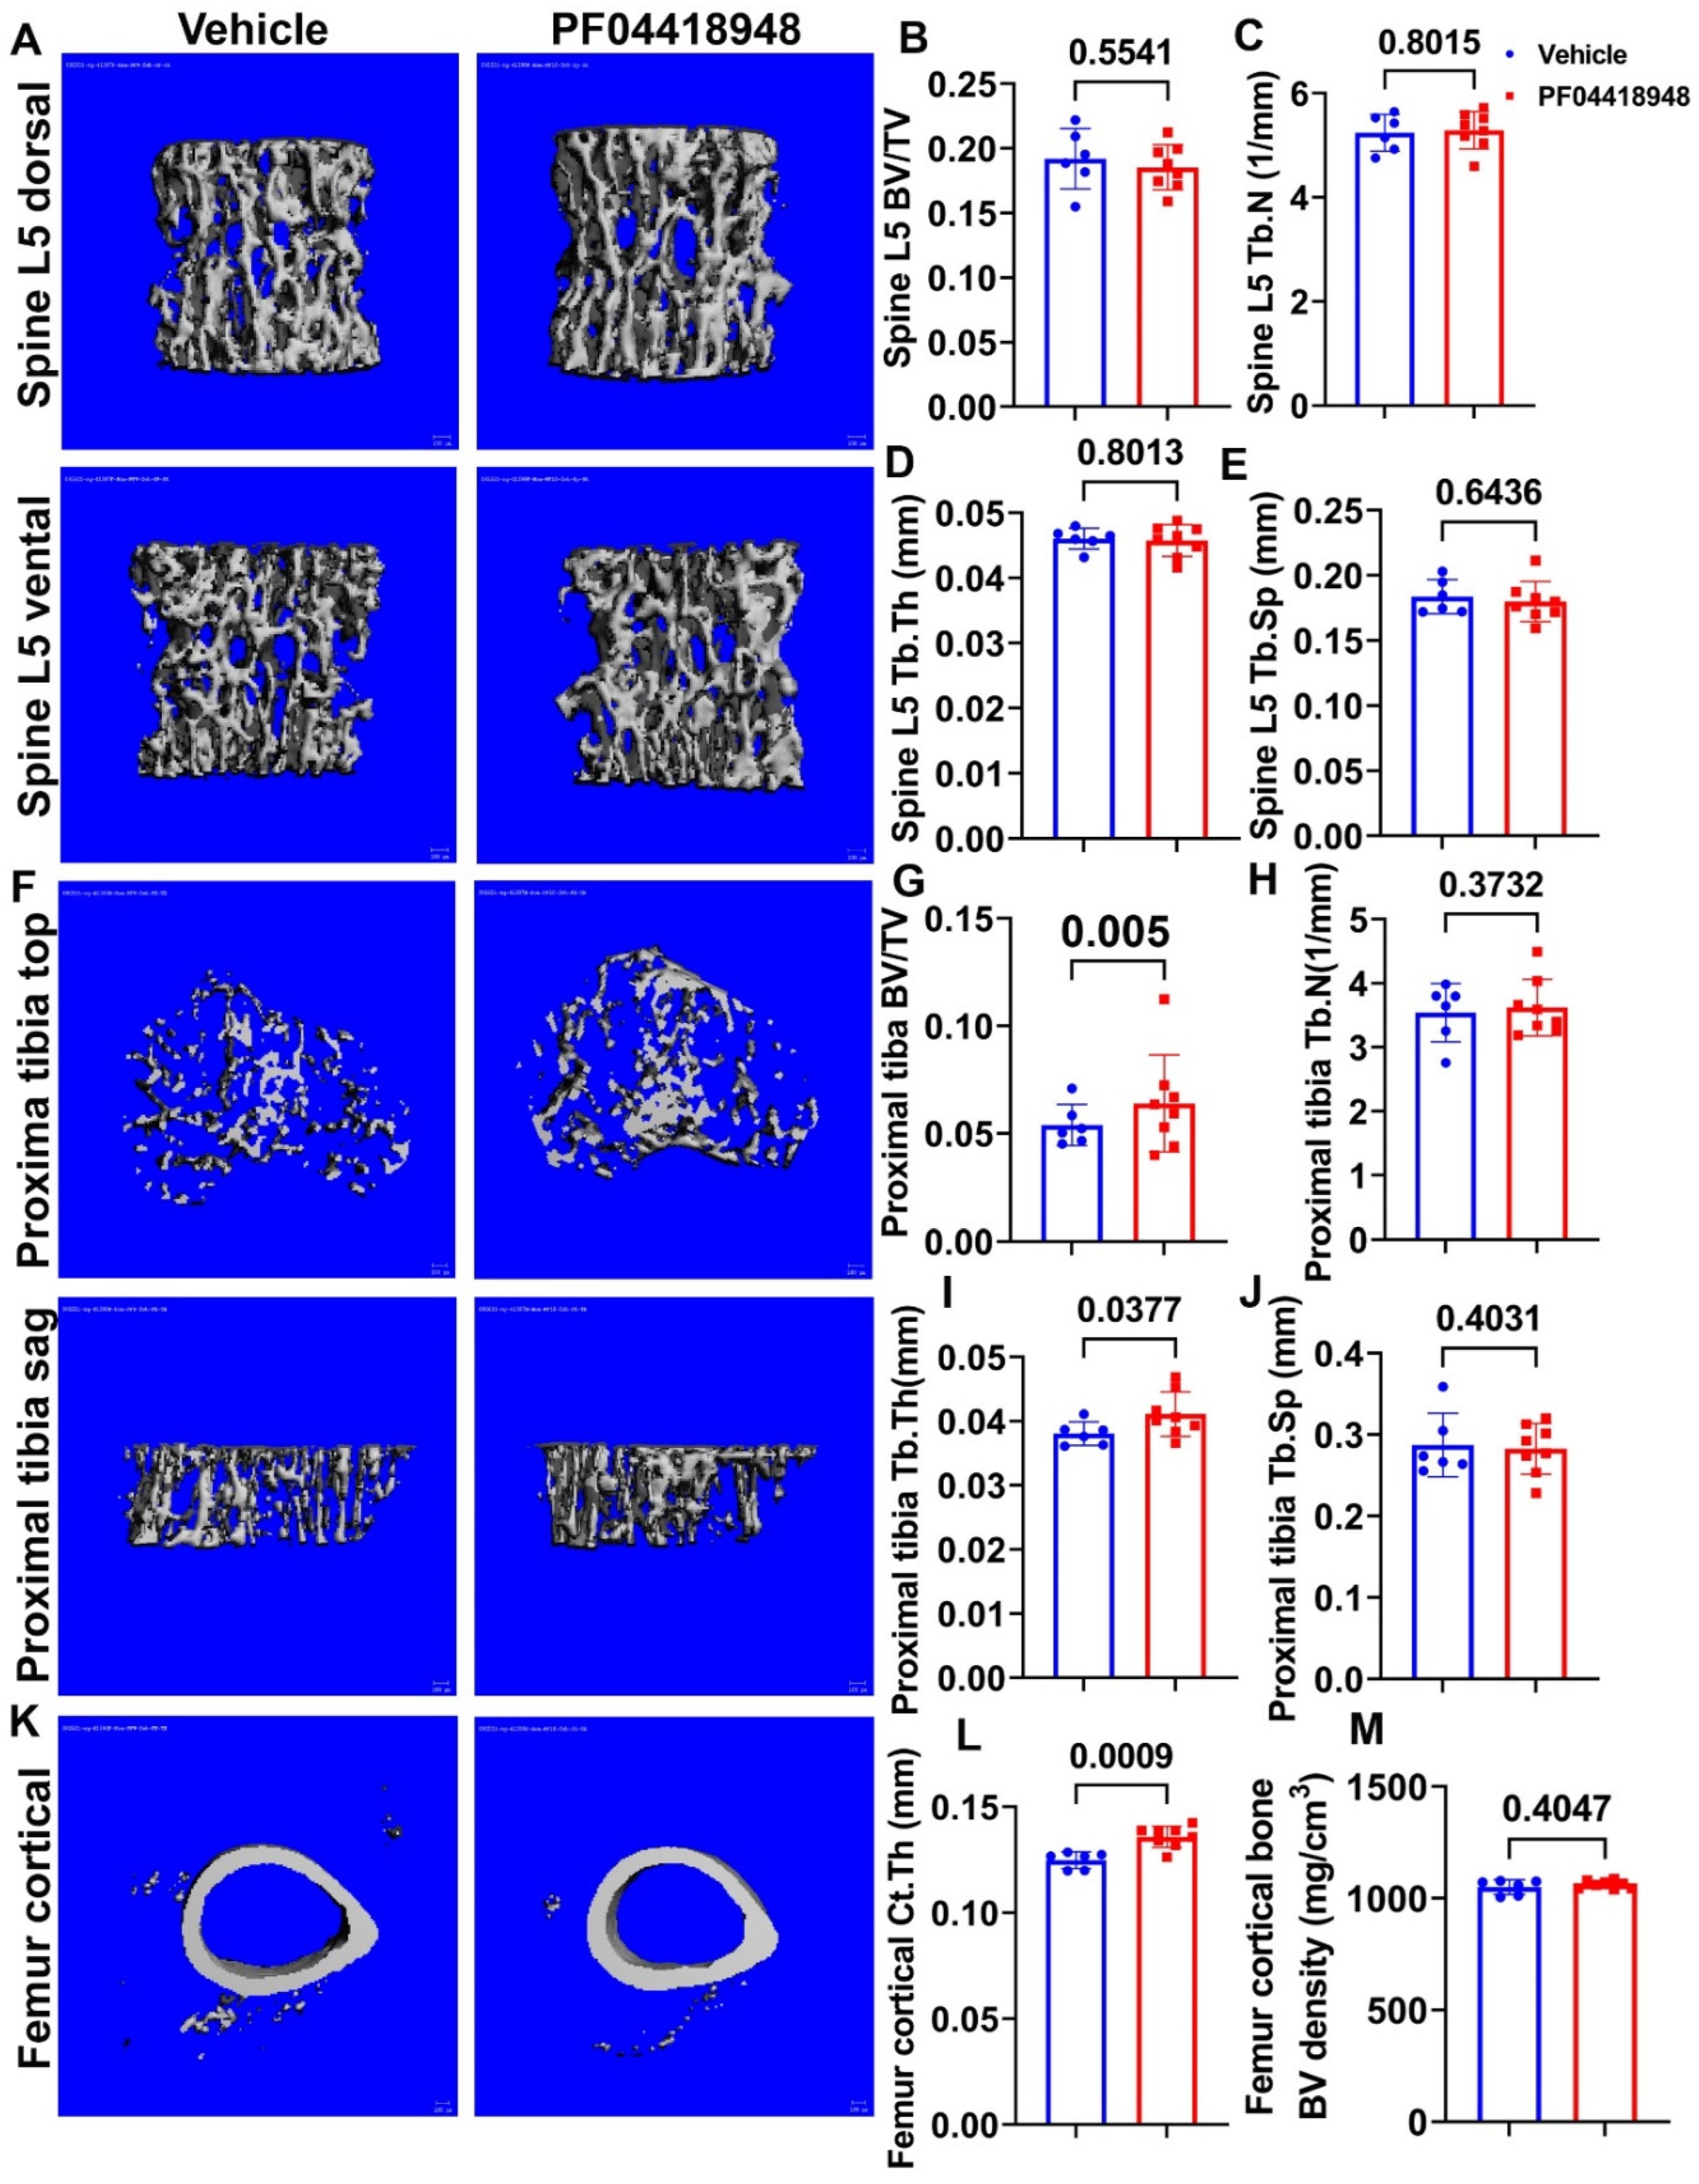
3.7. PF04418948 Treatment Improved Trabecular Bone and Cortical Bone Microarchitecture of Long Bones
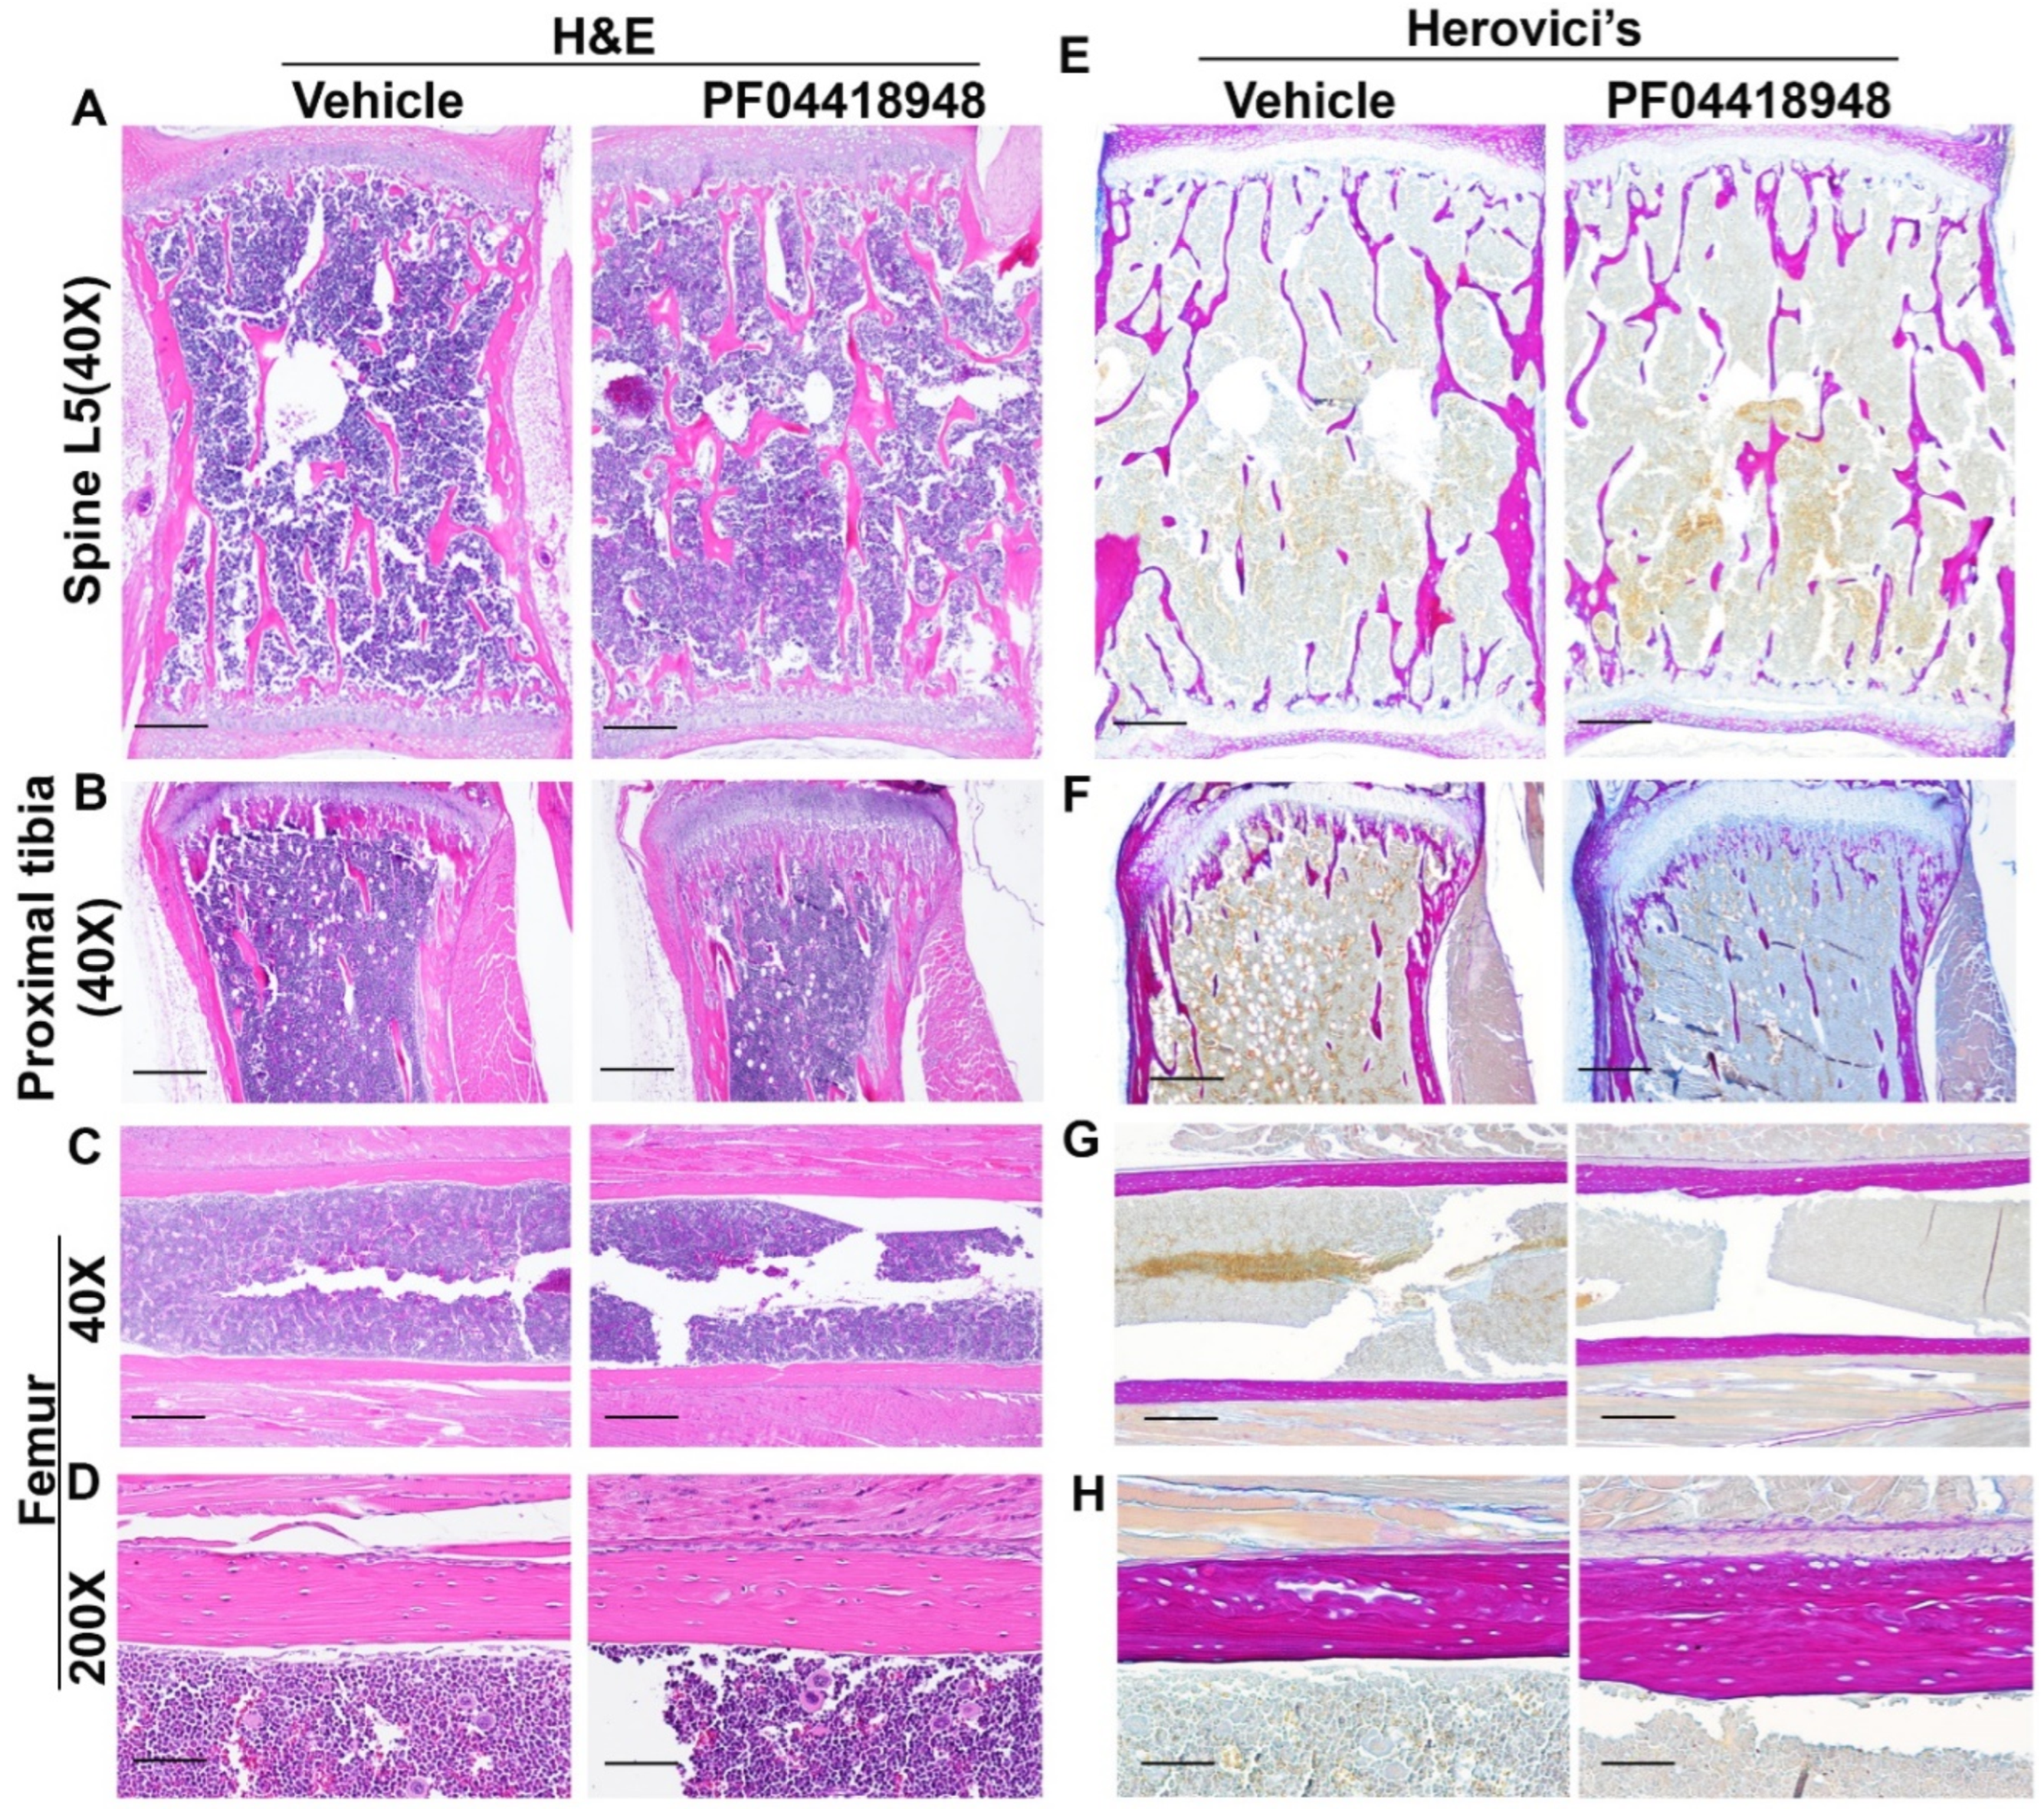
3.8. Effects of PF04418948 Treatment on General Bone Morphology and Bone Matrix Collagen Type 1 (COL1)
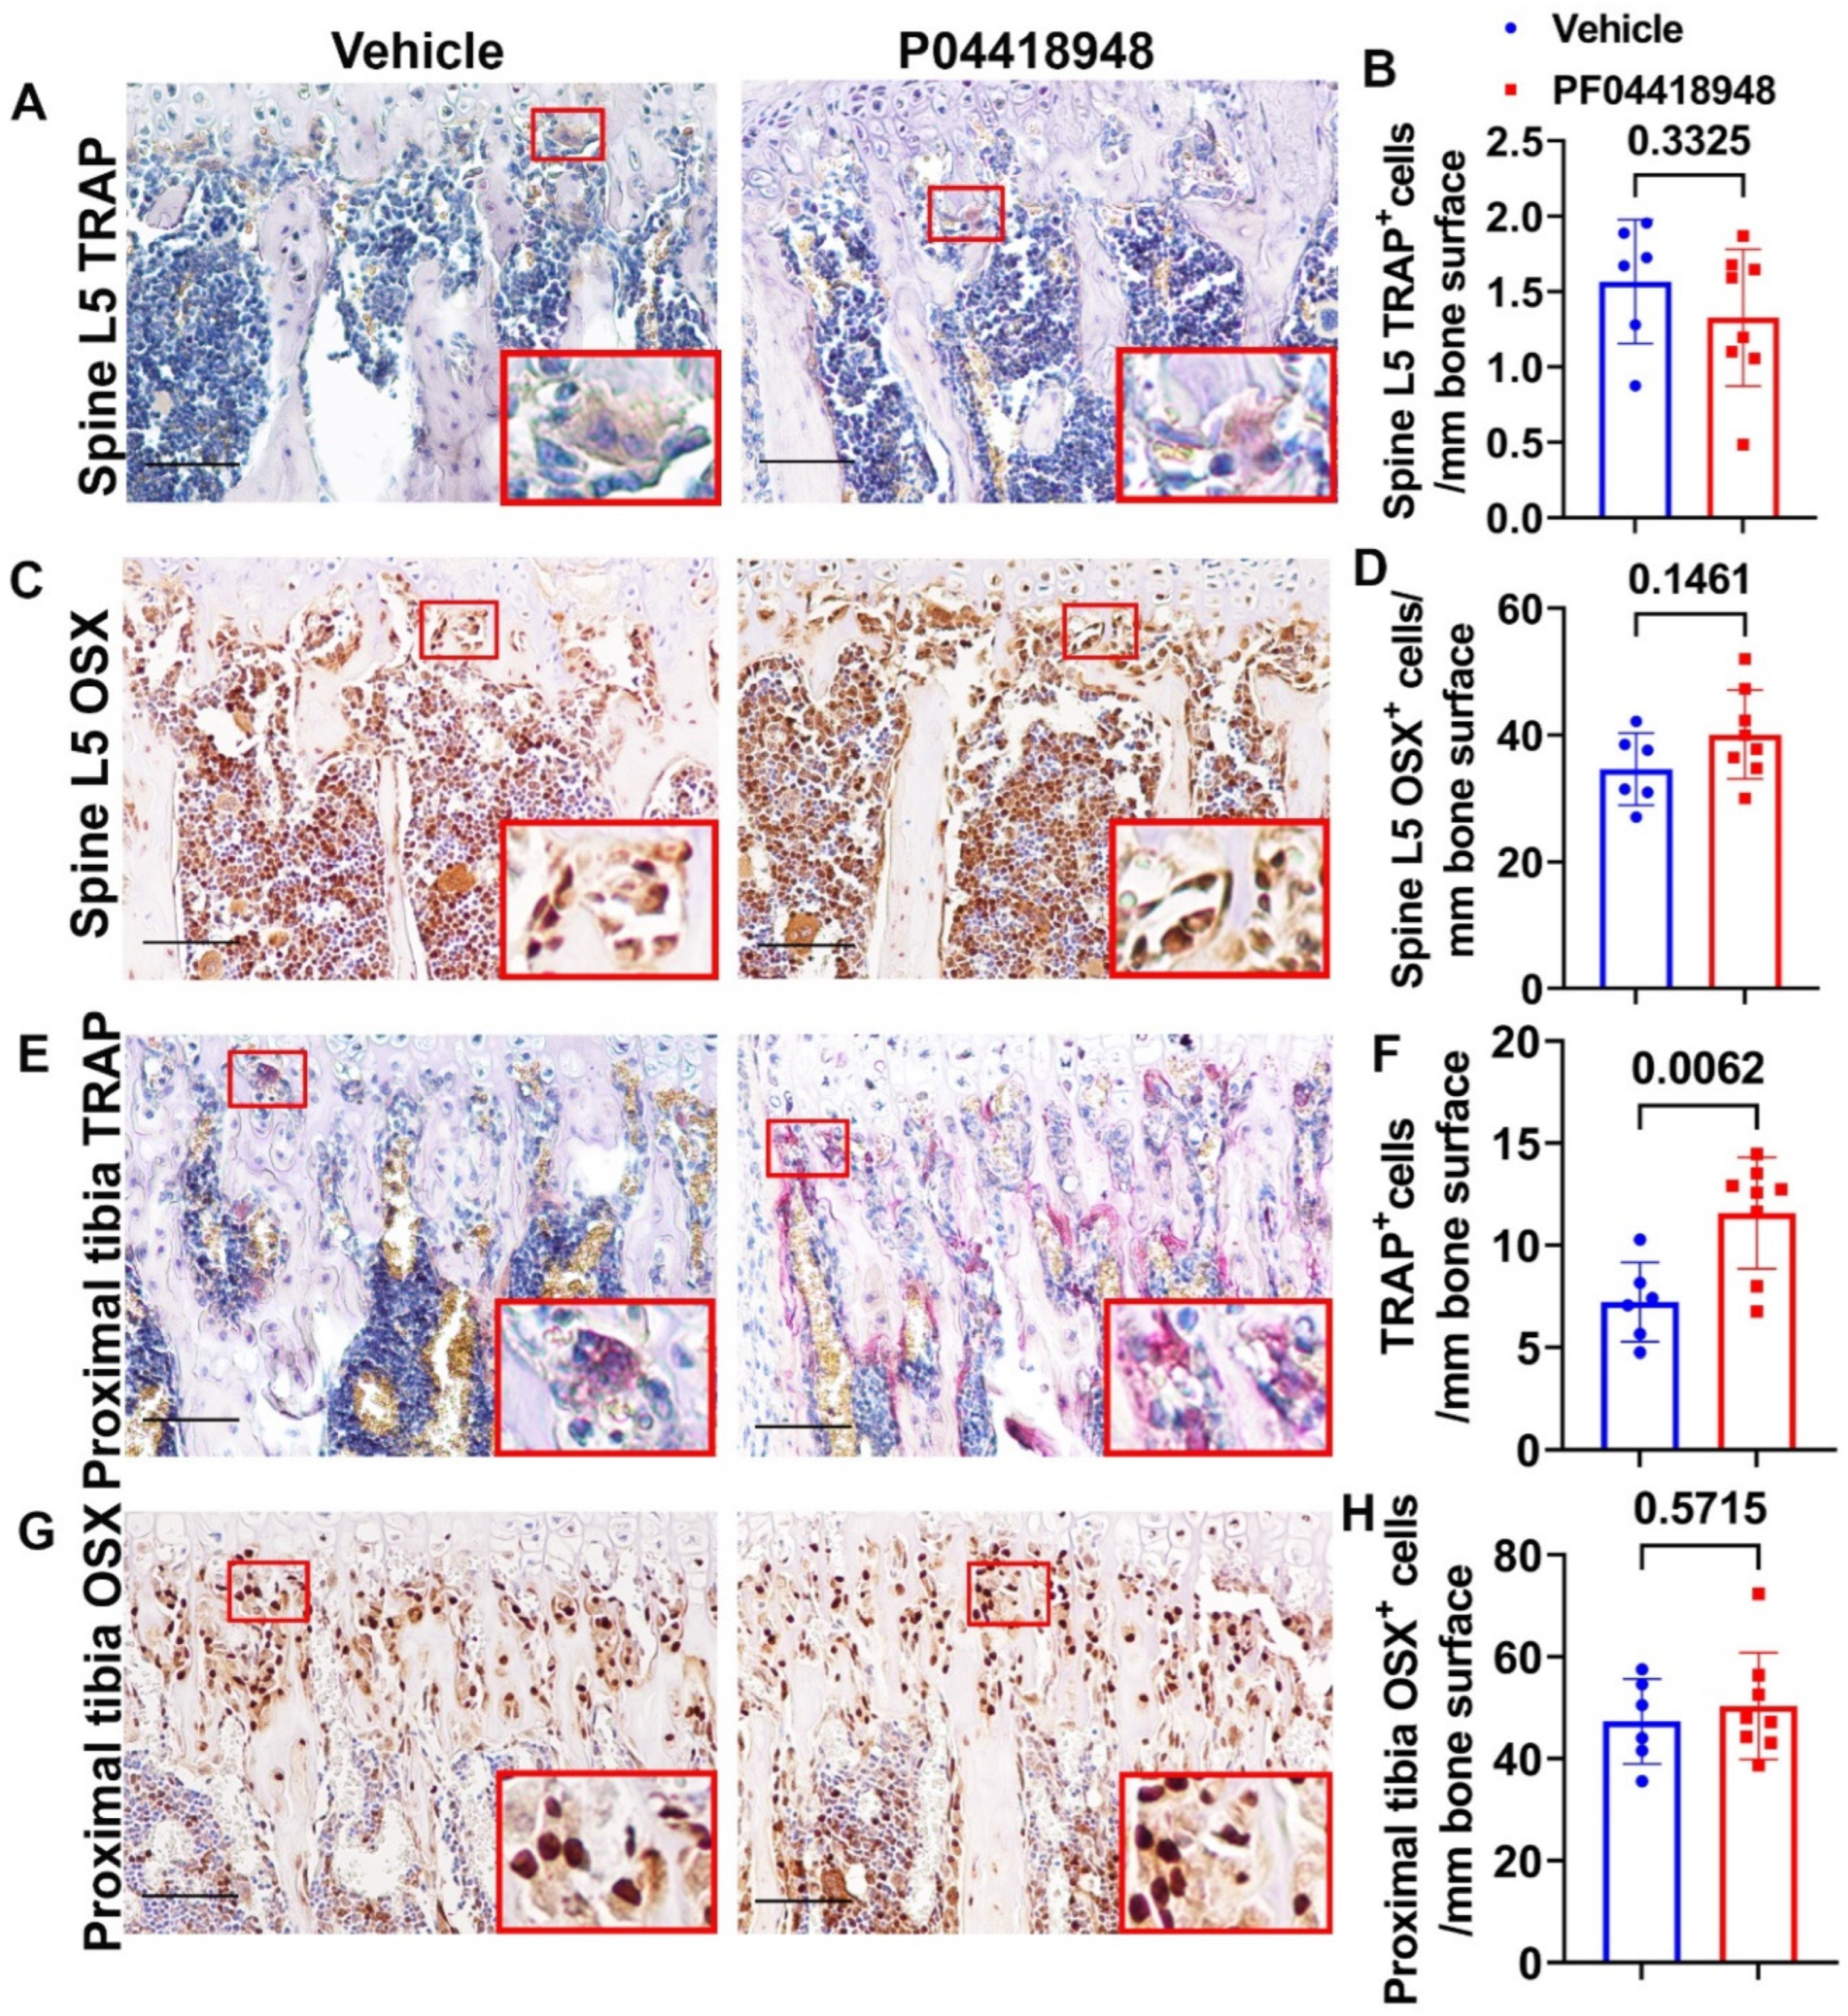
3.9. PF04418948 Treatment Increased Osteoclasts Without Changing Number of Osteoprogenitors in Trabecular Bone of Proximal Tibia
4. Discussion
5. Conclusion
Acknowledgement: We thank Nicole Ehrhart and Laura Chubb from Colorado State University for their help with animal protocol.
Author Contributions
Funding
Institutional Review Board Statement
Informed Consent Statement
Data Availability Statement
Conflicts of Interest
References
- Koenig, M.; Hoffman, E.; Bertelson, C.; Monaco, A.; Feener, C.; Kunkel, L. Complete cloning of the duchenne muscular dystrophy (DMD) cDNA and preliminary genomic organization of the DMD gene in normal and affected individuals. Cell 1987, 50, 509–517. [Google Scholar] [CrossRef] [PubMed]
- Hoffman, E.P.; Brown, R.H., Jr.; Kunkel, L.M. Dystrophin: The protein product of the duchenne muscular dystrophy locus. Cell 1987, 51, 919–928. [Google Scholar] [CrossRef] [PubMed]
- Grady, R.; Teng, H.; Nichol, M.C.; Cunningham, J.C.; Wilkinson, R.S.; Sanes, J.R. Skeletal and Cardiac Myopathies in Mice Lacking Utrophin and Dystrophin: A Model for Duchenne Muscular Dystrophy. Cell 1997, 90, 729–738. [Google Scholar] [CrossRef] [PubMed]
- Lu, A.; Poddar, M.; Tang, Y.; Proto, J. D.; Sohn, J.; Mu, X.; Oyster, N.; Wang, B.; Huard, J. , Rapid depletion of muscle progenitor cells in dystrophic mdx/utrophin-/- mice. Hum Mol Genet 2014, 23, (18), 4786–800. [Google Scholar] [CrossRef]
- Mu, X.; Tang, Y.; Lu, A.; Takayama, K.; Usas, A.; Wang, B.; Weiss, K.; Huard, J. The role of Notch signaling in muscle progenitor cell depletion and the rapid onset of histopathology in muscular dystrophy. Hum. Mol. Genet. 2015, 24, 2923–2937. [Google Scholar] [CrossRef]
- Sohn, J.; Lu, A.; Tang, Y.; Wang, B.; Huard, J. Activation of non-myogenic mesenchymal stem cells during the disease progression in dystrophic dystrophin/utrophin knockout mice. Hum. Mol. Genet. 2015, 24, 3814–3829. [Google Scholar] [CrossRef]
- Chen, S.; Zhang, C.; Liu, X.; Gao, L.; Zhang, W.; Huang, W.; Lu, X.; Wang, Z. [Study on the gene knockout model mice of Duchenne muscular dystrophy]. . 2003, 34, 210–3. [Google Scholar]
- Isaac, C.; Wright, A.; Usas, A.; Li, H.; Tang, Y.; Mu, X.; Greco, N.; Dong, Q.; Vo, N.; Kang, J.; et al. Dystrophin and utrophin “double knockout” dystrophic mice exhibit a spectrum of degenerative musculoskeletal abnormalities. J. Orthop. Res. 2012, 31, 343–349. [Google Scholar] [CrossRef]
- Gao, X.; Tang, Y.; Amra, S.; Sun, X.; Cui, Y.; Cheng, H.; Wang, B.; Huard, J. Systemic investigation of bone and muscle abnormalities in dystrophin/utrophin double knockout mice during postnatal development and the mechanisms. Hum. Mol. Genet. 2019, 28, 1738–1751. [Google Scholar] [CrossRef]
- Gao, X.; Sun, X.; Amra, S.; Cui, Y.; Deng, Z.; Cheng, H.; Zhang, G. W.; Huard, C. A.; Wang, B.; Huard, J. , Impaired bone defect and fracture healing in dystrophin/utrophin double-knockout mice and the mechanism. Am J Transl Res 2020, 12, (9), 5269–5282. [Google Scholar]
- Wakefield, P.M.; Tinsley, J.M.; A Wood, M.J.; Gilbert, R.; Karpati, G.; E Davies, K. Prevention of the dystrophic phenotype in dystrophin/utrophin-deficient muscle following adenovirus-mediated transfer of a utrophin minigene. Gene Ther. 2000, 7, 201–204. [Google Scholar] [CrossRef] [PubMed]
- Kawano, R.; Ishizaki, M.; Maeda, Y.; Uchida, Y.; Kimura, E.; Uchino, M. Transduction of Full-length Dystrophin to Multiple Skeletal Muscles Improves Motor Performance and Life Span in Utrophin/Dystrophin Double Knockout Mice. Mol. Ther. 2008, 16, 825–831. [Google Scholar] [CrossRef] [PubMed]
- Odom, G.L.; Gregorevic, P.; Allen, J.M.; Finn, E.; Chamberlain, J.S. Microutrophin Delivery Through rAAV6 Increases Lifespan and Improves Muscle Function in Dystrophic Dystrophin/Utrophin-deficient Mice. Mol. Ther. 2008, 16, 1539–1545. [Google Scholar] [CrossRef] [PubMed]
- Wang, B.; Li, J.; Fu, F.H.; Xiao, X. Systemic human minidystrophin gene transfer improves functions and life span of dystrophin and dystrophin/utrophin-deficient mice. J. Orthop. Res. 2009, 27, 421–426. [Google Scholar] [CrossRef]
- Xin, C.; Chu, X.; Wei, W.; Kuang, B.; Wang, Y.; Tang, Y.; Chen, J.; You, H.; Li, C.; Wang, B. Combined gene therapy via VEGF and mini-dystrophin synergistically improves pathologies in temporalis muscle of dystrophin/utrophin double knockout mice. Hum. Mol. Genet. 2021, 30, 1349–1359. [Google Scholar] [CrossRef] [PubMed]
- Goyenvalle, A.; Babbs, A.; Powell, D.; Kole, R.; Fletcher, S.; Wilton, S.D.; E Davies, K. Prevention of Dystrophic Pathology in Severely Affected Dystrophin/Utrophin-deficient Mice by Morpholino-oligomer-mediated Exon-skipping. Mol. Ther. 2010, 18, 198–205. [Google Scholar] [CrossRef]
- Goyenvalle, A.; Babbs, A.; Wright, J.; Wilkins, V.; Powell, D.; Garcia, L.; Davies, K. E. , Rescue of severely affected dystrophin/utrophin-deficient mice through scAAV-U7snRNA-mediated exon skipping. Hum Mol Genet 2012, 21, (11), 2559–71. [Google Scholar] [CrossRef]
- Delandistrogene moxeparvovec (Elevidys) for Duchenne muscular dystrophy. Med Lett Drugs Ther 2023, 65, (1686), 159–160.
- Long, C.; Amoasii, L.; Mireault, A.A.; McAnally, J.R.; Li, H.; Sanchez-Ortiz, E.; Bhattacharyya, S.; Shelton, J.M.; Bassel-Duby, R.; Olson, E.N. Postnatal genome editing partially restores dystrophin expression in a mouse model of muscular dystrophy. Science 2016, 351, 400–403. [Google Scholar] [CrossRef]
- Duchêne, B.L.; Cherif, K.; Iyombe-Engembe, J.-P.; Guyon, A.; Rousseau, J.; Ouellet, D.L.; Barbeau, X.; Lague, P.; Tremblay, J.P. CRISPR-Induced Deletion with SaCas9 Restores Dystrophin Expression in Dystrophic Models In Vitro and In Vivo. Mol. Ther. 2018, 26, 2604–2616. [Google Scholar] [CrossRef]
- Hanson, B.; Stenler, S.; Ahlskog, N.; Chwalenia, K.; Svrzikapa, N.; Coenen-Stass, A.M.; Weinberg, M.S.; Wood, M.J.; Roberts, T.C. Non-uniform dystrophin re-expression after CRISPR-mediated exon excision in the dystrophin/utrophin double-knockout mouse model of DMD. Mol. Ther. - Nucleic Acids 2022, 30, 379–397. [Google Scholar] [CrossRef] [PubMed]
- Ryu, S.-M.; Koo, T.; Kim, K.; Lim, K.; Baek, G.; Kim, S.-T.; Kim, H.S.; Kim, D.-E.; Lee, H.; Chung, E.; et al. Adenine base editing in mouse embryos and an adult mouse model of Duchenne muscular dystrophy. Nat. Biotechnol. 2018, 36, 536–539. [Google Scholar] [CrossRef]
- Chemello, F.; Chai, A.C.; Li, H.; Rodriguez-Caycedo, C.; Sanchez-Ortiz, E.; Atmanli, A.; Mireault, A.A.; Liu, N.; Bassel-Duby, R.; Olson, E.N. Precise correction of Duchenne muscular dystrophy exon deletion mutations by base and prime editing. Sci. Adv. 2021, 7, eabg4910. [Google Scholar] [CrossRef] [PubMed]
- Zhang, C.; Chen, S.-L.; Liu, X.-R.; Huang, W.; Zhang, W.-X.; Lu, X.-L. [Bone marrow stem cells transplantation improve locomotive function of dystrophin/utrophin gene double knock-out mice]. . 2003, 25, 160–3. [Google Scholar] [PubMed]
- Li, Z.; Liu, H.-Y.; Lei, Q.-F.; Zhang, C.; Li, S.-N. Improved motor function in dko mice by intravenous transplantation of bone marrow-derived mesenchymal stromal cells. Cytotherapy 2011, 13, 69–77. [Google Scholar] [CrossRef]
- Filareto, A.; Darabi, R.; Perlingeiro, R. C. , Engraftment of ES-Derived Myogenic Progenitors in a Severe Mouse Model of Muscular Dystrophy. J Stem Cell Res Ther 2012, 10, (1). [Google Scholar] [CrossRef] [PubMed]
- Pang, R.-Q.; He, J.; Zhang, Y.-Y.; Xiong, F.; Ruan, G.-P.; Zhu, X.-Q.; Wang, Q.; Wang, J.-X.; Zhu, G.-X.; Zhao, J.; et al. Systemic delivery of human bone marrow embryonic-like stem cells improves motor function of severely affected dystrophin/utrophin–deficient mice. Cytotherapy 2014, 16, 1739–1749. [Google Scholar] [CrossRef]
- Voit, A.; Patel, V.; Pachon, R.; Shah, V.; Bakhutma, M.; Kohlbrenner, E.; McArdle, J.J.; Dell’italia, L.J.; Mendell, J.R.; Xie, L.-H.; et al. Reducing sarcolipin expression mitigates Duchenne muscular dystrophy and associated cardiomyopathy in mice. Nat. Commun. 2017, 8, 1–14. [Google Scholar] [CrossRef]
- Wada, E.; Tanihata, J.; Iwamura, A.; Takeda, S.; Hayashi, Y. K.; Matsuda, R. , Treatment with the anti-IL-6 receptor antibody attenuates muscular dystrophy via promoting skeletal muscle regeneration in dystrophin-/utrophin-deficient mice. Skelet Muscle 2017, 7, (1), 23. [Google Scholar] [CrossRef]
- Mayo, A.; Craven, B.; McAdam, L.; Biggar, W. Bone health in boys with Duchenne Muscular Dystrophy on long-term daily deflazacort therapy. Neuromuscul. Disord. 2012, 22, 1040–1045. [Google Scholar] [CrossRef]
- Singh, A.; Schaeffer, E.K.; Reilly, C.W. Vertebral Fractures in Duchenne Muscular Dystrophy Patients Managed With Deflazacort. J. Pediatr. Orthop. 2018, 38, 320–324. [Google Scholar] [CrossRef] [PubMed]
- Joseph, S.; Wang, C.; Bushby, K.; Guglieri, M.; Horrocks, I.; Straub, V.; Ahmed, S. F.; Wong, S. C.; Network, U. K. N. C. , Fractures and Linear Growth in a Nationwide Cohort of Boys With Duchenne Muscular Dystrophy With and Without Glucocorticoid Treatment: Results From the UK NorthStar Database. JAMA Neurol 2019, 76, (6), 701–709. [Google Scholar] [CrossRef]
- Untergasser, A.; Cutcutache, I.; Koressaar, T.; Ye, J.; Faircloth, B. C.; Remm, M.; Rozen, S. G. , Primer3--new capabilities and interfaces. Nucleic Acids Res 2012, 40, (15), e115. [Google Scholar] [CrossRef]
- Koressaar, T.; Remm, M. Enhancements and modifications of primer design program Primer3. Bioinformatics 2007, 23, 1289–1291. [Google Scholar] [CrossRef] [PubMed]
- Kõressaar, T.; Lepamets, M.; Kaplinski, L.; Raime, K.; Andreson, R.; Remm, M. Primer3_masker: integrating masking of template sequence with primer design software. Bioinformatics 2018, 34, 1937–1938. [Google Scholar] [CrossRef] [PubMed]
- Gao, X.; Usas, A.; Proto, J. D.; Lu, A.; Cummins, J. H.; Proctor, A.; Chen, C. W.; Huard, J. , Role of donor and host cells in muscle-derived stem cell-mediated bone repair: differentiation vs. paracrine effects. FASEB J 2014, 28, (8), 3792–809. [Google Scholar] [CrossRef]
- af Forselles, K. J.; Root, J.; Clarke, T.; Davey, D.; Aughton, K.; Dack, K.; Pullen, N. , In vitro and in vivo characterization of PF-04418948, a novel, potent and selective prostaglandin EP(2) receptor antagonist. Br J Pharmacol 2011, 164, (7), 1847–56. [Google Scholar] [CrossRef]
- Turner, N.J.; Pezzone, M.A.; Brown, B.N.; Badylak, S.F. Quantitative multispectral imaging of Herovici's polychrome for the assessment of collagen content and tissue remodelling. J. Tissue Eng. Regen. Med. 2011, 7, 139–148. [Google Scholar] [CrossRef]
- Gao, X.; Usas, A.; Tang, Y.; Lu, A.; Tan, J.; Schneppendahl, J.; Kozemchak, A.M.; Wang, B.; Cummins, J.H.; Tuan, R.S.; et al. A comparison of bone regeneration with human mesenchymal stem cells and muscle-derived stem cells and the critical role of BMP. Biomaterials 2014, 35, 6859–6870. [Google Scholar] [CrossRef]
- Guglieri, M.; Bushby, K.; McDermott, M. P.; Hart, K. A.; Tawil, R.; Martens, W. B.; Herr, B. E.; McColl, E.; Speed, C.; Wilkinson, J.; Kirschner, J.; King, W. M.; Eagle, M.; Brown, M. W.; Willis, T.; Griggs, R. C.; Group, F.-D. I. o. t. M. S.; Straub, V.; van Ruiten, H.; Childs, A. M.; Ciafaloni, E.; Shieh, P. B.; Spinty, S.; Maggi, L.; Baranello, G.; Butterfield, R. J.; Horrocks, I. A.; Roper, H.; Alhaswani, Z.; Flanigan, K. M.; Kuntz, N. L.; Manzur, A.; Darras, B. T.; Kang, P. B.; Morrison, L.; Krzesniak-Swinarska, M.; Mah, J. K.; Mongini, T. E.; Ricci, F.; von der Hagen, M.; Finkel, R. S.; O’Reardon, K.; Wicklund, M.; Kumar, A.; McDonald, C. M.; Han, J. J.; Joyce, N.; Henricson, E. K.; Schara-Schmidt, U.; Gangfuss, A.; Wilichowski, E.; Barohn, R. J.; Statland, J. M.; Campbell, C.; Vita, G.; Vita, G. L.; Howard, J. F., Jr.; Hughes, I.; McMillan, H. J.; Pegoraro, E.; Bello, L.; Burnette, W. B.; Thangarajh, M.; Chang, T. , Effect of Different Corticosteroid Dosing Regimens on Clinical Outcomes in Boys With Duchenne Muscular Dystrophy: A Randomized Clinical Trial. JAMA 2022, 327, (15), 1456–1468. [Google Scholar] [CrossRef]
- Wong, B.L.; Cook, T.; Miller, H. Prednisone and deflazacort in Duchenne muscular dystrophy: a patient perspective and plain language summary publication of the Cincinnati study. J. Comp. Eff. Res. 2022, 11, 779–786. [Google Scholar] [CrossRef] [PubMed]
- McDonald, C.M.; Sajeev, G.; Yao, Z.; McDonnell, E.; Elfring, G.; Souza, M.; Peltz, S.W.; Darras, B.T.; Shieh, P.B.; Cox, D.A.; et al. Deflazacort vs prednisone treatment for Duchenne muscular dystrophy: A meta-analysis of disease progression rates in recent multicenter clinical trials. Muscle Nerve 2019, 61, 26–35. [Google Scholar] [CrossRef] [PubMed]
- Marden, J.R.; Freimark, J.; Yao, Z.; Signorovitch, J.; Tian, C.; Wong, B.L. Real-world outcomes of long-term prednisone and deflazacort use in patients with Duchenne muscular dystrophy: experience at a single, large care center. J. Comp. Eff. Res. 2020, 9, 177–189. [Google Scholar] [CrossRef]
- Phung, K.; McAdam, L.; Ma, J.; McMillan, H.J.; Jackowski, S.; Scharke, M.; Matzinger, M.-A.; Shenouda, N.; Koujok, K.; Jaremko, J.L.; et al. Risk factors associated with prevalent vertebral fractures in Duchenne muscular dystrophy. Osteoporos. Int. 2022, 34, 147–160. [Google Scholar] [CrossRef]
- Liaw, J.; Billich, N.; Carroll, K.; Adams, J.; Ryan, M.M.; Yiu, E.M.; Zacharin, M.; Simm, P.; Davidson, Z.E. Fracture risk and impact in boys with Duchenne muscular dystrophy: A retrospective cohort study. Muscle Nerve 2023, 67, 489–496. [Google Scholar] [CrossRef]
- McArdle, A.; Edwards, R.H.T.; Jackson, M.J. Effects of contractile activity on muscle damage in the dystrophin-deficient mdx mouse. Clin. Sci. 1991, 80, 367–371. [Google Scholar] [CrossRef]
- Jackson, M.J.; Brooke, M.H.; Kaiser, K.; Edwards, R. Creatine kinase and prostaglandin E, release from isolated Duchenne muscle. Neurology 1991, 41, 101–101. [Google Scholar] [CrossRef] [PubMed]
- Beaulieu, D.; Thebault, P.; Pelletier, R.; Chapdelaine, P.; Tarnopolsky, M.; Furling, D.; Puymirat, J. Abnormal prostaglandin E2 production blocks myogenic differentiation in myotonic dystrophy. Neurobiol. Dis. 2012, 45, 122–129. [Google Scholar] [CrossRef]
- Sakai-Takemura, F.; Nogami, K.; Elhussieny, A.; Kawabata, K.; Maruyama, Y.; Hashimoto, N.; Takeda, S.; Miyagoe-Suzuki, Y. Prostaglandin EP2 receptor downstream of Notch signaling inhibits differentiation of human skeletal muscle progenitors in differentiation conditions. Commun. Biol. 2020, 3, 1–13. [Google Scholar] [CrossRef]
- Gao, X.; Usas, A.; Lu, A.; Kozemchak, A.; Tang, Y.; Poddar, M.; Sun, X.; Cummins, J.H.; Huard, J. Cyclooxygenase-2 deficiency impairs muscle-derived stem cell-mediated bone regeneration via cellular autonomous and non-autonomous mechanisms. Hum. Mol. Genet. 2016, 25, 3216–3231. [Google Scholar] [CrossRef]
- Mu, X.; Lin, C.-Y.; Hambright, W.S.; Tang, Y.; Ravuri, S.; Lu, A.; Matre, P.; Chen, W.; Gao, X.; Cui, Y.; et al. Aberrant RhoA activation in macrophages increases senescence-associated secretory phenotypes and ectopic calcification in muscular dystrophic mice. Aging 2020, 12, 24853–24871. [Google Scholar] [CrossRef] [PubMed]
- Olguin, H.C.; Olwin, B.B. Pax-7 up-regulation inhibits myogenesis and cell cycle progression in satellite cells: a potential mechanism for self-renewal. Dev. Biol. 2004, 275, 375–388. [Google Scholar] [CrossRef] [PubMed]
- van der Wal, E.; Herrero-Hernandez, P.; Wan, R.; Broeders, M.; In ‘t Groen, S. L. M.; van Gestel, T. J. M.; van, I. W. F. J.; Cheung, T. H.; van der Ploeg, A. T.; Schaaf, G. J.; Pijnappel, W. , Large-Scale Expansion of Human iPSC-Derived Skeletal Muscle Cells for Disease Modeling and Cell-Based Therapeutic Strategies. Stem Cell Reports 2018, 10, (6), 1975–1990. [Google Scholar] [CrossRef]
- Mu, X.; Tang, Y.; Takayama, K.; Chen, W.; Lu, A.; Wang, B.; Weiss, K.; Huard, J. RhoA/ROCK inhibition improves the beneficial effects of glucocorticoid treatment in dystrophic muscle: implications for stem cell depletion. Hum. Mol. Genet. 2017, 26, 2813–2824. [Google Scholar] [CrossRef] [PubMed]
- Weivoda, M.M.; Bradley, E.W. Macrophages and Bone Remodeling. J. Bone Miner. Res. 2023, 38, 359–369. [Google Scholar] [CrossRef]
- Batoon, L.; Millard, S.M.; Wullschleger, M.E.; Preda, C.; Wu, A.C.-K.; Kaur, S.; Tseng, H.-W.; Hume, D.A.; Levesque, J.-P.; Raggatt, L.J.; et al. CD169+ macrophages are critical for osteoblast maintenance and promote intramembranous and endochondral ossification during bone repair. Biomaterials 2019, 196, 51–66. [Google Scholar] [CrossRef]
- Xie, C.; Liang, B.; Xue, M.; Lin, A. S.; Loiselle, A.; Schwarz, E. M.; Guldberg, R. E.; O’Keefe, R. J.; Zhang, X. , Rescue of impaired fracture healing in COX-2-/- mice via activation of prostaglandin E2 receptor subtype 4. Am J Pathol 2009, 175, (2), 772–85. [Google Scholar] [CrossRef]

| Gene name | Forward primers (5′-3′) | Reverse primers (5′-3′) | Product size(bp) |
|---|---|---|---|
| Ep2 | ATGCTCCTGCTGCTTATCGT | AGGGCCTCTTAGGCTACTGC | 126 |
| Ep4 | TGGCTGTCACTGACCTTCTG | TGCATAGATGGCGAAGAGTG | 254 |
| Cox-1 | GTGGCTATTTCCTGCAGCTC | CAGTGCCTCAACCCCATAGT | 209 |
| Cox-2 | GGGCCCTTCCTCCCGTAGCA | CCATGGCCCAGTCCTCGGGT | 232 |
| 15-Pgdh | AGGTAGCATTGGTGGATTGG | CCACATCACACTGGACGAAC | 105 |
| CD68 | TTCTGCTGTGGAAATGCAAG | AGAGGGGCTGGTAGGTTGAT | 241 |
| Fst | TGACAATGCCACATACGCCA | CCTCCTCCTCCTCTTCCTCC | 131 |
| Mstn | TCAGACCCGTCAAGACTCCT | GGTCCTGGGAAGGTTACAGC | 253 |
| Il1β | ACTCATTGTGGCTGTGGAGA | TTGTTCATCTCGGAGCCTGT | 199 |
| Il-6 | CCGGAGAGGAGACTTCACAG | CAGAATTGCCATTGCACAAC | 134 |
| Runx2 | CCCAGCCACCTTTACCTACA | TATGGAGTGCTGCTGGTCTG | 150 |
| Osx | ACTCATCCCTATGGCTCGTG | GGTAGGGAGCTGGGTTAAGG | 238 |
| Ctsk | CCAGTGGGAGCTATGGAAGA | TGGTTCATGGCCAGTTCATA | 159 |
| Trap | CAGCAGCCAAGGAGGACTAC | ACATAGCCCACACCGTTCTC | 190 |
| Gapdh | CCGGGGCTGGCATTGCTCTC | GTGTTGGGGGCCGAGTTGGG | 190 |
| Pax7 | GACTCCGGATGTGGAGAAAA | GAGCACTCGGCTAATCGAAC | 145 |
| Fndc5 | CACGCGAGGCTGAAAAGATG | ACACCTGCCCACATGAAGAG | 130 |
Disclaimer/Publisher’s Note: The statements, opinions and data contained in all publications are solely those of the individual author(s) and contributor(s) and not of MDPI and/or the editor(s). MDPI and/or the editor(s) disclaim responsibility for any injury to people or property resulting from any ideas, methods, instructions or products referred to in the content. |
© 2024 by the authors. Licensee MDPI, Basel, Switzerland. This article is an open access article distributed under the terms and conditions of the Creative Commons Attribution (CC BY) license (http://creativecommons.org/licenses/by/4.0/).


