1. Introduction
Water level monitoring is an important procedure either to maintain the product quality in certain industry systems [
1]; or to achieve high quality of rice production in paddy cultivation [
2]; to prevent flood disaster for the cities located on rivers bank [
3,
4,
5]; or to control water distribution network in communities [
6,
7,
8], as the purpose instances. The conventional method used in the monitoring process is usually ineffective and costly due to the manual data collection which requires user to run the measurement at the correct location at the right time. Therefore, the water depth monitoring must be conducted via telemetry design to reduce the manual measurement drawback [
9]. Telemetry can provide a real time data monitored from any place hence capable of providing an alert signal whenever the water level above or below certain threshold.
Mohindru in [
10] had classified the sensor used in water level measurement research i.e. hydrostatic pressure, radar level, optical fiber and laser-based gauges; or capacitive and ultrasonic sensor (US). Apparently, US is the most widely utilized due to its high accuracy output. Usually, the sensor is controlled by a microprocessor to collect the data before restore them in a digital memory. In 2018, [
11] developed an early warning system for flood risk using US and Arduino connected to GSM module to warn the citizen in Philippines via short message service (SMS). Diriyana et. al. combined US with NodeMCU-Esp8266 to establish an early flood warning scheme using Telegram application in 2019 [
12]. Pereira group had installed 5 sensors of ultrasonic in a chamber to monitor water level inside the flowing channels to prove the accuracy of the sensor even in turbulence water stream. Yet, this work was done without any data transmission [
13].
This paper proposed a telemetry system for water depth monitoring of Sriwijaya University’s lake, South Sumatera, Indonesia. This is necessary to prevent flooding in the raining season or wildfire in the summer. These disasters are common cases happen in South Sumatera which has 1,262,000 Ha of peatland area [
14]. The region is vulnerable to flooding or wildfire every year [
15]. It can be avoided by monitoring the water depth of the area (peatland, lake and other inland water) and alarming the officer in charge whenever water level over its maximum threshold to avoid flood or below its minimum limit to prevent wildfire.
This work had developed a low-cost monitoring system for water depth using Arduino R3 and ultrasonic sensor (US) with bidirectional communication via radio frequency connecting user and data. The data was displayed on a website via the uplink while user instructed the measurement using a command on the website as well via the downlink communication. This means user can collect data anytime from any location. Moreno et.al. had reported a device for river water level monitoring based on microcontroller and US where the data sent to website every 5 minutes via one directional mobile communication [
16]. In our opinion, it is more effective and energy saving by conducting the measurement at a significant time -such as during the heavy rain or one hot afternoon, instead of within a range of automatic setting time. By collecting the crucial data only, it will save the digital memory used for data storage. Hence, the bidirectional communication should take place to achieve an effective, efficient and a green monitoring system.
2. Materials and Methods
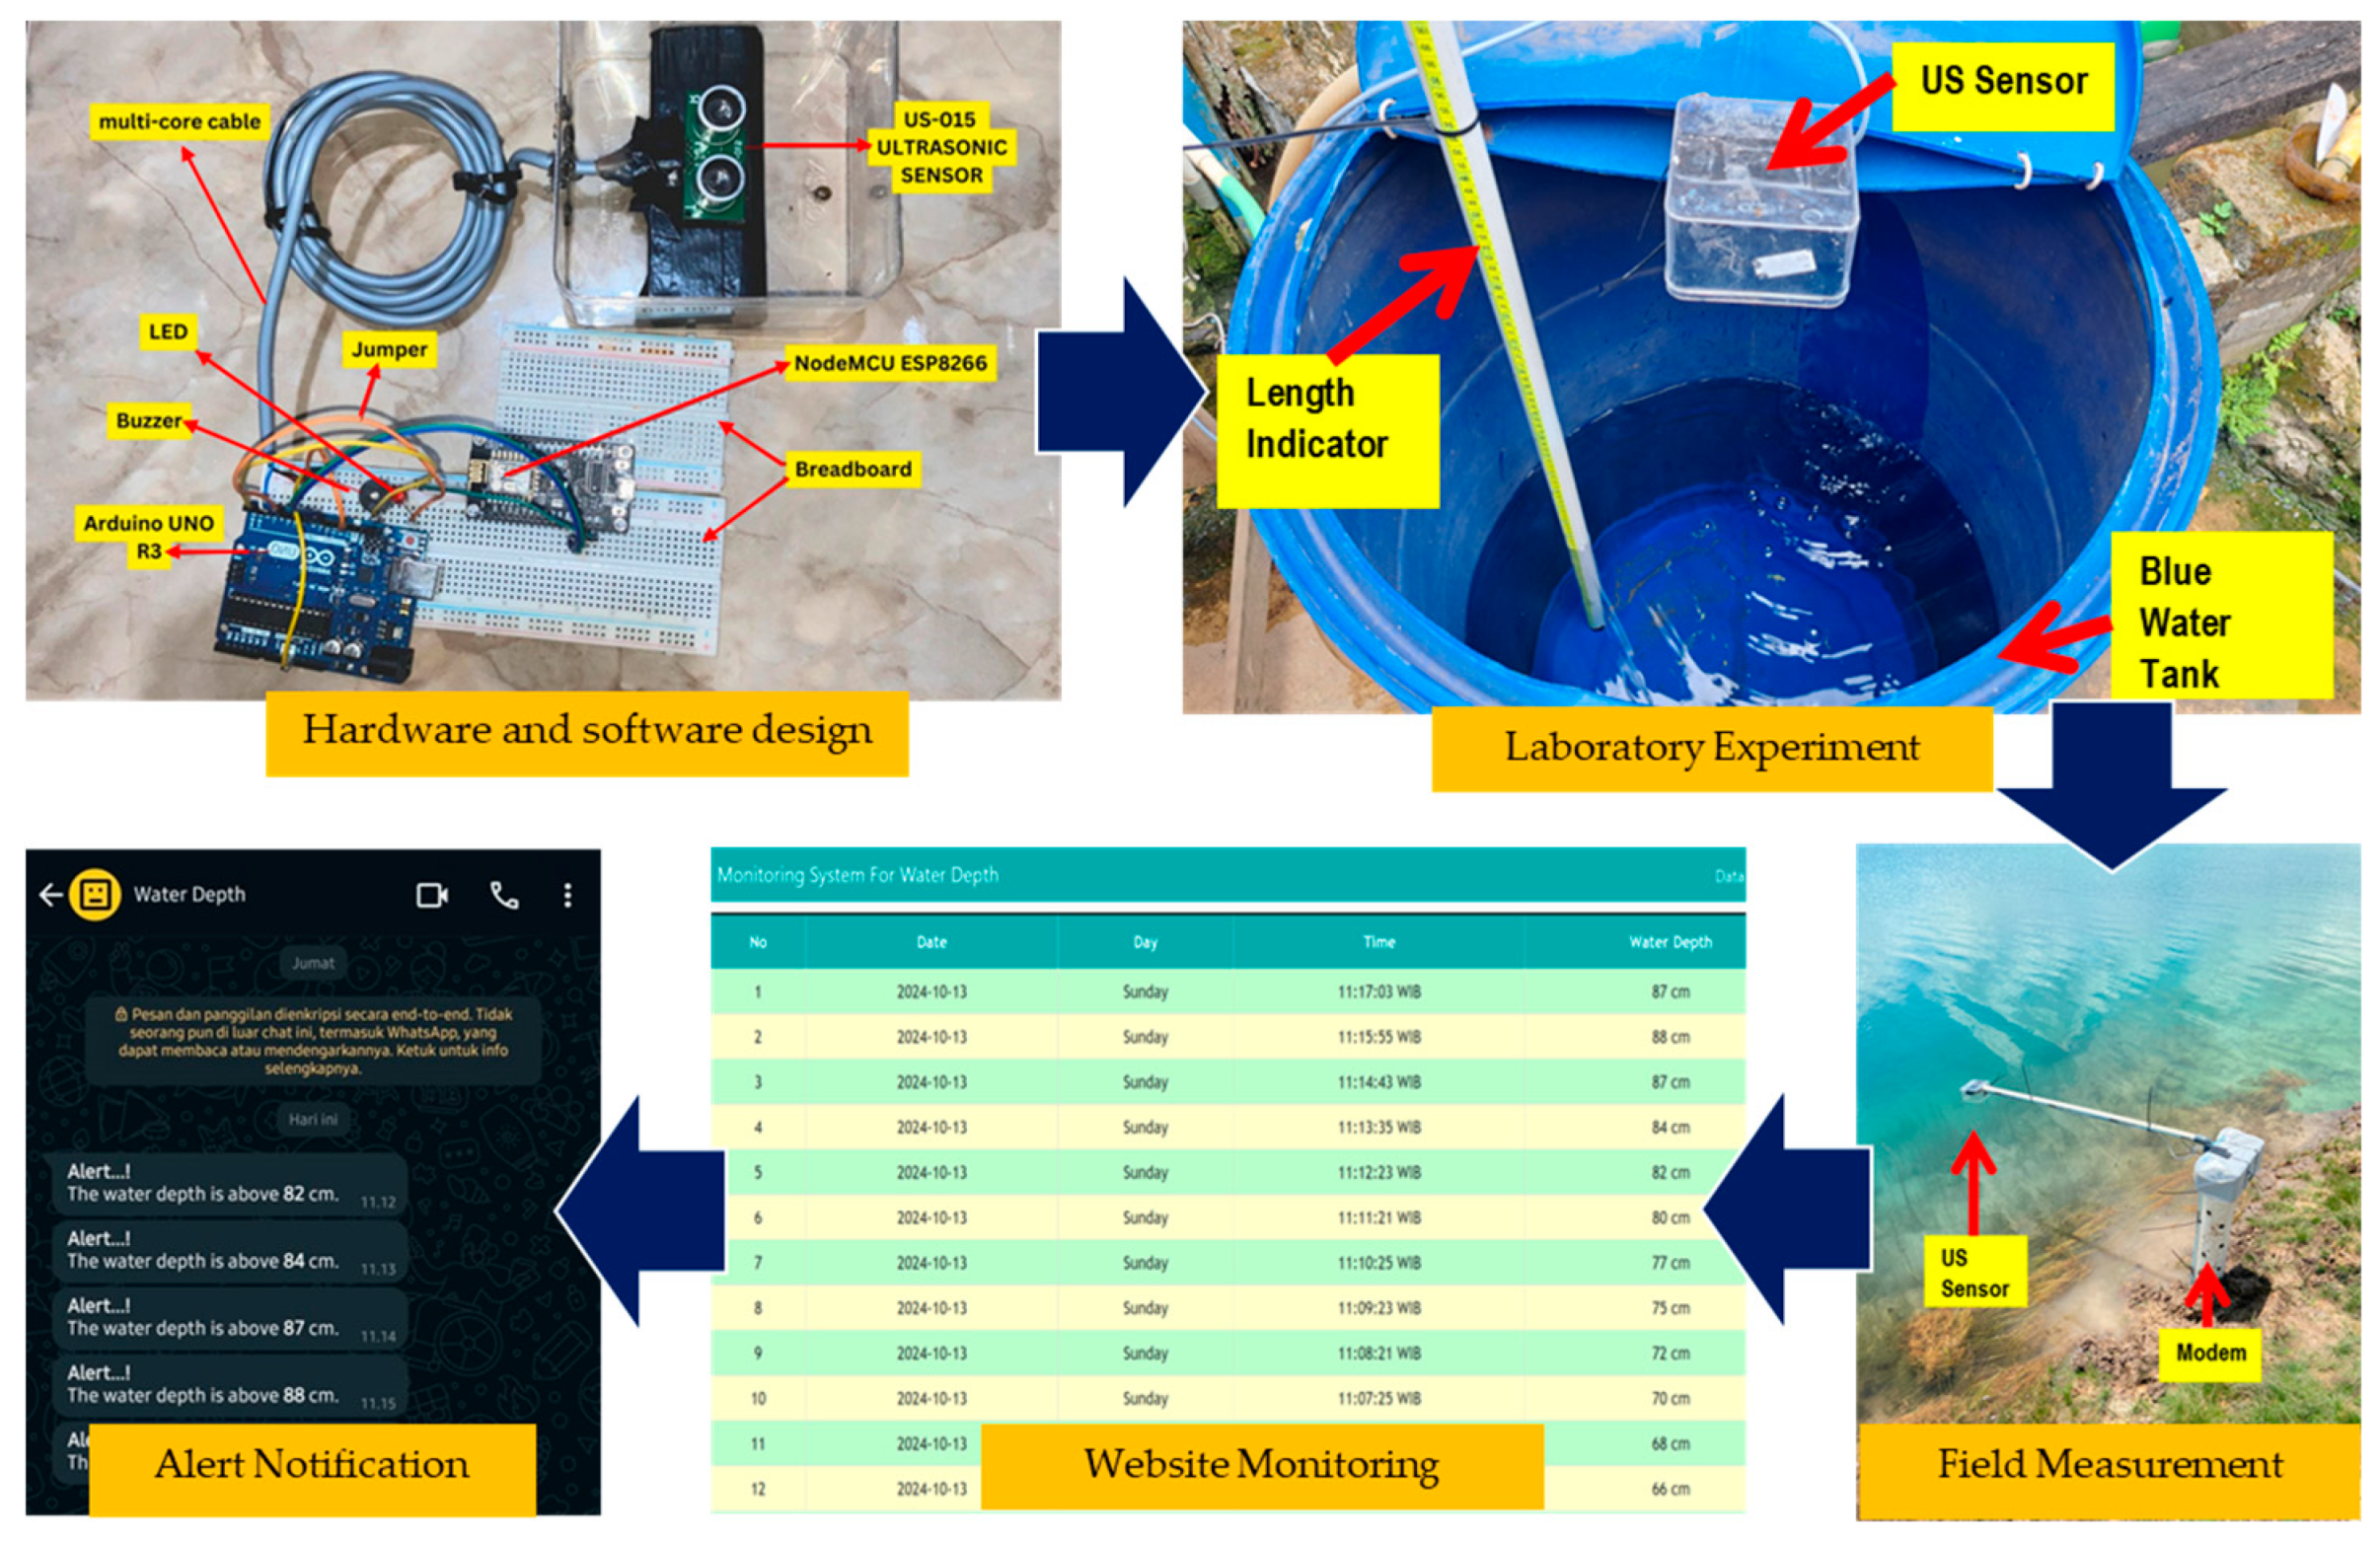
Research flow of this project consisted of 5 stages as shown by
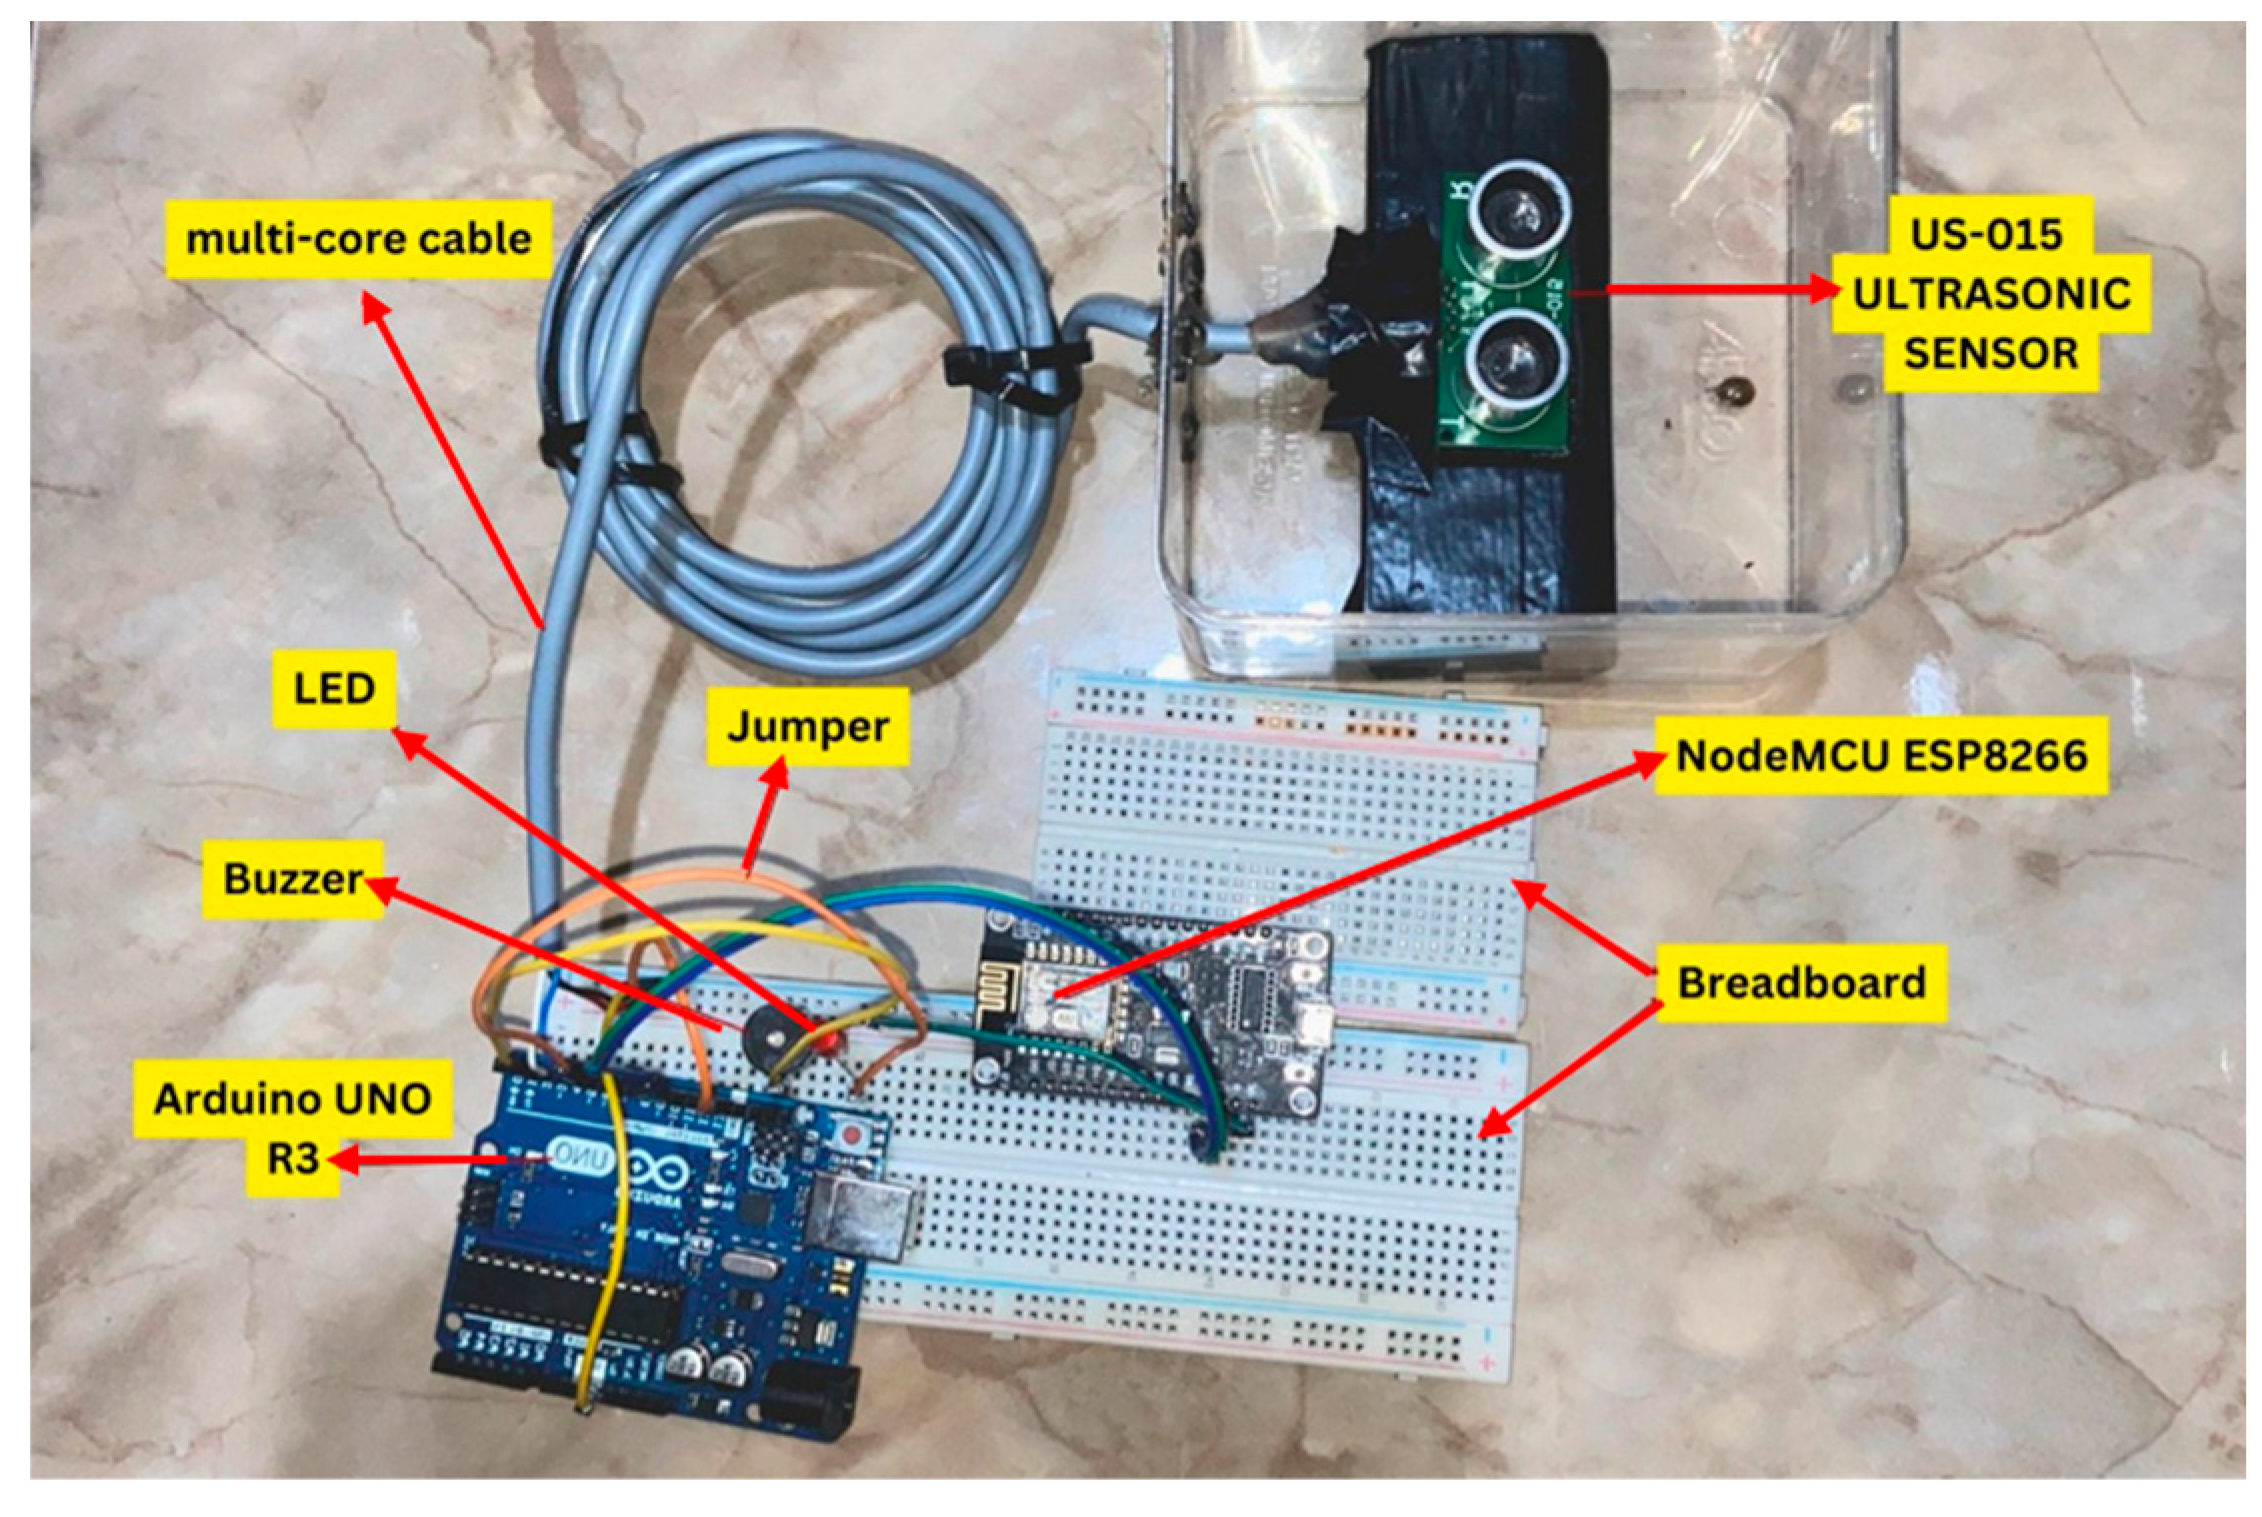
Figure 1. They are: 1) the hardware and software designs; 2) laboratory experiment; 3) real time measurement in the field, in this case, the campus lake of Sriwijaya University; 4) website monitoring and 5) alert notification system. On stage 1, the hardware circuit of the modem was built by connecting Arduino board with ultrasonic sensor (US) at digital pin no. 3 and 4 while Node MCU ESP8266 at pin Tx and Rx (
Figure 2). Buzzer was installed at pin no. 2 to generate an alarm sound whenever the water level above or below certain value. The code embedded inside Arduino and Node MCU were listed using Arduino IDE 2.3.3 software. Arduino read and controlled the data input while Node MCU arranged the communication procedures between Arduino and user. The generated alarm signal was also transmitted simultaneously to user's smart phone through the
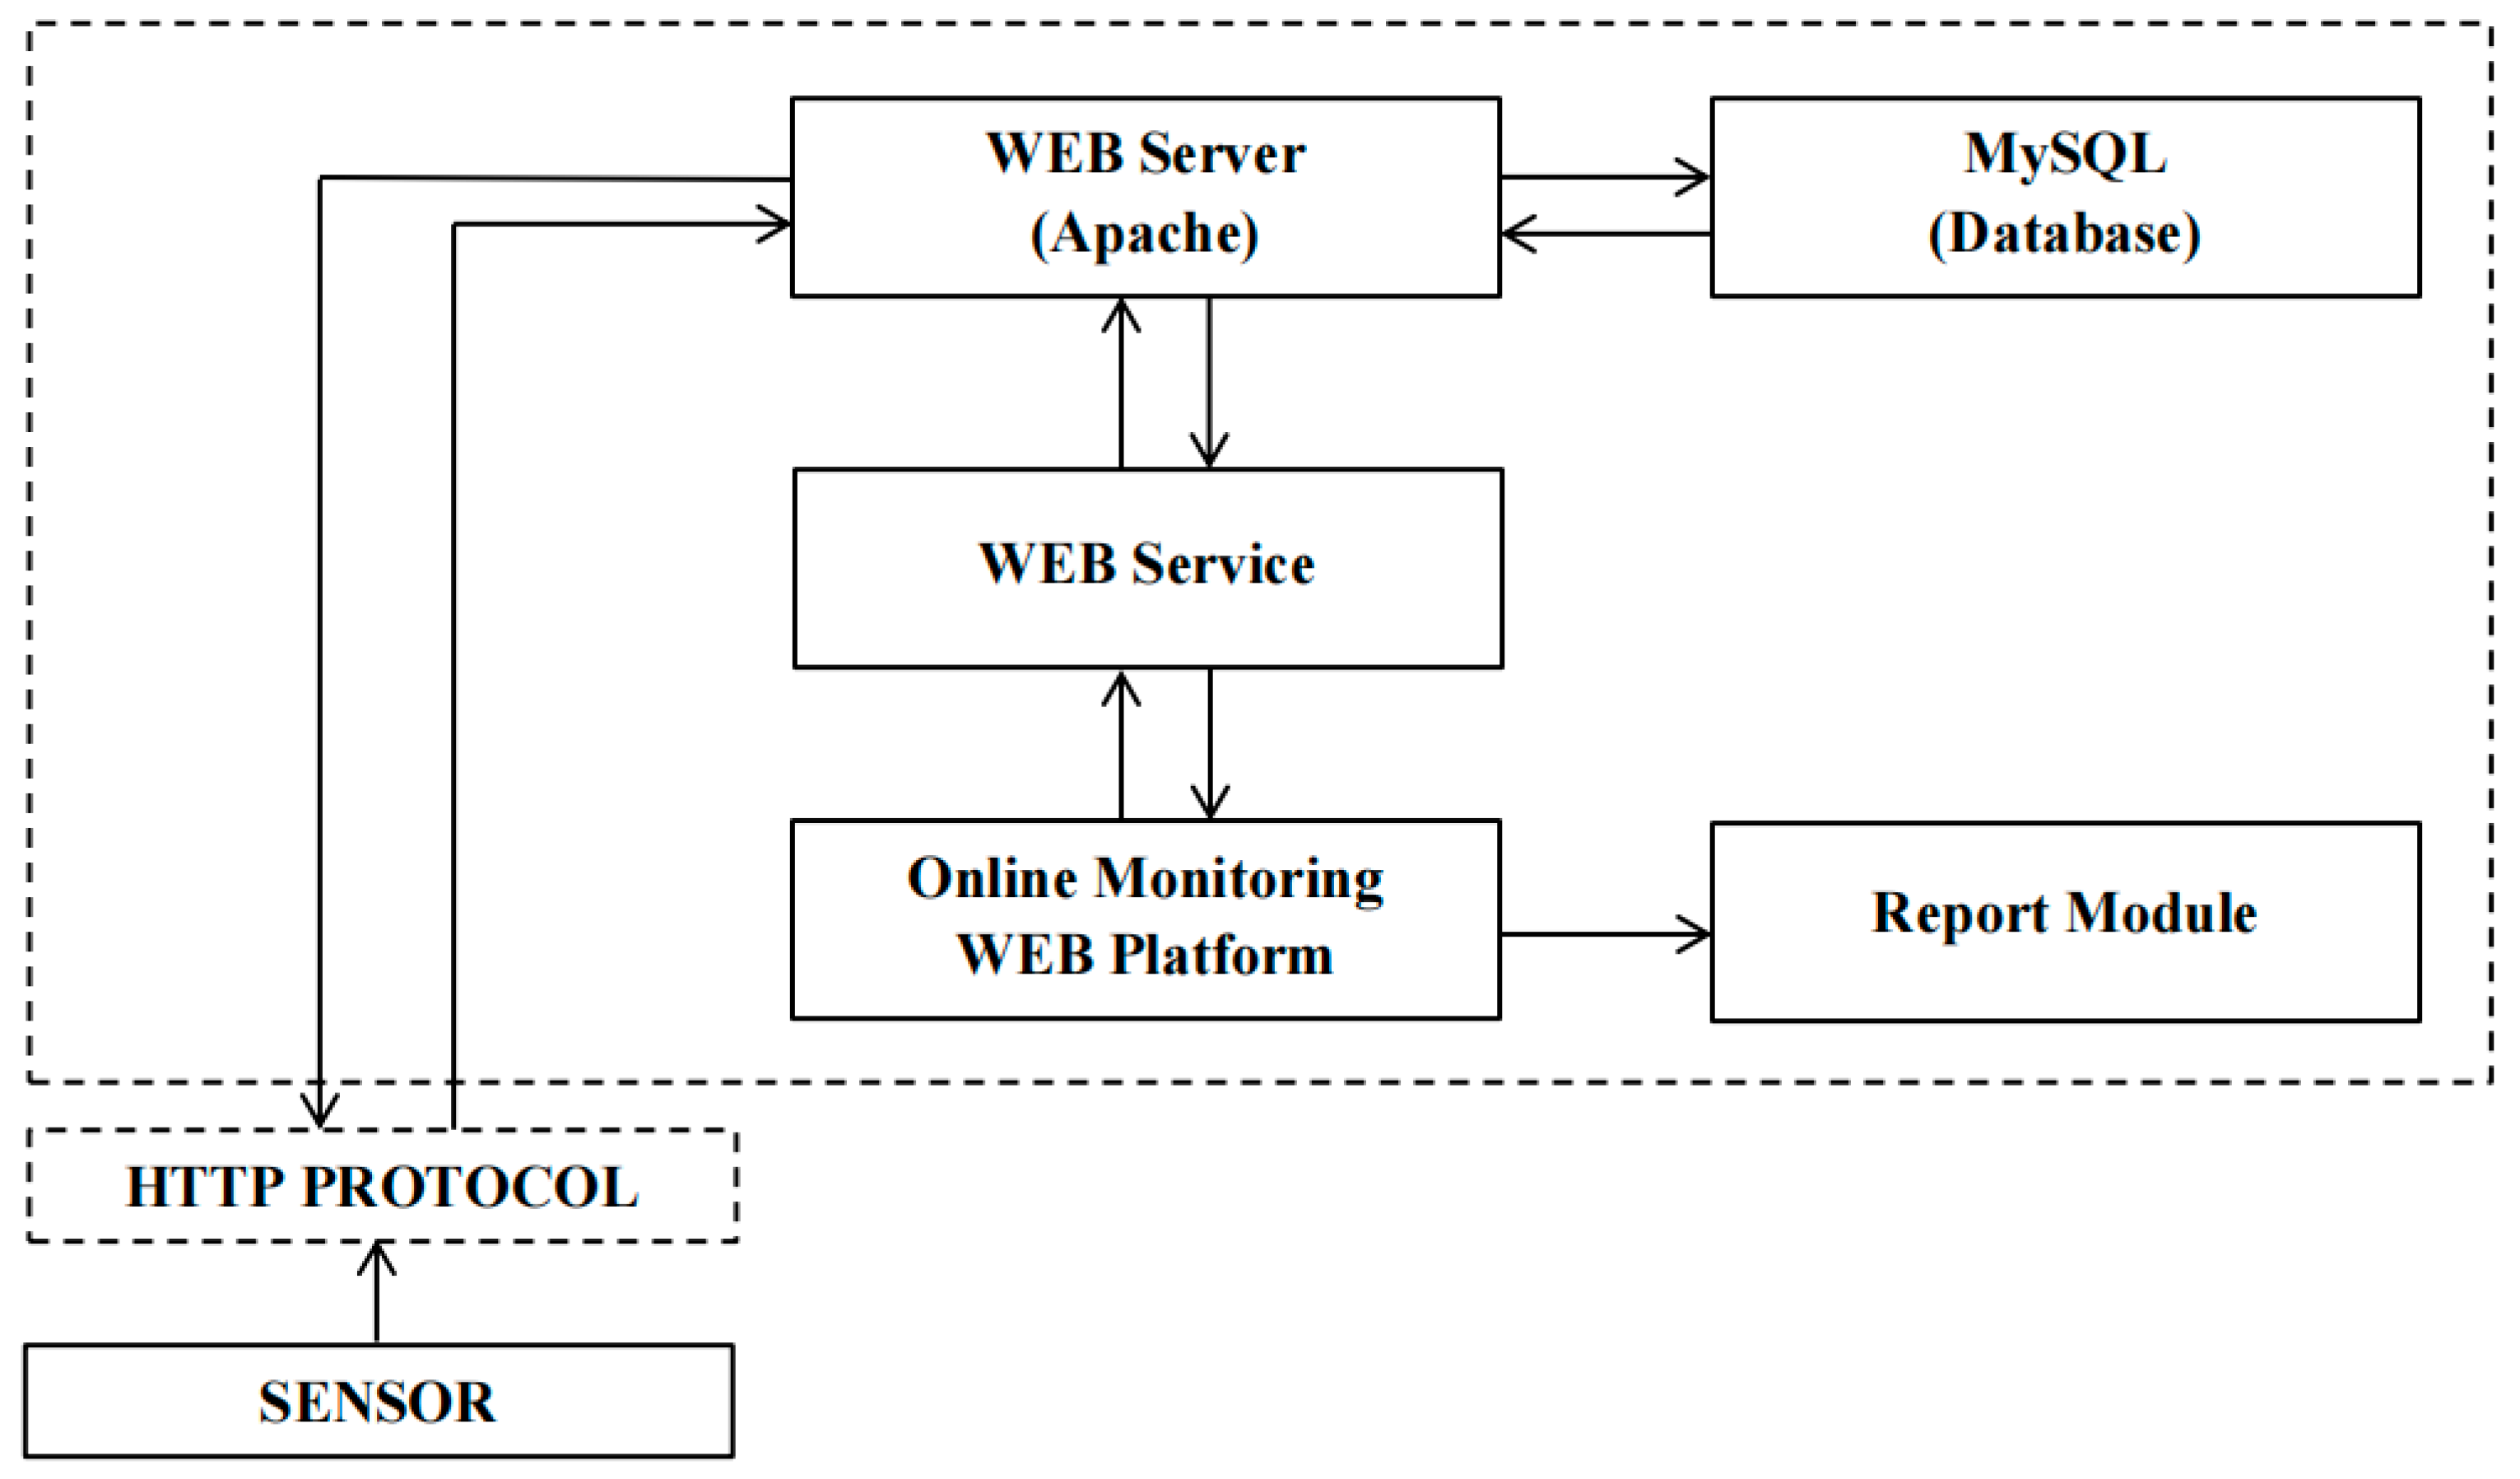
Whatsapp application. Therefore, the data acquisition must be done following the architecture shown by
Figure 3. The website was retrieving sensor data using
http protocol embedded in Node MCU for the uplink communication while at the downlink it was delivering the instruction from a user -who push the start button on the website- to Arduino where the sensor was attached.
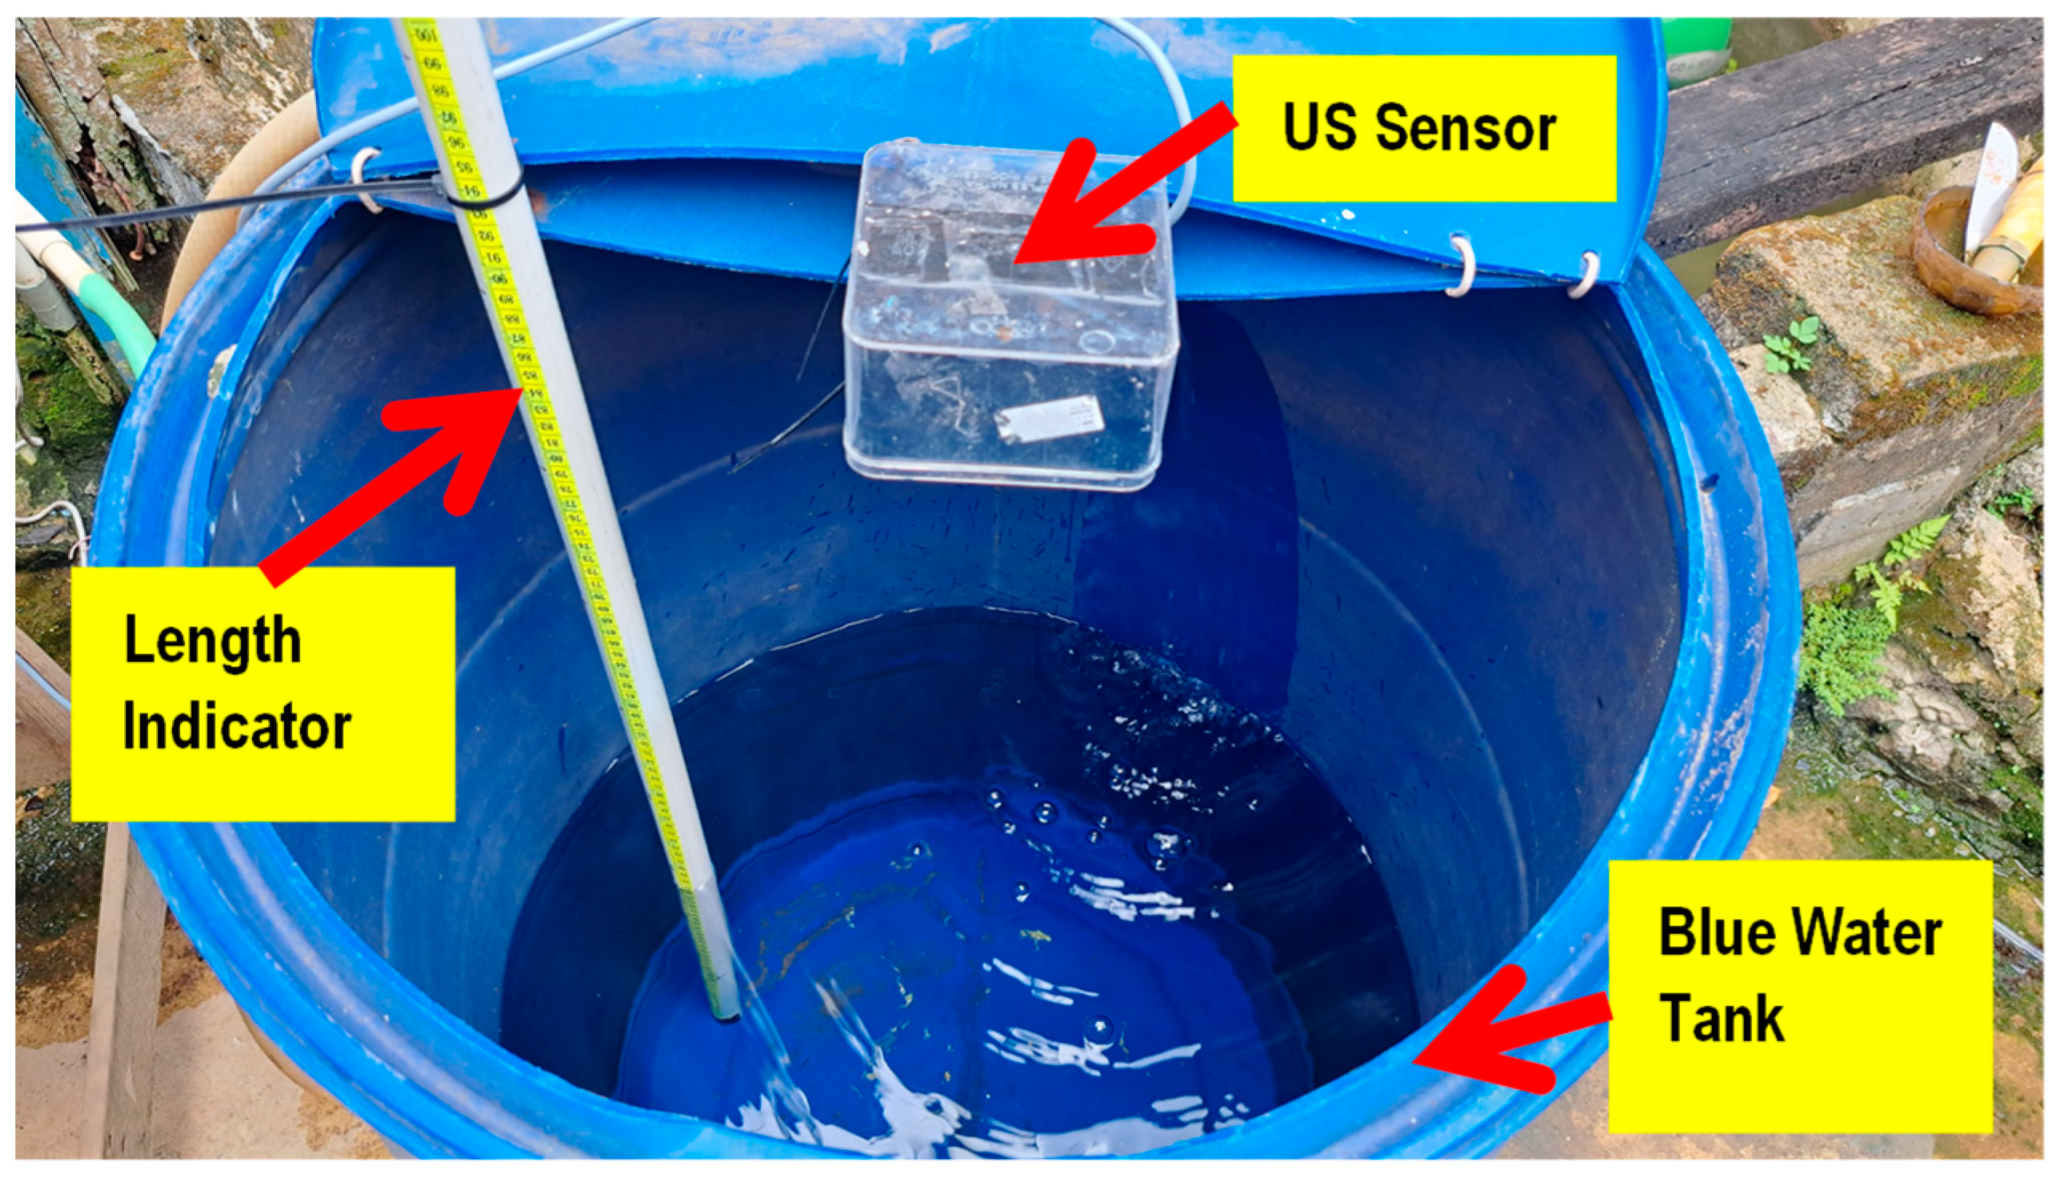
Stage 2 was conducted in the laboratory after the hardware and software designs finished. As can be seen on
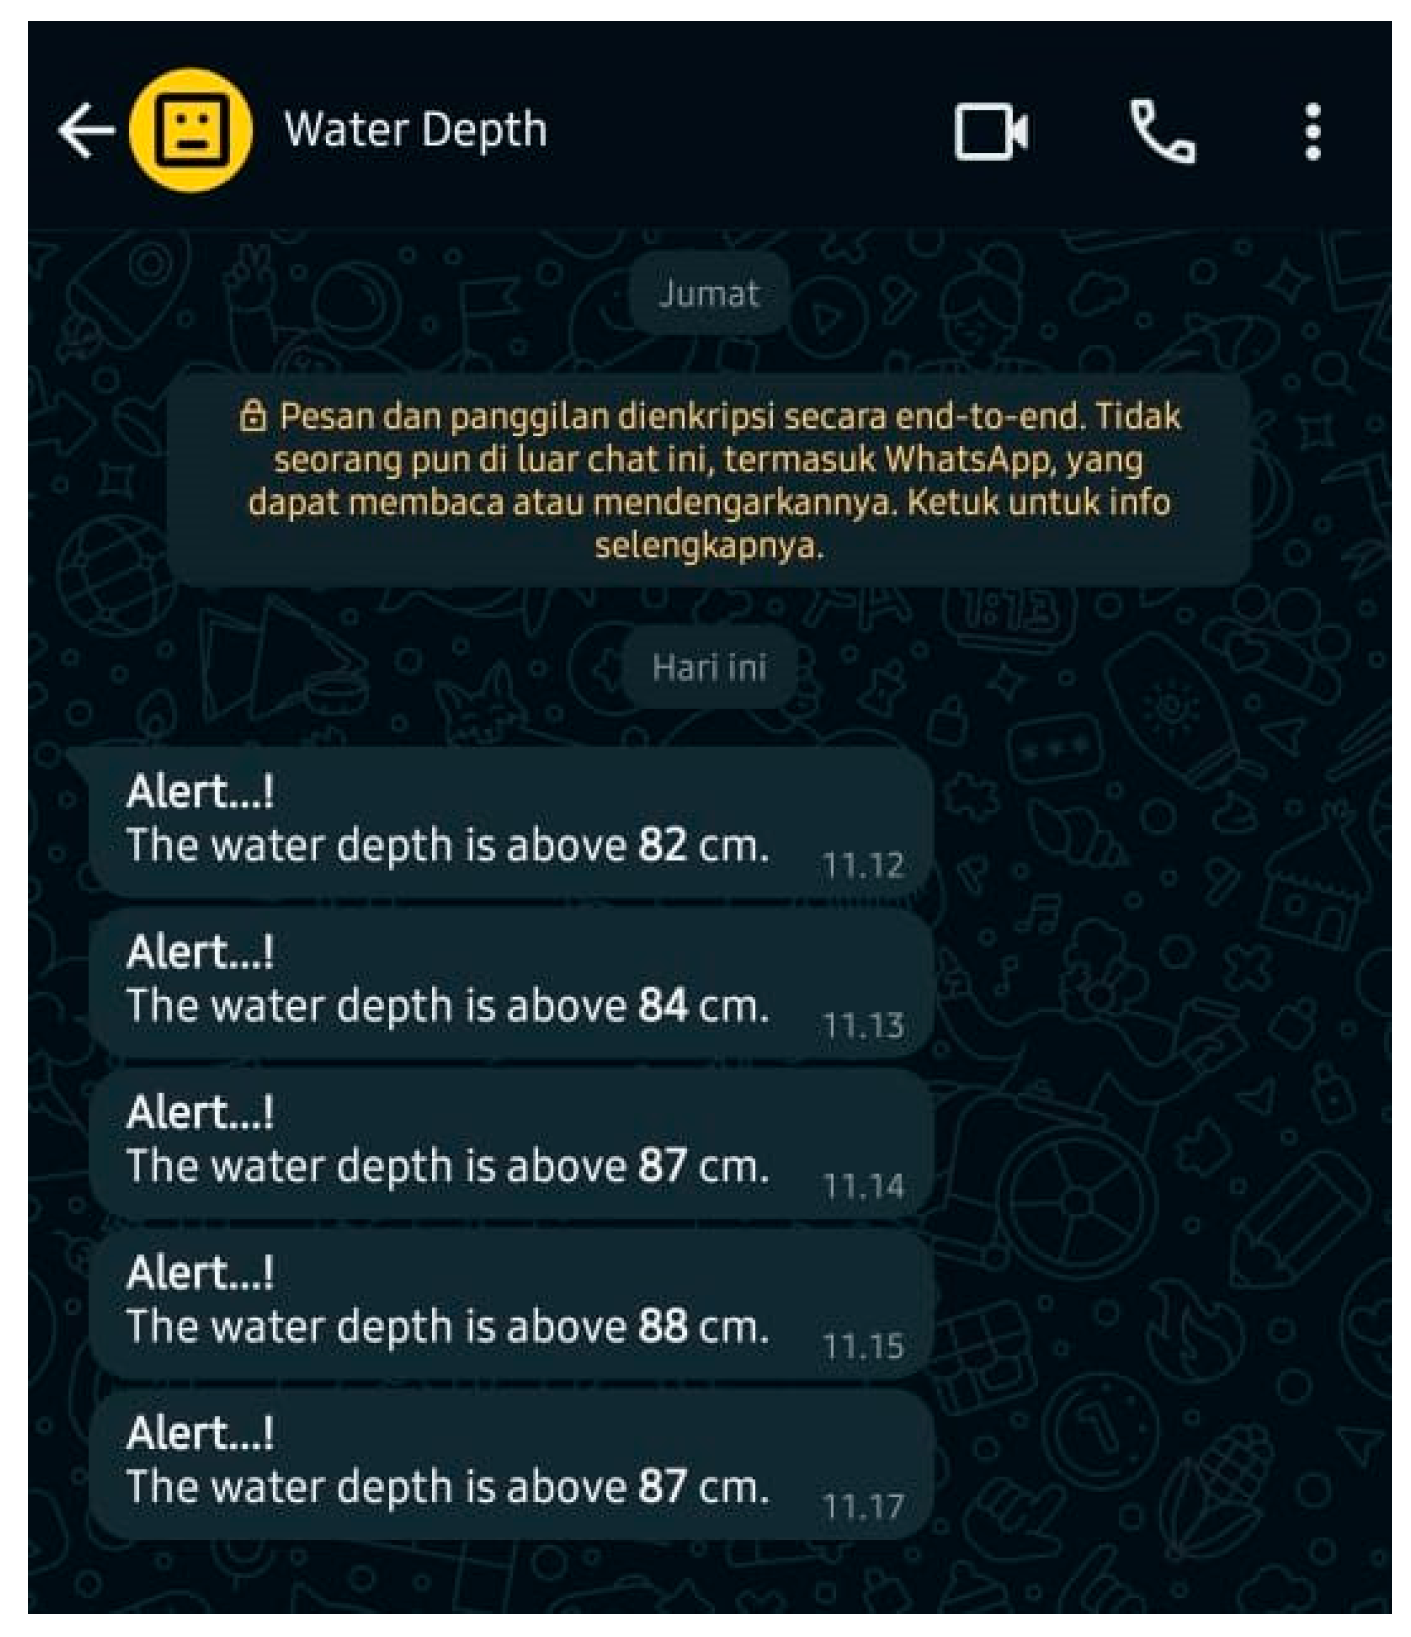
Figure 4, an empty blue water drum was filled by slow water flow from the tap water. The ultrasonic sensor was put on the top of the tank while a length meter was placed as the reference indicator. As the water level rises, the water depth read by sensor was also increase as displayed on the serial monitor. The reading was similar with number that length meter pointed out. To prove that the alert system was effective, 80 cm had been selected as a threshold of water depth to simulate flooding event. Thus, whenever the sensor reading exceeded 80 cm, the buzzer would generate sound and user’s phone would receive alert notification via the Whatsapp message. Eventually, when performing the monitoring process in the field, this threshold must be adjusted to acquire the real warning event. After stage 2 result convinced us that the system was able to receive command and send the correct water depth data between modem and the user, stage 3 was organized together with stage 4 at the campus lake. Since it was the transition time from drought to wet season, stage 5 was unable to realize in the field, yet it only able to be demonstrated in the laboratory experiment.
3. Results and Discussion
3.1. Ultrasonic Sensor Calibration
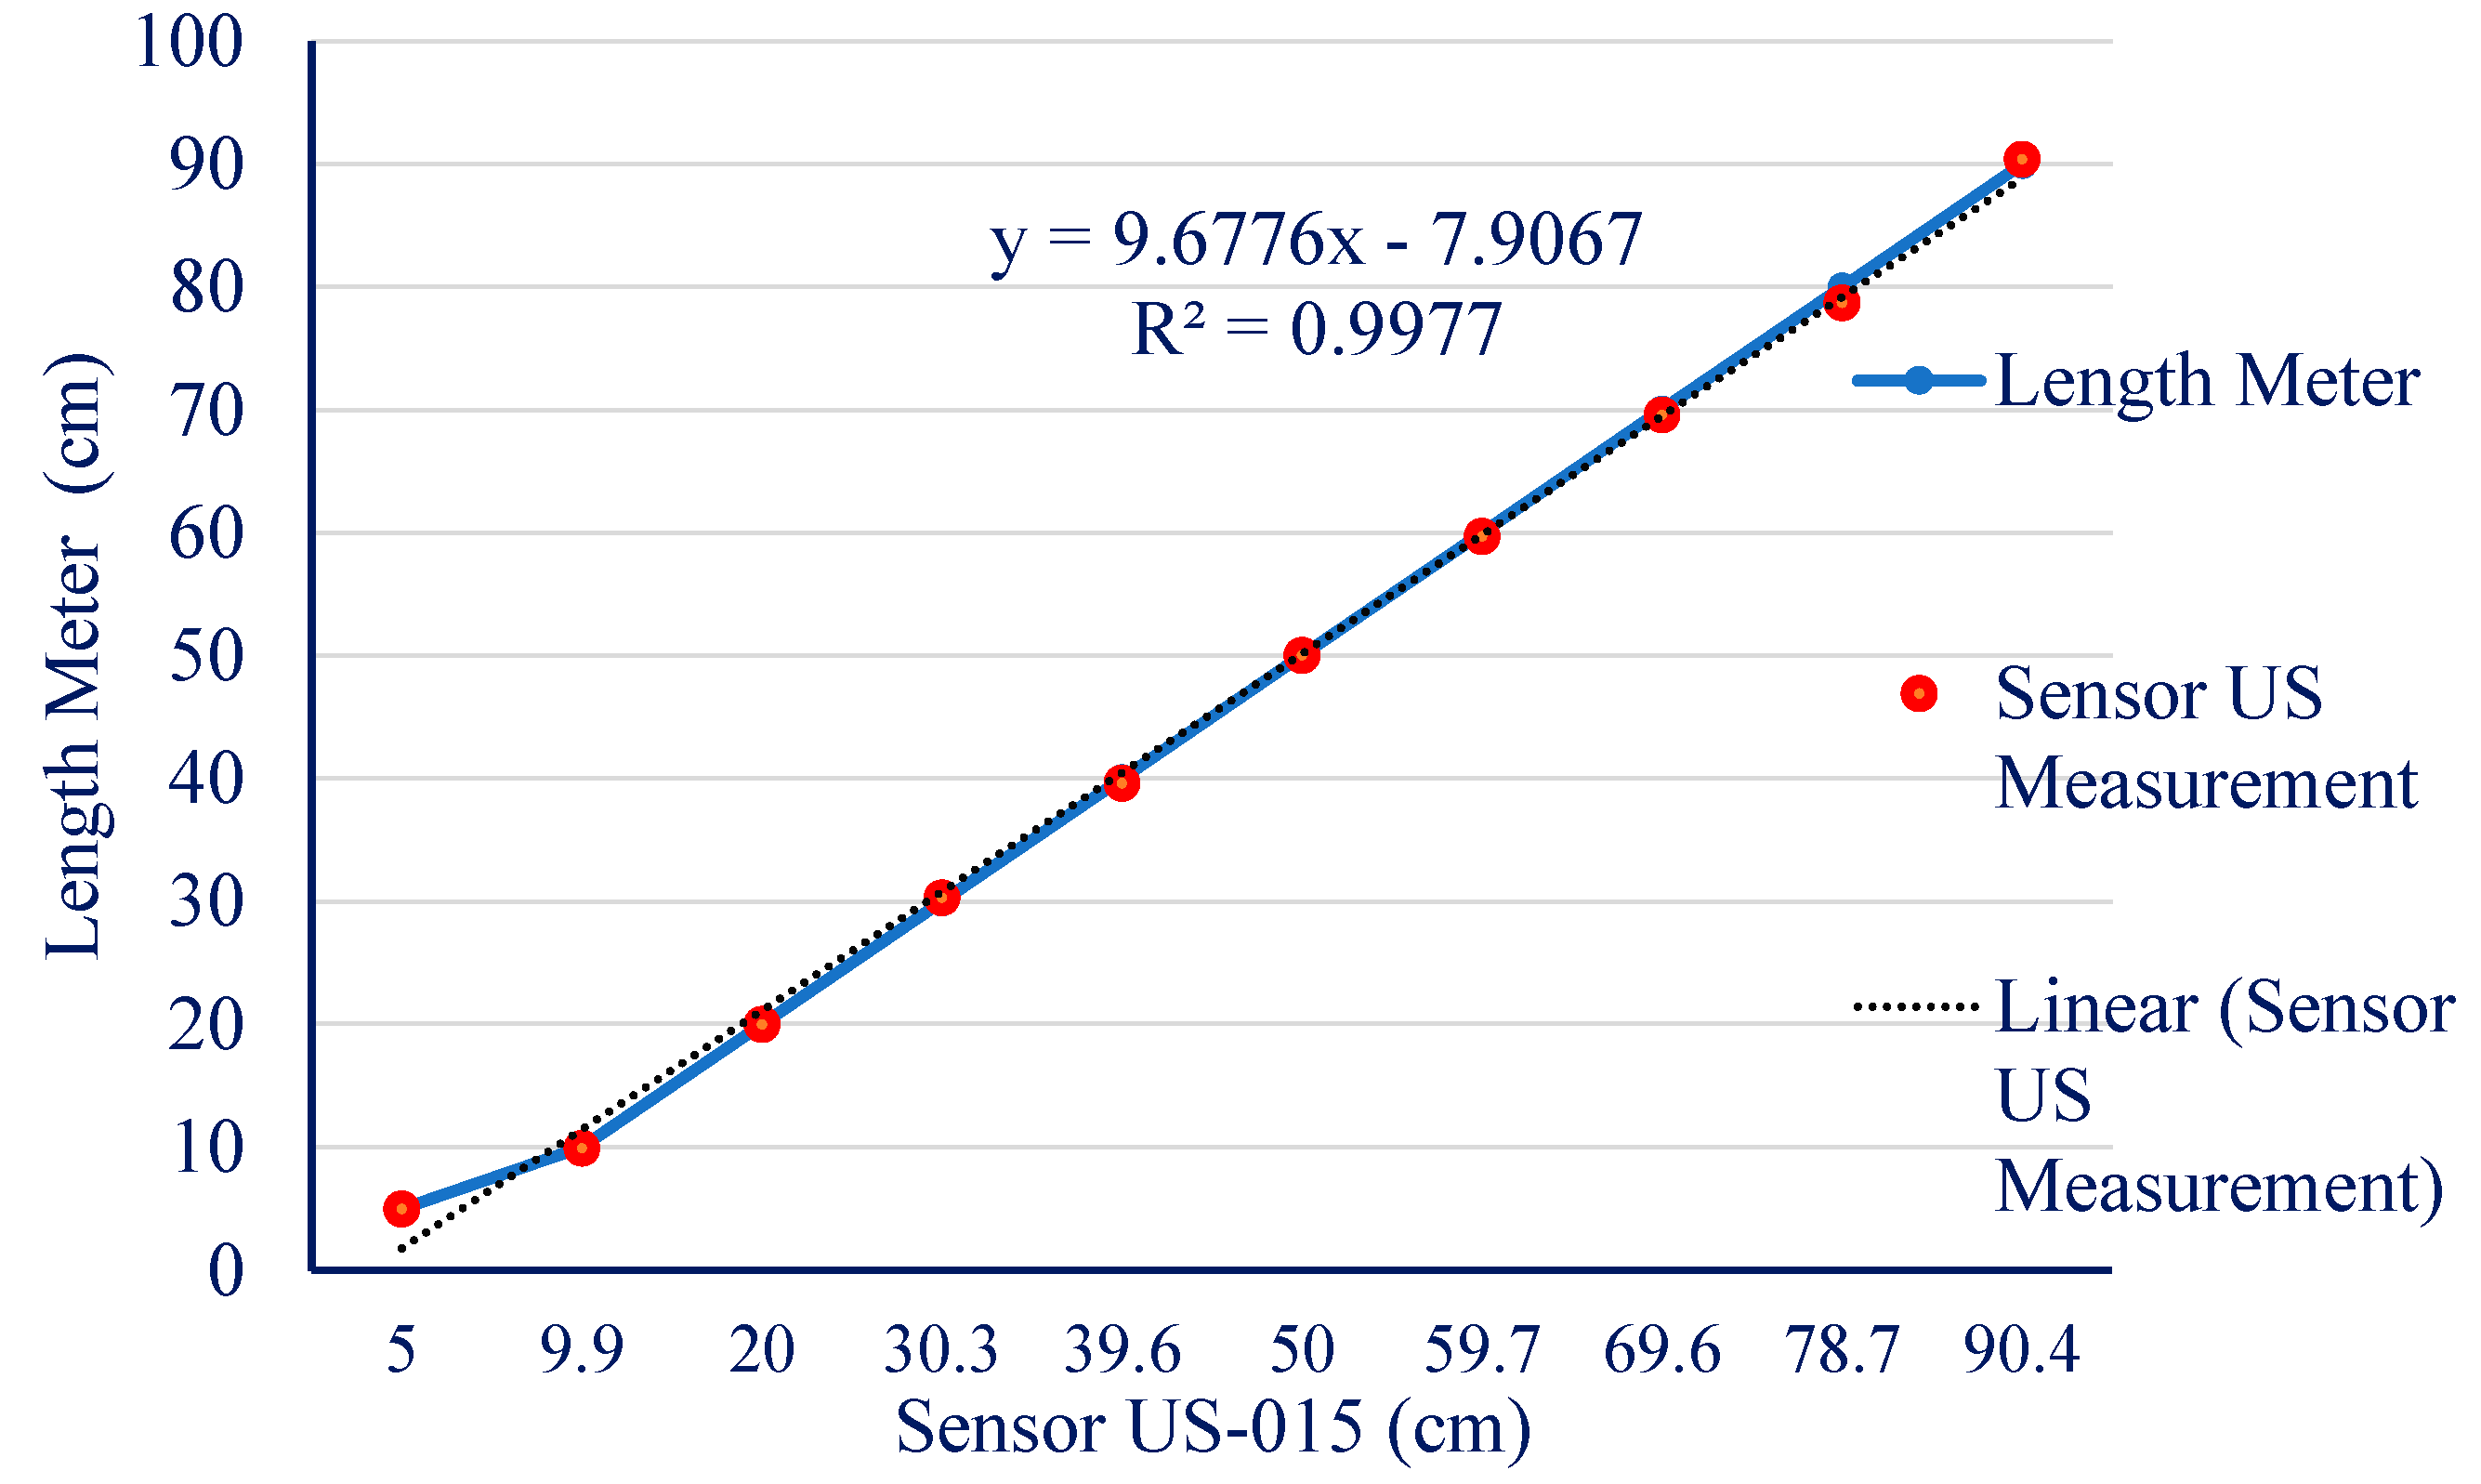
We had calibrated the ultrasonic sensor US-015 by setting up the water height from 5, 10, 20 up until 90 cm as shown in
Table 1. The water depth measurement by sensor was ran ten times for each height before the averages and error values calculated. The average numbers were similar with the exact water depth. Therefore, their error values were below 1%, acceptable for field measurement.
Figure 5 is showing the measurement result from the calibration test where the red dot is the curve of sensor reading while the blue line is the measurement output of the length meter. There is a linear correlation between sensor output and the reference thus the sensor had been standardized.
3.2. Laboratory Experiment Test
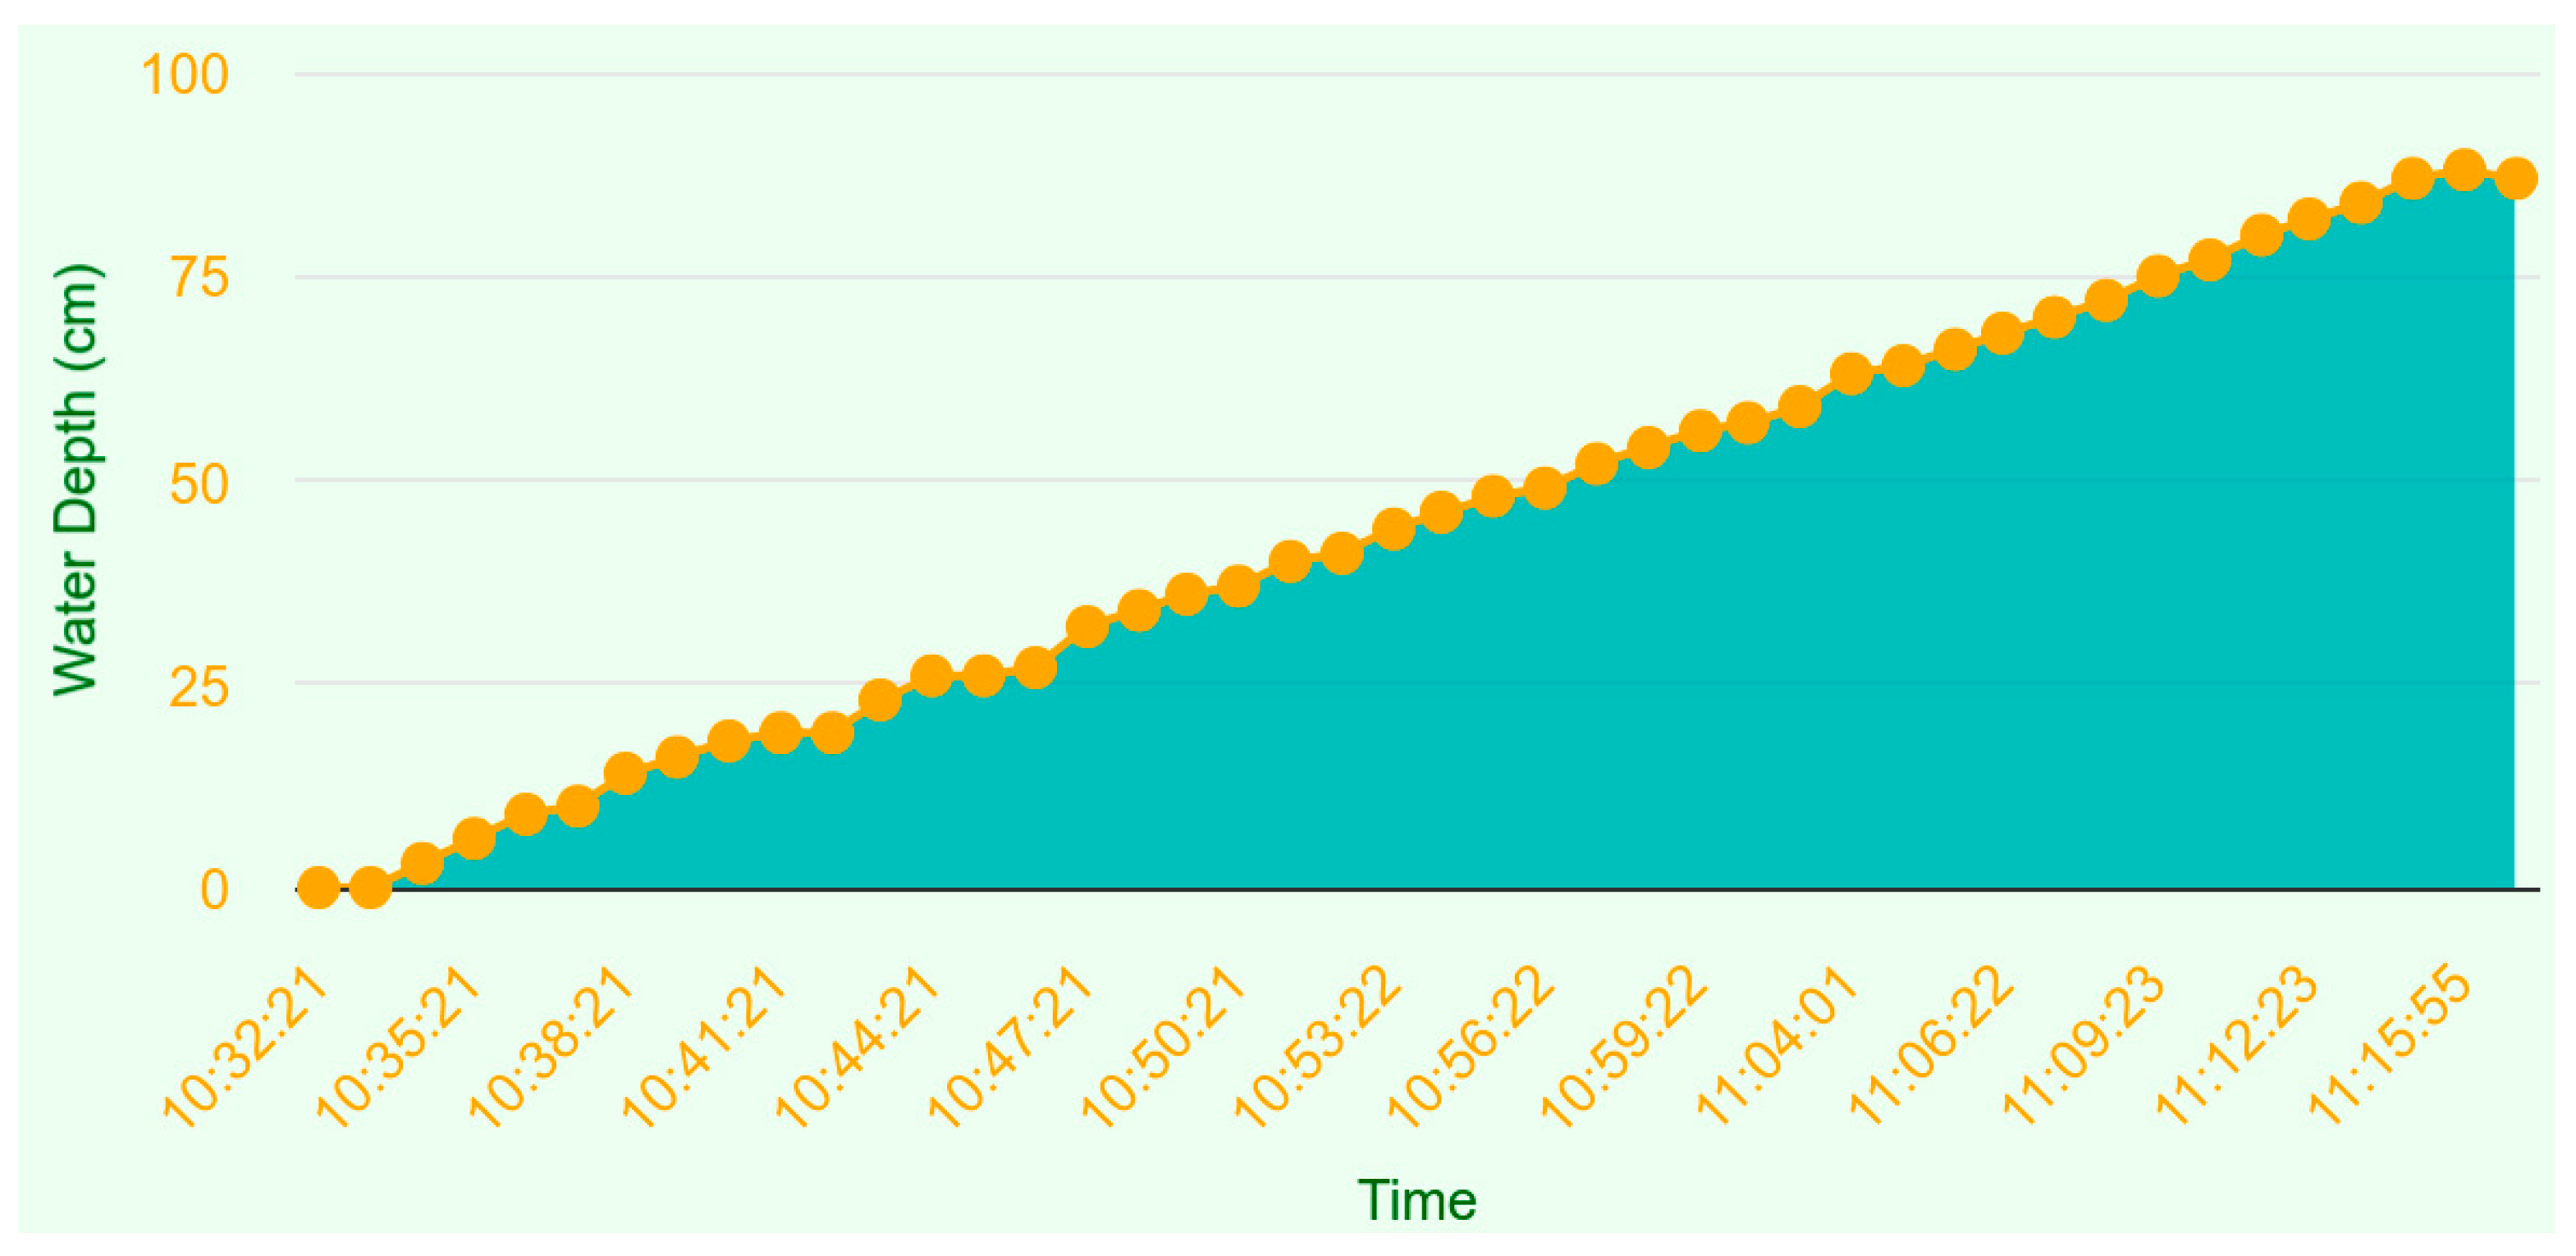
The experiment in the laboratory had been executed to ensure that ultrasonic sensor was able to measure the water depth correctly and the modem was able to display the data on the website. As
Figure 4 had shown, an empty blue water tank with 100 cm height was filled by water from 10:32 until 11:15 a.m. The maximum height of water filling was 90 cm to make the space between water surface and sensor position. The requirement sensing distance is 2 cm to 400 cm hence there was 10 cm space left to meet the specification. As the water level increased, the water depth measurement by sensor also rose as the graph displayed on the website (
Figure 6). Those data were similar with number shown by the length meter. To simulate a case of flooding event, 80 cm value had been selected as the threshold for the maximum water depth. Therefore, when the sensor output exceeded 80 cm, notification were sent to user via the Whatsapp application, as shown by
Figure 7.
3.3. Real time water depth monitoring of Sriwijaya University’s Lake
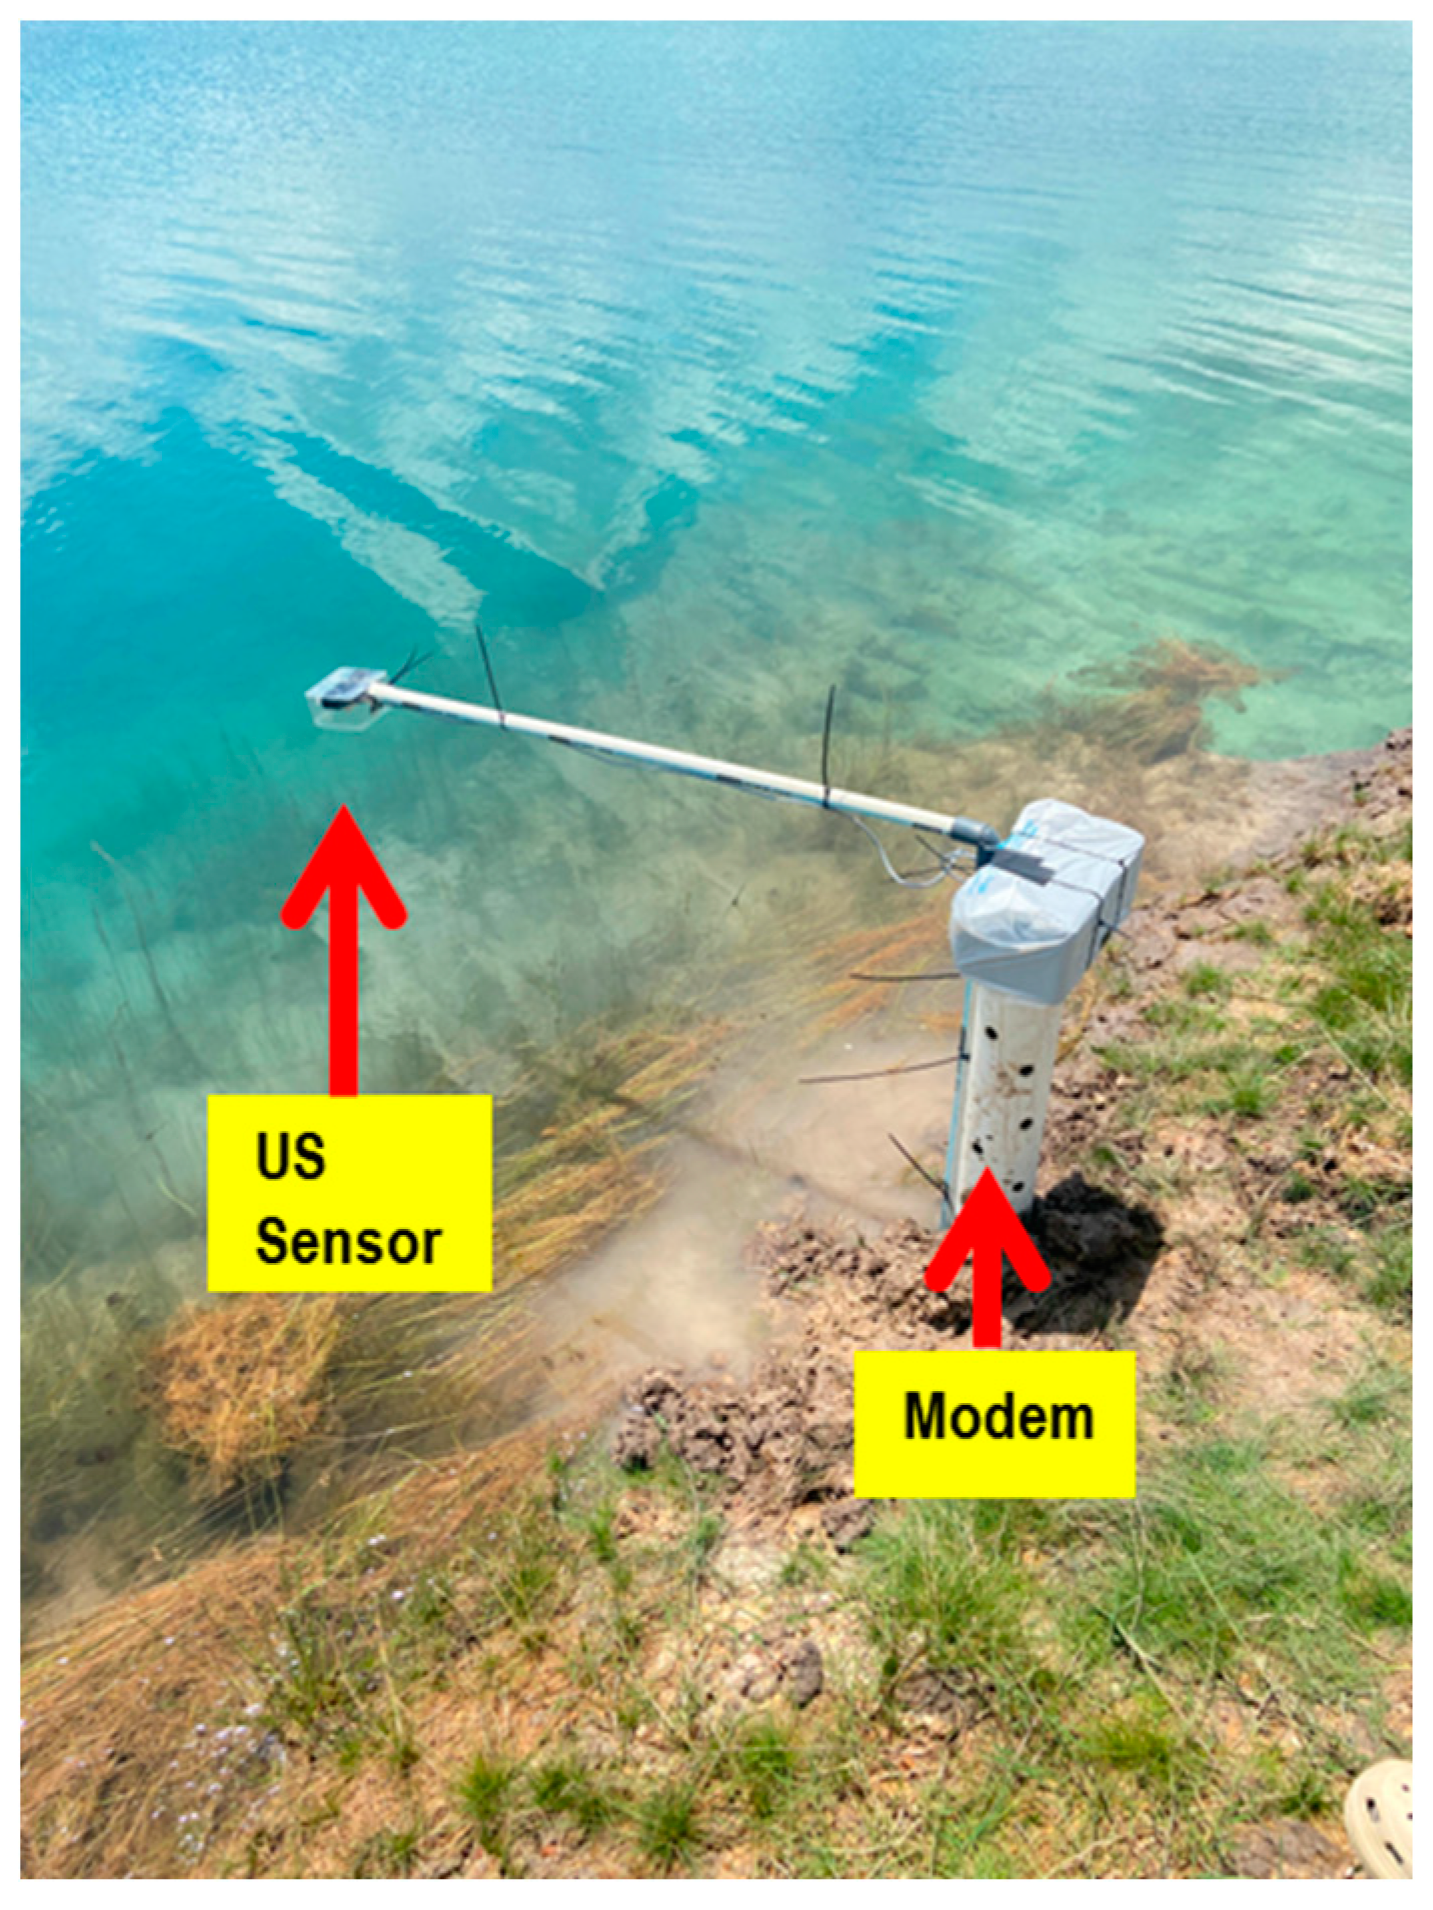
The real time monitoring of water depth at the campus lake was held on October 9
th 2024 (
Figure 8). The modem was using 3 sets consisted of 4 units battery (3.7 V, 1500 mAh) as the power supply for Arduino, Node MCU and Wi-Fi modem. We wanted to find out the energy consumption and lifespan of the sensor system using such power. Hence, the measurement was executed every ten minutes and turn out that the battery only lasted for 72 times of data transmission (12 hours operation time). Apparently, Arduino and Ultrasonic sensor needed 370 mA and 5 V for the operational power. Compared with research done by [
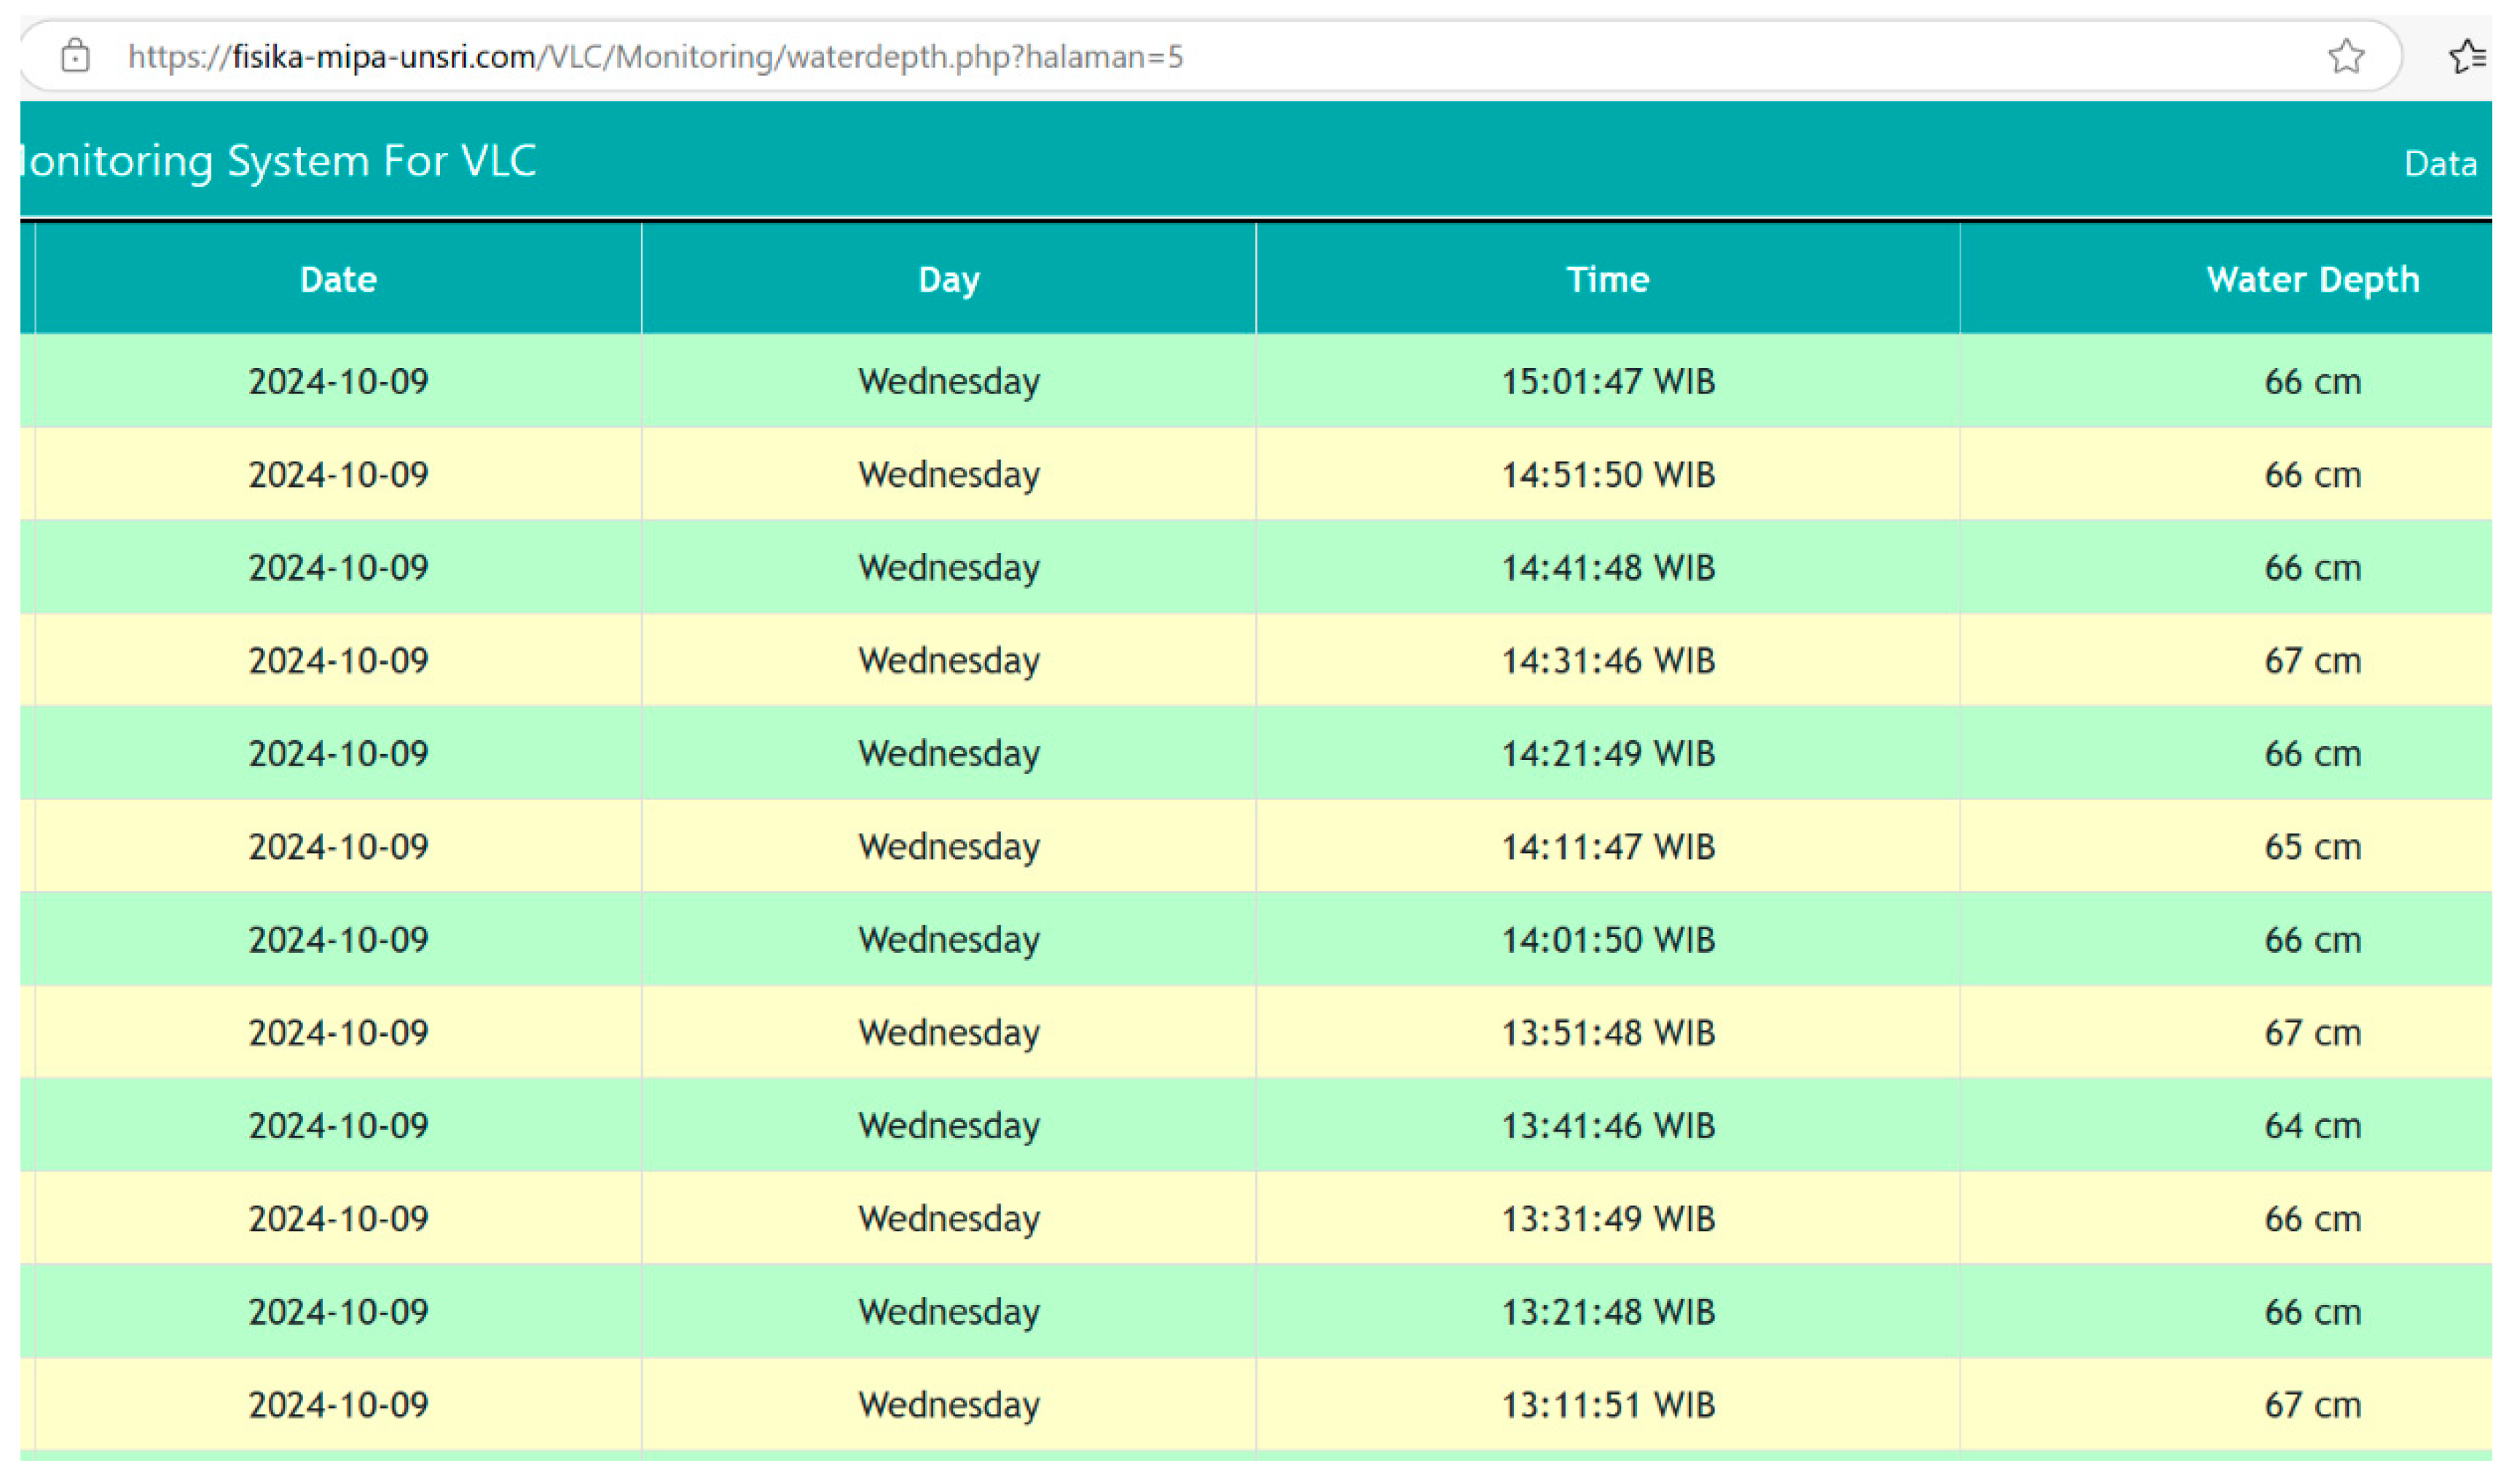
17] where 4 unit of AA batteries (1.5 V, 500 mAh) could supply power of Arduino-based logger for 3 months, this work demanded more power due to its communication function. They did not include the water depth data transmission in their project. Besides, they had spent USD 168.26 for the logger while the modem we had built costed USD 130.60 only. The power consumption data will be a baseline for our next work to manage the power supply whether by applying active-sleep mode algorithm to increase the measurement cycle or installing an adequate solar cell with harvesting and measuring modes embedded inside the Arduino controller. Some examples of real time data displayed on the website was shown by
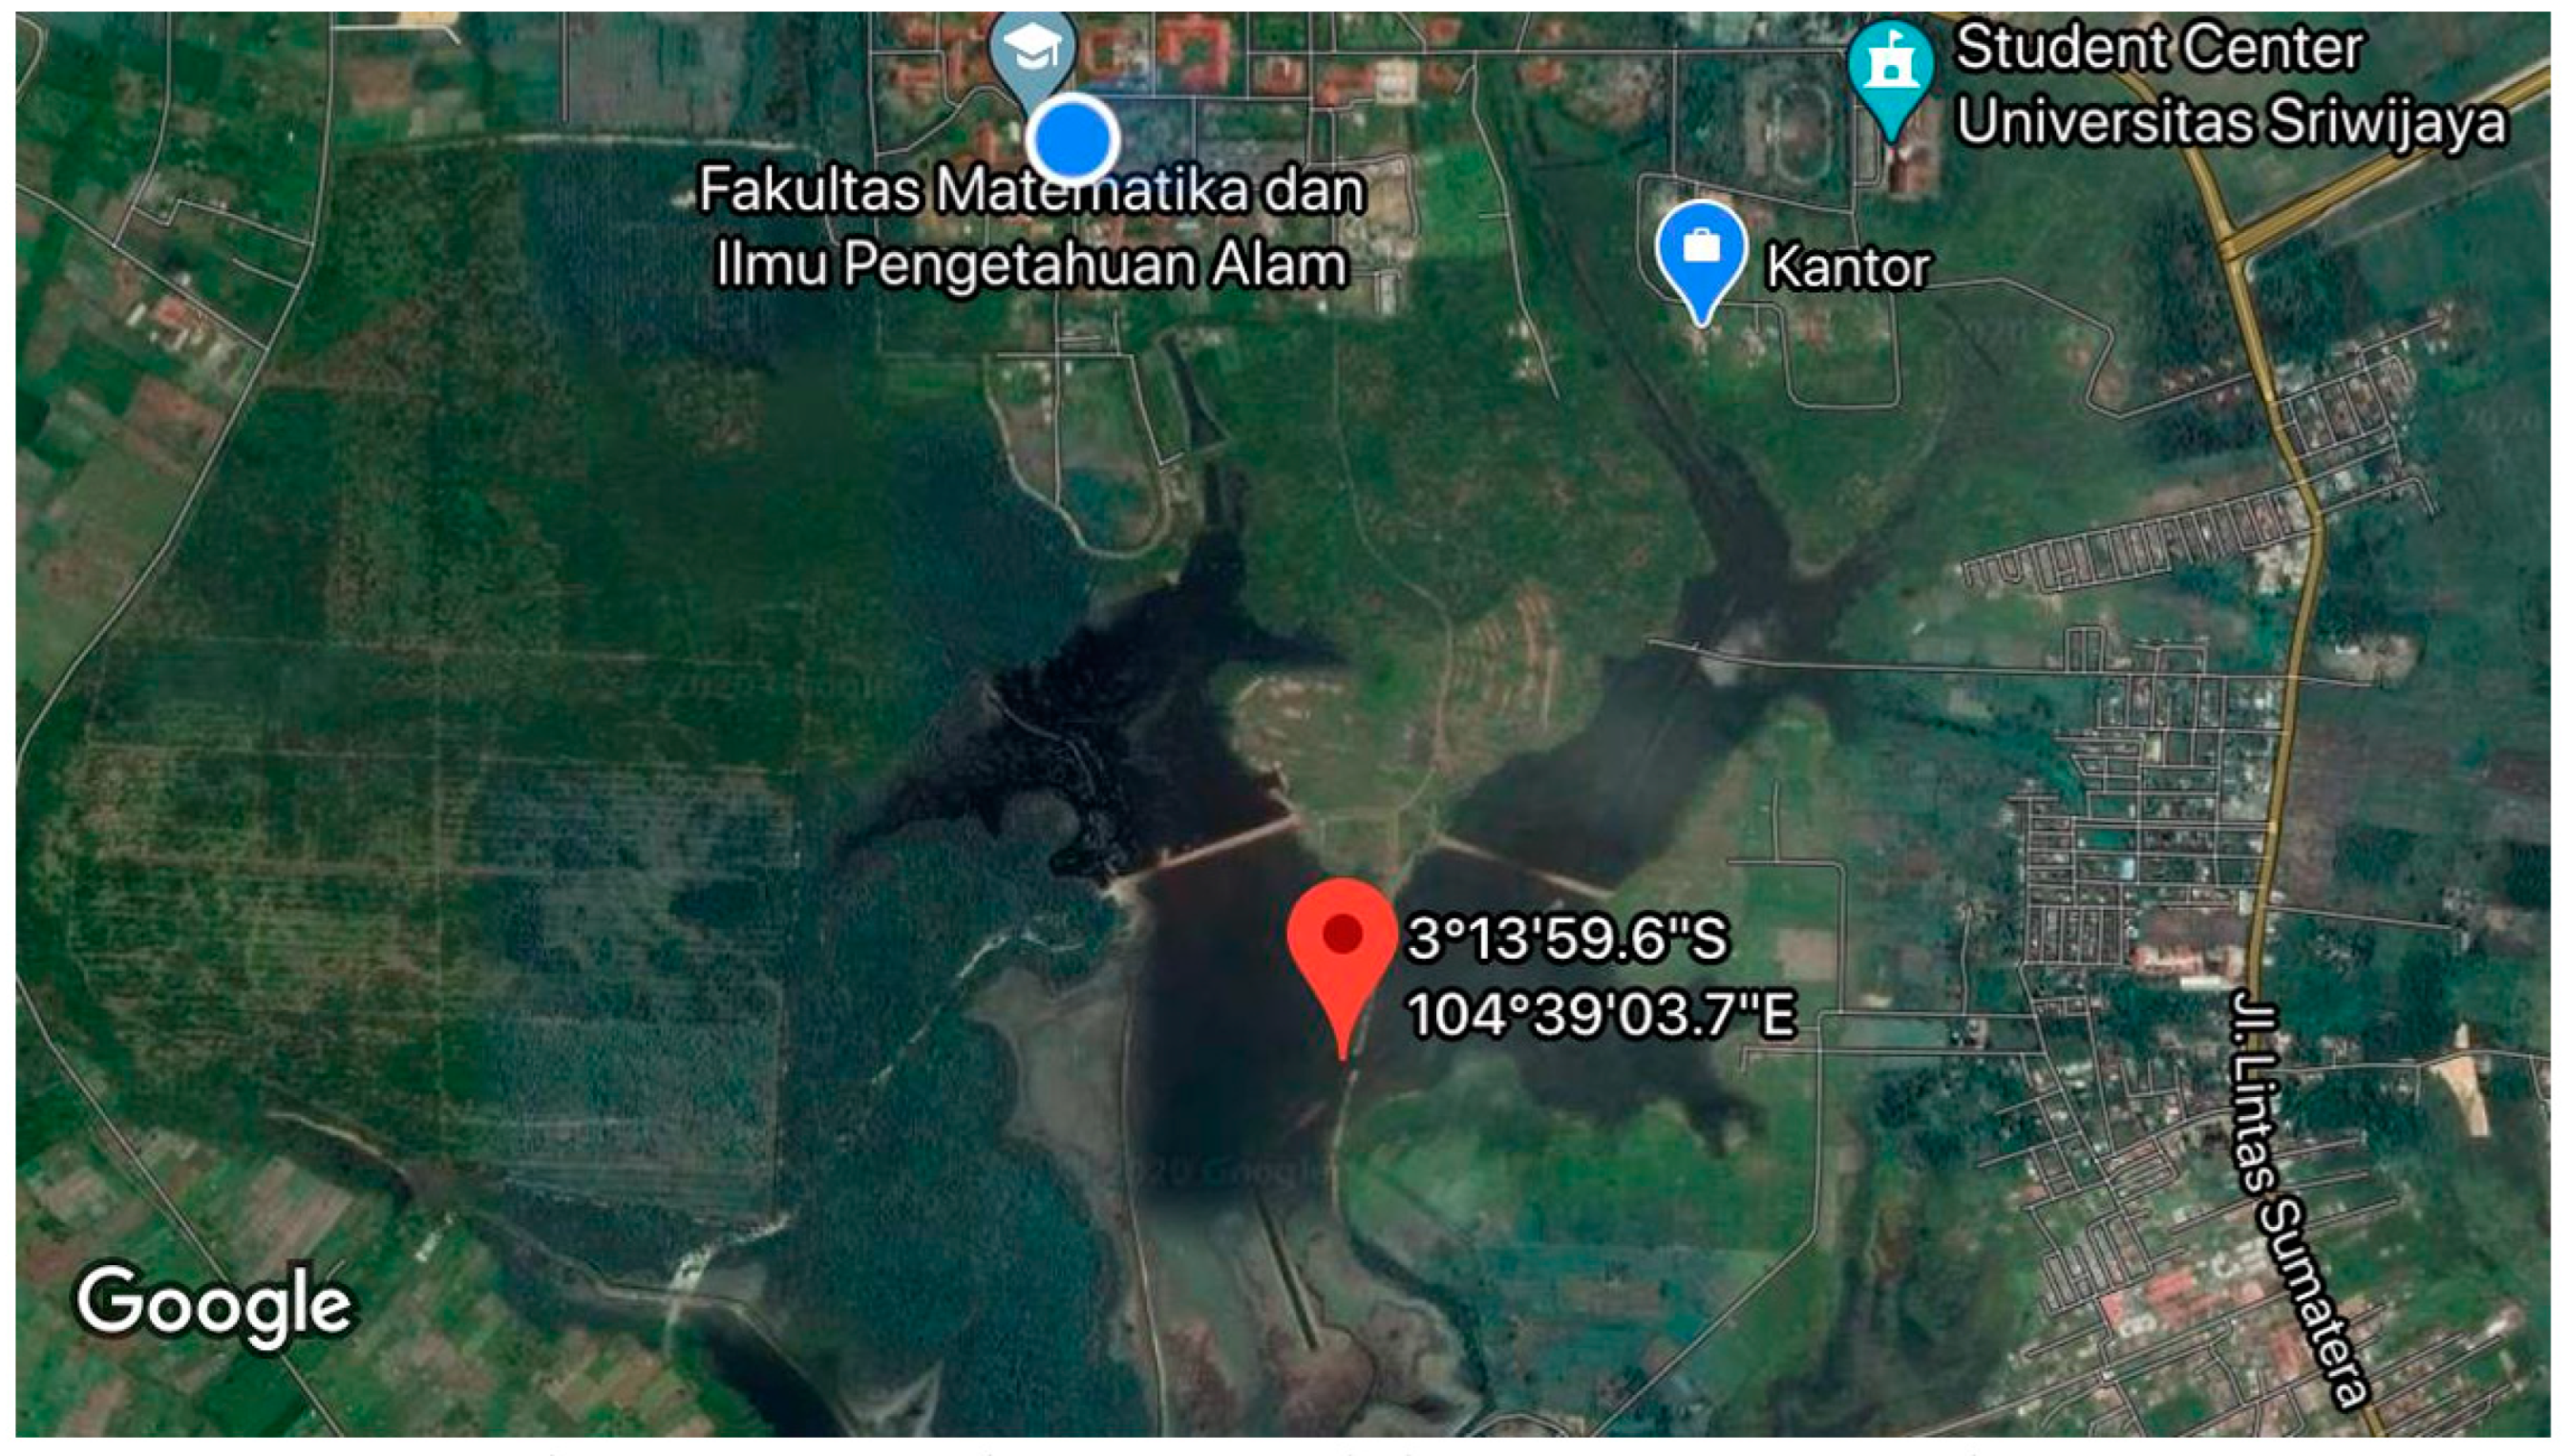
Figure 9. The water depth was around 66 cm during the range time of 12 hours. We expected these values would not change much for the lake with area about 135 Ha (
Figure 10). Therefore, the measurement must be done per user request at a critical time (at leats once a day) hence the bidirectional communication must be performed in this water depth monitoring case.
4. Conclusions
A low-cost bidirectional telemetry system for water depth monitoring had been applied at Sriwijaya University’s Lake successfully. The ultrasonic sensor had been calibrated and tested in laboratory measurement to read water depth precisely. The collected data sent through internet using http protocol embedded in Node MCU board used in the system and been displayed on a website. It was an effective and efficient system due to the bidirectional link of communication since it provided an actual and crucial data requested by user at significant situation, instead of any range of time measurement. This will obviously save the energy and the data storage for the system. A flooding warning also had been added on the embedded program so that it could alert the user in charge for preventing the natural disaster.
Author Contributions
Conceptualization, I.I. and K.S.; methodology, A, K.S.; software, R.M.; validation, I.I., A. and O.C; formal analysis, H. and O.C.; investigation, K.S. and R.M; resources, Y.A.; data curation, Y.A.; writing—original draft preparation, A.; writing—review and editing, A.; visualization, R.M.; supervision, I.I and A.; project administration, Y.A.; funding acquisition, H. All authors have read and agreed to the published version of the manuscript.
Funding
This research was supported by Faculty of Mathematics and Natural Sciences, University of Sriwijaya, through FMIPA PNPB Grant 2024.
Institutional Review Board Statement
Not applicable.
Informed Consent Statement
Not applicable.
Data Availability Statement
Data are contained within the manuscript.
Acknowledgments
We would like to thank Faculty of Mathematics and Natural Sciences; Mathematic and Natural Science Doctoral Program, University of Sriwijaya; Instrumentation Electronic Laboratory of FMIPA UNSRI and Komunikasi Nirkabel lab member for their support to this research.
Conflicts of Interest
The authors declare no conflicts of interest. The funders had no role in the design of the study; in the collection, analyses, or interpretation of data; in the writing of the manuscript; or in the decision to publish the results.
References
- Santosh, K.V; Joy, B; Rao, S. Design of an Instrument for Liquid Level Measurement and Concentration Analysis Using Multisensor Data Fusion. Journal of Sensors 2020, 20, 1-13. [CrossRef]
- Deqin Xiao, Jianzhao Feng, Ning Wang, Xiwen Luo, Yueming Hu, Integrated soil moisture and water depth sensor for paddy fields, Computers and Electronics in Agriculture 2013, 98, 214-221. [CrossRef]
- Machefer, M.; Perpinyà-Vallès, M.; Escorihuela, M.J.; Gustafsson, D.; Romero, L. Challenges and Evolution of Water Level Monitoring towards a Comprehensive, World-Scale Coverage with Remote Sensing. Remote Sens. 2022, 14, 3513. [Google Scholar] [CrossRef]
- Mousa, M; Zhang, X; Claudel, C. Flash Flood Detection in Urban Cities Using Ultrasonic and Infrared Sensors. IEEE Sensors. 2016, 16, 7204–7216.
- Yunita, A.M; Wardah, N.N; Sugiarto, A.; Susanti, E.; Sujai, L.; Rizky, R. Water level measurements at the cikupa pandeglang bantendam using fuzzy sugenowith microcontroler-based ultrasonik sensor. J. Phys.: Conf. Ser. 1477052048.
- Loizou, K; Koutroulis, E. Water level sensing: State of the art review and performance evaluation of a low-cost measurement system. Measurement. 2016, 89, 204–214. [Google Scholar] [CrossRef]
- Bathre, M; Pradipta, K.D. Water supply monitoring system with self-powered LoRa based wireless sensor system powered by solar and hydroelectric energy harvester. Computer Standards & Interfaces. 2022, 82, 103630. [Google Scholar]
- Shi, B.; Catsamas, S.; Kolotelo, P.; Wang, M.; Lintern, A.; Jovanovic, D.; Bach, P.M.; Deletic, A.; McCarthy, D.T. A Low-Cost Water Depth and Electrical Conductivity Sensor for Detecting Inputs into Urban Stormwater Networks. Sensors 2021, 21, 3056. [Google Scholar] [CrossRef] [PubMed]
- M. H. Bin Mat Idris, M. Al Azhari Bin Che Kamarudin, M. I. Sahalan, Z. Bin Zainal Abidin and M. M. Rashid, "Design and Development of an Autonomous Surface Vessel for Inland Water Depth Monitoring," International Conference on Computer and Communication Engineering (ICCCE), Kuala Lumpur, Malaysia, 2016, 177-182. [CrossRef]
- Mohindru, P. Development of liquid level measurement technology: A review. Flow Measurement and Instrumentation. 2023, 89, 102295. [Google Scholar] [CrossRef]
- Natividad, J.G; Mendez, J.M. Flood Monitoring and Early Warning System Using Ultrasonic Sensor. IOP Conf.Ser.: Mater.Sci.Eng. 2018, 325012020.
- Diriyana, A; Darusalam, U; Natasha, N.D. Water Level Monitoring and Flood Early Warning Using Microcontroller With IoT Based Ultrasonic Sensor. Teknik Informatika C.I.T Medicom. 2019, 11, 22–28. [Google Scholar]
- Pereira, *!!! REPLACE !!!*; Rodrigues, T.S; Carvalho, T.P; Mendes, T.A; Teodomiro, K. Evaluation of Water Level in Flowing Channels Using Ultrasonic Sensors. Sustainability. 2020, 14, 5512. [Google Scholar] [CrossRef]
- South Sumatera. Indonesian National Carbon Accounting System. Available online: http://incas.menlhk.go.id/data/south-sumatra/ (accessed on 30 September 2024).
- Fajriansyah, A. South Sumatra Potentially Surrounded by Disaster. Available online: https://www.kompas.id/baca/english/2023/11/23/en-sumatera-selatan-berpotensi-dikepung-bencana (accessed on 30 September 2024).
- Moreno, C.; Aquino, R.; Ibarreche, J.; Pérez, I.; Castellanos, E.; Álvarez, E.; Rentería, R.; Anguiano, L.; Edwards, A.; Lepper, P.; et al. RiverCore: IoT Device for River Water Level Monitoring over Cellular Communications. Sensors 2019, 19, 127. [Google Scholar] [CrossRef]
- Pearce, R.H.; Chadwick, M.A.; Main, B.; Chan, K.; Sayer, C.D.; Patmore, I.R. Low-Cost Approach to an Instream Water Depth Sensor Construction Using Differential Pressure Sensors and Arduino Microcontrollers. Sensors 2024, 24, 2488. [Google Scholar] [CrossRef] [PubMed]
|
Disclaimer/Publisher’s Note: The statements, opinions and data contained in all publications are solely those of the individual author(s) and contributor(s) and not of MDPI and/or the editor(s). MDPI and/or the editor(s) disclaim responsibility for any injury to people or property resulting from any ideas, methods, instructions or products referred to in the content. |
© 2024 by the authors. Licensee MDPI, Basel, Switzerland. This article is an open access article distributed under the terms and conditions of the Creative Commons Attribution (CC BY) license (http://creativecommons.org/licenses/by/4.0/).
