Preprint
Article

Impact of Saharan Dust Intrusions on Atmospheric Boundary Layer Height over Madrid

Altmetrics

Downloads

53

Views

24

Comments

0

A peer-reviewed article of this preprint also exists.

Submitted:

04 November 2024

Posted:

04 November 2024

You are already at the latest version

Alerts
Abstract
Atmospheric pollution caused by aerosols deteriorate air quality, increasing public health risk. Anthropogenic aerosols are mostly concentrated within the atmospheric boundary layer (ABL), that presents a daytime evolution that determine the vertical mixing of the air pollutants generated near the surface and therefore, their ground-level concentration from local sources. Proper characterization of this layer is of crucial importance in numerical weather forecasting and climate models; however, their estimation nowadays presents some spatial and temporal limitations. Lidars have demonstrated their capabilities to study the aerosol vertical distribution. A particular type of lidars, ceilometers, are capable of providing continuous aerosol vertical profiles with good spatial resolution and a large vertical range. Advanced methods, such as the recently developed STRATfinder algorithm, are required to estimate the ABL height due to difficulties with residual layers. The algorithm tracks ABL heights to provide values every hour during a 24-hour period. More complex situations occur due to advection of aerosols (e.g. due to long-range transport of desert dust, volcanic eruptions, or pyrocloud convection), producing lofted layer in the free troposphere that may remain decoupled from the local ABL but can also be mixed. Aerosol-based methods for determination of the ABL height are challenging in those situations. The main objective of this research is the assessment of the impact of Saharan dust intrusions on the ABL using ceilometer signals, along four years period 2020-2023. The database of ABL heights of continuous measurements have been classified regarding the most frequent patterns of synoptic circulation. Six synoptic meteorological patterns were identified through cluster analysis of sea level pressure fields as the main responsible of the weather conditions in the Iberian Peninsula. Counter-intuitive behavior is obtained in particular synoptic situations due to the presence of dust-rich aloft layers. These results are relevant for health advice during Saharan dust intrusion days.
Keywords: 
Subject: Environmental and Earth Sciences  -   Atmospheric Science and Meteorology

1. Introduction

Aerosols constitute a public health risk, as they can be considered one of the main factors contributing to poor air quality [1]. Aerosols are mainly concentrated within the atmospheric boundary layer (ABL), with long-range transport layer sometimes located in the free troposphere. This heterogeneous distribution make their characterization difficult The ABL is defined as the lowest part of the atmosphere, influenced by the Earth’s surface by means of exchange of energy and moisture [2]. It plays a critical role in air quality forecasts [3] and greenhouse gas concentration budgets [4] and it is mainly characterized by turbulent processes. The influence of solar radiation creates a daily evolution cycle of the layer [5]. The cycle, in clear-sky situations, starts with the increase of ground surface temperature after sunrise, which intensifies the convection. It produces ascension of warm air masses and downward displacement of colder air masses, which creates a growing mixing layer (ML) [6]. It is called this way because substances emitted into this layer disperse gradually horizontally and vertically due to the turbulence. When sufficient time is given and there are no sinks, the ML become completely mixed [4]. The vertical turbulent mixing processes produces a strong aerosol gradient between the ABL and the free troposphere. When the ML is well developed, usually at the end of the daytime period, the ABL height (ABLH) is estimated similar to the ML height (MLH), as the turbulent mixing produces a nearly homogeneous distribution of aerosols along the complete layer. Later in the day, the gradual reduction of incoming solar irradiance during the early evening transition period causes a weakening of the turbulence and the convective processes. This creates a nocturnal boundary layer (NBL) close to the surface, that is stable and stratified. The remnant of the daytime ML is located above the NBL and it is called the residual layer (RL). When the sun rise again, a new ML begins to grow rapidly, eroding firstly the NBL and then entraining into the RL, producing an early morning transition. Since different surfaces respond differently to the solar heating, the development of the ABL is influenced by the surface albedo of the underlying surface [7]. Therefore, the combined effects of the synoptic atmospheric conditions, such as atmospheric stability or wind shear, and surface characteristics such as cover, roughness or topography, determines the horizontal variations in ABL dynamics [8]. There are a wide range of applications with high societal, economic, and health impacts, such as air quality [9] the generation of renewable energy [10] or numerical weather prediction [11] that benefits from a better understanding of these ABL processes.
The traditional methods employed to characterize the ABLH, radiosounding in the frame of the World Meteorological Organization Radiosounding Global Network [12]; present spatial and temporal limitations as they are usually launched only twice per day in most airports worldwide. This scarce observations prevent an accurate determination of the ABLH variations, both temporal and spatially, compromising their representativeness for urban and regional scales. It was documented that the calculation of the MLH based on potential temperature profile or Richardson number performed by numerical meteorological models produces more than 50% uncertainty in shallow boundary layers and 20% in deeper boundary layers due to scarcity in the input data [12].
Continuous profiling of the entire ABL vertical extent is nowadays possible thanks to recent advances in ground-based remote-sensing technology and algorithm development [13]. The high temporal and vertical resolution of remote sensing instruments permits a precise automatic detection of ABL sub-layer heights [14]. Among novel remote sensing methods, a promising one is the ceilometer, a particular type of lidars operating with a single-wavelength and originally intended for cloud base height detection [15]. Currently, ceilometers provide continuous high resolution aerosol backscatter profiles (every 15 s) with good spatial resolution (tenth of meters) and a large vertical range (up to several km ) in unattended continuous operation. Furthermore, ceilometers are usually operated in networks, such as EUMETNET EPROFILE [16] and ICENET (Iberian Ceilometer Network, [17]).
The ABLH retrieval algorithm for these instruments is based on the aerosols vertical profile. It assumes that aerosol concentrations are lower in the free troposphere than in the mixing layer, producing a strong negative gradient clearly observable in the backscatter profiles [18]. The high temporal and spatial resolution allows the study of the aerosol concentration fluctuations produced by the constant interexchange of airmasses, those polluted with aerosols within the ML moving upward are exchanged with those clean moving downward from the free troposphere. A disagreement can result between the height of aerosol layers derived by lidar profiles and the radiosounding-derived MLH due to the inconsistency between the thermal profiles and the aerosol profile, especially during morning or evening transitions [19]. ABLH retrieval algorithms take advantage of these characteristics to determine the height, such as gradient method [20], wavelet covariance transform [21] or edge detection method [22]. More advanced methods extend the analysis to two dimensions (temporal and vertical) in order to guarantee temporal consistency [23], or applies graph theory to track the diurnal evolution [24]. A reliable new method called STRATfinder [25] combines these last two methodologies applying a backward propagating layer, from the end of the day, in order to determine the type of layer by minimizing a cost function from the forward and backward runs. This layer attribution is normally assisted by commonly available surface measurements of radiation and temperature in order to decrease its uncertainty [23].
However, more complex atmospheric situations can jeopardize the observable strong negative gradient in the backscatter profiles. For instance, desert dust intrusions, volcanic eruptions or forest fires [26] can produce long-range transport of aerosols that affects the vertical distribution over the site due to the presence of lofted layer, which can either mix with the ABL or remain above it for long periods. This advection of aerosols increases the layer retrieval uncertainty, challenging any aerosol-based method. [27]. The Iberian peninsula is located close to the Sahara desert and regularly receive desert dust events, occurring when the dust is injected and transported throughout the atmosphere over long distances. On a global scale, the apportion of desert dust have been estimated up to 40% of aerosol mass yearly injected into the troposphere [28] and in particular Sahara desert emit half of the world atmospheric mineral dust [29].
The main objective of this work is the assessment of the impact of Saharan dust intrusions on the ABLH using ceilometer signals, along four years period 2020-2023. The database of ABL heights of continuous measurements have been classified regarding the most frequent patterns of synoptic circulation. The weather conditions over the Iberian Peninsula were analyzed using cluster analysis of sea level pressure fields and six typical synoptic meteorological patterns (SMPs) were identified. Section 2 describes the methodology employed including the instrumentation (ceilometer profiles) and algorithms (STRATfinder), the synoptic meteorological patterns and the methodology followed to identify Saharan dust intrusions. Section 3 summarizes the main results obtained when the datasets are differentiated by season and by synoptic meteorological patterns and Section 4 discuss the main findings of the work.

2. Materials and Methods

2.1. Experimental Site

The CIEMAT (Centro de Investigaciones Energéticas, Medioambientales y Tecnológicas, 40.457◦N, 3.726◦W, 669 m asl) site is located Madrid, the capital of Spain placed roughly at the center of the Iberian Peninsula (See Figure 1). The site may be considered as an urban background station since there is a park (dehesa de la villa) closeby and the main traffic avenues are located moderately far away. Regarding the geography of the site, there are mountain ranges to the north-northwest (Sierra de Guadarrama, with maximum altitude of 2420 m. agl.)and also to the south (Montes de Toledo). the Madrid city’ population reached nearly 6 million inhabitants considering the metropolitan area and surrounding small towns, being one of the most populated regions in Spain. Main contributors to the Madrid air pollution plume are traffic emissions and residential heating, so it can be considered as typically urban. There is no significant industrial activity, only light factories [30]. Other contributions to the Madrid pollution be reduced to long-range transport of dust from the Sahara desert. In certain meteorological situations, Saharan dust intrusions can significantly contribute to the aerosol concentrations measured in the Madrid region [31]. The arrival of Atlantic air masses produces a cleansing effect on the Madrid atmosphere, with a significant reduction in the particulate matter levels. The weather in Madrid is described as continental Mediterranean, with prevalent clear-sky conditions, hot dry summers and cold winters [32]. During a large part of the year, the atmospheric situation is governed by the Azores high-pressure system which can produce periods of stagnation with high stability, poor ventilation and increases in local air pollution in winter.

2.2. Instrumentation

At the site, a ceilometer Lufft CHM15k-Nimbus belong to the instrumentation employed in the MDR-CIEMAT ACTRIS station [33], and, since 2020, the ceilometer data is available at ICENET [17]. The instrument operates with a pulsed Nd: YAG laser with output power per pulse of 59.5 mW at 1064 nm and a repetition frequency ranging between 5 and 7 kHz. The overlap between the telescope (mounted in biaxial configuration) and the laser beam is 90% complete between 555 and 855 m above ground level, according to the instrument datasheet, but Heese et al. [34] found that the complete overlap is located at 1500 m a.g.l. To improve this characteristic, a correction function was introduced to reduce the incomplete overlap producing a useful signal down to 232 m agl, where the laser beam divergence is 0.3 mrad and the telescope field of view, 0.45 mrad [36]. This overlap function has been successfully tested in previous works [33,35]. The ceilometer files for complete day are processed by means of the STRATfinder algorithm, available under the GNU General Public License v3.0 [25]. This recently developed algorithm estimates an auxiliary layer height that is tracked backwards in time from midnight to noon, then the Dijkstra algorithm [37] is applied to track MLH, ABLH and the mentioned auxiliary layer providing as output the estimations of the MLH and ABLH. A fast Fourier transform function is applied to exclude non-reliable estimations of MLH and ABLH from attenuated backscatter profiles. This also filters cases of rain, snow and low clouds, so these situations are excluded from the dataset. As it was mentioned in the introduction, ABLH estimations are more challenging during the evening decay of the mixed layer, so the algorithm assist in the identification by connecting individual paths merging the auxiliary layer and the preliminary ABLH to provide the final MLH and ABLH estimate for the whole 24 h period. The atmospheric vertical profiles are obtained from the backscattered signals with a temporal resolution of 15 s and a spatial resolution of 15 m, and averaged to 1 hour before stored in the database as daily files. For each day, the MLH at 16:00 was selected as representative height for that day. This allows a more reliable comparison among days than selecting the maximum value for each day, as it was tested in the data processing. The final dataset comprises a total of 1461 days between January 2020 and December 2023.

2.3. Methodology for Classification of Days Based on Meteorological Fields

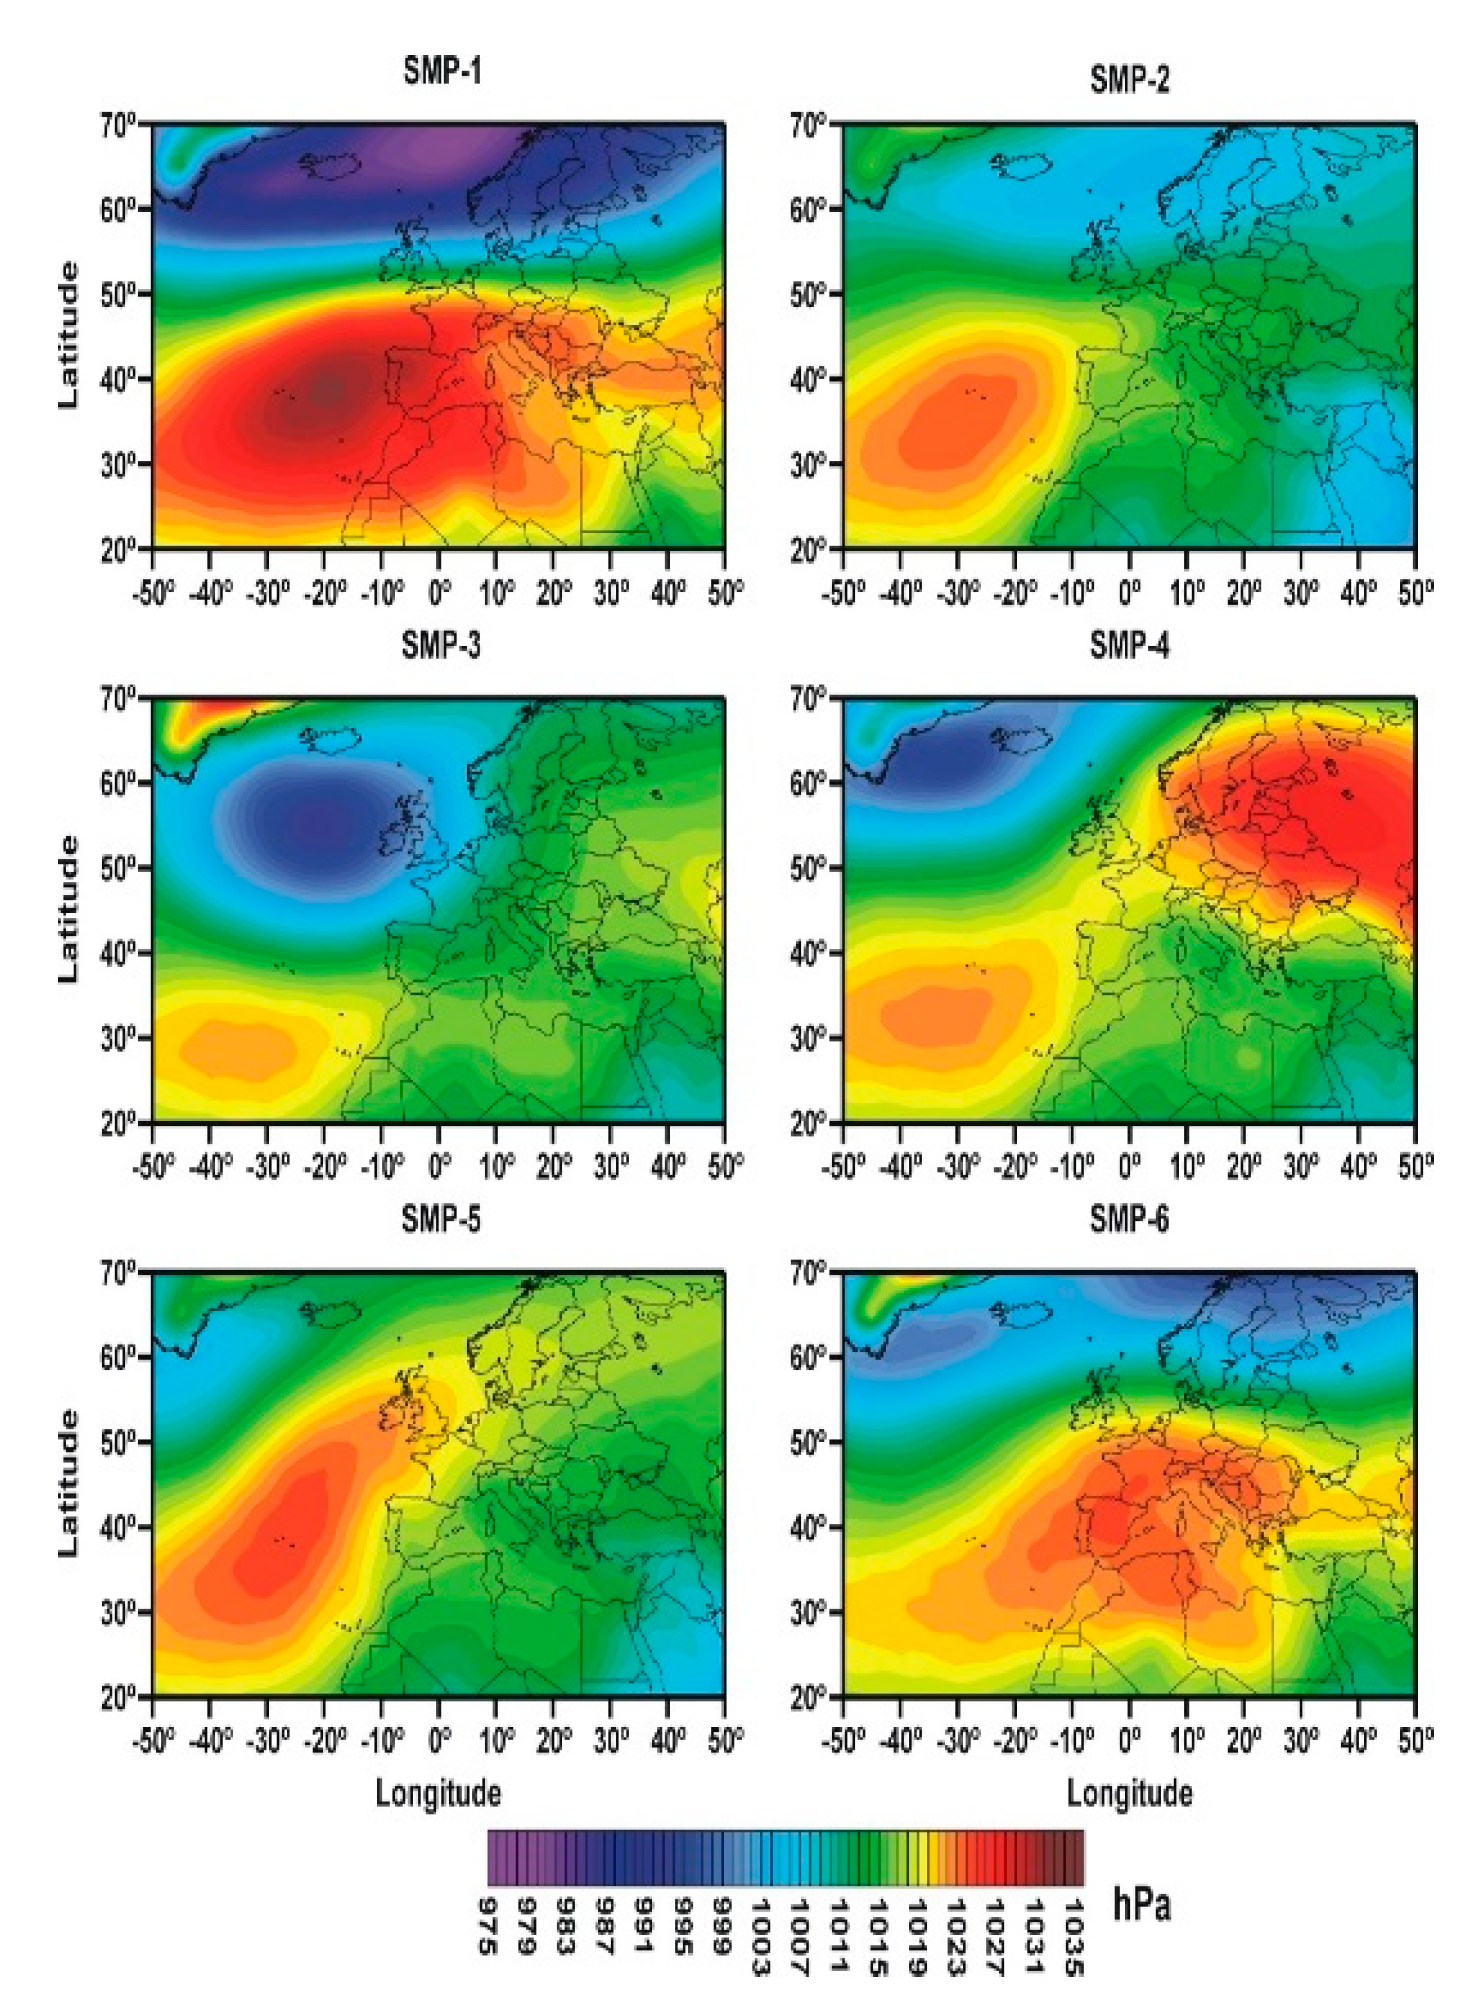
The most frequent synoptic meteorological patterns (SMPs) over the Iberian Peninsula were identified using sea level pressure (SLP) at 12 UTC over the period of 2001–2019 [38]. The non-hierarchical k-means cluster analysis was employed to assign each day to a specific SMP. The process consisted in 6 stages: Firstly, the reanalysis global fields of SLP for each day at 12 UTC were downloaded from the NCEP/NCAR (NOAA/OAR/ESRL PSD, Broadway Boulder, CO, USA) reanalysis dataset open access repository [40]. Then, the initial conditions were established selecting several k SLP fields, based on results concerning typical SMPs occurring in the western Mediterranean basin, which were obtained in previous studies. Thirdly, the Euclidean distance for the value of every grid point was calculated between each SLP data field and each k-cluster center was calculated and summed. The arithmetic mean of all their members, grid point by grid point provides new cluster centers, once every SLP data field was grouped into a specific cluster. Repeating this iteratively, a stable solution can be reached when each SLP field remains in its cluster from one iteration to the next. The results are composite maps representing the SMPs (see Figure 2) obtained by averaging all the SLP fields grouped into each cluster. The final number of clusters (k) was selected using variance plots. As a validation procedure, a complete dataset of parameters were analyzed for assuring the physical meaning of the SMPs. Measurements of meteorological variables performed in an instrumented tower, atmospheric stability parameters from numerical models and radiosondes were employed, which characterize the daily meteorological situation at the surface level in the central region of the Iberian Peninsula. This procedure provides physical meaning to the six different and realistic SMPs over the Iberian Peninsula. This classification have already been used in former studies to evaluate the influence of atmospheric conditions on airborne allergenic pollen and spores in Barcelona [40] and on the temporal evolution of the mixing layer over Madrid determined by different methods [41]. For this study, the classification can be applied to the period 2020-2023, assigning each day to a specific SMP for the subsequent analysis of the estimation of the ABLH,

2.4. Identification of Saharan Dust Events

The occurrence and duration of Saharan dust episodic days over the Iberian Peninsula was determined by a robust method based on four different components. Firstly the daily interpretation of air mass back trajectories computed by the HYSPLIT model [42], secondly, synoptic meteorological charts, thirdly, maps of aerosol index of Ozone Monitoring Instrument-OMI and NASA SeaWiFS images and finally, three dust forecast models outputs, namely: SKIRON-University of Athens (http://forecast.uoa.gr), MONARCH-Barcelona Supercomputing Center (https://dust.aemet.es/products/daily-dust-products) and NAAPS-Naval Research Laboratory (NRL), Monterey, CA (http://www.nrlmry.navy.mil/aerosol/). Once this episodic days are identified, the dust contribution to the PM10 daily records can be quantified performing an statistical analysis of the time series of PM10 values registered at regional background monitoring sites, classifying the intensity of the dust episodic day by their dust contribution levels. Different approaches has demonstrated the feasibility of this method [43] and nowadays is the Spanish and Portuguese reference method to identify and quantify African dust contributions to PM10 levels since 2004. Currently, this is one of the official methods recommended by the European Commission for evaluating the occurrence of African dust intrusions and quantifying its contributions [44]. In this work the African dust events were also separated by dust load (concentration of dust in the PM10 fraction registered at the rural background station “El Atazar” (Air Quality Network of the Madrid Region: https://gestiona.comunidad.madrid/azul_internet/run/j/AvisosAccion.icm during Saharan dust episodic days) considering clean days those without contribution of dust from the Sahara, low dust days those with concentration below the median plus half the standard deviation of the series, that yields a value of 30 µg/m3, and the high dust days are those above that concentration.

3. Results

3.1. Daily Evolution of the ML, Quicklooks and STRATfinder Estimations

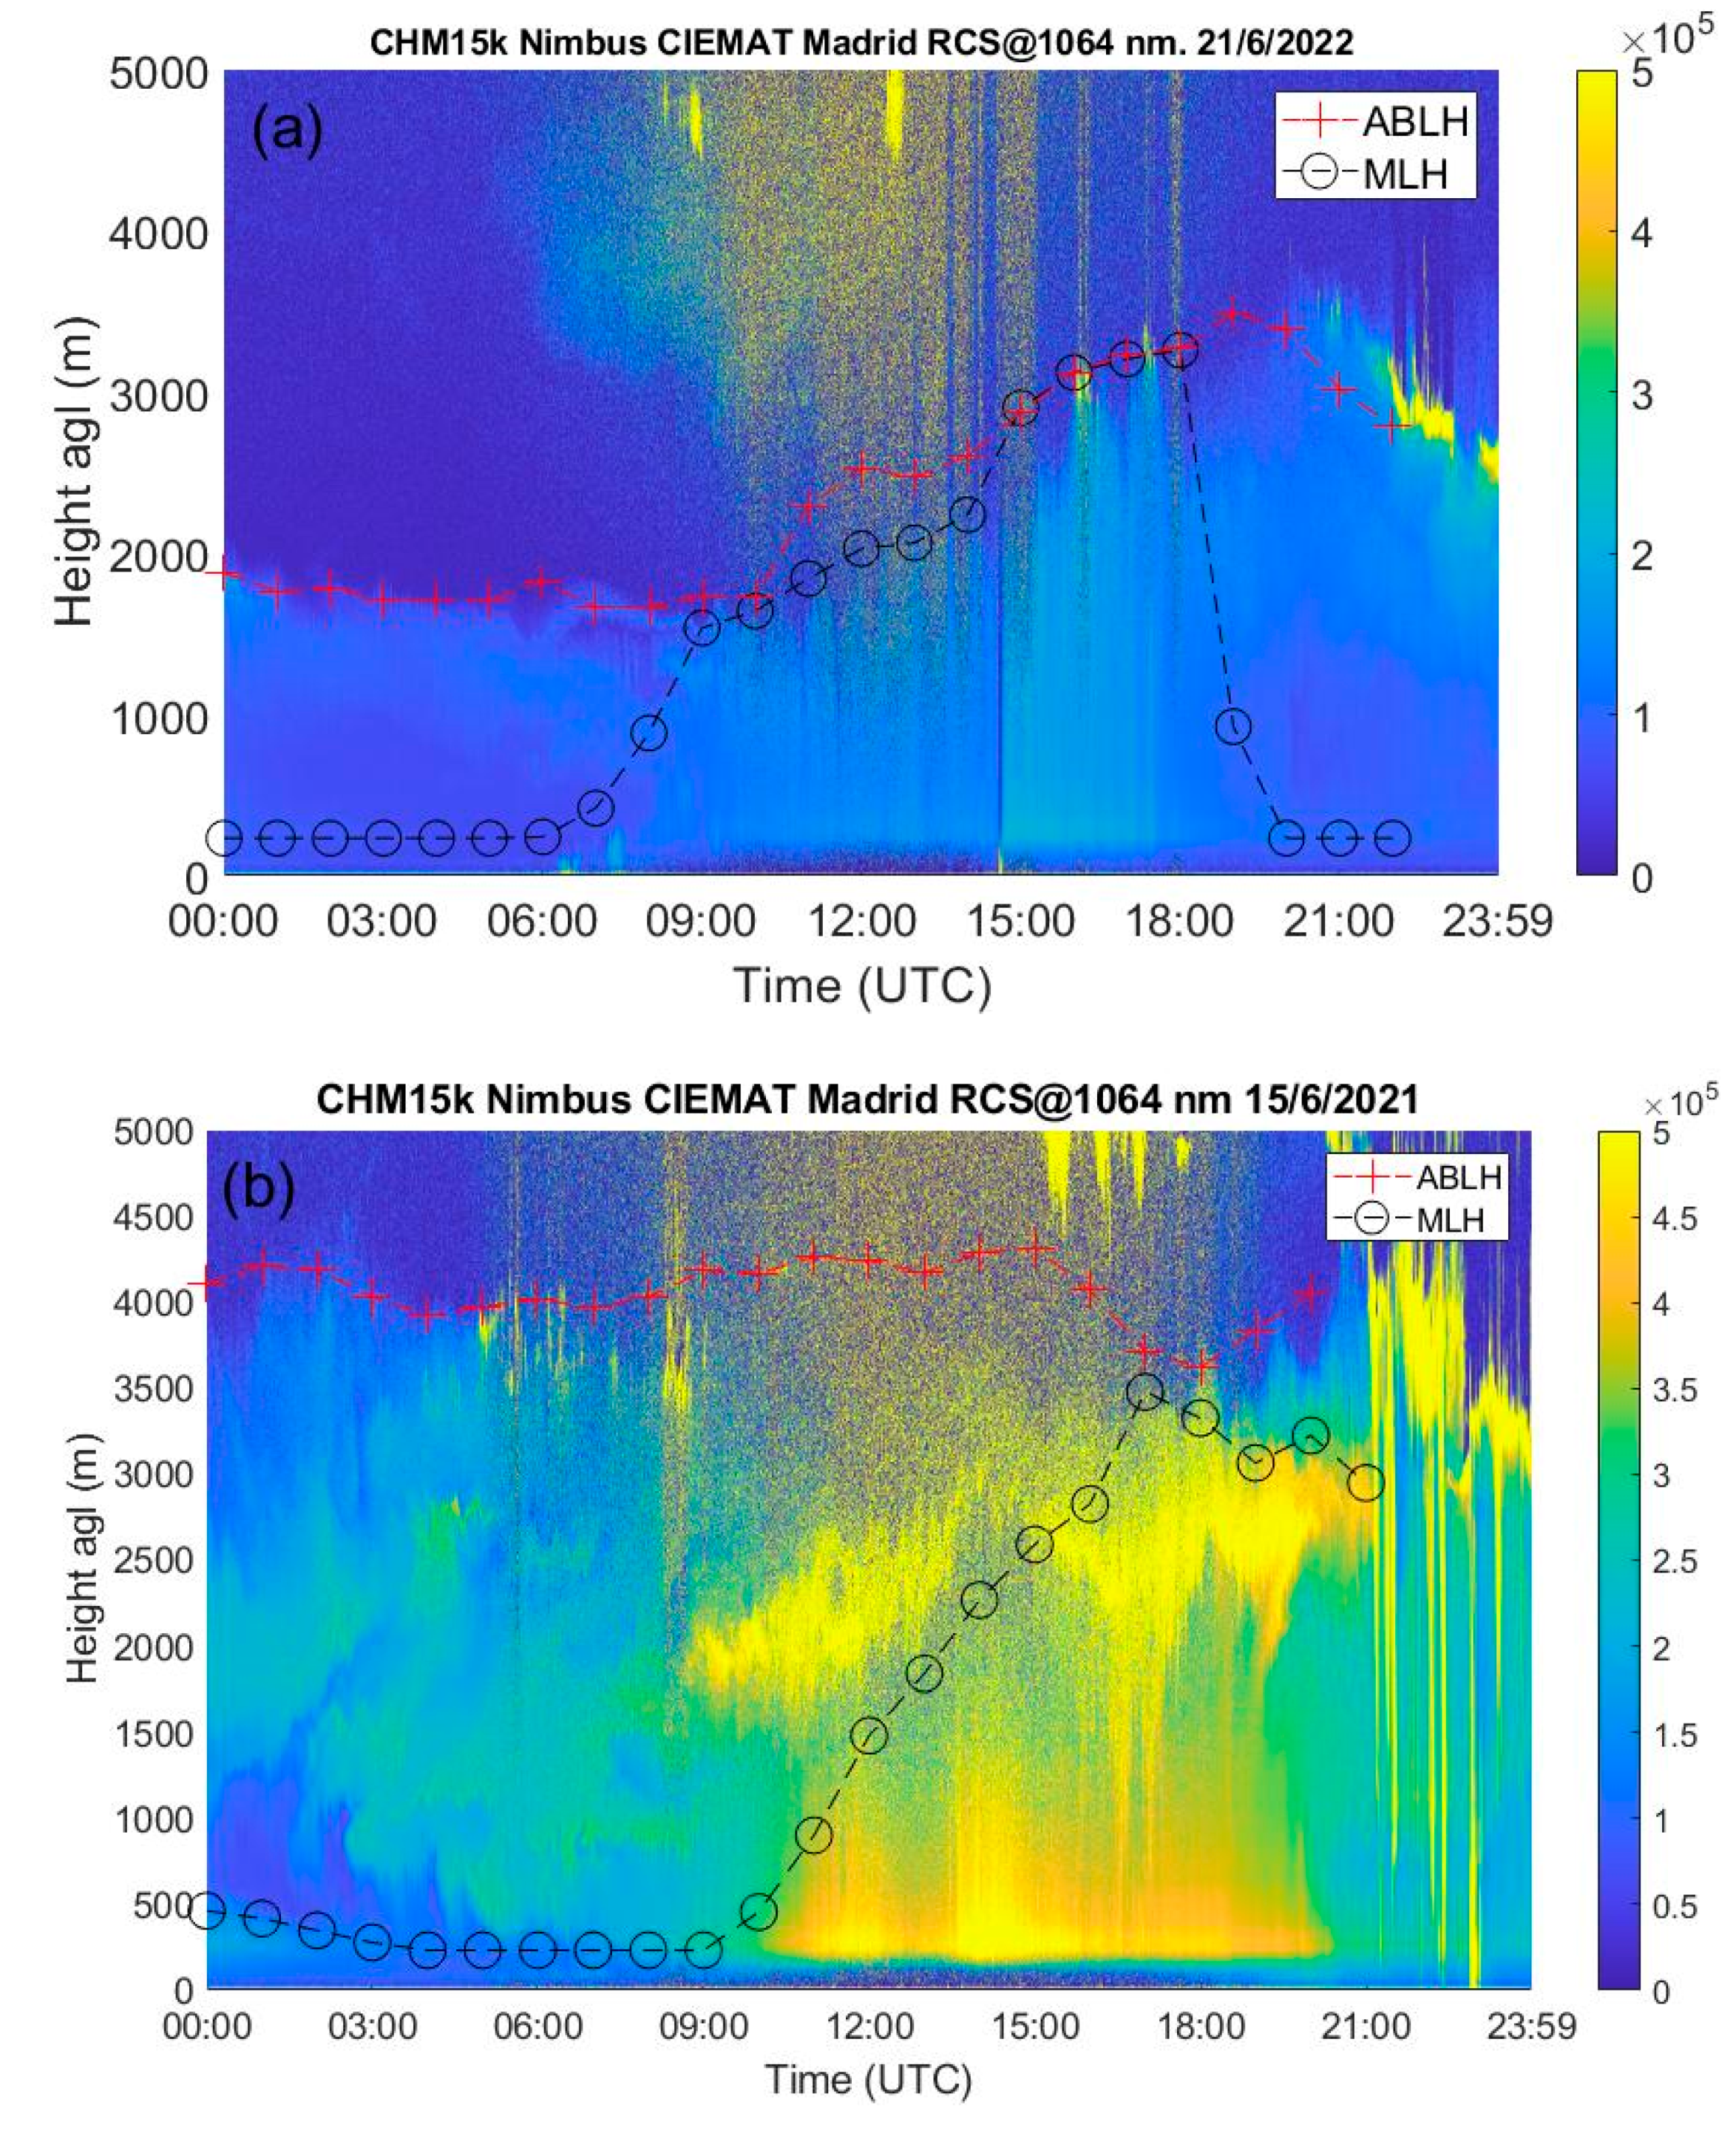
Figure 3 shows two cases as example of the STRATfinder estimations. Figure 1a shows a usual daily evolution case, occurred in 21 June 2022. The MLH (black circles) shows low values during the night and part of the morning, close to the minimum (232 m agl). During the same period, the ABLH (red crosses) reaches 1.8 km and is detected at the layer edge between the ABL and the free troposphere, indicating the residual layer from the previous day. The convection starts at sunrise (5:59 am), observable in the figure as vertical cyan lines along the day, detecting the strong upward movement of airmasses, up to 3 km at 18:00, just before sunset. Both estimations, MLH and ABLH are equal at 10:00, indicating a complete growth of the ML over the RL, although later on, the algorithm estimates lower MLH from 11:00 to 15:00, probably due to some inner structure in the aerosol layer. The agreement remains between 15:00 and 17:48, sunset time. After that time, the algorithm identify the MLH as the first detected layer close to the ground, meanwhile the ABLH tracks the residual layer that slowly transitions into the next day. Such daily evolution occurs consistently on clear-sky days, especially in summer. As it was mentioned in section 2.2, the MLH at 16:00 will be selected for this day, in this case, close to the maximum and in coincidence with the ABLH.
Figure 3b shows a case with a strong Saharan dust intrusion arriving at the site. As it can be seen, the daily evolution is different, with a large ABL, reaching up to 4 km, and a ML showing a delayed development during the morning, caused by the effect of the dust-rich airmass over the radiation that reach the surface and also over the meteorological conditions. Aloft aerosol-rich layers are observed between 9:00 and 21:00 from 2 to 3 km , with clouds at the end of the day located at 4 km, on top of the ABL. For this day, the selected MLH at 16:00 reached lower value than the ABLH due to the effect of the aloft dust-rich layer. The study of this influence of the presence of Saharan dust on the MLH is the main aim of this work, so the database have been discriminated between days with Saharan dust influence and clean days.

3.2. ML Heights Estimation for 2020– 2023

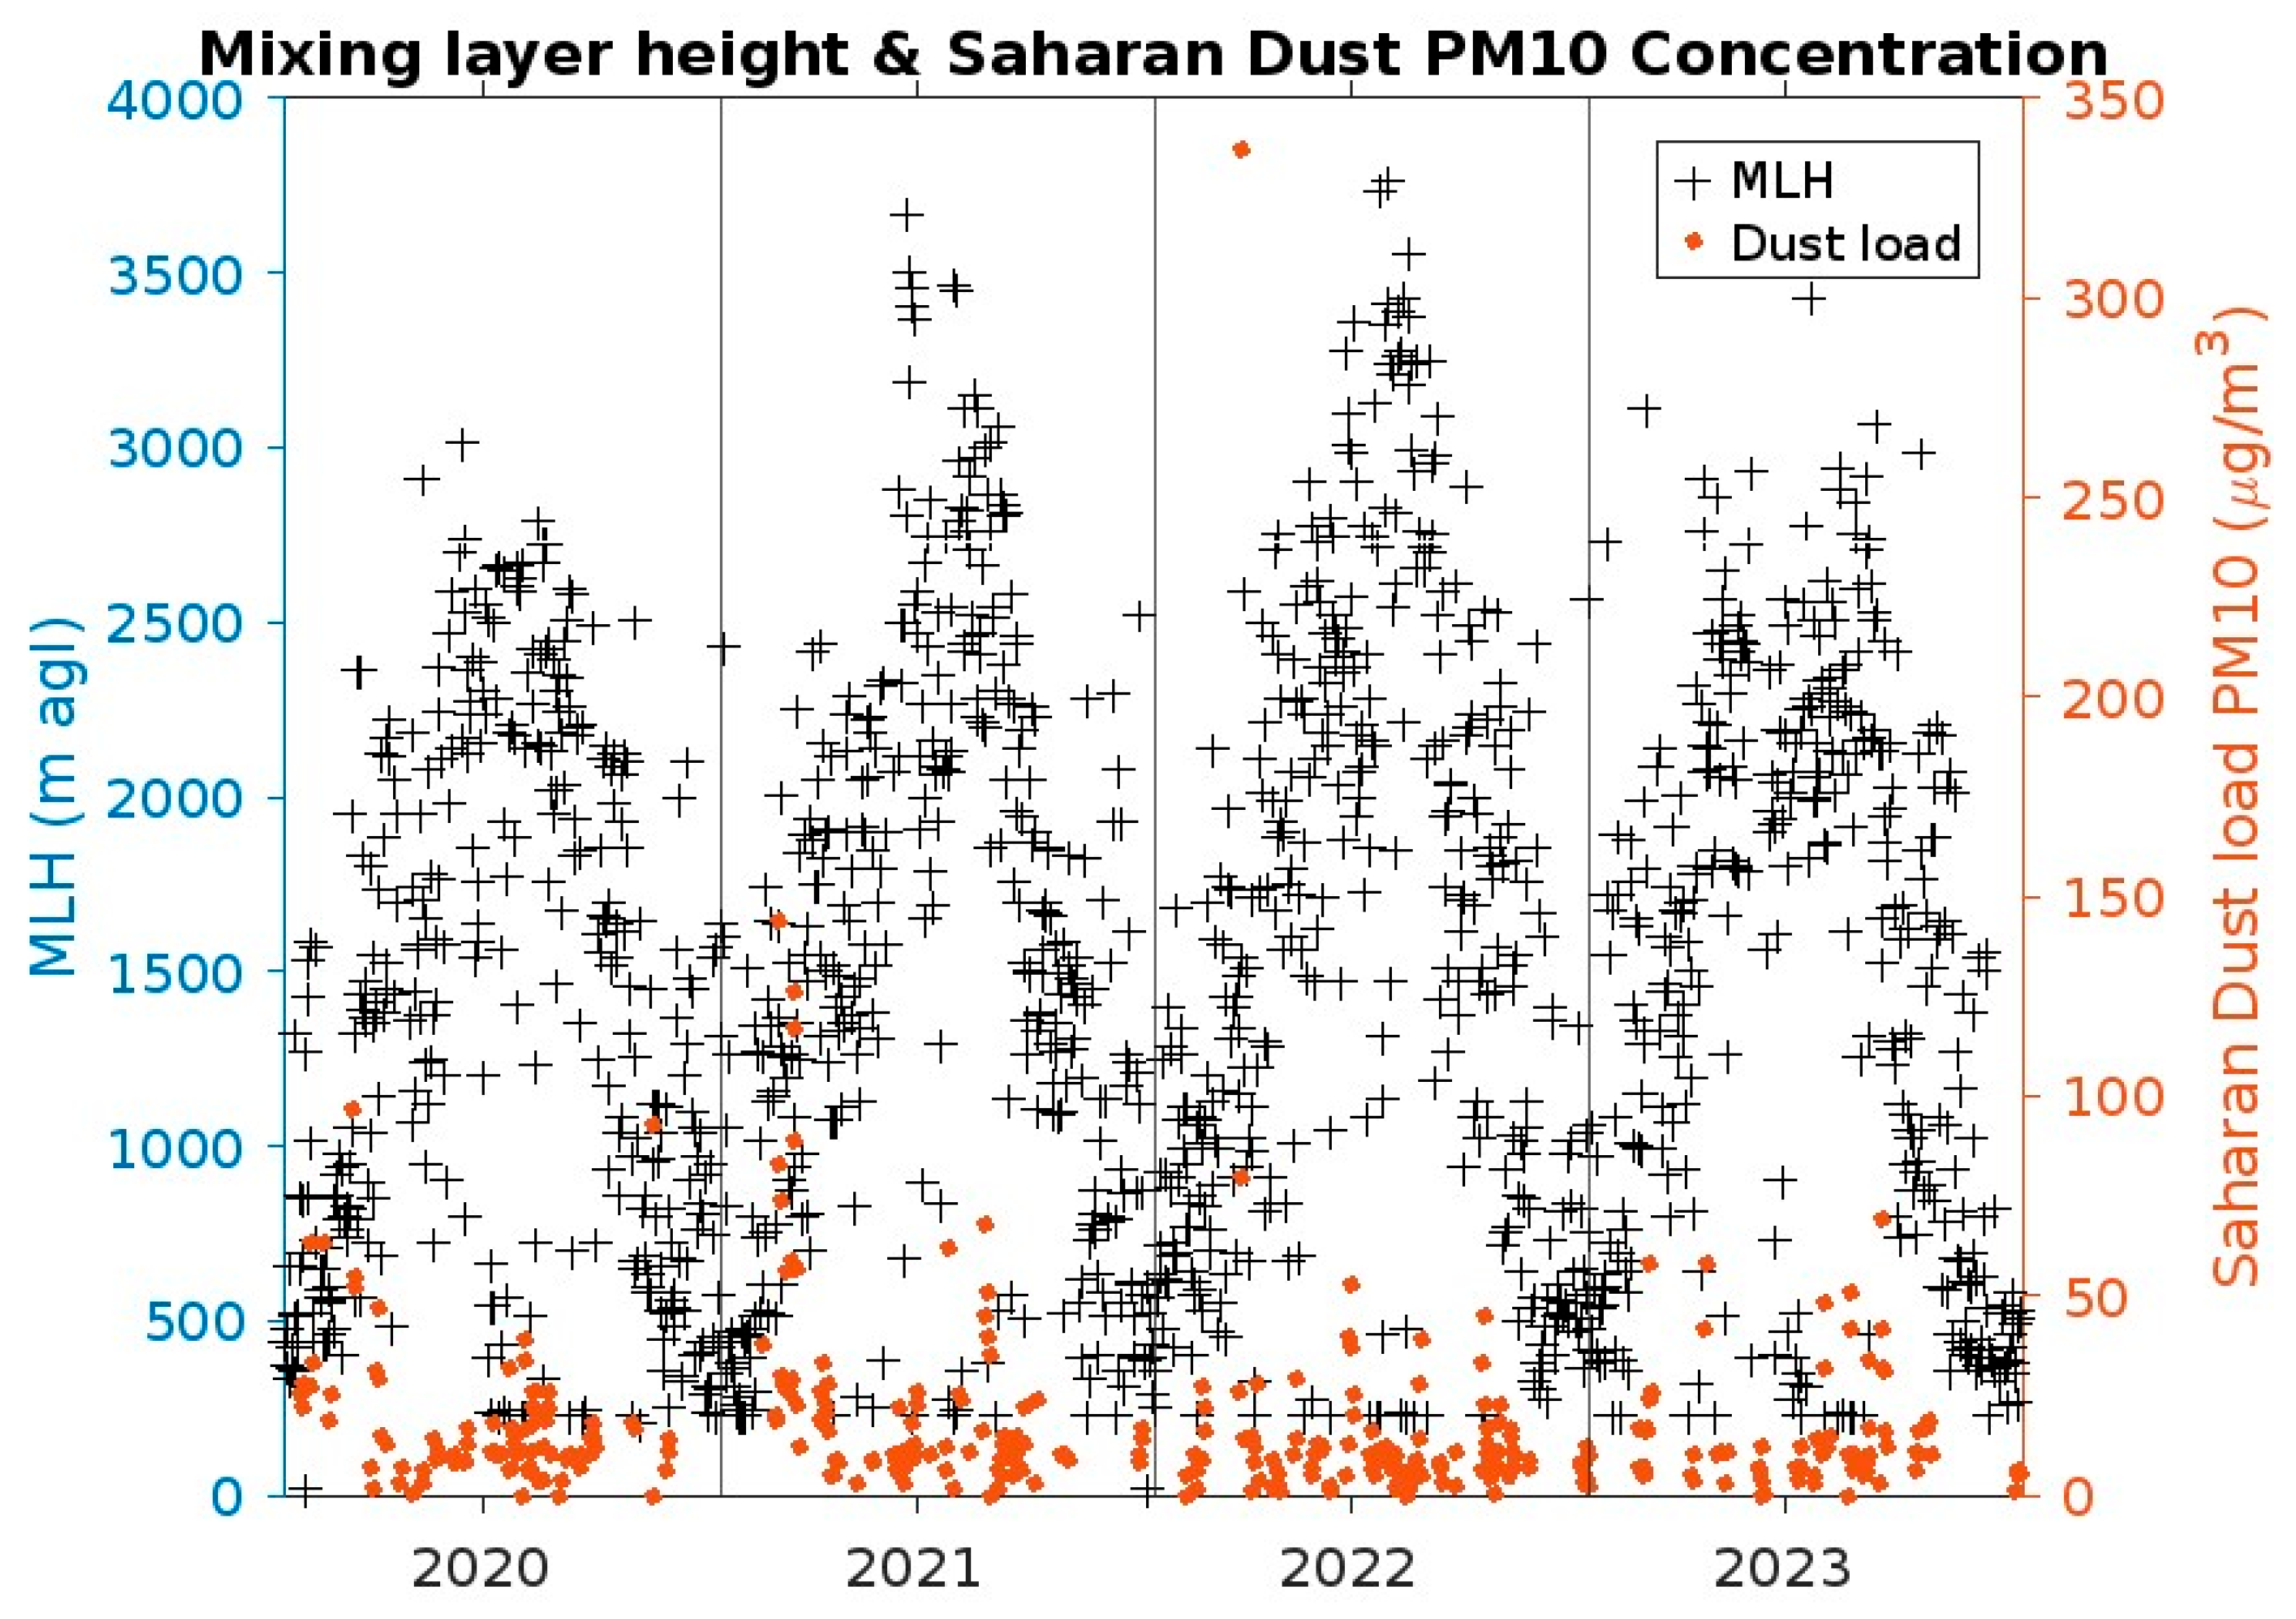
Figure 4 shows all the data, both MLH (black crosses, left axis) and daily dust loads (orange circles, right axis) for the four years studied (2020 - 2023). Several features can be observed, namely a clear seasonal behavior of the MLH along the four years, with maxima in summer, around 4 km, and minima in winter, less than 300 m and with a large variability. Development of Saharan dust episodes show the same seasonal behavior, with the highest number of episodic days in summer (40% of the total) and the lowest in winter (16% of the total). Finally, 361 days of the period 2020-2023 were categorized as Saharan dust episodic days (25% of the total). On average, daily dust load reach 18.1 µg/m3 along the study period with the highest mean values registered in winter (24.4 µg/m3) and spring (21.2 µg/m3). This is mainly a consequence of the occurrence of intense episodes with very high dust load, higher than 100 µg/m3 and even reaching 340 µg/m3 on Feb 2022, occurring in February and March. Considering the threshold value of 30 µg/m3 of daily dust load, the database identify 50 high and 311 low Saharan dust episodic days. Such discrimination will allow a more detailed study of the influence of Saharan dust, as it will be explained below.
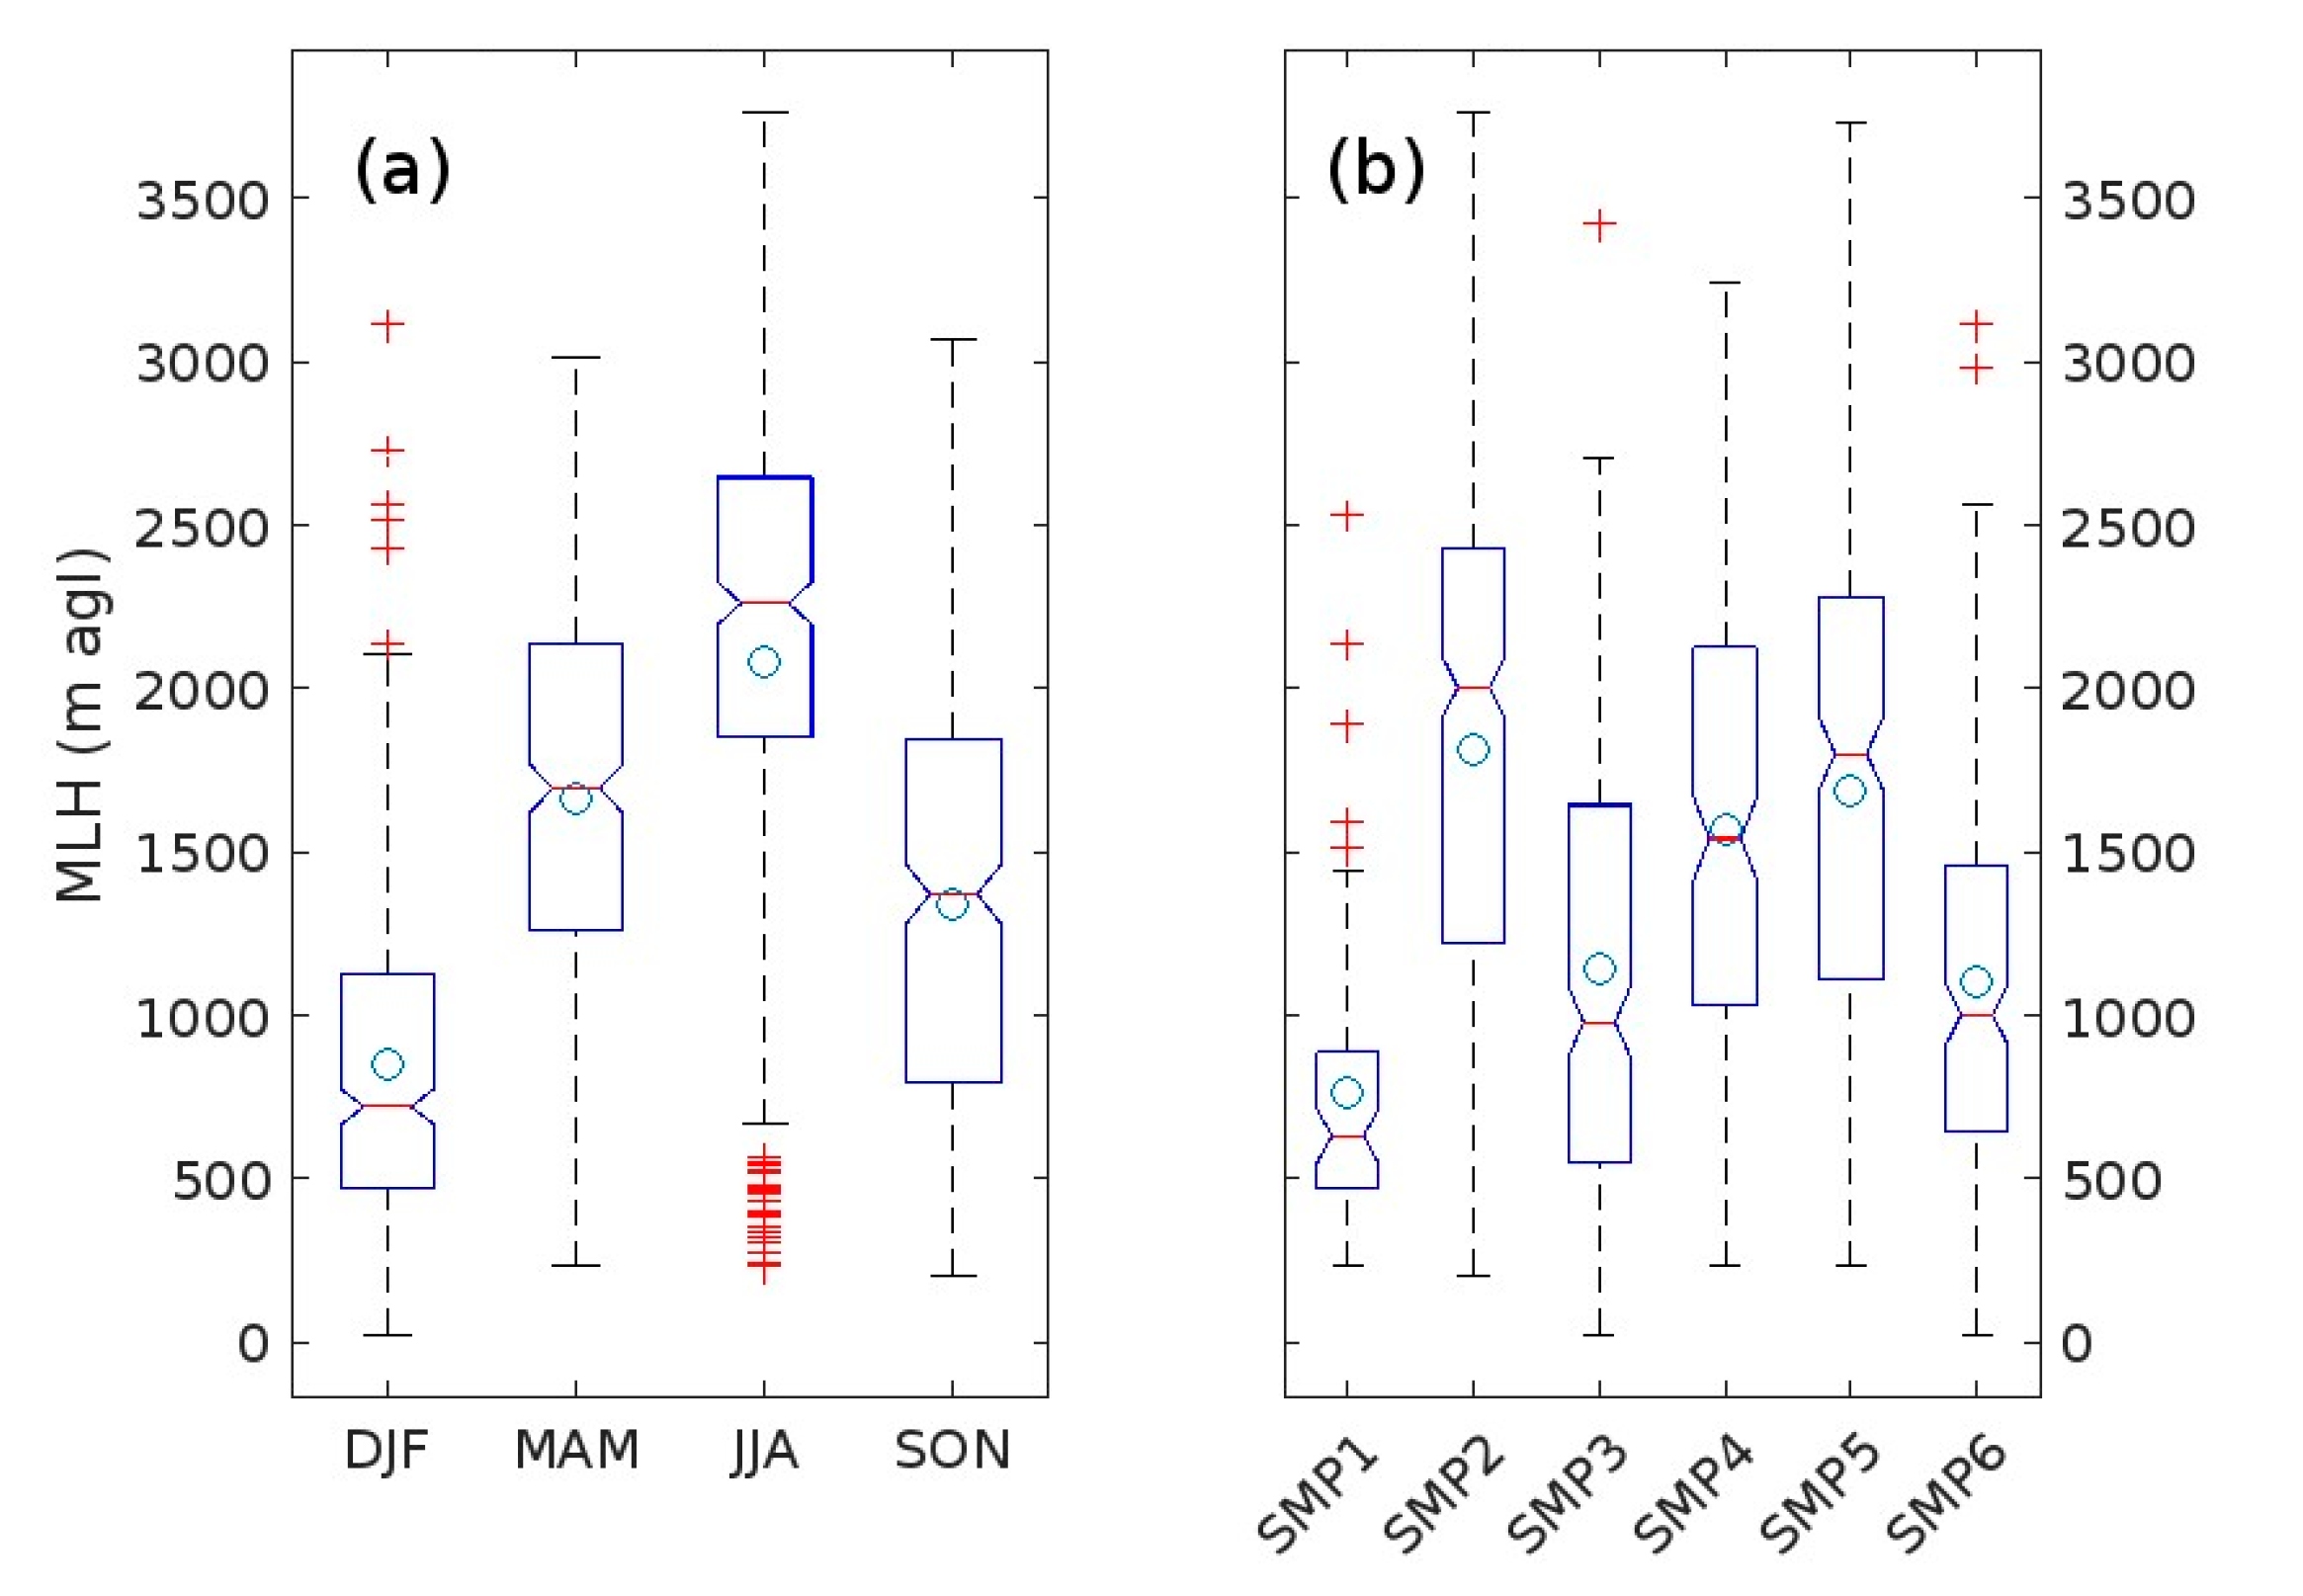
A first analysis of the complete database (all days considered) shown in Figure 4 was attempted separating by season. The results, plotted as boxplot graph (Figure 5), show median MLH values of 721 ± 502, 1694 ± 628, 2262 ± 875 and 1371 ± 638 m for winter (DJF), spring (MAM), summer (JJA) and autumn (SON) respectively, quantifying the seasonal effect mentioned before. The season are selected using complete months, corresponding winter to December, January and February, or DJF, spring to March, April and May, or MAM, summer to JJA and autumn to SON:
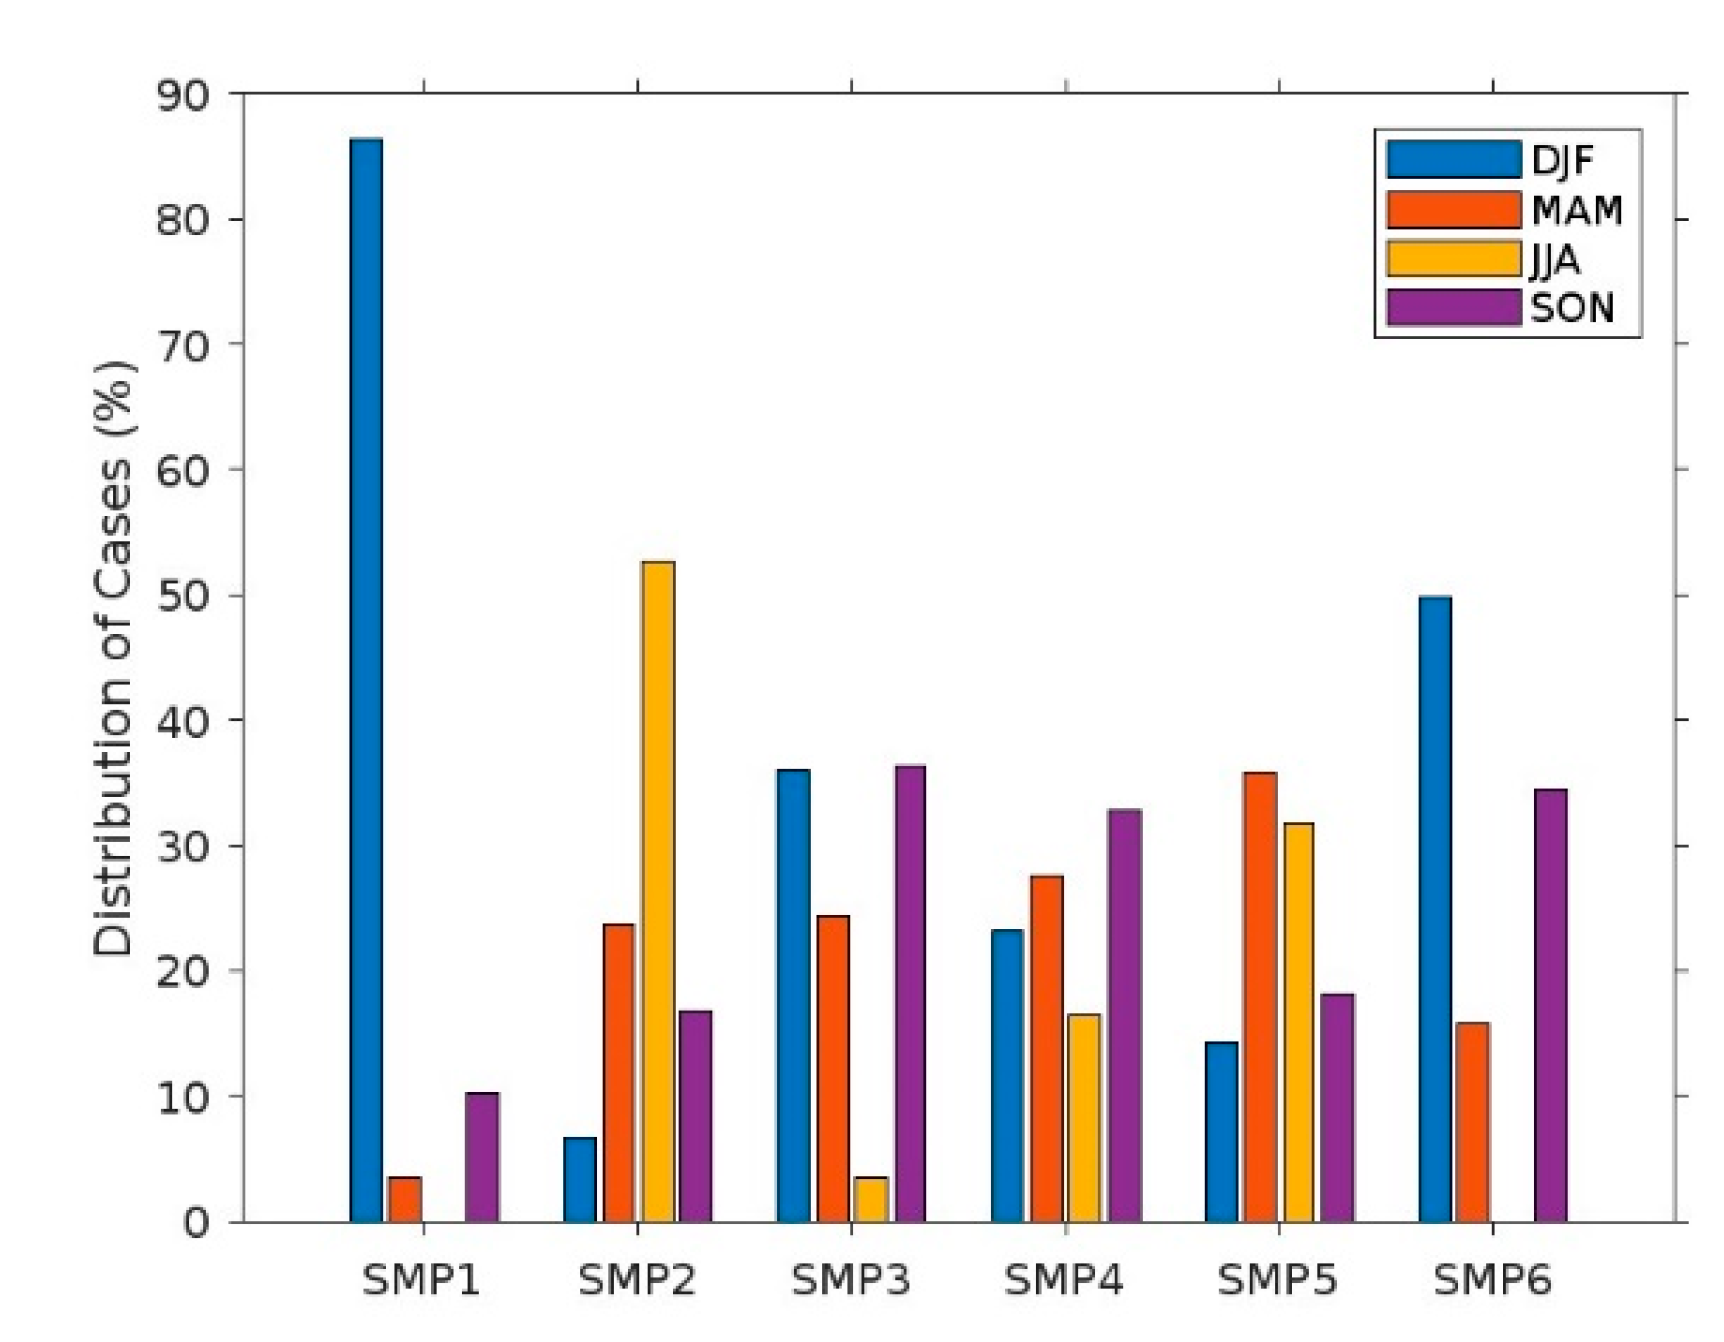
More detailed analysis can be accomplished by classifying days by the synoptic meteorological patterns, as explained in the methodology section 2.3. Figure 5b shows that the highest MLH corresponds to SMP2 (2004 ± 866 m), that mainly occurs in summer (53% of cases), while the lowest MLH correspond to SMP1 (630 ± 460 m) a clear winter type (86%), without cases in summer. The other synoptic patterns show a similar trend, with the next lowest cases corresponding to SMP6 (1002 ± 593 m), the other main pattern for winter (50%), while the other three show increasing MLH with the frequency of their cases in summer (SMP3: 980 ± 677 m (3% of cases in summer), SMP4: 1541 ± 721 m, 16% and SMP5: 1802 ± 804 m, 32%).
In order to characterize the different SMP, the distribution of cases for each season respect to the SMP are represented in Figure 6. The number of cases are converted into frequency by dividing them for each season by the total number of cases assigned to that SMP. As it can be seen in the figure, a clear representation of SMP1 cases in winter (86%) and none in summer, and a strong representation of cases of SMP2 in summer (53%) and less in the other seasons. As summary, it can be indicated that SMP1 and SMP6 are typical winter patterns, while SMP2 is the most frequent summer pattern, with decreasing presence of summer cases and increasing cases of spring cases in SMP5, 4 and 3 respectively. This distribution of cases will be employed later in the interpretation of the results obtained.

3.3. Effect of Saharan Dust Intrusions on MLHs

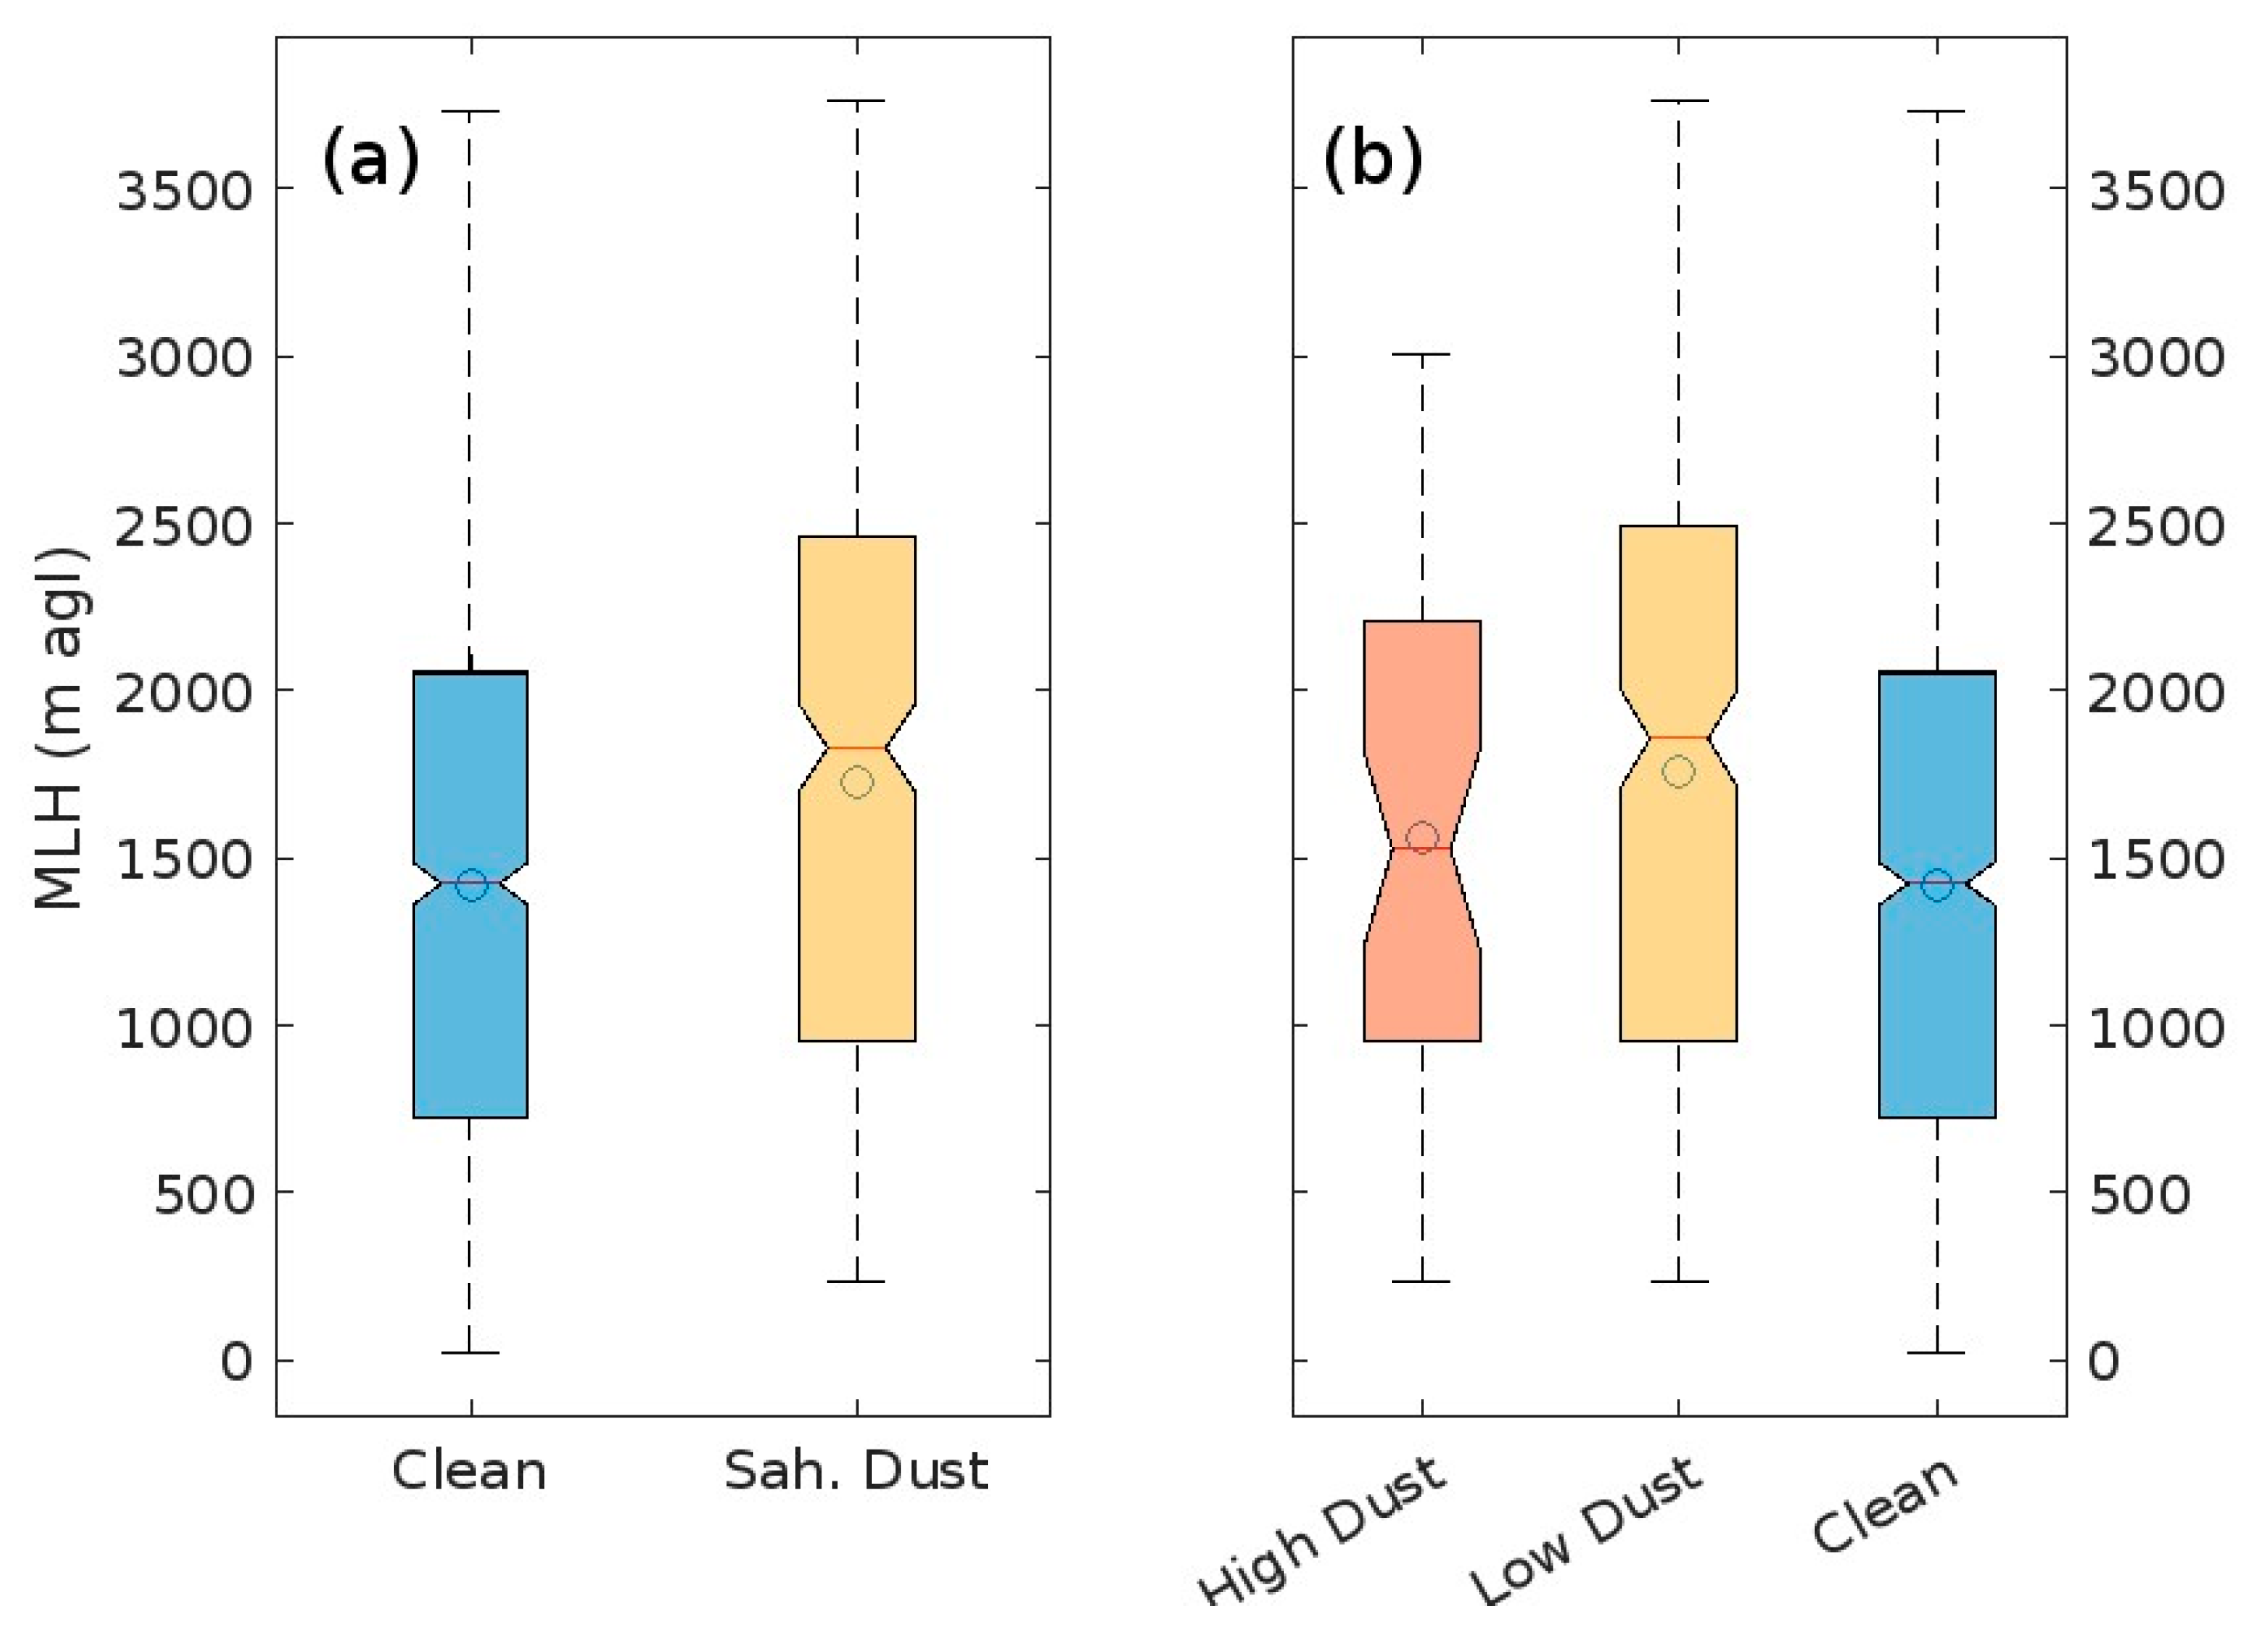
Regarding the occurrence Saharan dust intrusions, higher MLH is usually observed on those days. This effect can be produced by both the seasonal trend of the episodes and the effect of dust-rich layers over the site. This mixed contribution is difficult to disentangle. As it can be seen in Figure 6, when all cases for the complete four years database are analysed separating by type of day (Clean day or Saharan dust intrusion days) using the methodology explained in section 2.4, a median MLH of 1423 ± 773 m were determined during clean days, and the value increases to 1830 ± 910 m during Saharan dust intrusions (Figure 7a). This increase can be observed systematically in the ABLH, but the behavior of the MLH shows a counter-intuitive feature when the Saharan dust episodes are separated by high and low dust loads. As it can be seen in Figure 7b, high dust load cases, those with ground-level dust concentration higher than 30 µg/m3, as it was explained in section 2.4, produce a lower MLH (1526 ± 876 m) than low dust load cases (1858 ± 914 m). This feature is difficult to explain, so a detailed analysis have been performed.
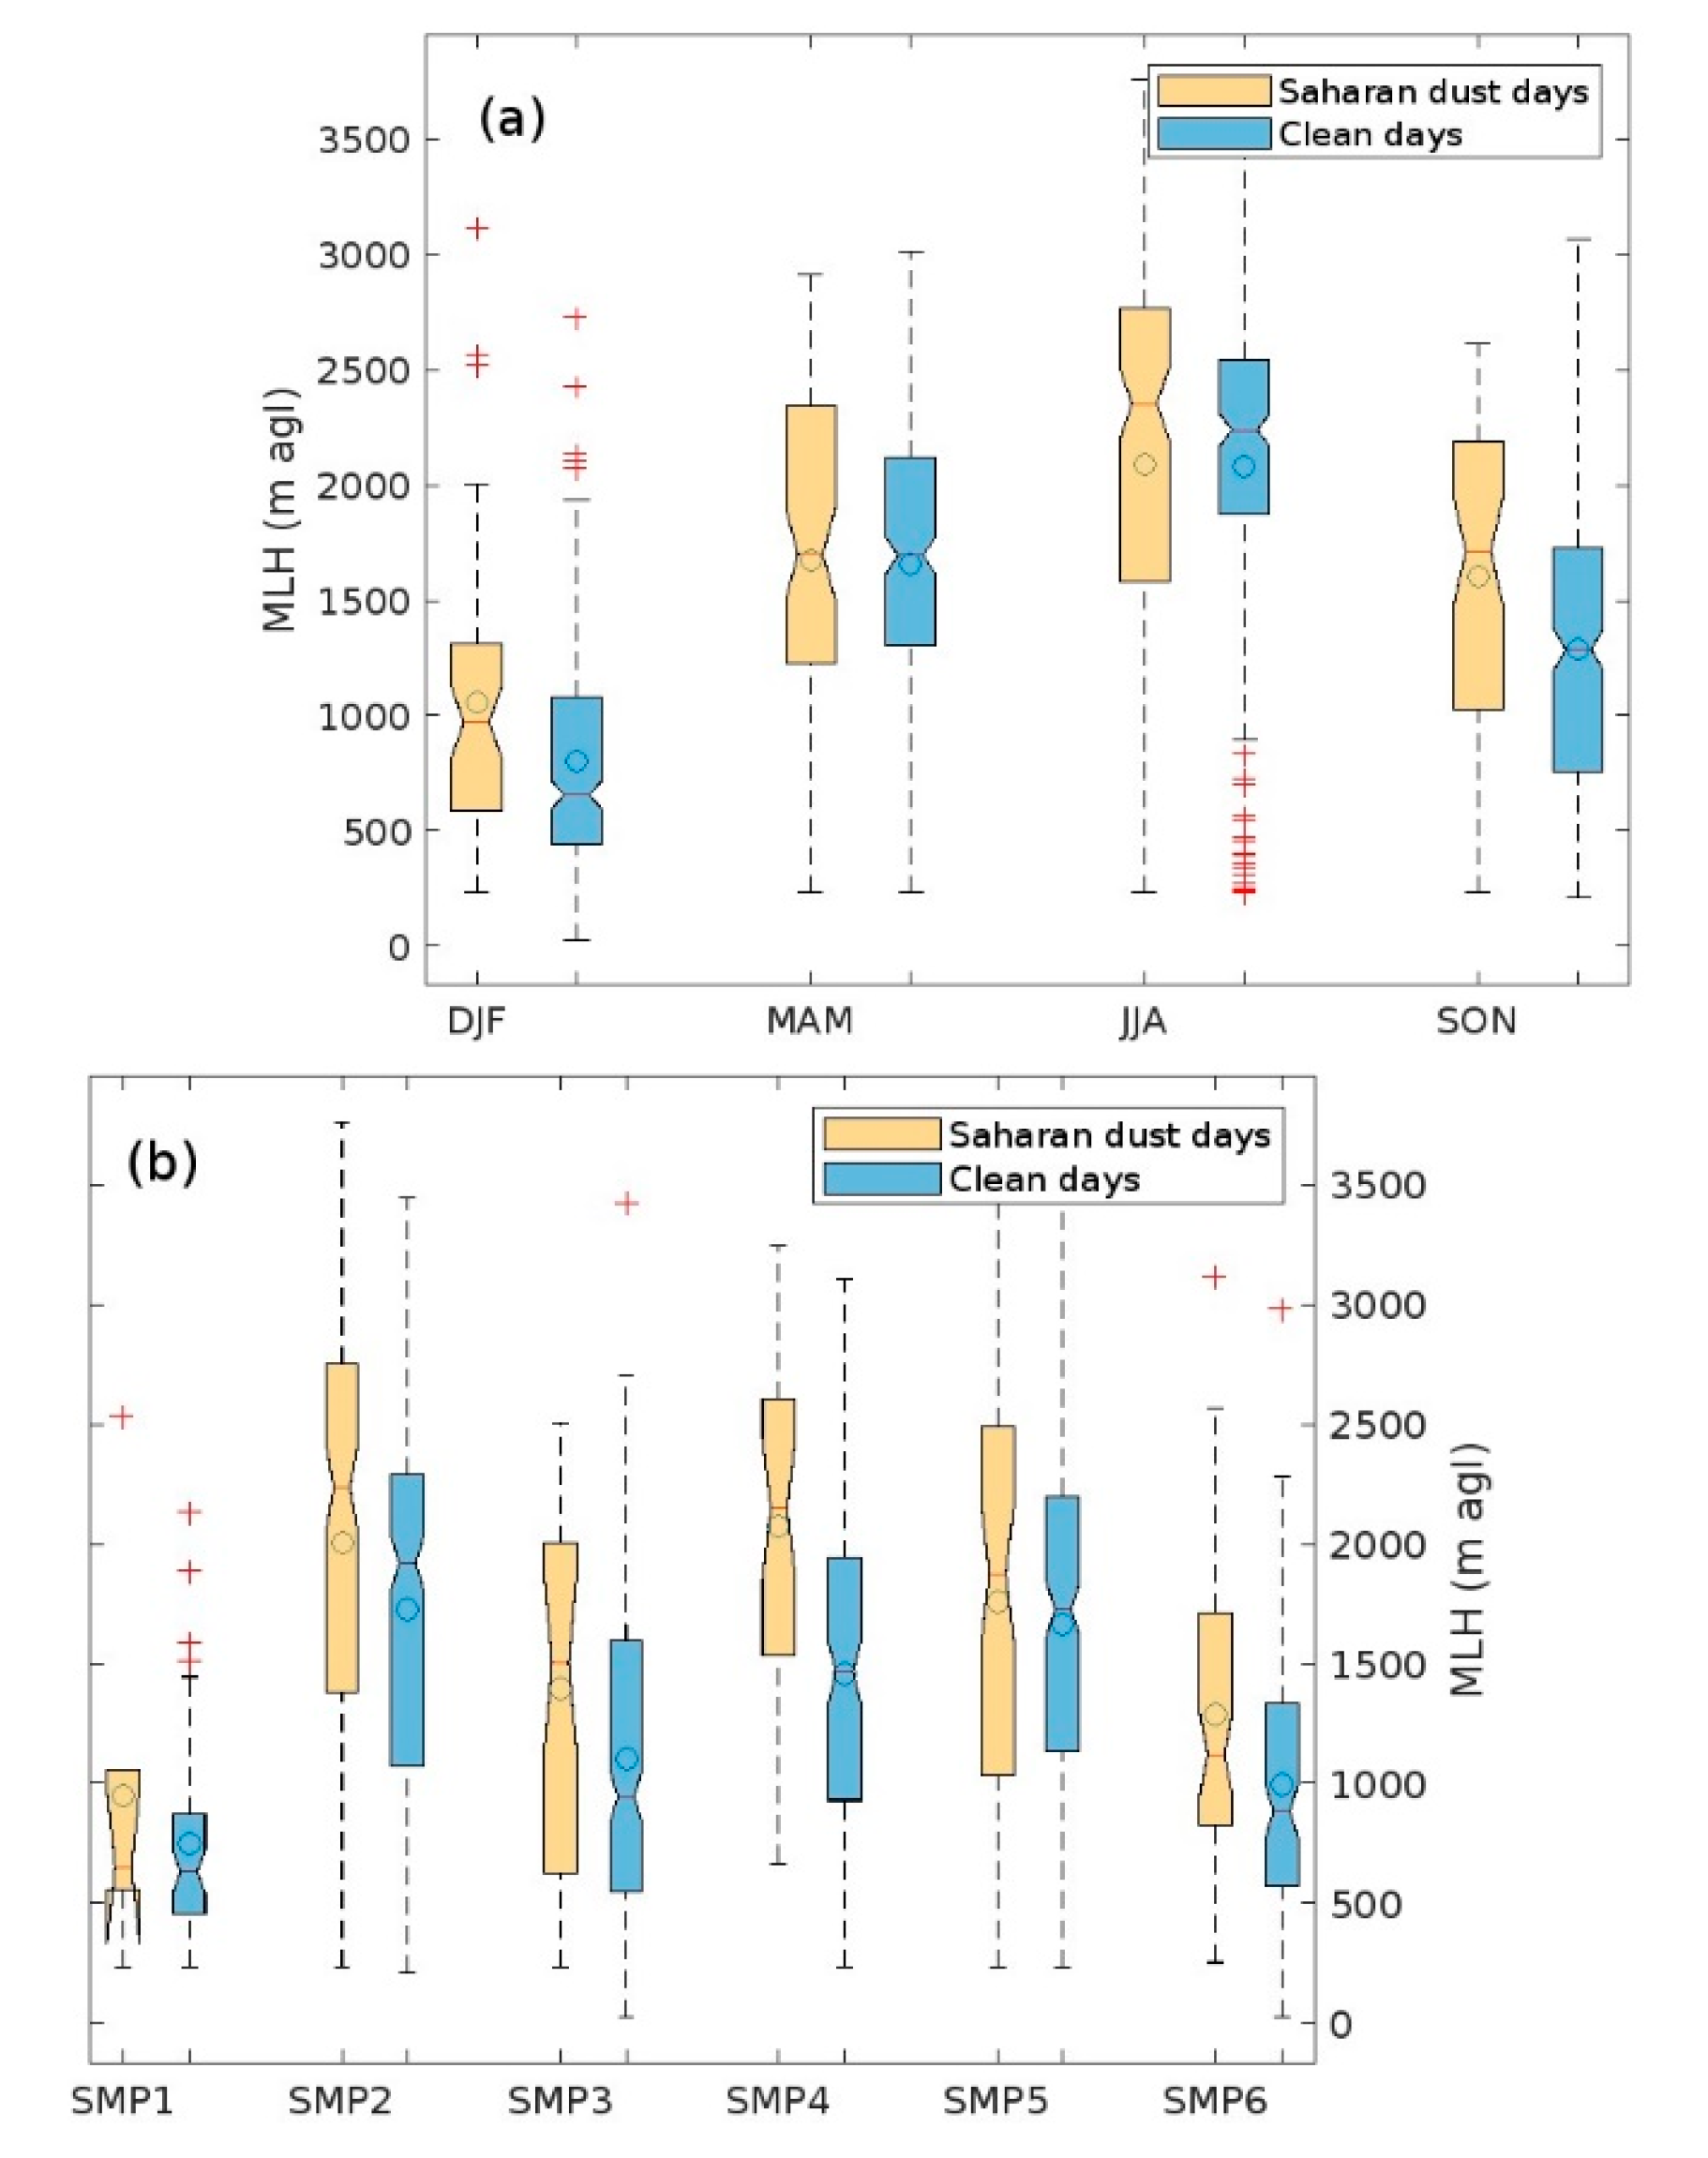
Firstly, the cases has been analysed only by the identification of Saharan dust days or clean days. Figure 8a shows that Saharan dust days occur in all season, with a pronounced effect over the MLH in autumn, with a mean difference of 427 m. These differences are smaller for winter (315 m), summer (114 m) and spring (6 m). The same study can be perfomed using the SMPs for classification, as shown in Figure 8b. In this case, the main differences are related with the prevalence of some SMPs for occurring in autumn (SMP4: 685 m & SMP3: 558 m), so no advantage is obtained in this season by using the synoptic situations. On the other hand, the differences are very small for one of the winter related cases (SMP1: 20 m) but large for the other (SMP6: 238 m), indicating that the SMP6 pattern is largely affected by Saharan dust intrusions. For the SMP2 cases, the difference is 315 m, so this pattern is also influenced by Saharan dust intrusions.
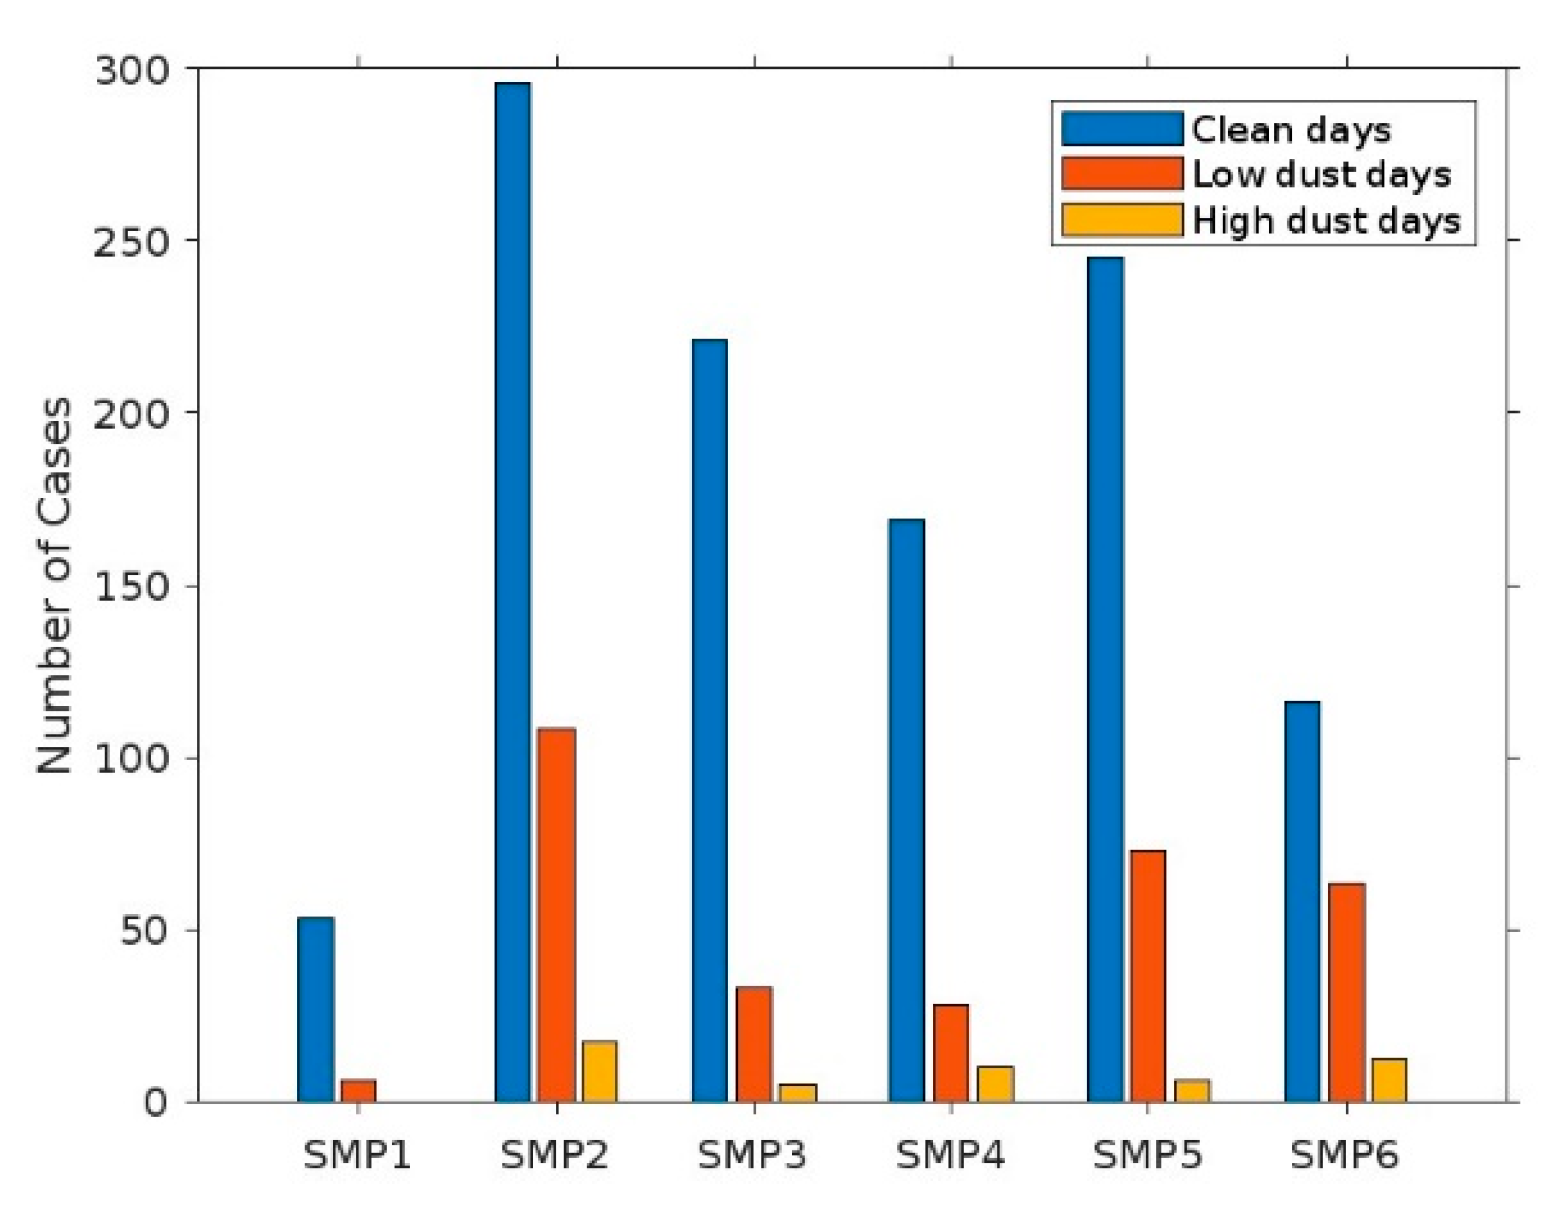
Figure 9 shows the distribution of clean, low and high dust cases for the six synoptic patterns. As it can be observed, the maximum number of days corresponds to clean days (296 days) for the SMP2, with 108 days of low dust load and 17 days of high dust load for that SMP. For SMP1, no high dust load days occurred in the four years studied, but it happens in SMP6 (12 days), the other prevalent winter case. For SMP3, SMP4 and SMP5, high dust load days were 5, 10 and 6 respectively, therefore, the results obtained using this strategy may be affected by the low High dust cases and the analysis will be more robust if the study is extended to longer period of time.
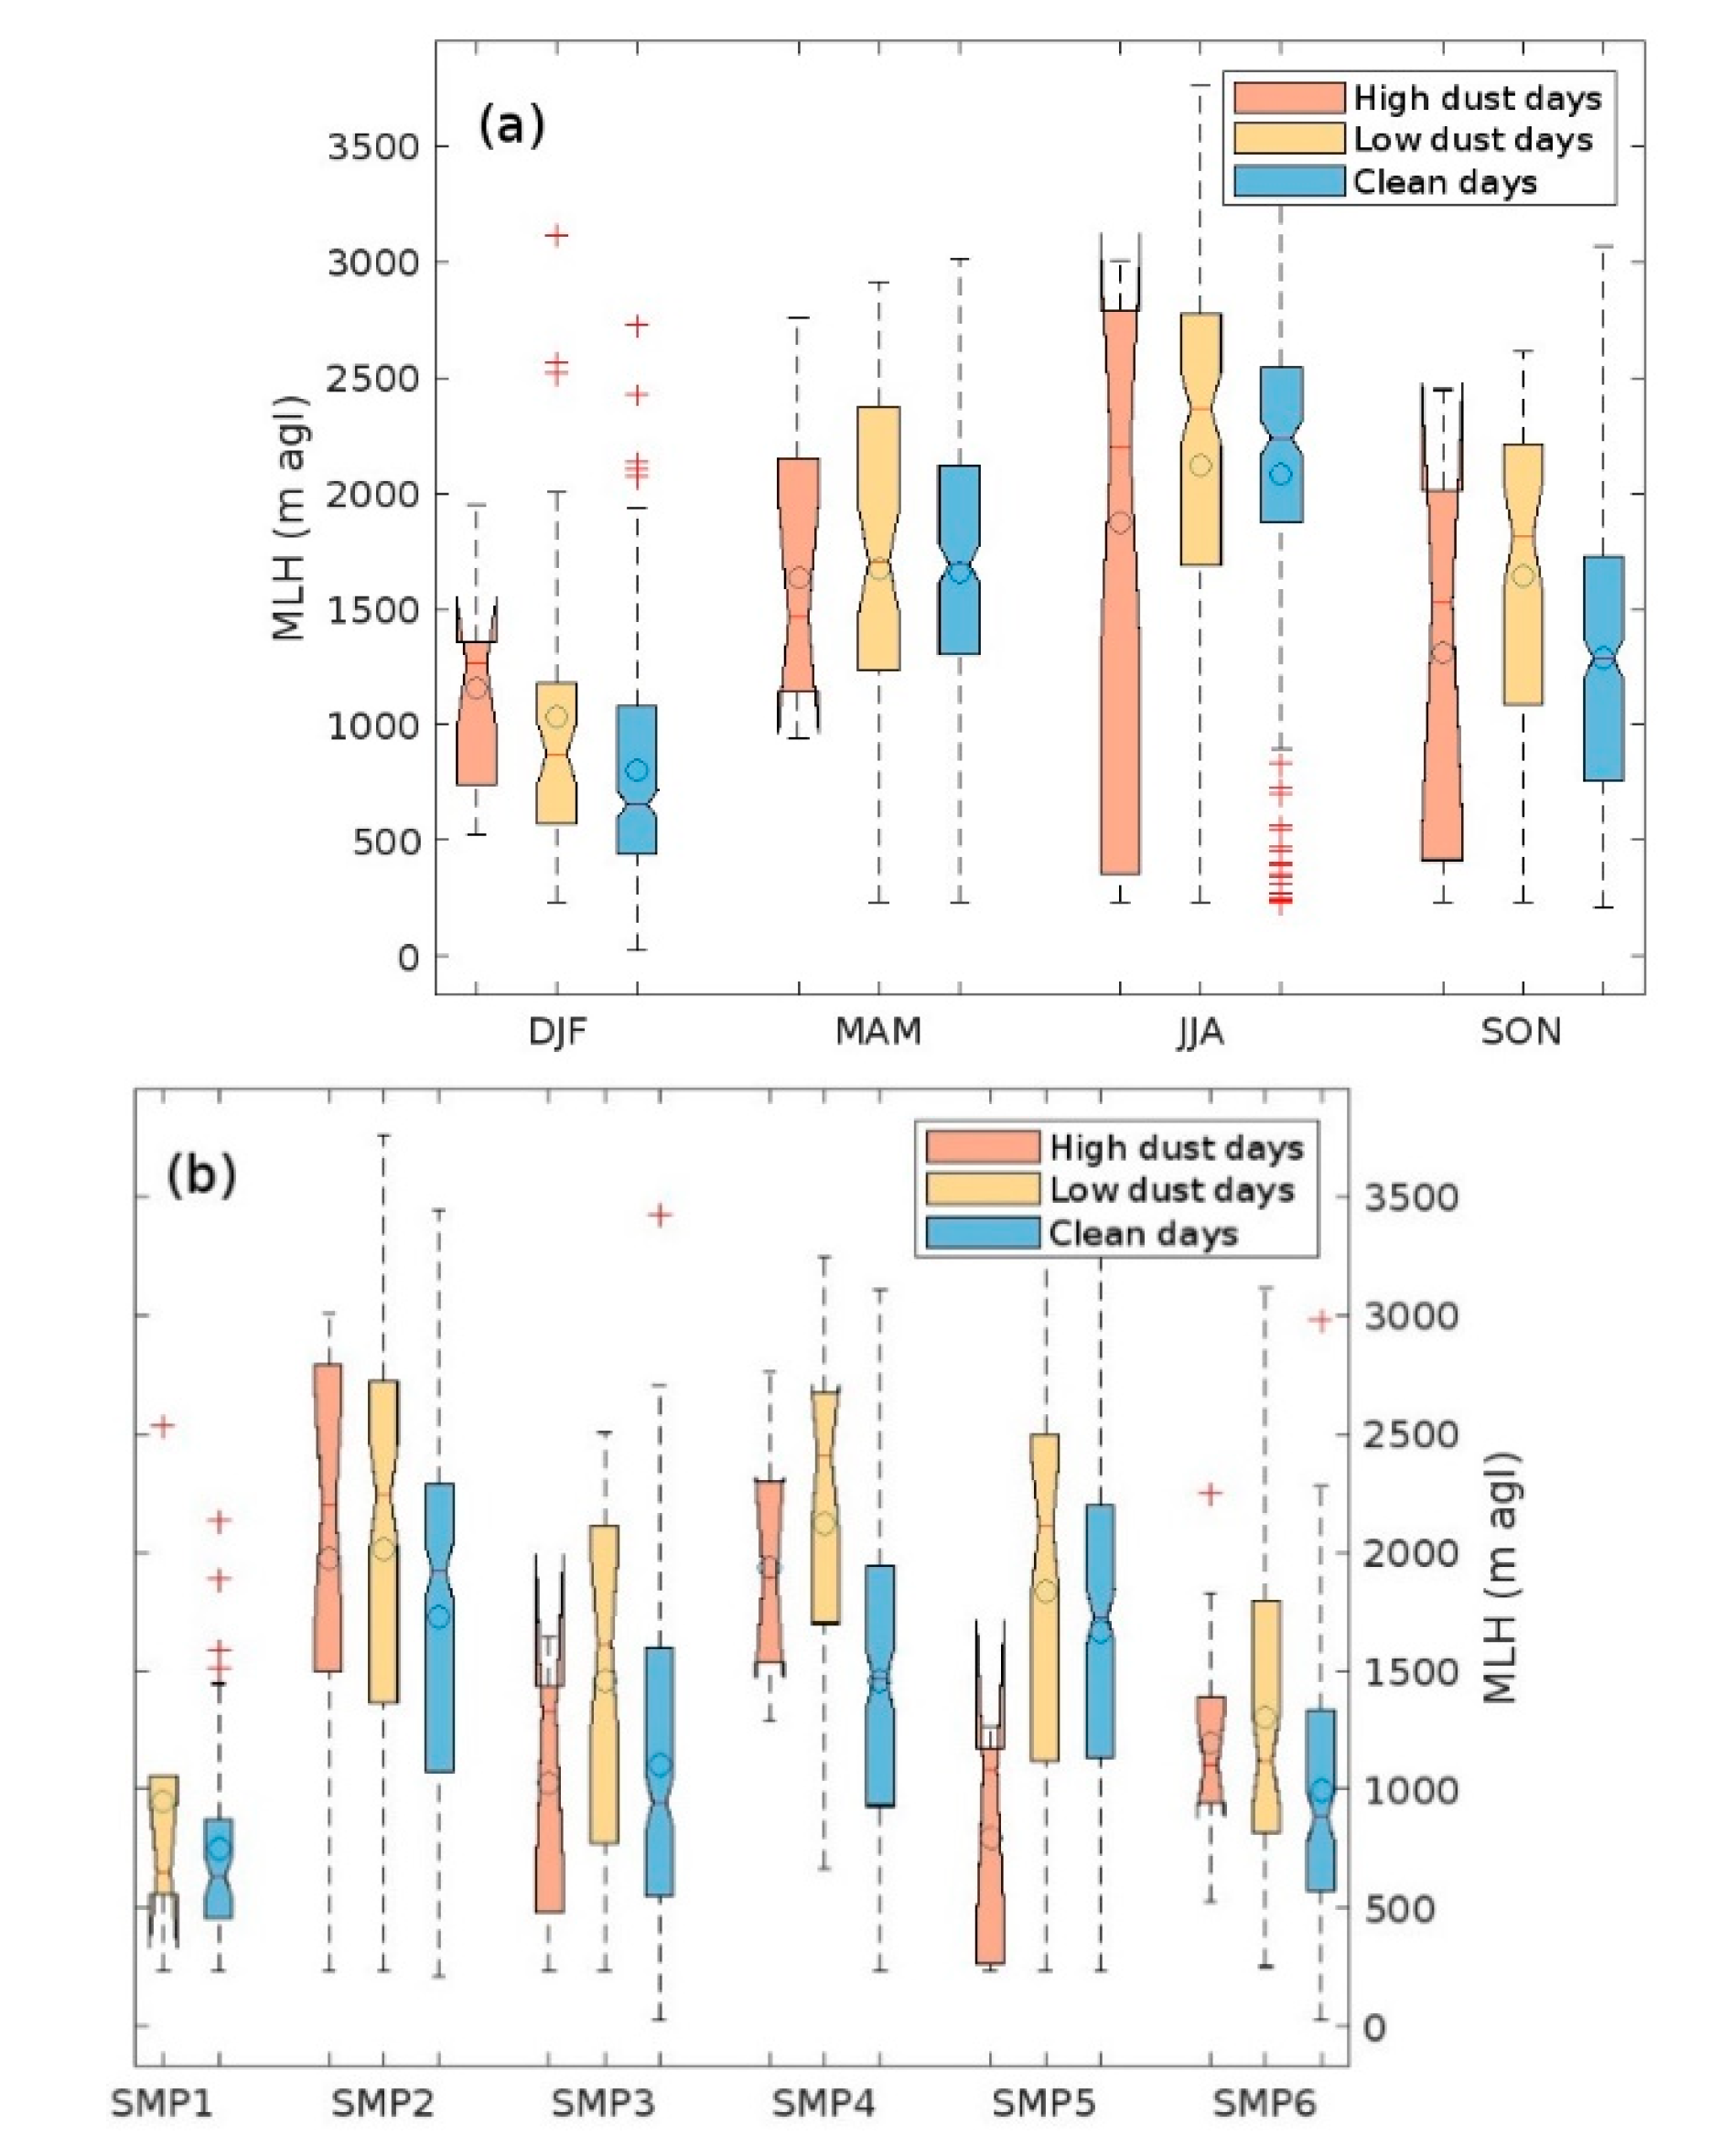
Taking these into account, the MLH have been analysed for these distribution, obtaining the results shown in Figure 10. In Figure 10a, the distribution by season is plotted, showing that the high dust load days produce lower MLH than both the low dust load and clean days in spring and summer. For the winter cases, the tendency is still increasing with the dust load, although the MLH is the lowest in these cases for the three situations. When the distribution is considered regarding the SMPs, shown in Figure 10b, a pronounced effect is observed for SMP5, occurring mainly in spring, with lower MLH for high dust load cases than both low dust load and clean days. The same effect but less intense is observed for SMP3 and SMP4, and very noticeable for SMP2, occurring mainly in summer, and SMP6, typical of winter and autumn, indicating that dust-rich airmasses behave differently in these synoptic patterns. A possible explanation of this feature is that the aloft dust-rich layers can produce a compression of the MLH, as it has been published by Salvador [45], due to mechanical compression or reduction in radiation reaching the surface.

4. Discussion

In this study, the effect of Saharan dust intrusions on the temporal evolution of the mixing layer heights (MLHs) has been analyzed. Ceilometer profiles were employed to analyze the vertical atmosphere over the site by means of the STRATfinder algorithm to obtain MLH. The dataset was differentiated by different meteorological conditions (seasons, synoptic patterns). Cluster analysis of sea level pressure fields allow the classification of six synoptic meteorological patterns as the main responsible of the weather conditions in the Iberian Peninsula. The mixing layer heights (MLHs) obtained by the STRATfinder algorithm from ceilometer profiles shows clear seasonal effects along the four years analysed (2020 – 2023). A counter-intuitive behavior was obtained, with a systematic reduction of the MLH during the occurrence of strong Saharan dust intrusions, with dust load PM10 concentrations larger than 30 µg/m3. This behavior occurred for all seasons and synoptic meteorological patterns. In general, the distribution of cases by synoptic meteorological patterns provides more insight about the situation, as it allows to differentiate the meteorological conditions suffered by the dust-rich airmass affecting the site atmospheric structure. This effect illustrates the strong direct radiative forcing by desert dust plumes on atmospheric stability within the lower troposphere in particular synoptic situations due to the presence of dust-rich aloft layers. Similar features have been obtained by Salvador [45]. In that study, the impact on air pollutant concentrations and health in Madrid during the period of 2011– 2014 due to variations in the MLH at midday was established. A well correlated decrease between the MLH and a linear increase in the daily number of exceedances of the European Union’s NO2 hourly limit value (200 µg/m3) at hotspot urban traffic monitoring stations was documented. Also an increase in all-natural-cause daily mortality shown a statistically significant relationship with reductions in the MLH. These results are relevant for health advice during Saharan dust intrusion days. It can be concluded that, for a complete description of the temporal evolution of the ML, strongly conditioned by the meteorological conditions, detailed analysis considering synoptic meteorological patterns will yield more clear results. The recent implementation of ceilometer networks will allow for a better characterization of the complexity of ML dynamics at larger scales, offering great potential as a correction tool for MLHs derived from models. This study has also highlighted the need for the use of datasets longer than four years, due to scarcity of cases in several synoptic situations. Future research should focus on characterizing larger geographical areas, taking advantage of the network capacities, in order to improve air pollution dispersion assessments and health alerts to population.

Author Contributions

Conceptualization, F.M.; methodology, F.M. and P.S.; software, F.M. and P.S.; validation, F.M., P.S. and M.P.; formal analysis, F.M. and P.S.; investigation, F.M., P.S. and M.P; resources, F.M., P.S. and M.P; data curation, F.M., P.S. and M.P writing—original draft preparation, F.M.; writing—review and editing, F.M., P.S. and M.P; project administration, F.M. and M.P.; funding acquisition, F.M. and M.P.. All authors have read and agreed to the published version of the manuscript.

Funding

This work was supported by Madrid Regional Government (TIGAS-CM, Y2018/EMT-5177), H2020 programme from the European Union (grant 654109, ACTRIS-2 project) and the Spanish Ministry of Economy and Competitivity (AtPollenFluo Grant PID2020-117873RB-I00 funded by MCIN/AEI/ 10.13039/501100011033).

Acknowledgments

The authors would like to acknowledge the STRATfinder software developers and also the Spanish Ministry of Ecological Transition and Demographic Challenge (MITECO) for providing the dates of Saharan dust episodes over 2020-2023 and the time series of daily Saharan dust contribution to PM10 concentrations at ground level. They also wish to thank the NOAA Air Resources Laboratory (ARL) for the provision of the HYSPLIT trajectory model. We also acknowledge to the Atmospheric Modelling & Weather Forecasting Group in the University of Athens, the Earth Science Dpt. from the Barcelona Supercomputing Centre and the Naval Research laboratory for the provision of SKIRON, MONARCH and NAAPs aerosol maps, respectively. Furthermore, the developers of the HYSPLIT model are also acknowledged.

Conflicts of Interest

The authors declare no conflicts of interest.

References

  1. Boucher, O.; Randall, D.; Artaxo, P.; Bretherton, C.; Feingold, G.; Forster, P.; Kerminen, V.; Kondo, Y.; Liao, H.; Lohmann, U.; et al. Clouds and Aerosols. In Contribution of Working Group I to the Fifth Assessment Report of the Intergovernmental Panel on Climate Change; Cambridge University Press: Cambridge, UK, 2013. [Google Scholar]
  2. Stull, R.B. An Introduction to Boundary Layer Meteorology. In Atmospheric Sciences Library; Springer: Berlin, Germany, 1988; Volume 8, p. 89. ISBN 978-94-009-3027-8. [Google Scholar]
  3. Monks, P.S. , Granier, C., Fuzzi, S., Stohl, A., Williams, M.L., Akimoto, H., Amann, M., Baklanov, A., Baltensperger, U., Bey, I., Blake, N., Blake, R.S., Carslaw, K., Cooper, O.R., Dentener, F., Fowler, D., Fragkou, E., Frost, G.J., Generoso, S., von Glasow, R., Atmospheric composition change – global and regional air quality. Atmos. Environ. 2009; 43, 5268–5350. [Google Scholar] [CrossRef]
  4. Geiß, A.; Wiegner, M.; Bonn, B.; Schäfer, K.; Forkel, R.; von Schneidemesser, E.; Münkel, C.; Chan, K.L.; Nothard, R. Mixing layer height as an indicator for urban air quality? Atmos. Meas. Tech. 2017, 10, 2969–2988. [Google Scholar] [CrossRef]
  5. Mahrt, L. Stratified atmospheric boundary layers. Bound. Layer Meteorol. 1999, 90, 375–396. [Google Scholar] [CrossRef]
  6. White, J.M., Bowers, J.F., Hanna, S.R., Lundquist, J.K., Importance of using Observations of Mixing Depths in order to Avoid large Prediction Errors by a Transport and Dispersion Model. J. Atmos. Ocean. Technol. 2009, 26, 22–32. [CrossRef]
  7. Sailor, D.J. Simulated urban climate response to modifications in surface albedo and vegetative cover. J. Appl. Meteorol. http:// www.jstor.org/stable/26187281. 1995, 34, 1694–1704. [Google Scholar] [CrossRef]
  8. Seibert, P.; Beyrich, F.; Gryning, S.-E.; Joffre, S.; Rasmussen, A.; Tercier, P. Review and intercomparison of operational methods for the determination of the mixing height. Atmos. Environ. 2000, 34, 1001–1027. [Google Scholar] [CrossRef]
  9. Stirnberg, R., Cermak, J., Kotthaus, S., Haeffelin, M., Andersen, H., Fuchs, J., Kim, M., Petit, J.-E., and Favez, O.: Meteorologydriven variability of air pollution (PM1) revealed with explainable machine learning, Atmos. Chem. Phys. 2021, 21, 3919–3948. [CrossRef]
  10. Peña, A., Floors, R., Sathe, A., Gryning, S. E., Wagner, R., Courtney, M. S., Larsén, X. G., Hahmann, A. N., and Hasager, C. B.: Ten Years of Boundary-Layer and Wind-Power Meteorology at Høvsøre, Denmark, Bound.-Lay. Meteorol. 2016, 158, 1–26. [CrossRef]
  11. Illingworth, A. J. , Cimini, D., Haefele, A., Haeffelin, M., Hervo, M., Kotthaus, S., Löhnert, U., Martinet, P., Mattis, I., O’Connor, E., and Potthast, R.: How Can Existing Ground-Based Profiling Instruments Improve European Weather Forecasts? B. Am. Meteorol. Soc. 2019, 100, 605–619. [Google Scholar] [CrossRef]
  12. Seidel, D.J.; Ao, C.O.; Li, K. Estimating climatological planetary boundary layer heights from radiosonde observations: Comparison of methods and uncertainty analysis. J. Geophys. Res. 2010, 116, D16113. [Google Scholar] [CrossRef]
  13. Kotthaus, S. and Grimmond, C.S.B.: Atmospheric boundary-layer characteristics from ceilometer measurements. Part 1: a new method to track mixed layer height and classify clouds. Q J R Meteorol. Soc. 2018, 144, 1525–1538. [Google Scholar] [CrossRef]
  14. Duncan Jr., J. B., Bianco, L., Adler, B., Bell, T., Djalalova, I. V., Riihimaki, L., Sedlar, J., Smith, E. N., Turner, D. D., Wagner, T. J., and Wilczak, J. M.: Evaluating convective planetary boundary layer height estimations resolved by both active and passive remote sensing instruments during the CHEESEHEAD19 field campaign. Atmos. Meas. Tech. 2022, 15, 2479–2502. [Google Scholar] [CrossRef]
  15. Wiegner, M. , Madonna F., Binietoglou I., Forkel R., Gasteiger J., Geiß A., Pappalardo G., Schäfer K., and Thomas W.: What is the benefit of ceilometers for aerosol remote sensing? An answer from EARLINET. Atmos. Meas. Tech. 2014, 7, 1979–1997. [Google Scholar] [CrossRef]
  16. Illingworth, A.J. , Cimini, D., Gaffard, C., Haeffelin, M., Lehmann, V., L¨ohnert, U., O’Connor, E.J., Ruffieux, D. Exploiting existing ground-based remote sensing networks to improve high-resolution weather forecasts. Bull. Am. Meteorol. Soc. 2015, 96, 2107–2125. [Google Scholar] [CrossRef]
  17. Cazorla, A.; Casquero-Vera, J.A.; Román, R.; Guerrero-Rascado, J.L.; Toledano, C.; Cachorro, V.E.; Orza, J.A.G.; Cancillo, M.L.; Serrano, A.; Titos, G.; et al. Near-real-time processing of a ceilometer network assisted with sun-photometer data: Monitoring a dust outbreak over the Iberian Peninsula. Atmos. Chem. Phys. 2017, 17, 11861–11876. [Google Scholar] [CrossRef]
  18. Flamant, C.; Georgelin, M.; Menut, L.; Pelon, J.; Bougeault, P. The atmospheric boundary-layer structure within a cold air outbreak: Comparison of in situ, lidar and satellite measurements with three-dimensional Simulations. Bound. Layer Meteorol. 2001, 99, 85–103. [Google Scholar] [CrossRef]
  19. Emeis, S., Schäfer, K., Remote sensing methods to investigate boundary-layer structures relevant to air pollution in cities. Bound.-Layer Meteorol., 2006, 121. [CrossRef]
  20. Flamant, C. , Pelon, J., Flamant, P.H., Durand, P., Lidar determination of the entrainment zone thickness at the top of the unstable marine atmospheric boundary layer. Bound.-Layer Meteorol. 1997, 83, 247–284. [Google Scholar] [CrossRef]
  21. Brooks, I.M. , Finding Boundary Layer top: Application of a Wavelet Covariance Transform to Lidar Backscatter Profiles. J. Atmos. Ocean. Technol. 2003, 20, 1092–1105. [Google Scholar] [CrossRef]
  22. Poltera, Y., Martucci, G., Collaud Coen, M., Hervo, M., Emmenegger, L., Henne, S., Brunner, D., Haefele, A., PathfinderTURB: an automatic boundary layer algorithm. Development, validation and application to study the impact on in situ measurements at the Jungfraujoch. Atmos. Chem. Phys. 2017, 17, 10051–10070. [CrossRef]
  23. Haeffelin, M. and Angelini, F.: Evaluation of mixing height retrievals from automatic profiling lidars and ceilometers in view of future integrated networks in Europe. Bound. Lay. Meteorol. 2012, 143, 49–75. [Google Scholar] [CrossRef]
  24. De Bruine, M.; Apituley, A.; Donovan, D.P.; Klein Baltink, H.; de Haij, M.J. Pathfinder: Applying graph theory to consistent tracking of daytime mixed layer height with backscatter lidar. Atmos. Meas. Tech. 2017, 10, 1893–1909. [Google Scholar] [CrossRef]
  25. Kotthaus, S.; Haeffelin, M.; Drouin, M.-A.; Dupont, J.-C.; Grimmond, S.; Haefele, A.; Hervo, M.; Poltera, Y.; Wiegner, M. Tailored Algorithms for the Detection of the Atmospheric Boundary Layer Height from Common Automatic Lidars and Ceilometers (ALC). Remote Sens. 2020, 12, 3259. [Google Scholar] [CrossRef]
  26. Bourgeois, Q. and Ekman, A. M. L. and Renard, J.-B. and Krejci, R. and Devasthale, A. and Bender, F. A.-M. and Riipinen, I. and Berthet, G. and Tackett, J. L. How much of the global aerosol optical depth is found in the boundary layer and free troposphere? 2018, 10, 7709 – 7720. [CrossRef]
  27. Bravo-Aranda, J. A. , Titos, G., Granados-Muñoz, M. J., Guerrero-Rascado, J. L., Navas-Guzmán, F., Valenzuela, A., Lyamani, H., Olmo, F. J., Andrey, J., and Alados-Arboledas, L. Study of mineral dust entrainment in the planetary boundary layer by lidar depolarisation technique. Tellus B, 2015; 67, 26180. [Google Scholar] [CrossRef]
  28. Andreae, M. O. , Climate effects of changing atmospheric aerosol levels, in World Survey of Climatology, 1995, vol. 16, Future Climate of the World, edited by A. Henderson-Sellers, pp. 341–392, Elsevier, New York.
  29. Prospero, J. M., P. Ginoux, O. Torres, S. E. Nicholson, and T. E. Gill, Environmental characterization of global sources of atmospheric soil dust identified with the Nimbus 7 Total Ozone Mapping Spectrometer (TOMS) absorbing aerosol products. Rev. Geophys., 2002, 40, 1002. [CrossRef]
  30. Artíñano, B.; Salvador, P.; Alonso, D.G.; Querol, X.; Alastuey, A. Anthropogenic and natural influence on the PM10 and PM2.5 aerosol in Madrid (Spain). Analysis of high concentration episodes. Environ. Pollut. 2003, 125, 453–465, ISSN 0269-7491. [Google Scholar] [CrossRef]
  31. Salvador, P.; Alonso-Pérez, S.; Pey, J.; Artíñano, B.; de Bustos, J.J.; Alastuey, A.; Querol, X. African dust outbreaks over the western Mediterranean Basin: 11-year characterization of atmospheric circulation patterns and dust source areas. Atmos. Chem. Phys. 2014, 14. [Google Scholar] [CrossRef]
  32. López, V.; Salvador, P.; Artíñano, B.; Gomez-Moreno, F.J.; Fernández, J.; Molero, F. Influence of the origin of the air mass on the background levels of atmospheric particulate matter and secondary inorganic compounds in the Madrid air basin. Environ. Sci. Pollut. Res. 2019, 26, 30426–30443. [Google Scholar] [CrossRef] [PubMed]
  33. Molero, F.; Andrey, F.J.; Fernandez, A.J.; Parrondo MD, C.; Pujadas, M.; Córdoba-Jabonero, C.; Gomez-Moreno, F.J. Study of vertically resolved aerosol properties over an urban background site in Madrid (Spain). Int. J. Remote Sens. 2014, 35, 2311–2326. [Google Scholar] [CrossRef]
  34. Heese, B.; Flentje, H.; Althausen, D.; Ansmann, A.; Frey, S. Ceilometer lidar comparison: Backsca􀁋er coefficient retrieval and signal-to-noise ratio determination, Atmos. Meas. Tech. 2010, 3, 1763–1770. [Google Scholar] [CrossRef]
  35. Molero, F.; Barragan, R.; Artíñano, B. Estimation of the atmospheric boundary layer height by means of machine learning techniques using ground-level meteorological data. Atmos. Res. 2022, 279, 106–401. [Google Scholar] [CrossRef]
  36. Molero, F. , Jaque, F., The laser as a tool in environmental problems. Opt. Mater. 1999, 13, 167–173. [Google Scholar] [CrossRef]
  37. Dijkstra, E.W. A note on two problems in connexion with graphs. Numer. Math. 1959, 1, 269–271. [Google Scholar] [CrossRef]
  38. Salvador, P.M.; Barreiro, F.J.; Gómez-Moreno, E.; Alonso-Blanco, B.; Artı́ñano, B. Synoptic classification of meteorological patterns and their impact on air pollution episodes and new particle formation processes in a south European air basin. Atmos. Environ. 2021, 245, 118016. [Google Scholar] [CrossRef]
  39. Kalnay, E.; Kanamitsu, M.; Kistler, R.; Collins, W.; Deaven, D.; Gandin, L.; Iredell, M.; Saha, S.; White, G.; Woollen, J.; et al. The NCEP/NCAR 40-year reanalysis project. Bull. Am. Meteorol. Soc. 1996, 77, 437–470. [Google Scholar] [CrossRef]
  40. M. Alarcón, R. Rodríguez-Solà, M. Carmen Casas-Castillo, F. Molero, P. Salvador, C. Periago, J. Belmonte. Influence of synoptic meteorology on airborne allergenic pollen and spores in an urban environment in Northeastern Iberian Peninsula. Science of the Total Environment 2023, 896, 165337. [Google Scholar] [CrossRef]
  41. Barragán, R.; Molero, F.; Salvador, P.; Theobald, M.R.; Vivanco, M.G.; Rodríguez-Sánchez, A.; Gil VGarrido, J.L.; Pujadas, M.; Artíñano, B. Study of the Effect of Different Atmospheric Conditions on the Temporal Evolution of the Mixing Layer over Madrid during the Year 2020 by Means of Two Different Methods: Ceilometer Signals and the ECMWF-IFS Meteorological Model. Remote Sensing 2023, 15, 5583. [Google Scholar] [CrossRef]
  42. Draxler, R.R., Hess, G., 1997. Description of the HYSPLIT_4 modelling system. In: NOAA Tech. Mem. ERL ARL-224, Scientific Report, pp. 28. available at. https://www.arl.noaa.gov/documents/reports/arl-224.pdf (last access February 2023).
  43. Viana, M. Salvador, P., Artíñano, B., Querol, X., Alastuey, A., Pey, J., Latz, A., Cabañas, M., Moreno, T., García, S., Herce-Garraleta, D., Diez, P., Romero, D., Fernandez-Patier, R., Assessing the performance of methods to detect and quantify African dust in airborne particulates. Environ. Sci. Technol. 2010, 44, 8814–8820. [Google Scholar] [PubMed]
  44. Commission Staff Working Paper, 2011. Establishing Guidelines for Demonstration and Subtraction of Exceedances Attributable to Natural Sources under the Directive 2008/50/EC on Ambient Air Quality and Cleaner Air for Europe, Brussels, 15.02.2011. SEC(2011) 208 Final. 37 pp., available at: https://www.miteco.gob.es/content/dam/miteco/es/calidad-y-evaluacion-ambiental/temas/atmosfera-y-calidad-del-aire/Directrices%20Comisi%C3%B3n-SEC%20208%20final-en_tcm30-186523.pdf (last access October 2024).
  45. Salvador, P.M.; Pandolfi, A.; Tobías, F.J.; Gómez-Moreno, F.; Molero, M.; Barreiro, N.; Pérez, M.A.; Revuelta, I.; Martínez Marco, X.; Querol, B. Artíñano Impact of mixing layer height variations on air pollutants concentrations and health in a European urban area: Madrid (Spain), a case study. Environ. Sci. Pollut. Res. 2020, 27, 41702–41716. [Google Scholar] [CrossRef] [PubMed]
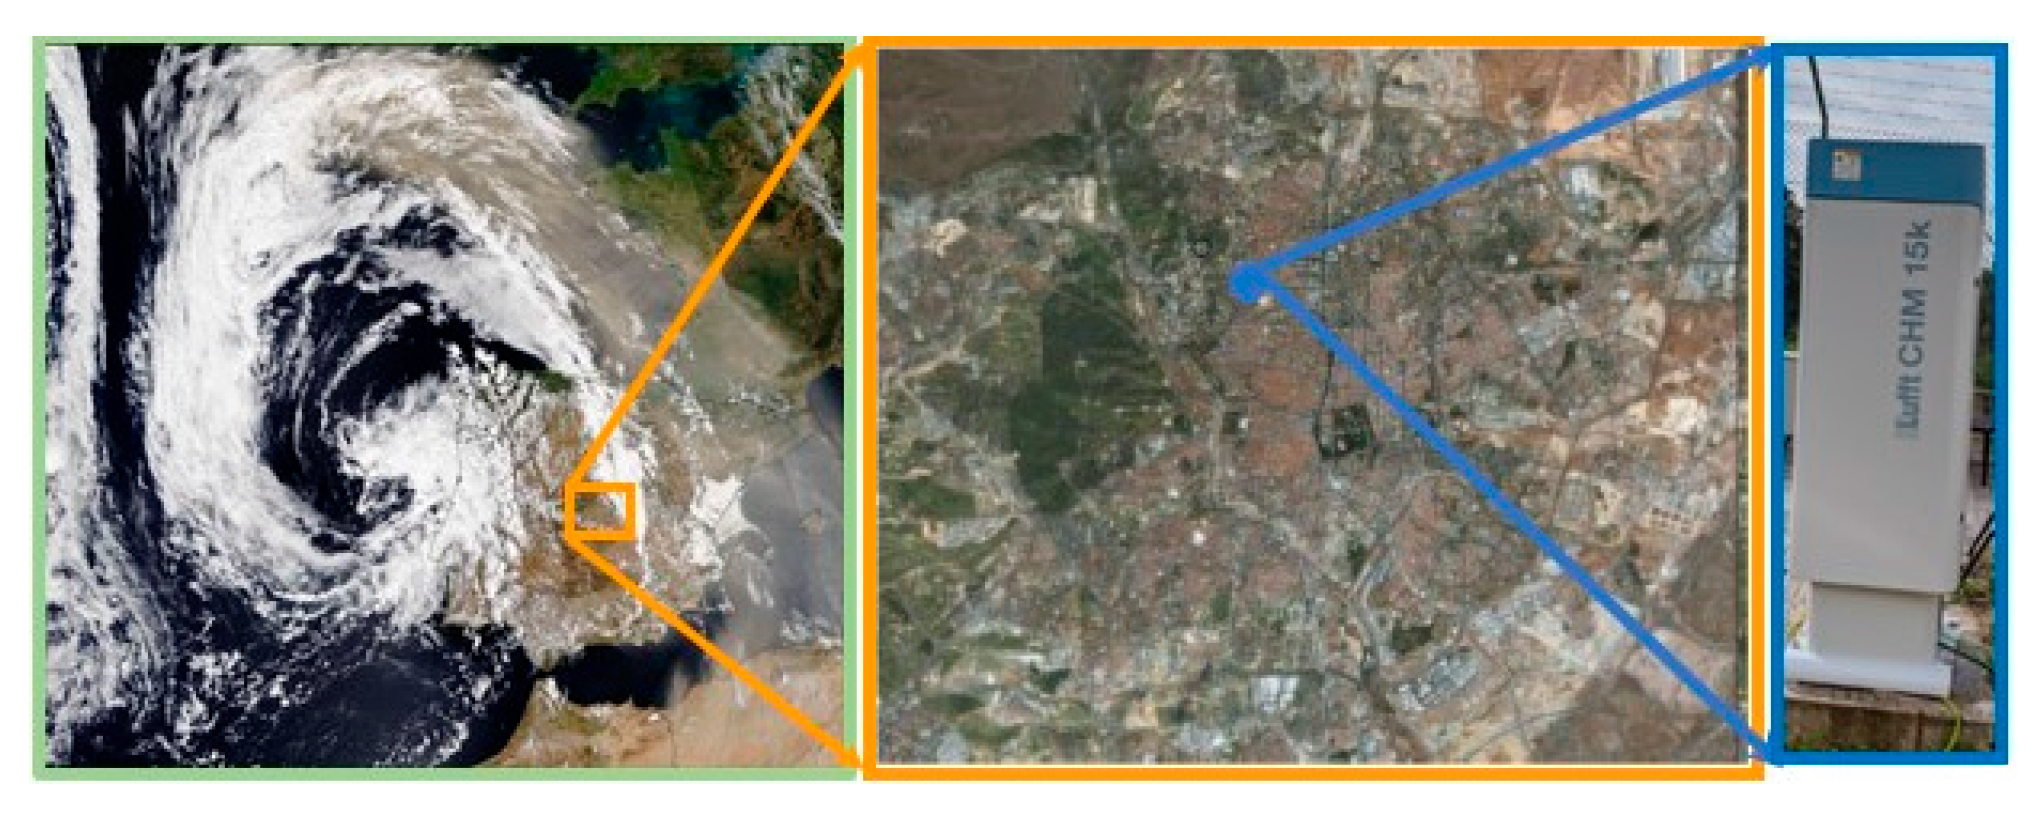
Figure 1. CIEMAT-Madrid site, located in the middle of the Iberian peninsula (left panel), and at the northwest of the Madrid city (middle panel), with the instrument (right panel). The satellite image at the left panel also shows a saharan dust intrusion.
Preprints 138464 g001
Figure 2. Synoptic meteorological patterns (SMP) obtained by cluster analysis of reanalysis global fields of sea level pressure at 12 UTC for the period 2001–2019. Colored areas represent atmospheric pressure measured in hPa. Cool colors are used to represent low pressures, while warm colors symbolize higher pressures. The X-axis represents longitude while the Y-axis represents latitude, both measured in degrees. North Atlantic, Europe and North Africa are depicted on the maps.
Preprints 138464 g002
Figure 3. Quicklook of the range corrected signal (raw signal multiplied by the square of range) calibrated at 1064 nm, as color scale, and the prediction provided by the STRATfinder algorithm of the MLH (black circles) and ABLH (red crosses) at (a): 21/06/2022 and (b): 15/06/2021. The x-axis represents the time, 24 hours and the vertical axis is the height, with the color scale representing the range corrected signal.
Preprints 138464 g003
Figure 4. MLH estimations (black crosses, left y-axis) and Saharan dust load (orange circles, right y-axis) for days between January 2020 and December 2023.
Preprints 138464 g004
Figure 5. Boxplots of MLH for all the days separated by (a): season and (b) synoptic meteorological pattern. As usual, the red line in the middle of the boxplot represents the media of the values for that group, the box comprises the interquartile range and the top and bottom lines are the maximum and minimum values respectively. The mean have also been represented as blue circles.
Preprints 138464 g005
Figure 6. Seasonal distribution of cases, number of cases for each season, divided by the total number of cases assigned to that SMP, for the six synoptic meteorological patterns during the period 2020 - 2023.
Preprints 138464 g006
Figure 7. Boxplots of MLH for (a): Saharan and clean days and (b) High dust load, low dust load and clean days.
Preprints 138464 g007
Figure 8. Boxplots of Saharan and clean days separated by (a): season and (b) synoptic meteorological pattern.
Preprints 138464 g008
Figure 9. Distribution of clean (blue bars), low dust load (red bars) and high dust load days (orange bars) regarding the synoptic meteorological patterns for the period 2020 – 2023.
Preprints 138464 g009
Figure 10. Boxplots of High dust load, Low dust load and clean days separated (a) by season and (b) by synoptic meteorological pattern.
Preprints 138464 g010
Disclaimer/Publisher’s Note: The statements, opinions and data contained in all publications are solely those of the individual author(s) and contributor(s) and not of MDPI and/or the editor(s). MDPI and/or the editor(s) disclaim responsibility for any injury to people or property resulting from any ideas, methods, instructions or products referred to in the content.
Copyright: This open access article is published under a Creative Commons CC BY 4.0 license, which permit the free download, distribution, and reuse, provided that the author and preprint are cited in any reuse.
Prerpints.org logo

Preprints.org is a free preprint server supported by MDPI in Basel, Switzerland.

Subscribe

© 2024 MDPI (Basel, Switzerland) unless otherwise stated