1. Introduction
Modern climate warming has led to a near-universal increase in permafrost temperature in the cryolithozone [
1,
2,
3,
4,
5,
6,
7]. The activation of cryogenic processes can be observed in nearly all areas due to climate warming [
8,
9,
10,
11,
12], and the emergence of new conditions in landscape maintenance leads to permafrost degradation and infrastructure risks. Thus, research is necessary to detect changes and prevent permafrost stability loss.
Arctic and Subarctic landscapes comprise approximately 40% of Yakutia's territory, encompassing tundra, sparse woodlands, plains, and mountains. The climate and permafrost are matched by the diverse landscapes. Tundra landscapes are associated with the Arctic zone, while sparse larch forests of the northern taiga are found in the Subarctic zone.
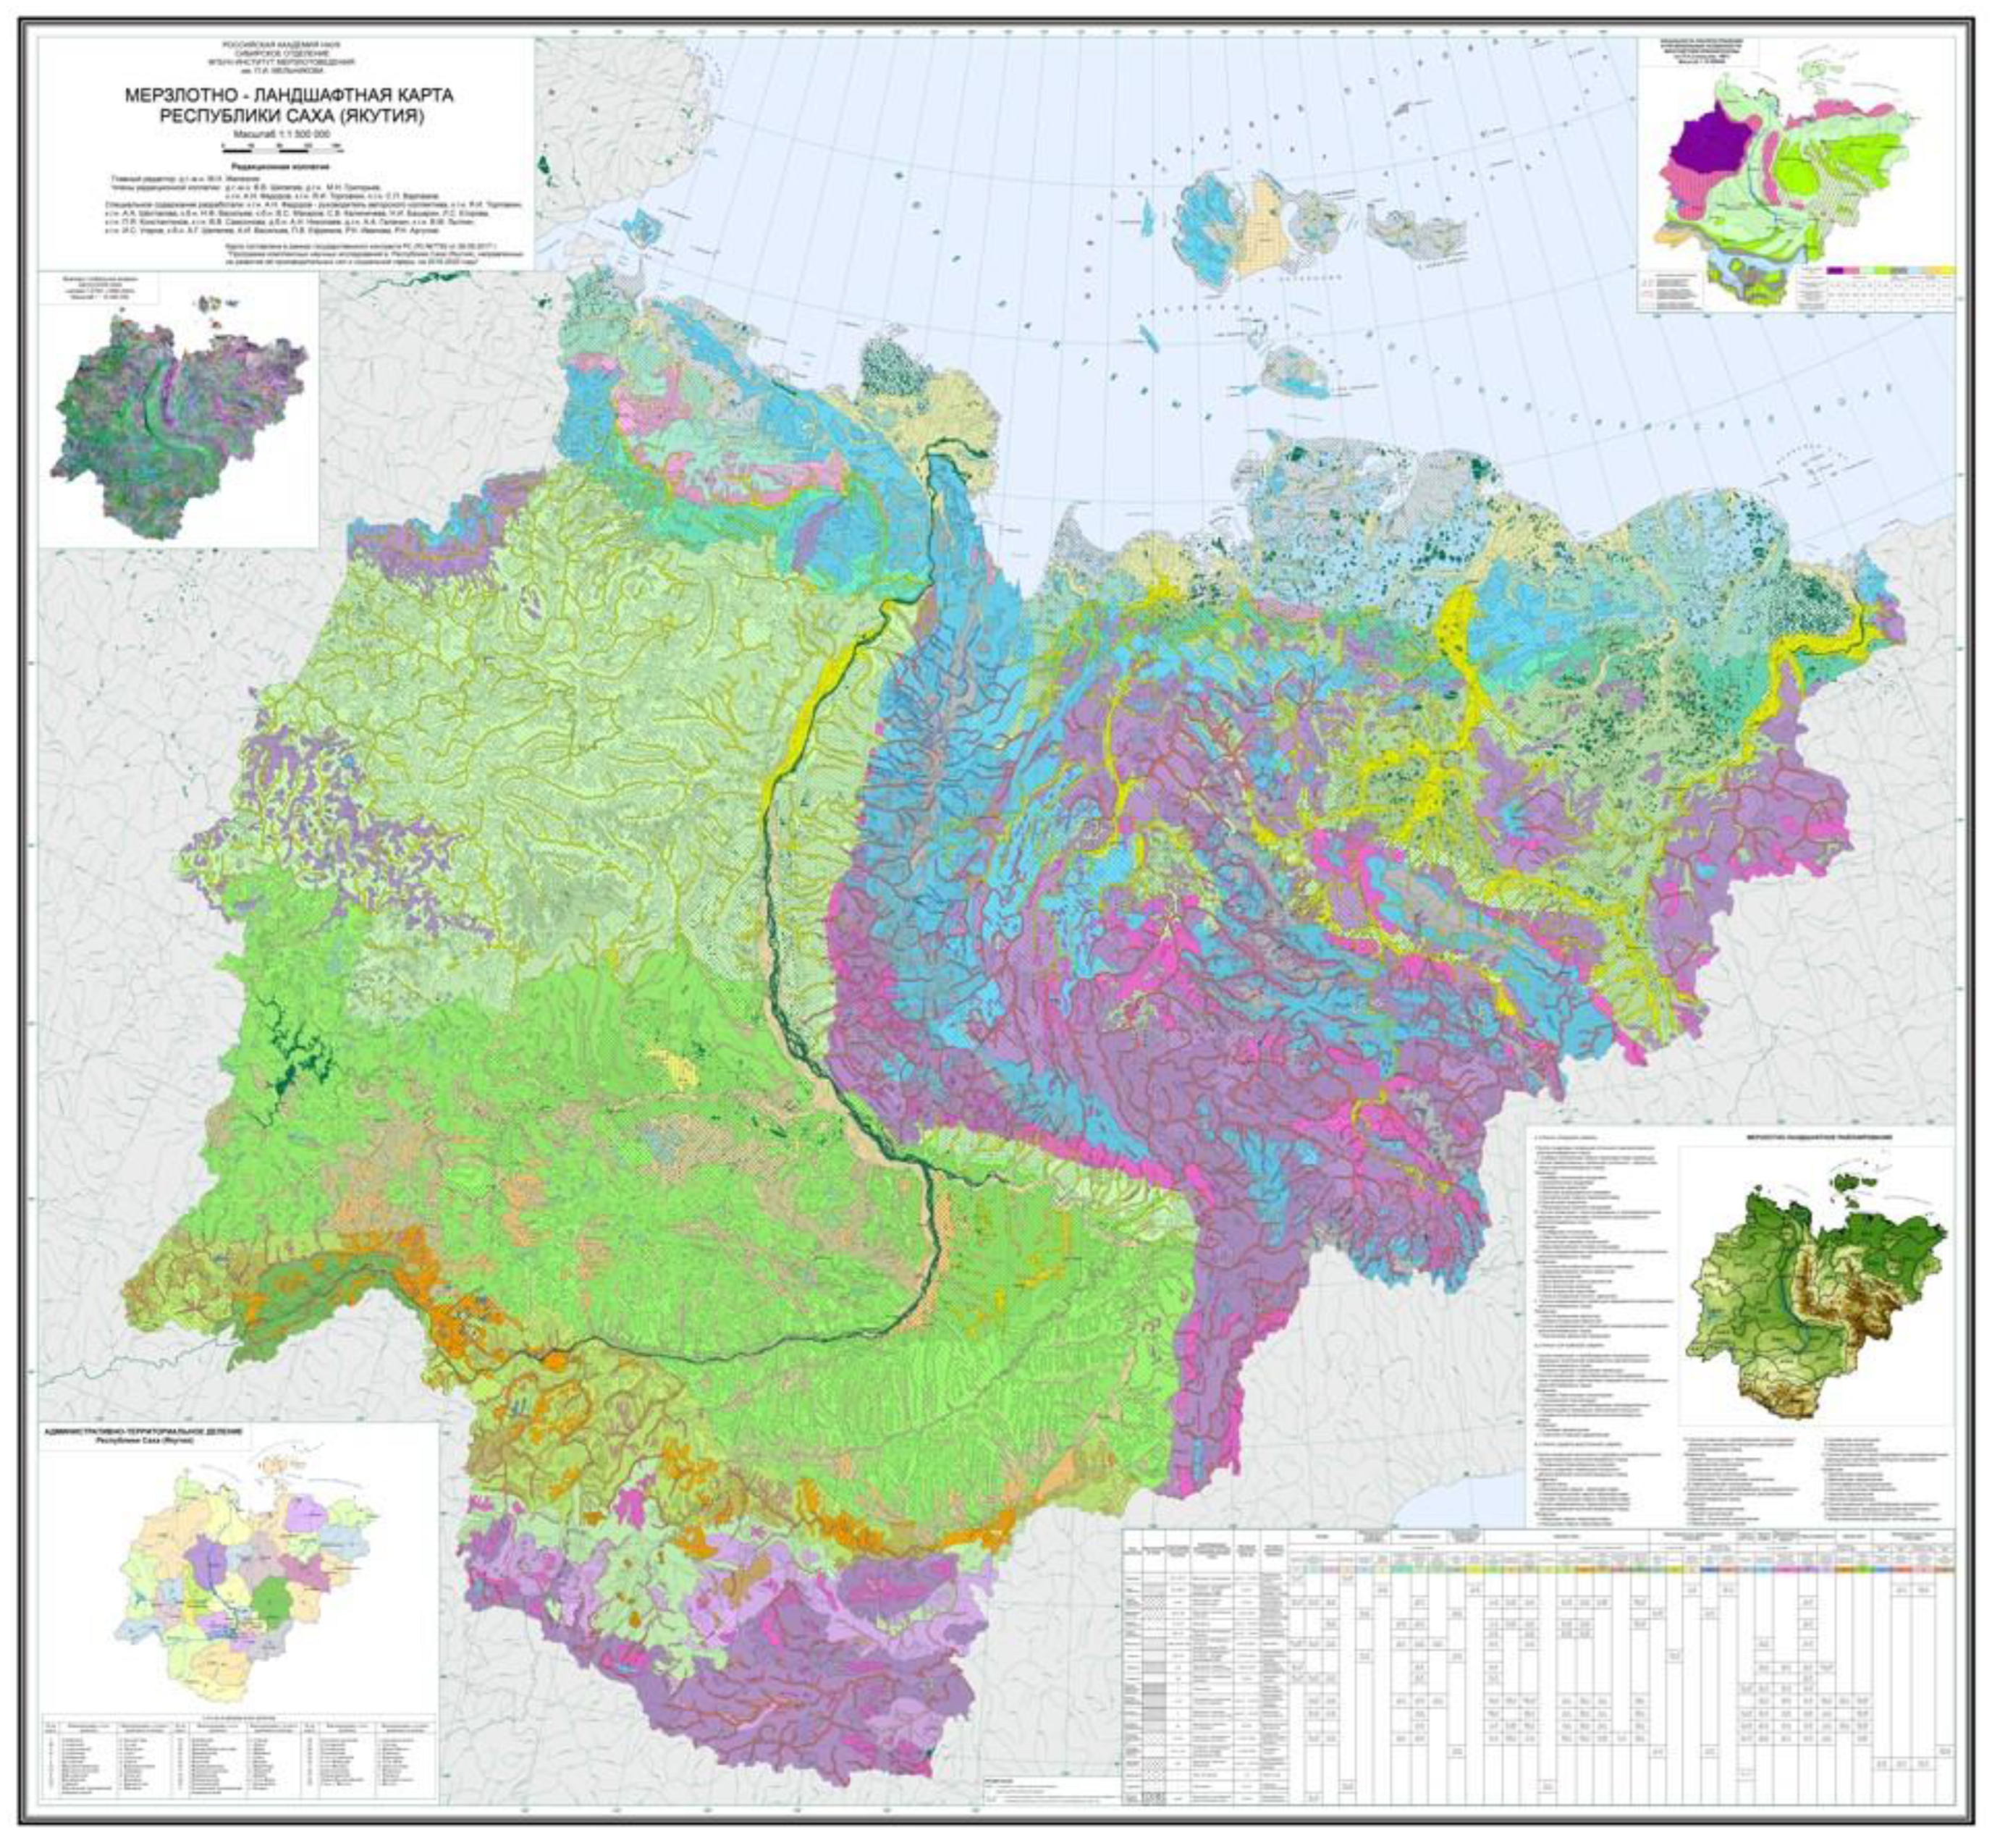
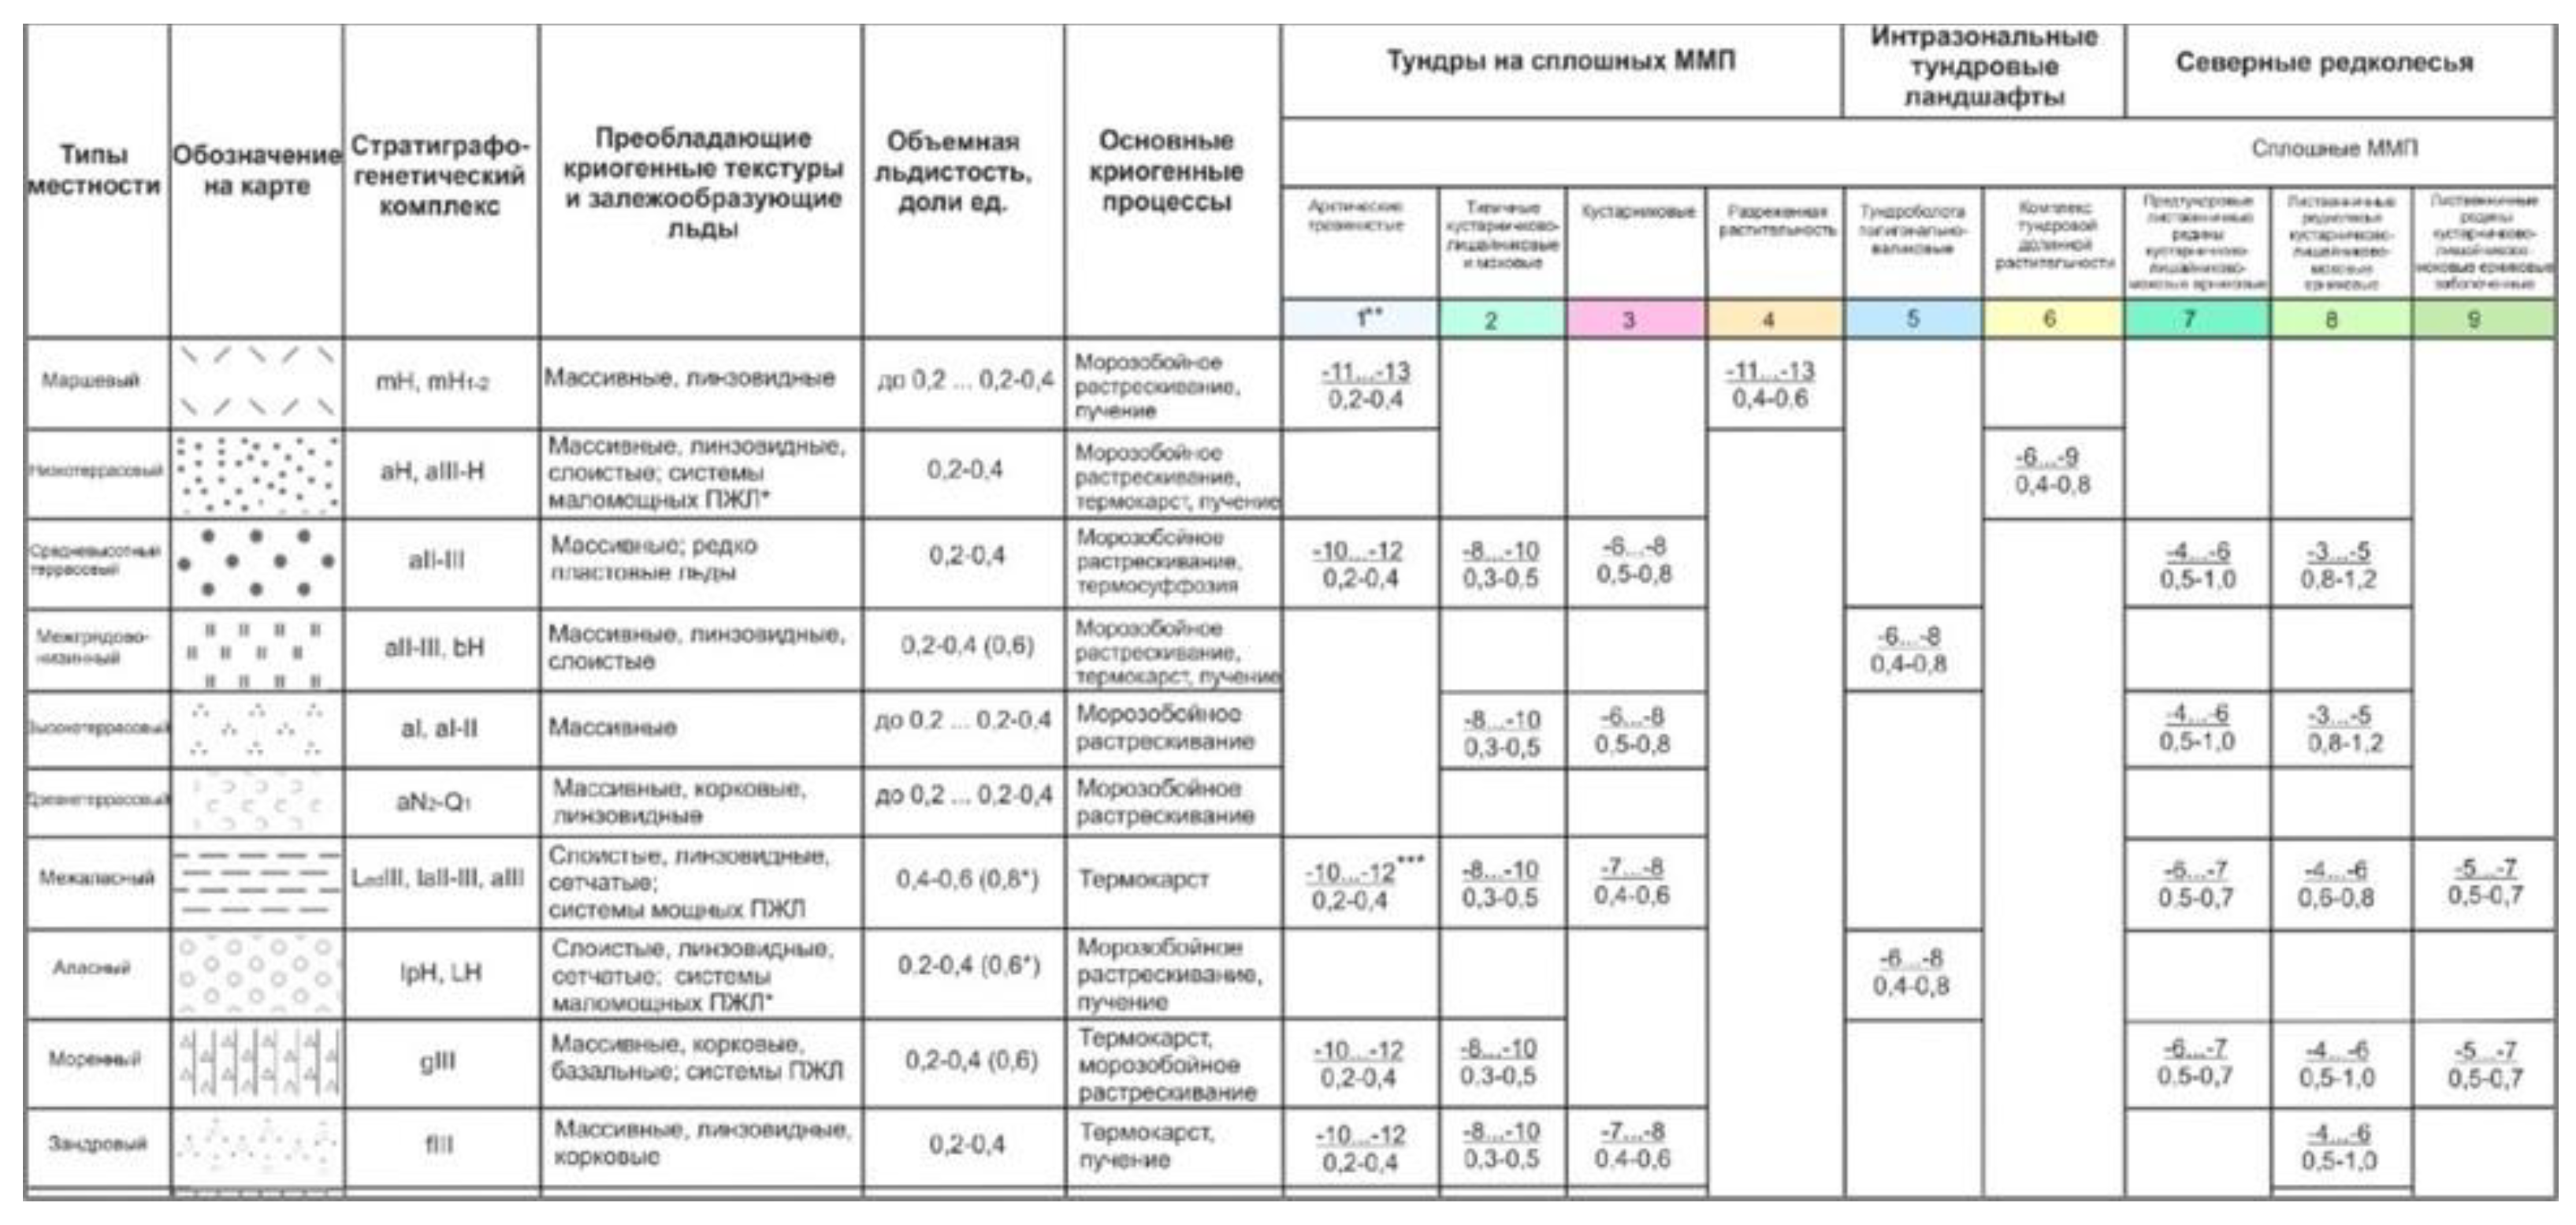
The 1:1,500,000 scale permafrost landscape map of the Republic of Sakha (Yakutia) (
Figure 1 and
Figure 2) effectively showcases the diverse permafrost landscapes in the region [
13]. The map displays 20 different types of terrain, including inter-alas, alas, low-terrace, moraine, zander, slope colluvial–deluvial, and slope deluvial–solifluction. The genetic features of each determine their cryolithological features, cryogenic textures, and voluminous ice.
A total of 36 vegetation groupings provide information on the biohydroclimatic characteristics of permafrost landscapes. The different environments include arctic (typical) shrubby tundra, pre-tundra woodlands, northern sparse forests, mountain deserts, mountain tundra, undergrowth shrubs, and mountain light forests. By overlaying terrain types and vegetation groupings, the map's legend shows a visual representation of the permafrost temperature and active layer thickness.
The climate and permafrost variability of the Arctic and Subarctic Yakutia were previously not examined independently. Research in Russia by Pavlov and Malkova [
2] showed a steady increase in the mean annual air temperature, ranging from 0.03 to 0.05 °C per year, in the Arctic and Subarctic regions of Yakutia. This area had the smallest increase in temperature compared to other regions in Yakutia.
Skachkov [
14] investigated the spatial variations in the mean annual air temperature in Yakutia from 1965 to 2009. They observed a noticeable rise in the mean annual air temperature in the Arctic zone of Yakutia, increasing from west to east—from 0.7 °C in Saskylakh, 1.2 °C in Tiksi, and 1.8 °C in Chokurdakh to up to 2.2 °C in Chersky. No specific patterns were observed in the Subarctic zone. On average, the mean air temperature increased by 1.4-1.8 °C during the time examined. During the same period, the Arctic zone experienced a decline in annual precipitation ranging from 34 mm in Tiksi to 86 mm in Chokurdakh. In Subarctic Yakutia, the western part (Olenek–Shelagontsy) saw a decrease in annual precipitation, while others (Zhigansk, Zyryanka) observed an increase.
Gorokhov and Fedorov [
15] found that in Yakutia from 1966 to 2016, the Arctic and Subarctic regions experienced annual temperature trends between 0.03 and 0.05 °C per year. The Arctic area of Yakutia saw a significant decrease in annual precipitation, while Subarctic Yakutia saw a shift from negative to positive trends, as revealed by research.
The study of permafrost conditions is focused on specific regions and territories. Over the past two to three decades, permafrost dynamics have been monitored in the Lena River delta [
16] and Arctic Ocean coast [
17,
18], as well as in the Batagai depression [
19,
20,
21] and other sites. Russian institutes (VSEGINGEO and PNIIIS, Moscow State University, and the Melnikov Permafrost Institute SB RAS) have been responsible for conducting a substantial amount of permafrost research in the Arctic and Subarctic areas over the years.
The research conducted by Pavlov and Malkova [
2] in 1966-2005 focused on the dynamics of Russia's cryolithozone in response to modern climate changes. The zone of trends with values ranging from 0.01 to 0.02
oC was found to encompass the majority of Arctic and Subarctic Yakutia. In Central Yakutia, the trend reached 0.03
oC per year under these conditions. Therefore, Pavlov and Malkova [
2] assigned the majority of Arctic and Subarctic Yakutia to the low activation zone of cryogenic processes during the warm season. Romanovsky et al. [
3] found that the permafrost temperature in Yakutia's Kolyma Lowland has risen by 1.5
oC at 15 m depth in the past 20 years.
The objective of this study is to analyze the regional aspects of climate and permafrost changes in Yakutia's Arctic and Subarctic regions over the past 50-60 years. The focus was on delimiting the extent of present-day warming in certain regions and identifying the most vulnerable territories to cryogenic processes that have a detrimental impact on permafrost landscapes and infrastructure. The results of this research have practical implications for predicting the evolution of permafrost landscapes in the Russian Federation, critical for geocryological monitoring efforts.
3. Results
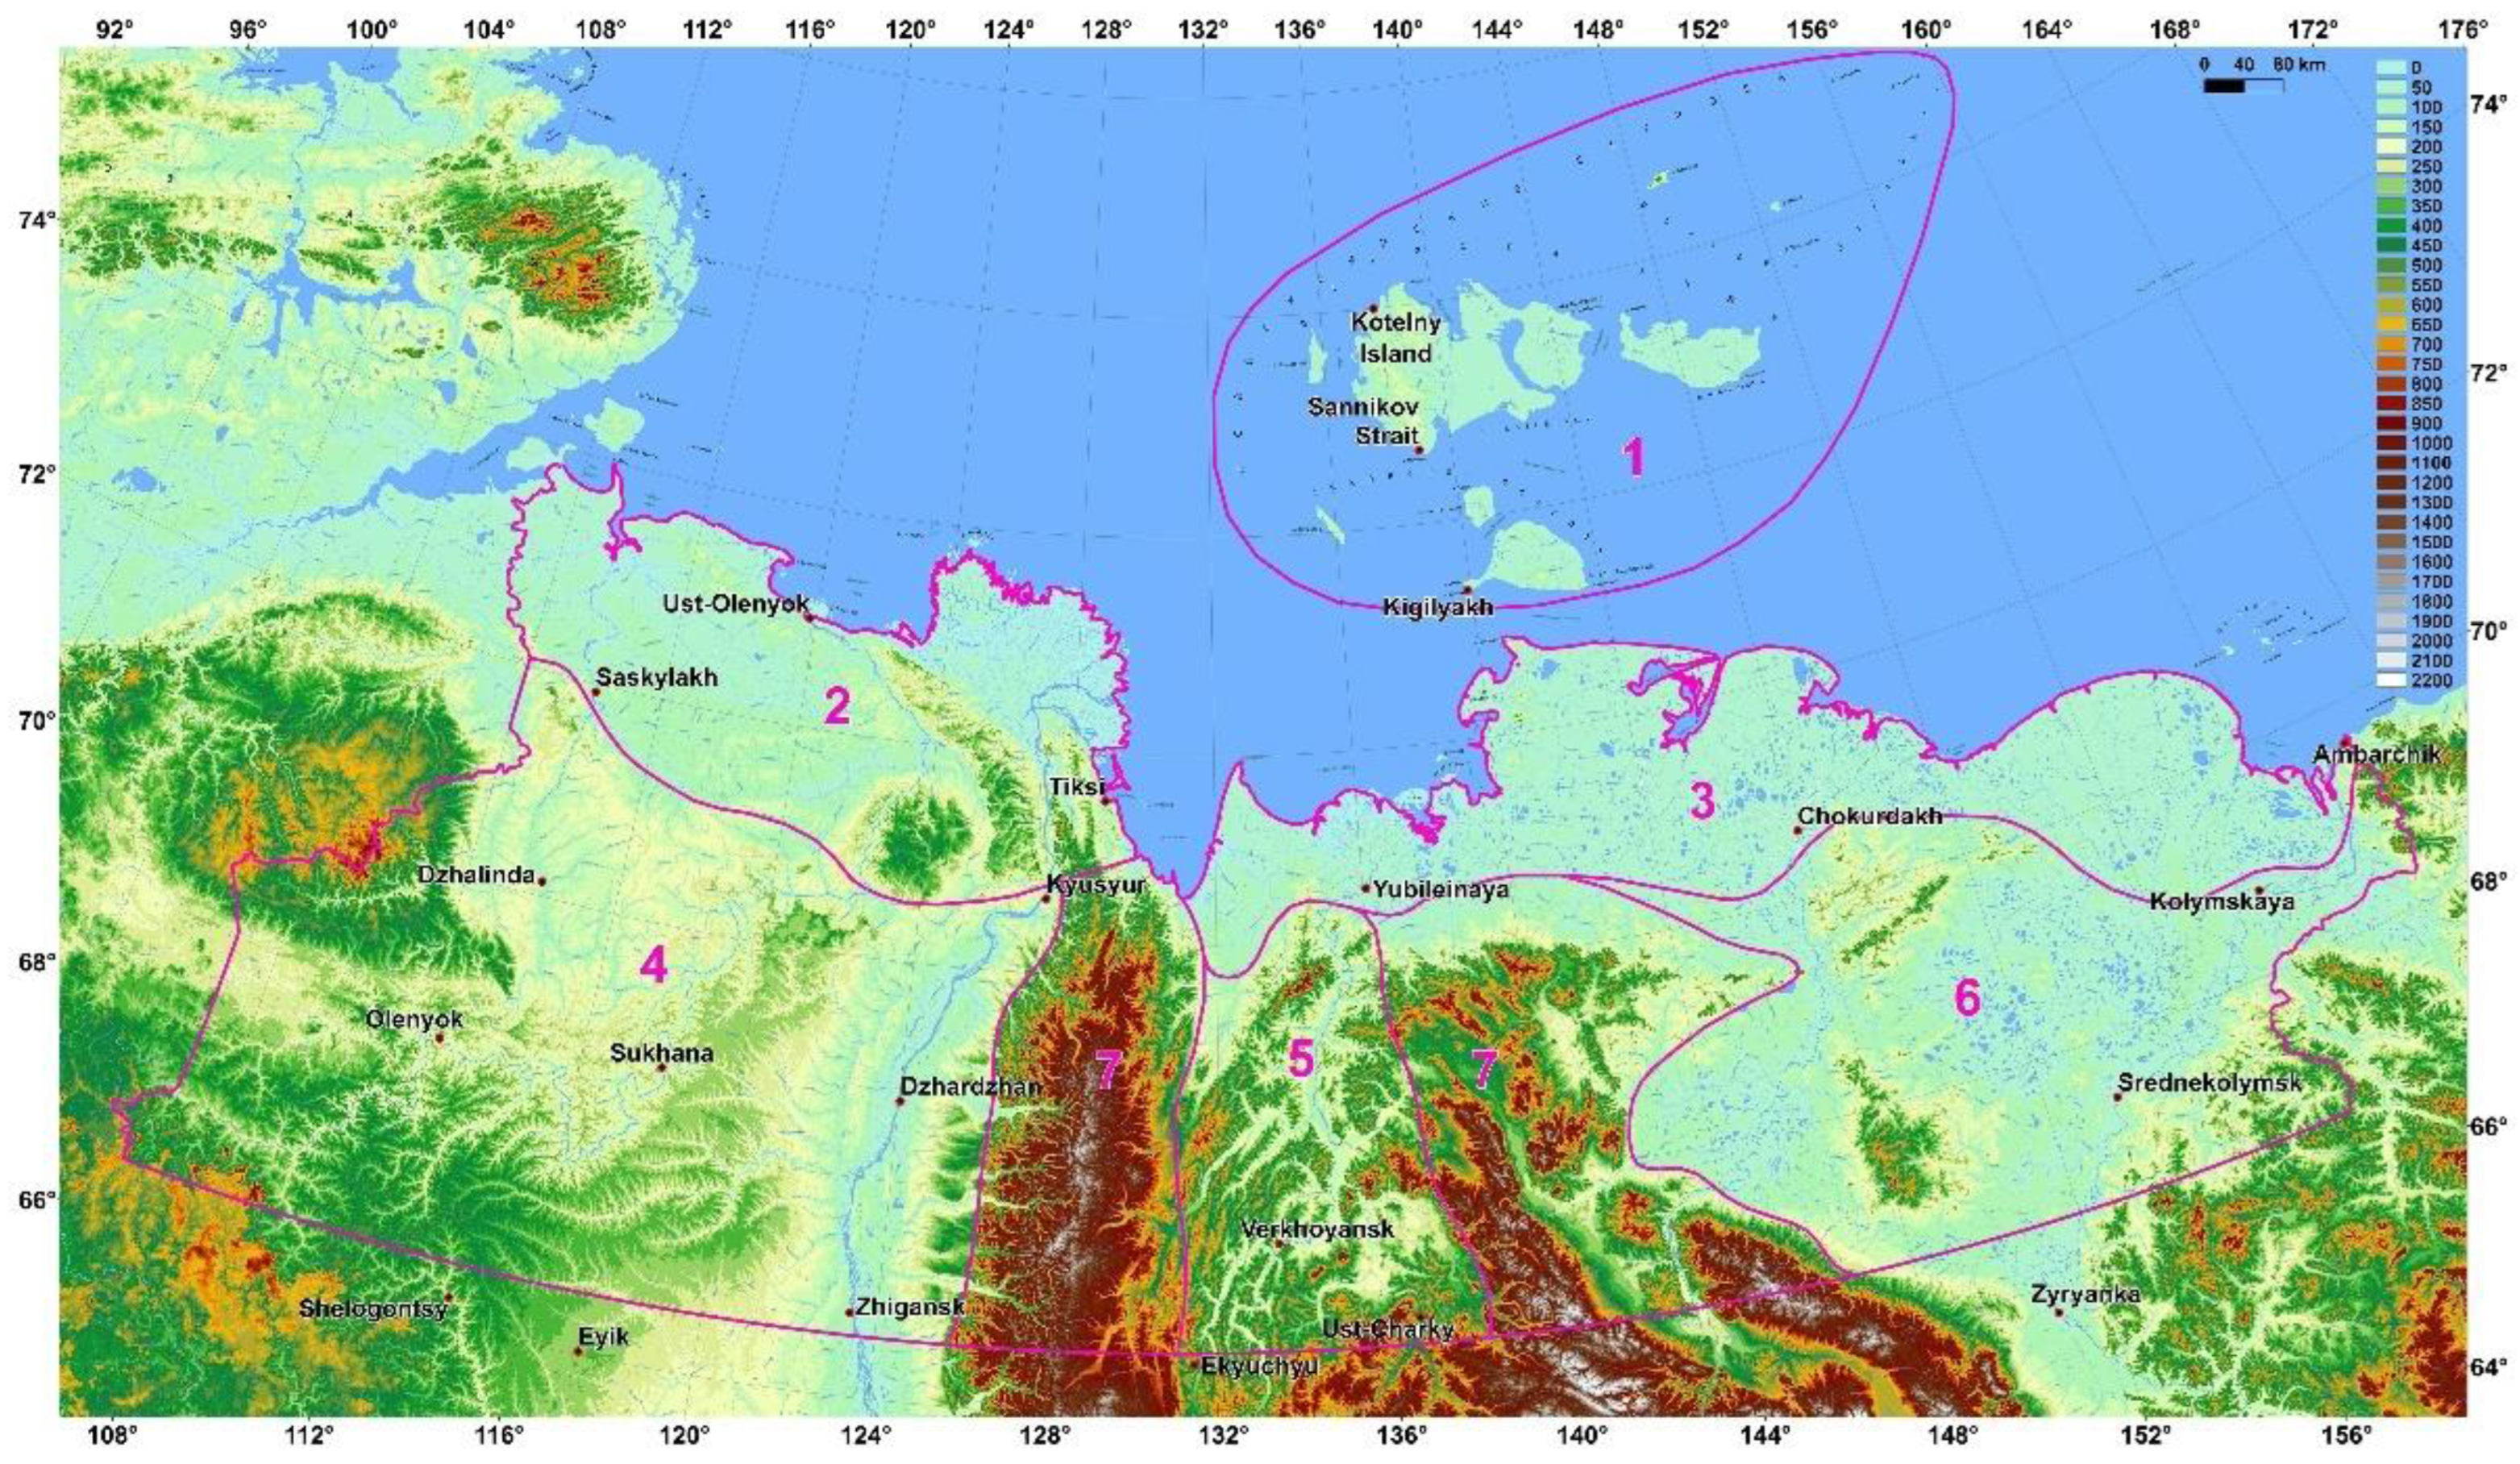
The geological and geomorphological histories, as well as the elevation, are the primary factors influencing the natural and landscape features of the regions. Permafrost climatic zoning and permafrost landscape zoning are not the same. Homogeneous climatic conditions can be found in the same permafrost landscape provinces. Hence, we grouped them based on climate characteristics in permafrost regions. From a taxonomic perspective, these permafrost climatic regions have a higher ranking than permafrost landscape provinces. We identified three permafrost climatic regions in the Arctic Yakutia—New Siberian Islands, Lena–Anabar, and Yana–Kolyma. In Subarctic Yakutia, the following regions were identified: Lena–Olenek, Yana, Kolyma–Indigirka, and Verkhoyansk–Chersky (
Figure 3). Climate changes in the Verkhoyansk–Chersky region remain unknown due to the absence of long-term weather stations.
3.1. Climate Variability in the Arctic Region of Yakutia over the Past 50-60 Years
The mean annual air temperature in the Arctic zone of the Republic of Sakha (Yakutia) ranged from -11.8 °C (Ambarchik) to -14.4 °C (Sannikov Strait) between 1965 and 2023 (
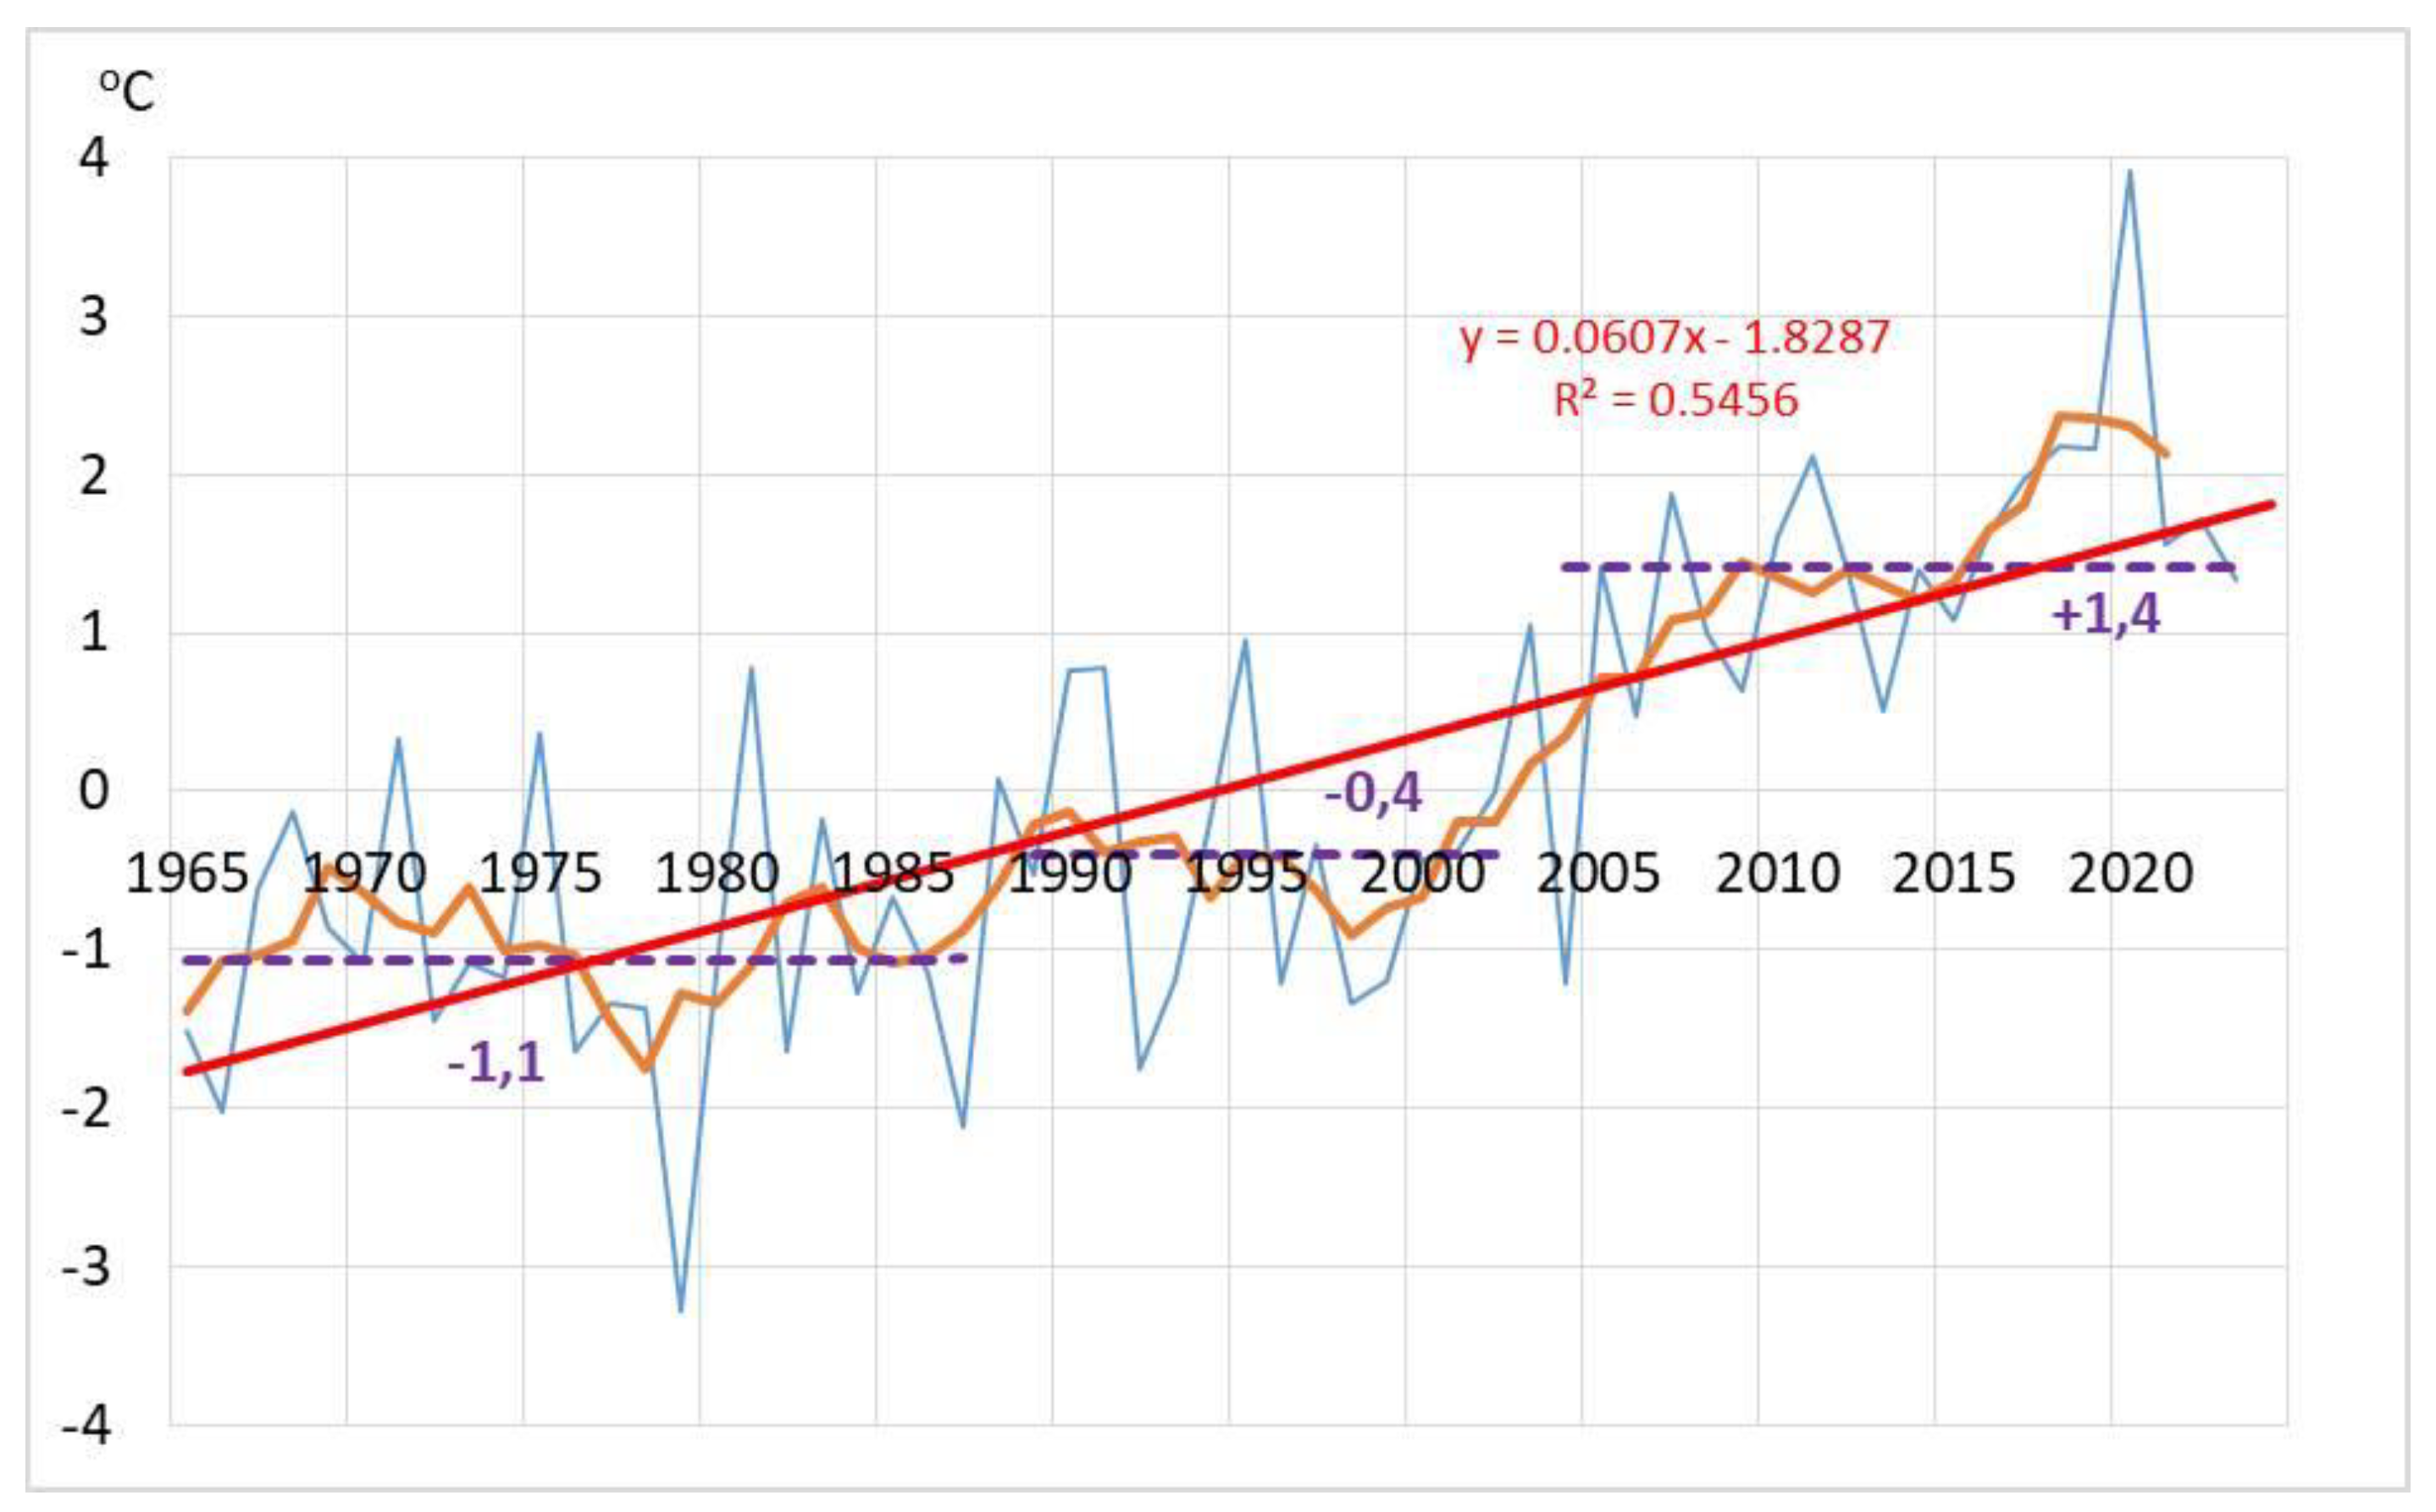
Table 1). The interannual variability of the mean annual air temperature is characterized by two distinct boundaries—1987-1988 and 2004-2005—marked by significant developmental shifts. Three periods were identified, 1965-1987, 1988-2002, and 2003-2023, each with different development characteristics (
Figure 4). The periods can be defined as 1965-1987, representing a cold era; 1988-2004, pre-warming; and 2005-2023, modern warming. The mean annual air temperature in the tundra zone of Yakutia increased at a rate of 0.06 °C per year from 1965 to 2023.
The correlation coefficient of the mean annual air temperatures varies among the three permafrost climatic regions. In New Siberian Islands (Kotelny Island, Sannikov Strait, and Kigilyakh weather stations), it is 0.97-0.99; in the Anabar–Lena region (Saskylakh, Ust–Olenek, and Tiksi weather stations), it is 0.88-0.91; and in the Yana–Kolyma region (Yubileinaya, Chokurdakh and Ambarchik weather stations), it is 0.50-0.89 (p ≈ 0.05 and n = 55). The Ambarchik weather station at the lower part of the Kolyma River basin has slightly different data than the other stations. In 1965-1987, the mean deviation of the mean annual temperature for all weather stations was -1.1 °C from the norm for the entire period of 1965-2023, -0.4 °C in 1988-2004, and +1.4 °C in 2005-2023 (see
Figure 4). The Arctic zone of Yakutia experienced significant warming starting in 2005.
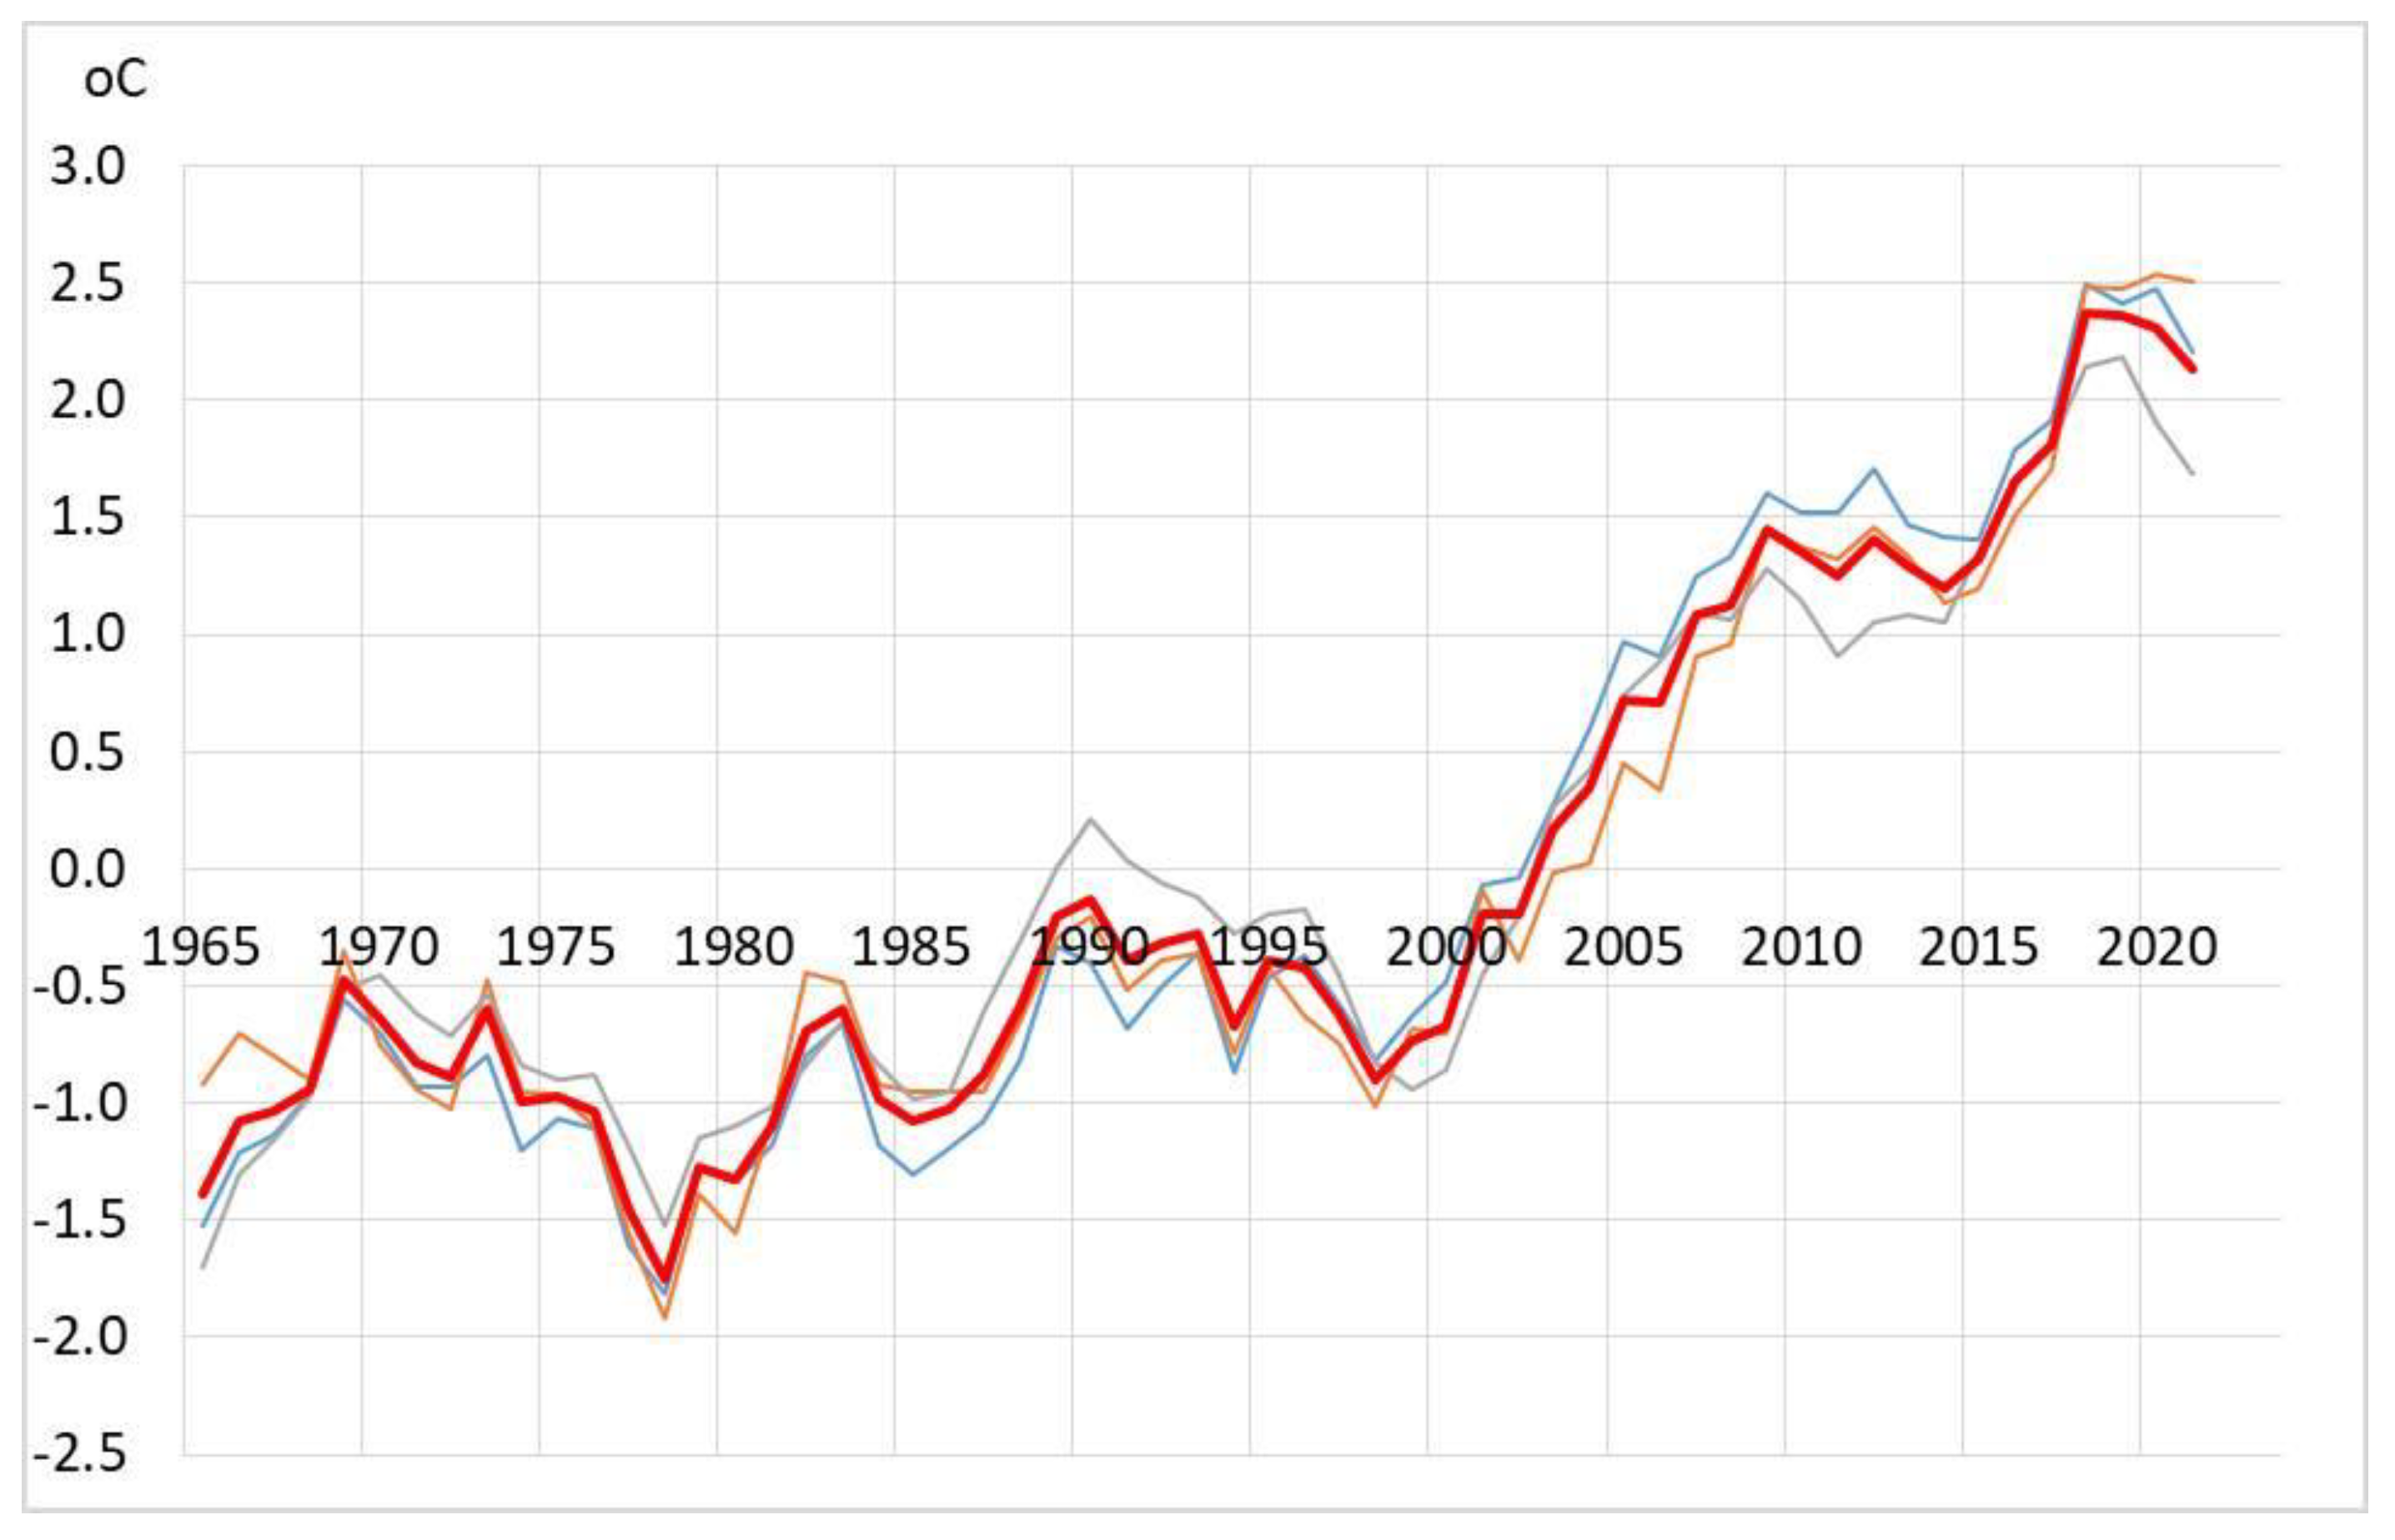
While the three tundra regions show similar development trends in the mean annual air temperature, there are some differences between them (
Figure 5). The Novosibirsk Islands experienced a more intense cold from 1965 to 1987. During the pre-warming period (1988-2004), the Yana–Kolyma region experienced a more substantial temperature increase. Temperature increases during the warming period (2005-2023) were most noticeable on the Novosibirsk Islands and, more recently, in the Anabar–Lena region. In general, in regions, the difference in deviations on average reached 0.5 °C.
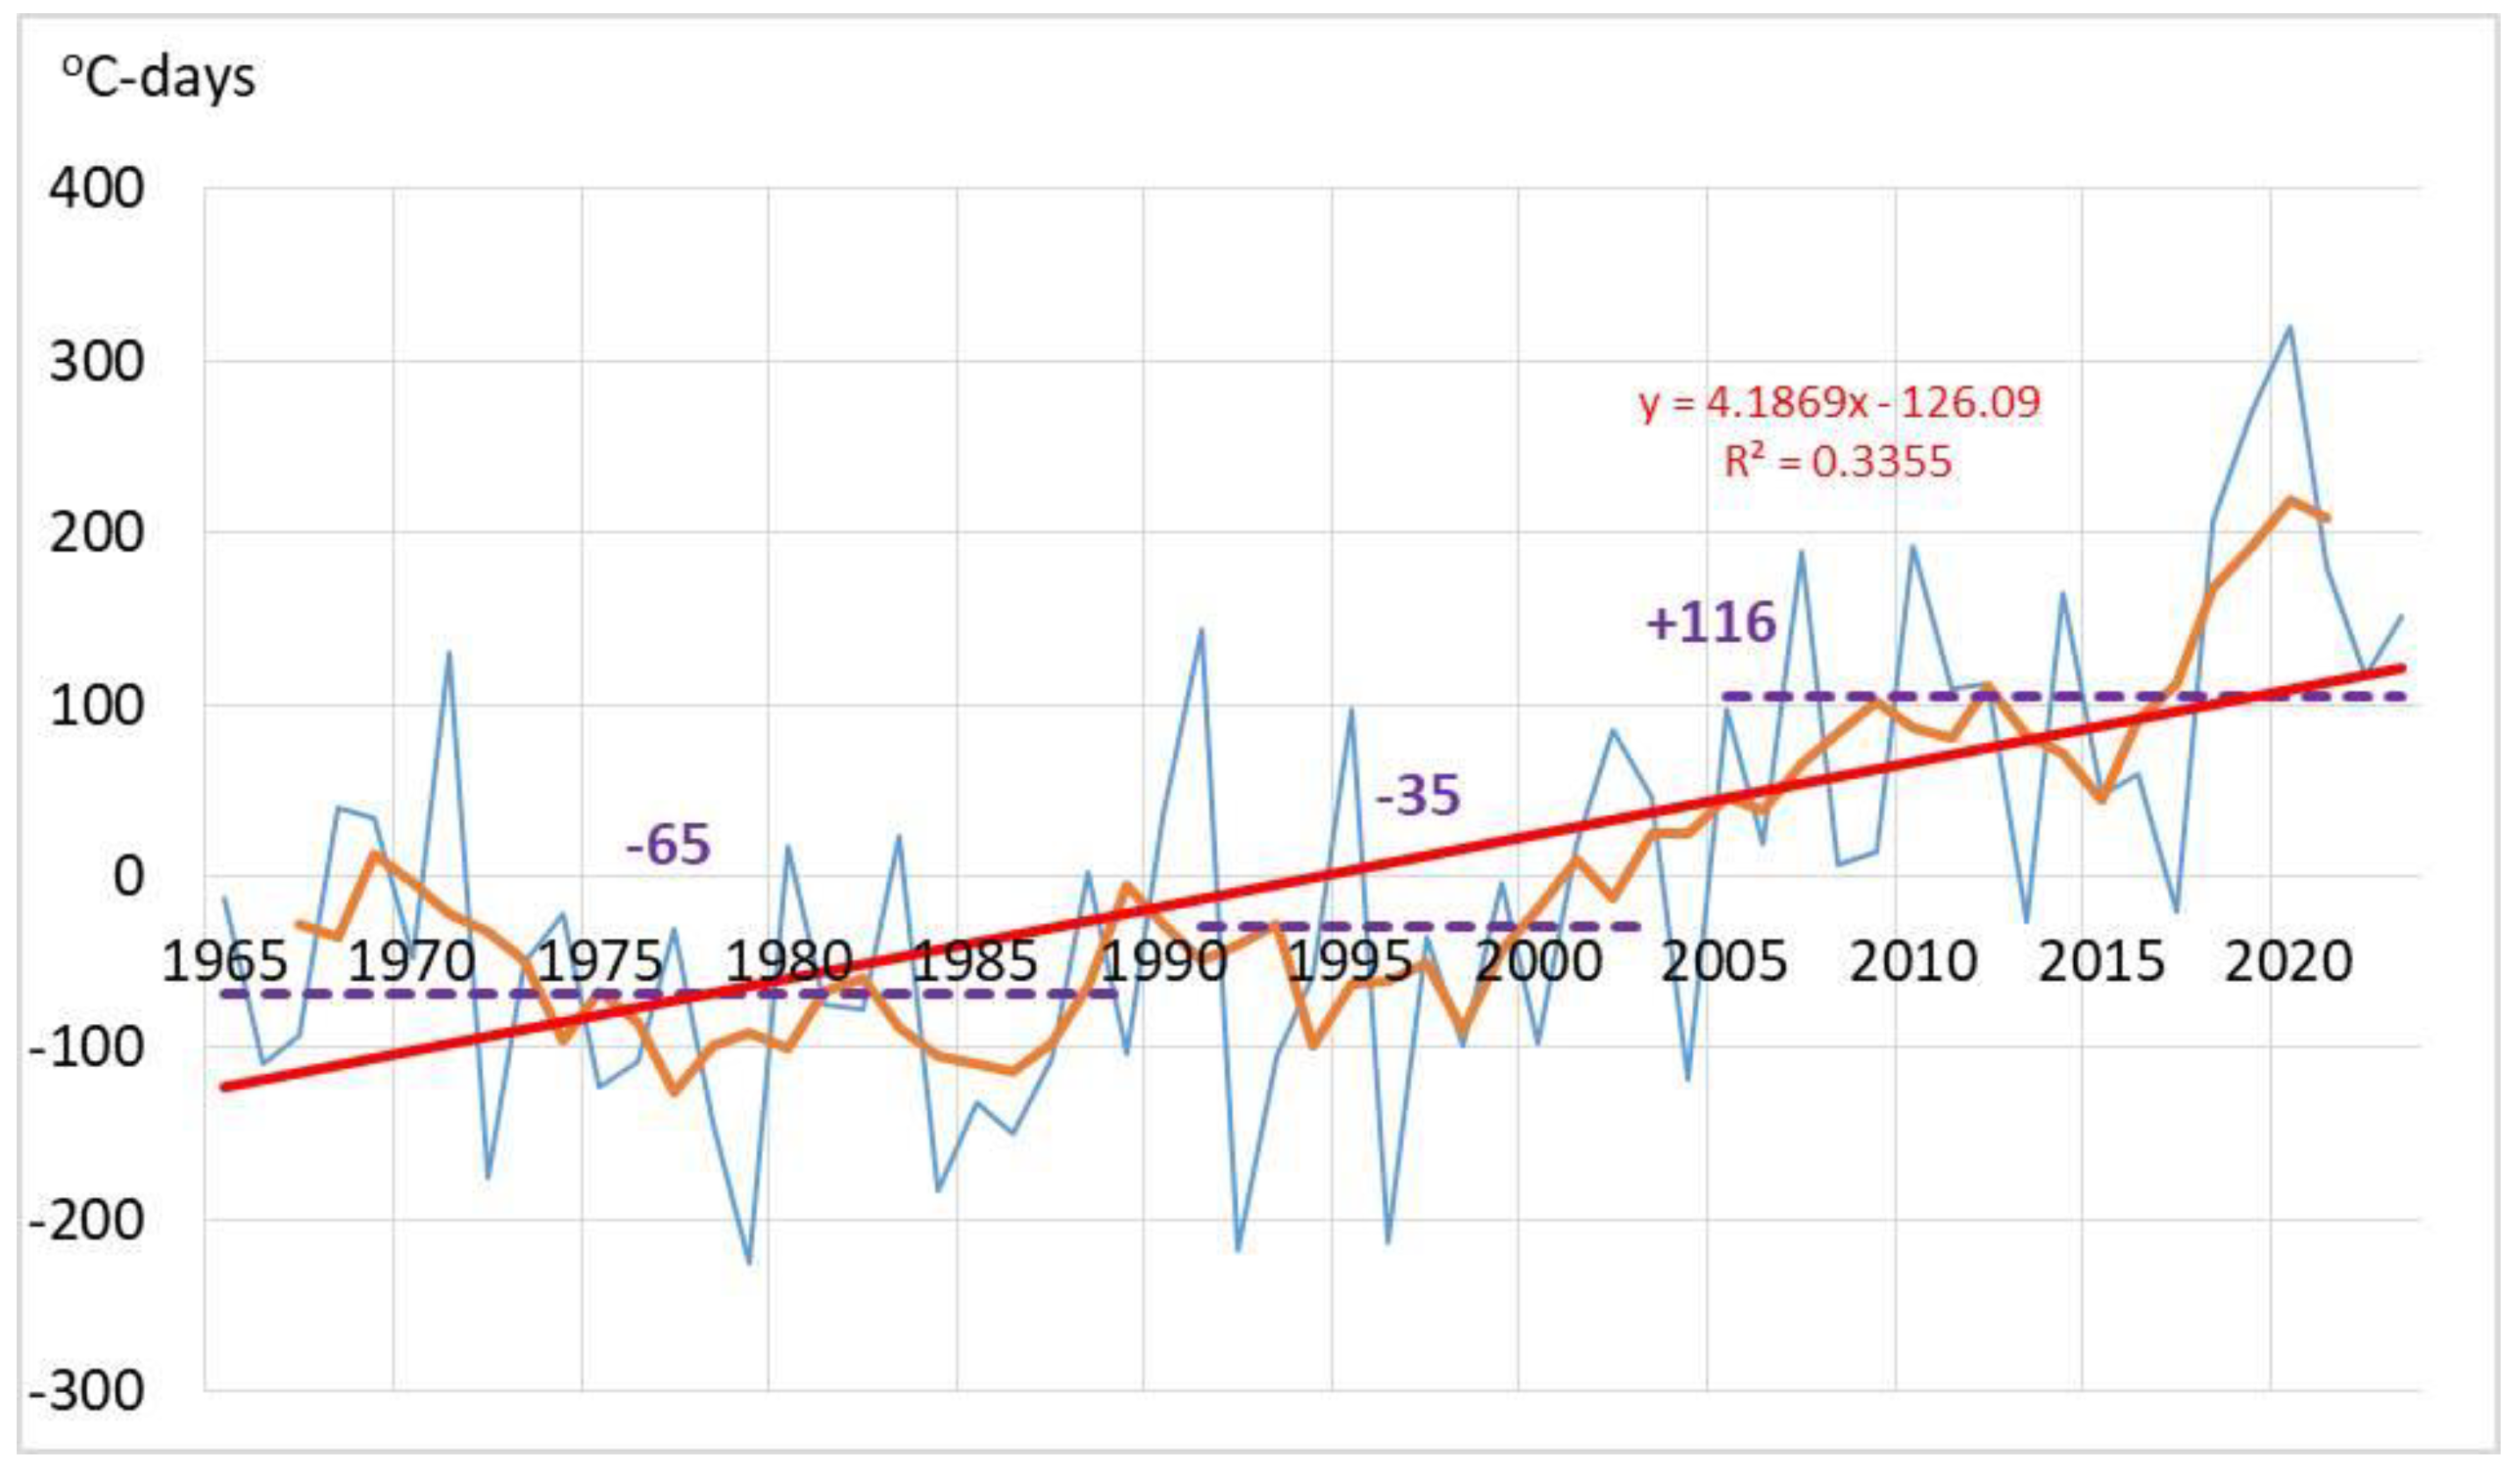
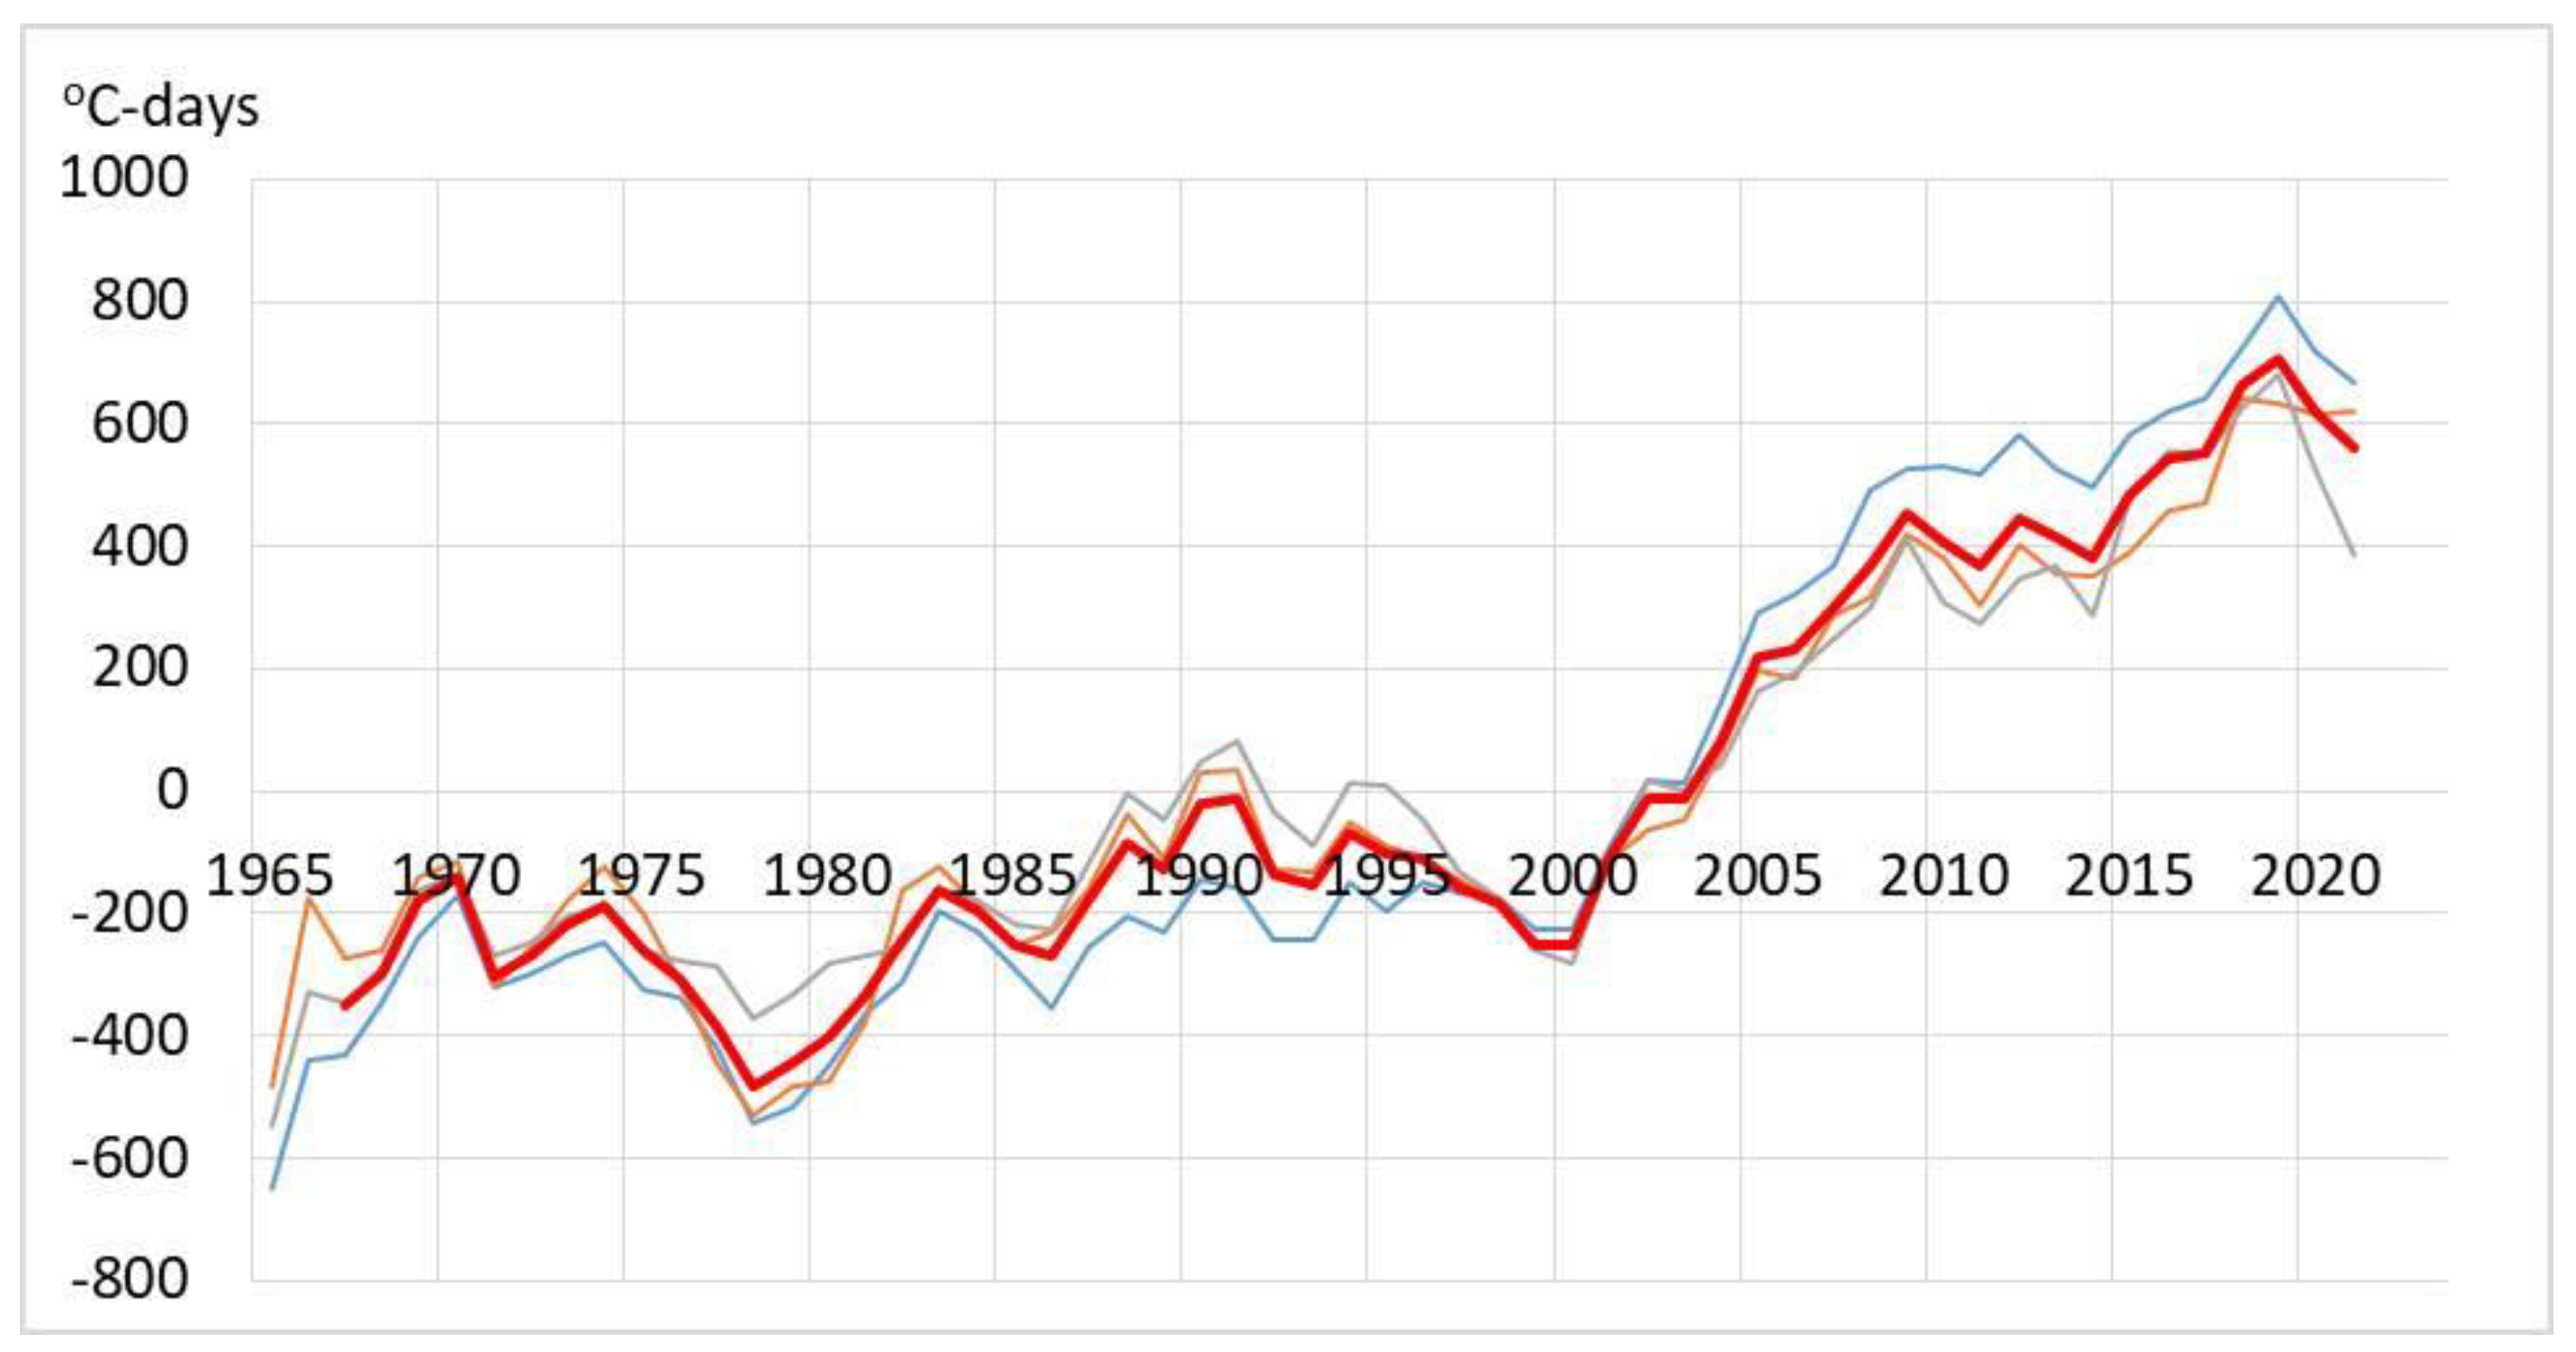
The thawing index in the Arctic zone of the Republic of Sakha (Yakutia) ranges from 198 (Kotelny) to 929
oС days (Yubileinaya) in 1965-2023 (
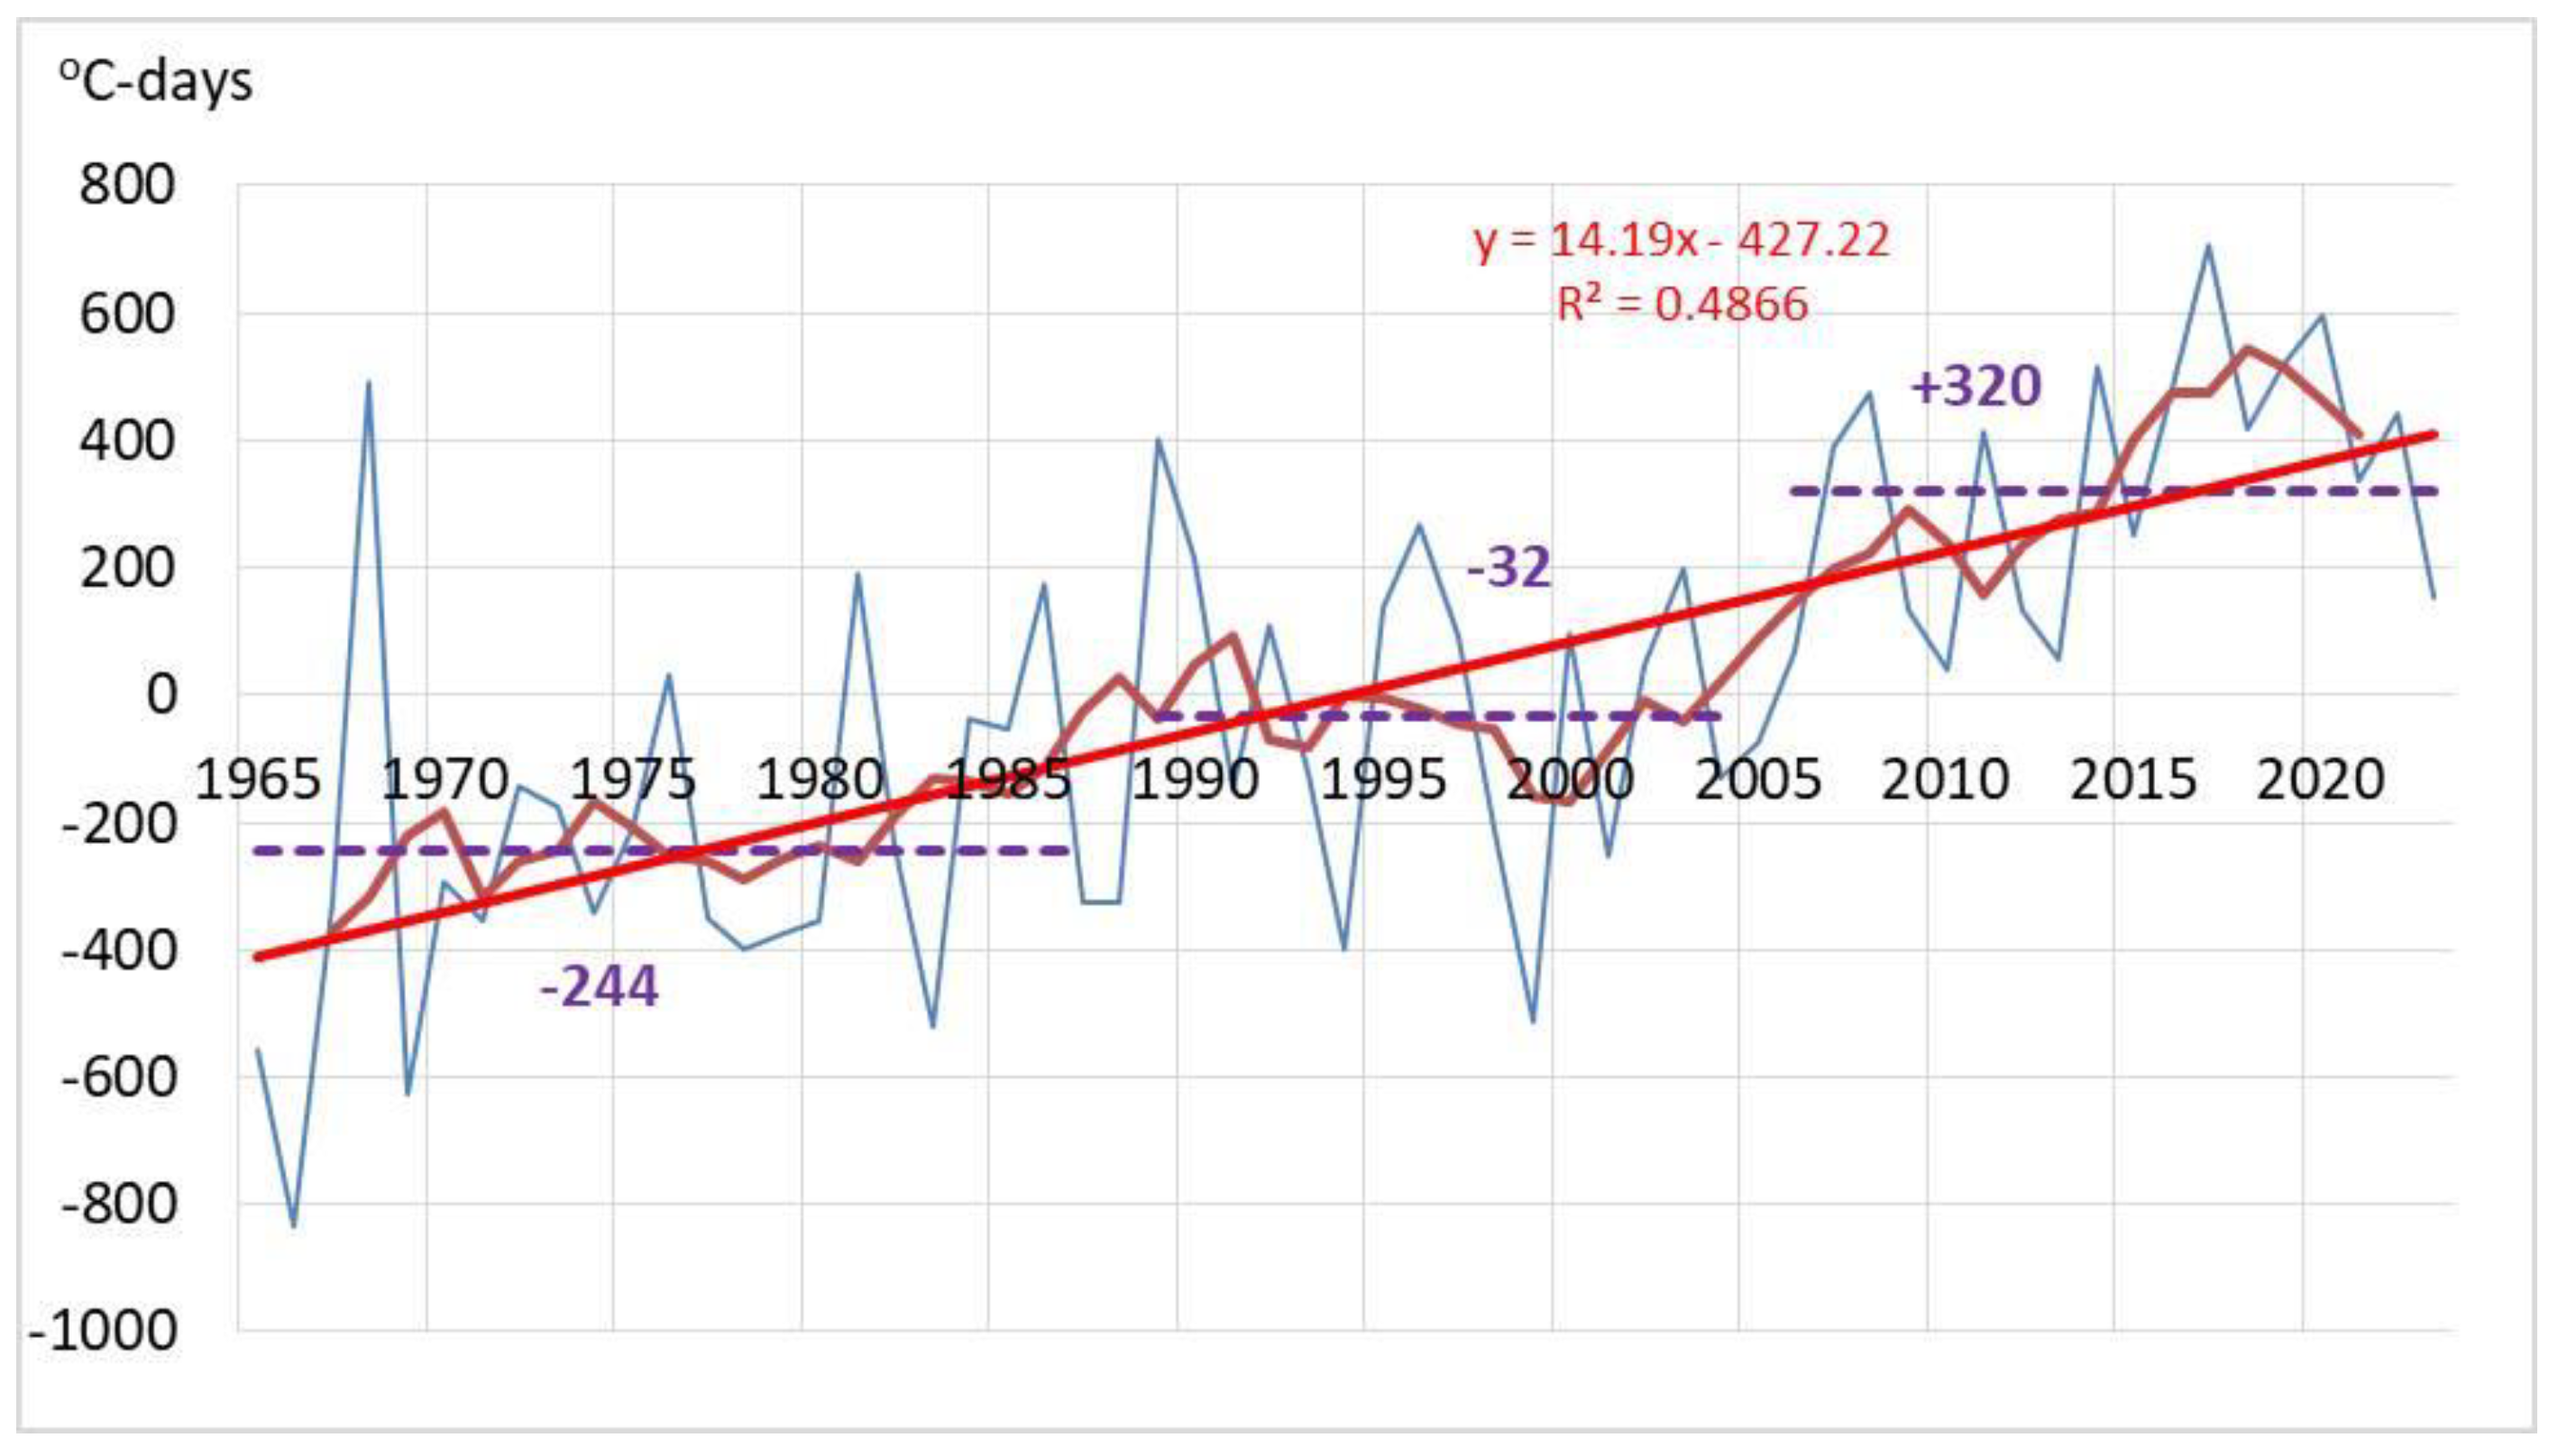
Table 2). The differentiation of tundra landscapes into arctic, typical, and shrubby areas leads to a significant variation in data. Here, three distinct periods are identified—1965-1987, 1988-2004, and 2005-2023 (
Figure 6). During the warmest period from 2005 to 2023, the thawing index in the tundra was 37% higher than in the cold period from 1965 to 1989.
In the New Siberian Islands (Kotelny Island and Kigilyakh) and the Anabar–Lena (Saskylakh, Ust–Olenek, and Tiksi) region, the thawing index at weather stations has a correlation coefficient of 0.74-0.89 (p ˂ 0.05 and n= 59), and in Yana–Kolyma region (Yubileinaya, Chokurdakh, and Ambarchik), it is 0.45-0.89 (p ˂ 0.05 and n=55). The data collected at the Ambarchik weather station on the lower Kolyma River differ significantly from other stations.
The mean deviation in the thawing index for all weather stations was -65
oC days from the norm during 1965-1987, -35
oC days during 1988-2004, and +116
oC days during 2005-2023 (see
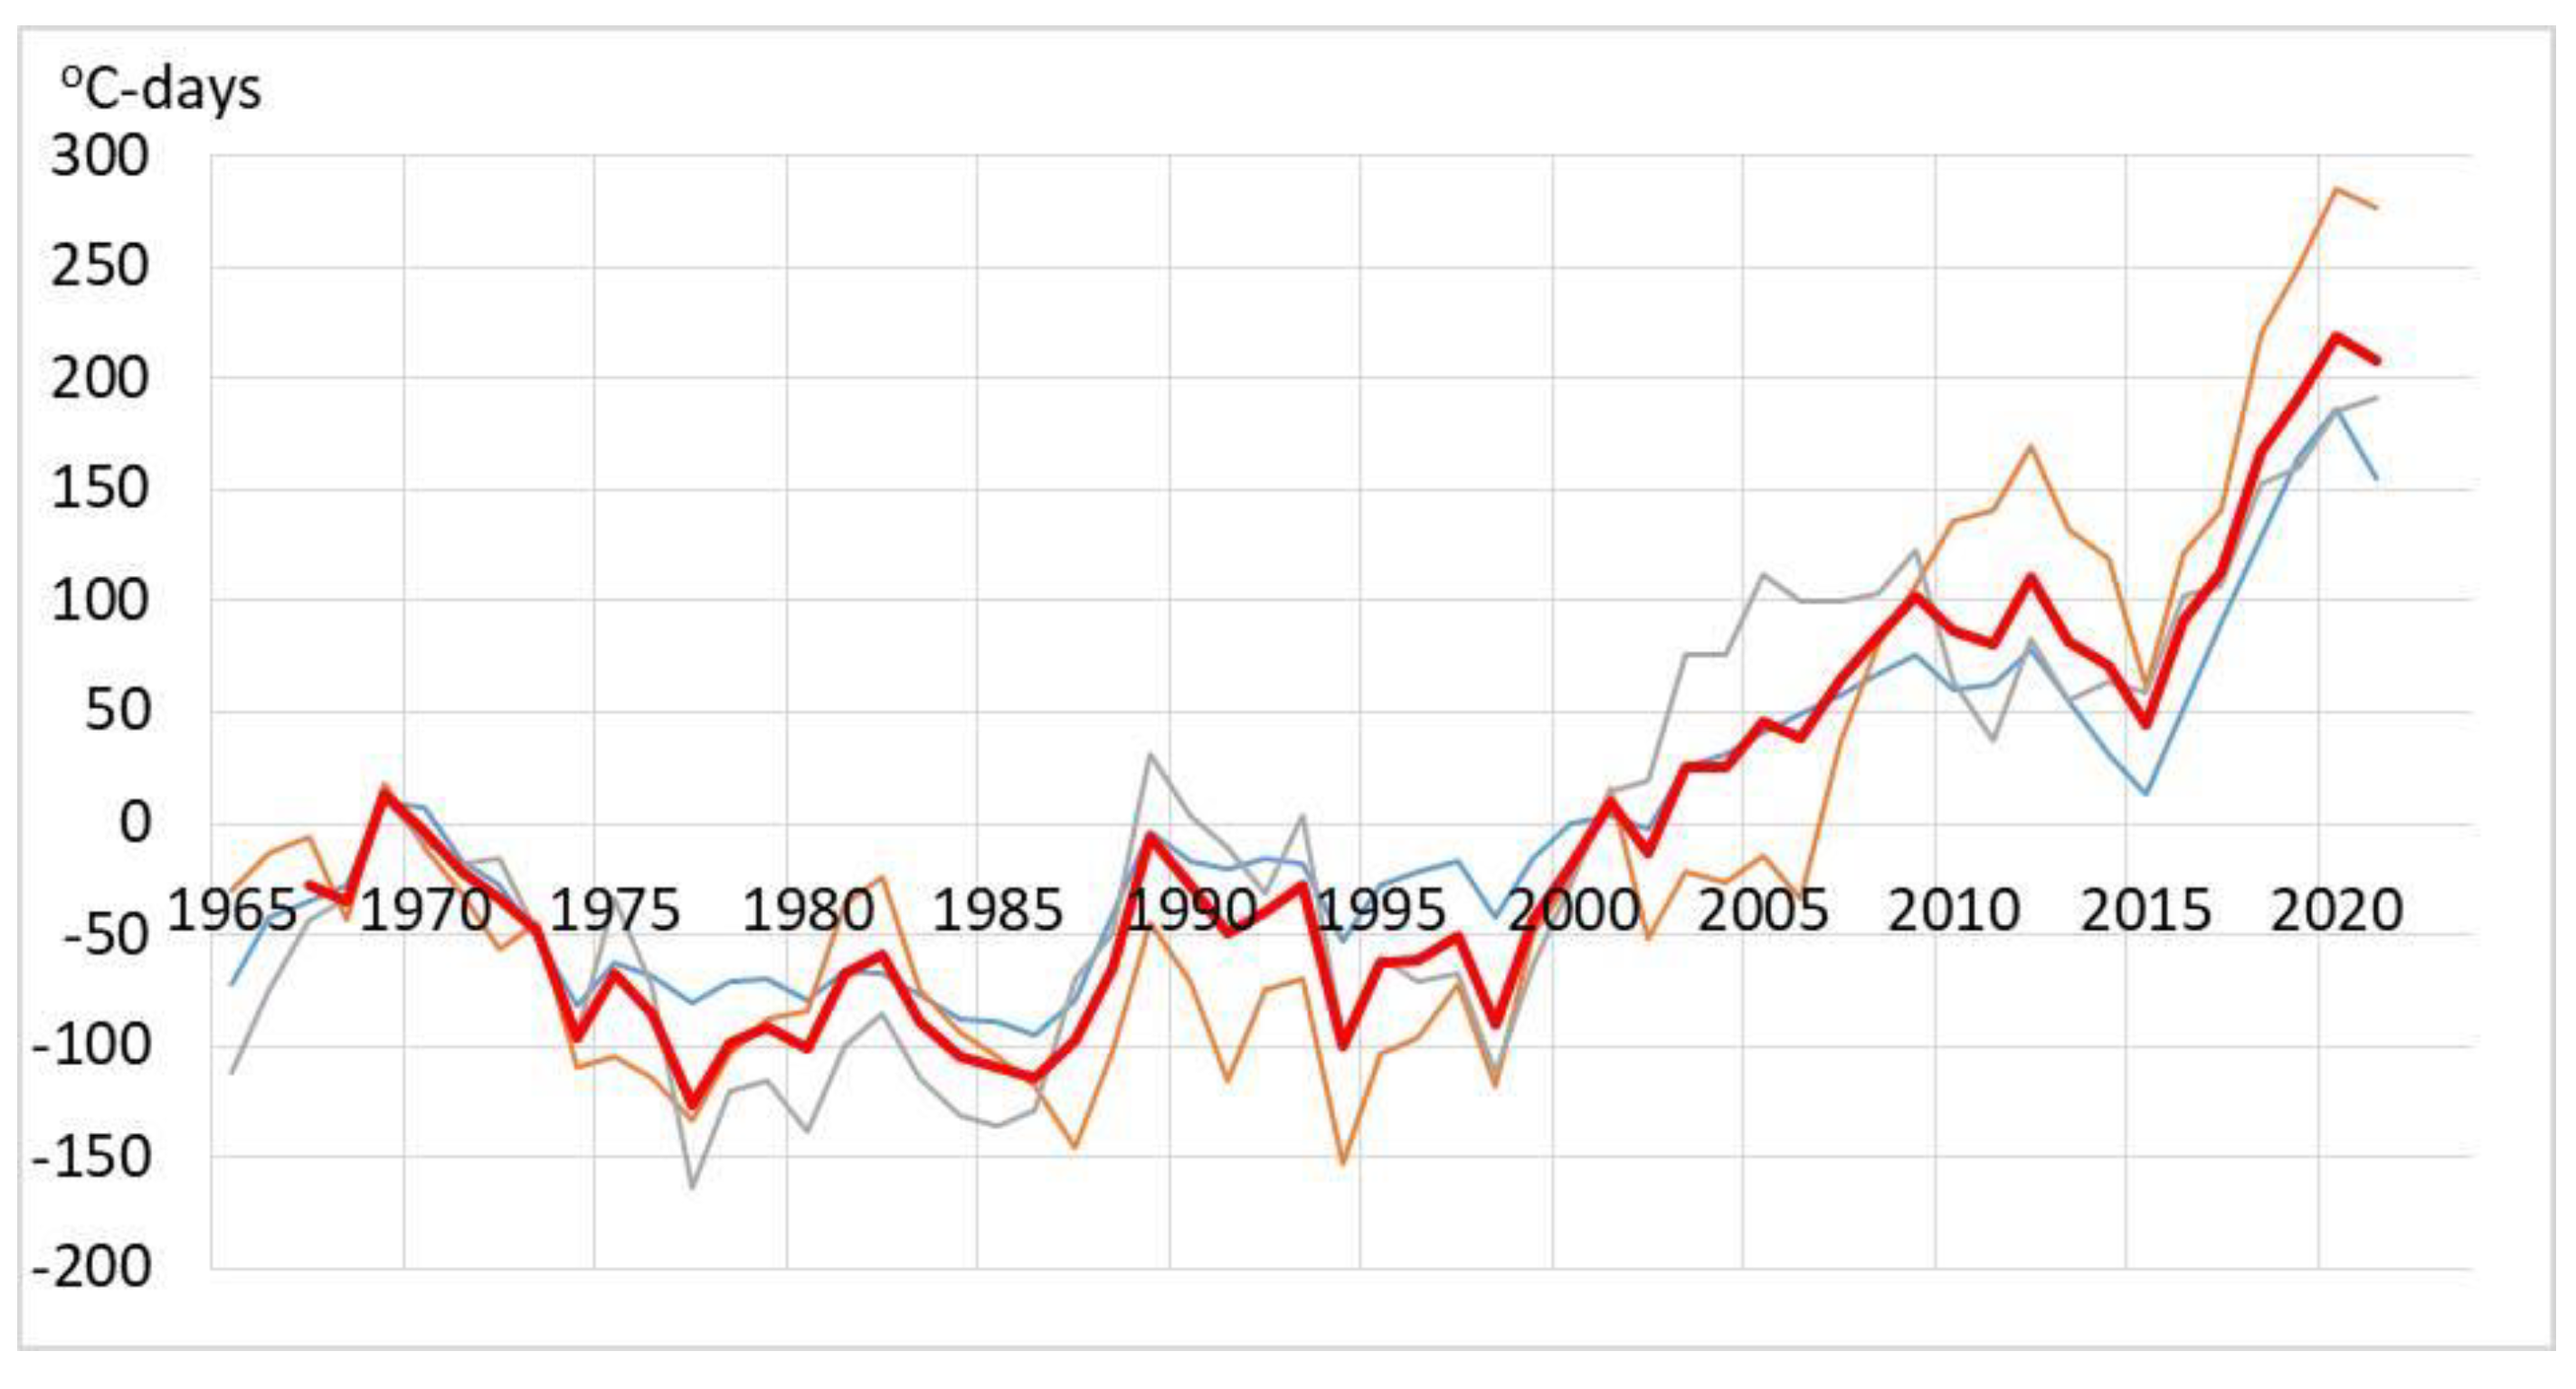
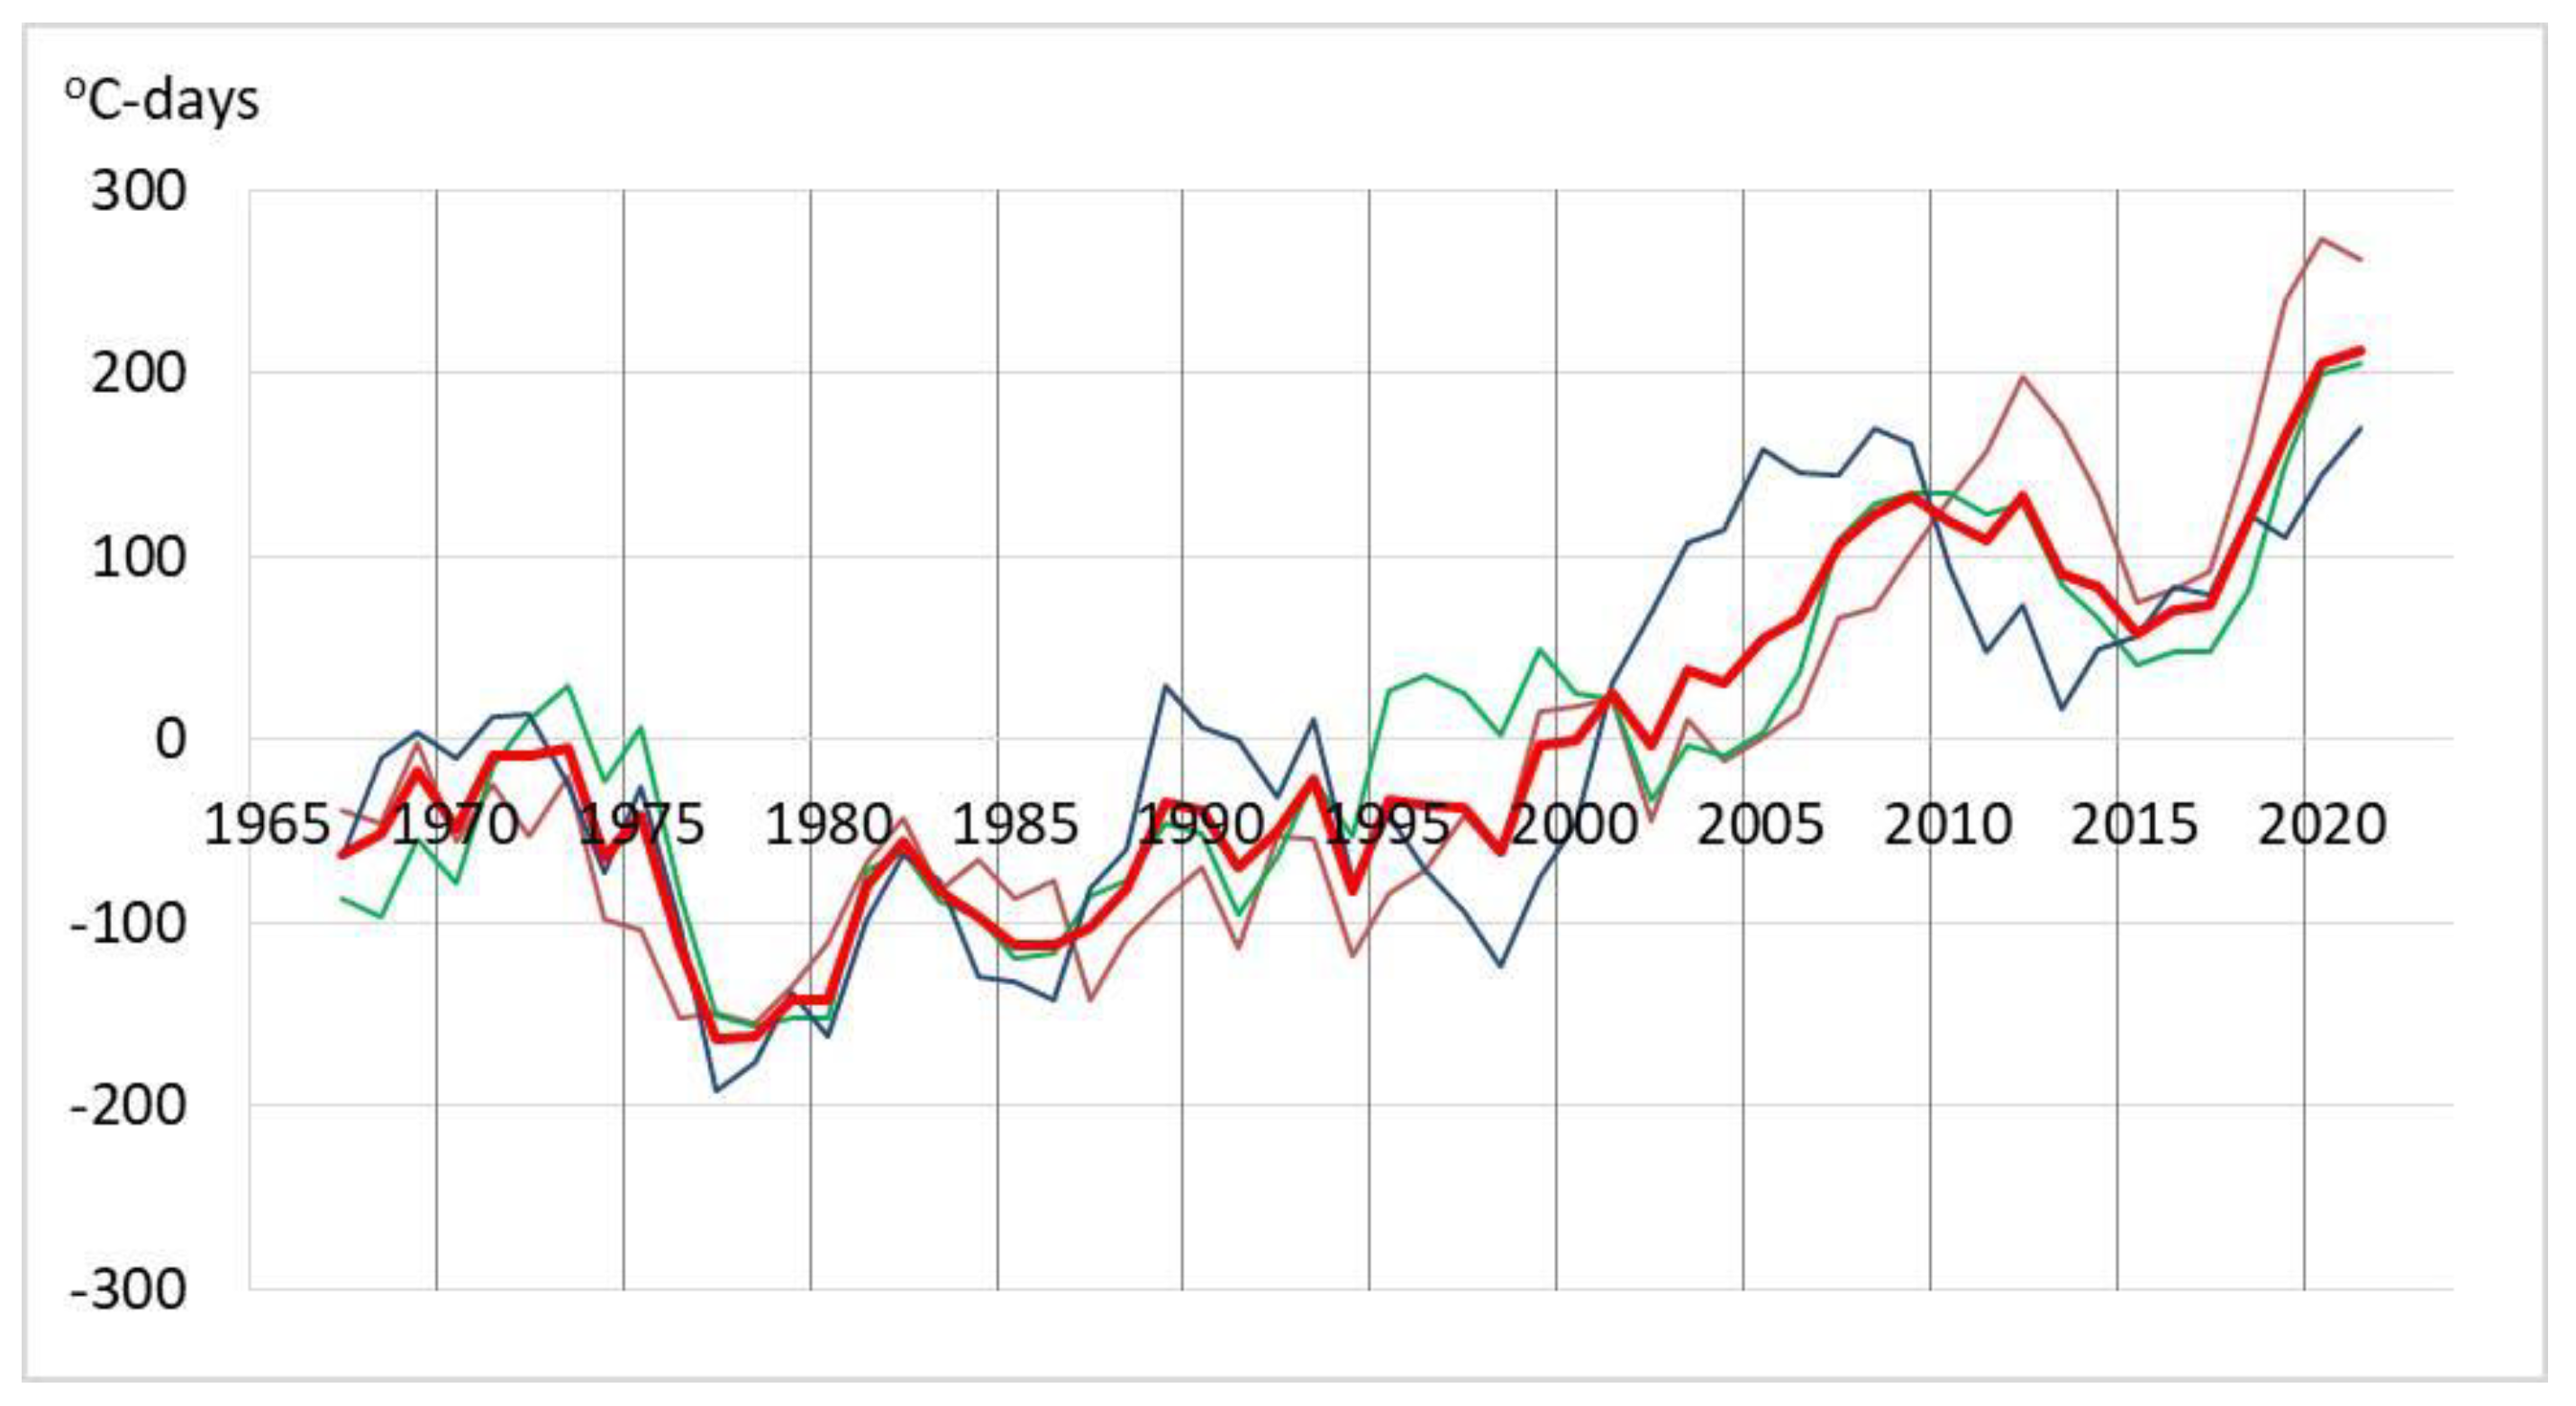
Figure 5). The Arctic zone experienced increasingly noticeable warming during summer since 2005. The variability of the thaw index shows a relatively uniform trend across the three tundra regions, with some differences observed (
Figure 7). Between 1965 and 1987, the Yana–Kolyma region had a lower summer temperature rise. The Anabar–Lena region experienced a more noticeable temperature increase during the summer periods from 2005 to 2023.
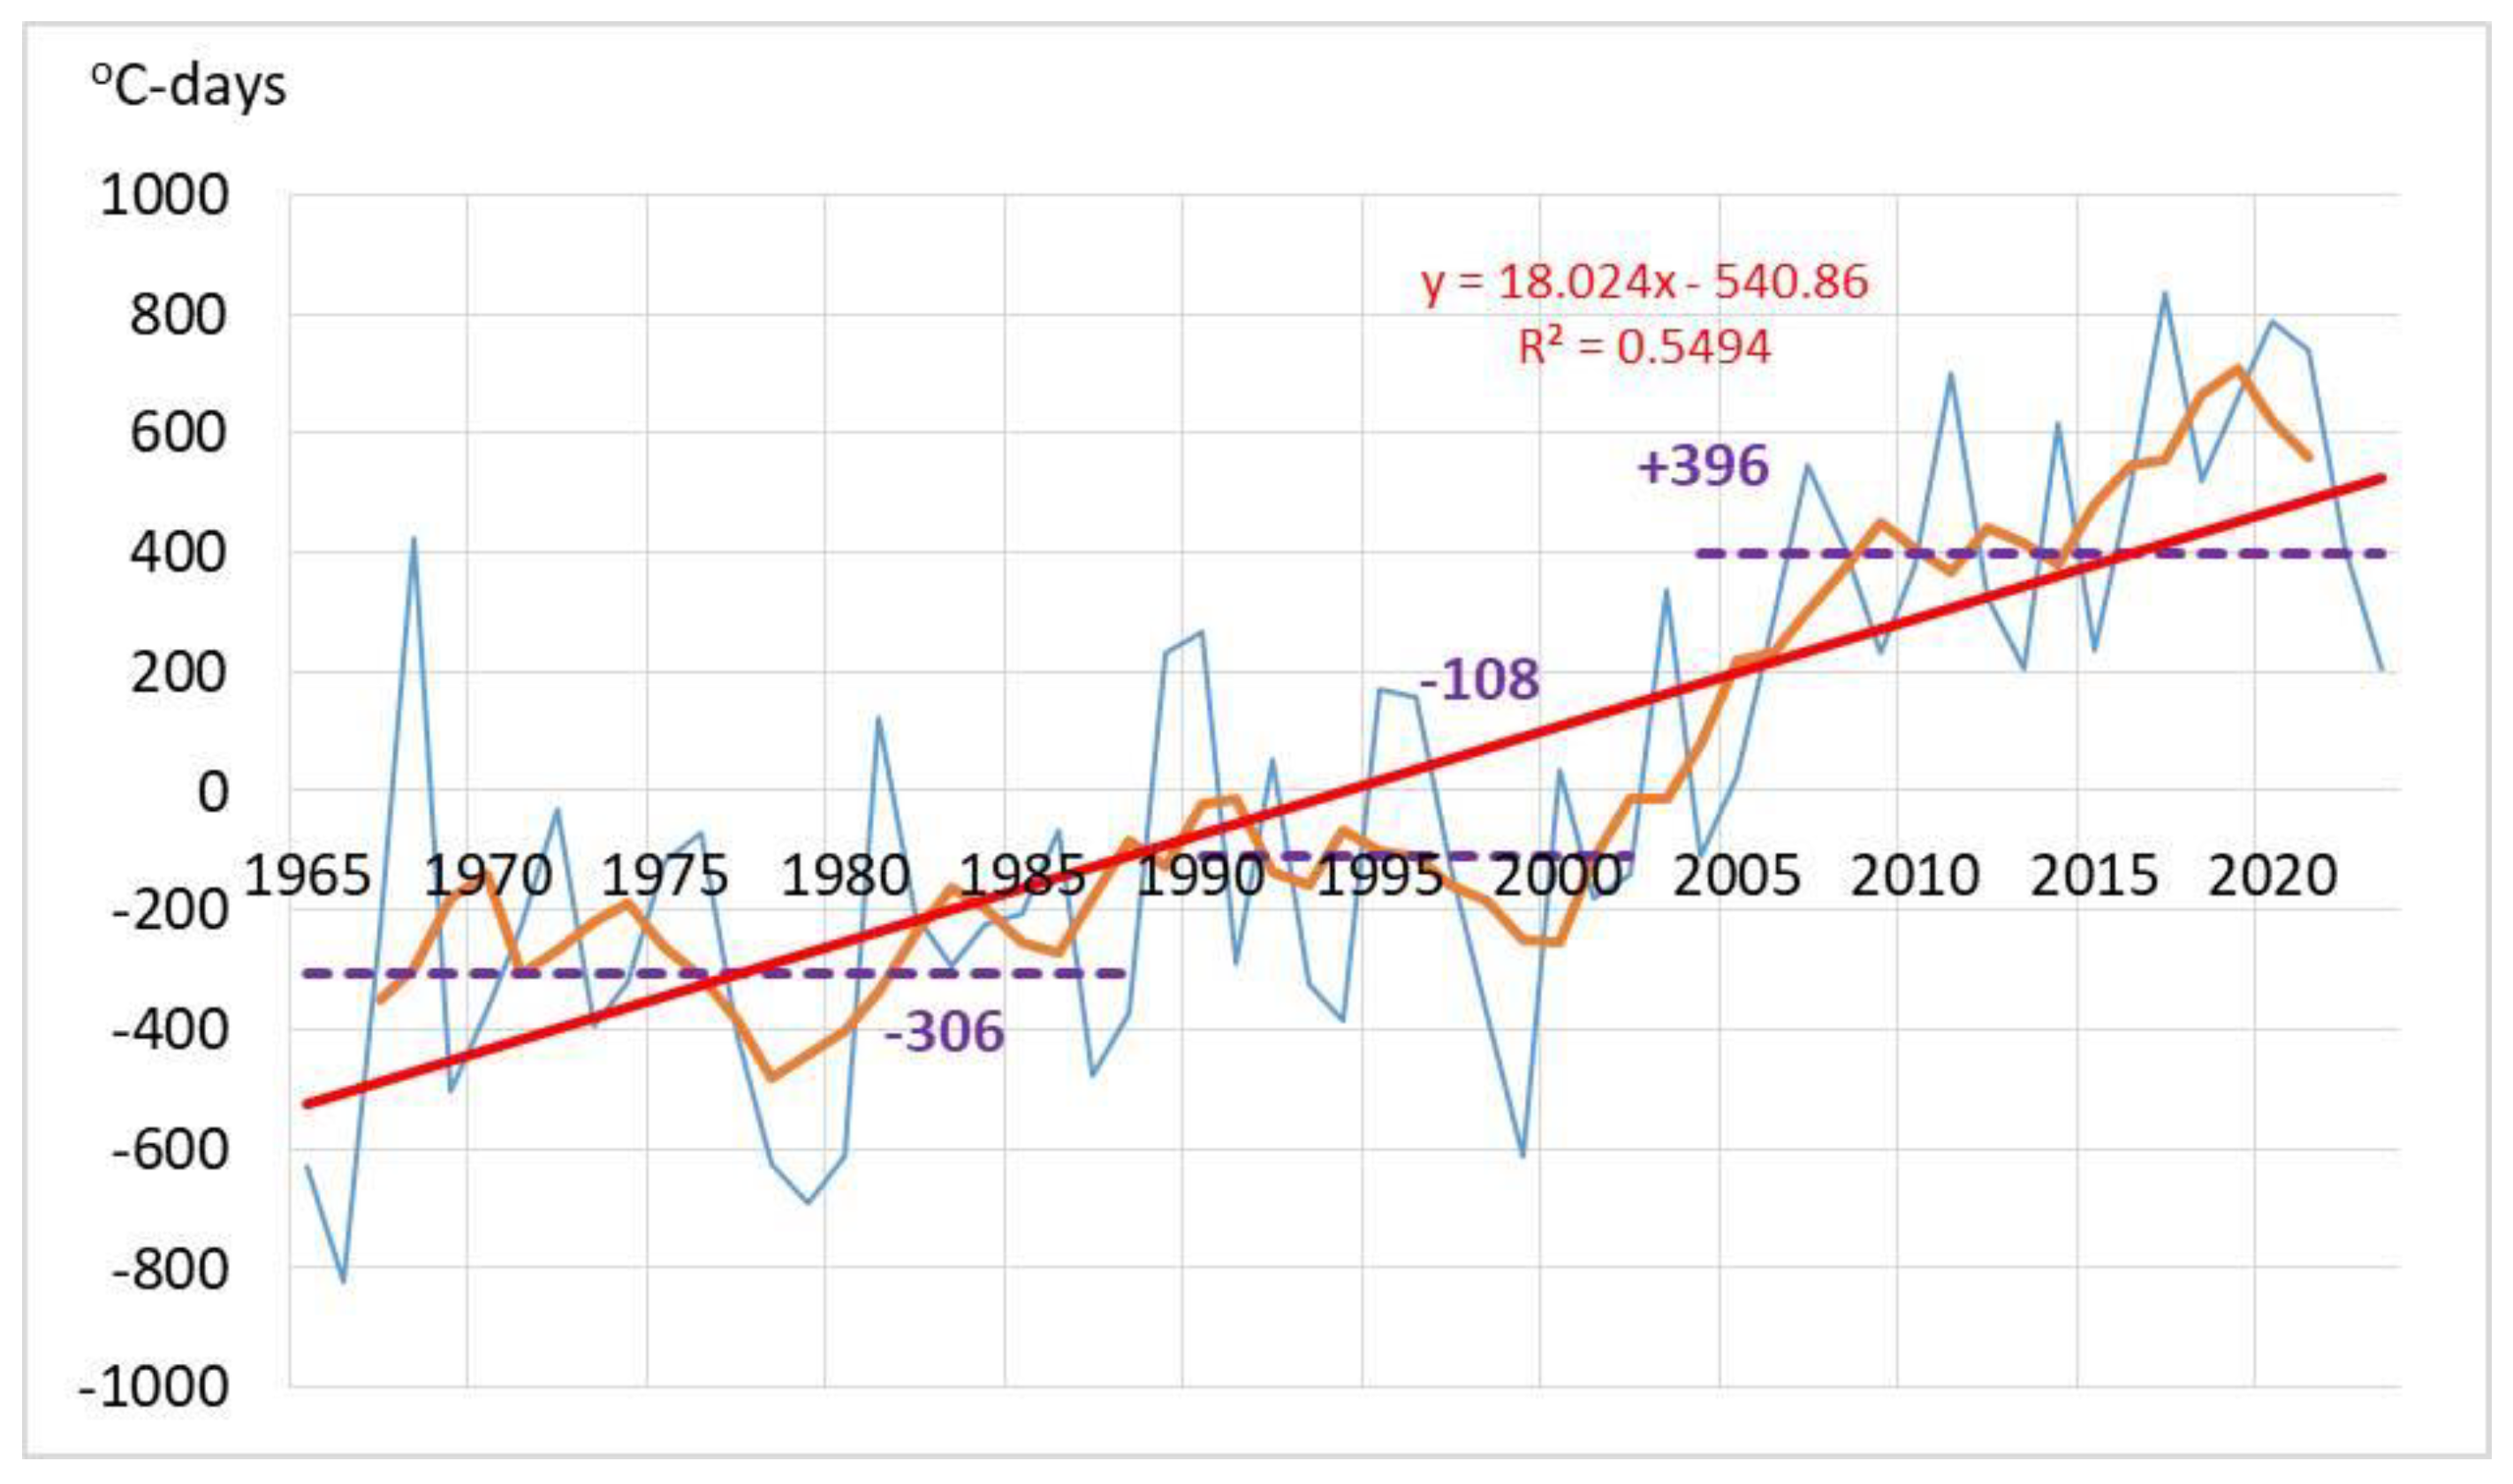
The freezing index in 1965-2023 in the tundra zone of the Republic of Sakha (Yakutia) varied from -4936 (Ambarchik) to -5935
oC days (Saskylakh) (
Table 3). Three different periods were distinguished—1965-1988, 1989-2004, and 2005-2023 (
Figure 8). The freezing index in the tundra in the warmest period of 2005-2023 was, on average, 13% lower compared to the colder period of 1965-1987.
On the New Siberian Islands (Kotelny Island, Sannikov Strait, and Kigilyakh weather stations) and the Lena–Anabar region (Saskylakh, Ust–Olenek, and Tiksi weather stations), the correlation coefficient of mean annual air temperatures at weather stations is 0.83-0.98 at p ˂ 0.05 and n=55, and in Yana–Kolyma (Yubileynaya, Chokurdakh and Ambarchik weather stations), it is 0.67-0.91 (p ˂ 0.05 and n=56). In 1965-1987, the mean value of deviations of the freezing index for all weather stations was -306
oC–days from the norm for the entire period of 1965-2023, -108
oC–days for 1988-2004, and +396
oC–days for 2005-2023 (see
Figure 7).
The trends in the freezing index variability by years and periods in the three Arctic regions are relatively uniform, but there are some differences (
Figure 9). In 1965-1988, the most severe winter conditions were typical for the New Siberian Islands, which, in 2005-2023, experienced the highest rates of winter warming.
Precipitation. Weather stations in the Arctic zone of Yakutia, the New Siberian Islands, and the Anabar–Lena region have numerous gaps in precipitation measurements. As examples for these two regions, data from the Kotelny Island and Saskylakh weather stations, which have continuous data since 1966, were used. The Tiksi weather station data were excluded from the Anabar–Olenek region due to the lack of correlation with the Saskylakh weather station data. The data in the Yana–Kolyma region exhibit significant correlations (0.30 to 0.52 at p ˂ 0.05) with n = 47, except for one insignificant correlation between the Yubileinaya and Chokurdakh weather stations. The data from the Tiksi meteorological station show a correlation with the data from all three weather stations in the Yana–Kolyma tundra, ranging from 0.45 to 0.50.
Table 4 shows that the annual precipitation in the tundra zone of the Sakha Republic (Yakutia) ranges from 150.1 mm (Ambarchik) to 214.7 mm (Tiksi) between 1966 and 2023. The Anabar–Lena region (Saskylakh) and the New Siberian Islands (Kotelny Island) are characterized by alternating wet and dry periods with a small amplitude of annual precipitation. The Lena–Anabar region experiences significant alternation with amplitudes averaging up to 100 mm in both positive and negative precipitation phases. The Yano-Kolyma region has experienced a notable decrease in precipitation; the mean variation between 2003-2023 and 1966-1989 was roughly 40 cm. The variability in annual precipitation patterns helps us confirm the division of Yakutia's tundra zone into distinct regions (
Figure 10).
3.2. Climate Variability in the Subarctic Region of Yakutia Over the past 50-60 Years
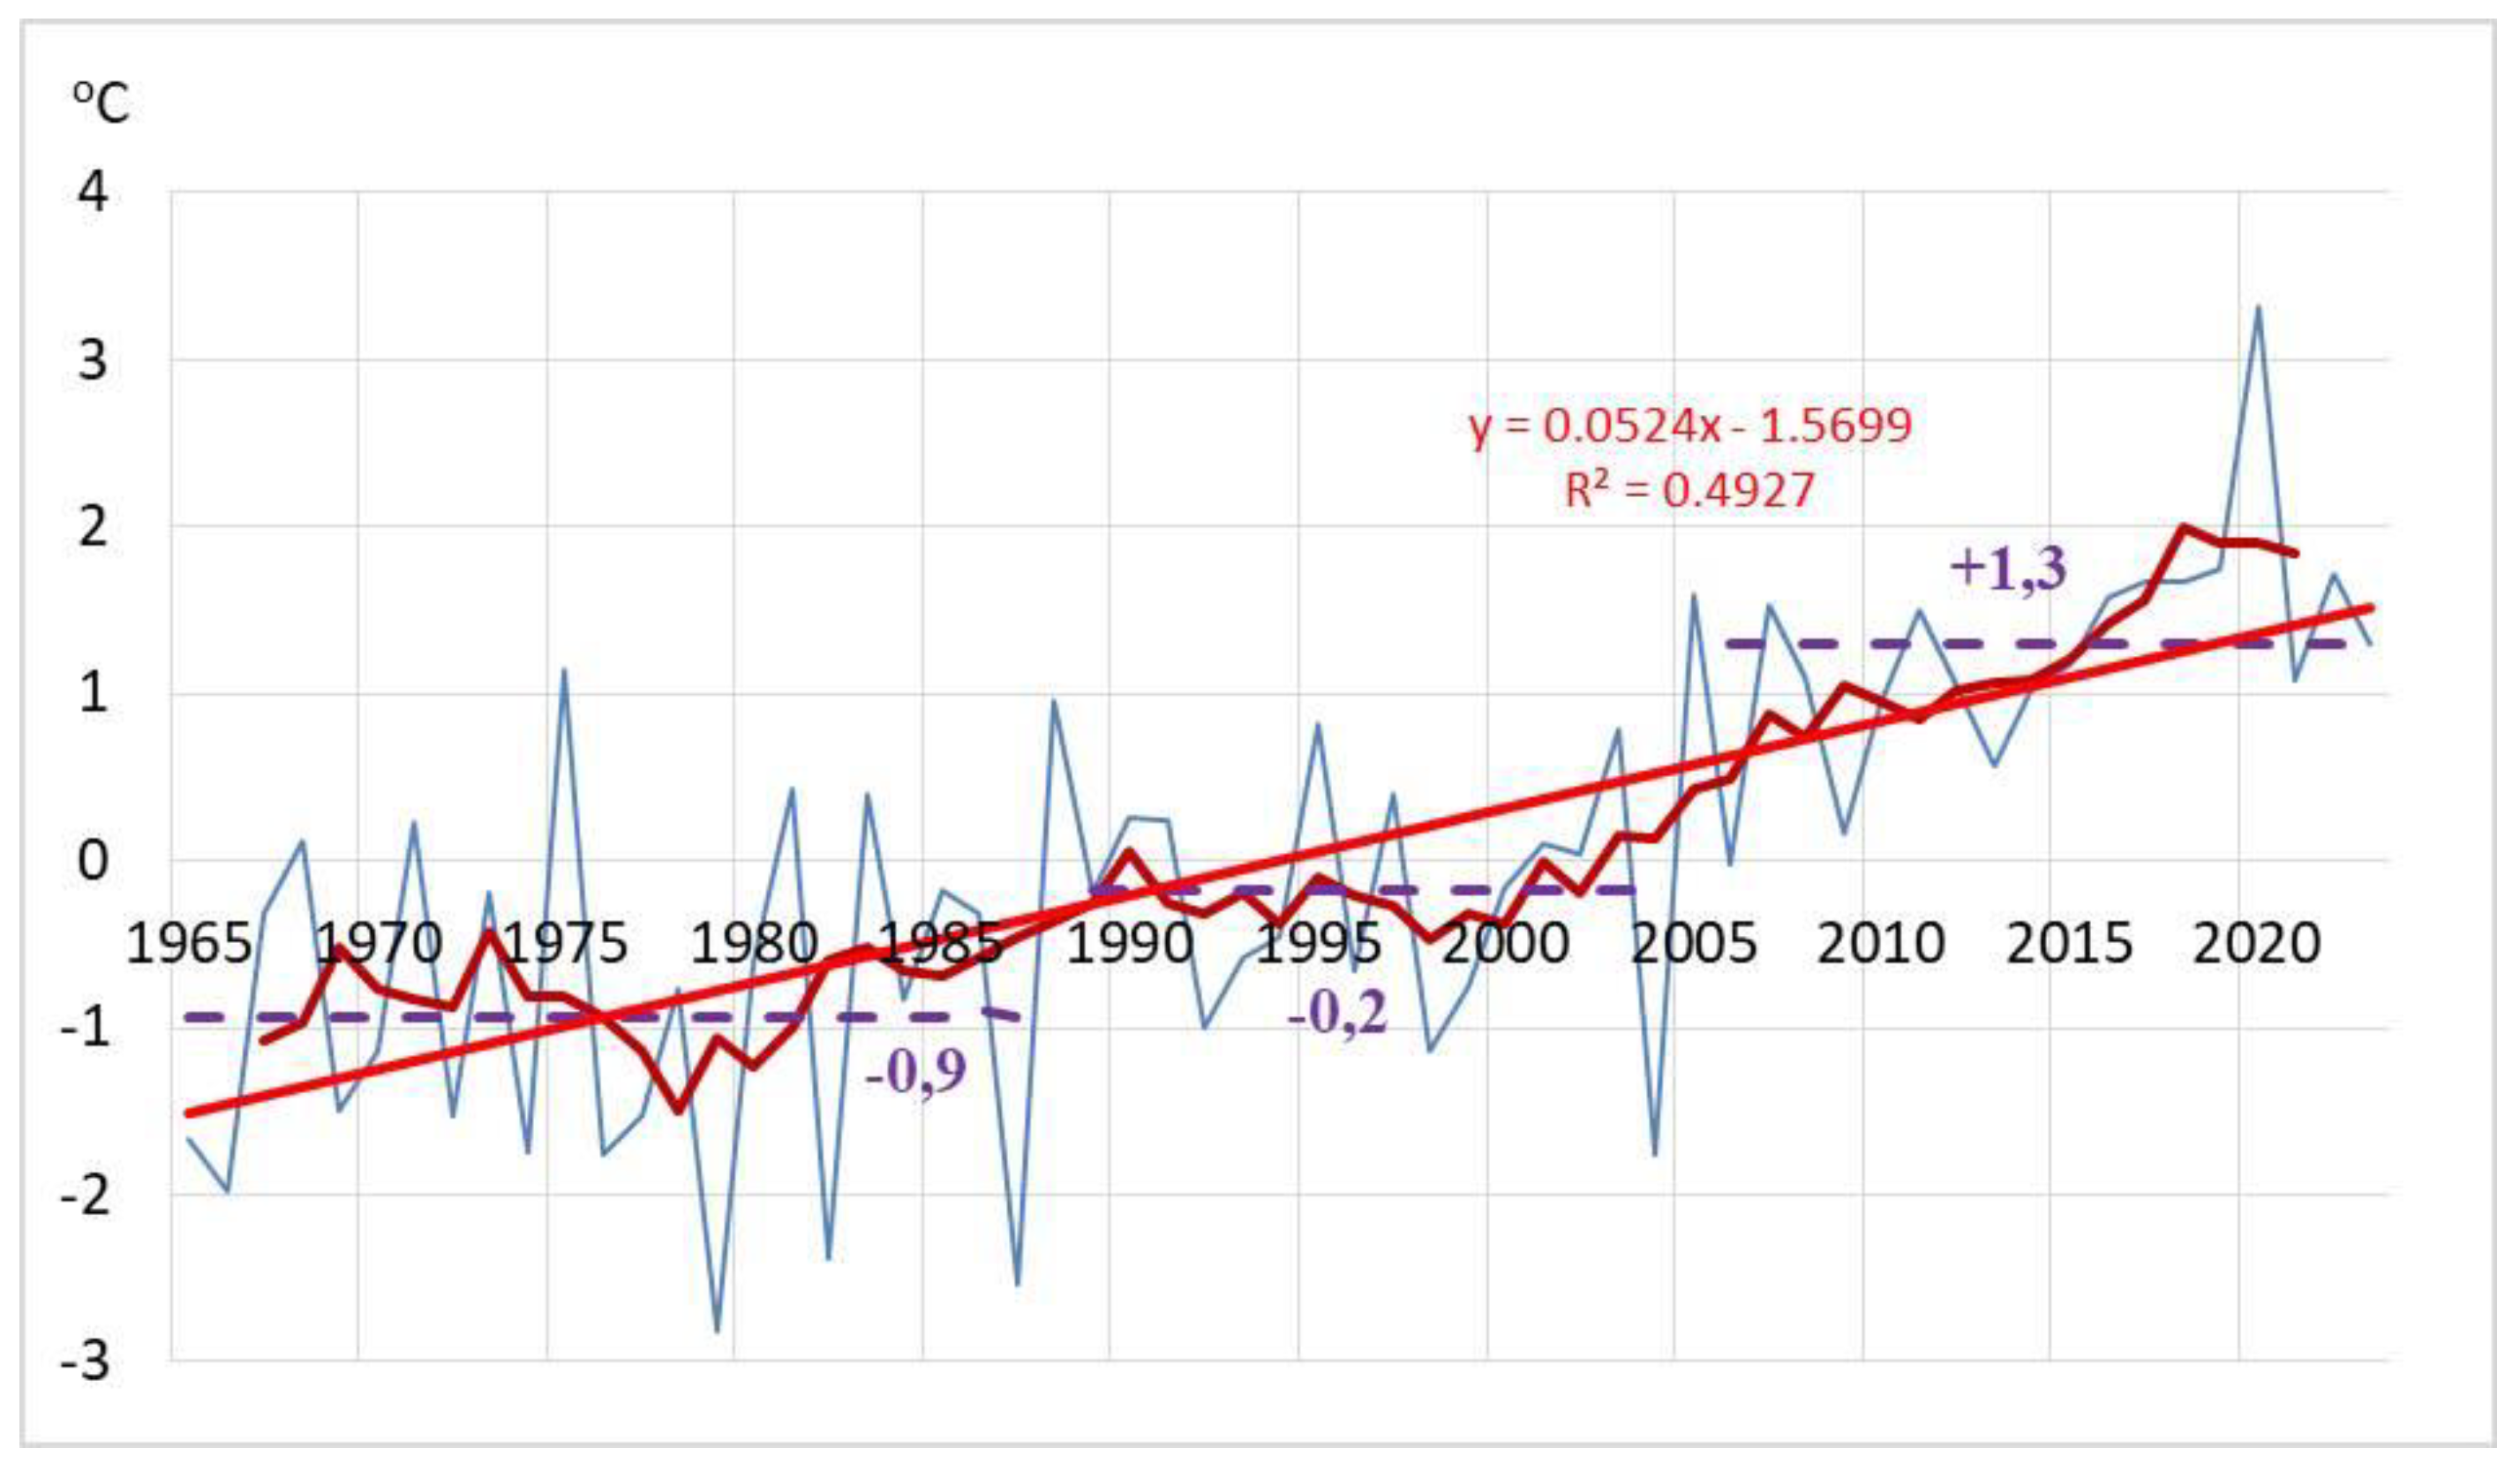
Between 1965 and 2023, the Subarctic zone of the Republic of Sakha (Yakutia) experienced mean annual air temperatures ranging from -10.5 (Zyryanka) to -15.3
oC (Iema) (
Table 5). The climatic boundaries observed in the Arctic regions are also present in this area (
Figure 10). In the Subarctic of Yakutia, the mean annual air temperature increased at a rate of 0.05
oC/year from 1965 to 2023.
The correlation coefficient of mean annual air temperatures in the Lena–Olenek region is 0.83-0.97; in the Yana region, it is 0.88-0.95, and in the Kolyma–Indigirka region, it is 0.90-0.97 at p ˂ 0.05 and n=55. Between 1965 and 1987, the mean annual temperature at all weather stations deviated from the normal by an average of -0.9
oC. In the period of 1988-2004, it was -0.1
oC, and from 2005 to 2023, it was +1.3
oC (see
Figure 10).
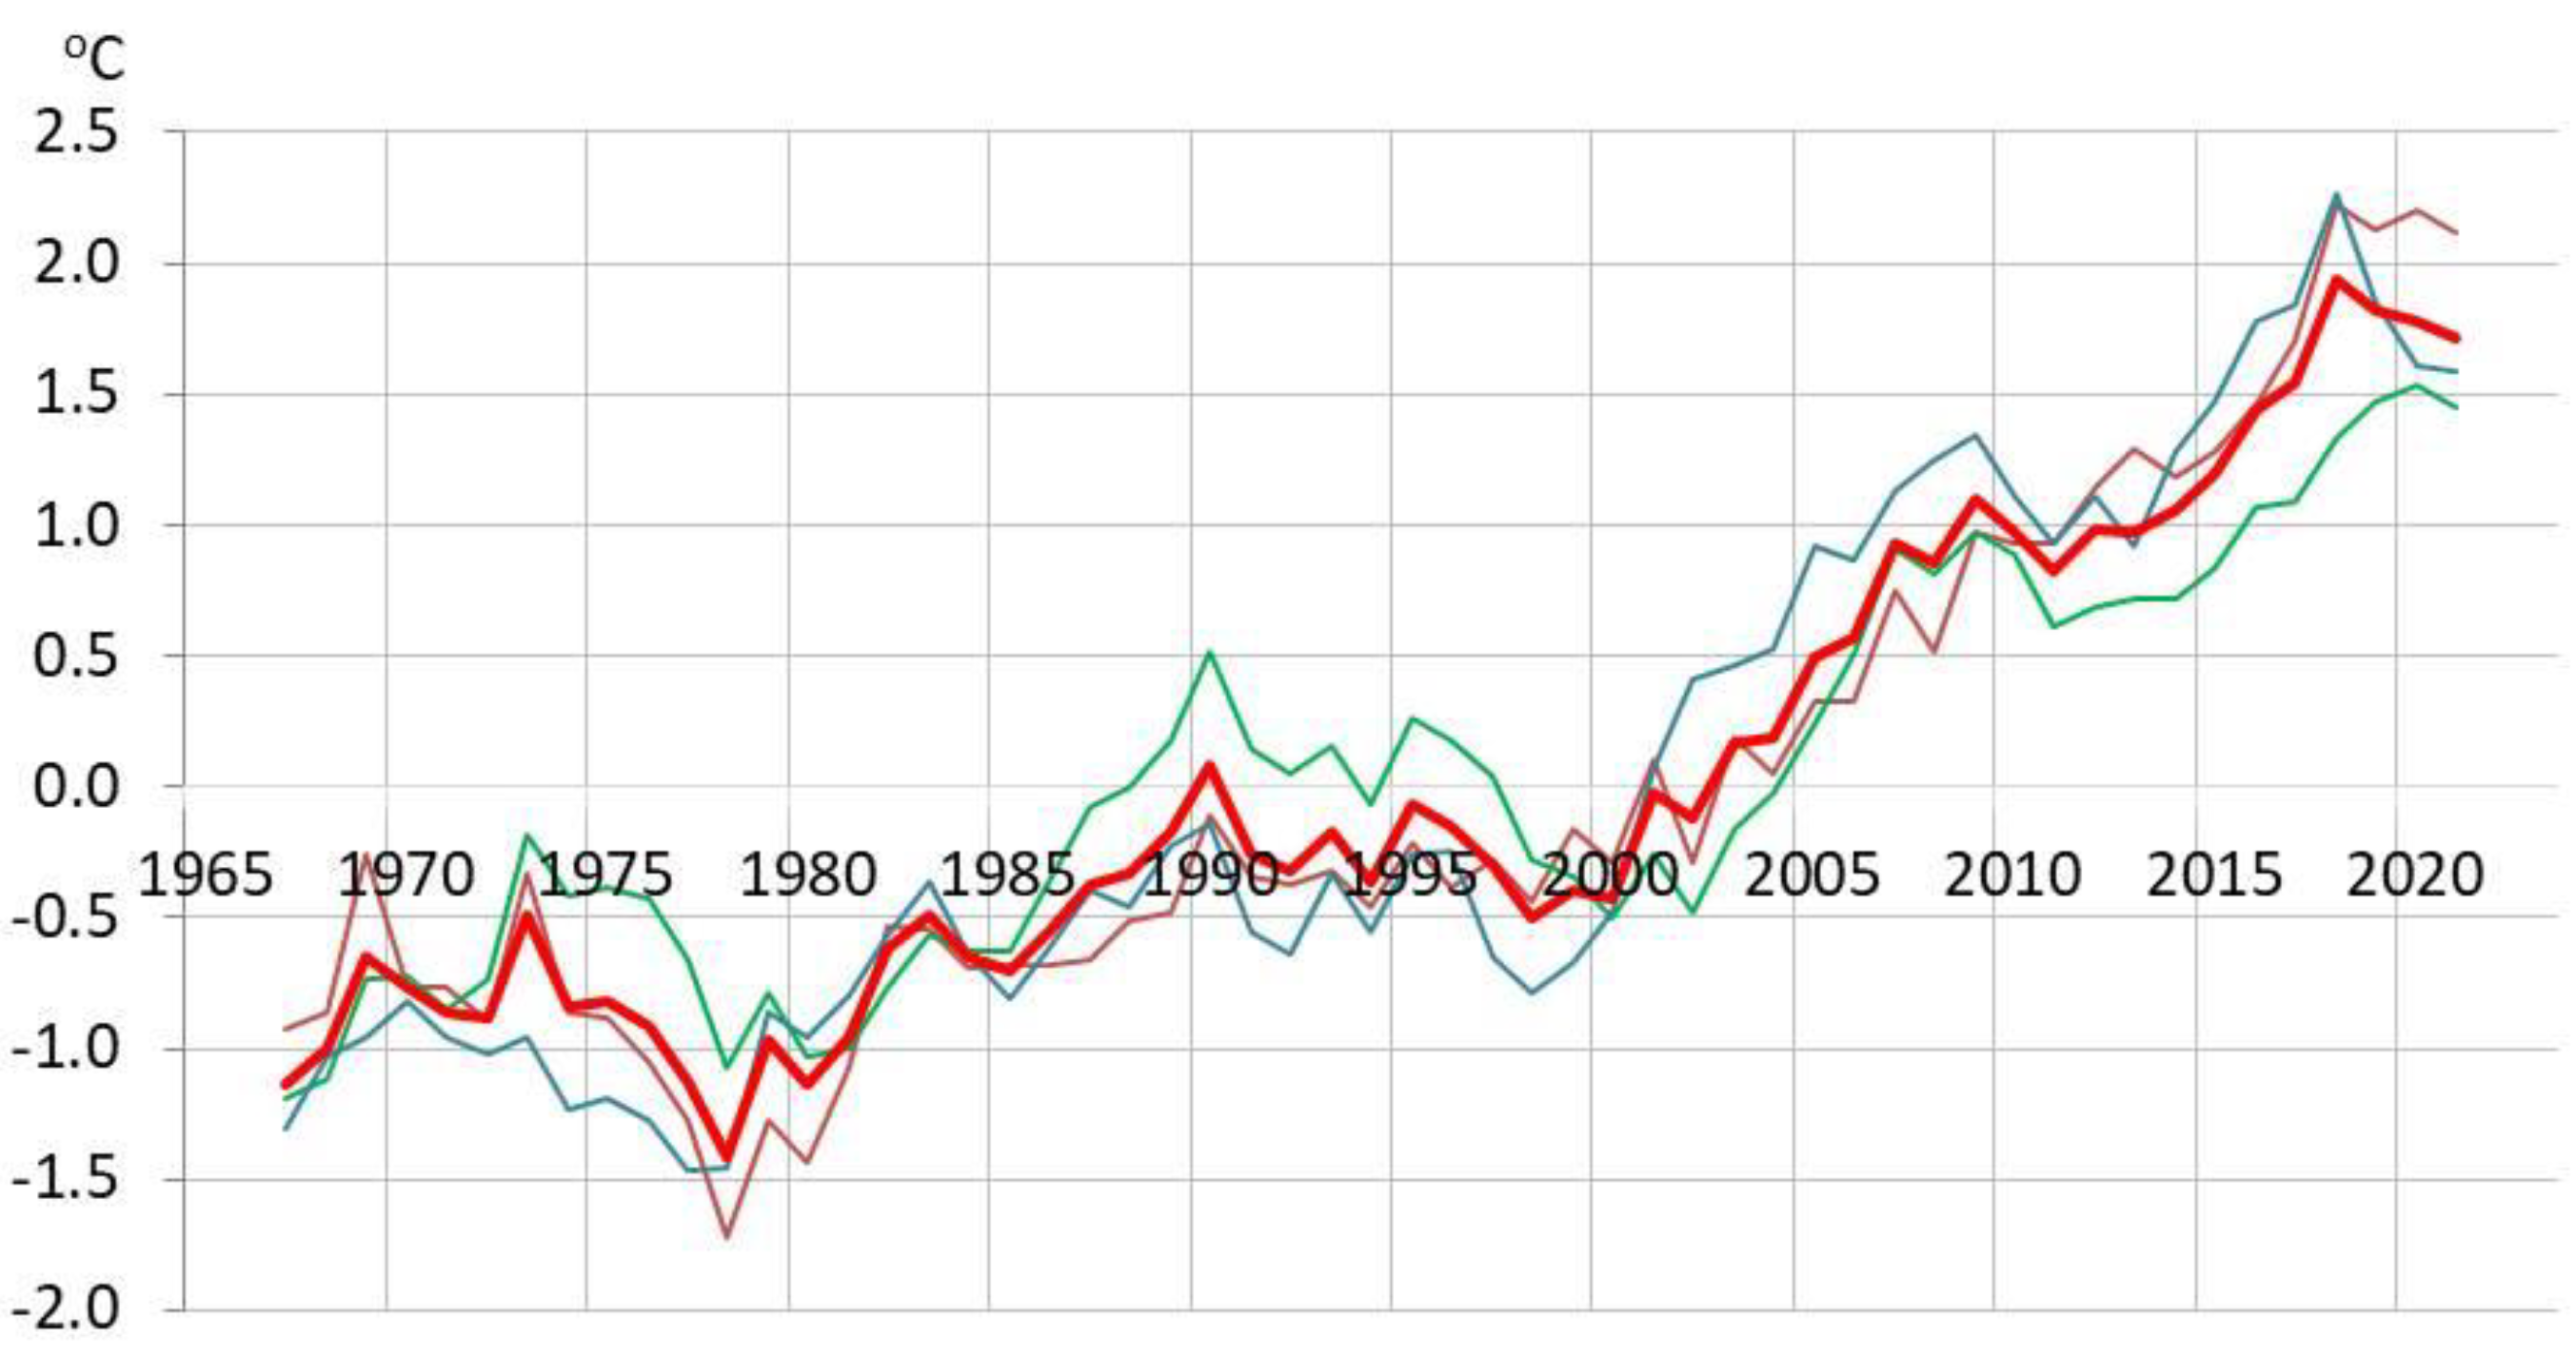
The interannual variability of mean annual air temperature differs among the three regions (
Figure 11). The Kolyma–Indigirka and Lena–Olenek regions experienced harsher conditions from 1965 to 1987. The Yana region experienced a more significant increase in air temperature during the pre-warming period (1988-2004). The air temperature showed a stronger increase in the Kolyma–Indigirka and Lena–Olenek regions during the warming period (2005-2023).
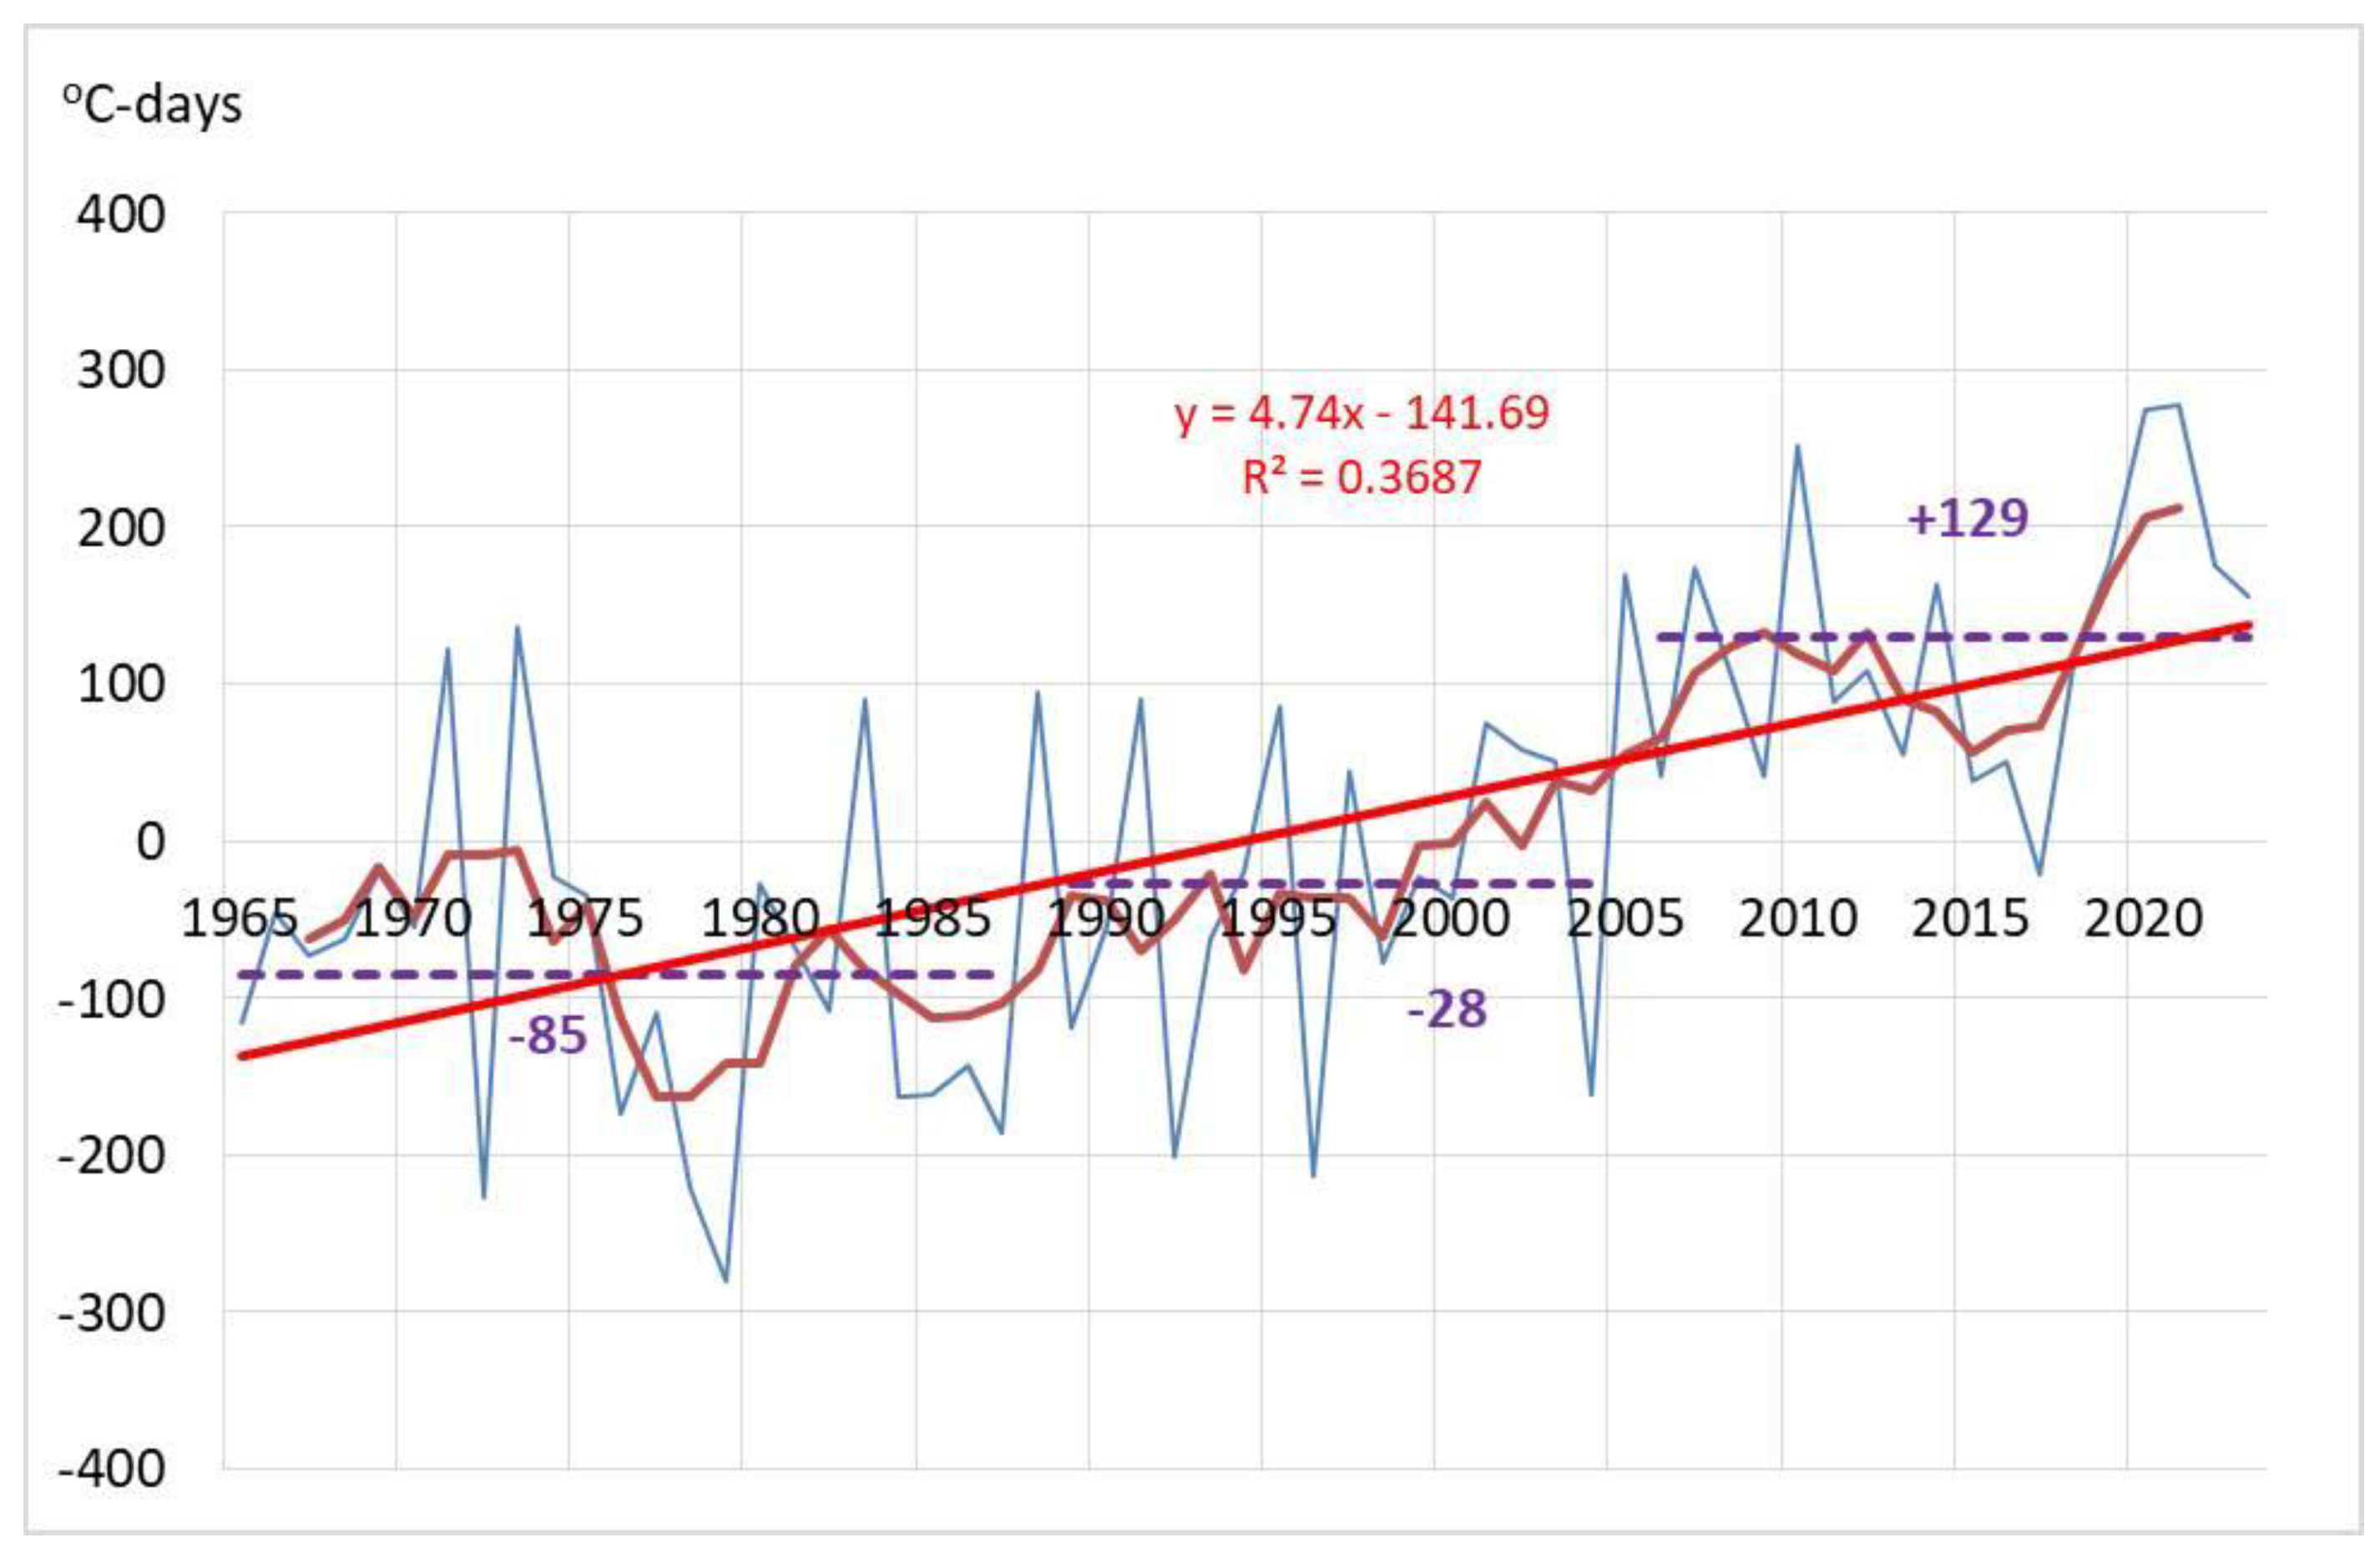
Thawing index. In the Subarctic zone of Yakutia, the thawing index ranged from 940 (Kolymskaya) to 1530
oC days (Zyryanka) between 1965 and 2023 (
Table 6). Here, we can observe three distinct time periods—1965-1987, 1988-2004, and 2005-2023 (
Figure 12). The mean thawing index in the warmest period of 2005-2023 was 18% higher in the Subarctic zone compared to the colder period of 1965-1987.
The correlation coefficient of the thawing index at meteorological stations in the Lena–Olenek region ranges from 0.72 to 0.98, in the Yana region—0.86-0.94 and, in the Kolyma–Indigirka region, it is 0.81-0.97 at p ˂ 0.05 and n=57.
In 1965-1987, the mean deviation of the thaw index was -85 °C days from the norm for the entire period of 1965-2023, -28 °C days in 1988-2004, and +129 °C days in 2005-2023 (see
Figure 12). The development of thaw index variability is consistent across the three regions, but there are slight differences (
Figure 13). If there was a consistent change in 1965-1987, then there was a pattern of alternating values in 1988-2004. The Kolyma–Indigirka region had warmer weather initially and toward the end, with the Yana region experiencing higher temperatures in between. From 2005 to 2023, summer temperatures showed a stronger rise in the Lena–Olenek region.
Freezing index. In Yakutia's Subarctic zone, the freezing index ranged from -5347
oC (Eik) to -6786
oC (Iema) for 1965-2023 (
Table 7). Three distinct periods can be identified: 1965-1988, 1989-2004, and 2005-2023 (
Figure 14). The freezing index was, on average, 10% lower in the warmest period of 2005-2023 compared to the colder period of 1965-1987.
The correlation coefficient of the freezing index at the weather stations of the Lena–Olenek region is in the range of 0.77 to 0.98; in the Yana region, it is 0.83-0.95; and in the Kolyma–Indigirka region, it is 0.87-0.96 at p ˂ 0.05 and n = 56. The correlation coefficient of the freezing index at the weather stations of the Lena–Olenek region ranges from 0.77 to 0.98; in the Yana region, it is 0.83-0.95; and in the Kolyma–Indigirka region, it is 0.87-0.96 at p ˂ 0.05 and n = 56.
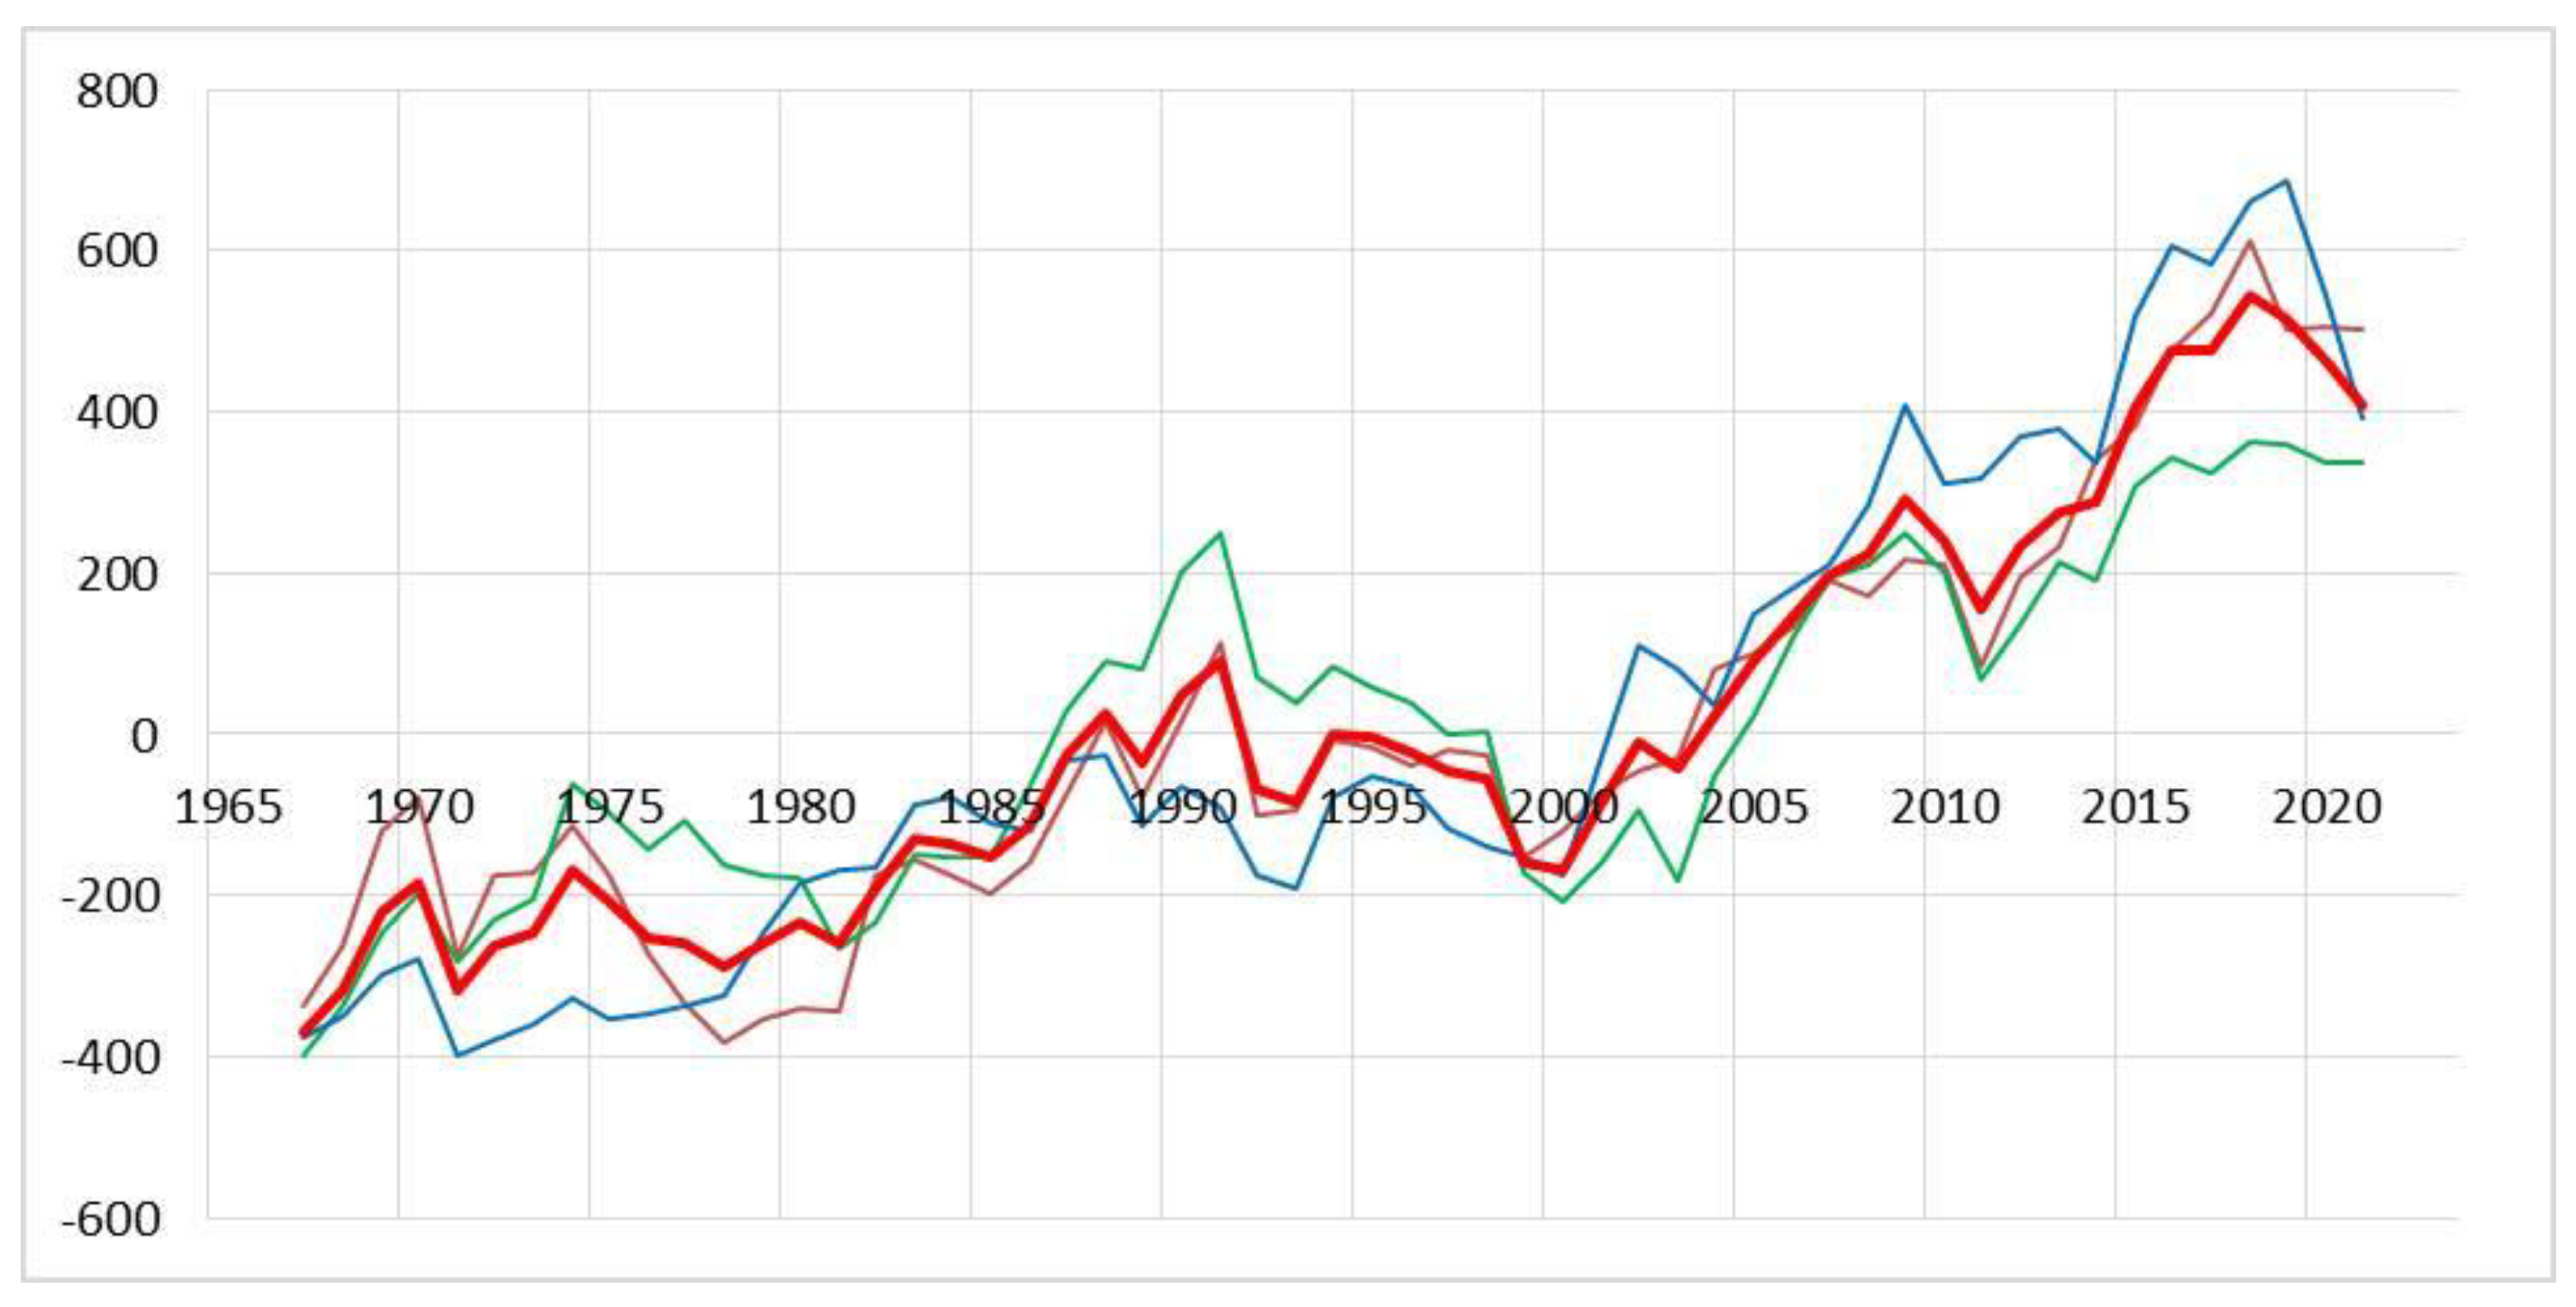
The freezing index variability in the three tundra regions shows uniform trends across years and periods, with slight differences (
Figure 15). The Yana region experienced milder winter temperatures during 1965-1987 and 1988-2004, whereas the Kolyma–Indigirka and Lena–Olenek regions had harsher conditions. During 2005-2023, the Kolyma–Indigirka region experienced the highest rates of winter warming among the three regions, whereas the Yana region had the lowest rates.
Precipitation. We collected data from nine meteorological stations in three regions of Yakutia's Subarctic zone with the longest observations and notable correlations (
Table 8). The selected weather stations have maintained continuous data since 1966. Significant correlations between 0.32 and 0.67 exist in the data from the Lena–Anabar region. The correlation coefficient between Verkhoyansk and Ust–Charky in the Yana region is 0.38, while in the Kolyma–Indigirka region, it is 0.78 for Srednekolymsk and Zyryanka, with a significance level of p < 0.05 and a sample size of n = 58. The precipitation data for the Yana–Indigirka and Kolyma–Indigirka regions show a strong correlation of 0.36-0.49.
Annual precipitation in the Subarctic zone from 1966 to 2023 ranged from 193.5 mm (Verkhoyansk) to 328.5 mm (Zhigansk) (see
Table 8). The Yana region has seen minimal shifts in annual precipitation levels over time. Precipitation in the Kolyma–Indigirka region has significantly increased from the late 1990s to 2020. The Srednekolymsk and Zyryanka meteorological stations recorded an average increase of 50-70 mm in precipitation during the warming period of 2005-2023. In the 2020s, there was a significant decrease in precipitation. The Lena–Olenek region, in its western part, maintains an even distribution of precipitation during climatic periods (Dzhalinda, Olenek). The warming from 2005 to 2023 in Sukhana and Dzhardzhan resulted in a 20 mm increase in precipitation from the norm of 1965-2023. Zhigansk was the sole location experiencing a significant 50 mm rise in precipitation from 2005 to 2023.
3.3. The Impact of Global Warming on the State of Permafrost
The warming of Arctic landscapes between 2005 and 2023 greatly exceeded Arctic warming in the 1930-1940s in all aspects. The mean annual air temperature at that time was 1.4 °C higher than the long-term norm, while in 1930-1940, it was only 0.5-1 °C higher [
25]. Permafrost warming has been observed in the Russian Arctic, including Yakutia, since the early 2000s, leading to changes in permafrost conditions. Many studies [
5,
26,
27,
28,
29,
30] have documented their transition toward warming.
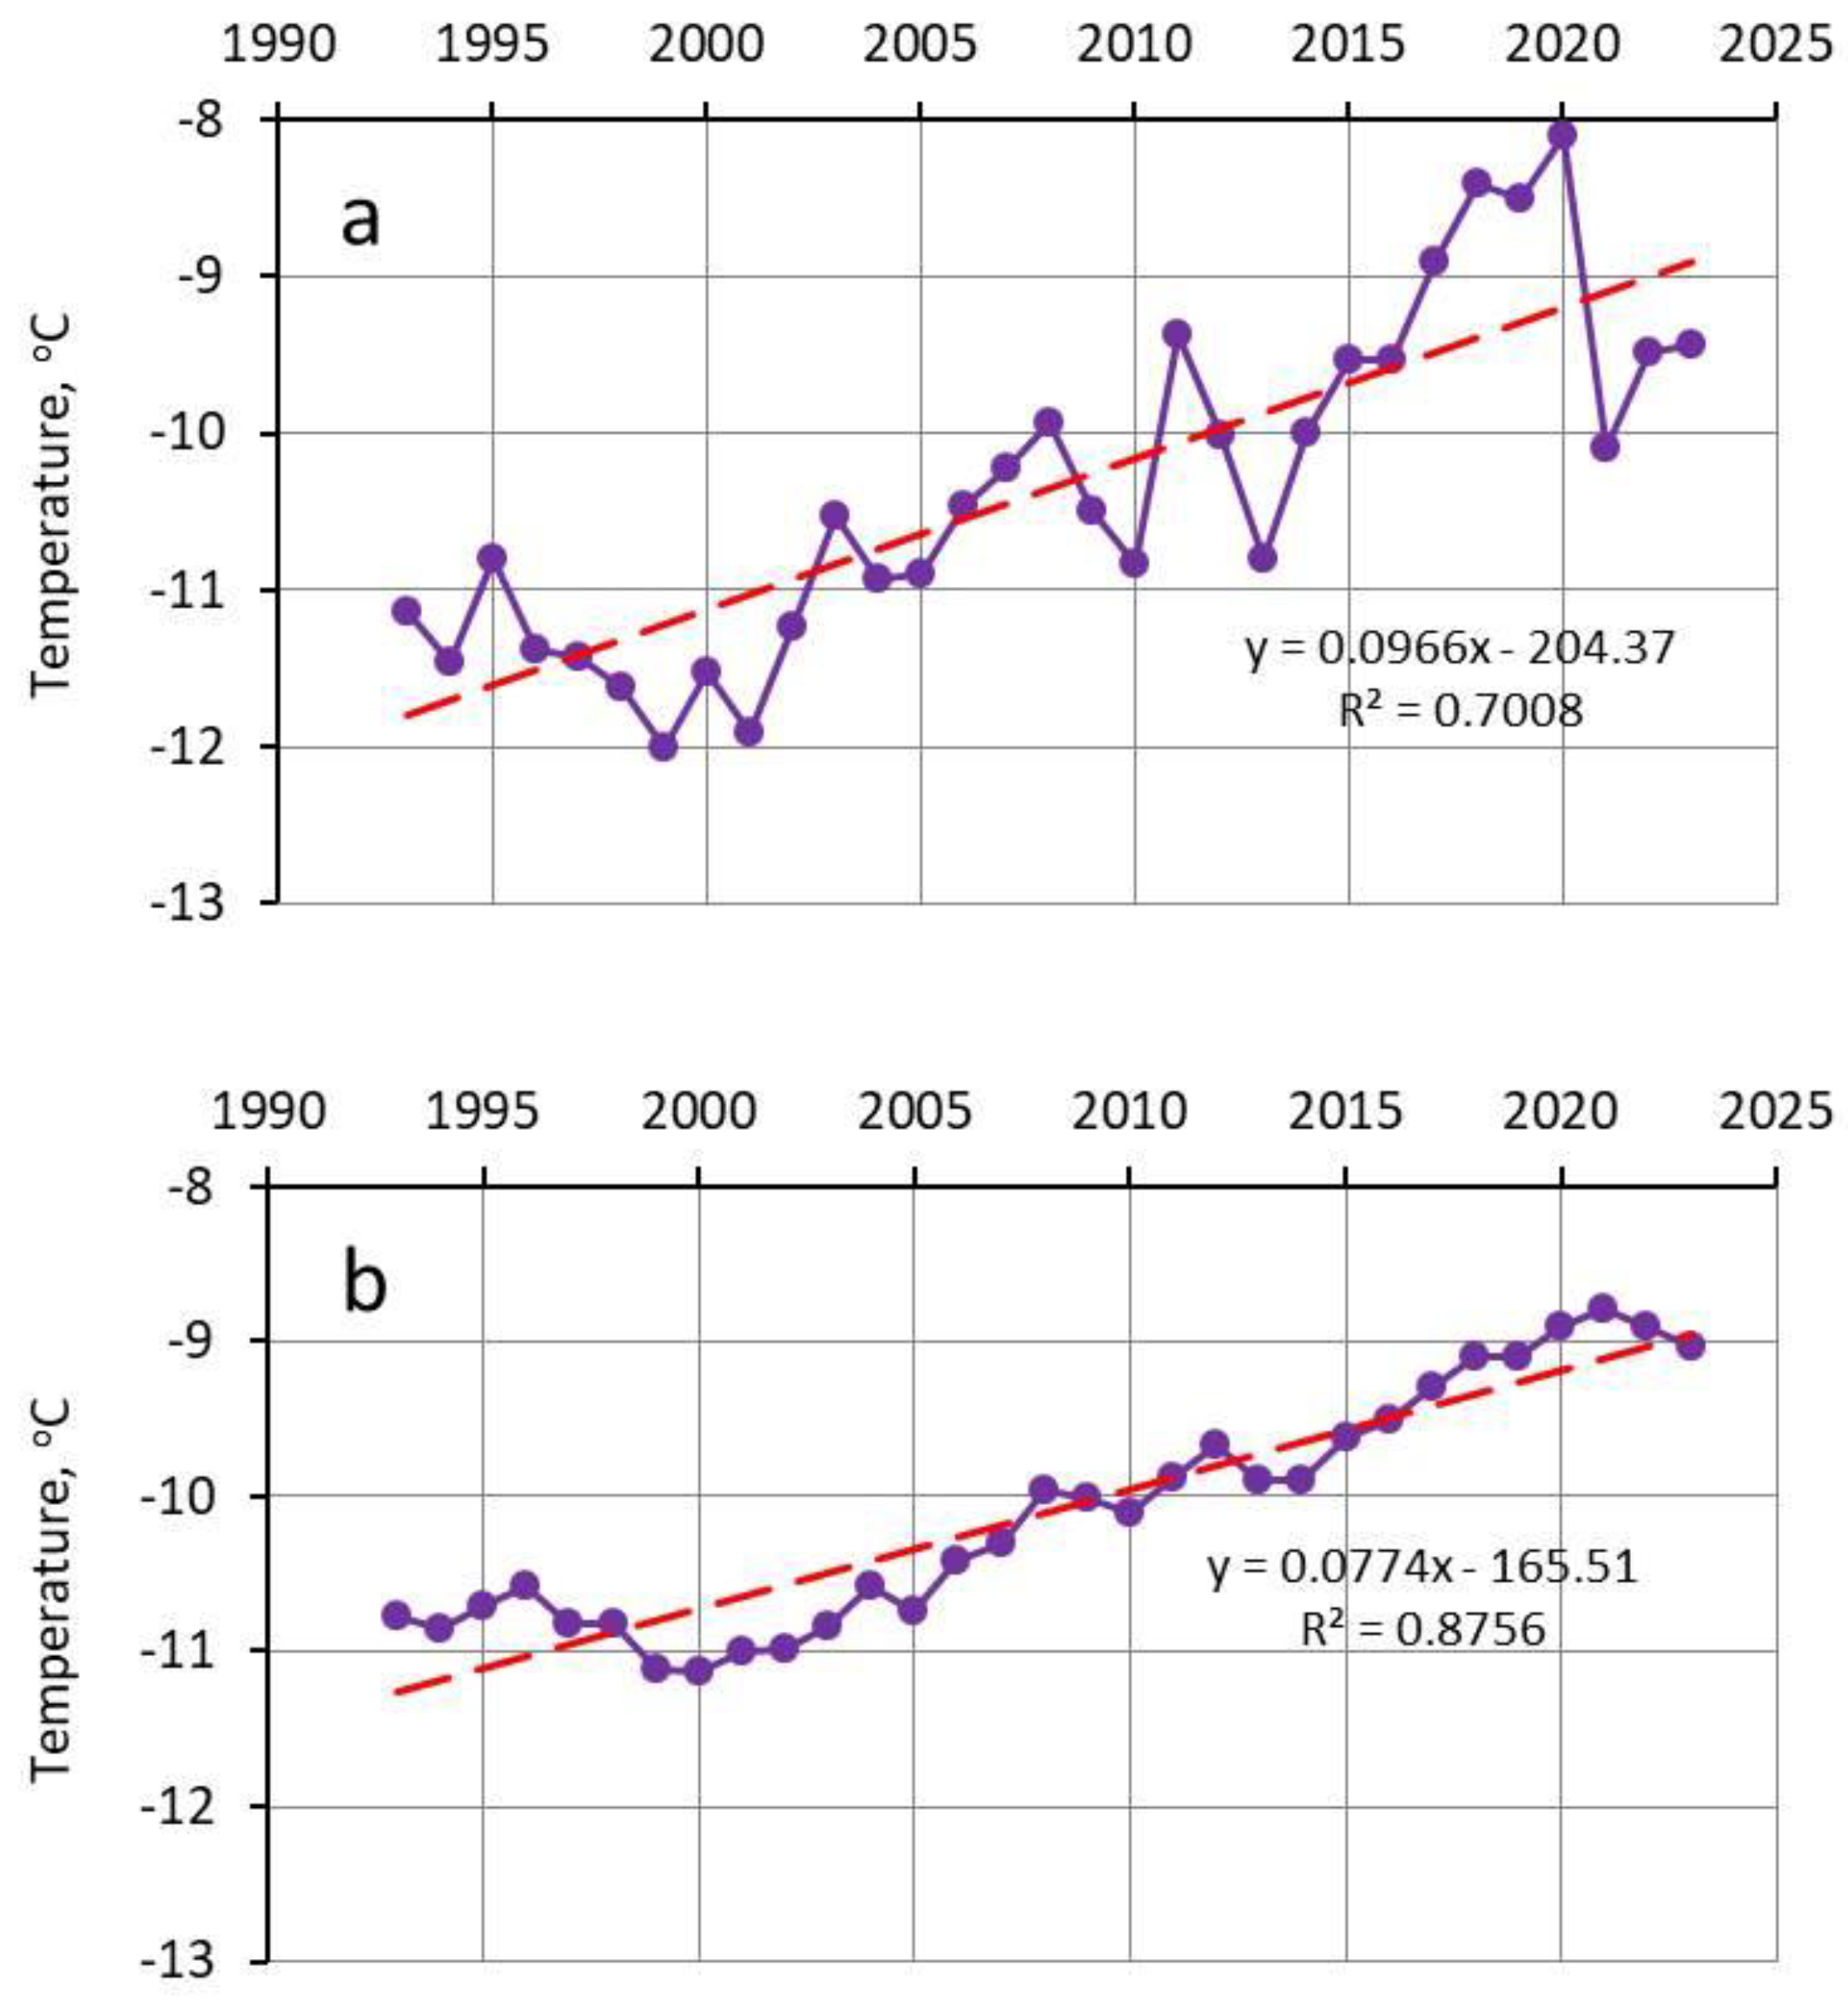
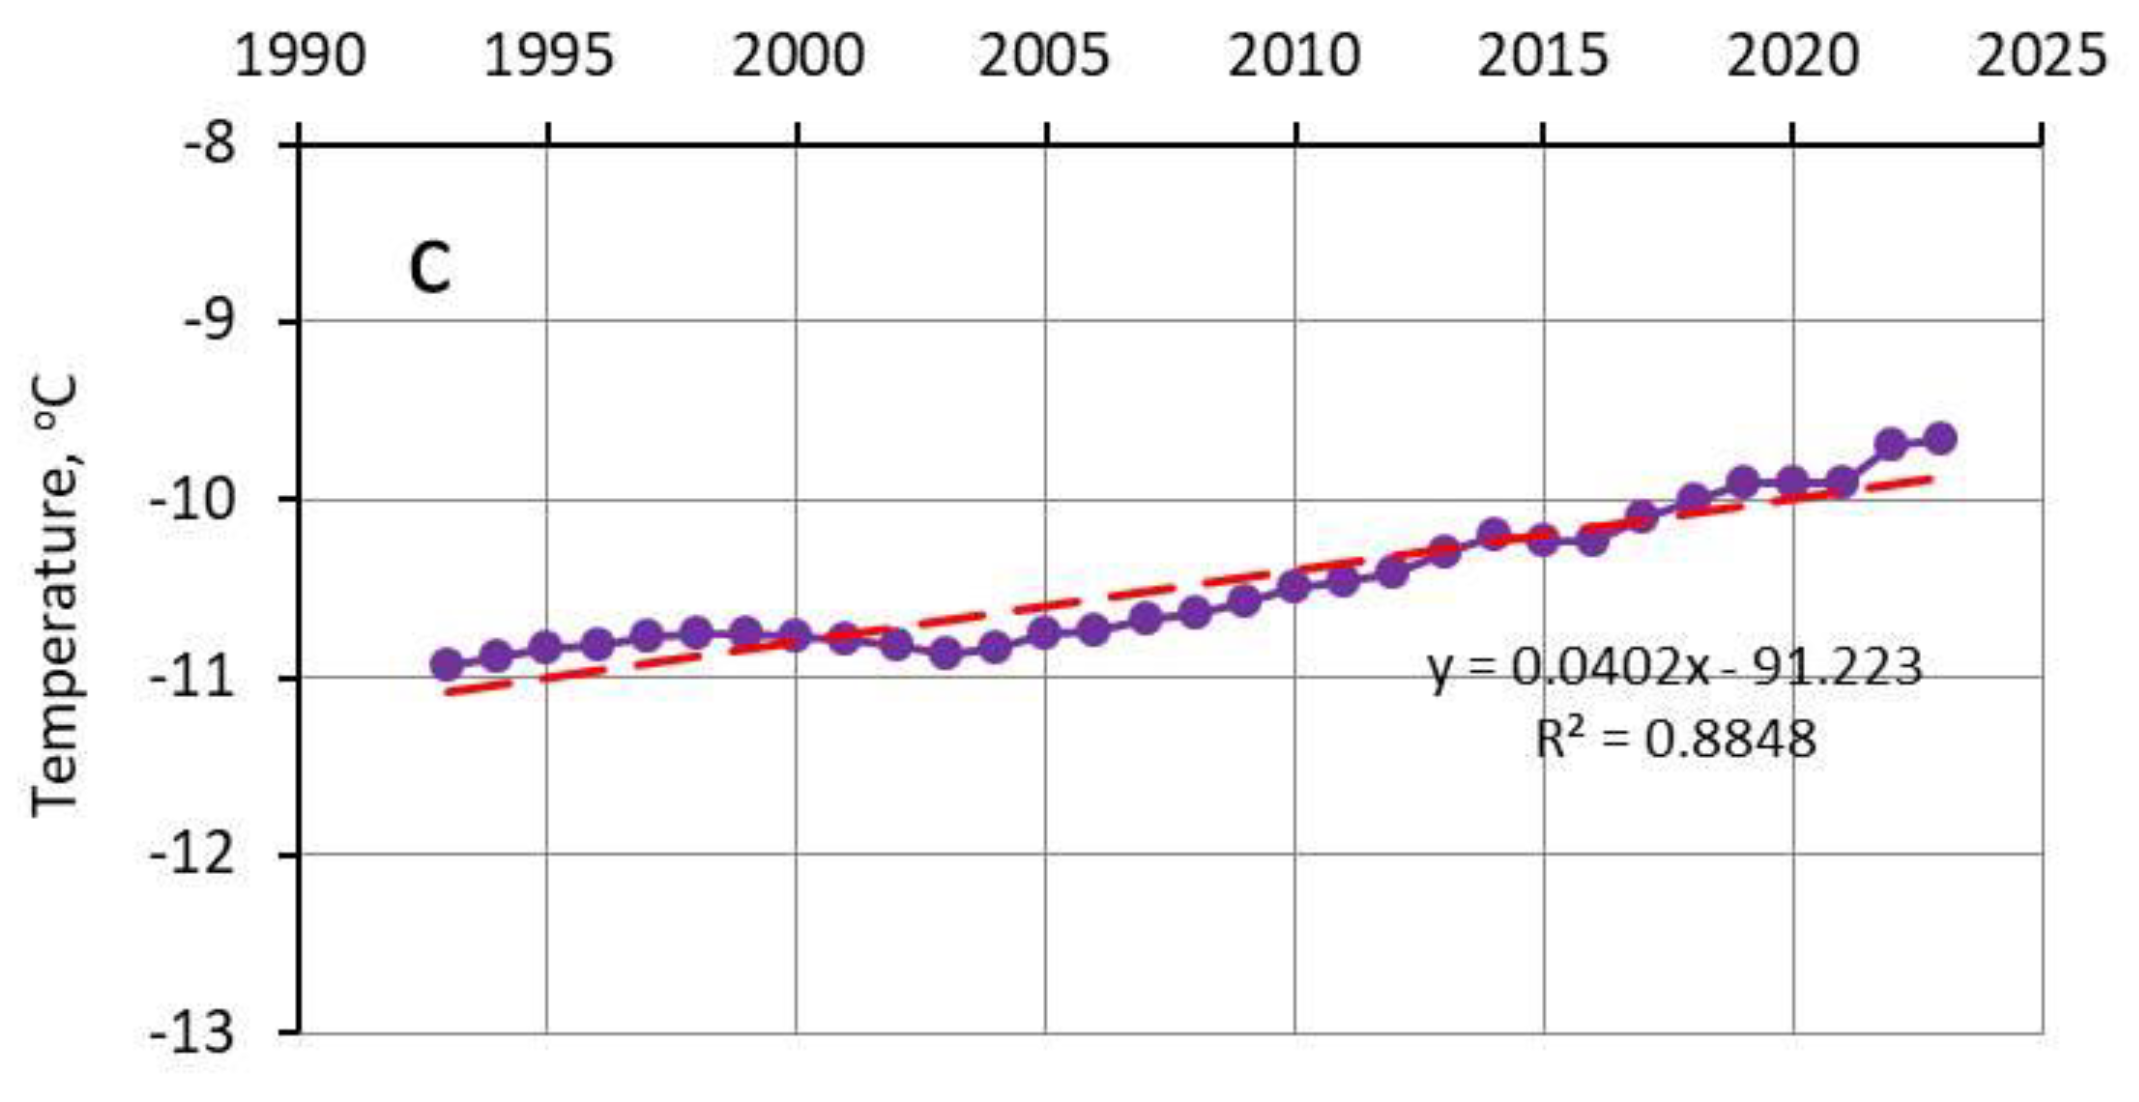
The monitoring site of the Melnikov Permafrost Institute in the Lena–Anabar Arctic region of Yakutia offers the longest series of continuous experimental observations of permafrost temperature. The study area is located in the foothills of the eastern slope of the Primorsky Ridge. The temperature borehole is situated on a low stone ridge, with a depth of 30 m and a.s.l. of 49 m. The permafrost temperature showed a long-term increase from 1993 to 2023 (
Figure 16). Moreover, the depth of its change was uneven over time, as shown in
Table 9. Around the mid-2000s, there was a faster increase in permafrost temperature [
31].
Starting in 2006, the Russian–German Arctic expedition has been monitoring permafrost temperature on Samoylovsky Island in the Lena River Delta. According to Boike et al. [
16], the mean annual permafrost temperature increased by 0.9 °C from 2008 to 2016 at a depth of 20 m in a borehole on Samoylovsky Island. Meanwhile, in a borehole near Tiksi town, the temperature rose by a modest 0.6 °C at a depth of 20 m. A global analysis of permafrost's thermal state post-International Polar Year (2007-2009) revealed the mean temperature increase at zero annual amplitude depth for all Arctic regions in the Northern Hemisphere. According to Biskaborn et al. [
5], the temperature change from 2007 to 2016 was 0.39 ± 0.15 °C. In the reviewed period, the Tiksi and Lena River delta experienced a higher permafrost temperature increase compared to the Arctic zone in total.
The Institute of Physicochemical and Biological Problems of Soil Science RAS monitors permafrost temperatures in the Yana–Kolyma Arctic region near the lower Kolyma River [
18,
32,
33]. According to these studies, the region's permafrost temperatures remained stable until the early 2000s. The permafrost temperature started increasing in the late 1990s due to global warming. Meanwhile, permafrost temperatures in the Kolyma Lowland have increased by 1.5-2 °C since 1980, showing the most significant changes.
Since 2007, permafrost temperatures in the lower part of the seasonal temperature fluctuation layer have generally shown a stable positive trend, according to most monitoring points. The most significant changes occur in the tundra landscapes near the Arctic Ocean. According to Kholodov et al. [
18] (2012), the mean annual permafrost temperature at depths of 15 and 25 m is increasing by up to 0.2 °C per year. According to Andreeva et al. [
34], the most significant rise in permafrost temperature was observed in fire-affected woodland landscapes in the lower Kolyma River region.
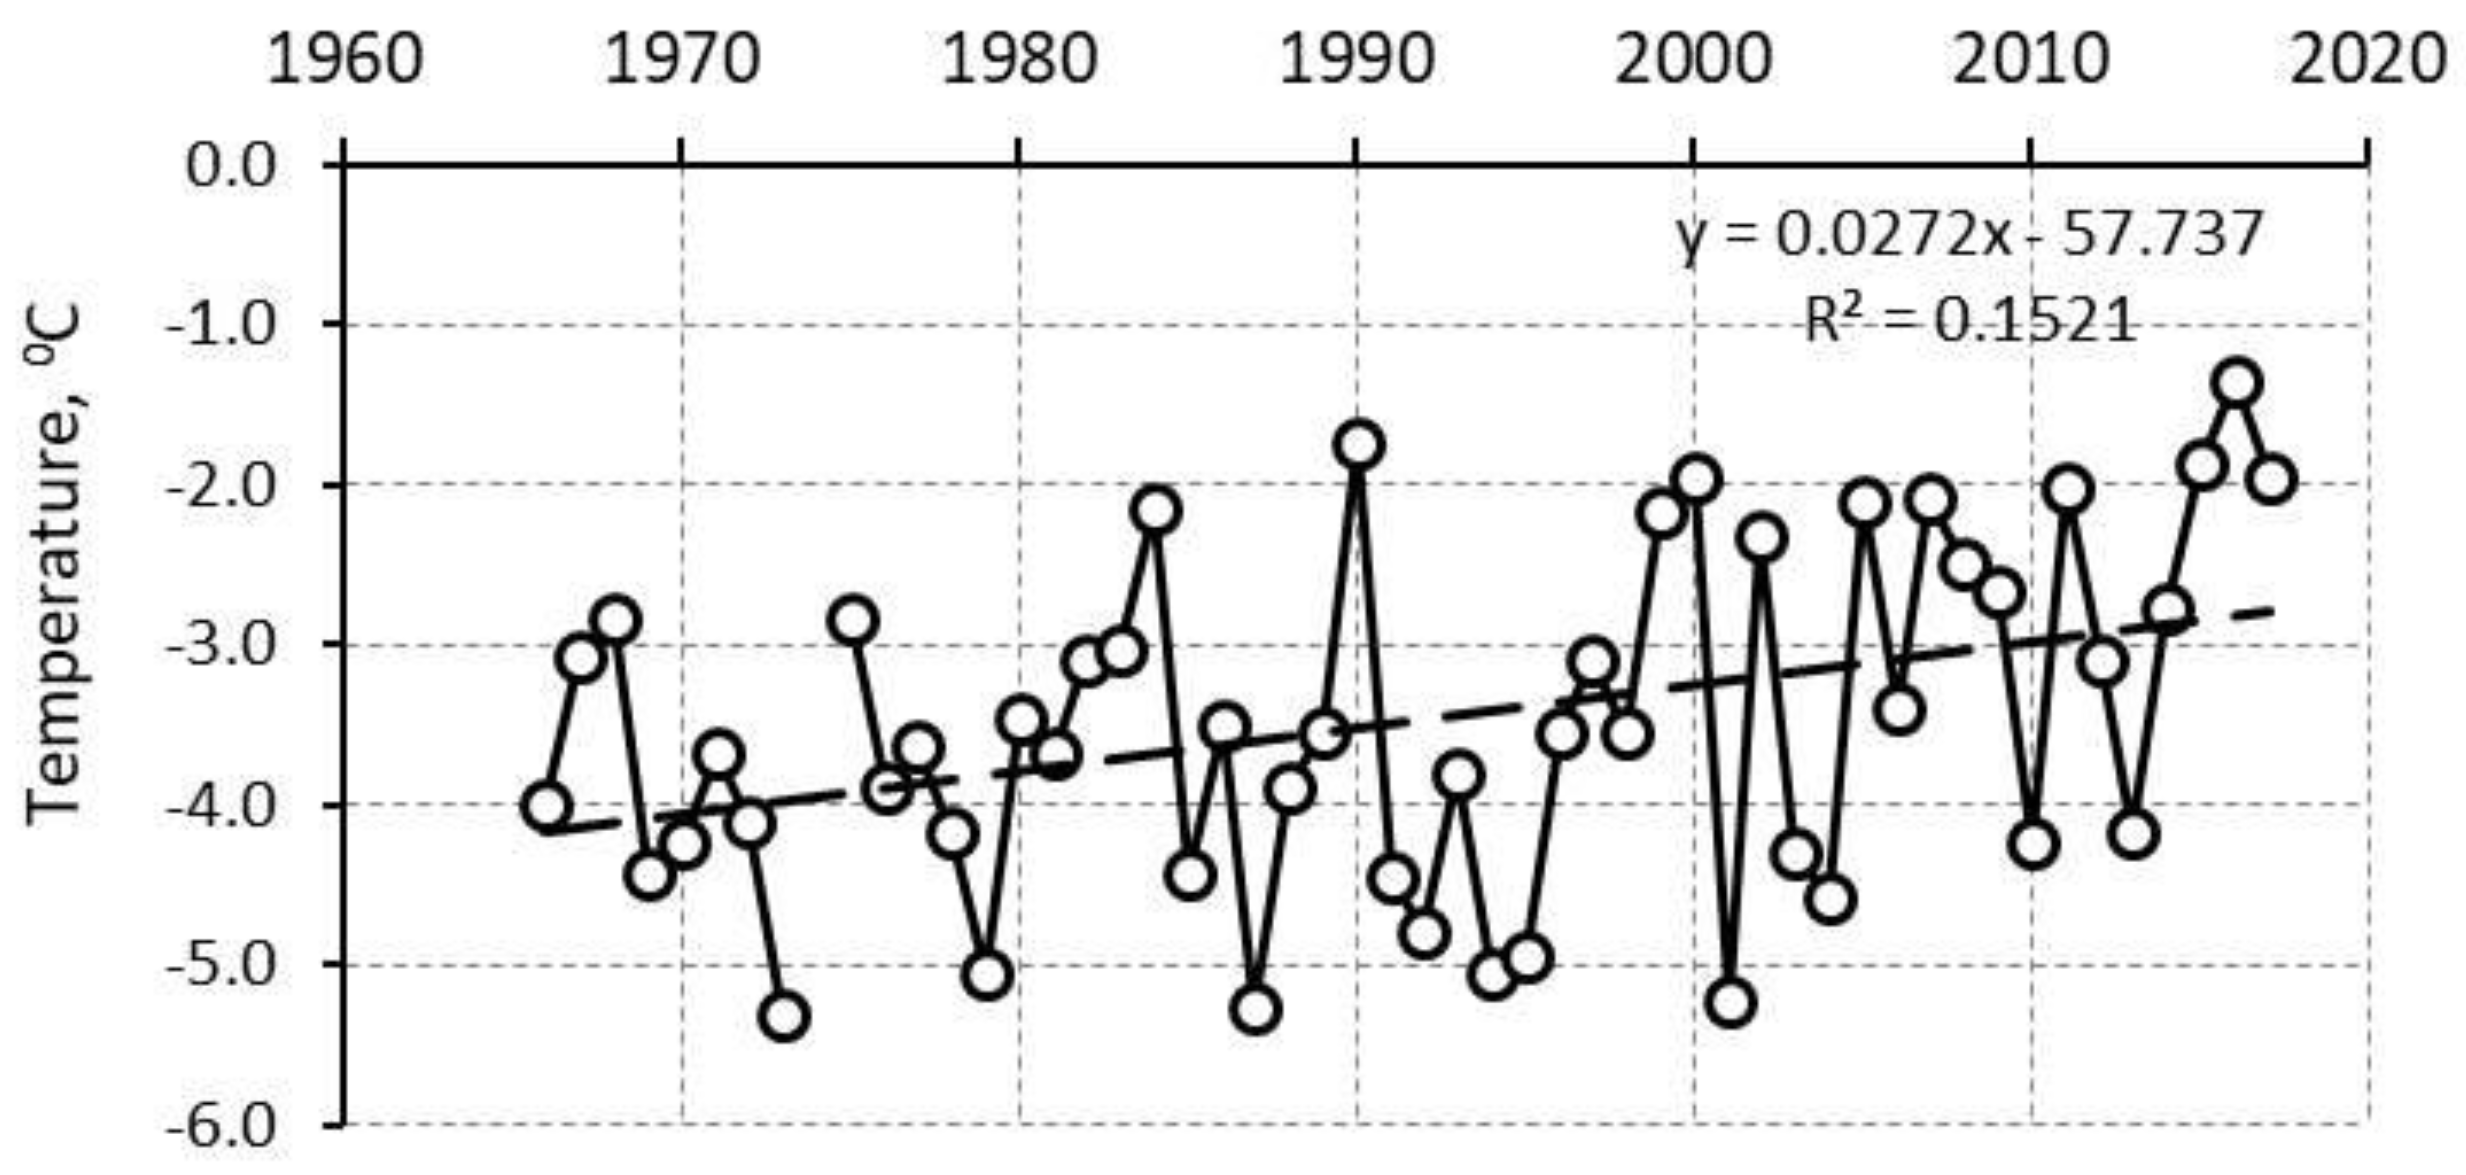
The permafrost temperature in the Subarctic zone of Yakutia is monitored through long-term observations at Roshydromet weather stations. Olenek weather stations are located in the Lena–Olenek Subarctic area. From 1966 to 2017, the mean annual permafrost temperature at a depth of 1.6 m increased by 0.03 °C/year (
Figure 17).
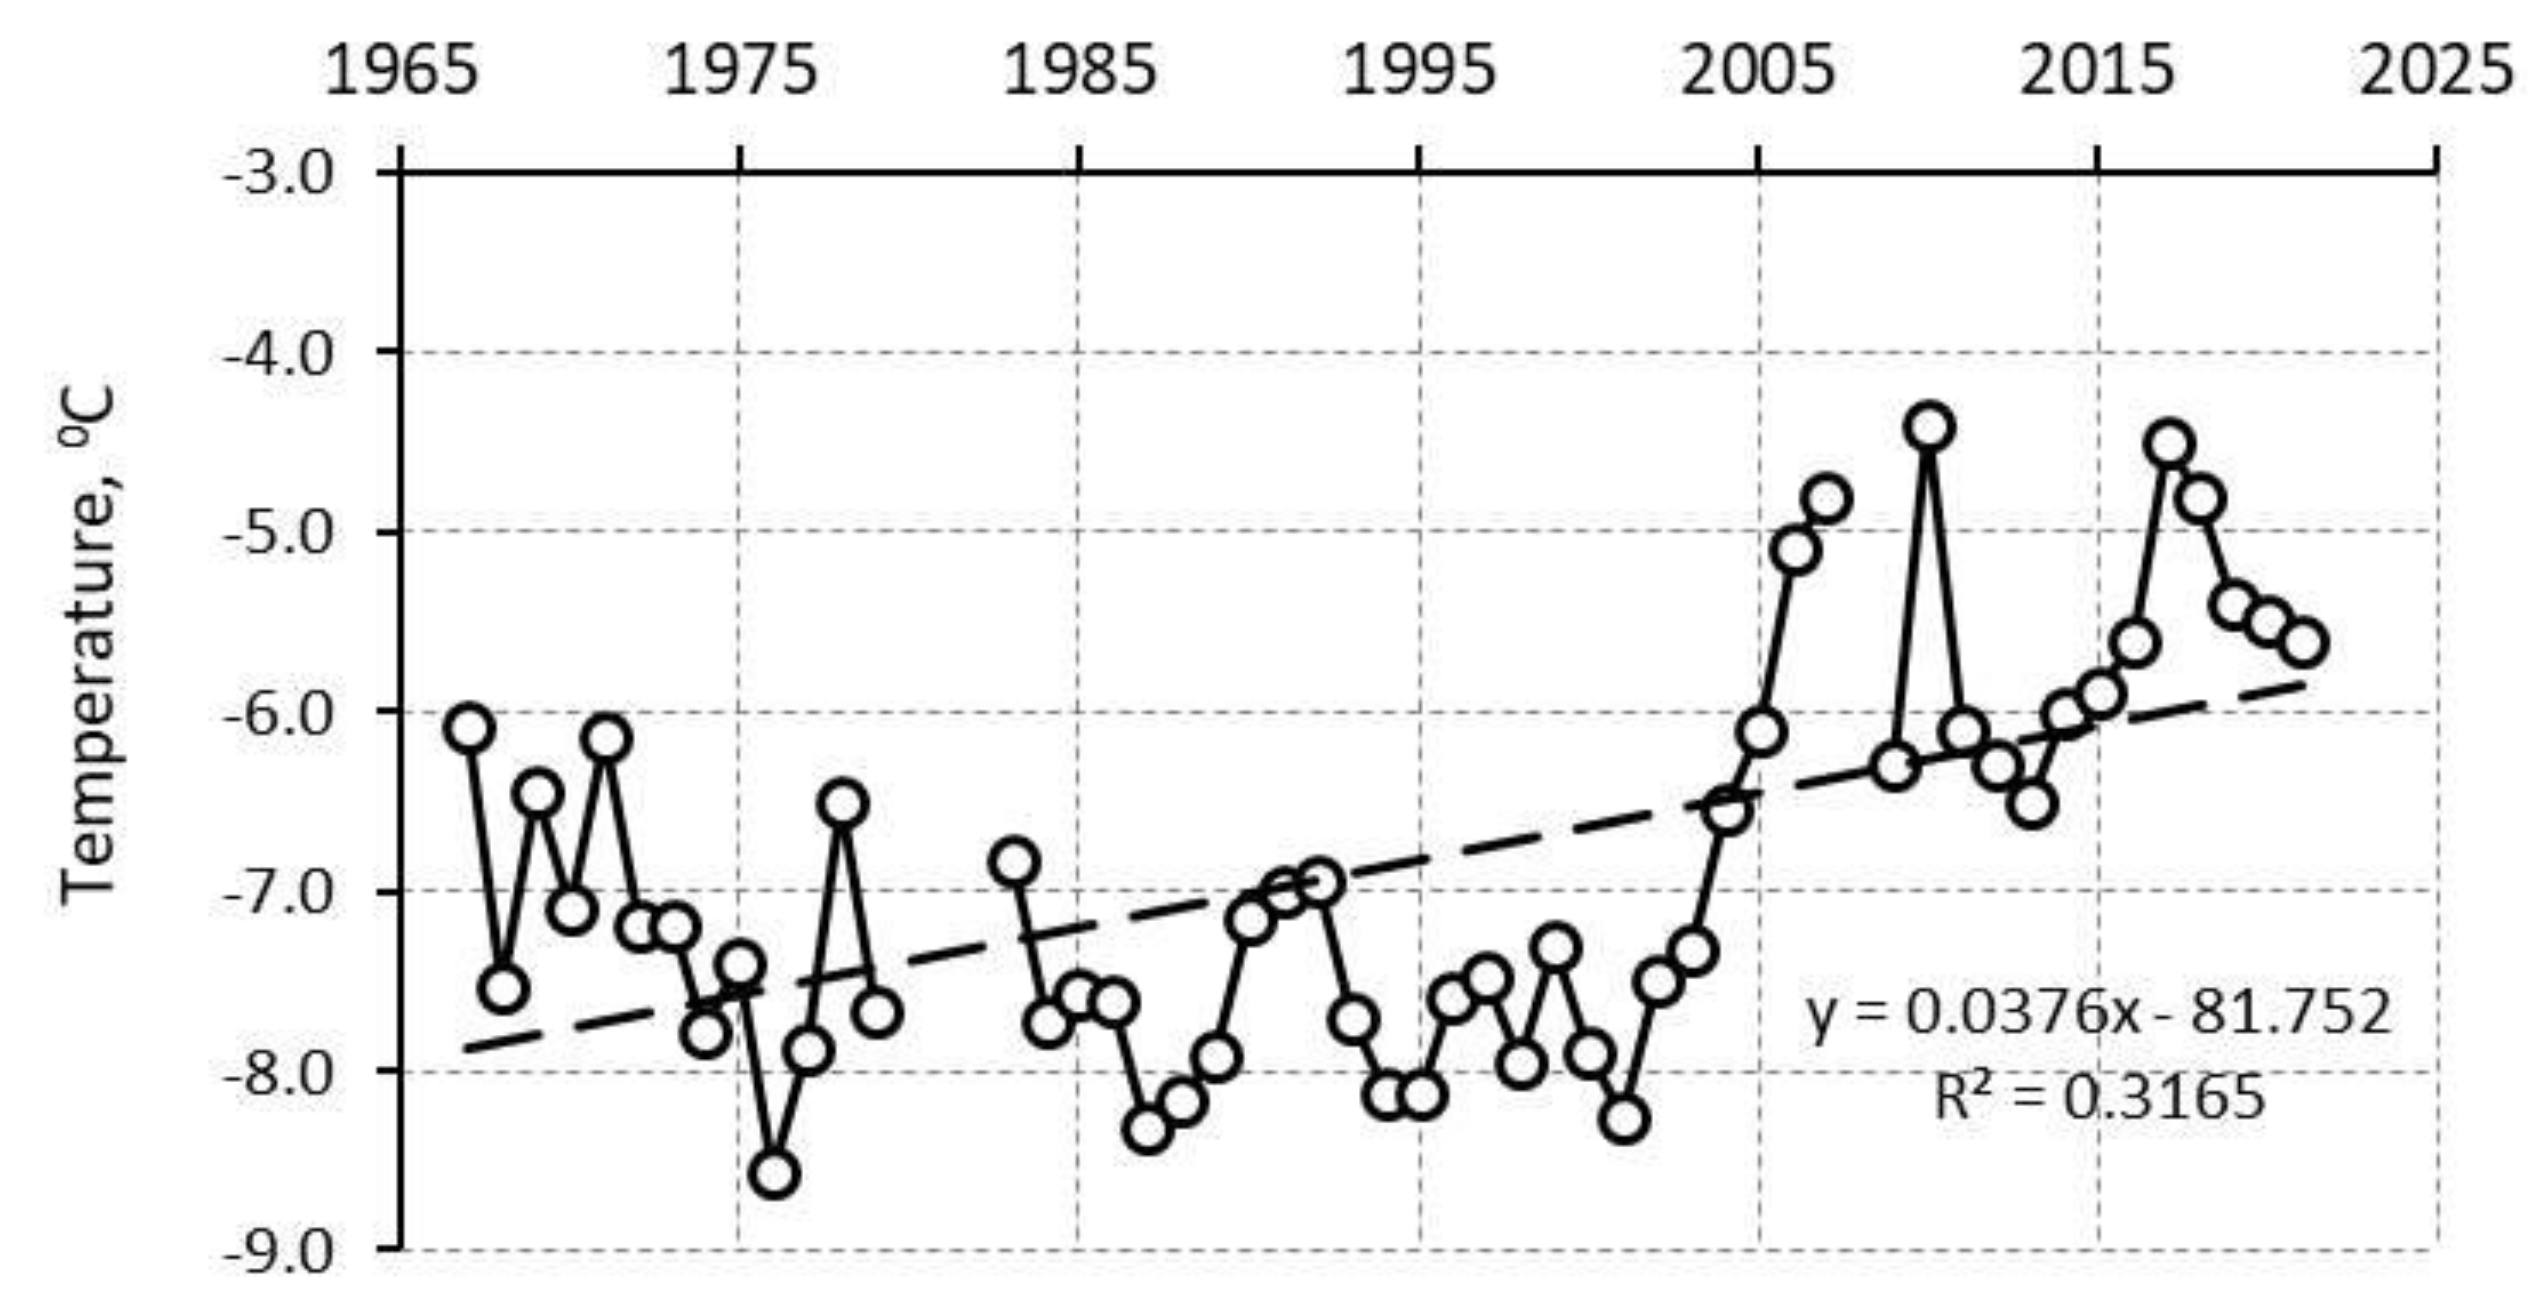
The Verkhoyansk weather station in the Yana Subarctic region has a long record of permafrost temperature observations. The Verkhoyansk weather station observed a 0.04 °C/year increase in the mean annual temperature at a depth of 1.6 m from 1967 to 2021 (
Figure 18).
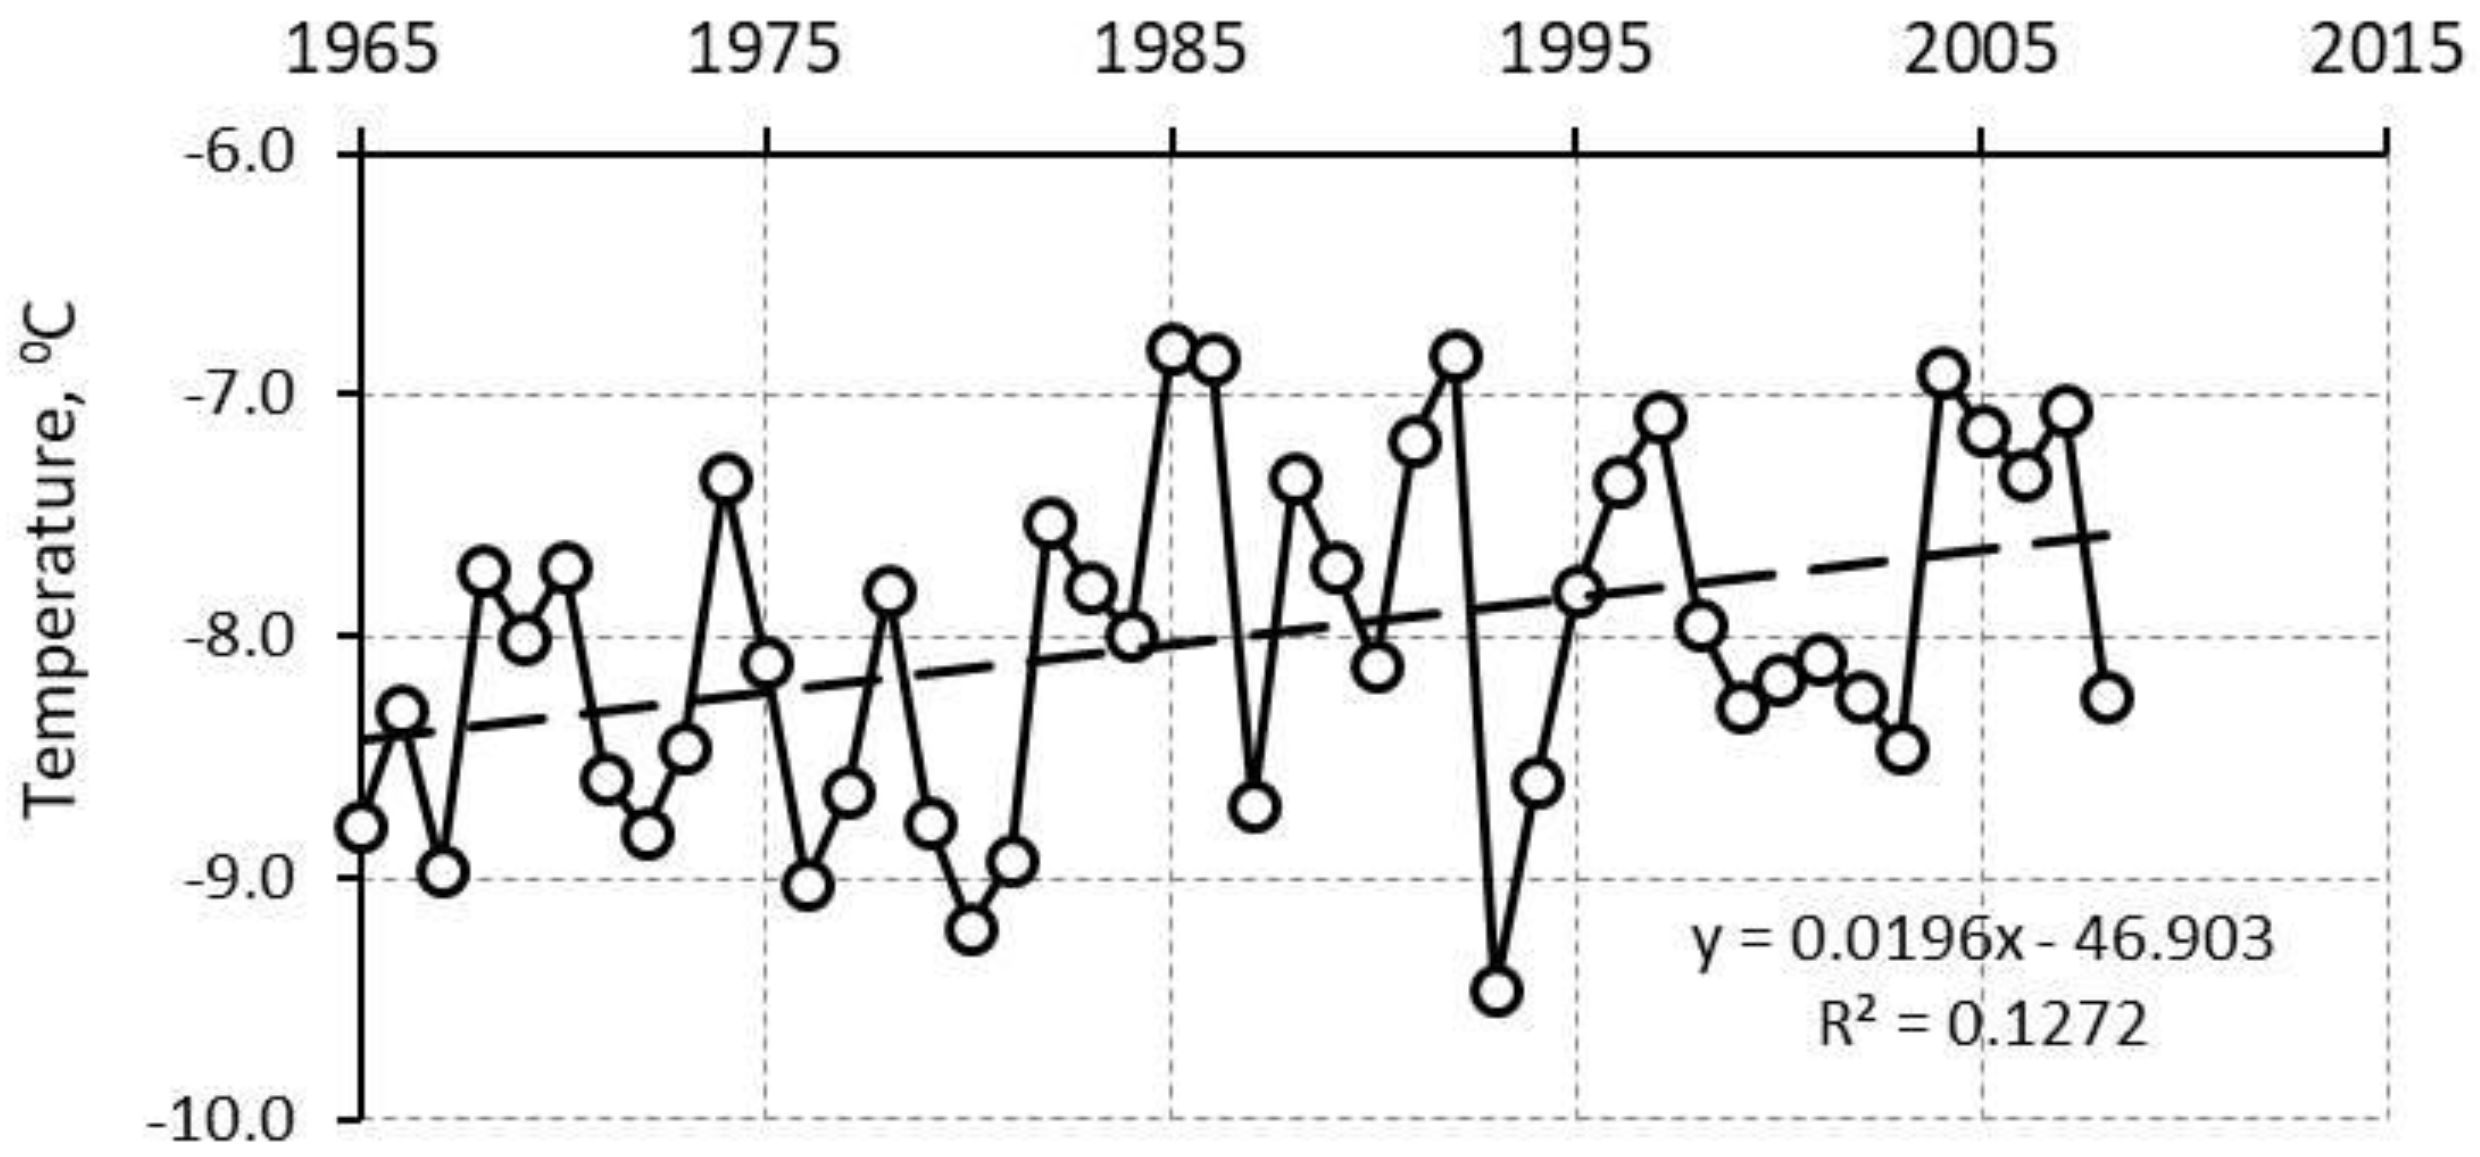
Figure 19 shows that between 1965 and 2008, the Ust–Moma weather station observed a continuous rise in mean annual permafrost temperature at a depth of 1.6 m in the Verkhoyansk–Chersky mountain region.
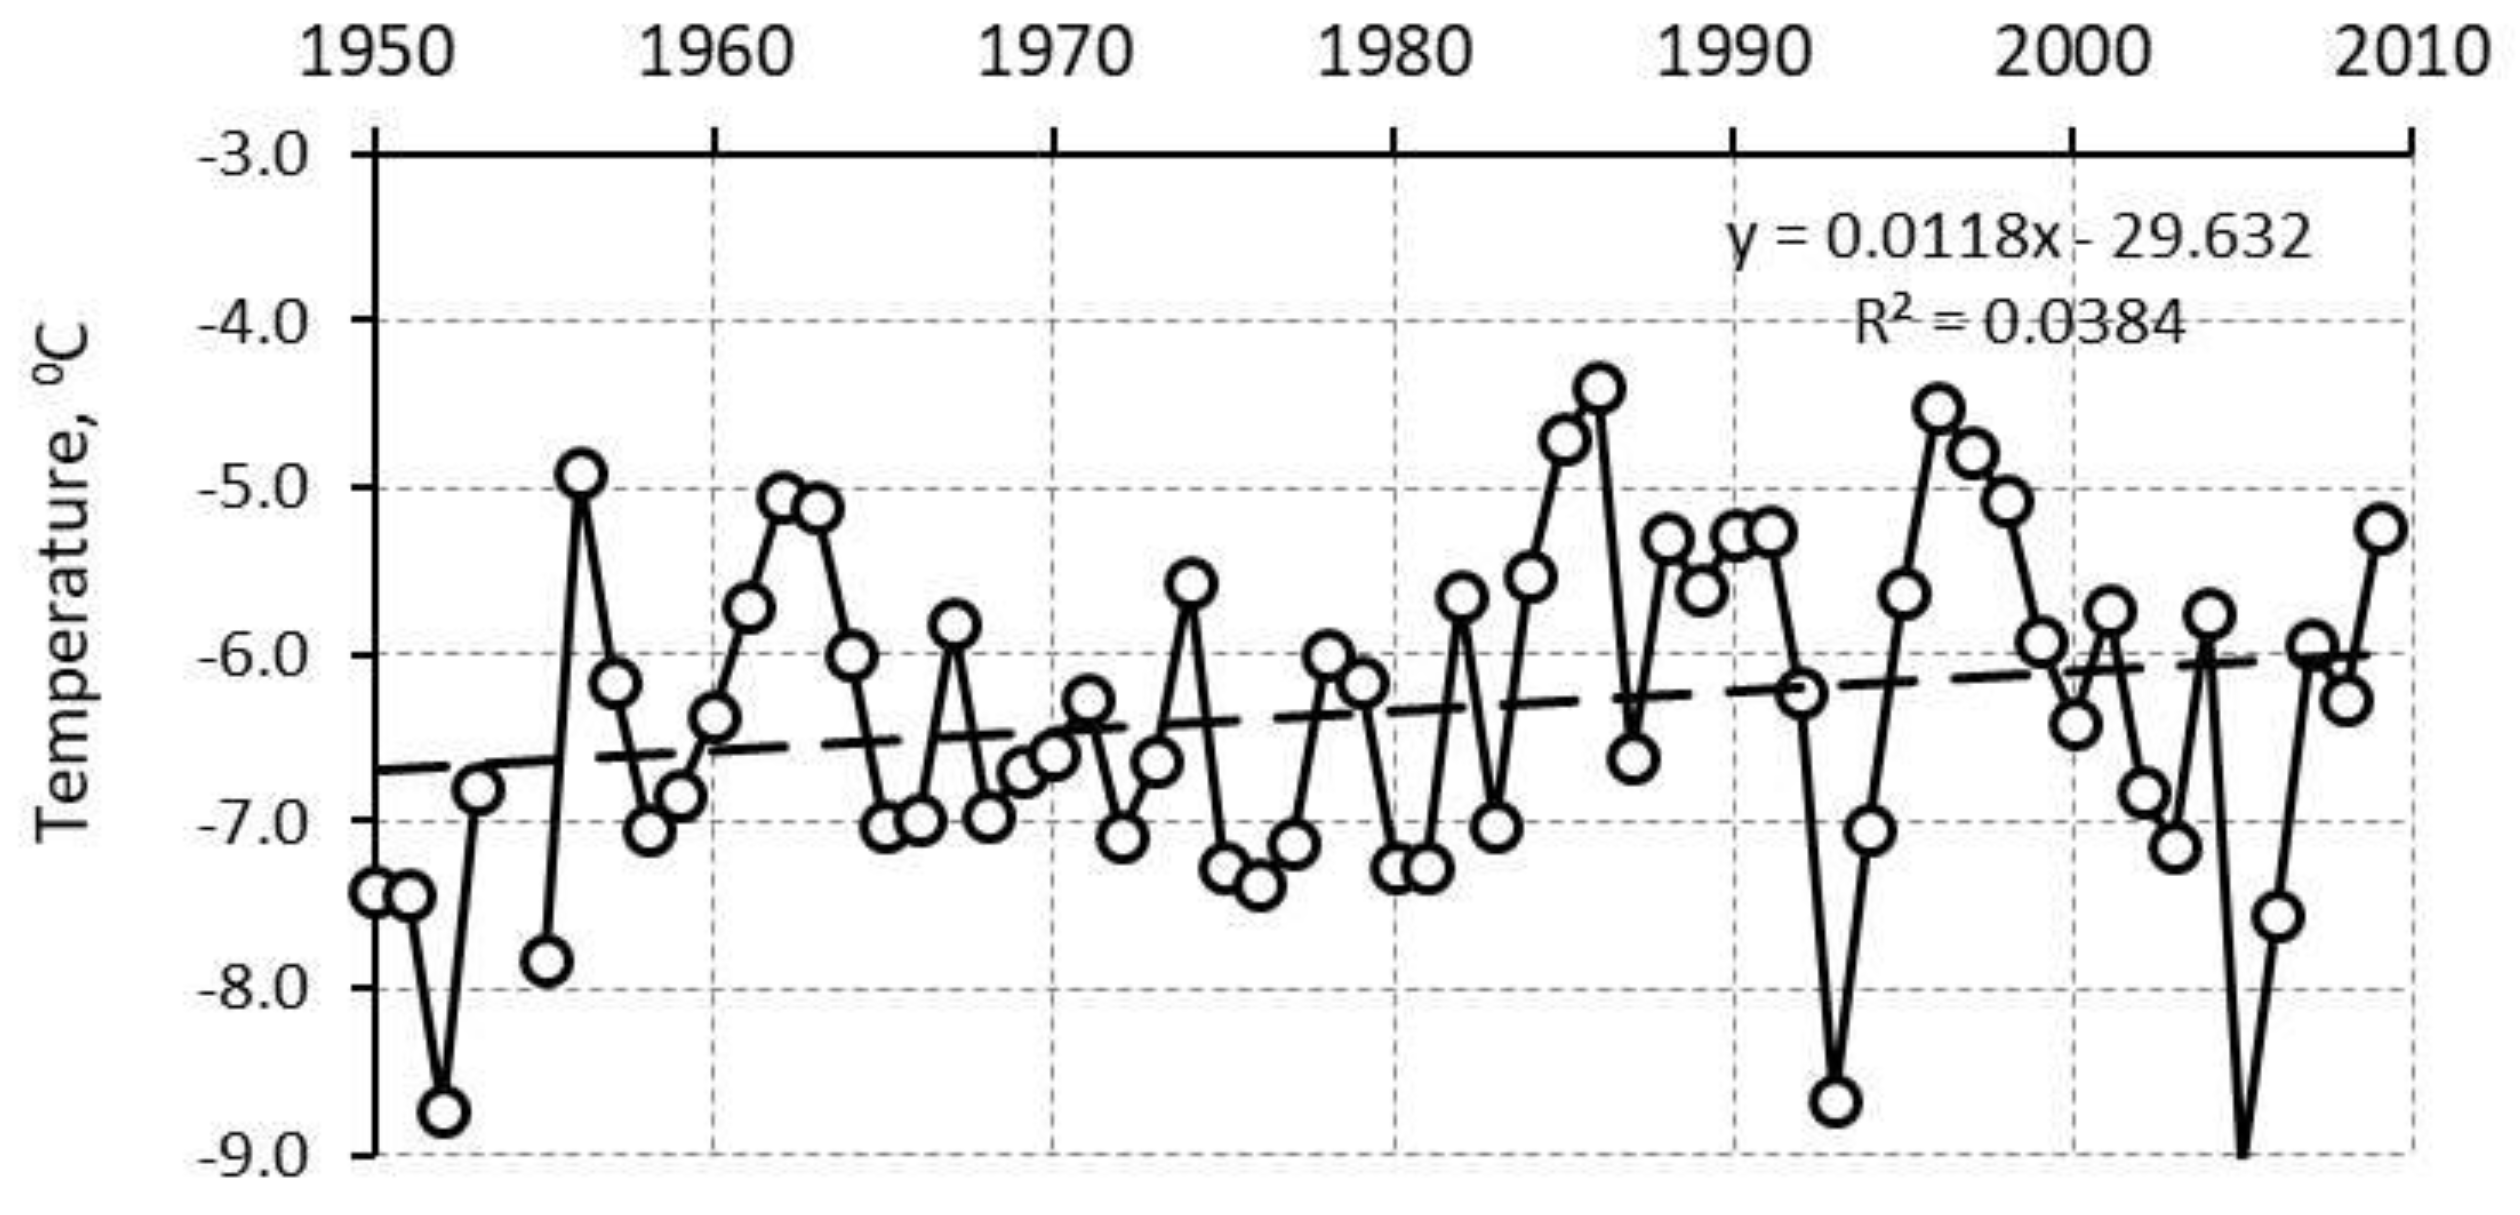
No meteorological stations in high-mountain Subarctic regions record soil temperature data. The Delyankir weather station, located in the highlands but further south, offers a window into the dynamics of permafrost conditions in these areas. Based on data from this weather station, the mean annual permafrost temperature at a depth of 1.6 m showed a positive trend of 0.01 °C/year from 1950 to 2009 (
Figure 20).
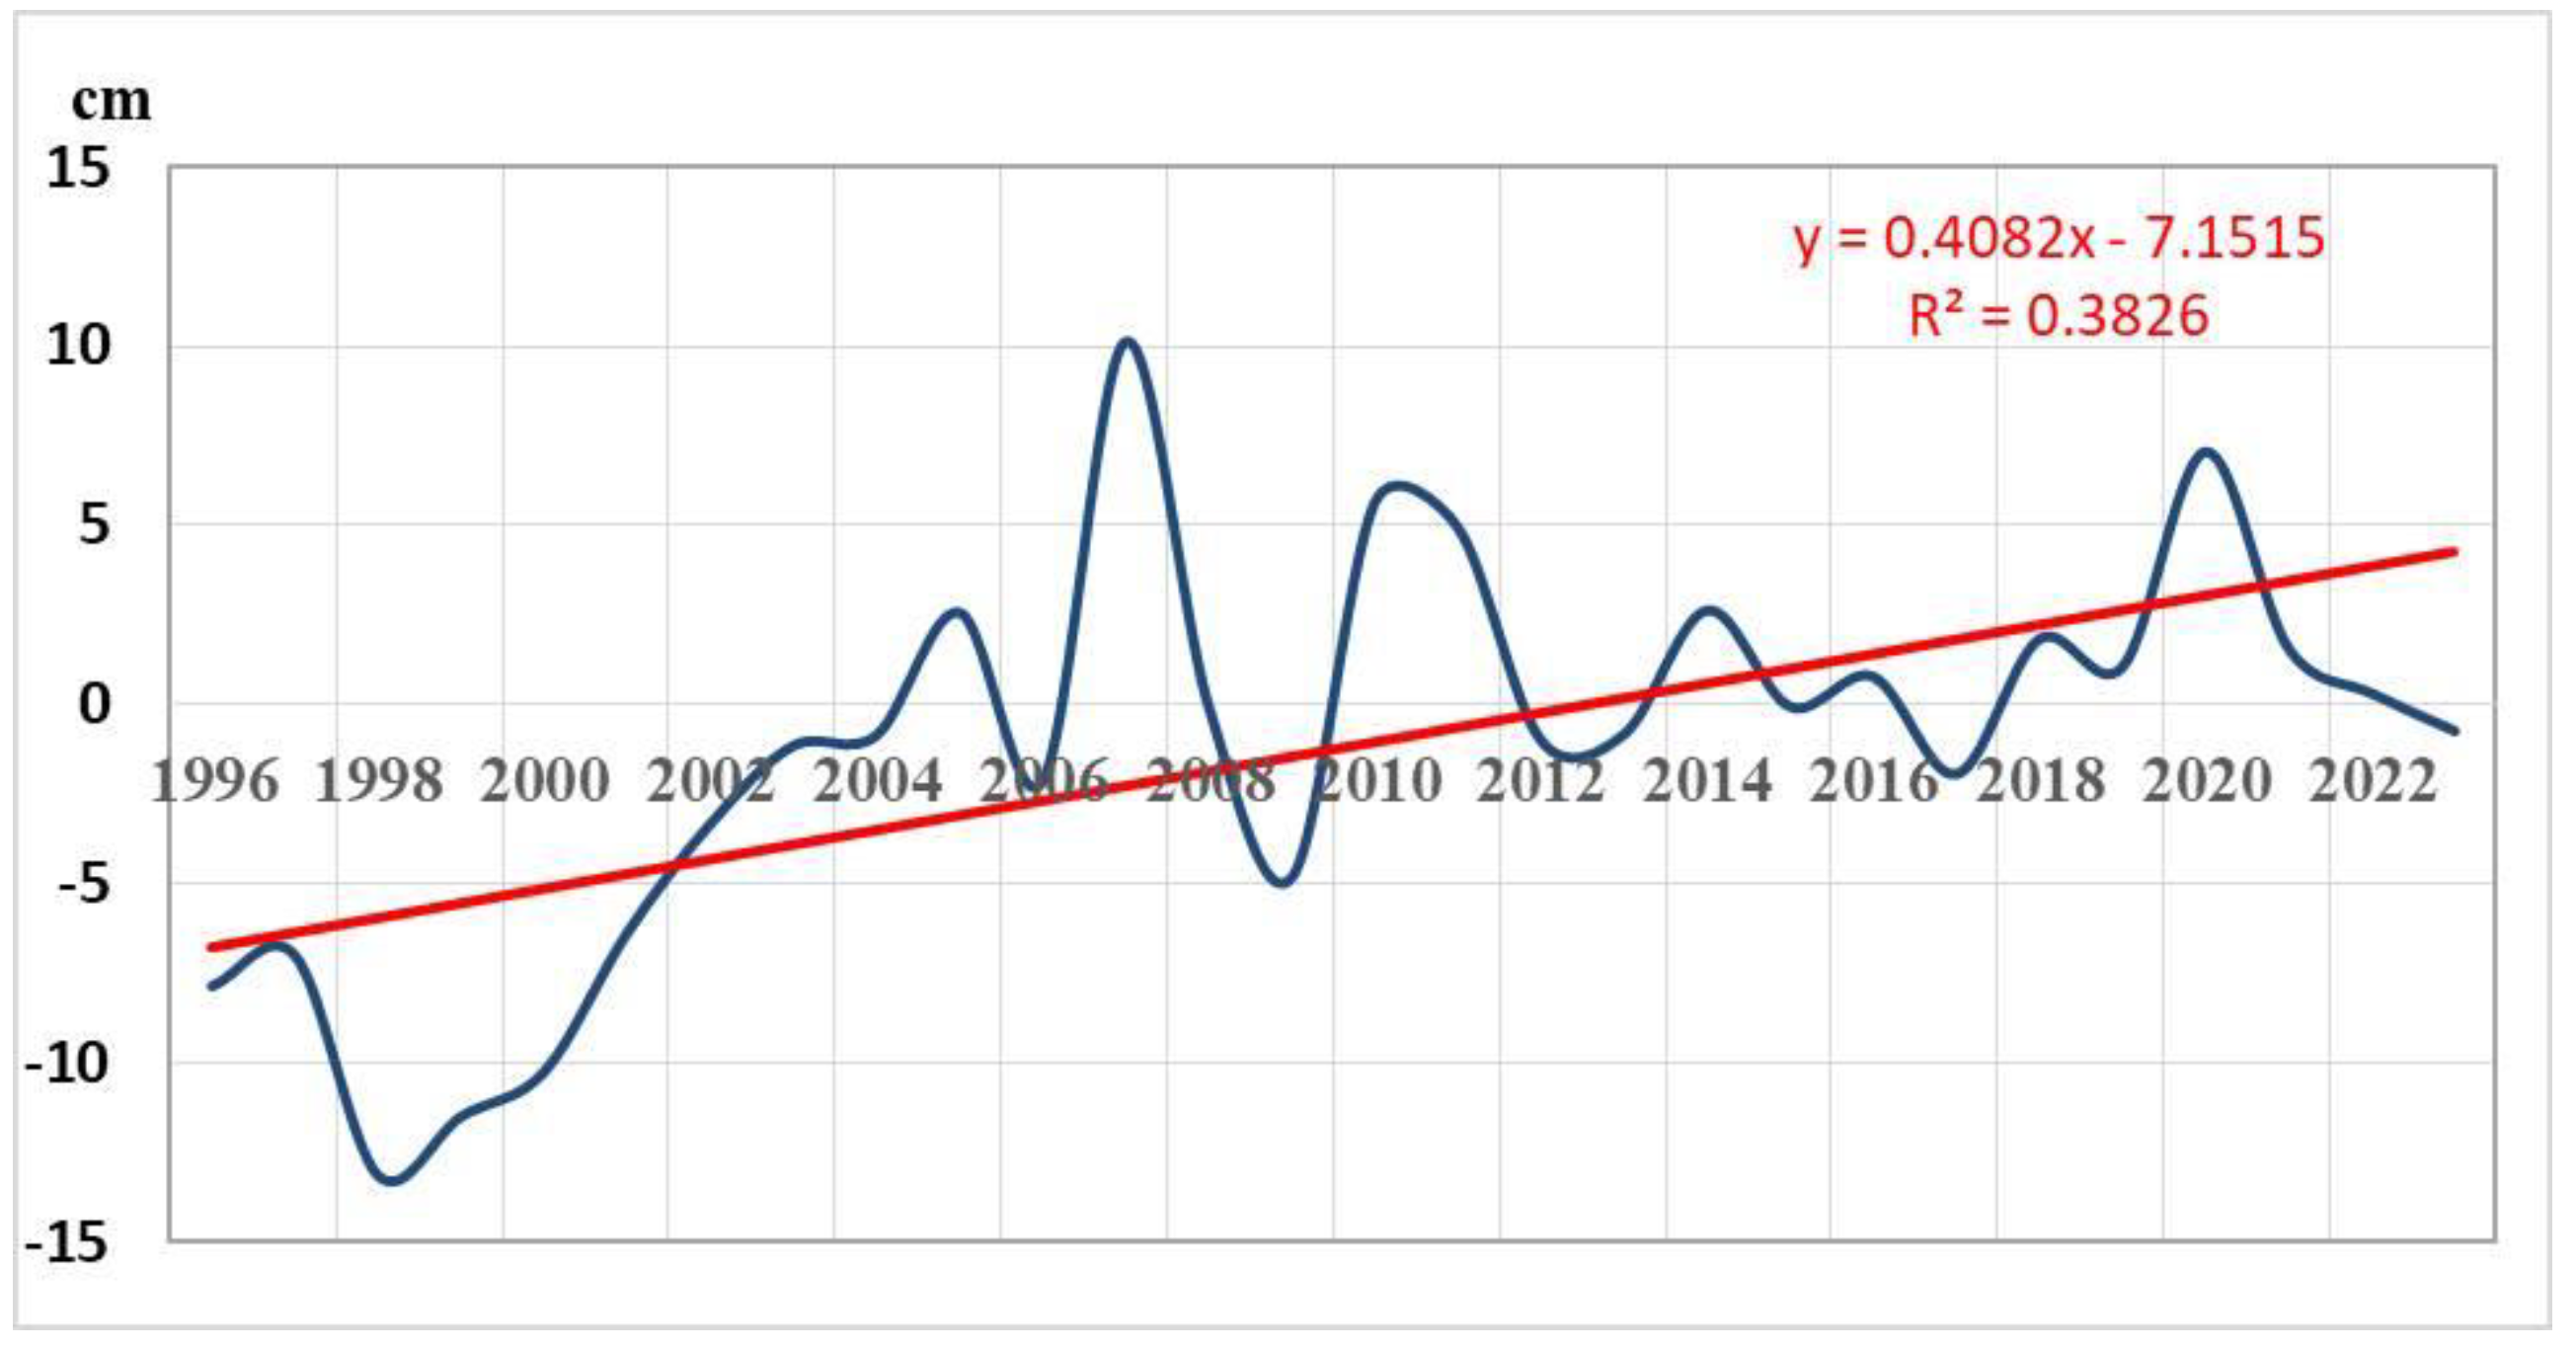
Active layer thickness. We studied the CALM data specifically for Yakutia's Arctic zone. A selection of 18 polygons was performed for typical landscapes (
https://www2.gwu.edu/~calm/data/north.htm). To demonstrate the fluctuation in active layer thickness, we focused on the impact of local landscape conditions. Using the data from each site, we calculated the yearly variability of deviation of active layer thickness and overall average variability (
Figure 21).
The active layer thickness showed distinct negative deviations from the long-term norm during 1996-2004, followed by a significant increase during the warming period of 2005-2023. In 2007, 2010, and 2020, a significant rise in the active layer thickness was observed during the warming period.
Cryogenic processes. A study by Morgenstern et al. [
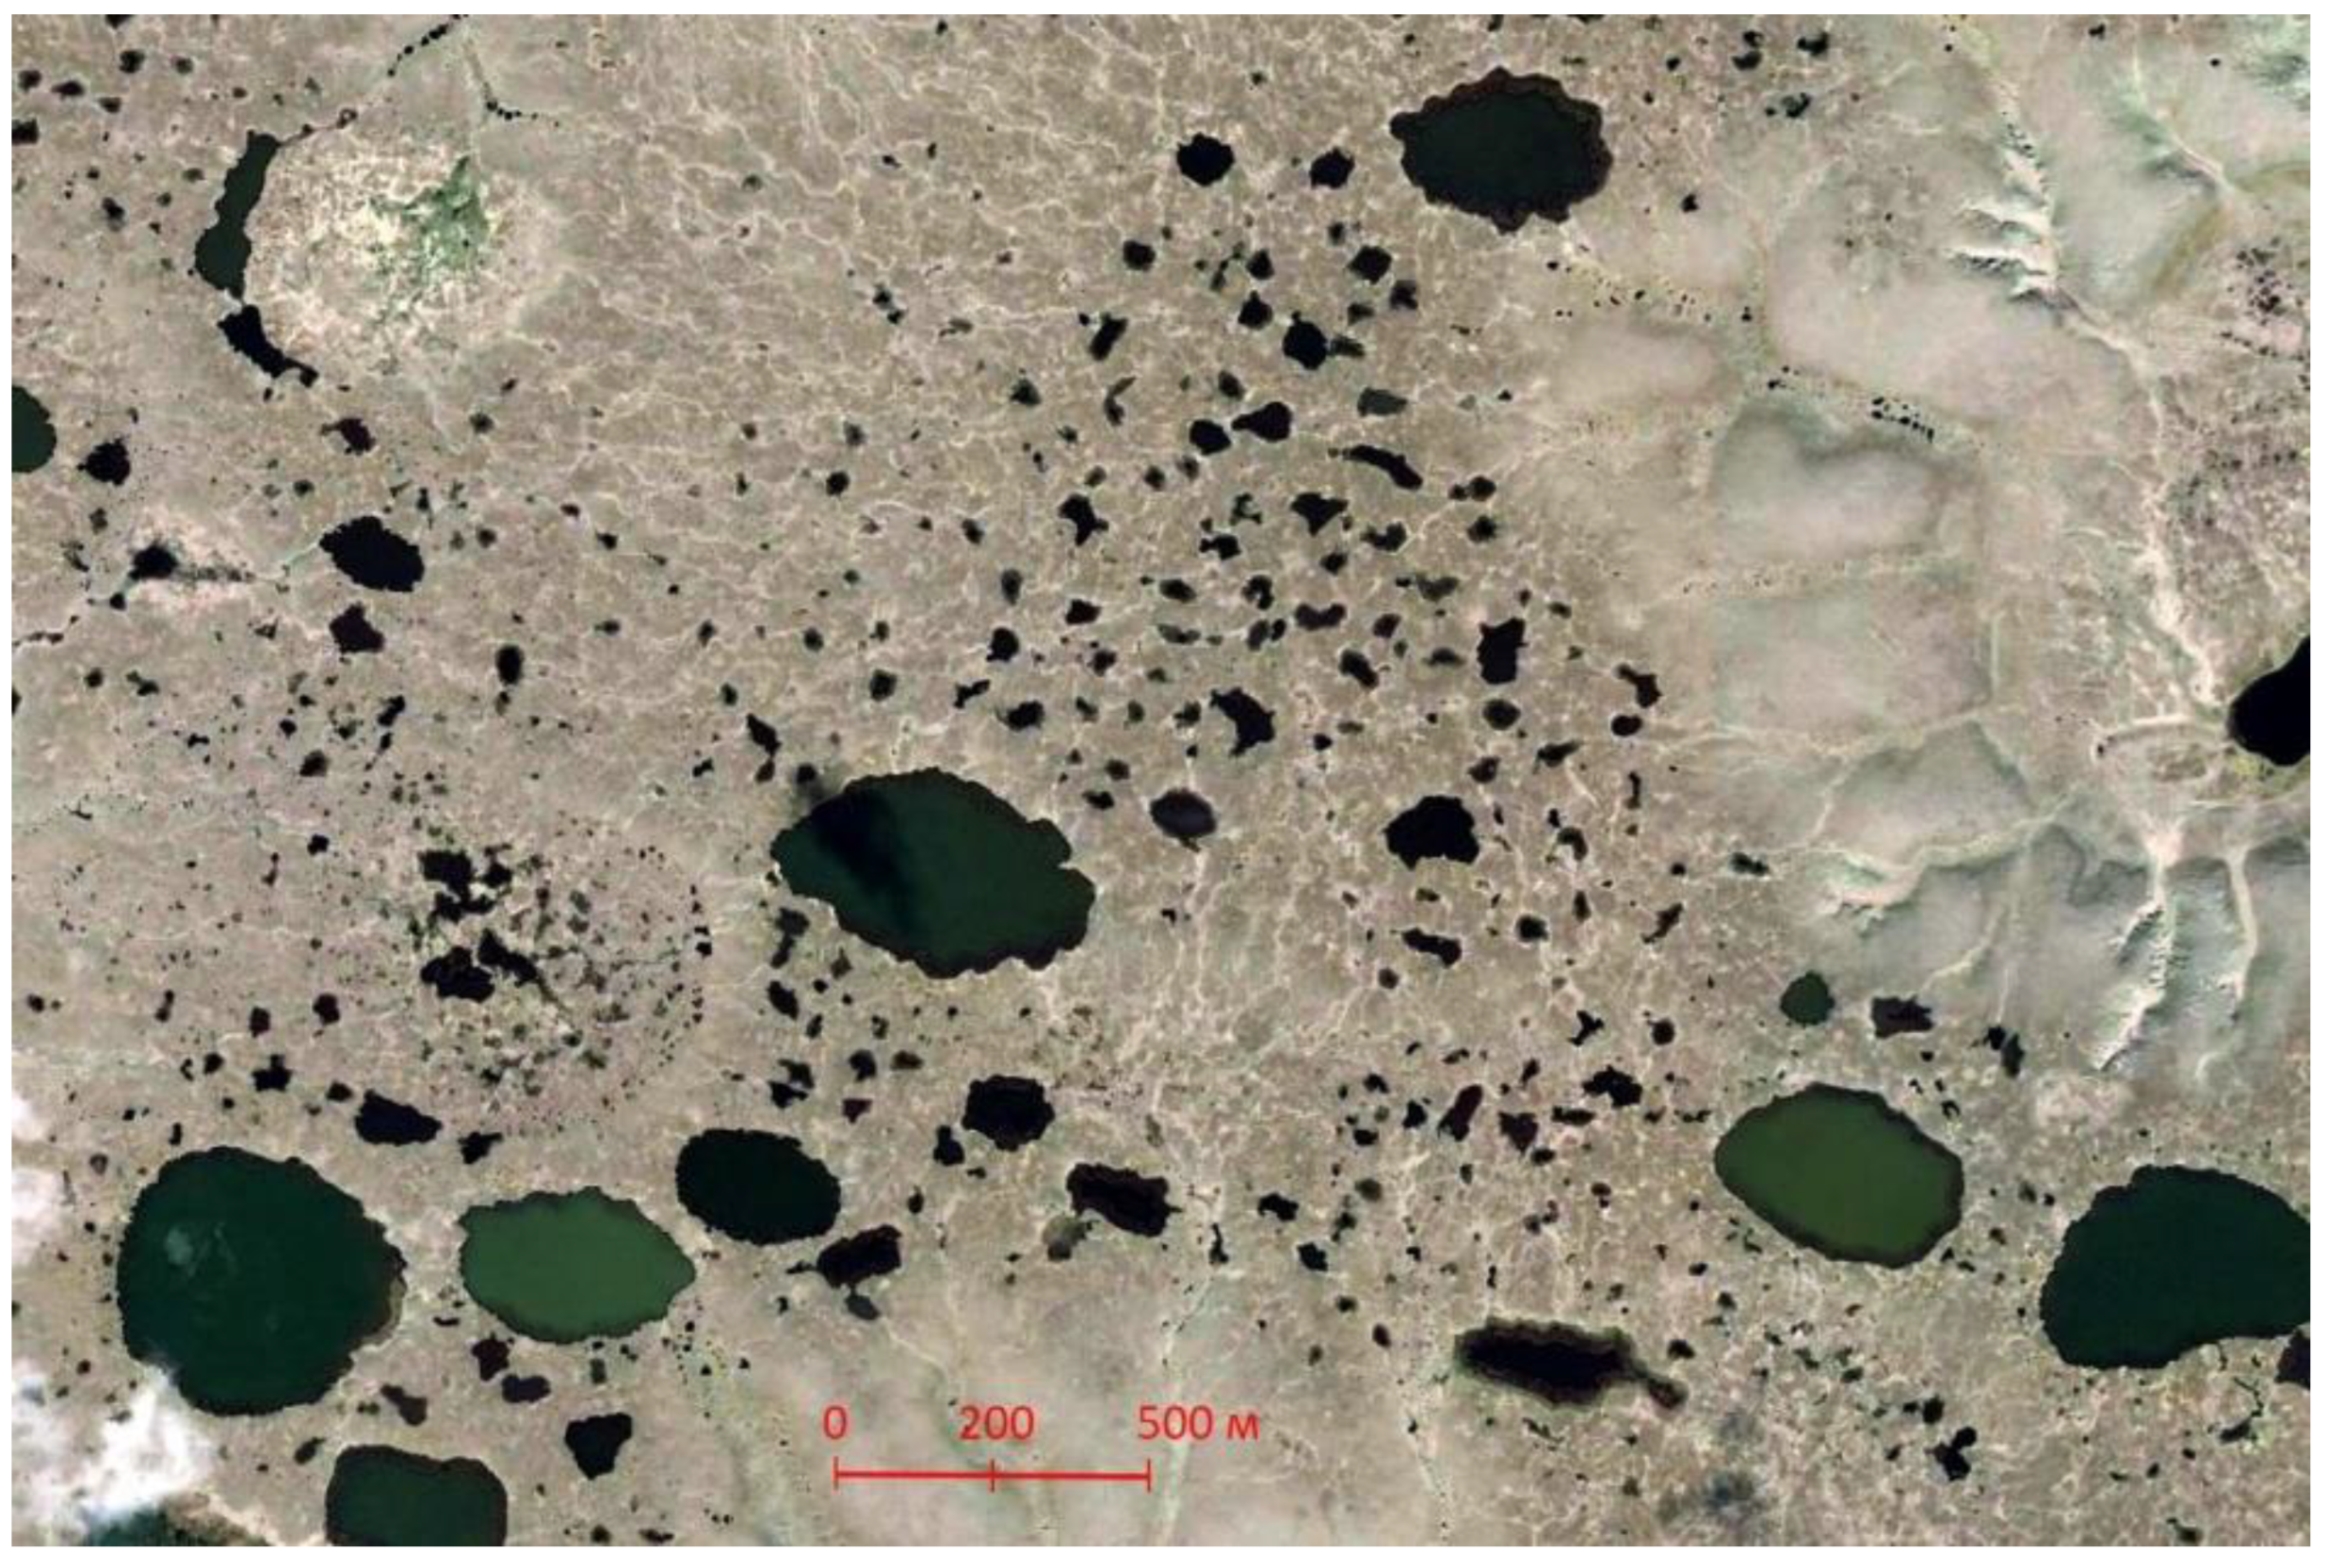
35] confirmed that Yedoma in the Lena River delta can experience thermokarst activation due to icy permafrost. Their data indicate the presence of over 1800 thermokarst lakes, which have an average size of about 0.3 hectares.
Figure 22 shows that the contemporary thermokarst process in the Arctic is highly active.
According to Grigoriev et al. [
36], an increase in air temperature activates thermal erosion on the icy shores of the Arctic seas of Eastern Siberia, which was observed in the 1930-1940s and the 1990s. In 2006-2008, there was a significant rise in thermal erosion caused by a sudden increase in air temperature in the East Siberian part of the Arctic, as noted by Grigoriev [
37].
Walter et al. [
38] discovered the expansion and emergence of thermokarst lakes in Chersky, Kolyma River, using satellite image analysis of 1974 and 2000. Van Huissteden et al. [
39] observed a threefold increase in the number of thermokarst lakes in the lower Indigirka region near Chokurdakh based on satellite images from 1977 and 2010. The lakes also significantly expanded in size. This indicates the occurrence of significant permafrost degradation.
4. Discussion
Consequently, the studies conducted reveal that the geocryological situation in the tundra zone of North-Eastern Eurasia worsened from 2005 to 2020, whereas it was less evident during 1988-1995. According to climate data, the geocryological hazard for landscapes was lower in the 1930-1940s compared to recent years [
25].
In Arctic Yakutia, the melting of ice wedges has led to the widespread presence of high-centered polygons in disturbed areas. Other permafrost regions are also experiencing significant thawing of deep ice permafrost due to the current climate warming [
8,
9,
40,
41,
42,
43,
44,
45,
46]. The emergence of cryogenic risks in Arctic landscapes is indicated by their development. Moreover, global warming activates thermal erosion, landslides, solifluction, and other dangerous phenomena.
The distribution of Yedoma and the thickness of ice wedges is crucial for understanding permafrost hazards. Substantial success has been attained in this field [
47,
48]. Nevertheless, additional data are needed to investigate the dynamics of these landscapes. Understanding the depth of the occurrence and thickness of ice wedges is crucial in this context. Nonetheless, acquiring these data demands extensive effort. Based on field observations in undisturbed landscapes, preliminary GIS modeling was conducted using a permafrost landscape map. The depth of the upper edge of ice wedges in the arctic tundra is, on average, 0.5; 0.9 in typical tundra; 1.1 in southern shrub tundra; and 1.3 m in pre-tundra larch sparse forests [
49]. A 1.5-2-fold increase in thawing depth leads to a higher cryogenic risk for thermokarst development in these landscapes.
Recent climate warming in the Arctic part of Yakutia indicates a rise in the mean annual permafrost temperature by 1.5-2 °C and more calls to the emergence of cryogenic risks. Permafrost covered with unusual vegetation is greatly affected by changes in the thawing and freezing index, especially in disturbed areas. Areas with grassy tundra on ice-rich permafrost are where cryogenic processes are mainly developed.
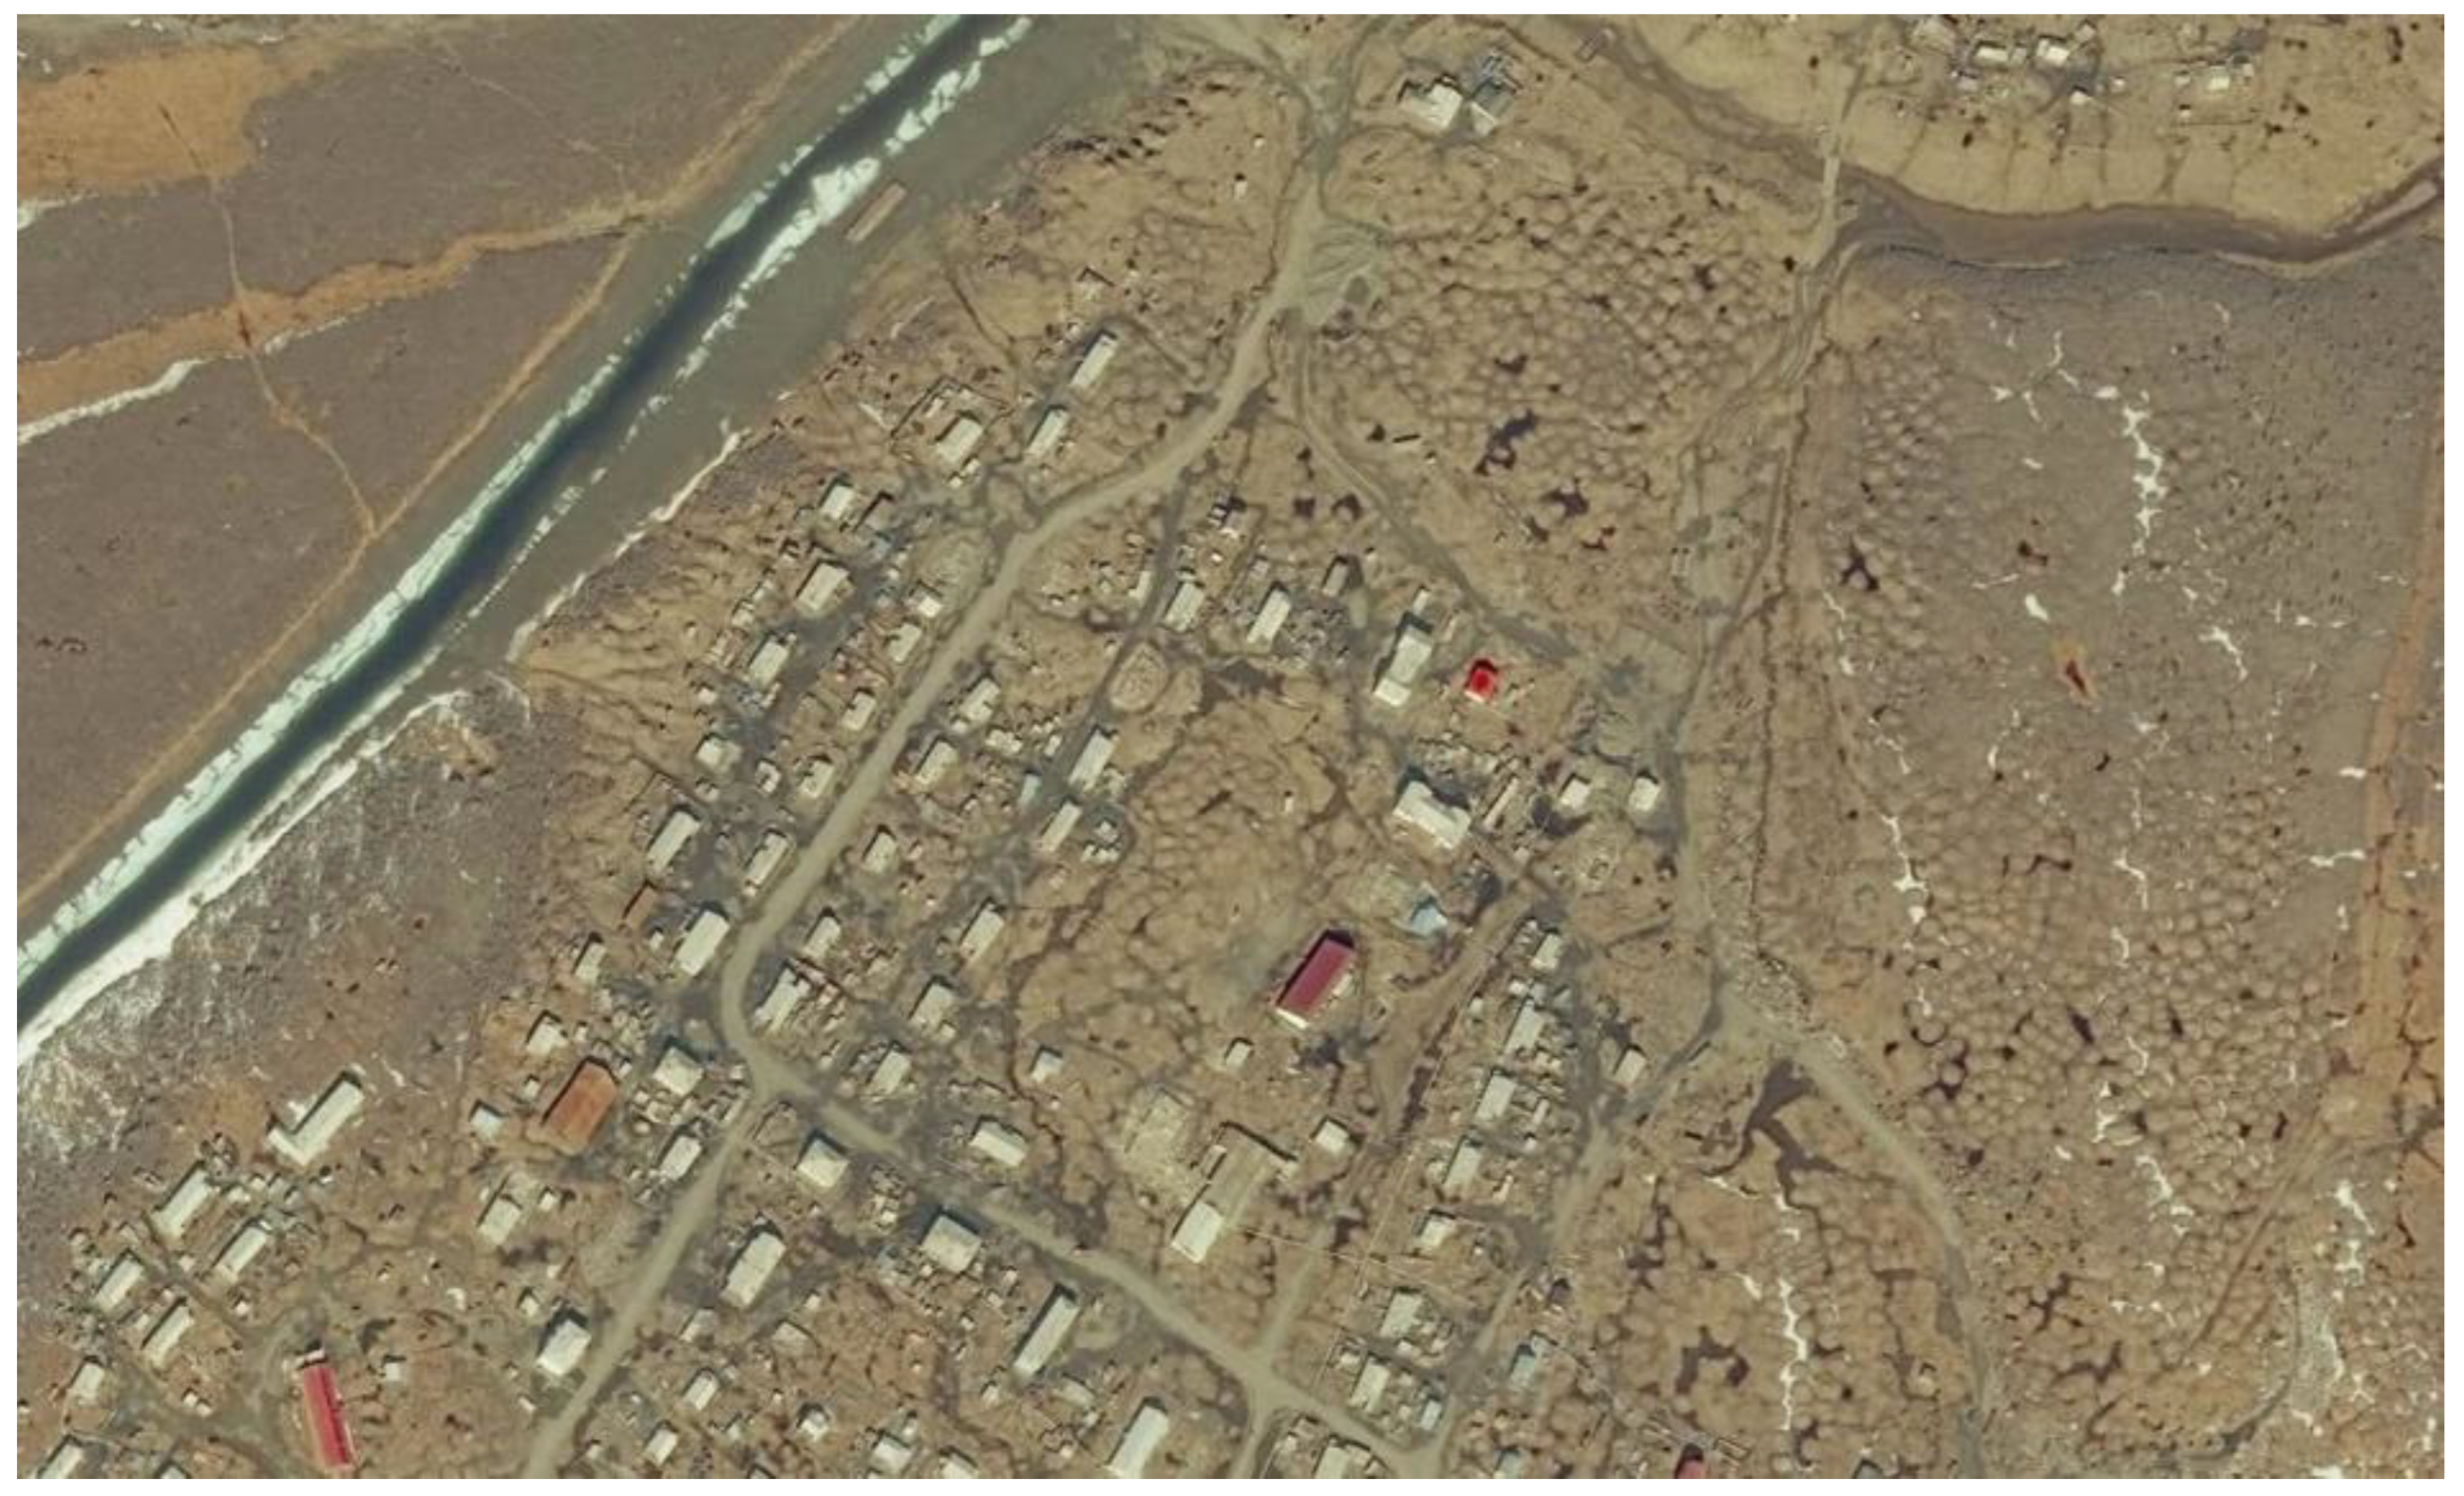
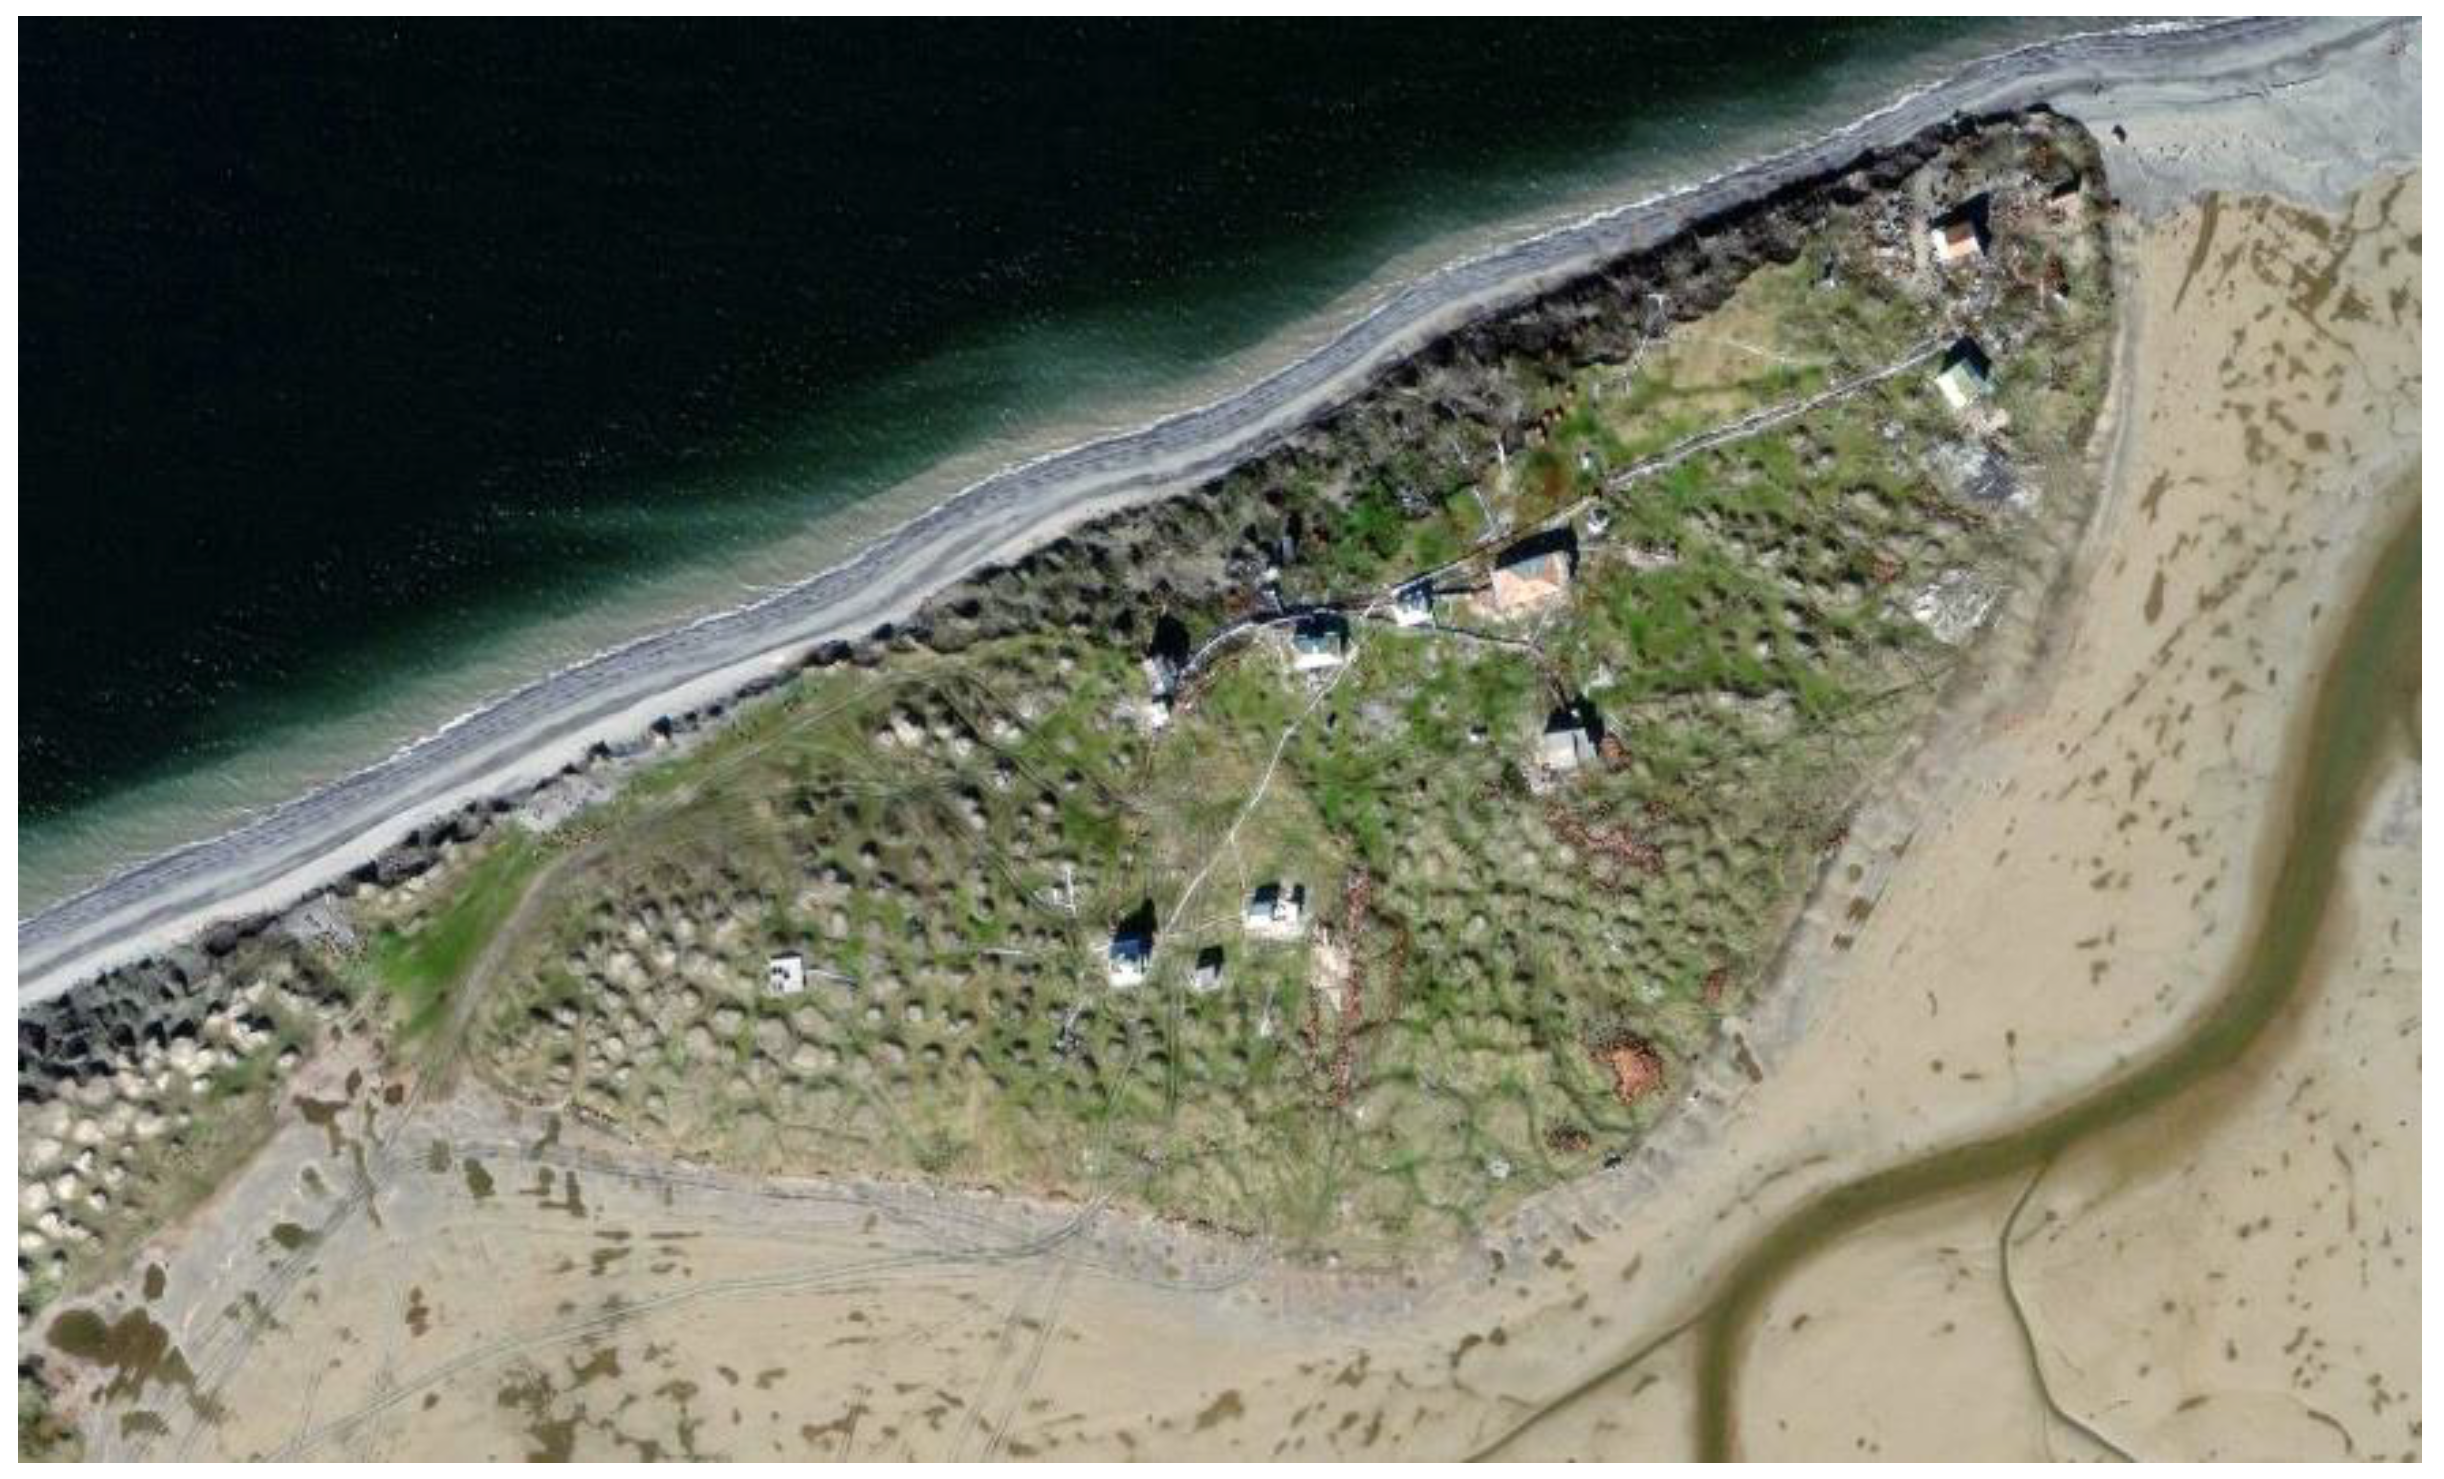
In the Arctic zone of Yakutia, the most common cryogenic process is thermokarst, which involves thawing ice-rich permafrost, leading to subsidence and collapse relief forms. High-centered polygons (
Figure 23 and
Figure 24) are the common initial relief forms in Yedoma terrain. The existence of initial thermokarst forms signals the degradation of permafrost. Mapping these disturbances would help us to gauge the level of degradation of ice-rich permafrost.
The study conducted by Jorgenson et al. [
50] on permafrost resilience and vulnerability is a classic work in assessing the geocryological hazards associated with global warming. Studying the transformation of vegetation species in an evolutionary model can yield valuable insights into permafrost changes. For example, according to Tyrtikov [
51], replacing the moss-lichen cover near Igarka with dry bluegrass can triple the active layer thickness from 0.42-0.48 to 1.26 meters. In the Dikson settlement area, the active layer thickness ranges from 0.2-0.4 m in lichen–moss arctic tundra while reaching 0.5-0.6 m in dryad–grassy polygonal grassy arctic tundra [
52]. These data illustrate the correlation between vegetation changes and permafrost conditions. When moss–lichen cover is replaced by forb–grass groups, the active layer thickness increases significantly, resulting in permafrost degradation.
Understanding the patterns of secondary vegetation successions can offer valuable insights into land restoration after fires, logging, and permafrost disturbances [
53,
54,
55,
56,
57]. This will help us understand how biota influence permafrost stabilization and restoration after disturbances. Currently, there is an insufficient number of studies of the influence of vegetation type and biomass changes on the state of permafrost under global warming. To accurately evaluate permafrost change, it is crucial to consider ecosystem and biota changes in this study of climate change.
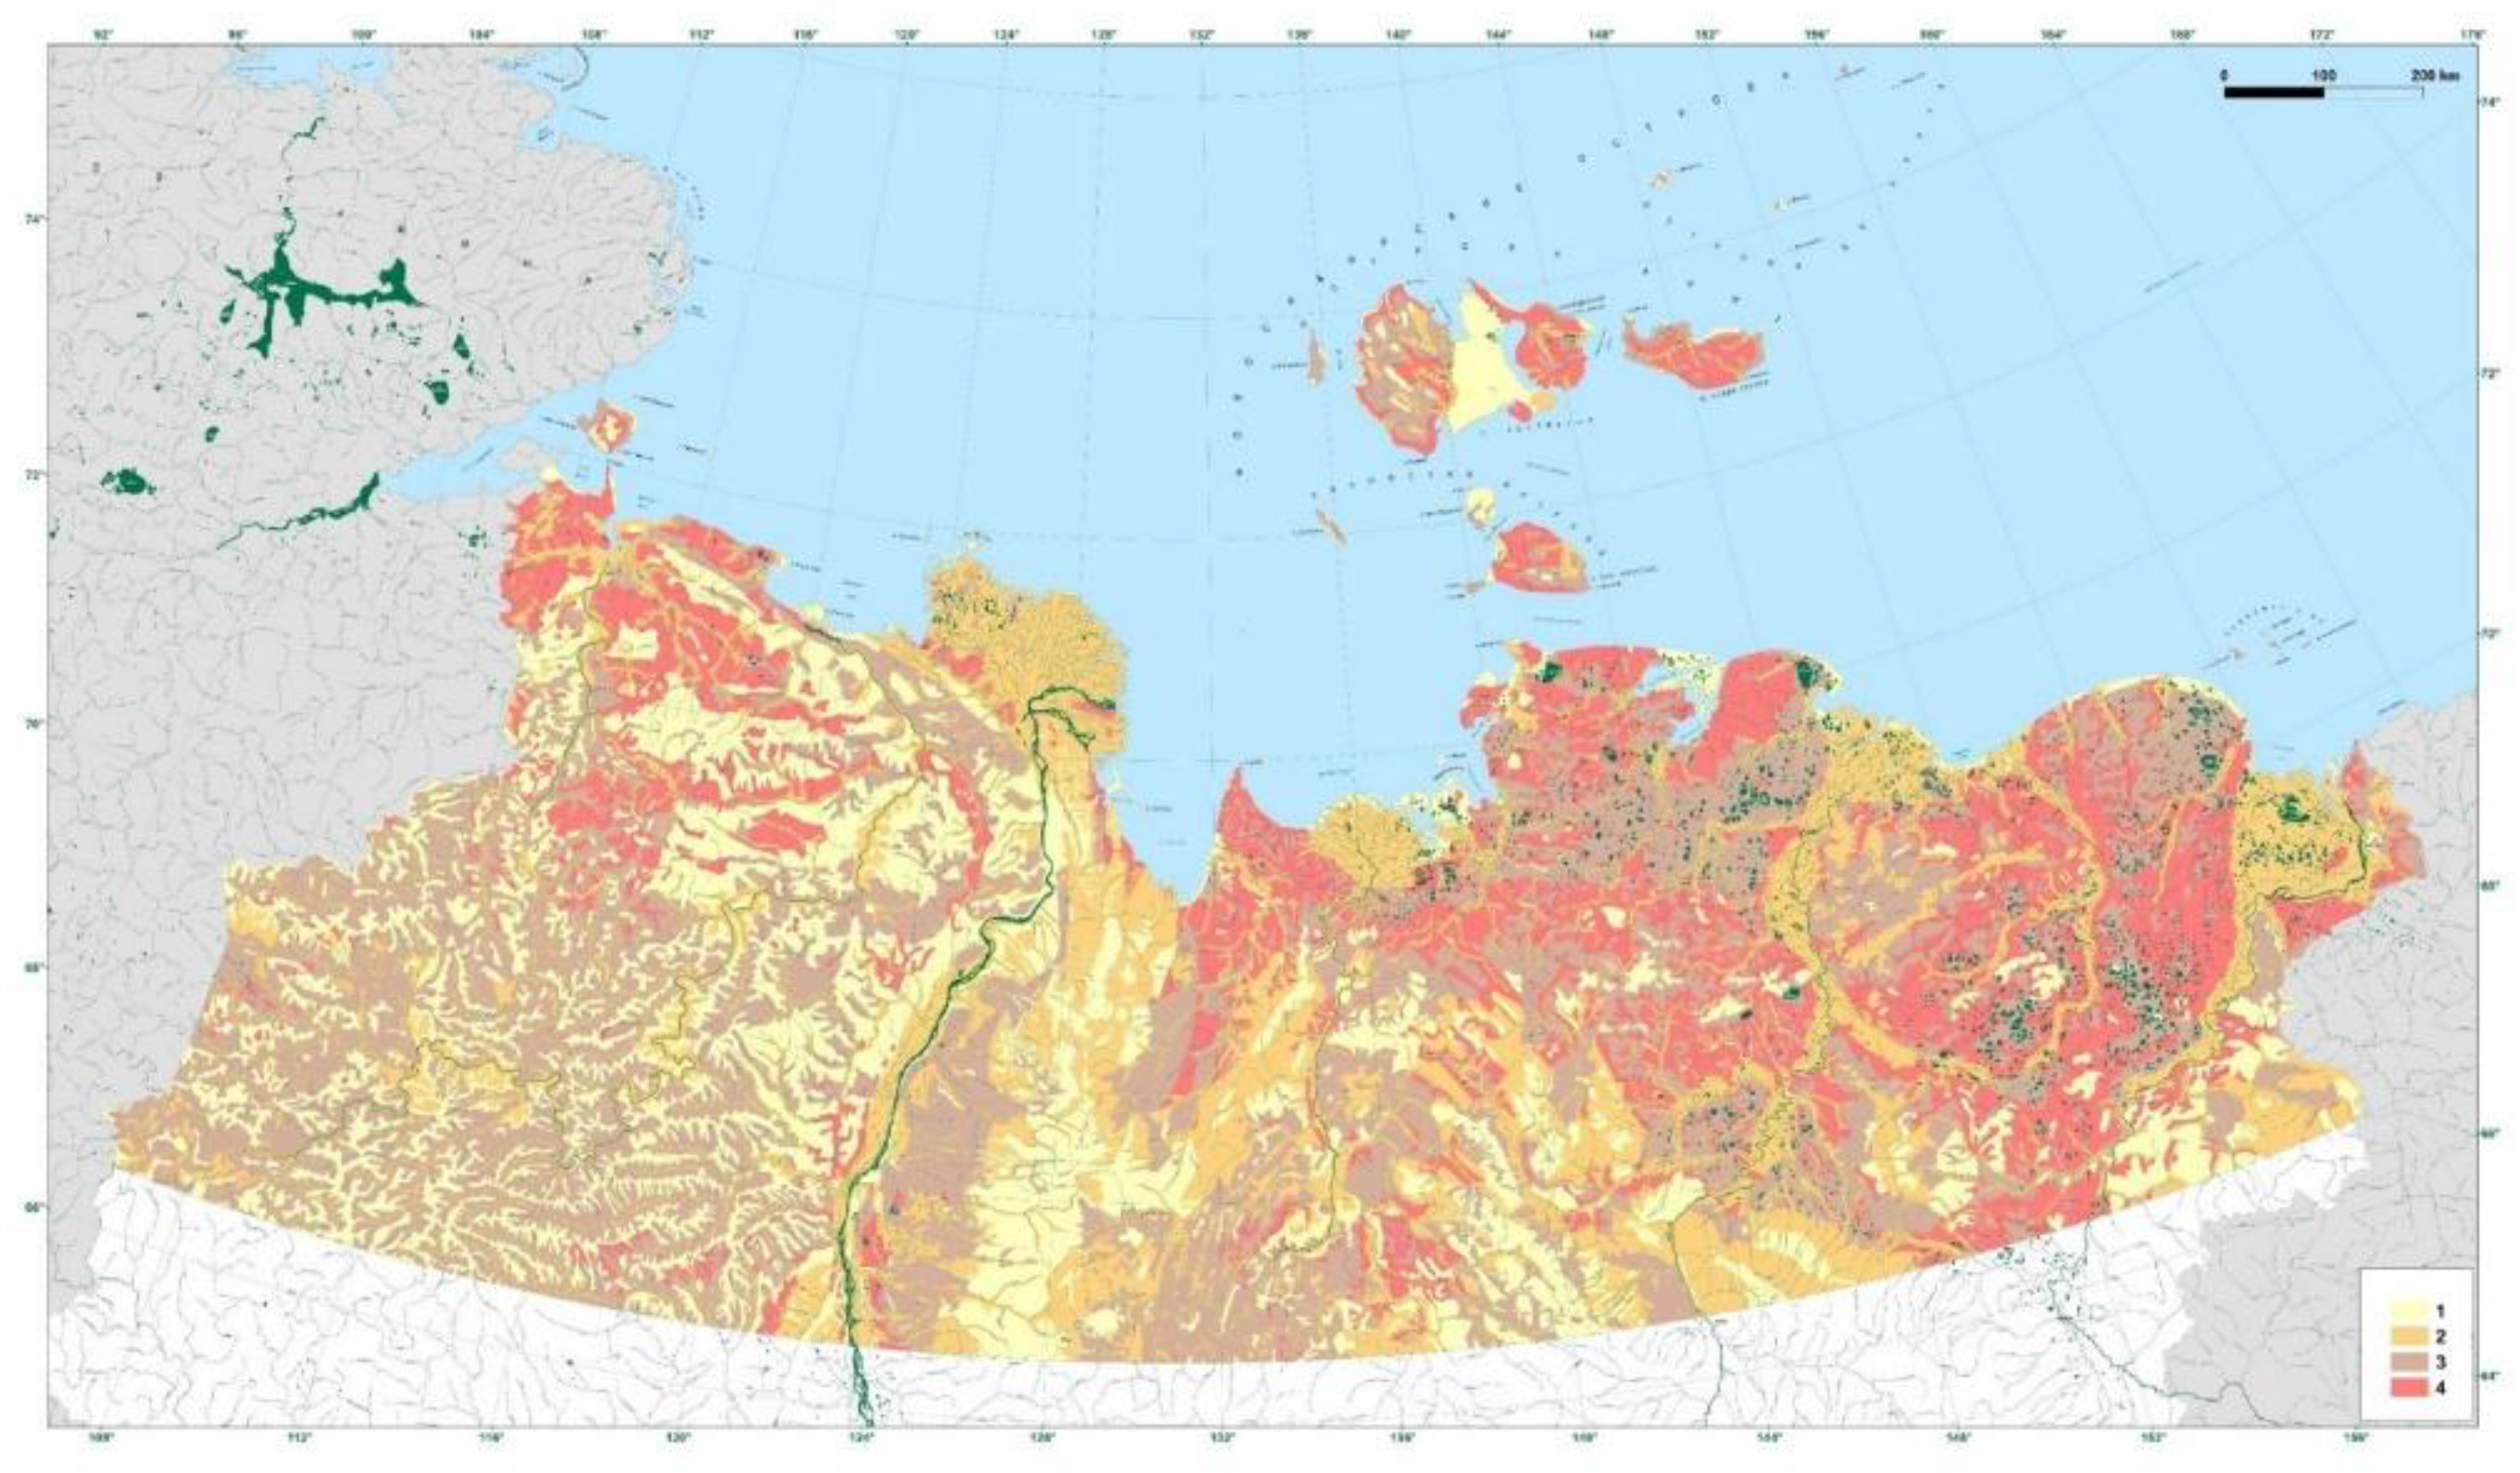
Geocryological hazards. The ice in permafrost is closely connected to the advancement of negative cryogenic processes. Studying geocryological hazards requires valuable information on the permafrost ice content and the characteristics of cryogenic processes in diverse landscapes. Using an ice volume map [
24], we developed a map that displays the potential geocryological hazards in the Arctic and Subarctic Yakutia (
Figure 25). The reason we included this in this section is because the ice content of permafrost determines all the negative impacts of climate warming. The ice content of permafrost must be taken into account when addressing climate warming issues. Ecosystems on low-ice permafrost can adjust to new climate conditions without major damage, while adapting to an ecosystem with high-ice permafrost will be difficult for both nature and socio-economics.
Least susceptible. Low-ice permafrost with nearby rock formations and coarse-grained, sandy deposits are the most resistant to negative cryogenic processes. The ice content can reach up to 0.2 in volume. The processes that occur in these landscapes are not capable of causing destruction. Approximately 21% of the Arctic and Subarctic Yakutia being examined are covered by these landscapes.
Moderately susceptible. Landscapes containing 0.2-0.4 volumetric ice content are moderately susceptible to negative cryogenic processes. These include marine and high river terraces, outwash fields, and deluvial–solifluction complexes. Although the processes in these landscapes are active, they do not cause destruction. Landscapes can be easily restored following disturbances. A total of 26.6% of the Arctic and Subarctic Yakutia is moderately susceptible.
Highly susceptible. Permafrost with an ice content of 0.4-0.6 is typically highly susceptible to negative cryogenic processes. The landscape includes low river terraces, thermokarst plains, moraines, and swampy inter-ridge depressions. With climate warming and disturbances, the structure of these landscapes can change due to the thawing of underground ice. A total of 31.8% of the territory of the Arctic and Subarctic of Yakutia typically is highly susceptible.
Most susceptible. Ultra-icy Yedoma and poorly drained swampy territories (about 18.5%) are most susceptible to negative cryogenic processes due to their high volumetric ice content of 0.6 and above. The large-scale thawing of underground ice results from climate changes and disturbances. The structure of the landscape transforms dramatically, giving way to the creation of thermokarst lakes and alas. In the Holocene warming periods, approximately 72% of the Yedoma territory in the Kolyma tundra turned into thermokarst plains—alases—due to degradation [
58].
About 1.5% of the presented map is covered by water bodies. The small-scale map helps us estimate areas of natural hazards in Arctic and Subarctic Yakutia. The situation is worse in the northern part of North-Eastern Siberia in this regard. The ice content in the permafrost here is significantly higher. However, dangerous areas can be found everywhere across the landscape.
5. Conclusions
Our analysis of climate changes over the last 50-60 years has revealed three distinct periods in the climate development of Arctic and Subarctic Yakutia. It is easy to differentiate between the cold eras (1965-1987), the pre-warming phase (1988-2004), and the modern warming period (2005-2023). The mean annual air temperature difference between the cold period and modern warming in Yakutia's Arctic zone is 2.5 °C, compared to a 2.2 °C difference in the Subarctic zone. The average increase in the thawing index was 171 °C days in the Arctic and 214 °C days in Subarctic Yakutia, while the freezing index increased by 702 °C days and 564 °C days, respectively. All three characteristics experienced slight warming during the pre-warming period.
Climate change caused permafrost warming and an increase in the thickness of the active layer, especially in the 2004-2023 period. In the longest-term monitoring site near Tiksi, after the mid-2000s, increasing warming was noted at depths of 3, 10, and 30 m. Thus, at a depth of 10 m during this time, the permafrost temperature increased by 1.7 °C, as well as 1.1 °C at a depth of 30 m. The climatic boundary of 2004/2005 is also felt in the change in the thickness of the active layer. The activation of cryogenic processes is noted during the period of modern warming. All this leads to the formation of geocryological hazards. Based on the map of the volumetric ice content of permafrost landscapes [
24], a map of susceptibility to geocryological hazards in Arctic and Subarctic Yakutia during climate warming was compiled.
The results of the conducted research are the information base for further study of the impact of global climate warming on permafrost, retrospective assessments of the formation of permafrost conditions in the Holocene and Late Pleistocene, and forecasts of changes in permafrost landscapes in the future. All this can be a basis for conducting environmental studies on adapting socio-economic conditions in the north of Yakutia to modern climate warming.
Author Contributions
Conceptualization, A.F., M.Z., and P.K.; methodology, A.F.; validation, A.F.; formal analysis, A.F.; investigation, N.V., S.V., Y.S., S.K., R.I., A.P., V.A., V.N., M.S., and M.Z.; resources, A.F.; data curation, A.F.; writing—original draft preparation, A.F. and P.K.; writing—review and editing, A.F. and P.K.; visualization, A.F.; supervision, A.F. and M.Z.; project administration, A.F. and M.Z.; funding acquisition, A.F. and M.Z. All authors have read and agreed to the published version of the manuscript.
Figure 1.
The 1:1,500,000 scale permafrost landscape map of the Republic of Sakha (Yakutia) [
13].
Figure 1.
The 1:1,500,000 scale permafrost landscape map of the Republic of Sakha (Yakutia) [
13].
Figure 2.
A fragment of the legend of the permafrost landscape map of the Republic of Sakha (Yakutia) on a scale of 1: 1,500,000 [
13].
Figure 2.
A fragment of the legend of the permafrost landscape map of the Republic of Sakha (Yakutia) on a scale of 1: 1,500,000 [
13].
Figure 3.
Permafrost climatic zoning of Yakutia. Arctic regions: 1—New Siberian Islands, 2—Lena–Anabar, and 3—Yana–Kolyma; Subarctic regions: 4—Lena–Olenek, 5—Yana, 6—Kolyma–Indigirka, and 7—Verkhoyansk–Chersky.
Figure 3.
Permafrost climatic zoning of Yakutia. Arctic regions: 1—New Siberian Islands, 2—Lena–Anabar, and 3—Yana–Kolyma; Subarctic regions: 4—Lena–Olenek, 5—Yana, 6—Kolyma–Indigirka, and 7—Verkhoyansk–Chersky.
Figure 4.
A generalized model for deviations in mean annual air temperature in the Arctic zone of Yakutia. Thin blue line—the mean deviation for all weather stations; thick brown line—the 5-year moving average deviations for all weather stations; thick red line—the trend of the mean deviation for 1965-2023; thick, intermittent purple line—the mean deviation of all weather stations in different periods (1965-1987, 1988-2004, and 2005-2023).
Figure 5.
The fluctuations in the deviations of the mean annual air temperature according to 5-year moving averages across various areas in the Arctic zone of Yakutia. Thin blue line—New Siberian Islands; thin brown line—Lena–Anabar region; thin gray line—Yana; thick red line—the total mean deviation for the Arctic zone in Yakutia.
Figure 6.
A generalized model of changes in deviations of the thawing index in the Arctic zone of Yakutia. Thin blue line—the mean deviation for all weather stations; thick brown line—5-year moving average deviation for all weather stations; thick red line—the trend of mean deviation for 1965-2023; thick intermittent purple line—the mean deviation for all weather stations in different periods (1965-1987, 1988-2004, and 2005-2023).
Figure 7.
The fluctuations in the deviations of the thaw index according to the 5-year moving average across various areas in the Arctic zone of Yakutia. Thin blue line—Novosibirsk islands; thin brown line—Lena–Anabar; thin gray line—Yana–Kolyma region; thick red line—the total mean deviation for the Arctic zone in Yakutia.
Figure 8.
A generalized model of change in the freezing index deviation in the Arctic zone of Yakutia. Thin blue line—the mean deviation for all weather stations; thick brown line—the 5-year moving average deviation for all weather stations; thick red line—the mean deviation trend for 1965-2023; thick, intermittent purple line—the mean deviation for all weather stations in different periods (1965-1987, 1988-2004 and 2005-2023).
Figure 9.
Fluctuations in deviations of the thaw index according to 5-year moving averages across various areas in the Arctic zone of Yakutia. Thin blue—New Siberian Islands; thin brown line—Lena–Anabar; thin gray line—Yana–Kolyma regions; thick red line—the total mean deviation for the Arctic zone in Yakutia.
Figure 10.
A generalized model for deviations in the mean annual air temperature in the Subarctic zone of Yakutia. Thin blue line—mean deviation for all weather stations; thick brown line—5-year moving average deviations for all weather stations; thick red line—the mean deviation trend for 1965-2023; thick, intermittent purple line—the mean deviation for all weather stations in different periods (1965-1987, 1988-2004, and 2005-2023).
Figure 11.
Fluctuations in deviations of the mean annual air temperature according to 5-year moving averages across various areas in the Subarctic zone of Yakutia. Thin blue line—Kolyma–Indigirka region; thin brown line—Lena–Olenek region; thin green line—Yana region; thick red line—the general average deviation for the sparse forest zone in Yakutia.
Figure 12.
A generalized model changes in deviations of the thawing index in the Subarctic zone of Yakutia. Thin blue line—the mean deviation for all weather stations; thick brown line—the 5-year moving average deviation for all weather stations; thick red line—the trend of the mean deviation for 1965-2023; thick, intermittent purple line—the mean deviation for all weather stations in different periods (1965-1987, 1988-2004, and 2005-2023).
Figure 13.
Fluctuations in the deviations of the thaw index according to 5-year moving averages across various areas in the Subarctic zone of Yakutia. Thin blue line—Kolyma–Indigirka region; thin brown line—Lena–Olenek region; thin green line—Yana region; thick red line—the general average deviation for the Subarctic zone in Yakutia.
Figure 14.
A generalized model of change in freezing index deviation in the Arctic zone of Yakutia. Thin blue line—the mean deviation for all weather stations; thick brown line—the 5-year moving mean deviation for all weather stations; thick red line—the mean deviation trend for 1965-2023; thick, intermittent purple line—the mean deviation for all weather stations in different periods (1965-1987, 1988-2004, and 2005-2023).
Figure 15.
Fluctuations in freezing index deviations across various regions in the Subarctic zone of Yakutia according to a 5-year moving average. Thin blue line—Kolyma–Indigirka region; thin brown line—Lena–Olenek region; thin green line—Yana region; thick red line—the general average deviation for the northern sparse forest zone in Yakutia.
Figure 16.
The annual temperature of the permafrost fluctuates at depths of 3 m (a), 10 m (b), and 30 m (c) near Tiksi town.
Figure 16.
The annual temperature of the permafrost fluctuates at depths of 3 m (a), 10 m (b), and 30 m (c) near Tiksi town.
Figure 17.
Change in the mean annual temperature at a depth of 1.6 m at the Olenek weather station.
Figure 17.
Change in the mean annual temperature at a depth of 1.6 m at the Olenek weather station.
Figure 18.
The mean annual temperature changes at a depth of 1.6 m at the Verkhoyansk weather station.
Figure 18.
The mean annual temperature changes at a depth of 1.6 m at the Verkhoyansk weather station.
Figure 19.
The mean annual temperature changes at a depth of 1.6 m at the Ust–Moma weather station.
Figure 19.
The mean annual temperature changes at a depth of 1.6 m at the Ust–Moma weather station.
Figure 20.
The mean annual temperature changes at a depth of 1.6 m at the Delyankir weather station.
Figure 20.
The mean annual temperature changes at a depth of 1.6 m at the Delyankir weather station.
Figure 21.
Interannual variability of active layer thickness deviations in the Arctic zone of Yakutia in 1996-2023 (CALM data).
Figure 21.
Interannual variability of active layer thickness deviations in the Arctic zone of Yakutia in 1996-2023 (CALM data).
Figure 22.
Thawing lakes on the Yedoma on the island of Hardang–Sise in the Lena River delta (Google Earth Data).
Figure 22.
Thawing lakes on the Yedoma on the island of Hardang–Sise in the Lena River delta (Google Earth Data).
Figure 23.
Thermokarst forms as ice wedges melt with high-centered polygons in Kazachye village near the Yana River (Google Earth Data).
Figure 23.
Thermokarst forms as ice wedges melt with high-centered polygons in Kazachye village near the Yana River (Google Earth Data).
Figure 24.
High-centered polygons on Kotelny Island as a result of ice wedge thawing (Google Earth Data).
Figure 24.
High-centered polygons on Kotelny Island as a result of ice wedge thawing (Google Earth Data).
Figure 25.
A map of susceptibility to geocryological hazards in Arctic and Subarctic Yakutia. 1—Least susceptible, 2—Moderately susceptible, 3—Highly susceptible, 4—Most susceptible.
Figure 25.
A map of susceptibility to geocryological hazards in Arctic and Subarctic Yakutia. 1—Least susceptible, 2—Moderately susceptible, 3—Highly susceptible, 4—Most susceptible.
Table 1.
The mean annual air temperatures at weather stations in the tundra zone of Yakutia.
Table 1.
The mean annual air temperatures at weather stations in the tundra zone of Yakutia.
| Region |
Weather station |
Mean for
1965-2023 |
Mean for
1965-1987 |
Mean for
1988-2004 |
Mean for
2005-2023 |
| New Siberian |
Kotelny Island |
–14,0±1,6 |
–15,1±0,9 |
–14,6±1,1 |
–12,1±0,9 |
| Islands |
Sannikov Strait |
–14,4±1,5 |
–15,6±0,9 |
–14,8±1,1 |
–12,7±0,8 |
| |
Kigilyakh |
–13,8±1,4 |
–14,9±0,9 |
–14,0±1,0 |
–12,2±0,7 |
| Lena–Anabar |
Saskylakh |
–13,8±1,7 |
–14,8±1,4 |
–14,3±1,0 |
–12,1±1,2 |
| |
Ust–Olenek |
–13,5±1,6 |
–14,6±1,1 |
–14,0±1,3 |
–11,8±1,1 |
| |
Tiksi |
–12,5±1,7 |
–13,5±1,3 |
–12,8±1,3 |
–11,1±1,0 |
| Yana–Kolyma |
Yubileinaya |
–13,1±1,4 |
–14,0±1,2 |
–13,1±1,4 |
–11,9±0,9 |
| |
Chokurdakh |
–13,3±1,3 |
–14,3±0,8 |
–13,5±1,0 |
–11,8±0,8 |
| |
Ambarchik |
–11,8±1,5 |
–12,9±0,8 |
–12,4±1,2 |
–10,3±1,1 |
Table 2.
The thawing index at weather stations in the Arctic zone of Yakutia, oС days.
Table 2.
The thawing index at weather stations in the Arctic zone of Yakutia, oС days.
| Region |
Weather station |
Mean for
1965-2023 |
Mean for
1965-1987 |
Mean for
1988-2004 |
Mean for
2005-2023 |
| New Siberian Islands* |
Kotelny Island |
198±119 |
145±181 |
161±106 |
294±117 |
| Kigilyakh |
256±124 |
80±91 |
106±116 |
239±102 |
| Lena–Anabar |
Saskylakh |
858±165 |
784±109 |
809±161 |
990±153 |
| Ust–Olenek |
597±196 |
550±112 |
465±187 |
772±169 |
| Tiksi |
656±162 |
566±144 |
623±139 |
793±114 |
| Yana–Kolyma |
Yubileinaya |
929±167 |
838±146 |
913±160 |
1050±127 |
| Chokurdakh |
795±156 |
718±148 |
775±143 |
907±117 |
| Ambarchik |
600±171 |
519±154 |
581±147 |
716±157 |
Table 3.
The thawing index at weather stations in the Arctic zone of Yakutia, oС days.
Table 3.
The thawing index at weather stations in the Arctic zone of Yakutia, oС days.
| Region |
Weather station |
Mean for
1965-2023 |
Mean for
1965-1987 |
Mean for
1988-2004 |
Mean for
2005-2023 |
| New Siberian Islands |
Kotelny Island |
–5345±491 |
–5692±289 |
–5526±269 |
–4763±286 |
| Sannikov Strait |
–5497±481 |
–5870±271 |
–5616±311 |
–4940±253 |
| Kigilyakh |
–5394±451 |
–5736±286 |
–5522±234 |
–4864±240 |
| Lena–Anabar |
Saskylakh |
–5935±496 |
–6211±461 |
–6075±346 |
–5476±320 |
| Ust–Olenek |
–5569±455 |
–5896±340 |
–5626±358 |
–5122±270 |
| Tiksi |
–5272±459 |
–5535±408 |
–5346±396 |
–4887±312 |
| Yana–Kolyma |
Yubileinaya |
–5742±418 |
–5966±350 |
–5785±421 |
–5440±323 |
| Chokurdakh |
–5672±391 |
–5946±243 |
–5750±320 |
–5270±255 |
| Ambarchik |
–4936±458 |
–5237±260 |
–5000±389 |
–4515±404 |
Table 4.
The annual precipitation in Yakutia's Arctic weather stations.
Table 4.
The annual precipitation in Yakutia's Arctic weather stations.
| Region |
Weather station |
Mean for
1965-2023 |
Mean for
1965-1987 |
Mean for
1988-2004 |
Mean for
2005-2023 |
| New Siberian Island |
Kotelny Island |
162,4±33,4 |
169,0±36,8 |
158,4±30,2 |
158,4±32,1 |
| Lena–Anabar |
Saskylakh |
197,7±60,5 |
214,9±55,7 |
168,4±41,3 |
200,7±70,6 |
| Yana–Kolyma |
Yubileinaya |
214,7±65,4 |
237,2±54,4 |
229,7±35,0 |
185,2±76,5 |
| Chokurdakh |
208,7±63,7 |
224,8±65,6 |
219,7±44,8 |
184,0±67,9 |
| Ambarchik |
150,1±57,3 |
169,5±51,0 |
138,7±66,7 |
137,7±54,3 |
Table 5.
The mean annual air temperatures at weather stations in the Subarctic zone of Yakutia.
Table 5.
The mean annual air temperatures at weather stations in the Subarctic zone of Yakutia.
| Region |
Weather station |
Mean for
1965-2023 |
Mean for
1965-1987 |
Mean for
1988-2004 |
Mean for
2005-2023 |
| Lena–Olenek |
Dzhalinda |
–13,0±1,7 |
–14,1±1,4 |
–13,3±0,9 |
–11,3±1,1 |
| Olenyok |
–11,4±1,6 |
–12,3±1,6 |
–11,7±0,9 |
–9,9±1,0 |
| Kyusyur |
–13,0±1,4 |
–13,9±1,2 |
–13,3±1,0 |
–11,6±0,8 |
| Sukhana |
–12,9±1,6 |
–14,0±1,5 |
–13,2±0,9 |
–11,4±1,1 |
| Shelagontsy |
–12,3±1,6 |
–13,3±1,4 |
–12,7±0,8 |
–10,8±1,1 |
| Eyik |
–10,9±1,5 |
–11,9±1,4 |
–11,1±0,8 |
–9,5±0,9 |
| Dzhardzhan |
–11,8±1,3 |
–12,6±1,3 |
–11,9±0,9 |
–10,6±1,0 |
| Zhigansk |
–11,0±1,3 |
–11,8±1,2 |
–11,1±0,8 |
–10,0±1,1 |
| Yana |
Verkhoyansk |
–14,4±1,3 |
–15,4±1,1 |
–14,3±1,1 |
–13,2±0,7 |
| Ekyuchyu |
–14,2±1,3 |
–15,1±1,3 |
–14,3±0,9 |
–13,0±0,7 |
| Ust–Charky |
–13,1±1,1 |
–13,7±1,1 |
–13,1±1,0 |
–12,3±0,6 |
| Iema |
–15,3±1,2 |
–16,1±1,1 |
–15,2±0,8 |
–14,3±0,6 |
| Kolyma–Indigirka |
Srednekolymsk |
–11,3±1,4 |
–12,5±0,8 |
–11,5±1,1 |
–9,8±0,8 |
| Zyryanka |
–10,5±1,1 |
–11,3±0,7 |
–10,7±1,0 |
–9,4±0,7 |
| Kolymskaya |
–12,4±1,6 |
–13,6±0,8 |
–12,7±1,3 |
–10,8±1,0 |
Table 6.
The thawing index at weather stations in the Subarctic zone of Yakutia.
Table 6.
The thawing index at weather stations in the Subarctic zone of Yakutia.
| Region |
Weather station |
Mean for
1965-2023 |
Mean for
1965-1987 |
Mean for
1988-2004 |
Mean for
2005-2023 |
| Lena–Olenek |
Dzhalinda |
1108±172 |
1018±113 |
1057±164 |
1261±132 |
| Olenyok |
1237±184 |
1161±138 |
1164±173 |
1395±141 |
| Kyusyur |
1043±178 |
963±139 |
977±157 |
1198±137 |
| Sukhana |
1276±166 |
1194±119 |
1229±152 |
1416±138 |
| Shelagontsy |
1290±161 |
1204±122 |
1233±130 |
1445±113 |
| Eyik |
1341±170 |
1249±136 |
1289±129 |
1500±125 |
| Dzhardzhan |
1291±168 |
1223±138 |
1239±146 |
1421±150 |
| Zhigansk |
1462±169 |
1384±134 |
1412±129 |
1602±148 |
| Yana |
Verkhoyansk |
1472±163 |
1366±143 |
1481±154 |
1591±100 |
| Ekyuchyu |
1397±157 |
1310±143 |
1387±131 |
1524±125 |
| Ust–Charky |
1387±138 |
1339±143 |
1347±125 |
1481±91 |
| Iema |
1172±148 |
1071±119 |
1149±115 |
1314±84 |
| Kolyma–Indigirka |
Srednekolymsk |
1300±172 |
1200±137 |
1285±163 |
1434±130 |
| Zyryanka |
1530±153 |
1448±151 |
1519±122 |
1640±114 |
| Kolymskaya |
940±153 |
859±141 |
932±145 |
1044±114 |
Table 7.
The freezing index at weather stations in the Subarctic zone of Yakutia.
Table 7.
The freezing index at weather stations in the Subarctic zone of Yakutia.
| Region |
Weather station |
Mean for
1965-2023 |
Mean for
1965-1987 |
Mean for
1988-2004 |
Mean for
2005-2023 |
| Lena–Olenek |
Dzhalinda |
-5878±488 |
-6181±454 |
-5969±322 |
-5430±314 |
| Olenyok |
-5429±481 |
-5695±508 |
-5483±362 |
-5058±296 |
| Kyusyur |
-5824±384 |
-6049±380 |
-5879±283 |
-5501±241 |
| Sukhana |
-6037±460 |
-6315±438 |
-6101±321 |
-5645±323 |
| Shelagontsy |
-5831±479 |
-6101±456 |
-5910±358 |
-5432±340 |
| Eyik |
-5347±419 |
-5598±406 |
-5376±337 |
-5017±276 |
| Dzhardzhan |
-5613±395 |
-5834±379 |
-5611±343 |
-5348±309 |
| Zhigansk |
-5516±377 |
-5716±340 |
-5510±306 |
-5280±363 |
| Yana |
Verkhoyansk |
-6768±380 |
-7016±315 |
-6753±371 |
-6482±257 |
| Ekyuchyu |
-6621±383 |
-6830±365 |
-6660±313 |
-6310±275 |
| Ust–Charky |
-6186±336 |
-6348±316 |
-6169±340 |
-6015±285 |
| Iema |
-6786±320 |
-6988±326 |
-6738±262 |
-6596±233 |
| Kolyma–Indigirka |
Srednekolymsk |
-5470±391 |
-5768±240 |
-5526±280 |
-5058±257 |
| Zyryanka |
-5393±321 |
-5593±256 |
-5444±252 |
-5105±244 |
| Kolymskaya |
-5519±467 |
-5835±242 |
-5611±373 |
-5054±396 |
Table 8.
Annual precipitation at weather stations in the Subarctic zone of Yakutia.
Table 8.
Annual precipitation at weather stations in the Subarctic zone of Yakutia.
| Region |
Weather station |
Mean for
1965-2023 |
Mean for
1965-1987 |
Mean for
1988-2004 |
Mean for
2005-2023 |
| Lena–Olenyok |
Dzhalinda |
262,7±52,7 |
262,2±52,5 |
266,0±59,6 |
260,3±49,0 |
| Olenyok |
300,9±58,2 |
293,3±60,9 |
312,6±56,7 |
299,2±57,9 |
| Sukhana |
261,8±47,6 |
240,6±44,5 |
268,2±37,1 |
280,6±51,6 |
| Dzhardzhan |
315,4±72,9 |
284,8±64,4 |
331,4±59,3 |
336,4±83,6 |
| Zhigansk |
328,5±70,8 |
278,3±57,7 |
335,4±60,3 |
380,6±53,6 |
| Yana |
Verkhoyansk |
193,5±43,2 |
174,4±44,9 |
178,5±35,9 |
192,2±47,2 |
| Ust–Charky |
226,1± 44,6 |
217,8±51,4 |
225,5±40,6 |
236,4±39,4 |
| Kolyma–Indigirka |
Srednekolymsk |
249,2±63,8 |
227,0±54,0 |
244,3±65,6 |
279,3±63,9 |
| Zyryanka |
289,8±71,9 |
258,5±59,6 |
281,5±58,8 |
333,5±76,7 |
Table 9.
Observation of permafrost temperature trends within a rock ridge at different depths over time.
Table 9.
Observation of permafrost temperature trends within a rock ridge at different depths over time.
| Years |
Trends in mean annual permafrost temperature (°С/10 years) |
| 3 м |
10 м |
30 м |
| 1993-2023 |
1,0 |
0,8 |
0,4 |
| 1993-2002 |
-0,6 |
-0,4 |
0,1 |
| 2003-2012 |
1,0 |
1,2 |
0,5 |
| 2013-2023 |
1,3 |
1,3 |
0,6 |
