
Submitted:
03 November 2024
Posted:
05 November 2024
You are already at the latest version
Abstract
Old growth forests are increasingly rare but important carbon sinks which harbour rich biodiversity. Chronic browsing by the white-tailed deer (Odocoileus virginianus) is a major problem in northern temperate forests where deer numbers have increased in recent decades driven by stricter hunting rules and reduced predation necessitating local monitoring of vegetation responses. The objective of this study was to determine the effects of deer exclusion on tree regeneration dynamics and soil nutrient cycling in an old growth Carolinian forest. This was done using exclusion fencing and tip-up mounds at McMaster Forest Nature Preserve and the Sheelah Dunn Dooley Nature Sanctuary in Hamilton Ontario. Tree regeneration was surveyed from thirty 1m x 1m quadrats within exclusion plots and another thirty quadrats from deer browsed areas adjacent to the exclusion plots. Soil samples were taken from each quadrat to analyze browsing impacts on nitrate, phosphate and soil organic matter. Red oak (Quercus rubra) was planted at the top and base of tip-up mounds of varying heights and widths and monitored for deer access and browsing activity. Results show a significantly higher density of woody plants within exclosures compared to non-exclosures (p=0.0089) and twice more abundance of highly palatable species within the exclosures. However, species richness (p > 0.05) and diversity (p > 0.05) were minimally impacted by deer browsing showing a resilient old growth forest. Soil nitrate was consistently higher in the non-exclosures while phosphate was consistently higher within deer exclosures. Finally, more seedlings survived at the top of mounds than the bases showing the potential of tip-up mounds to be a natural method of deer exclusion and a critical avenue for restoring over-browsed forests.
Keywords:
Carolinian forests
; tip-up mounds
; regeneration dynamics
; soil nutrients
; tree seedlings
; Forest conservation
; Plant biodiversity
; Herbivory
; Deer browsing
1. Introduction
The forest is an incredibly complex, interconnected ecosystem of plants, animals, fungi, bacteria and other biotic and abiotic factors. The proper balance of life in a forest allows the ecosystem to function properly as each form of life fulfills a different role [1]. A major factor in the health of a forest is the richness and diversity of the canopy as trees provide diverse habitats, cycle nutrients, sequester carbon from the atmosphere, and perform many other important roles [2,3]. A diverse canopy leads to greater biodiversity and increases a forest’s persistence against disturbances [4,5]. That diversity depends on the regeneration phase. Forest regeneration refers to seedlings establishing under the mature canopy [6,7]. Successful regeneration is critical for the formation of future canopy layers [8]. Many factors can imbalance this regenerative process, often through disturbances (e.g., fire, insect outbreak, herbivory), limited resources (e.g., soil nutrients, moisture) around seedlings impacting their ability to grow and replace dying trees [9].
Deer browsing strongly impacts forest canopy regeneration, primarily in areas where deer populations exceed the carrying capacity of the ecosystem. One impact of deer browsing is the loss of deer-preferred tree seedlings [7] including northern red oak (Q. rubra), black cherry (Prunus serotina), eastern hemlock (Tsuga canadensis), northern white cedar (Thuja occidentalis), eastern white pine (Pinus strobus), etc. [10]. When over-browsing occurs, browse-tolerant plant species such as ferns, American beech (Fagus grandifolia), and invasive species such as garlic mustard (Alliaria petiolata) and buckthorn (Rhamnus cathartica) [11,12,13,14] come to dominate the understory leading to a decrease in species richness and diversity. Over a long period of time, over browsing can change the canopy of a forest as it becomes dominated by browse-tolerant tree species such as the American beech tree (F. grandifolia) [7].
Over browsing can also have significant impacts on soil chemical elements. Herbivory in general may either increase or decrease the nutrient cycling in an area depending on several factors. Nutrient cycling increases when herbivores leave excrement [15]. Deer fecal pellets release bioavailable nitrogen into the soil which can lead to increased nutrient cycling [16]. However, while deer leave fecal pellets, they also compact soil while they walk and selectively browse living palatable tree species. Soil compaction can lower the activity of enzymes in the soil and decrease nutrient cycling [16]. Furthermore, the species they browse are generally high in nutrients, and their loss decreases the nutrient cycling due to the slow decomposition rates of the remaining vegetation [17]. For this reason, high browsing in an area may often deplete the soil nutrient levels and further decrease plant abundance.
Because of limiting resources such as light and nutrients available on the forest floor, competition does impact forest floor plant species composition which can impact native seedling establishment, growth, and survival [8]. Invasive species in the understory tend to outcompete native plants and use up available soil nutrients and light. For instance, garlic mustard (A. petiolata) is an invasive plant species that has become dominant in the understory of many forests in North America [18]. One major factor contributing to the success of this plant over others in the understory is its impact on ectomycorrhizal (EM) fungi which is important for the growth of many tree seedlings [18,19]. Garlic mustard (A. petiolata) degrades EM fungi in the soil around it, so tree seedlings growing in that soil are less likely to survive and grow effectively [18]. Another common invasive species is buckthorn (R. cathartica), a shade-tolerant shrub that decreases regeneration by outcompeting native tree seedlings [20]. Over the long term and with repeated over browsing, the abundance and richness of invasive species could lead to a decreased abundance and diversity of native tree species.
Within temperate forests where white-tailed deer (Odocoileus virginianus) densities have increased dramatically in the last decades owing to stricter hunting rules and reduced predation [21,22], species regeneration on tip-up mounds has been of significant interest [e.g., 23]. A tip-up mound is the mound formed at the base of trees after a windstorm event pulling up roots and dirt from the ground [23]. While tip-up mounds often experience higher erosion and quicker freezing and thawing rates which can be harmful to seedlings [23], they also provide more light and differing soil conditions which may improve growth [24]. Overall, they create a unique microhabitat which may favor the growth of certain seedlings, decreasing competition against dominant species such as maples (Acer) which do not grow well on tip-up mounds [25]. Furthermore, tip-up mounds provide refuge for plants from deer browsing as deer often cannot access the plants growing on top of the mounds [23].
Carolinian old-growth forests, located only in southwestern Ontario, are incredibly rare, biodiverse ecosystems supporting over 25% of Canada’s native tree species [26]. Many of the native trees are endangered or unique to the Carolinian forests making conservation efforts very important [26]. Some of these species include the Eastern flowering dogwood (Cornus florida), American sycamore (Platanus occidentalis), American chestnut (Castanea dentata), sassafras (Sassafras albidum), etc. [27]. The deer population in this region (~30 deer/km2) is three times the carrying capacity which may impact the long-term compositional dynamics of this forest. Also, Ontario sees catastrophic wind events, the most tornado events of any province in Canada which includes the Carolinian forest region [28] and thus tip-up mounds are common. It is, however, unclear the extent to which tip-up mounds are mediating the impacts of deer browsing on regeneration. Given how rare and biodiverse this forest type is, this study is critical in determining the contributions of deer browsing, invasive plant abundance, and tip-up mounds to native tree regeneration and diversity in the Carolinian old-growth forests. Such insights are critical for more effective conservation efforts.
This study therefore seeks to understand the impacts of deer browsing on native tree species richness and diversity and to clarify the role of tip-up mounds in disrupting deer browsing access. It is hypothesized that deer exclusion plots will have higher native tree regeneration density and species richness than deer-browsed sites. Because the deer-browsed sites are disturbed sites, and invasive species tend to prefer disturbed sites, it is hypothesized that deer-browsed sites will have higher density and richness of invasive species compared to deer exclosures. Given the high density of deer in the Carolinian old-growth forest, it is hypothesized that deer over browsing will lead to higher nutrient cycling outside rather than inside deer exclosures. Due to potential challenges with accessing plants on tip-up mounds by browsers, it is hypothesized that tip-up mounds will offer an escape from deer browsing.
2. Materials and Methods
2.1. Project Site Description
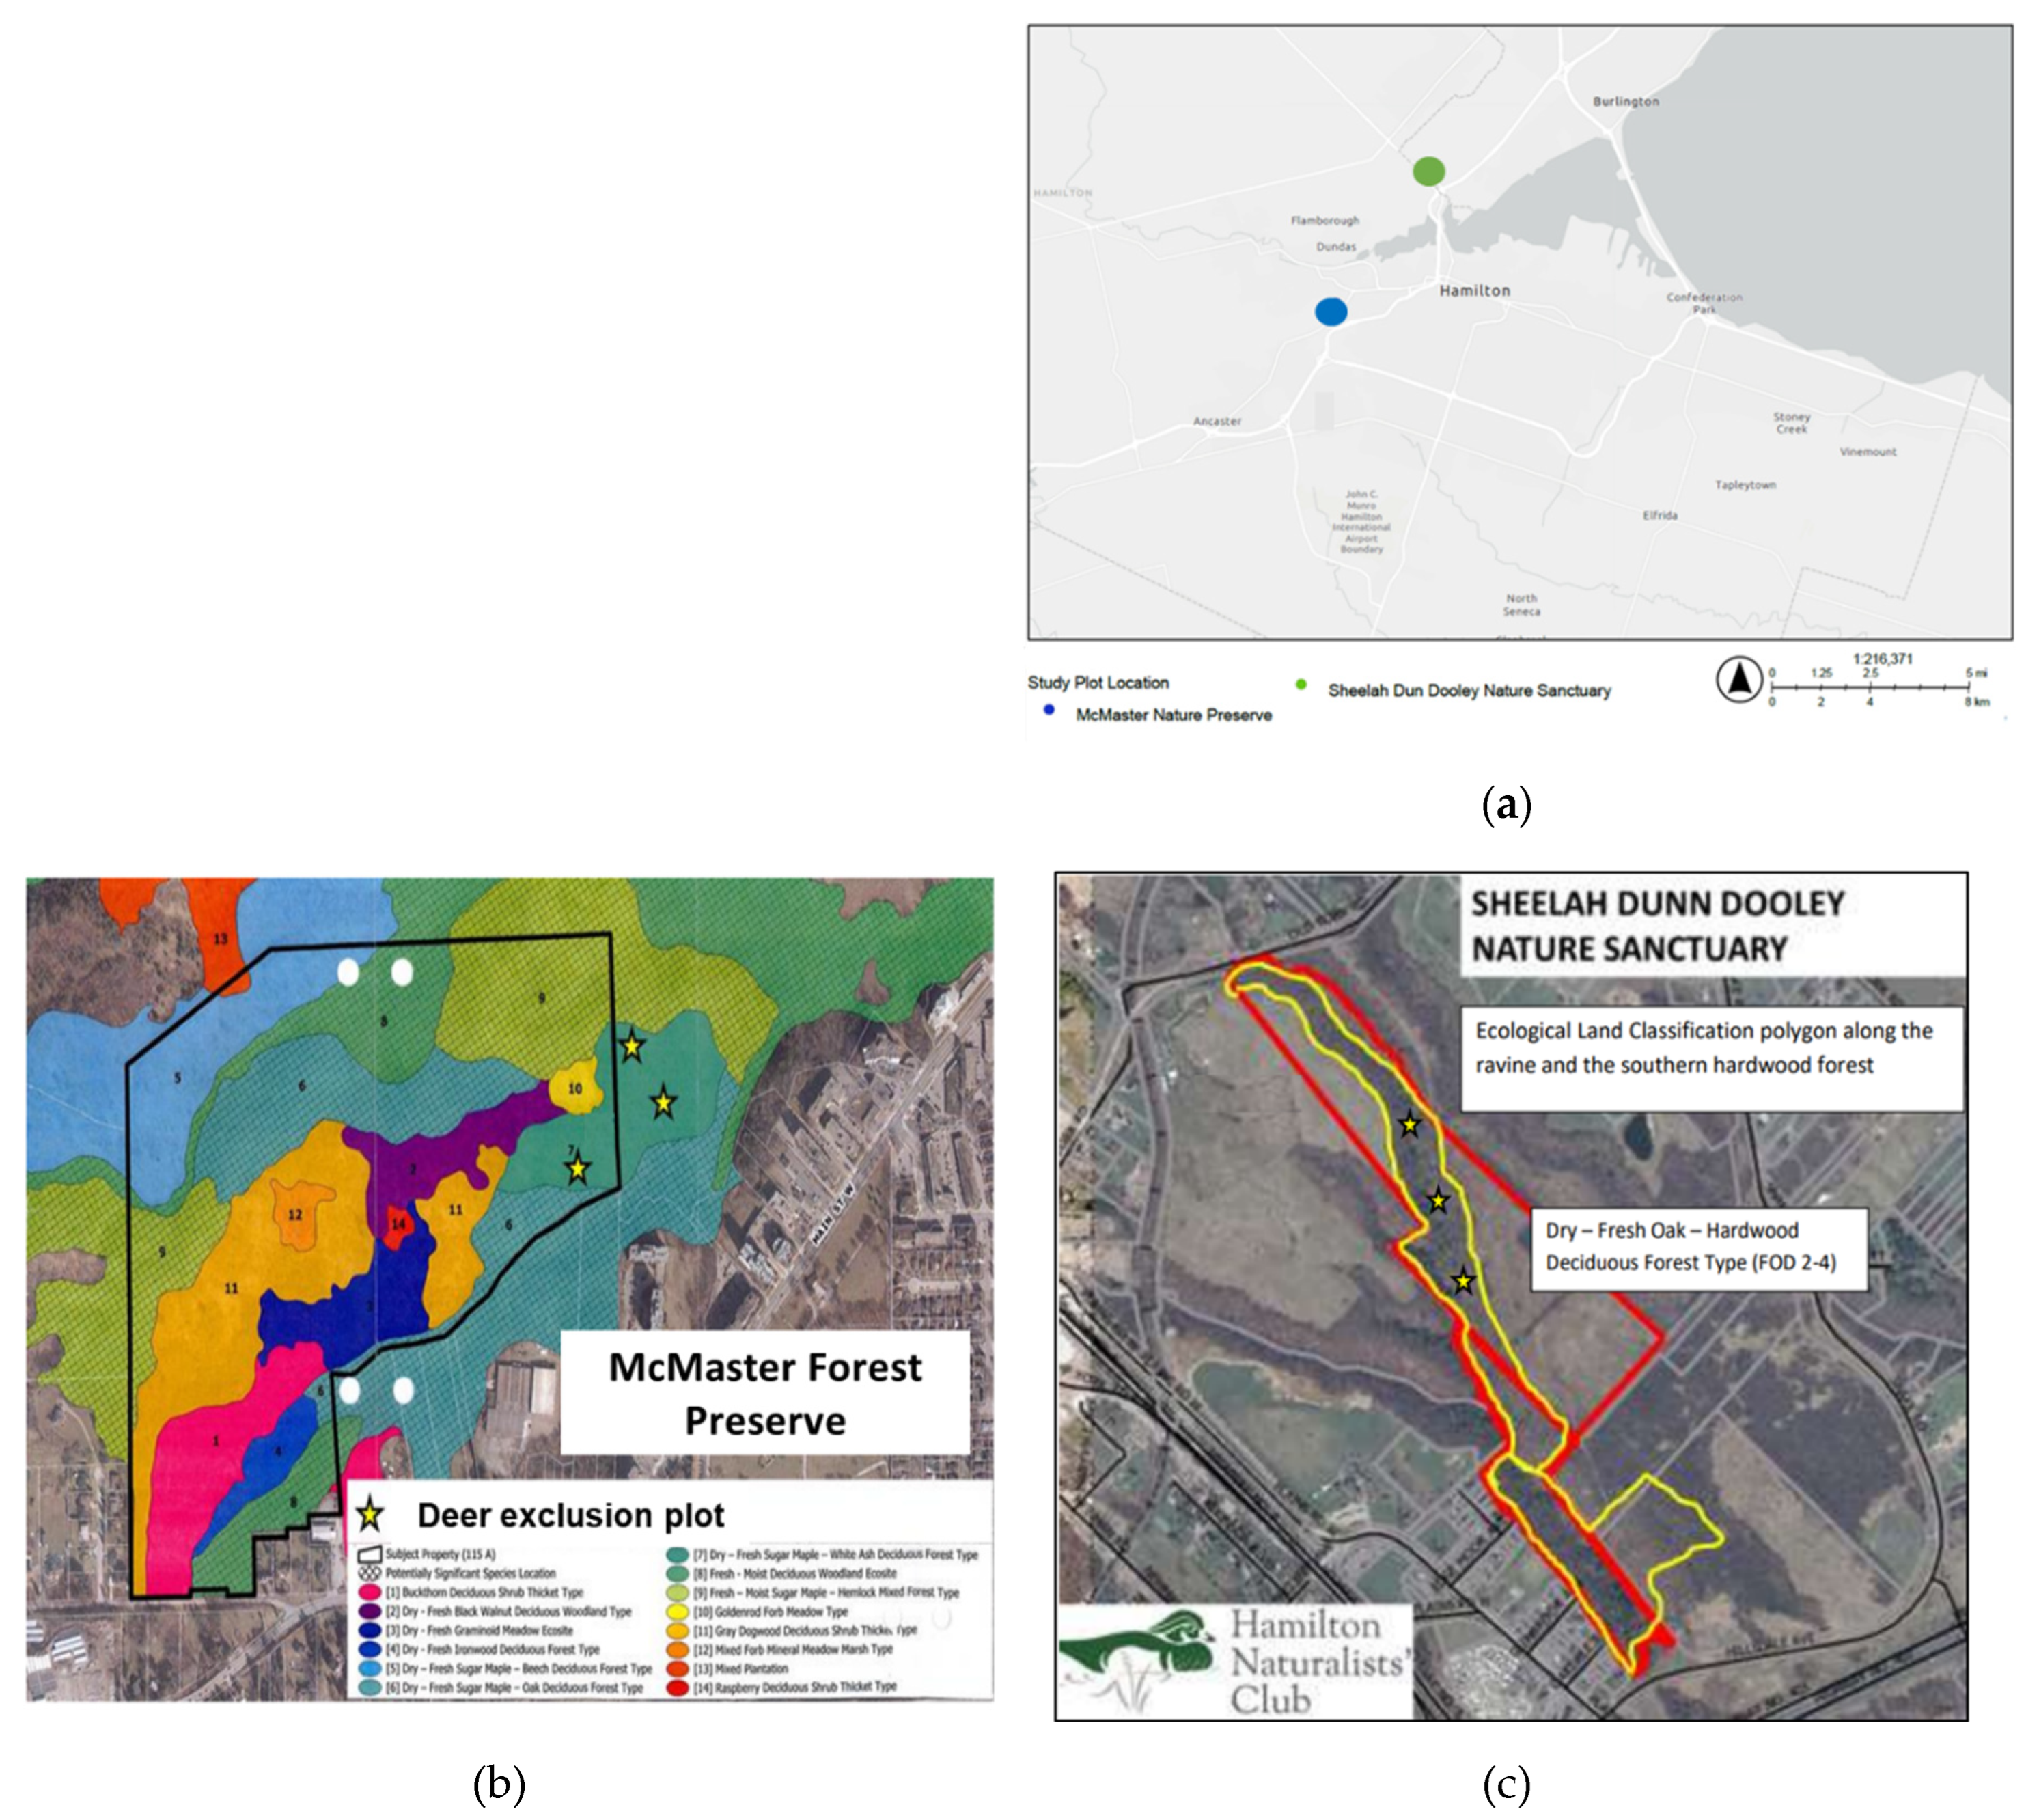
This research was conducted at two sites about 10 km apart; the Sheelah Dunn Dooley Nature Sanctuary (SDD), located in Aldershot, Burlington and owned and managed by the Hamilton Naturalists Club and the McMaster Forest Nature Preserve (MFNP), located in Ancaster and owned and managed by McMaster University (Figure 1).
The SDD is a 32-hectare property that contains a section of Grindstone Creek with an associated steep-sided (slope = - 19.5 o) ravine with a Dry-Fresh Oak Hardwood Deciduous Forest Type (FOD2-4) that extends from the creek to the upper ravine slope. Beyond the ravine, is a relatively flat area with a mix of Fresh-Moist Green Ash Lowland Deciduous Forest (FOD7-2), Gray Dogwood Deciduous Thicket Type (THDM5-1), Reed-Canary grass graminoid mineral meadow marsh type (MAMM1-3) and Naturalized deciduous plantation ecosites (FODM12). The land outside of the ravine was predominantly an agricultural cropland until 2005, while the Dry-Fresh Oak Hardwood Deciduous Forest Type (FOD2-4) on the ravine is part of an environmentally sensitive area that has escaped prior agricultural use because of the acute slope. The sanctuary provides important habitats for many unique and endangered species such as the eastern flowering dogwood (Cornus florida) and American columbo (Frasera caroliniensis). The main trees include white oak (Quercus alba), sugar maple (Acer saccharum), shagbark hickory (Carya ovata), and some red maple (Acer rubrum). The understory mainly consists of white ash (Fraxinus Americana), black cherry (Prunus serotina), and invasive buckthorn (Rhamnus cathartica). The soil is mainly Oneida loam, which is well drained with a smooth topography, along with high levels of clay surface soils with low infiltration rates [29]. This area has approximately 45 deer/km2, which is above the 10 deer/km2 carrying capacity of the region [30]. Deer exclusion plots of size 20 m x 20 m were built along the upper ravine slope in spring 2023 to monitor the effects of deer browsing. The main invasive species is buckthorn (Rhamnus cathartica), which also poses a high threat to biodiversity [29].
The McMaster Forest Nature Preserve is a 48-hectare natural area with relatively flat topography located within the Niagara Escarpment Protection Area. Much of the area was agricultural crop land until 1964 when McMaster University purchased the property and allowed natural regeneration to take place [31]. However, historical aerial photographs indicate areas of forest that are over 90 years old. The deer population density in forests surrounding the McMaster Forest Nature Preserve was estimated as ~30 deer/km2 for Dundas Valley Conservation Area and ~36 deer/km2 for the Tiffany Falls Conservation Area, well above the 10 deer/km2 carrying capacity for the region. In 2017, three deer exclusion plots of size 14 m x 14 m were established in the Dry-Fresh Sugar Maple - White Ash Deciduous Forest type [31]. Figure 1 shows all the ecological land classification types of this forest preserve. The main tree species include sugar maple (Acer saccharum), American beech (Fagus grandifolia), white ash (Fraxinus americana), and eastern hemlock (Tsuga canadensis). Garlic mustard (A. petiolata) is the main invasive species of concern in this forest preserve. Barker [31] monitored, deer browsing activity following the planting of 93-eastern hemlock (Tsuga canadensis), 96-Black cherry (Prunus serotina) and 96-Red oak (Quercus rubrum) seedlings within and outside of the exclosures. Results 1-year after planting shows that all the black cherry and red oak outside of the exclosures were browsed and 98% of hemlock seedlings were also browsed while none of the planted seedlings were browsed within exclosures. Barker [31] also removed garlic mustard from half of the plot, leaving garlic mustard in the other half of the plot in order to measure the impact of garlic mustard on the planted seedlings. Barker [31] reported that mustard removal did not impact the planted seedlings. Because the garlic removal treatment was applied to all of the McMaster Forest Nature Preserve study plots, we do not expect it to introduce bias into our observations. Also given that garlic mustard has the potential to spread aggressively, we believe that in the 7-years following its removal, the species has re-colonized the studied plots.
2.2. Experimental Design & Data Collection
The experiment involved two elements including a) deer exclosures and outside of the exclosures, and b) tip-up mounds.
2.2.1. Deer Exclusion Study
The McMaster Forest Nature Preserve contains 3 exclosure plots and 3 exclosure-adjacent plots with 14 m x 14 m dimensions. The Sheelah Dunn Dooley Nature Sanctuary contains 3 exclosures (established in 2023, with no manipulation done subsequently) and 3 adjacent plots with 20 m x 20 m dimensions. The adjacent deer browsed plots were compared to deer exclosures to determine the impact of exclosures on soil nutrient cycling, seedling density and diversity. Data was collected from five 1 m x 1m quadrats placed at the corners and the centre of the main plots with a total of 60 quadrats, similar to earlier work done by Stephan et al. [32]. The exact coordinates of each study plot were determined using a GPS taken from the centre quadrat within each plot (Cross-checked with co-ordinates generated by apple iPhone 14 device). We also measured the elevation and slope from the centre quadrat of each plot. All seedlings (woody plants < 2.5 cm) and saplings (woody plants 1 to 2 m tall) within quadrats were identified and counted in June 2024 using tree identification guides [33] in conjunction with phone apps [34]. Soil samples were collected in ziplock bags from each quadrat for soil organic matter and nutrient analysis.
2.2.2. Tip-up Mound Study
Both study sites were surveyed for suitable tip-up mounds for this study. For a tip-up mound to be suitable, a) it must not be an inclined mound with the possibility of tipping back up i.e., there was clear separation between the root plate at the base of the tip-up mound and the pit, b) the tip-up mound is reasonably tall (≥ 1m from the pit) for the potential to limit deer access, c) there is sufficient mound at the base of the uprooted tree to support seedling growth. We identified 10 tip-up mounds in the McMaster Forest Nature Preserve and marked their location (latitude, longitude co-ordinates). The tip-up mounds provide the opportunity to verify if mounds provide browse-free zones that would promote seedling growth. No suitable tip-up mound was observed at the SDD site. The height and width of each tip-up mound were measured. Soil samples were also collected from each mound for soil organic matter and nutrient analysis. For each of the tip-up mounds, 1-month old red oak (Quercus rubra) seedlings, a deer-preferred species [31] was planted, one at the top of the mound and another, at the base of the uprooted tree. We teamed up with a local high school who had embarked on a project to nurse oak seedlings as a way of stimulating interest in tree planting among the youth to obtain the seedlings. Planting took place in May 2024. At the time of planting, seedlings were on average 10 – 15 cm tall. Every week following the planting, we counted the total number of leaves on each seedling and measured the length of the longest leaf on each seedling.
2.3. Determination of Soil Organic Matter
About 15-30 g of soil samples were oven-dried at 105 o C for 24 hours and weighed upon cooling giving the dried mass. Samples were then placed in ceramic crucibles and then heated at 500 o C in a muffle furnace for approximately 24 hours [35]. Their placement in the furnace was labelled on paper to keep track of them. Once finished heating, they were cooled for 1-2 hours and weighed again. The percentage of organic matter (SOM) in each sample is estimated using Equation (1) below:
2.4. Soil Nitrate and Phosphate Determination
Soil sample from each quadrat was placed into a labelled aluminum foil cup and dried in the oven at 50 o C for 24 hours [36]. The soil from each cup was crushed in a mortar and pestle and sifted through a soil sieve. For nitrate analysis, 1 g of each soil sample was placed in labelled 25 mL Erlenmeyer flasks and 10 mL of KCl was added. A blank with no soil was also made. The solution was placed on a shaker at 160 strokers per minute for 30 minutes. They were then filtered through Fisherbrand P-5 filter paper into labelled test tubes. A series of NO3—N standards were then made (1.00-8.00 ppm). Using a 100-µL pipette, 20 µL of each sample, standard, and blank were added to wells in a 96-well microplate with their exact placement labelled on paper. A 180 µL of nitrate reduction solution was added to each well using a 1000-µL pipette and the plate was gently shaken. The plate was incubated at 30 °C for 30 minutes. A colour solution was then made and 20 µL was added to each well. The microplate was left for 10 minutes for the colour to develop then inserted into the BioTek HT Synergy Microplate Reader for absorbance readings at 543 nm. Using the absorbance values, the nitrate levels of each solution were determined using a standard curve.
Vegetation contributes significantly to soil nutrient quality through e.g., litter droppings. To verify if the soil nitrate content is significantly correlated with the vegetation nitrate content, we estimated the plot-level vegetation nitrate index which is an index of the nitrate richness of seedlings within a plot using Equation (2). We first reviewed 25-papers (Table S1) that report the nitrate content of our observed plant species and based on this assigned nitrate scores to each plant species including 1 (low nitrate content), 2 (medium nitrate) and, 3 (high nitrate content). We then computed vegetation nitrogen index using the Equation (2) below.
Where Vns is the vegetation nitrate score i.e., 1 is low, 2 is medium and, 3 is high, nik is the count of species i in plot k. Nk is the total seedling count in plot k. Plots with a high abundance of nitrate rich seedlings will have high vegetation nitrate index.
For phosphate analysis, 2 g of each soil sample was added to labelled 50 mL Erlenmeyer flasks. A 20 mL of Mehlich 3 extracting solution was added to each under a fume hood, the flasks were corked, and each solution was shaken for 5 minutes at 160 strokes per minute. These were filtered through Fisherbrand P-5 filter paper into labelled test tubes. A 100 µL of each sample was diluted with 10 mL of water. Then, eight PO43—P standards (0.020-0.800 ppm) were made. A 40 µl of colour solution was added to each well in a 96-well microplate. A 160 µL of each diluted sample, standard, and blank were added to the microplate wells and their placements were labelled. After 10 minutes the BioTek HT synergy microplate reader was used to read the absorbances at 630 nm. Phosphate levels were then determined using absorbances and a standard curve [37].
2.5. Vegetation Data
The tree seedling data was coded based on the Ontario vegetation classification codes (Table S2). Based on the species ID, each plant species was grouped into native, non-native or invasive, by deer preference, and by shade tolerance. Plants were identified as either native, non-native, or invasive using the Ontario tree atlas [38], Ontario trees & shrubs [39], and the USDA plants database [40]. The deer preferability of a species was classified on a scale of 1 (highly avoided) to 5 (highly selected) based on several sources [39,40,41,42,43,44,45,46,47]. The shade tolerance of a species was determined using a scale of 1 (shade intolerant) to 4 (very shade tolerant) based on several sources [48,49,50,51,52]. Total seedling density was calculated in each quadrat along with the density of native, non-native, and invasive species, and deer preferred vs. non-preferred species. Seedling species richness was estimated as the number of unique species within each quadrat. Shannon diversity index (Sh) was calculated for each plot using Equation (3) below.
Where Pi is the proportion of species i within a plot and In is natural log
2.6. Statistical Analysis and Modelling
The impact of deer browsing on nutrient cycling and seedling recruitment dynamics was determined by comparing deer exclosures to non-exclosures using a two-sample T-test [53]. A test is significant when the p-value is < 0.05 (α = 5%). The Non-Metric Multidimensional Scaling (NMDS) ordination technique was used to visualize and compare the species compositions between exclosures and non-exclosures and between sites. This was done in R studio using the following packages: vegan, ggplot2, dplyr, readxl, grid, and ggrepel.
In order to explain the variability in regeneration species richness and density, we explored the linear and non-linear (quadratic) effects of potential explanatory variables using the PROC GLM and PROC NLIN procedures in SAS (SAS Institute, Cary, NC, USA). PROC GLM allows for exploring the linear relations between a response variable and a single or a set of explanatory variables while the PROC NLIN procedure allows for exploring non-linear relations between a response variable and a single or a set of explanatory variables.
Where is species richness, is mean species richness observed and designates the product of n modifiers having a value close to unity when the variables are equal to their mean and increase or decrease when moving further away from the mean. We define as;
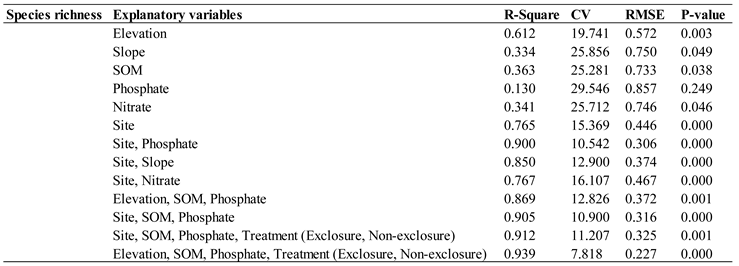
Where and represent linear and quadratic effects of the variable on species richness. Potential explanatory variables include elevation, slope, soil nitrate, soil phosphate, soil organic matter, treatment (exclosure vs. non-exclosure). For each model, the coefficient of determination (R2), the coefficient of variation (CV), the root mean square error (RMSE) and p-values were noted. Results show strong linear fits (Table 1 and Table S1).
3. Results
3.1. Impact of Deer Browsing on Abundance and Diversity
3.1.1. Seedling Density, Species Richness and Diversity
Two sample t-test results show that seedling density was significantly higher within exclosures than the non-exclosures at the McMaster study site (Figure 2a, Table S3). This finding was further reinforced by NMDS site-level clustering (Figure 4) which shows clear distinction between the McMaster exclosures and non-exclosures seedling abundance. This trend was not observed at the Sheelah Dunn Dooley (SDD) site (Figure 2a and Figure 4). Species richness and diversity were comparable between the exclosures and non-exclosures at both sites (Figure 2b). Further analysis using species accumulation curves however showed that as plots were added, the slope of increase in species richness was higher within deer exclosures compared to outside of the exclosures (Figure 3). When data from both sites were combined, the variability in species richness was mainly explained by slope (R2=33%), elevation (R2=61%) and SOM (R2=36%) (Table 1). Variability in density was insignificantly linked to site or soil nutrient dynamics (results not shown).
3.1.2. Abundance of Deer-Preferred Species
At the McMaster study site, results show that highly selected/deer-preferred species were far more abundant in the exclosures (70%) than in non-exclosures (30%) as illustrated in Figure 5a. Also, highly avoided species were far more abundant in the non-exclosures (97%) than exclosures (3%). The middle three categories were relatively similar between exclosures and non-exclosures. At SDD (Figure 5b), highly selected species were slightly higher in the non-exclosure (54%) than in the exclosure (46%). The highly avoided were also evenly distributed between exclosure (50.5) and non-exclosure (49.5). Again, the middle three categories were also very similar between exclosures and non-exclosures.
3.1.3. Species Dominance
The species abundance curves (Figure 6 and Figure S1), the butterfly charts (Figure 7) and the NMDS plots (Figure 8) indicate a large contrast between the vegetation communities in McMaster and SDD. The steep lines representing McMaster species abundance show a sugar maple dominance (Figure S1a,c, Figure 6 and Figure 7a). The SDD species abundance curves are less steep indicating reduced dominance by a single species (Figure S1b,d, Figure 6 and Figure 7b). There is a far greater difference in species dominance between McMaster and SDD study sites than between the exclosures and non-exclosures..
3.2. Impact of Deer Browsing on Species Invasion
Inter-site differences were higher than differences between exclosures and non-exclosure with regards to the proportion of native to non-native species (Figure 9, Table S4). The proportion of native species within the exclosures was statistically insignificantly different from that of the non-exclosures for both sites.
3.3. Impact of Deer Browsing on Nutrient Cycling
The results of this analysis showed slightly higher phosphate levels in the deer exclosures at both the McMaster study site (p = 0.358) and the SDD study site (p = 0.0506) (Table S5, Figure 10). Furthermore, nitrate levels were lower in the deer exclosures at both the McMaster Forest Nature Preserve (p = 0.124) and the SDD study sites (p = 0.0138). Finally, soil organic matter was comparable between exclosure and non-exclosures at both the McMaster site (p = 0.106), and the SDD site (p = 0.242).
3.4. Impact of Tip-Up Mounds on Deer Browsing Activity
After 9 weeks of monitoring, the seedling count decreased by 90% at the base of the mound and by 60% at the top of the mound (Figure 11). The average number of leaves remaining stayed constant at 4 for seedlings at the base and fluctuated for seedlings planted at the top. Seedling remaining based on the height of the mound shows the greatest decrease in height of 0 m mounds (seedlings at the base) and the least decrease in the mounds of 1-1.5 m in height. Mounds higher than 2 m were unincluded from the plot as there were only 2.
4. Discussion
In this study, we examined the impact of deer browsing on the regeneration dynamics and soil nutrient cycling of an old-growth Carolinian forest in south western Ontario. Because data was collected from two study sites, we discussed the inter-site differences in regeneration dynamics and nutrient cycling. We subsequently discussed the impact of deer browsing on seedling attributes (density, diversity, species invasion), the impact of deer browsing on nutrient cycling, and, the impact of tip-up mound on deer browsing access.
4.1. Inter-Site Differences in Regeneration Dynamics and Nutrient Cycling
The species abundance found in this study averaged 16 seedlings per square meter at the MFNP and 14 at SDD site. In one study on North American temperate forests, the average seedling density was found to be 9 with a range of 0-57 in the 1 m2 quadrats [55]. A different study done in the MFNP, sampling all saplings above 130 cm in height, found an average of 52.8 stems per 20 m x 20 m with a large variation in abundance between the plots [56]. This value is equivalent to 0.132 per 1 m x 1 m quadrat, however, as that study only counted saplings and not seedlings, it would be expected to be much lower than the values found in this study. Species richness in this study was found to be on average 2.2 species per square meter at MFNP and 3.6 species per square meter at the SDD study sites (Table S6). An earlier study conducted by Stegman [57] at the same site reported 105 species per square meter which is higher than our data but it may be due to the fact that the earlier study looked at the richness of floral species, rather than just woody species. We observed an average Shannon diversity value of 0.79 at MFNP and 0.73 at SDD study sites (Table S6). As there were only 10 and 12 species in these samples, the maximum diversity value possible is ~1 (log10(10) = 1) indicating significantly high diversity which is consistent with the high biodiversity known for the Carolinian forests in this region [26].
The average soil nitrate was 3.4 ppm at MFNP and 2.5 ppm at SDD sites (Table S6). A study done in deciduous forests in Ohio, found soil nitrate levels to be ~5.11 ppm [58]. Another study conducted in pine and oak-dominated temperate forests of China reported nitrate values in the range of 12-35 ppm [59]. Our data thus show that soil nitrate levels are low for the deciduous forests of Hamilton (Southern Ontario). Soil phosphate levels in this study were found to be an average of 55.6 ppm at MFNP and 9.2 ppm at SDD study sites (Table S6). This is comparable to the average soil phosphorus levels of ~37 ppm reported for the Southern Ontario region by the Fertilizer Institute [60]. Our SOM levels were 7.6% at MFNP and 9.6% at the SDD control sites (Table S6). A typical loam soil in Ontario has a SOM of 4-5% (Ontario, 2022) and the Fertilizer Institute’s reported average SOM for agricultural soils in southern Ontario is 3.3% [60]. The deciduous forests of Hamilton and Southern Ontario thus have slightly higher SOM than the agricultural soils of the region.
The two study sites differ most notably in species dominance with the MFNP site dominated by maple mainly sugar maple (Acer saccharum) species while the SDD site was dominated by Gray dogwood (Cornus racemose) albeit to a lesser extent. The two sites differ significantly in slope and elevation, the SDD site has greater elevation (135 m) and steeper slopes (-19.5 o) than the MFNP site (Table S6) which explains significant variability in species richness. Higher elevation with steeper slopes would drive more erosion events leading to phosphate levels that are 6x lower on this site [61]. Phosphate is more susceptible to erosion than nitrate as it has been found to decrease soil stability by impacting the soil charge [62]. He et. al. [63] reported over 7x higher loss in available phosphorus on 20 °-slope compared to 10 °-slope. The higher SOM of this site reflects the dense old growth closed canopy forest with high litter turnover rate [29].
4.2. Impact of Deer Browsing on Seedlings
We observed a significantly higher density of regeneration within the exclosures (e.g., [32]) after 7-years of deer exclusion. Though differences in species richness and Shannon diversity between exclosures and non-exclosures were not significant even after 7-years of deer exclusion, the nature of the result is similar to the results reported by Stephan et al. [32]. Furthermore, density may increase richness if there is high species evenness, but the species evenness was quite low in some of the exclosures meaning that increased density didn’t lead to significantly higher richness or diversity [64]. However, species accumulation curves reveal higher slope of increase in species richness in the deer exclosures, at both study sites (Figure 3), which signals a positive correlation between deer exclusion and species richness. We also observed that after 7-years of deer exclusion, (MFNP), deer-preferred species were far more abundant in the exclosures and deer-highly avoided species were more abundant in the non-exclosures which supports the hypothesis that deer browsing will lead to the predominance of deer-tolerant species. This trend is because selective browsing on preferred species allows unpalatable species to proliferate in non-exclosures, while lack of browsing will have the opposite effect (e.g., [65]). Overall, these results indicate that exclosures positively impacted regeneration density. It was also hypothesized that more invasive species would be present on the browsed sites relative to deer exclosures [66], however, the opposite was observed at the McMaster site. This may be because there were very few invasive tree species recorded overall at the McMaster site so no strong trends could be obtained. The SDD site had slightly more invasive species, however, the impact of browsing was insignificant perhaps because the exclusion plots at SDD were established only 1-year old.
4.3. Impact of Deer Browsing on Nutrient Cycling
We expected higher nutrient cycling on browsed sites relative to non-exclosures which was true for nitrate and SOM. However, phosphate levels were higher in the exclosures. A study on the effects of deer exclosures monitored over 18 years showed that PO4-P and NO3-N concentrations were not impacted, and that SOM increased in the exclosure [32]. Another study found that deer browsing led to decreased soil nitrate levels [17]. A study done in Canadian temperate forests showed that the exclusion of deer decreased soil compaction which increased soil phosphate levels [67]. Overall, these results vary which may indicate that deer may play a role, but other factors in the biotic and abiotic environment such as soil microbes and plant makeup in the understory may make large differences causing the impact of deer to be less straightforward [32,68]. In our case, further analysis of the vegetation nitrate content shows that vegetation nitrate is comparable across sites and between exclosures and non-exclosures (Figure 12) which implies that the observed differences in soil nitrate was not driven by vegetation nitrate contents but rather most likely due to the direct impacts of deer fecal droppings.
4.4. Impact of Tip-Up Mounds on Deer Browsing Activity
Finally, we verified if seedlings growing on tip-up mounds tend to be inaccessible to deer. As expected, the tip-up mounds appeared to give some protection to the seedlings growing on top as more seedlings at the bases of the mounds were found missing over the 9-week period. There did not appear to be useful insights in terms of leaf growth in relation to seedling position on mound, and limited correlation between the height of mound and the seedlings remaining overtime, most likely due to the limited number of tip-up mounds considered in this study.
5. Conclusions
The results of this study show how deeply deer browsing impacts both soil and vegetation dynamics in an old growth Carolinian forest. Exclusion of deer led to a significant increase in vegetation density, insignificant differences in richness and diversity and yet a significantly greater abundance of deer-preferred species reinforcing the notion of deer as a careful selective browser. Furthermore, as more time passes the differences between exclosures and non-exclosures become evidence as demonstrated by the differences in the results from the McMaster and SDD sites. Finally, results regarding the tip-up mounds indicate that this may be a promising, natural method of deer exclusion. Further work could track the growth of specific seedlings over time because some studies have found that certain plant species in exclosures, may outcompete native seedlings due to the lack of browsing.
Supplementary Materials
The following supporting information can be downloaded at the website of this paper posted on Preprints.org, Figure S1. Species abundance curves for McMaster (a) Exclosures and (c) Non-exclosures and Sheelah Dunn Dooley (b) Exclosures and (d) Non-exclosures. Figure S2. NMDS plot showing the species distributions/associations at a) McMaster site (p = 0.004) and b) Sheelah Dunn Dooley site (p = 0.144). Each species is represented by its species code (Table S1). Only species that occur on at least 2-plots were included in this analysis. Figure S3. NMDS plot showing the species-level clustering with all sites combined and removing rare species, a) species with total abundance <10 removed (1%), b) species with total abundance <50 removed (5%). Figure S4. Species abundance by shade tolerance class for a) McMaster study site, b) Sheelah Dunn Dooley Nature Sanctuary. Table S1: Leaf nitrate classification into low (1), medium (2), high (3) and the reference literature. Table S2. Tree species codes (following the Ontario Vegetation Classification). Table S3. Seedling density, species richness and diversity in both control and treatment groups at the McMaster and SDD sites. Table S4. Percentage of native seedlings (seedling density) and native species (species proportion) in the treatment and control groups at the McMaster and SDD sites. Table S5. Soil phosphate, nitrate, and organic matter in treatment and control plots at the McMaster and SDD sites. Table S6. Inter-site summary of biotic and abiotic attributes.
Author Contributions
Conceptualization, K.A. and S.D.2; methodology, K.A., S.D.1, S.D.2; validation, K.A., S.D.1, S.D.2; formal analysis, K.A., S.D.1.; K.A., S.D.1, S.D.2.; data curation, K.A., S.D.1.; writing—original draft preparation, K.A., S.D.1; writing—review and editing, K.A., S.D.1, S.D.2.; visualization, K.A., S.D.1.; supervision, K.A. and S.D.2.; funding acquisition, K.A.. All authors have read and agreed to the published version of the manuscript. S.D.1 is Sarah Don, S.D.2 is Susan Dudley.
Funding
This work was funded by the NSERC undergraduate student research award.
Data Availability Statement
The raw data supporting the conclusions of this article will be made available by the authors on request.
Acknowledgments
We are grateful to the Hamilton Naturalists Club for allowing their deer exclusion plots to be used in this study. Authors are grateful to Dr. Edward Berkelaar for his help with soil nutrient analysis.
Conflicts of Interest
The authors declare no conflicts of interest. The funders had no role in the design of the study; in the collection, analyses, or interpretation of data; in the writing of the manuscript; or in the decision to publish the results.
References
- Perry, D. A., Oren, R., & Hart, S. C. (2008). Forest Ecosystems (2nd ed.). JHU Press.
- Johnson, D. W., & Turner, J. (2019). Tamm Review: Nutrient cycling in forests: A historical look and newer developments. Forest Ecology and Management, 444, 344–373. https://doi.org/10.1016/j.foreco.2019.04.052. [CrossRef]
- Kraus, D., & Krumm, F. (2013). Integrative approaches as an opportunity for the conservation of forest biodiversity. European Forest Institute. https://www.researchgate.net/publication/263580500_Integrative_Approaches_as_an_Opportunity_for_the_Conservation_of_Forest_Biodiversity.
- Ampoorter, E., Barbaro, L., Jactel, H., Baeten, L., Boberg, J., Carnol, M., Castagneyrol, B., Charbonnier, Y., Dawud, S. M., Deconchat, M., Smedt, P. D., Wandeler, H. D., Guyot, V., Hättenschwiler, S., Joly, F.-X., Koricheva, J., Milligan, H., Muys, B., Nguyen, D., Allan, E. (2020). Tree diversity is key for promoting the diversity and abundance of forest-associated taxa in Europe. Oikos, 129(2), 133–146. https://doi.org/10.1111/oik.06290. [CrossRef]
- Jactel, H., Bauhus, J., Boberg, J., Bonal, D., Castagneyrol, B., Gardiner, B., Gonzalez-Olabarria, J. R., Koricheva, J., Meurisse, N., & Brockerhoff, E. G. (2017). Tree diversity drives forest stand resistance to natural disturbances. Current Forestry Reports, 3(3), 223–243. https://doi.org/10.1007/s40725-017-0064-1. [CrossRef]
- Kozlowski, T. T. (2002). Physiological ecology of natural regeneration of harvested and disturbed forest stands: Implications for forest management. Forest Ecology and Management, 158(1), 195–221. https://doi.org/10.1016/S0378-1127(00)00712-X. [CrossRef]
- Harmer, R. (2001). The effect of plant competition and simulated summer browsing by deer on tree regeneration. Journal of Applied Ecology, 38(5), 1094–1103. https://doi.org/10.1046/j.1365-2664.2001.00664.x. [CrossRef]
- Laurent, L., Mårell, A., Balandier, P., Holveck, H., & Saïd, S. (2017). Understory vegetation dynamics and tree regeneration as affected by deer herbivory in temperate hardwood forests. iForest - Biogeosciences and Forestry, 10(5), 837. https://doi.org/10.3832/ifor2186-010. [CrossRef]
- De Lombaerde, E., Verheyen, K., Van Calster, H., & Baeten, L. (2019). Tree regeneration responds more to shade casting by the overstorey and competition in the understorey than to abundance per se. Forest Ecology and Management, 450, 117492. https://doi.org/10.1016/j.foreco.2019.117492. [CrossRef]
- Patton, S. R., Russell, M. B., Windmuller-Campione, M. A., & Frelich, L. E. (2021). White-tailed deer herbivory impacts on tree seedling and sapling abundance in the Lake States Region of the USA. Annals of Forest Science, 78(4), Article 4. https://doi.org/10.1007/s13595-021-01108-6.
- Krueger, L. M., Peterson, C. J., Royo, A., & Carson, W. P. (2009). Evaluating relationships among tree growth rate, shade tolerance, and browse tolerance following disturbance in an eastern deciduous forest. Canadian Journal of Forest Research, 39(12), 2460–2469. https://doi.org/10.1139/X09-155. [CrossRef]
- Nuttle, T., Royo, A. A., Adams, M. B., & Carson, W. P. (2013). Historic disturbance regimes promote tree diversity only under low browsing regimes in eastern deciduous forest. Ecological Monographs, 83(1), 3–17. https://doi.org/10.1890/11-2263.1. [CrossRef]
- Nuttle, T., Ristau, T. E., & Royo, A. A. (2014). Long-term biological legacies of herbivore density in a landscape-scale experiment: Forest understoreys reflect past deer density treatments for at least 20 years. Journal of Ecology, 102(1), 221–228. https://doi.org/10.1111/1365-2745.12175. [CrossRef]
- Waller, D. M., & Maas, L. I. (2013). Do white-tailed deer and the exotic plant garlic mustard interact to affect the growth and persistence of native forest plants? Forest Ecology and Management, 304, 296–302. https://doi.org/10.1016/j.foreco.2013.05.011. [CrossRef]
- Belovsky, G. E., & Slade, J. B. (2000). Insect herbivory accelerates nutrient cycling and increases plant production. Proceedings of the National Academy of Sciences, 97(26), 14412–14417. https://doi.org/10.1073/pnas.250483797. [CrossRef]
- Woods, M. J., Roberson, E., Cipollini, D., & Rúa, M. A. (2019). White-tailed deer and an invasive shrub facilitate faster carbon cycling in a forest ecosystem. Forest Ecology and Management, 448, 104–111. https://doi.org/10.1016/j.foreco.2019.05.068. [CrossRef]
- Harrison, K. A., & Bardgett, R. D. (2004). Browsing by red deer negatively impacts on soil nitrogen availability in regenerating native forest. Soil Biology and Biochemistry, 36(1), 115–126. https://doi.org/10.1016/j.soilbio.2003.08.022. [CrossRef]
- Wolfe, B. E., Rodgers, V. L., Stinson, K. A., & Pringle, A. (2008). The invasive plant Alliaria petiolata (garlic mustard) inhibits ectomycorrhizal fungi in its introduced range. Journal of Ecology, 96(4), 777–783. https://doi.org/10.1111/j.1365-2745.2008.01389.x. [CrossRef]
- Anderson, I. C., & Cairney, J. W. G. (2007). Ectomycorrhizal fungi: exploring the mycelial frontier. FEMS Microbiology Reviews, 31(4), 388–406. https://doi.org/10.1111/j.1574-6976.2007.00073.x. [CrossRef]
- Fagan, M. E., & Peart, D. R. (2004). Impact of the invasive shrub glossy buckthorn (Rhamnus frangula L.) on juvenile recruitment by canopy trees. Forest Ecology and Management, 194(1), 95–107. https://doi.org/10.1016/j.foreco.2004.02.015. [CrossRef]
- Brown, T.L., Decker, D.J., Riley, S.J., Enck, J.W., Lauber, T.B., Curtis, P.D. and Mattfeld, G.F., 2000. The future of hunting as a mechanism to control white-tailed deer populations. Wildlife Society Bulletin, 28(4), pp.797-807.
- Ballard, W., Lutz, D., Keegan, T., Carpenter, L., & deVos, J. (2001). Deer-predator relationships: A review of recent North American studies with emphasis on mule and black-tailed deer. Wildlife Society Bulletin, 29(1). Deer-predator relationships: A review of recent North American studies with emphasis on mule and black-tailed deer | Request PDF (researchgate.net).
- Long, Z. T., Carson, W. P., & Peterson, C. J. (1998). Can disturbance create refugia from herbivores: An example with hemlock regeneration on treefall mounds. Journal of the Torrey Botanical Society, 125, 165–168. https://doi.org/10.2307/2997303. [CrossRef]
- Titus, J. H. (1990). Microtopography and woody plant regeneration in a hardwood floodplain swamp in Florida. Bulletin of the Torrey Botanical Club, 117(4), 429–437. https://doi.org/10.2307/2996840. [CrossRef]
- Bartlick, C. I., Burton, J. I., Webster, C. R., Froese, R. E., Hupperts, S. F., & Dickinson, Y. L. (2023). Artificial tip-up mounds influence tree seedling composition in a managed northern hardwood forest. Canadian Journal of Forest Research, 53(11), 893–904. https://doi.org/10.1139/cjfr-2022-0252. [CrossRef]
- Tidman, D., & Hsiang, T. (2021). Restoring forest cover and enhancing biodiversity of the Carolinian forest in Ontario affected by Ash tree decline from the Emerald Ash Borer. https://hdl.handle.net/10214/24139.
- DeYoung, B., & Troughton, M. (2005). Sharp pencils, fat crayons and fuzzy boundaries: How to depict the Carolinian in Canada. Protected Areas and Species and Ecosystems at Risk: Research and Planning Challenged. Proceedings of the Parks Reserach Forum of Ontario (PFRO) Annual General Meeting. https://longpointbiosphere.com/download/Environment/PRFO-2005-Proceedings-p413-422-DeYoung-and-Troughton.pdf.
- Public Safety Canada 2020. Canadian Disaster Database. https://cdd.publicsafety.gc.ca/prnt-eng.aspx?cultureCode=en-Ca&provinces=9&eventTypes=%27EP%27%2C%27IN%27%2C%27PA%27%2C%27AV%27%2C%27CE%27%2C%27DR%27%2C%27FL%27%2C%27GS%27%2C%27HE%27%2C%27HU%27%2C%27SO%27%2C%27SS%27%2C%27ST%27%2C%27TO%27%2C%27WF%27%2C%27SW%27%2C%27EQ%27%2C%27LS%27%2C%27TS%27%2C%27VO%27&normalizedCostYear=1&dynamic=false. Last accessed on July 28, 2024.
- Hamilton Naturalist’s Club (2024). Sheelah Dunn Dooley Nature Sanctuary Stewardship Plan. https://mail.google.com/mail/u/0?ui=2&ik=0cb42d64be&attid=0.2&permmsgid=msg-f:1797325289225623768&th=18f161d3f21e98d8&view=att&disp=inline&realattid=f_lvfga0nh2.
- HCA (Hamilton Conservation Authority) 2013. White-tailed Deer Annual Report, 2013. https://conservationhamilton.ca/images/PDFs/Board%20of%20Directors/Appendix_A_-_2013_Deer_Report.pdf.
- Barker, J., 2018. Effects of white-tailed deer and invasive garlic mustard on native tree seedlings in an urban forest. MSc dissertation. https://macsphere.mcmaster.ca/handle/11375/24171.
- Stephan, J. G., Pourazari, F., Tattersdill, K., Kobayashi, T., Nishizawa, K., & De Long, J. R. (2017). Long-term deer exclosure alters soil properties, plant traits, understory plant community and insect herbivory, but not the functional relationships among them. Oecologia, 184(3), 685–699. https://doi.org/10.1007/s00442-017-3895-3. [CrossRef]
- Kershaw, L. 2001. Trees of Ontario. Lone Pine Publishing. 240 pages.
- Anyomi, K., 2023. How consistent are citizen science data sources, an exploratory study using free automated image recognition apps for woody plant identification. Canadian Journal of Forest Research, 54(3), pp.357-365.
- Hoogsteen, M., Lantinga, E., Bakker, E.-J., Groot, J., & Tittonell, P. A. (2015). Estimating soil organic carbon through loss on ignition: Effects of ignition conditions and structural water loss. European Journal of Soil Science, 66. https://doi.org/10.4141/S05-070. [CrossRef]
- Pellerin, A., Parent, L.-É., Fortin, J., Tremblay, C., Khiari, L., & Giroux, M. (2006). Environmental Mehlich-III soil phosphorus saturation indices for Quebec acid to near neutral mineral soils varying in texture and genesis. Canadian Journal of Soil Science, 86(4), 711–723. https://doi.org/10.4141/S05-070. [CrossRef]
- Berkelaar, E. (2023). ENV 222: Environmental Science II: Pollution and Climate Change Unpublished laboratory manual.
- OMNR (Ontario Ministry of Natural Resources) 2024. The tree atlas: Southwest region. https://www.ontario.ca/page/tree-atlas/ontario-southwest. Last accessed July 3rd 2024.
- Muma, W. 2014. Ontario trees and shrubs. https://ontariotrees.com/main/index.php. Last accessed on June 28, 2024.
- USDA (United States Department of Agriculture) 2014. USDA Plants Database. https://plants.usda.gov/home. Last accessed June 28, 2024.
- Sample, R. D., Delisle, Z. J., Pierce, J. M., Swihart, R. K., Caudell, J. N., & Jenkins, M. A. (2023). Selection rankings of woody species for white-tailed deer vary with browse intensity and landscape context within the Central Hardwood Forest Region. Forest Ecology and Management, 537, 120969. https://doi.org/10.1016/j.foreco.2023.120969. [CrossRef]
- Ward, J. S., Williams, S. C., & Linske, M. A. (2018). Influence of invasive shrubs and deer browsing on regeneration in temperate deciduous forests. Canadian Journal of Forest Research, 48(1), 58–67. https://doi.org/10.1139/cjfr-2017-0208. [CrossRef]
- Catling, P. M., & Mitrow, G. (2008). Distribution and History of Naturalized Common Pear, ‘Pyrus communis’, in Ontario. The Canadian Field-Naturalist, 122(1), Article 1. https://doi.org/10.22621/cfn.v122i1.544. [CrossRef]
- Nature’s Mace (2024). Do Deer Eat Walnut Trees? Nature’s Mace. https://naturesmace.com/blogs/blog/do-deer-eat-black-walnuts#:~:text=Black%20walnuts%20also%20make%20a,once%20the%20plants%20before%20woody. Last accessed July 3rd 2024.
- Scottish Forestry, n.d. Relative palatability and resilience of native trees. https://www.forestry.gov.scot/woodland-grazing-toolbox/grazing-management/foraging/palatability-and-resilience-of-native-trees. Last accessed on July 3, 2024.
- GardenTabs 2021. Are Dogwood Trees Deer Resistant? GardenTabs. https://gardentabs.com/are-dogwood-trees-deer-resistant/. Last accessed on July 22, 2024.
- Midwest Gardening 2017. Black Maple Trees. Midwest Gardening. https://www.midwestgardentips.com/trees-index-1/2017/12/8/black-maple-trees. Last accessed on July 22, 2024.
- Alverson, W.S., Lea, M.V. and Waller, D.M., 2019. A 20-year experiment on the effects of deer and hare on eastern hemlock regeneration. Canadian Journal of Forest Research, 49(11), pp.1329-1338.
- NCSU (North Carolina State University) 2024. The North Carolina extension gardener plant toolbox. https://plants.ces.ncsu.edu/. Last accessed July 3rd 2024.
- The Spruce (n.d.). How to Grow and Care for Japanese Barberry. The Spruce. https://www.thespruce.com/japanese-barberry-shrubs-2132250. Last accessed on July 22, 2024.
- Nolan, J., & Expert, G. (2022). Boxelder trees: Types, leaves, bark, fruit (with pictures) - Identification guide. Leafy Place. https://leafyplace.com/boxelder-trees/.
- The Plant Native (2023). A guide to planting spicebush. The Plant Native. https://theplantnative.com/plant/spicebush/. Last accessed on July 22, 2024.
- Whitlock, M. & Schluter, D., 2015. The analysis of biological data (Vol. 768). Greenwood Village, Colorado: Roberts Publisher.
- Dexter, E., Rollwagen-Bollens, G., & Bollens, S. M. (2018). The trouble with stress: A flexible method for the evaluation of nonmetric multidimensional scaling. Limnology and Oceanography: Methods, 16(7), 434–443. https://doi.org/10.1002/lom3.10257. [CrossRef]
- Magee, L., Wolf, A., Howe, R., Schubbe, J., Hagenow, K., & Turner, B. (2021). Density dependence and habitat heterogeneity regulate seedling survival in a North American temperate forest. Forest Ecology and Management, 480, 118722. https://doi.org/10.1016/j.foreco.2020.118722. [CrossRef]
- Munoz, S. (2016). Forest diversity across space and environmental gradients. McMaster University, 111. https://dsp.lib.mcmaster.ca/bitstream/11375/19437/2/Munoz_Sophia_L_201605_MSc.pdf.
- Stegman, N., 2023. Temporal and Landscape Influences on the Bee Community Assemblage of the McMaster Research and Conservation Corridor. MSc dissertation. https://macsphere.mcmaster.ca/handle/11375/28274.
- Deforest, J. L., Smemo, K. A., Burke, D. J., Elliott, H. L., & Becker, J. C. (2012). Soil microbial responses to elevated phosphorus and pH in acidic temperate deciduous forests. Biogeochemistry, 109(1–3), 189–202. https://doi.org/10.1007/s10533-011-9619-6. [CrossRef]
- Geng, X., Zuo, J., Meng, Y., Zhuge, Y., Zhu, P., Wu, N., Bai, X., Ni, G., & Hou, Y. (2023). Changes in nitrogen and phosphorus availability driven by secondary succession in temperate forests shape soil fungal communities and function. Ecology and Evolution, 13(10), e10593. https://doi.org/10.1002/ece3.10593. [CrossRef]
- TFI (The Fertilizer Institute) 2021. Soil Test Levels in North America, 2020 Summary Update. The Fertilizer Institute, Arlinton, VA 22203, USA.
- Alewell, C., Ringeval, B., Ballabio, C., Robinson, D. A., Panagos, P., & Borrelli, P. (2020). Global phosphorus shortage will be aggravated by soil erosion. Nature Communications, 11(1), 4546. https://doi.org/10.1038/s41467-020-18326-7. [CrossRef]
- Li, S., Li, Y., Huang, X., Hu, F., Liu, X., & Li, H. (2018). Phosphate fertilizer enhancing soil erosion: Effects and mechanisms in a variably charged soil. Journal of Soils and Sediments, 18(3), 863–873. https://doi.org/10.1007/s11368-017-1794-1. [CrossRef]
- He, X., Zheng, Z., Li, T. and He, S., 2020. Effect of slope gradient on phosphorus loss from a sloping land of purple soil under simulated rainfall. Polish Journal of Environmental Studies, 29(2), pp.1637-1647.
- Wilsey, B., & Stirling, G. (2007). Species richness and evenness respond in a different manner to propagule density in developing prairie microcosm communities. Plant Ecology, 190(2), 259–273. https://doi.org/10.1007/s11258-006-9206-4. [CrossRef]
- Tanentzap, A. J., Burrows, L. E., Lee, W. G., Nugent, G., Maxwell, J. M., & Coomes, D. A. (2009). Landscape-level vegetation recovery from herbivory: Progress after four decades of invasive red deer control. Journal of Applied Ecology, 46(5), 1064–1072. https://doi.org/10.1111/j.1365-2664.2009.01683.x. [CrossRef]
- Shen, X., Bourg, N. A., McShea, W. J., & Turner, B. L. (2016). Long-term effects of white-tailed deer exclusion on the invasion of exotic plants: A case study in a mid-atlantic temperate forest. PLOS ONE, 11(3), e0151825. https://doi.org/10.1371/journal.pone.0151825. [CrossRef]
- Maillard, M., Martin, J.-L., Chollet, S., Catomeris, C., Simon, L., & Grayston, S. J. (2021). Belowground effects of deer in a temperate forest are time-dependent. Forest Ecology and Management, 493, 119228. https://doi.org/10.1016/j.foreco.2021.119228. [CrossRef]
- Wu, J., Wang, H., Li, G., Ma, W., Wu, J., Gong, Y., & Xu, G. (2020). Vegetation degradation impacts soil nutrients and enzyme activities in wet meadow on the Qinghai-Tibet Plateau. Scientific Reports, 10(1), 21271. https://doi.org/10.1038/s41598-020-78182-9. [CrossRef]
Figure 2.
Seedling density (a) and species richness and diversity (b) within and outside of exclosures at the McMaster and SDD sites.
Figure 2.
Seedling density (a) and species richness and diversity (b) within and outside of exclosures at the McMaster and SDD sites.
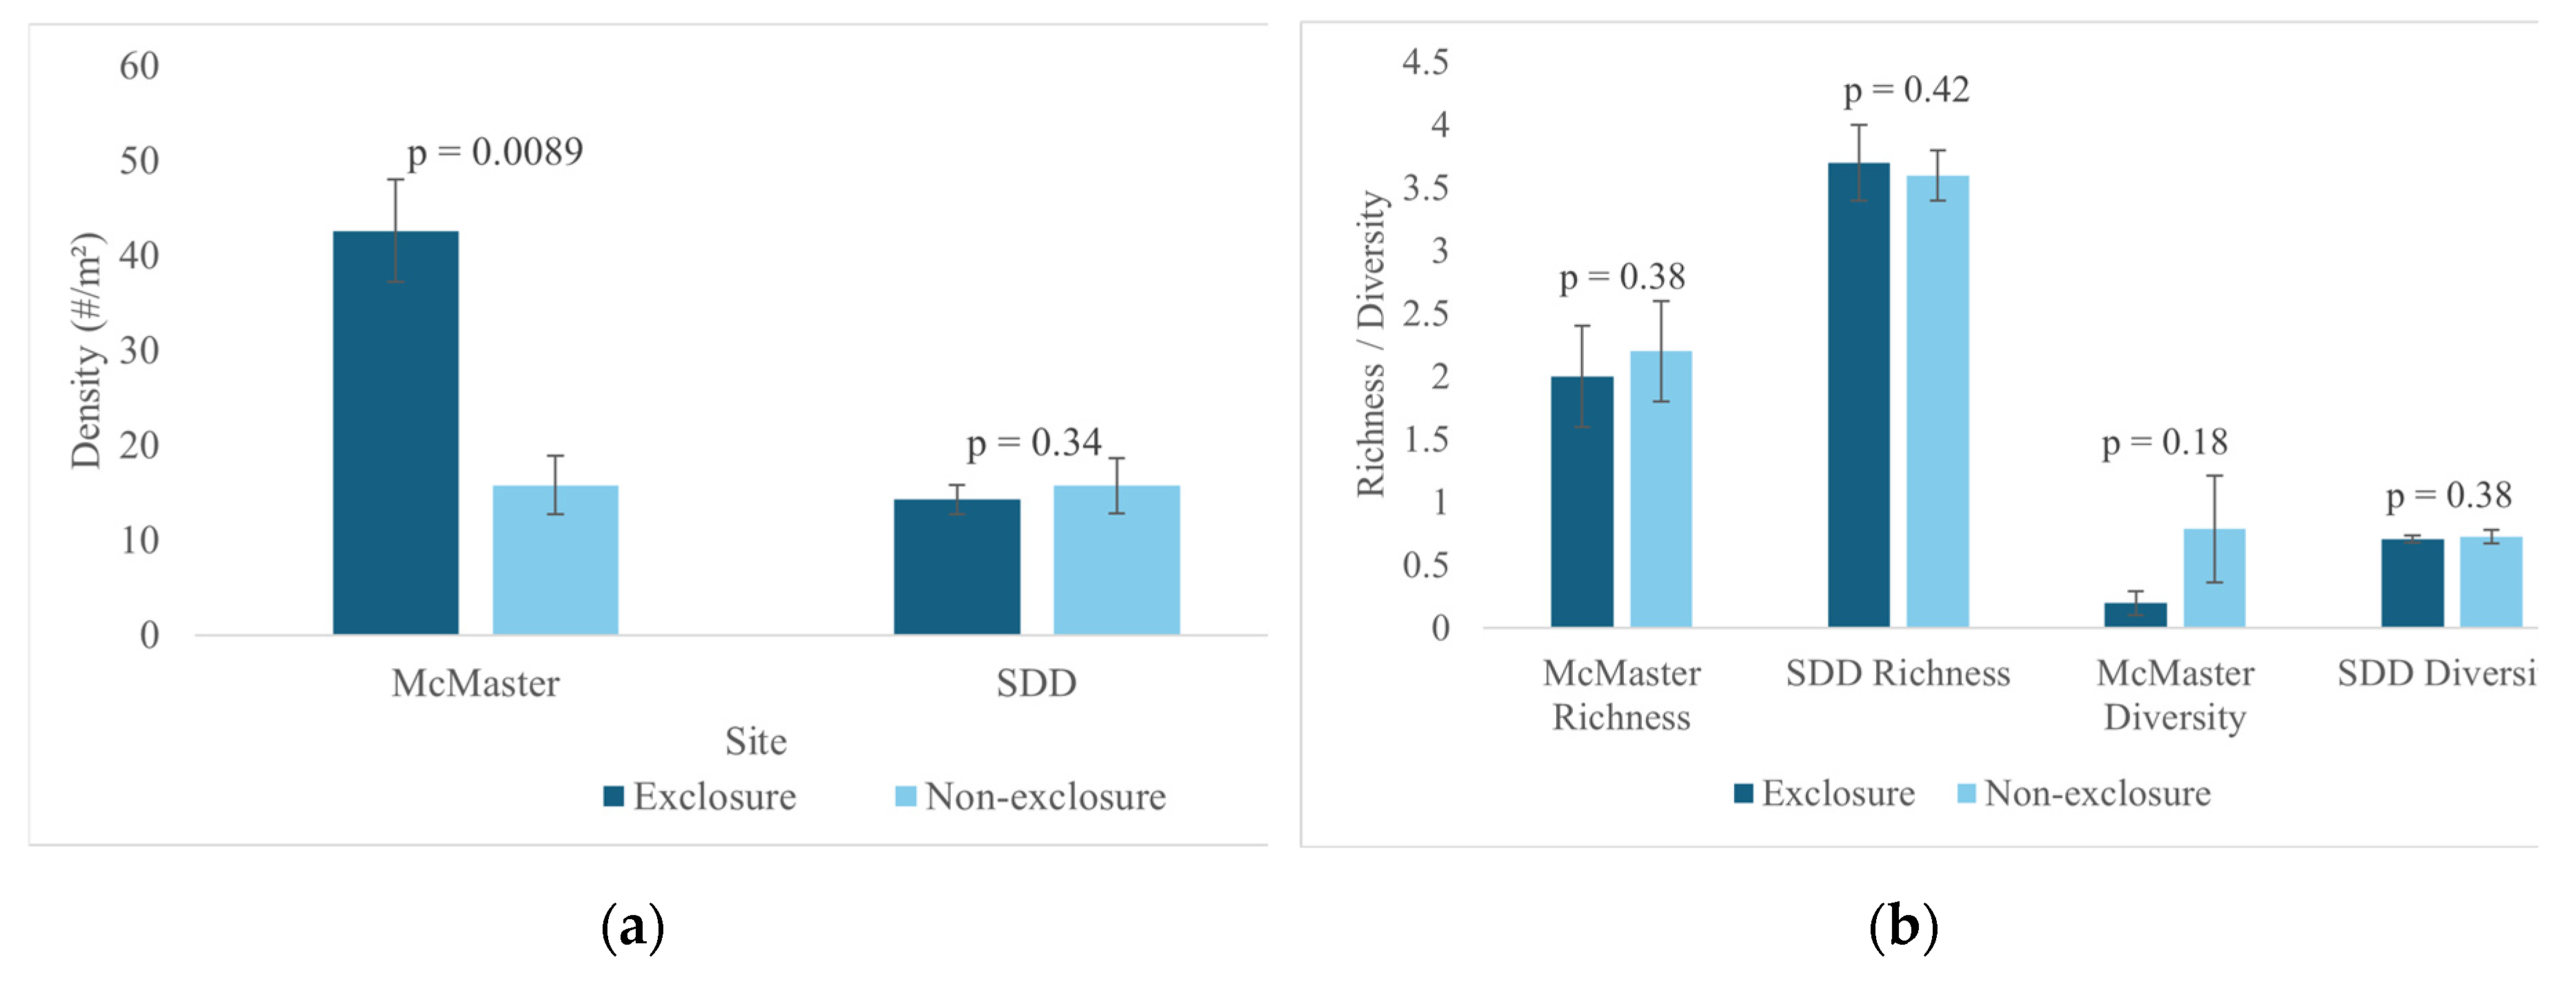
Figure 3.
Species accumulation plot showing an increase in species richness as more quadrats are accounted for in both exclosures and non-exclosures at the McMaster and SDD sites.
Figure 3.
Species accumulation plot showing an increase in species richness as more quadrats are accounted for in both exclosures and non-exclosures at the McMaster and SDD sites.
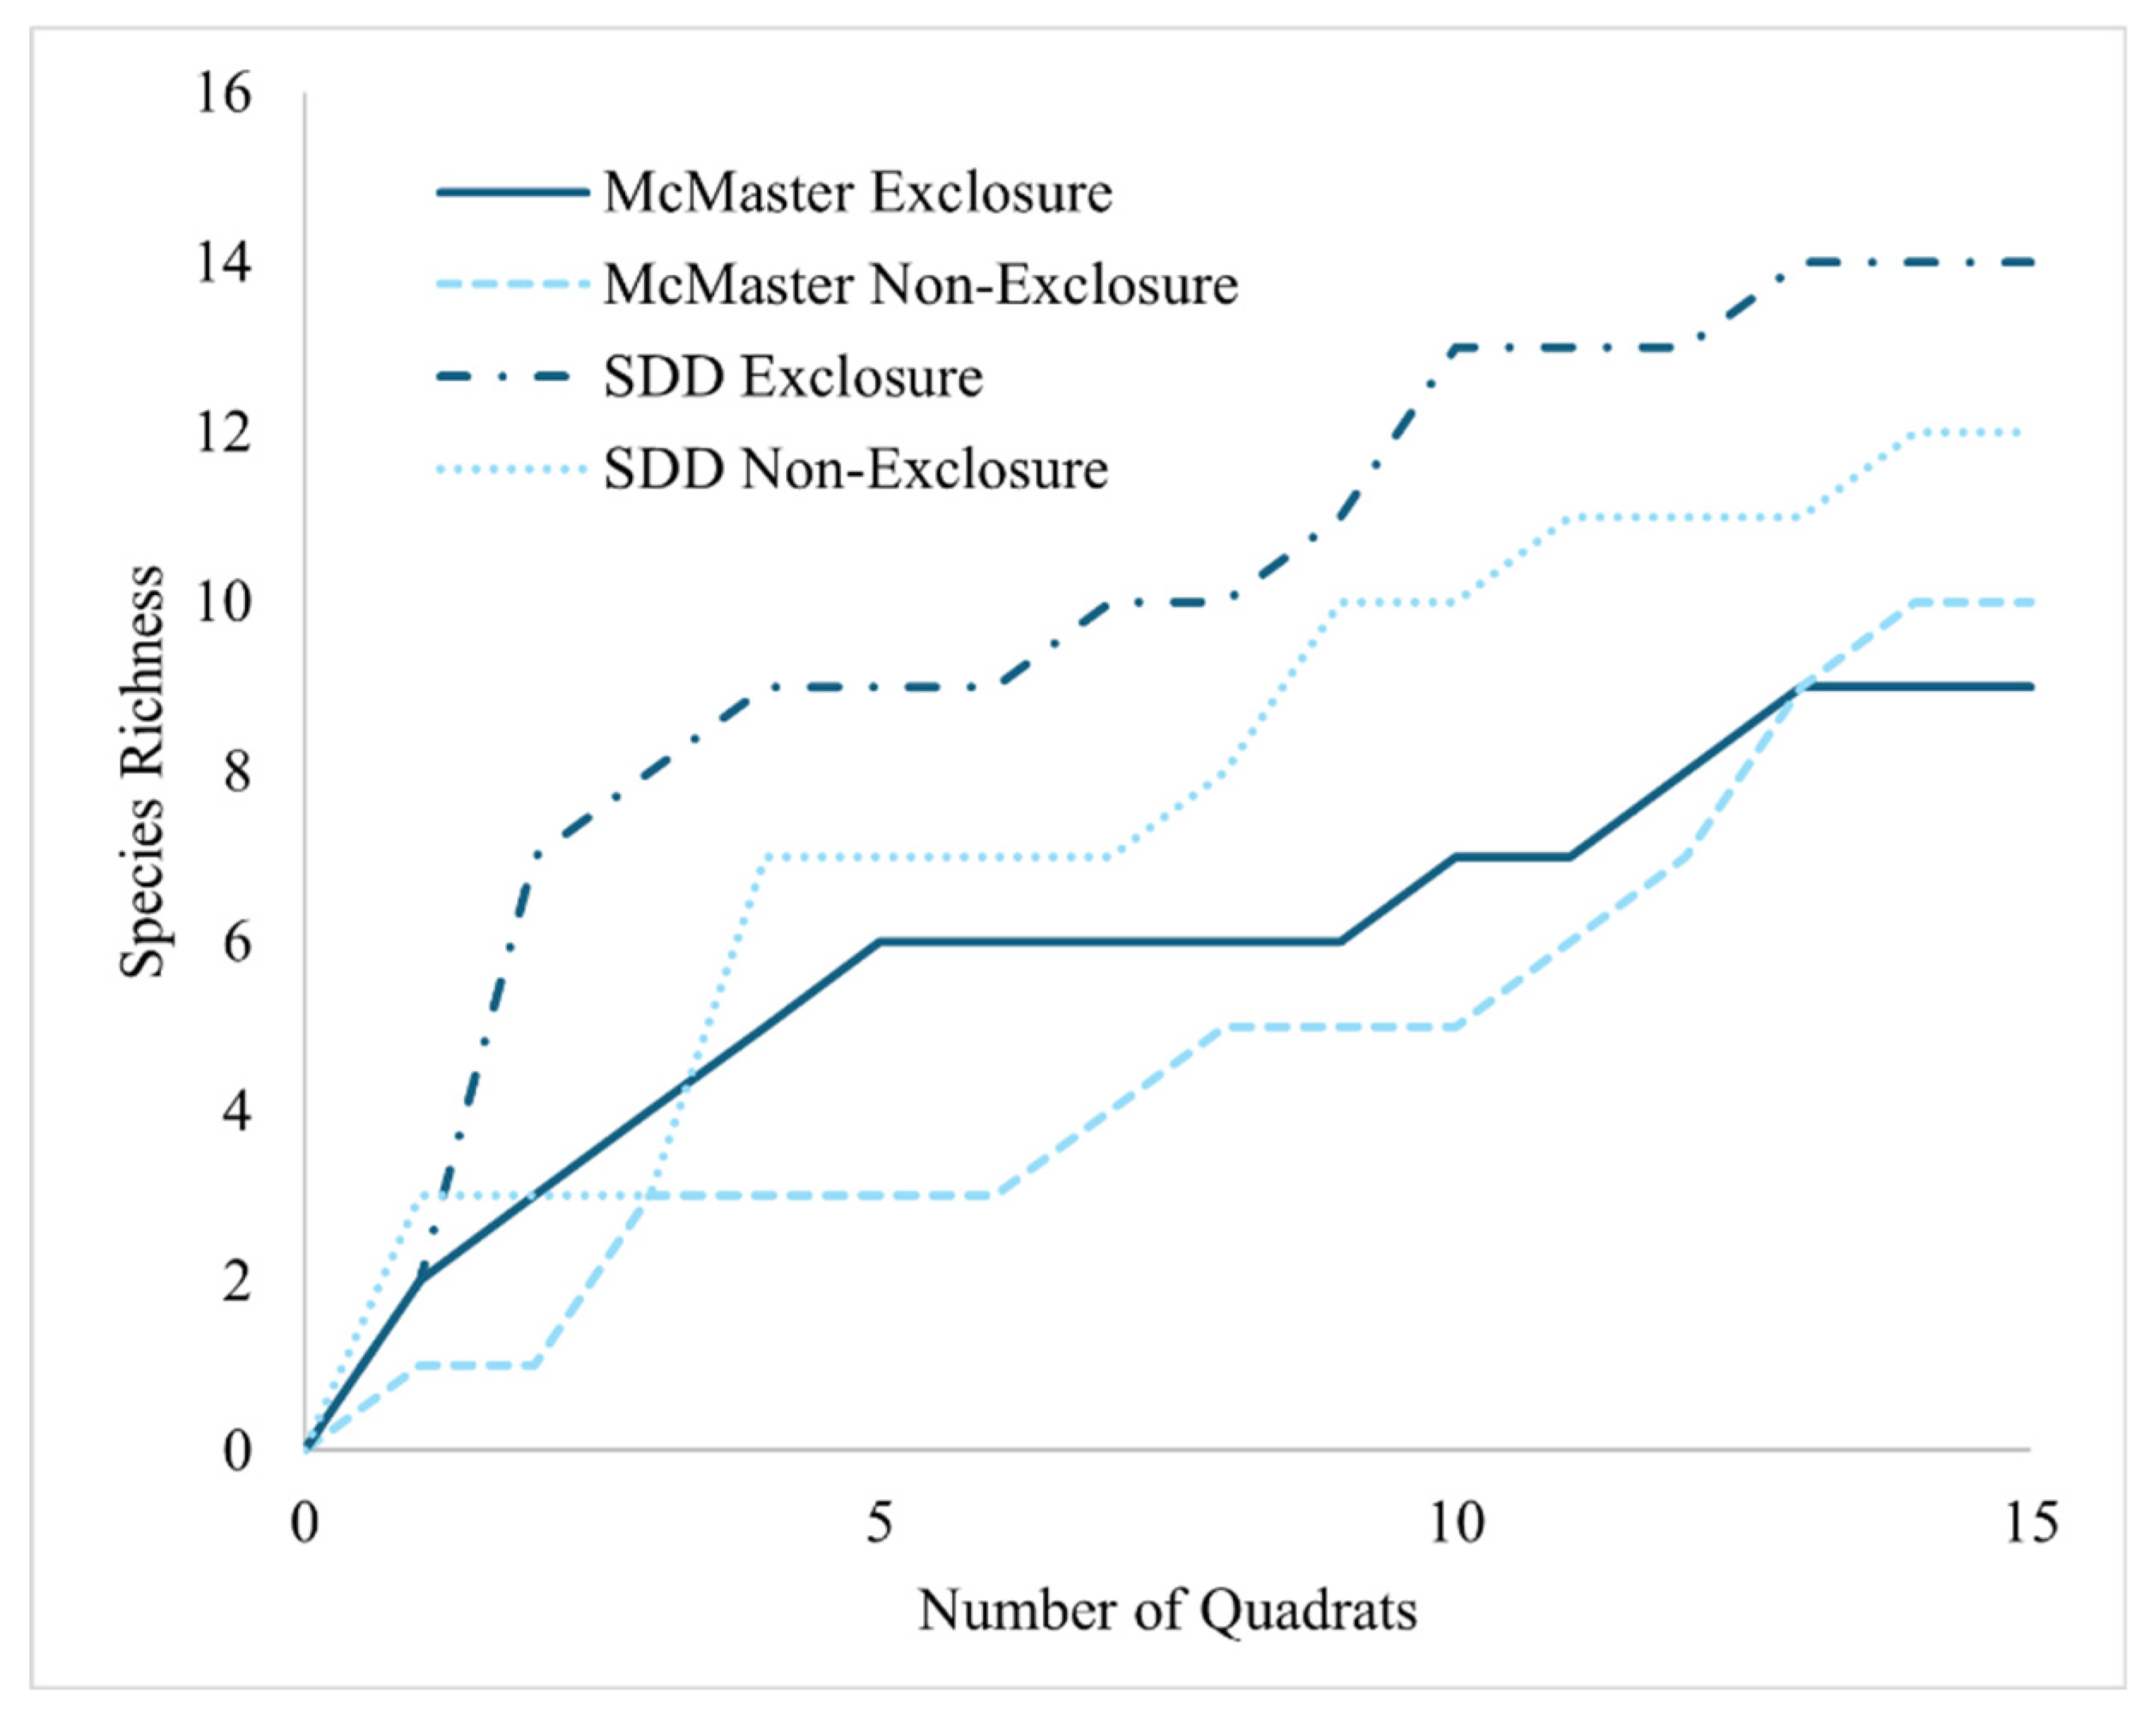
Figure 4.
NMDS plot showing study sites and their similarity based on the vegetation metrics (p = 0.007). The stress value is 0.1041 indicating that this plot is a good representation of the dissimilarity between the sites [54]. Darker convex hulls show the exclosures and lighter hulls show the non-exclosures. Trends in seedling density, soil nitrate, soil phosphate, species diversity, elevation, slope and species richness are represented by the arrows in the center. ‘M’ and ‘S’ stand for the MFNP and SDD sites respectively. ‘E’ and ‘P’ stand for exclosures and non-exclosures respectively. As such, ME1, ME2, ME3 refer to MFNP exclosure plots 1, 2, 3 respectively. MP1, MP2, MP3 refer to the MFNP deer browsed plots 1, 2, 3 respectively. SE1, SE2, SE3 refer to SDD exclosure plots 1, 2, 3 respectively while SP1, SP2, SP3 refer to SDD deer browsed plots 1, 2, 3 respectively.
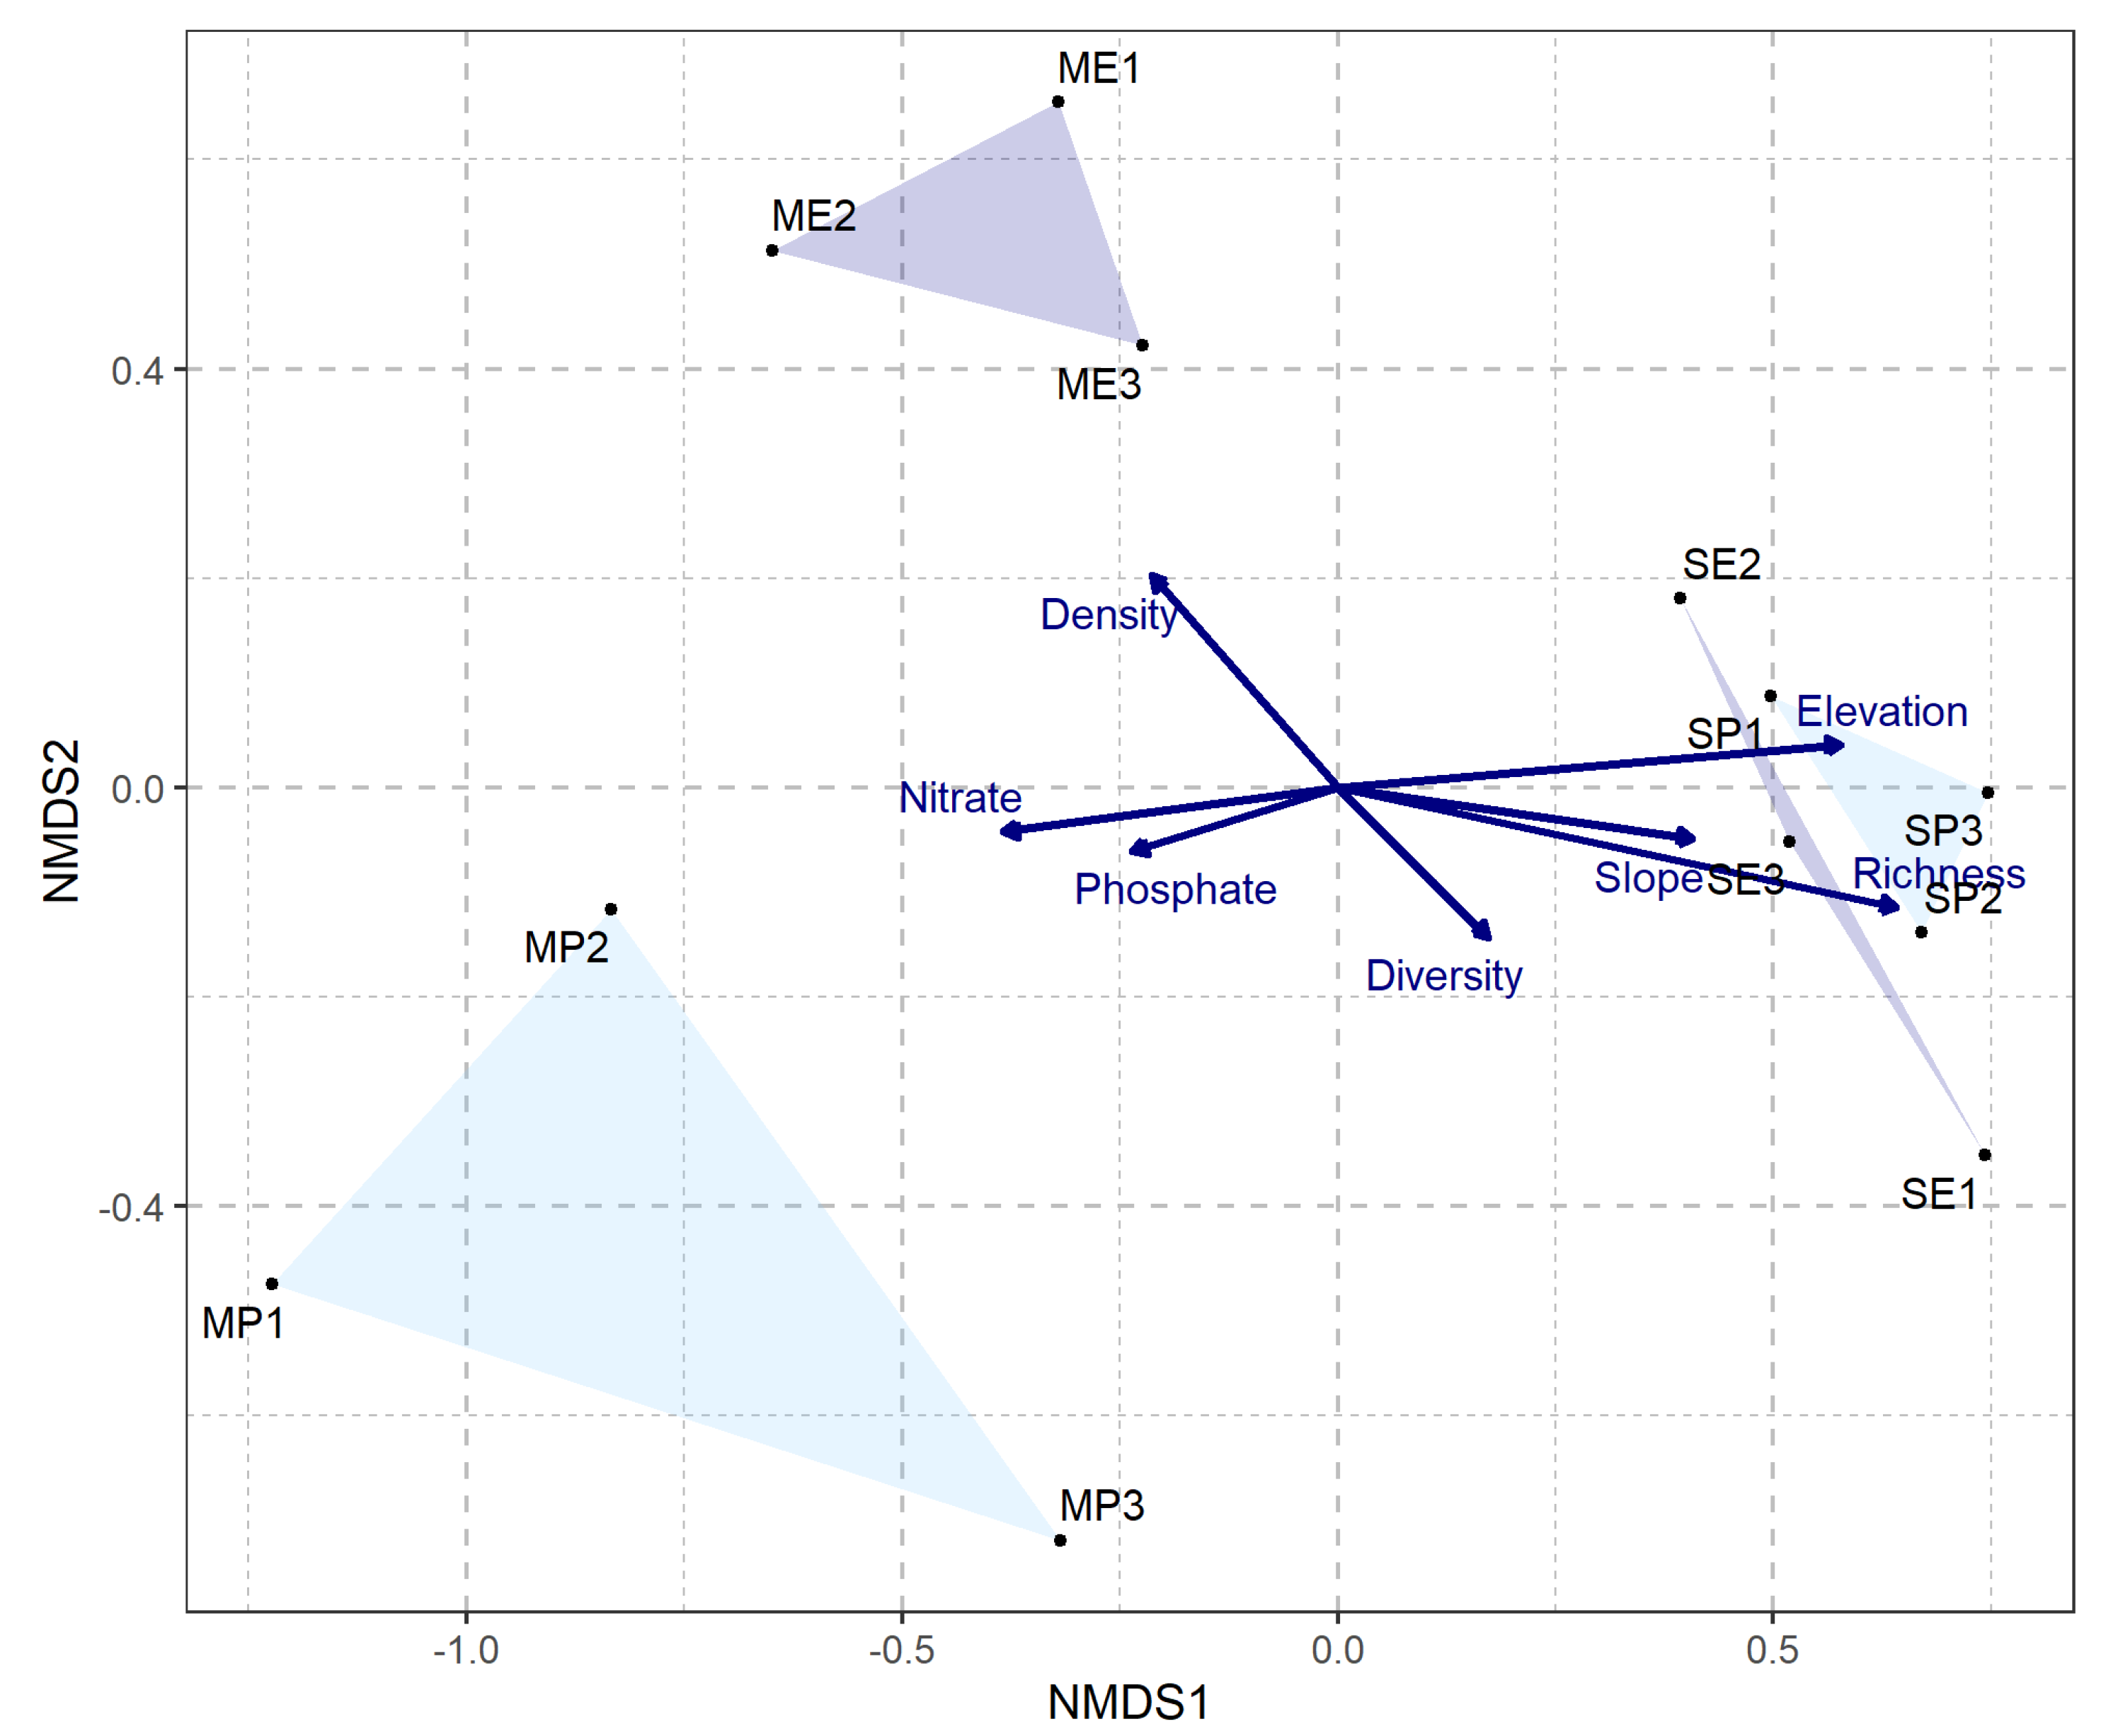
Figure 5.
Species abundance grouped by deer preference within exclosures and outside exclosures at the a) McMaster Forest Nature Preserve and b) SDD study site.
Figure 5.
Species abundance grouped by deer preference within exclosures and outside exclosures at the a) McMaster Forest Nature Preserve and b) SDD study site.
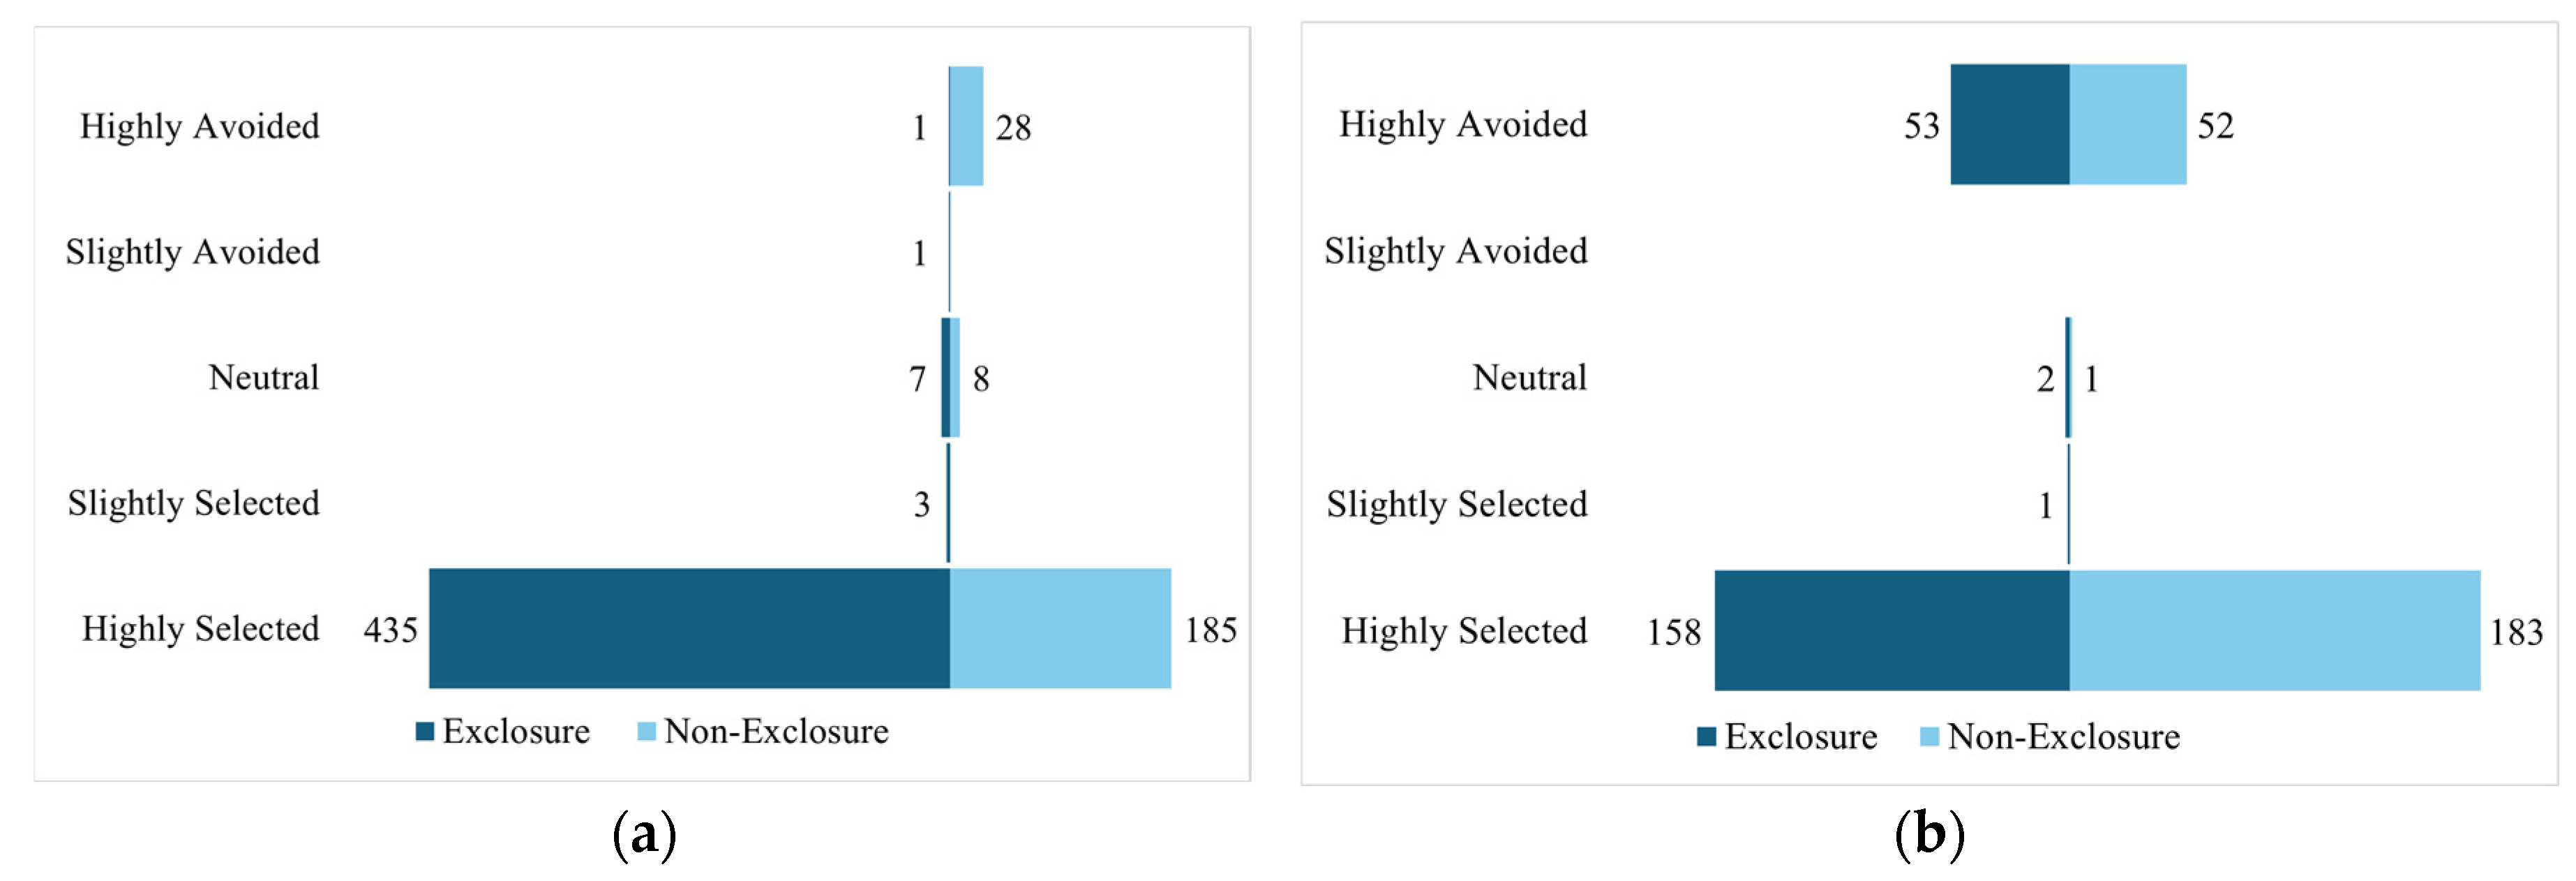
Figure 6.
Combined species abundance curves for exclosures and non-exclosures at both the McMaster and SDD sites.
Figure 6.
Combined species abundance curves for exclosures and non-exclosures at both the McMaster and SDD sites.
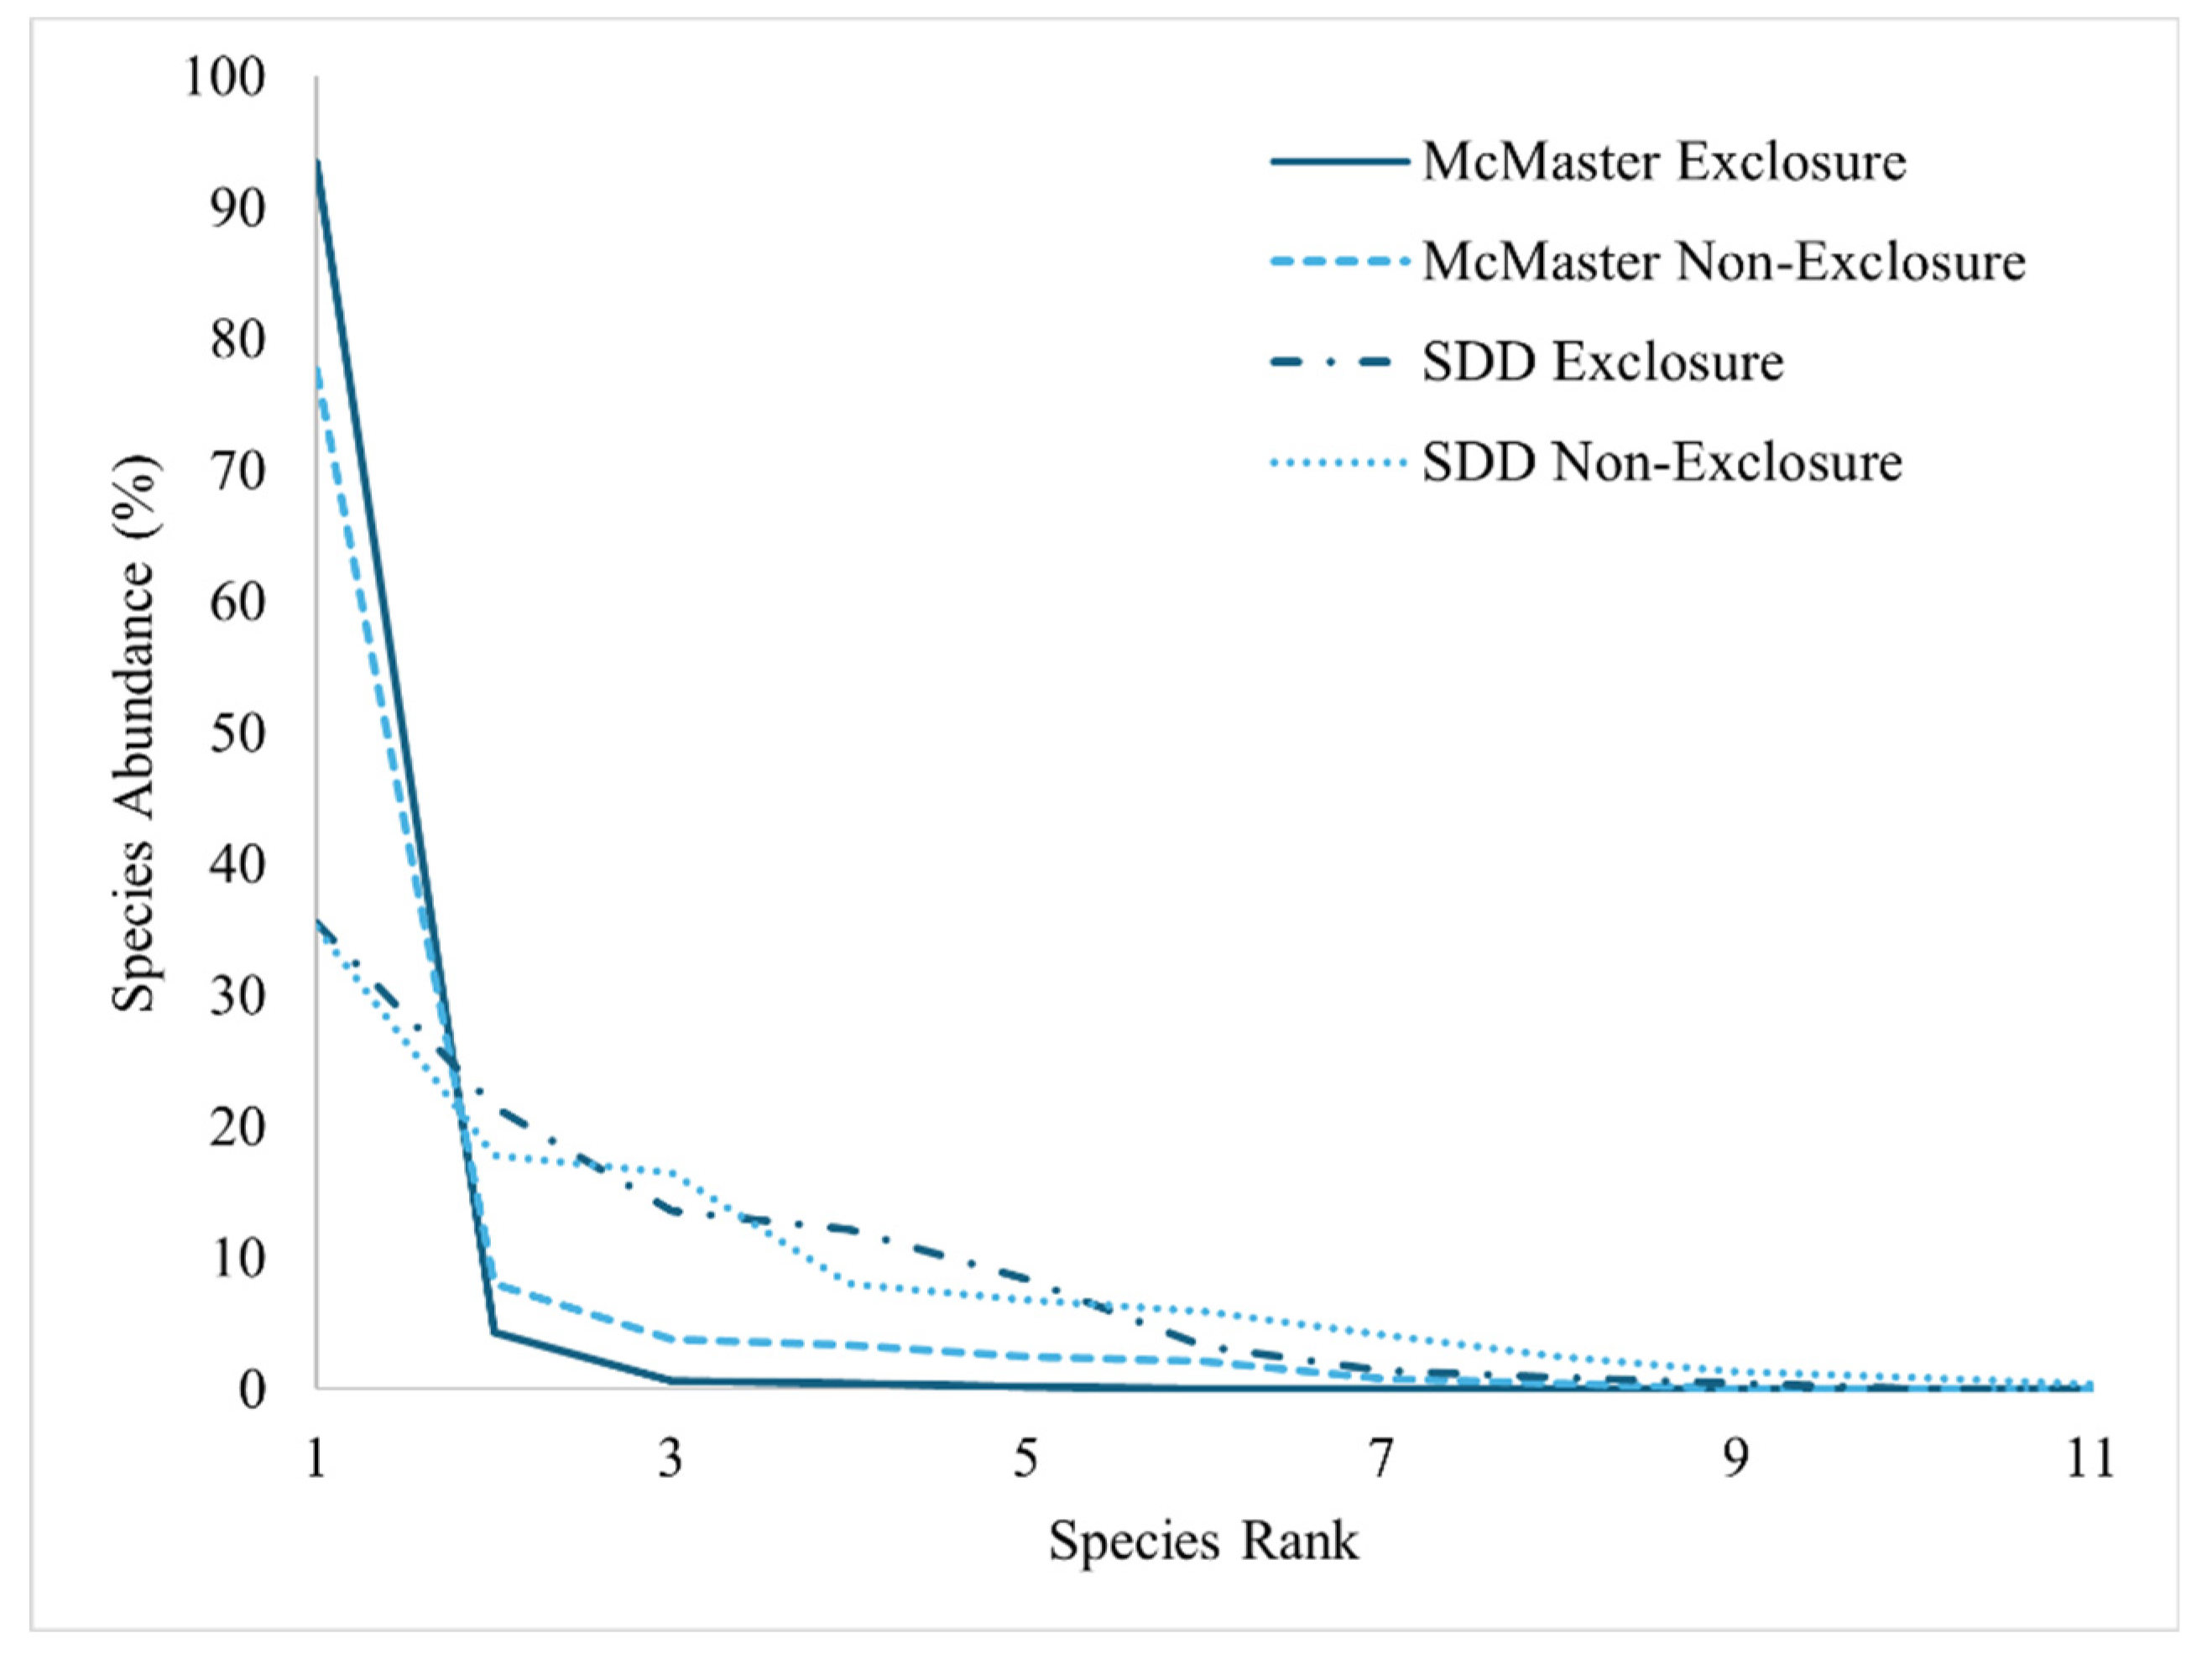
Figure 7.
Butterfly charts comparing the abundance of different woody species between the exclosures and non-exclosures in both a) McMaster and b) Sheelah SDD sites.
Figure 7.
Butterfly charts comparing the abundance of different woody species between the exclosures and non-exclosures in both a) McMaster and b) Sheelah SDD sites.
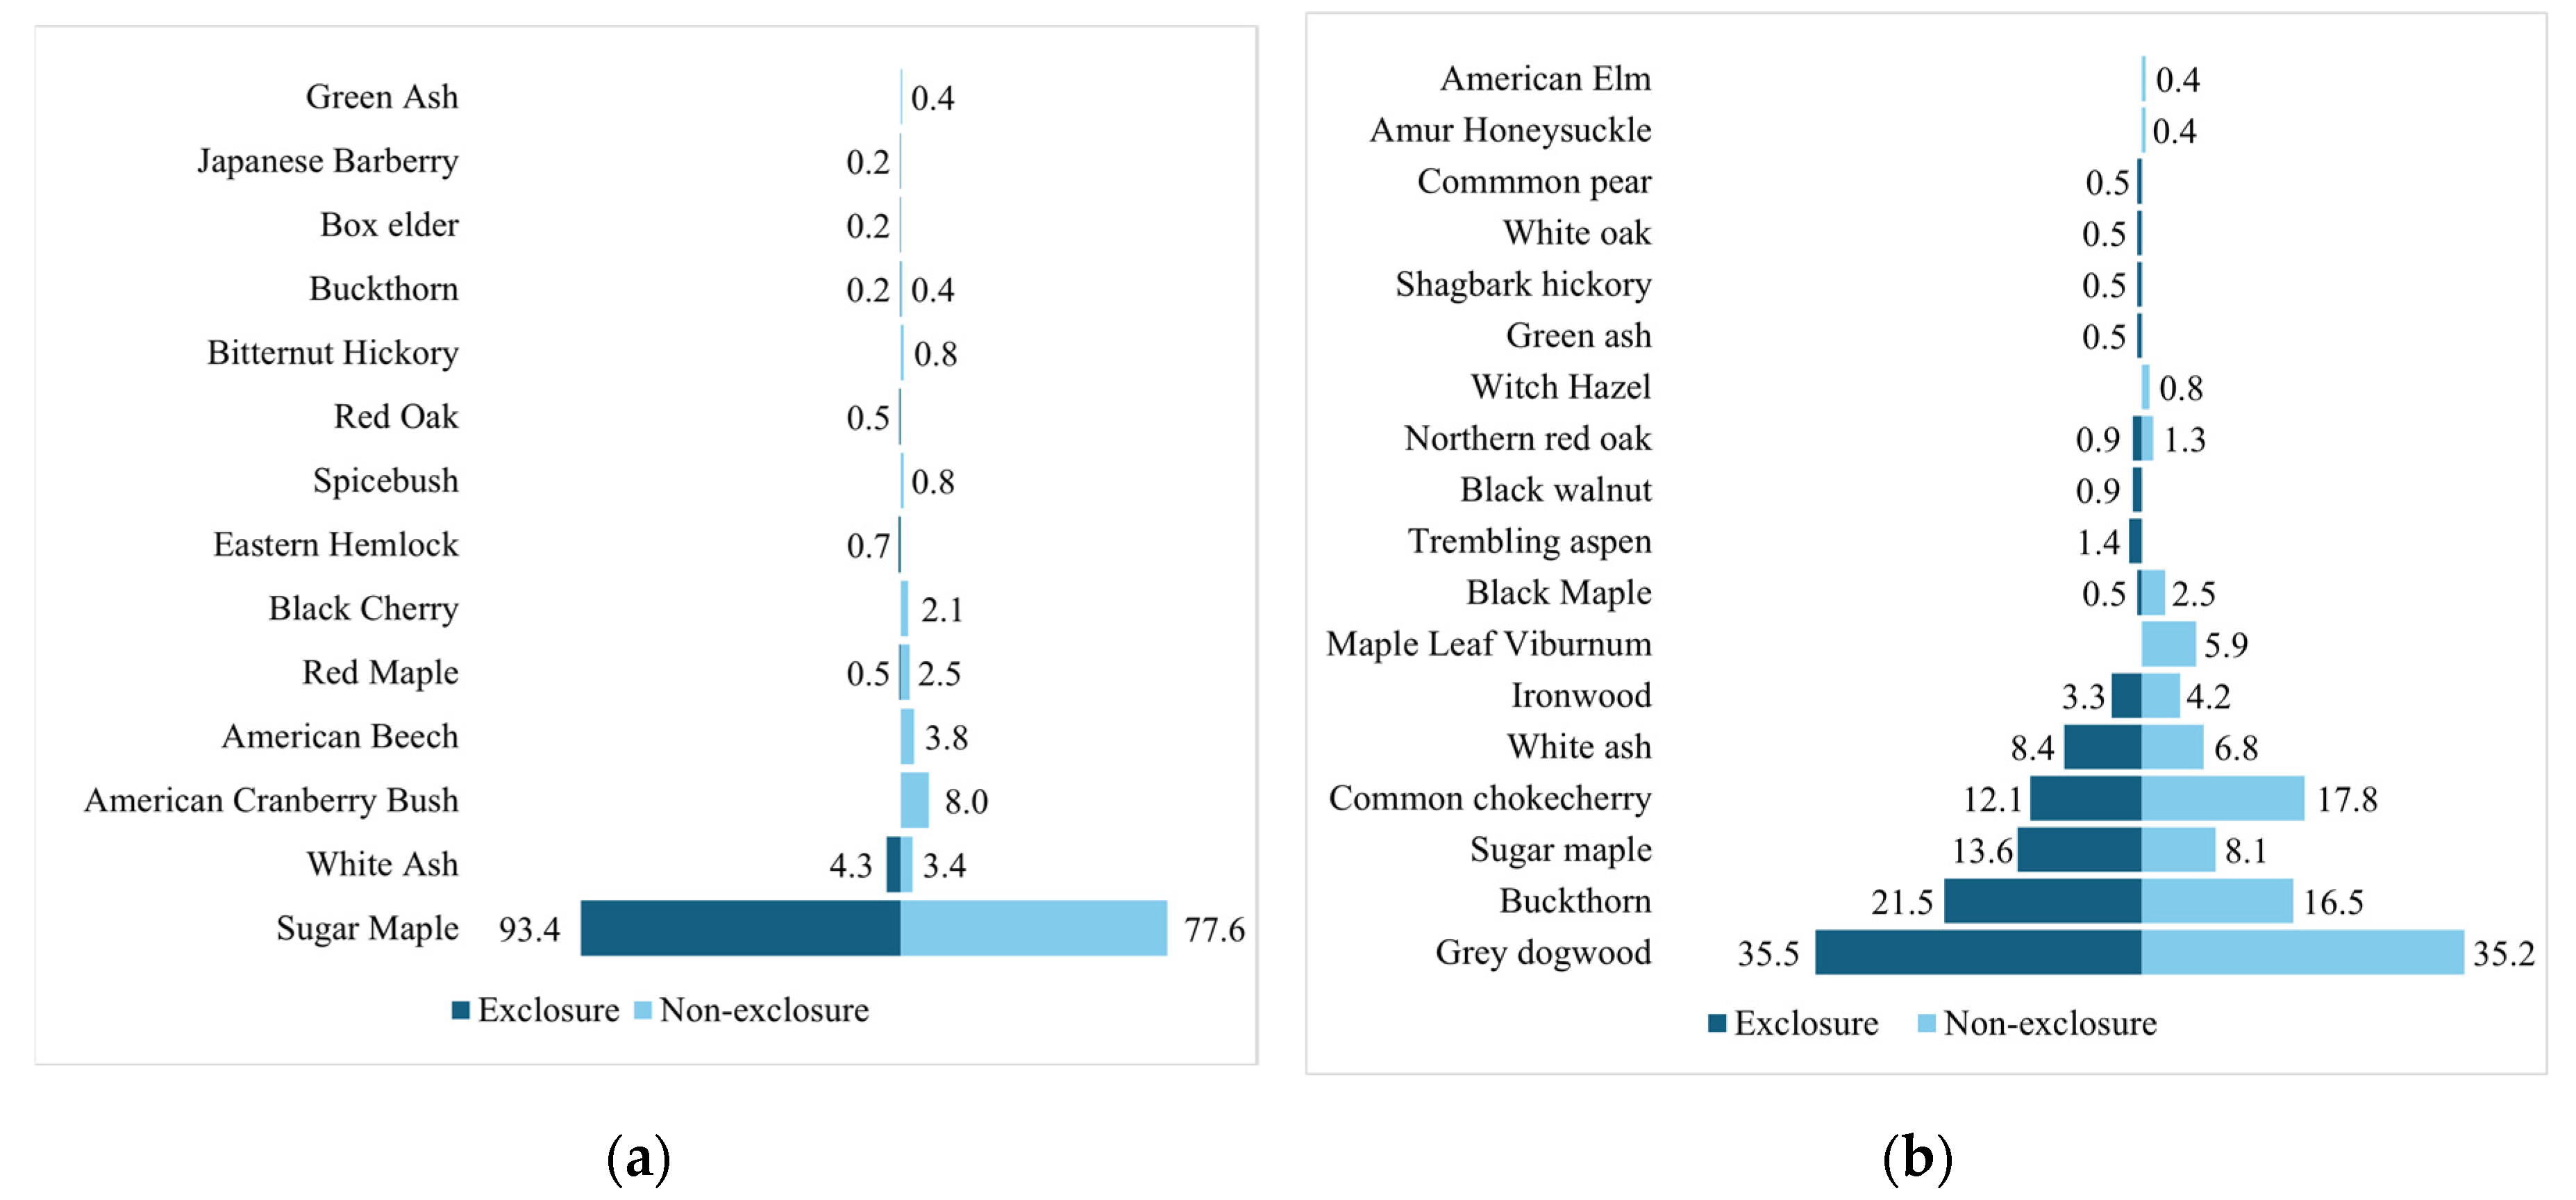
Figure 8.
NMDS Ordination plot showing the species-level clustering at a) McMaster site (p-value = 0.003) and b) SDD site (p-value = 0.001). Each species is represented by its species code (defined in Table S1). Trends in deer preference, species richness, seedling density, elevation, soil organic matter (SOM), soil phosphate, and nitrate content are shown by the arrows in the center. The lightness of each point represents the level of deer preference i.e., lighter blue shows the species is preferred by deer while deeper blue indicate high deer avoidance.
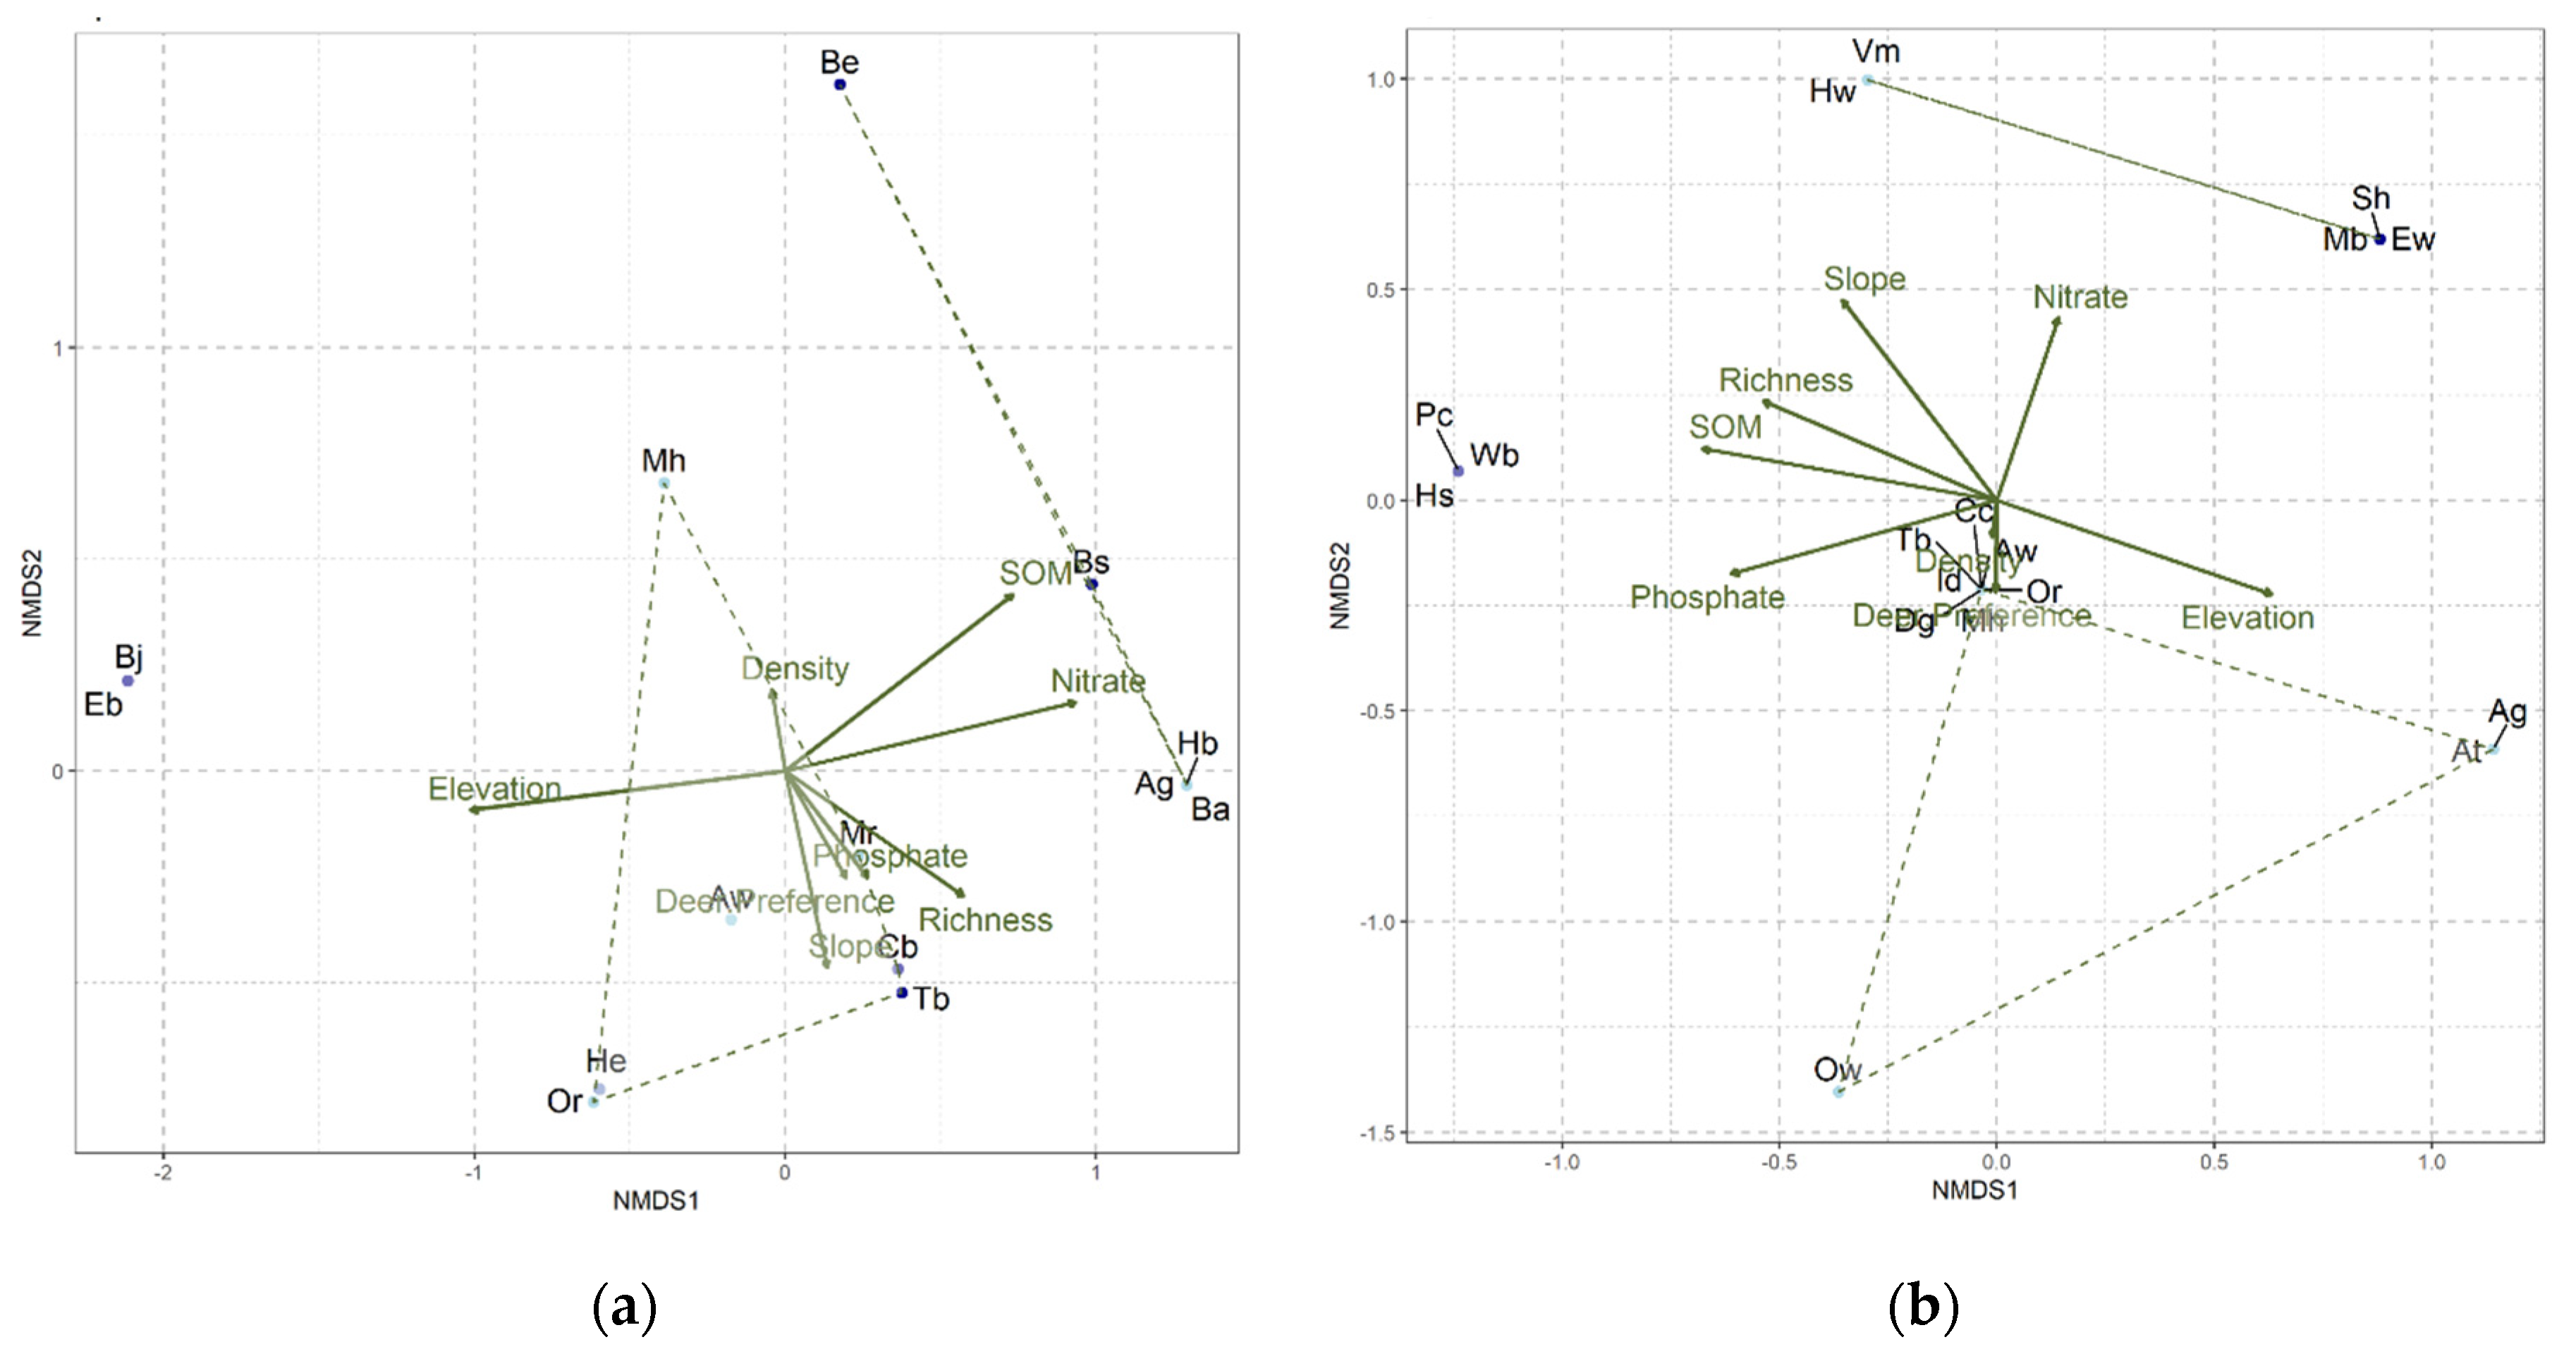
Figure 9.
Percentage of native species, shown as both (a) seedling density and (b) species proportion, in the treatment and control plots at the McMaster and SDD sites.
Figure 9.
Percentage of native species, shown as both (a) seedling density and (b) species proportion, in the treatment and control plots at the McMaster and SDD sites.
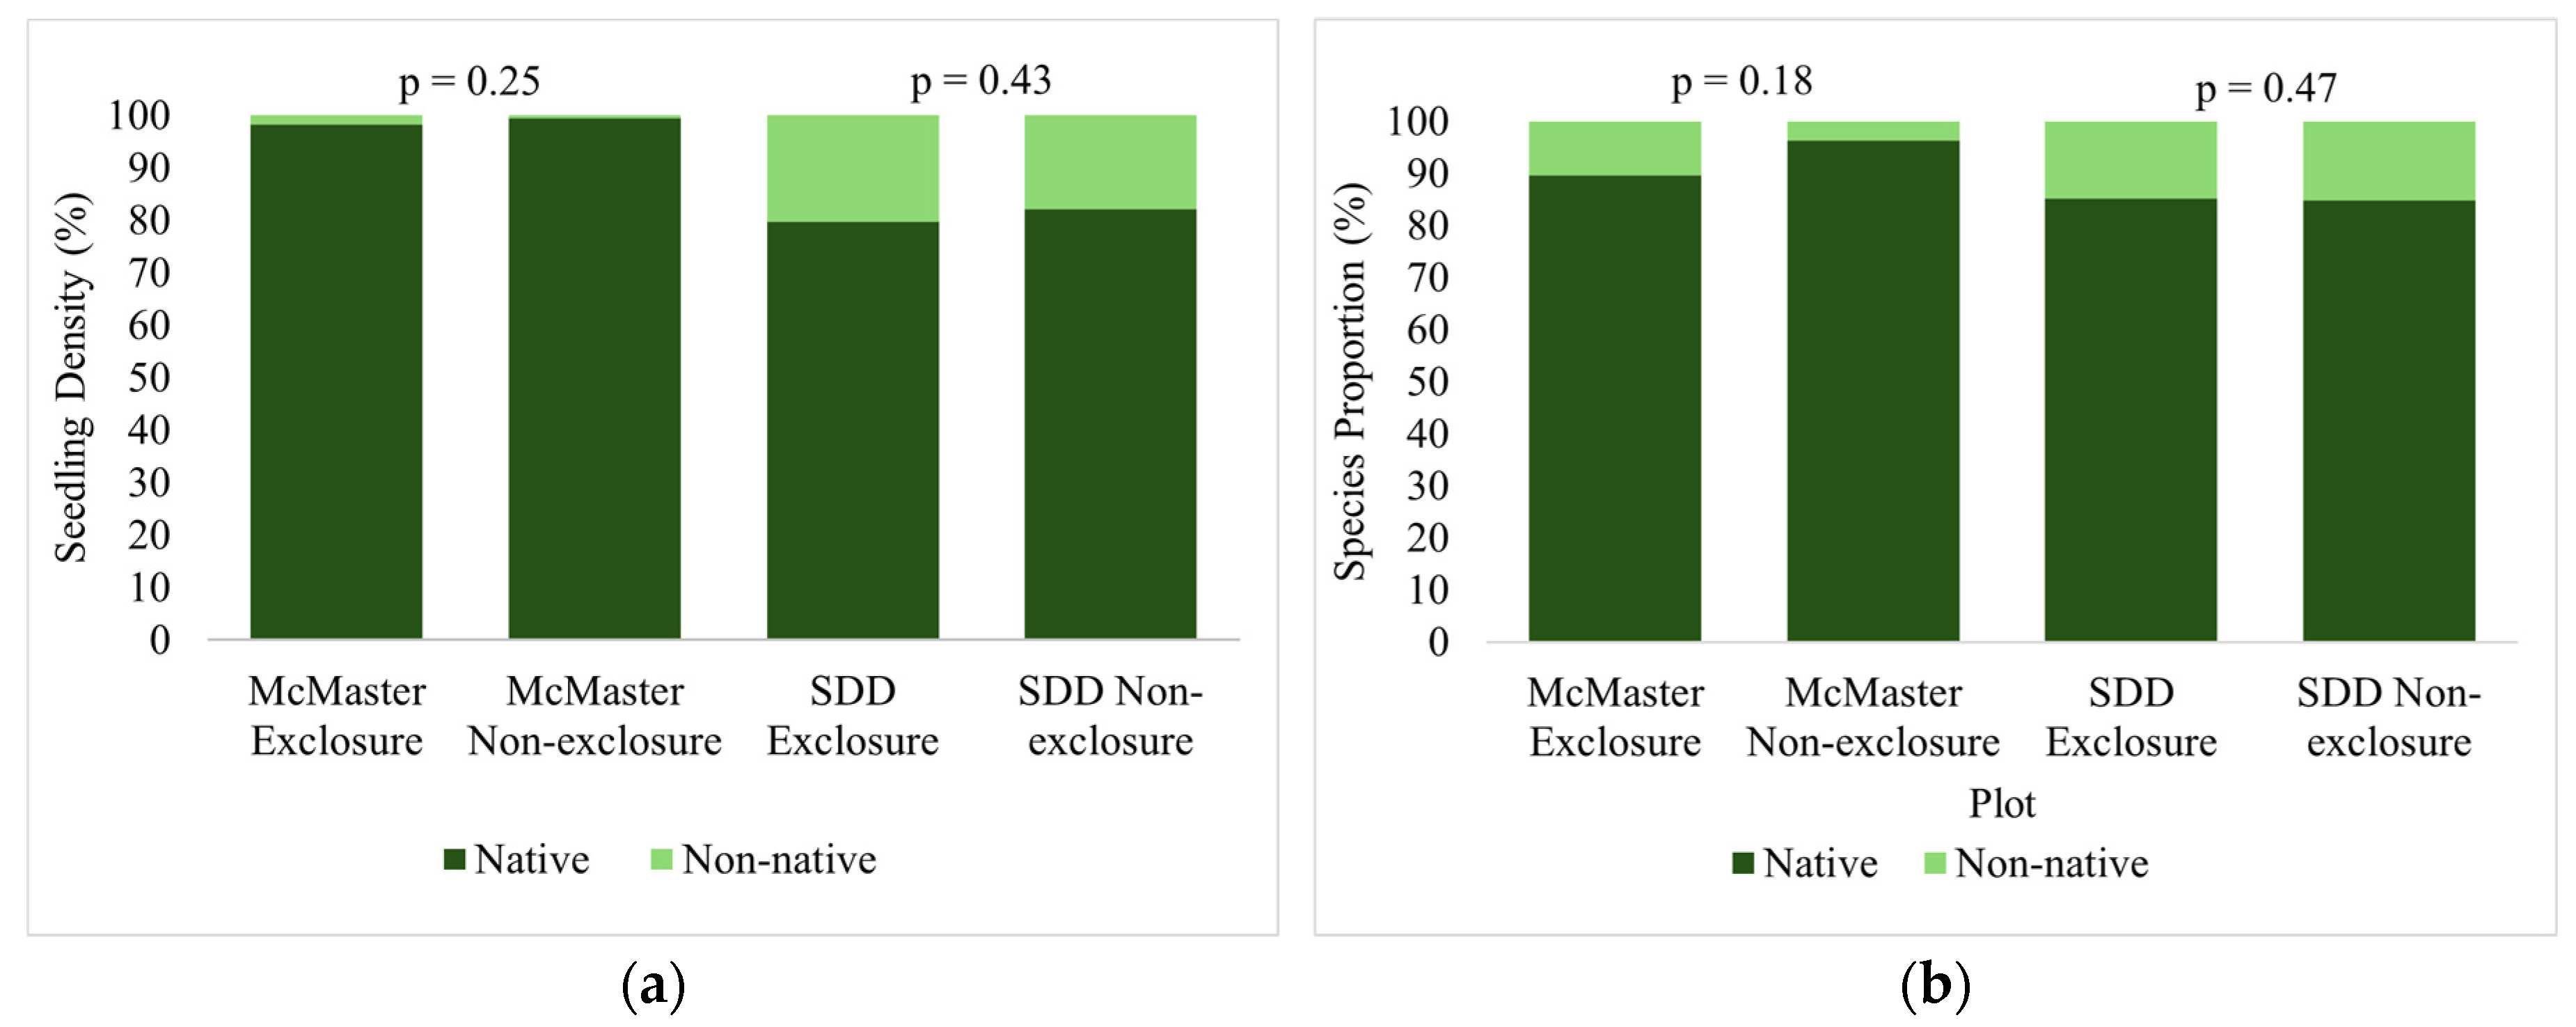
Figure 10.
a. Soil phosphate concentration within and outside of exclosures at the McMaster Forest preserve and SDD sites. b. Soil nitrate concentration within and outside of exclosures at the McMaster Forest preserve and SDD sites. c. Soil organic matter within and outside of exclosures at the McMaster Forest preserve and SDD sites.
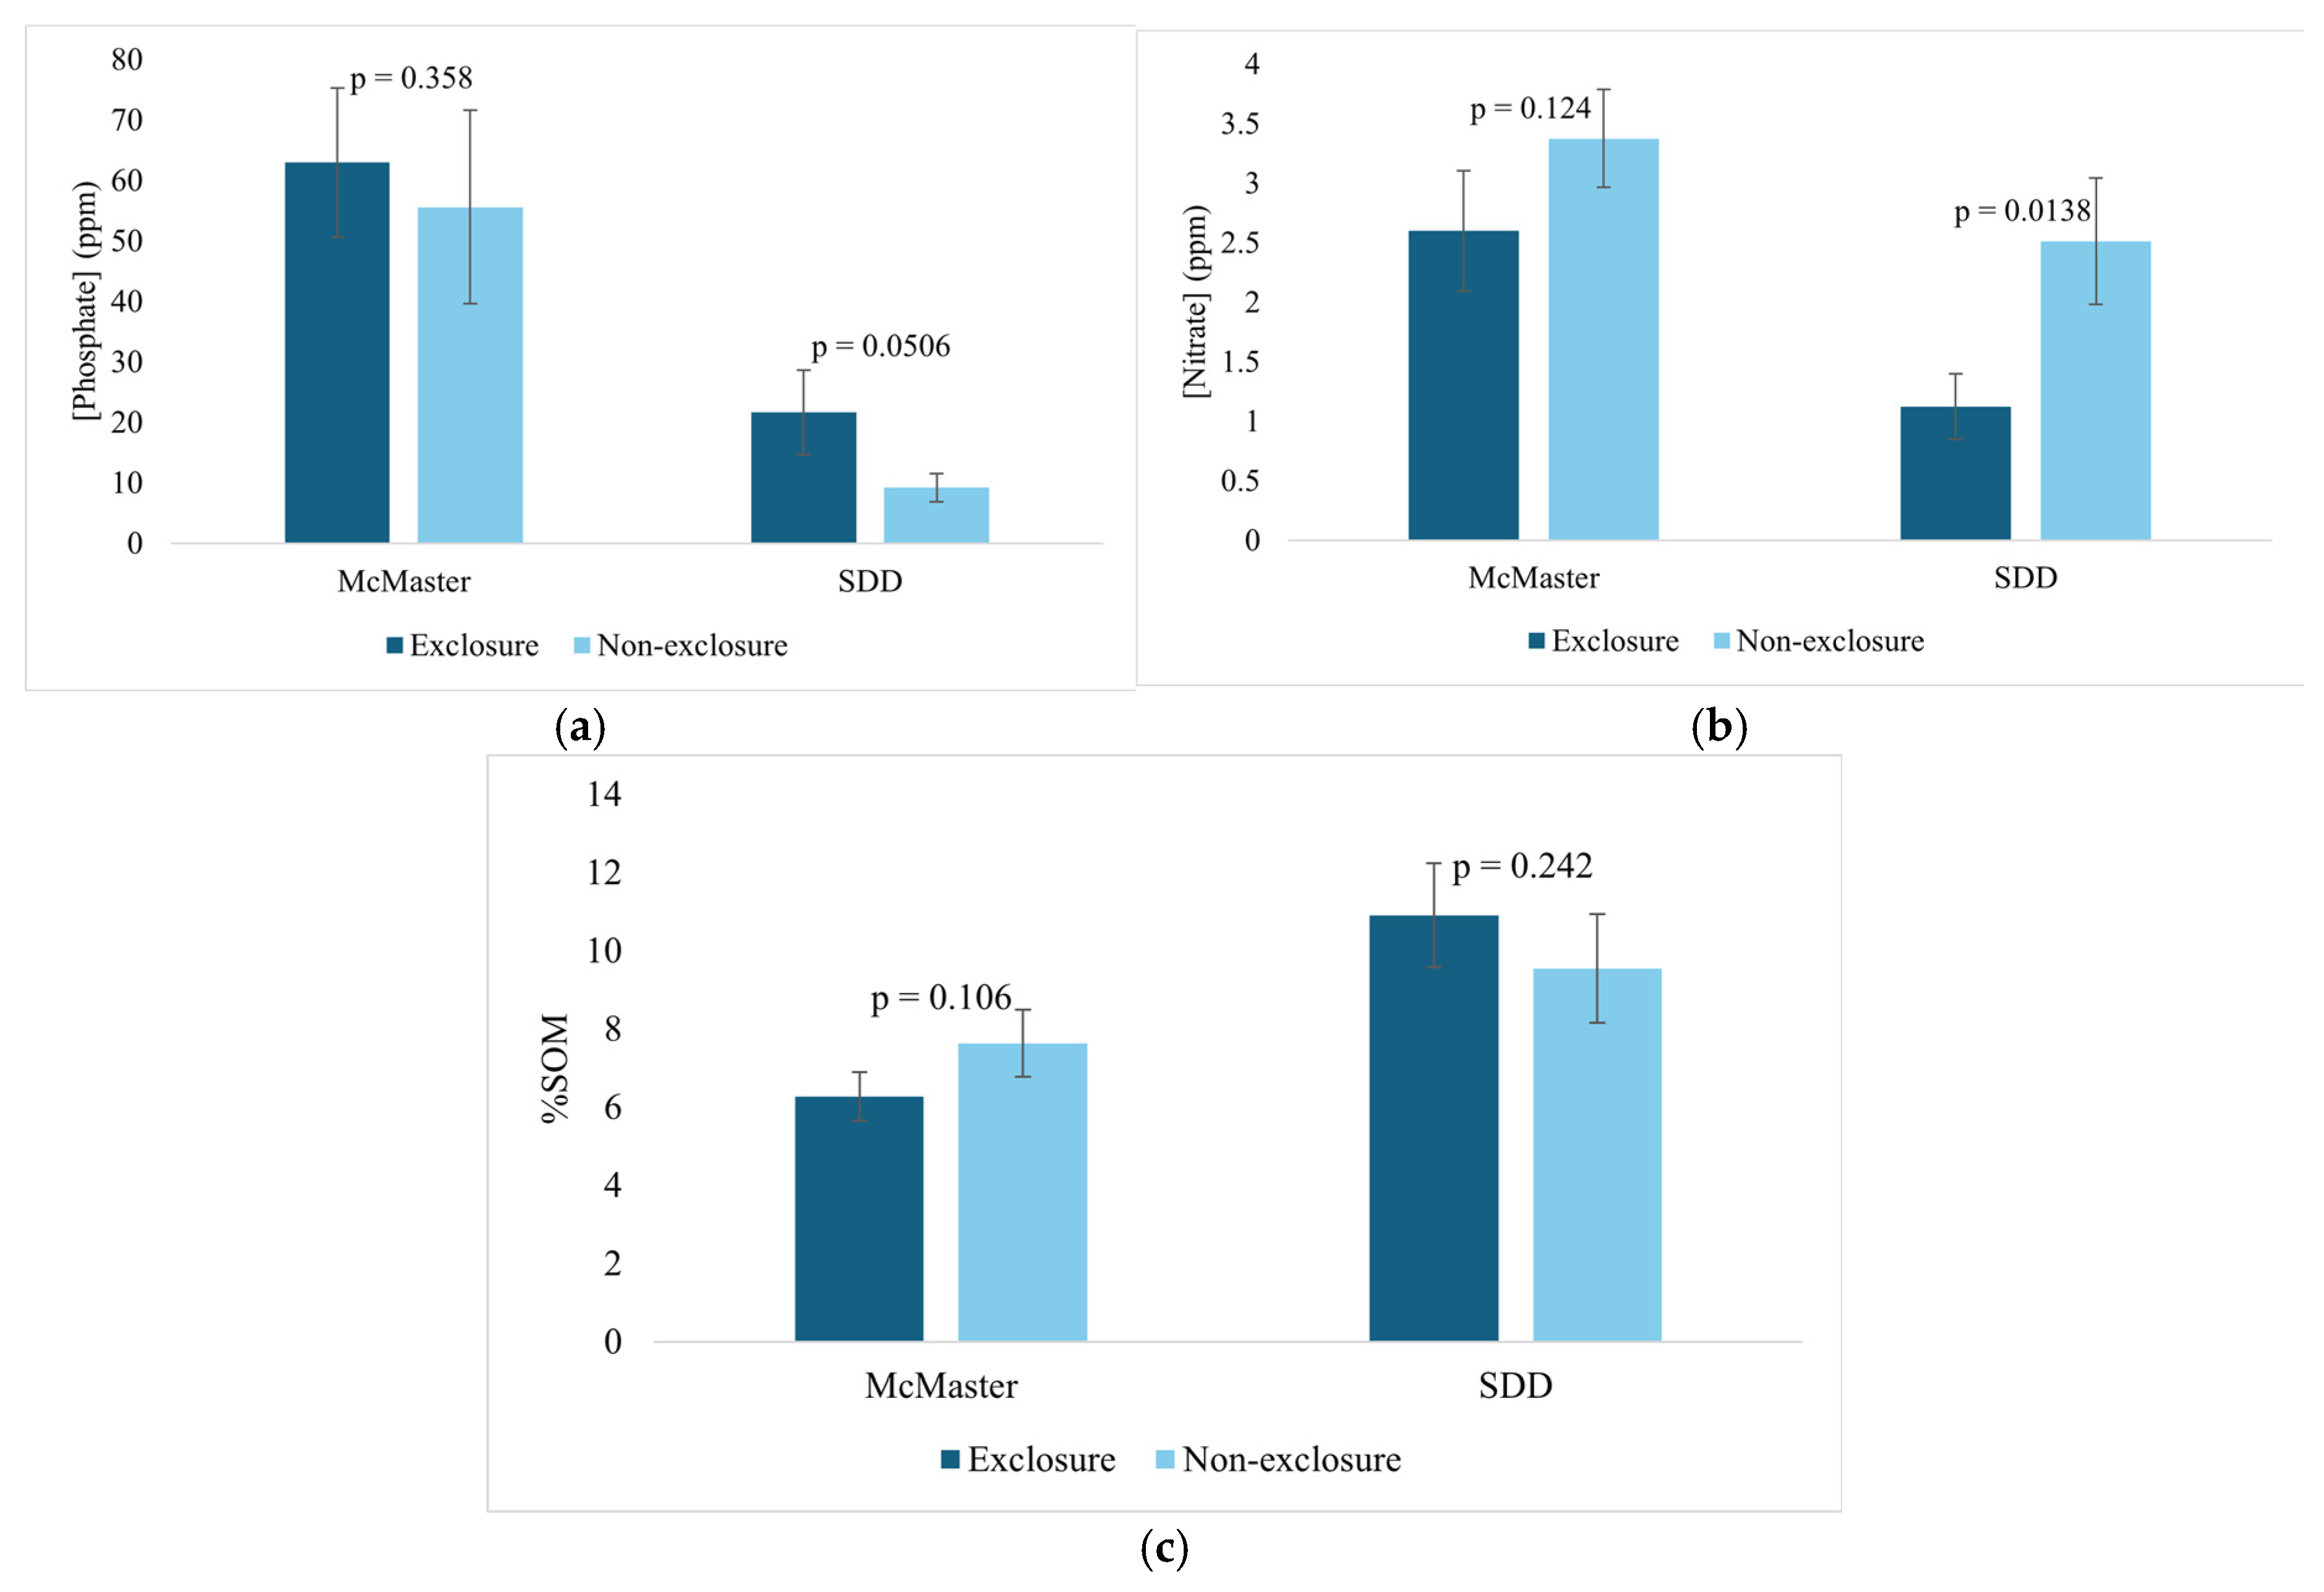
Figure 11.
The proportion of seedlings remaining at the top and base of the mounds over time a), The average number of leaves remaining on seedlings at the top and base of the tip-up mounds over time b), and the proportion of seedlings in different height categories over time c).
Figure 11.
The proportion of seedlings remaining at the top and base of the mounds over time a), The average number of leaves remaining on seedlings at the top and base of the tip-up mounds over time b), and the proportion of seedlings in different height categories over time c).
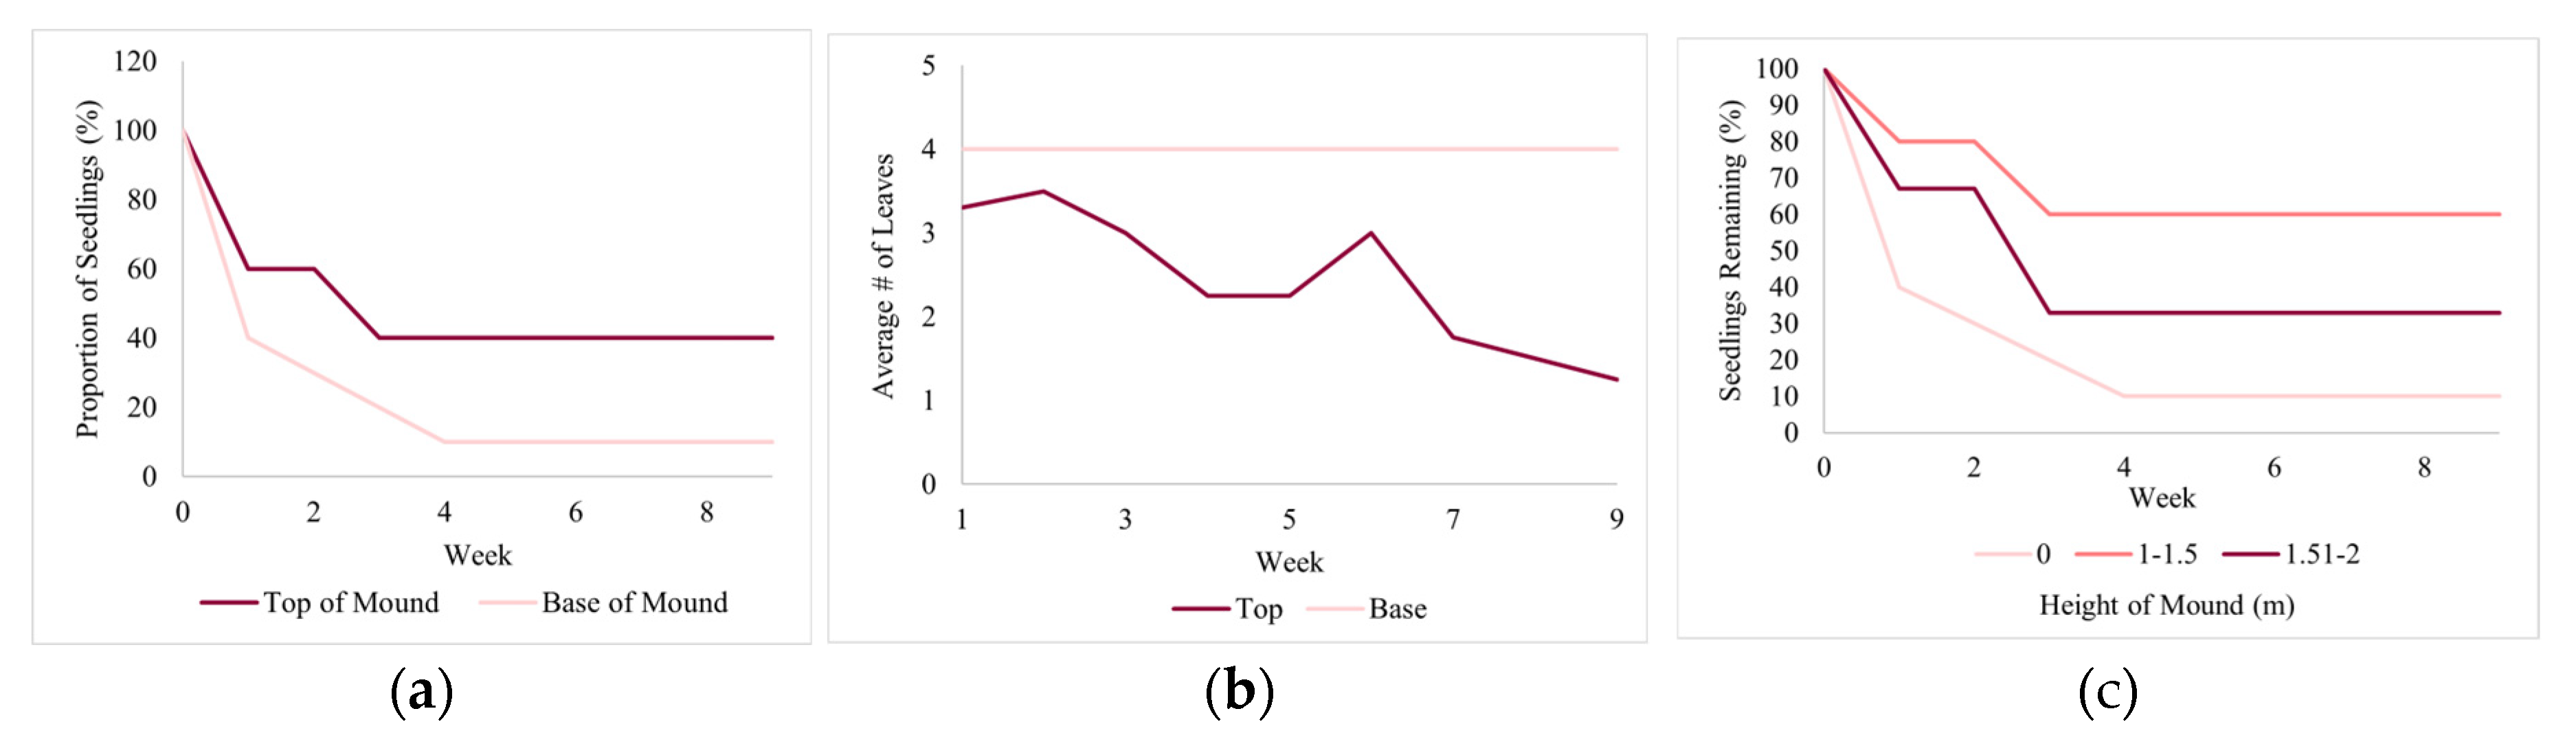
Figure 12.
Vegetation nitrate index and soil nitrate by site and for exclosures and non-exclosures.
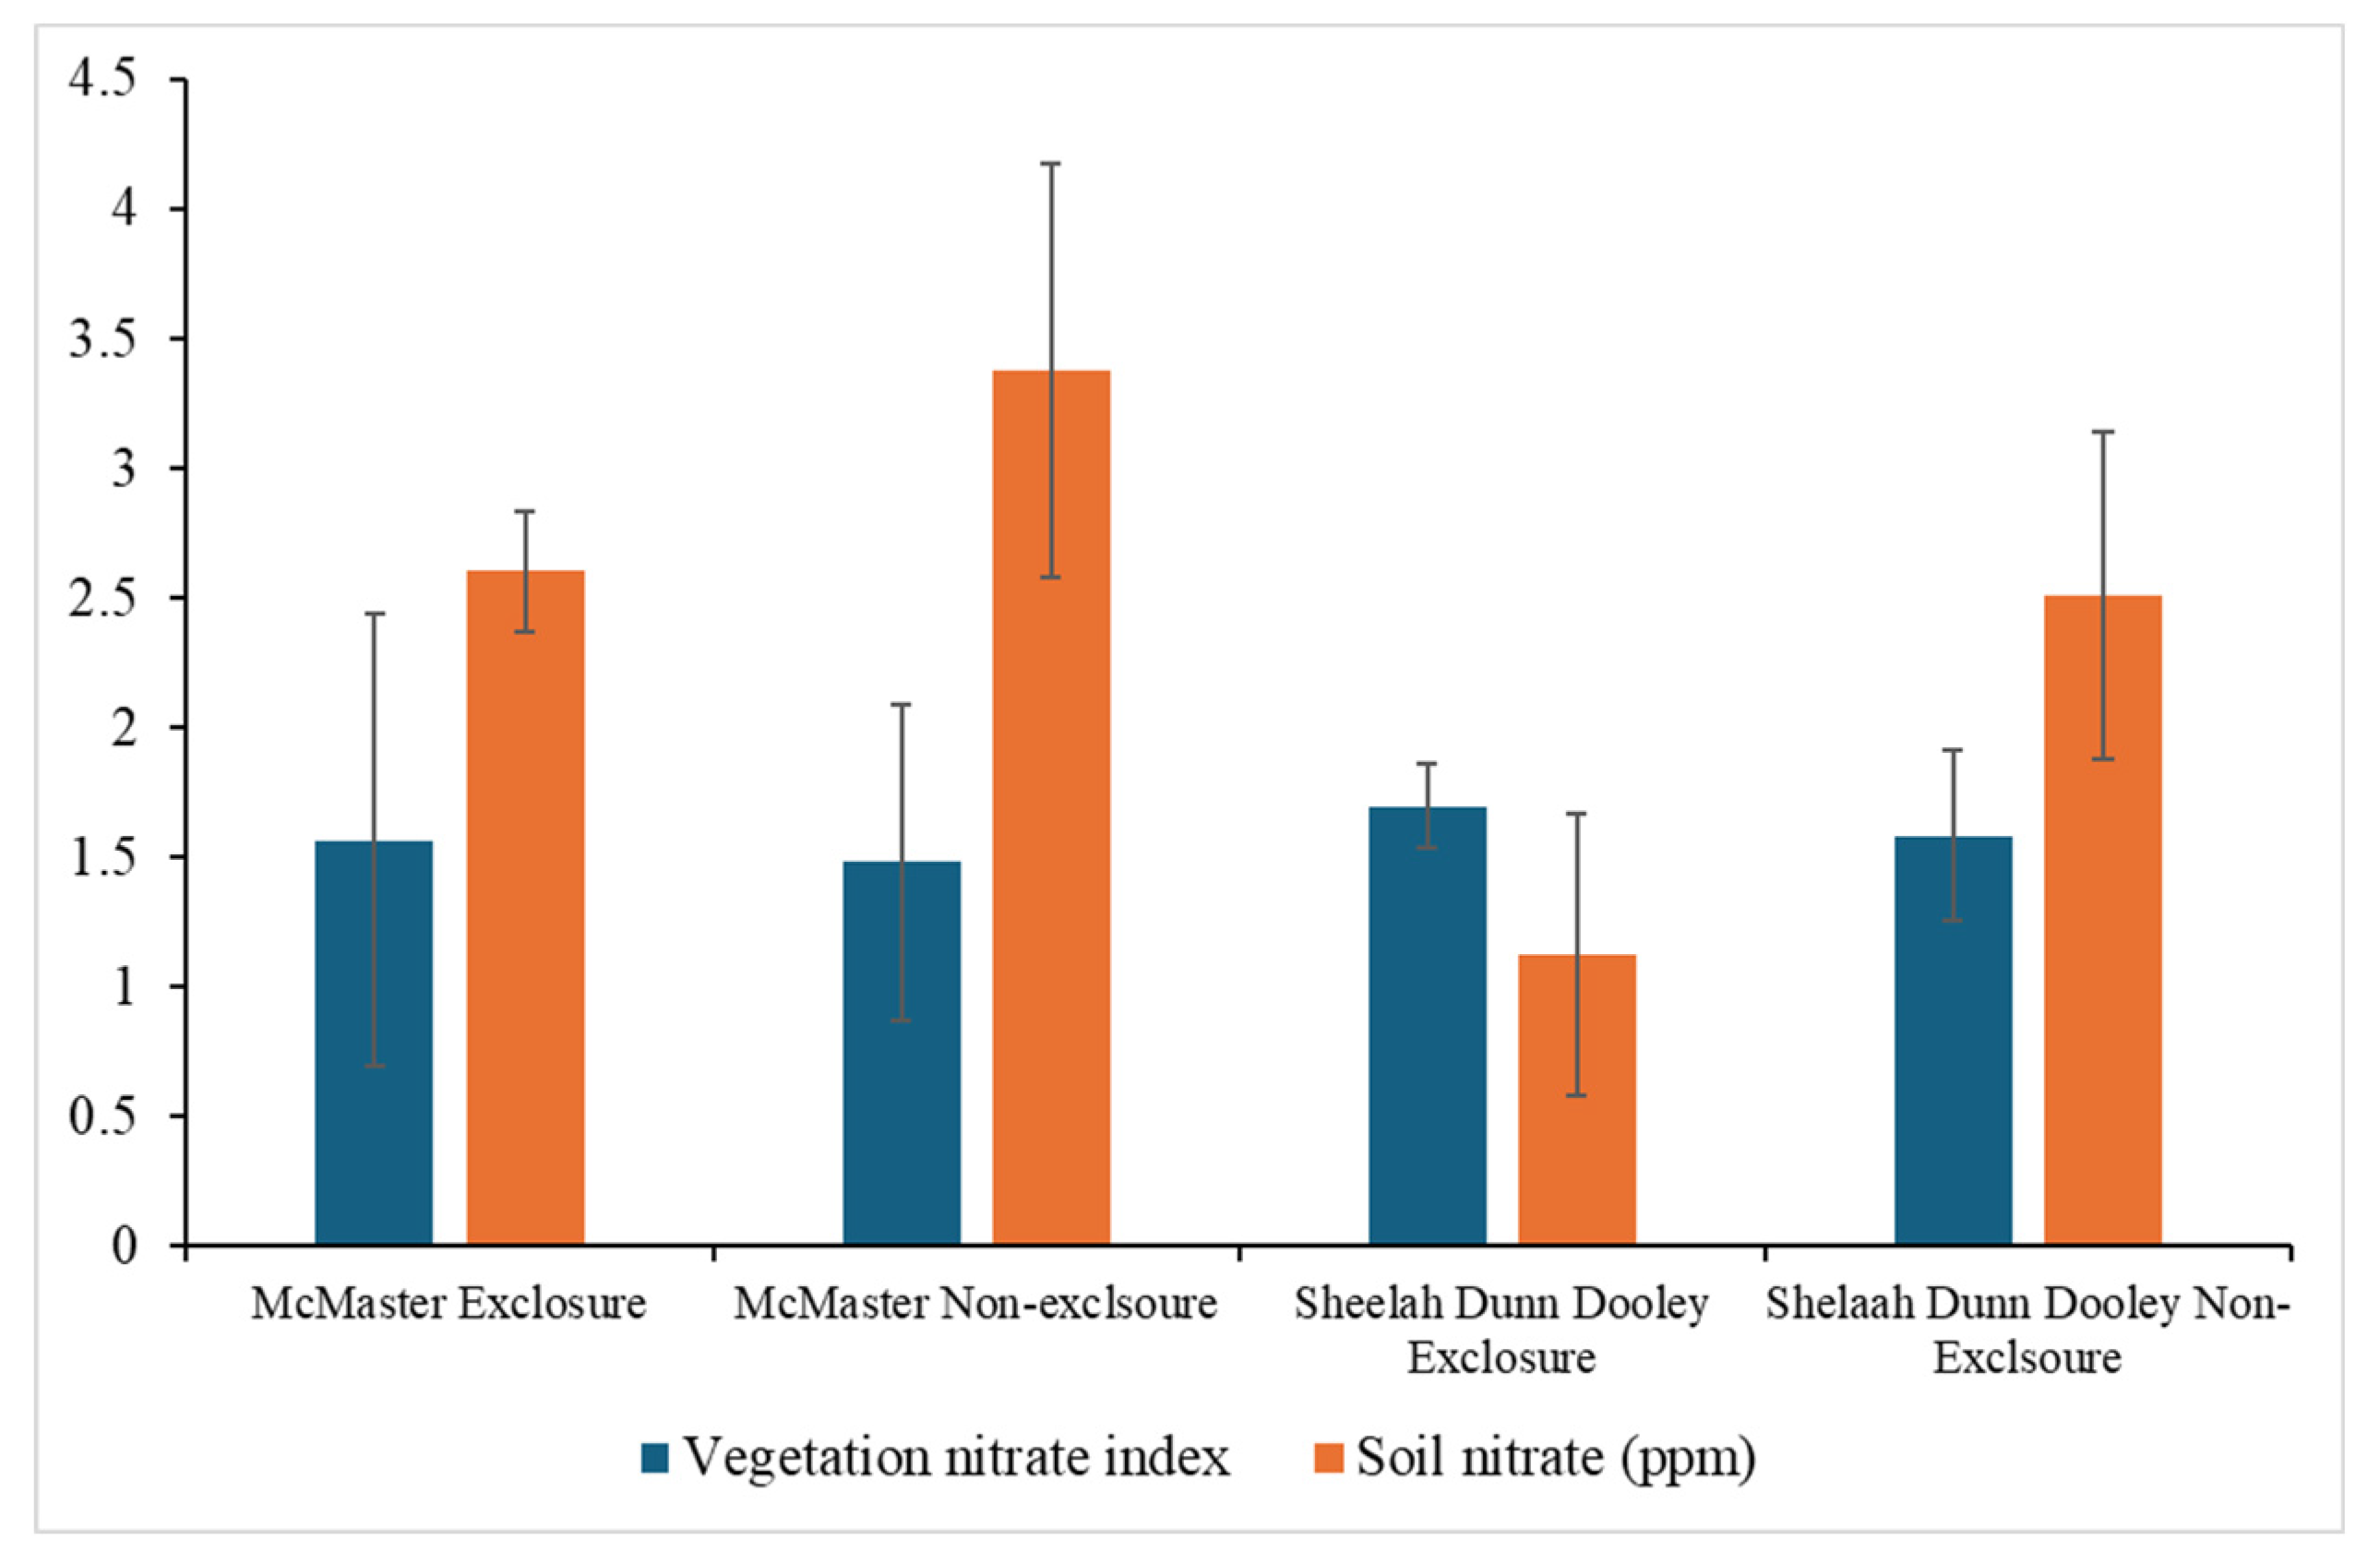

Table 1.
Species richness model fit statistics.
 |
Disclaimer/Publisher’s Note: The statements, opinions and data contained in all publications are solely those of the individual author(s) and contributor(s) and not of MDPI and/or the editor(s). MDPI and/or the editor(s) disclaim responsibility for any injury to people or property resulting from any ideas, methods, instructions or products referred to in the content. |
© 2024 by the authors. Licensee MDPI, Basel, Switzerland. This article is an open access article distributed under the terms and conditions of the Creative Commons Attribution (CC BY) license (http://creativecommons.org/licenses/by/4.0/).
Copyright: This open access article is published under a Creative Commons CC BY 4.0 license, which permit the free download, distribution, and reuse, provided that the author and preprint are cited in any reuse.


