Submitted:
01 November 2024
Posted:
05 November 2024
You are already at the latest version
Abstract
The core principle of investment posits a direct correlation between risk and return. In the language of finance, "risk" refers to the degree of uncertainty or the likelihood of financial loss associated with an investment choice. Conventional wisdom holds that as investment risk escalates, investors expect higher returns as compensation for the increased risk they undertake. Yet, the interplay between risk and return is not always linear or predictable. This study utilized optimization modeling in the options market to investigate the risk-return relationship, focusing on how returns change with different risk levels. Concentrating on the short iron condor strategy, with its capped risk and return, the research aimed to maximize returns within various loss scenarios. This method clarified return levels at different risk thresholds and emphasized the short iron condor strategy's role in delineating the risk-return dynamics. Using 2023 data, research on the 14 most traded US equity and 9 ETF options, with maturities ranging from 5 to 20 days, identified a clear relationship between risk, measured by both maximum loss levels and price fluctuations, and potential returns in short iron condor strategies. While higher maximum loss limits led to larger potential returns, the risk-adjusted returns, expressed as the return-to-risk ratio, declined as risk increased. However, with increased price fluctuations, the potential return actually decreased due to the capped profit potential of the strategy, showing a different dynamic compared to maximum loss risk. Furthermore, longer time to maturity further reduced this ratio, highlighting that both the level of risk and the duration of the position play critical roles in determining returns. These findings emphasize the complex balance between risk and return, and the diminishing marginal benefits of increasing risk and holding periods in short iron condor strategies.
Keywords:
Risk-return relationship
; optimization modeling
; options market
; short iron condor strategy
1. Introduction
Evaluating investment opportunities necessitates balancing risk against reward. It's widely recognized in investment decision-making that as the level of risk associated with an investment increase, investors demand a proportionately higher return to compensate for the added risk. However, the relationship between risk and return is not always simple or linear. This fundamental principle in finance enables investors to make informed decisions about how to allocate their capital. By leveraging the risk-return relationship, the viability of various investment options can be assessed. For example, when comparing two investments with similar expected returns, the one with a lower level of risk is generally considered more appealing. Similarly, when two investments have comparable levels of risk, the one offering a higher expected return is viewed as a more favorable alternative. The risk-return relationship can be used to evaluate the potential of investments across different asset classes, such as stocks, bonds, real estate, and commodities. Another essential aspect for investors is to ascertain the level of risk they are prepared to accept and the duration they are willing to endure it within a specific investment vehicle. This research aims to address these concerns through the application of the short iron condor strategy in stock and ETF options, offering an environment with limited risk and return.
Options are financial derivatives that serve as a flexible and multifaceted tool for investors. They enable investors to customize their investments, generate revenue, safeguard their portfolios, broaden their investment scope, and effectively manage risk. Particularly, options are instrumental in risk management, empowering investors to make well-informed decisions and potentially circumvent substantial losses. Through the strategic use of options to set their maximum potential loss, investors can enhance their risk management capabilities, confidently navigating the intricate and constantly evolving financial landscape.
The iron condor strategy, employed in this study, involves simultaneously maintaining a bull put spread and a bear call spread. This strategy involves selling an out-of-the-money put and purchasing a lower strike out-of-the-money put to establish a bull put spread, as well as selling an out-of-the-money call and buying a higher strike out-of-the-money call to form a bear call spread. All involved options share the same expiration date and are derived from the same underlying asset. Generally, the width of the spread is identical for both the put and call components. This approach yields a net premium and aims to capitalize on stocks characterized by low volatility. The iron condor strategy, with its capped risk and return framework, allows for the optimization of maximum return through various maximum loss level constraints. This enables a comprehensive understanding of achievable returns at different levels of risk.
This study aimed to dissect the relationship between risk and return within the options market, employing optimization modeling to specifically investigate several key questions: Do maximized return levels increase with escalating risk? How does the return per unit of risk (the return-to-risk ratio) evolve? And how do increasing maturity periods affect the return-to-risk ratios? Focusing on the short iron condor strategy, characterized by its capped risk and return, the research endeavors to optimize returns across diverse loss scenarios. This analytical method was applied to highlight the changes in return levels across various risk thresholds, thereby emphasizing the critical role of the short iron condor strategy in decoding the complex dynamics between risk and returns. Using 2023 data, the study examined the 23 most actively traded US equity and ETF options, with maturities ranging from 5 to 20 days, to offer profound insights into the interplay of risk and return in the stock options market, addressing the aforementioned questions.
The primary contribution of this study is to show that, in the Short Iron Condor option strategy, increasing risk levels through higher maximum loss values leads to a corresponding rise in potential returns. However, the return-to-risk ratio declines significantly as risk increases, indicating that higher risk does not result in a proportional increase in returns. Additionally, increased price fluctuations further reduce potential returns due to the strategy’s capped profit potential, which behaves differently compared to the impact of maximum loss risk. The study also highlights that extending maturity periods further lowers the return-to-risk ratio.
The article is organized into six sections. Related Work provides an overview of existing literature on the risk-return trade-off, focusing on both stock markets and options strategies. Methodology details the comprehensive explanation of the optimization model applied on Short Iron Condor strategy, including modelling parameters, constraints, and the objective function. The Dataset & Experimental Design section provides an overview of the assets analyzed. It also outlines the setup and evaluation process, detailing the inputs such as loss limits, price risk levels, and maturity periods, as well as the outputs, including metrics like ROI. The Findings and Results section presents the study’s outcomes, using tables and figures to support the research objectives and linking the results back to the hypotheses. Finally, the Conclusion highlights the study’s practical contributions to the field and outlines directions for future research.
2. Related Work
The interplay between risk and return is pivotal in finance, thoroughly explored since Markowitz's foundational portfolio theory in 1959, coined by Markowitz (1991). This led to Sharpe, Lintner, and Mossin's development of the mean-variance capital asset pricing model in the mid-1960s, establishing the theoretical basis for a positive risk-return correlation—that is, expecting higher returns from higher risks.
Empirical studies on this relationship, however, present a varied picture. Research continues to explore the risk-return trade-off across different times and markets, employing a range of asset-pricing models and estimation methods.
Among the studies supporting a positive correlation, Bali and Peng (2006) found a significant link between risk and return in the aggregate stock market using high-frequency data. Ghysels et al. (2005) examined the ICAPM's intertemporal dynamics between stock market's conditional mean and variance, introducing the Mixed Data Sampling (MIDAS) method for forecasting monthly variance using past daily squared returns. Yu and Yuan (2011) showed the influence of investor sentiment on the market's mean–variance tradeoff. They found that the stock market's expected excess return is positively related to the market's conditional variance in low-sentiment periods but unrelated to variance in high-sentiment periods. Chiang et al. (2015) confirmed this positive correlation in Chinese equity markets through a TARCH-M model, highlighting that stock returns increase with predictable volatility. Their work also connects higher stock returns to greater downside risk, factoring in market sentiment and liquidity. Wang et al. (2021) studied risk-return tradeoff based on returns from 28 countries, covering a wide range of advanced and emerging markets. They presented evidence that a substantial amount of time variation in expected returns is determined by a positive risk-return tradeoff.
Numerous studies have highlighted evidence of a negative relationship between risk and return. (French et al. 1987; Campbell and Hentschel 1992; Bekaert and Wu 2000) have proposed that the asymmetrical return-volatility relationship stems from the volatility feedback effect. According to their theory, an anticipated increase in volatility leads to higher expected equity returns, causing stock prices to fall to reflect the heightened risk. Ang et al. (2009) have identified a strong negative correlation between past idiosyncratic volatility and future returns. Abdymomunov et al. (2016) have examined the intraday asymmetric relationship between returns and volatility, analyzing this relationship at various points in the conditional distribution of volatility changes. They found that the relationship between return and volatility is not consistent across different parts of the distribution of volatility changes, with the impact of return shocks being more pronounced at the tails of the conditional distribution. Brandt and Kang (2004) have employed a flexible statistical framework to model the conditional mean and volatility of stock returns as a latent VAR (vector autoregression) process. This approach allowed them to explore the contemporaneous and intertemporal relationships between returns and volatility without depending on external predictors. Their findings revealed a strong and stable negative correlation between the innovations to the conditional moments, leading to a marked countercyclical variation in the Sharpe ratio.
The literature on the risk-return tradeoff has predominantly focused on stock markets, with limited attention given to options strategies have been studied respectively by (Bauer et al. 2009; Goltz and Lai 2009; Sheu and Wei 2011). Although some studies have explored the relationship between risk and return in covered call strategies by (Board et al. 2000; Niblock and Sinnewe 2018) research into straddle by (Hui et al. 2008; Broadie et al. 2007; Kongsilp and Mateus 2017) strangle via Hong et al. (2018) and butterfly strategies with (Grieves 1999; Goldberg and Veitch 2010) remains sparse. Moreover, existing studies comparing the risk and return of straddle and strangle strategies have produced contradictory results and offered limited insights into the comparative risk-return trade-off relations of options strategies have been focused on by (Bruder and Gaussel 2011).
In a more recent study, Shivaprasad et al. (2022) [25] have analyzed the risk-return dynamics of straddle, strangle, and butterfly option strategies through panel data analysis. This research indicated that while risks associated with butterfly strategies did not affect their payoffs, short straddle and strangle strategies were negatively impacted by risks but still managed to generate excess returns. In contrast, long straddle and strangle strategies experienced positive effects from risks on their payoffs, although option premiums had a negative impact.
Considering the existing body of scholarly work, our research adds valuable insights into the risk-return dynamic in the options market by offering a fresh exploration of the short iron condor strategy—a topic that has been relatively underexplored in the current literature. Our study is distinguished by its use of optimization modeling to investigate the maximization of returns under capped risk conditions, an approach not previously undertaken in the field. By utilizing current data, this research contributes new insights into risk-adjusted returns and the relationship between risk levels and investment durations. While previous studies have not extensively explored the combination of optimization modeling with capped risk-return strategies, this study offers a unique approach. Through a careful and methodical analysis, it provides valuable findings that enhance both academic understanding and practical applications in options trading strategies.
3. Methodology
This section outlines the core components of our methodology, starting with the optimization model framework, which is pivotal to our analysis. The process begins by defining the key variables, parameters, and constraints utilized within the model, ensuring a clear understanding of their respective roles and importance. The model has been constructed as a Mixed Integer Programming (MIP) model, adhering to the principles outlined below.
Before delving into the details of the model, let’s briefly explain the Short Iron Condor strategy. The Short Iron Condor is constructed by taking four different option positions on the same underlying asset, using varying strike prices. This strategy is based on a single asset or stock, not multiple assets Hull (2009).
The Short Iron Condor strategy is typically applied in environments with low expected volatility, offering limited profit and loss potential. The strategy involves selling a call option (out of the money - OTM), buying a call option (at a higher strike price, OTM), selling a put option (out of the money - OTM), and buying a put option (at a lower strike price, OTM). All these options must have the same expiration date to align with the strategy's objectives. This strategy is particularly suitable for investors who anticipate that the underlying asset’s price will stay within the range of the strike prices of the sold options (both put and call).
The Short Iron Condor aims to profit from low volatility in the underlying asset, assuming the price will remain between the strike prices of the sold options. This minimizes the risk of significant price movements. Increased volatility, however, could result in potential losses. The purchased options act as a hedge, limiting downside risk. The profit is constrained, primarily coming from the premiums earned by selling the options, while the risk is capped due to the purchased options.
For example, suppose the underlying asset is priced at $100. A Short Iron Condor strategy could be constructed as follows: sell a put option with a $90 strike, buy a put option with an $85 strike, sell a call option with a $110 strike, and buy a call option with a $115 strike. In this scenario, the strategy assumes the asset’s price will remain between $90 and $110. If the price moves outside this range, losses could occur, but these are limited due to the protective put and call options purchased.
The Short Iron Condor involves selling OTM call and put options while simultaneously buying further OTM call and put options to limit risk. All options share the same expiration date. The goal is to collect premiums from the sold options while limiting risk with the purchased options. The strategy aims to profit from low volatility, expecting the underlying asset to stay between the two strike prices of the sold options.
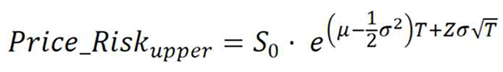
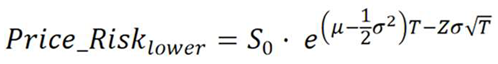
In our methodology, we first collected option chain data as snapshots at specific point in time for various expiration dates. To align with the Short Iron Condor strategy, call and put options were filtered based on the Out of the Money (OTM) criteria. The optimization model was applied using predefined maximum loss thresholds and risk levels for both lower and upper price bounds, which were calculated based on predefined probabilities derived from the Black-Scholes-Merton model. In this model, S represents the current stock price, μ is the expected return, σ is the volatility of the stock, T is the time to maturity (in years), Z is the z-score corresponding to the desired confidence level, and e is the base of the natural logarithm, this formula estimates the lower bound of the stock price's range at time T.
This optimization process was conducted independently for each asset and expiration date to ensure precise alignment with the strategy's objectives.
3.1. Objective
Maximize the total net premium received from the selected options for a specific asset across various time-to-maturity intervals, while ensuring risk is limited by choosing protective options from the option chain.
3.2. Decision Variables
The model considers different options, where i indicates the position within the option chain, representing the specific sequence or strike price for each call or put option.
- : Takes a value of 1 if the put option i is sold; otherwise, it is 0.
- : Takes a value of 1 if the put option i is bought; otherwise, it is 0.
- : Takes a value of 1 if the call option i is sold; otherwise, it is 0.
- : Takes a value of 1 if the call option i is bought; otherwise, it is 0.
3.3. Parameters – Premiums, Strike Prices and Spot Prices
- : The premium for selling put option i
- : The premium for buying put option i
- : The premium for selling call option i
- : The premium for buying call option i
- : Strike price for the sold put option i
- : Strike price for the bought put option i
- : Strike price for the sold call option i
- : Strike price for the bought call option i
- S0 : Spot price of the underlying asset
3.4. Objective Function
Optimize Net Premium (Z) subject to constraints
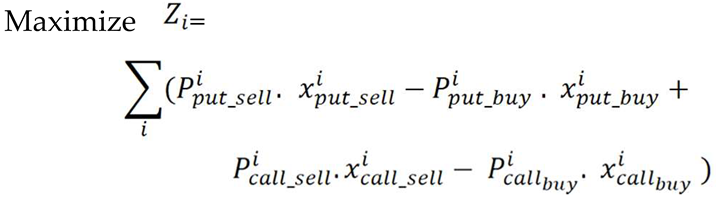
This function maximizes the total net premium, while considering the premiums paid and received for each option selected.
3.5. Constraints
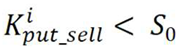
3.5.1. Strike Price Constraints
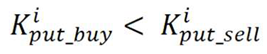
The strike price of the sold put must be lower than the current stock price.
The strike price of the bought put must be lower than the strike price of the sold put.
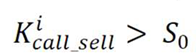
The strike price of the sold call must be higher than the current stock price.
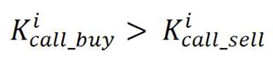
The strike price of the bought call must be higher than the strike price of the sold call.
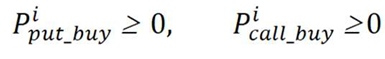
3.5.2. Premium non-negativity
The premium for selling options must be non-negative
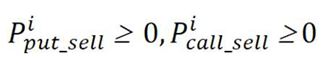
Similarly, the premium for buying options must be non-negative
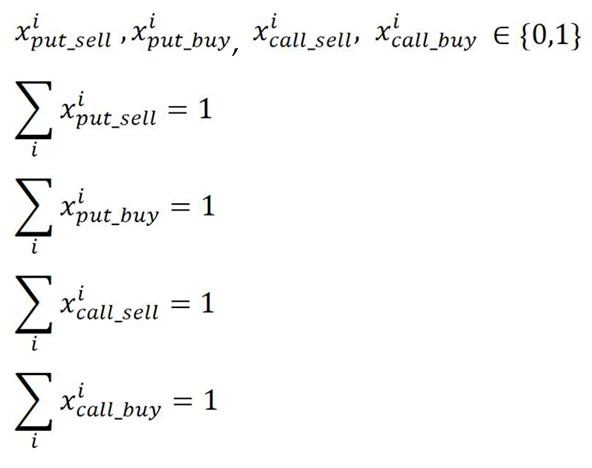
3.5.3. Option Selection Constraints
The goal is to ensure that exactly one put option, and one call option is chosen for both buying and selling from the option chain. The decision variables are binary indicating whether a specific option is selected (1) or not (0).
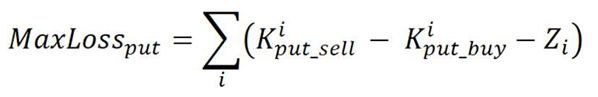
3.5.4. Maximum Loss Constraints
The maximum potential loss arising from put options is calculated by subtracting the difference between the selling and buying strike prices for each put option and the net premium (Z). This calculation is also applied to call options in the same manner.
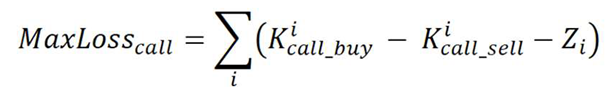
The overall maximum potential loss from both put and call options is determined by taking the larger of the two calculated losses. This ensures that the worst-case scenario is accounted for in the risk assessment.
The total maximum loss is defined as:

To ensure that this maximum loss stays within acceptable risk limits, a constraint is applied:
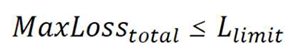
Here, Llimit represents the predefined maximum loss limit or risk tolerance level. This constraint guarantees that the total potential loss from the options portfolio does not exceed the allowed risk threshold, providing a controlled approach to managing financial exposure.
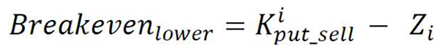
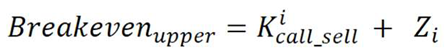
3.5.5. Break-Even Constraints
The breakeven points define the upper and lower price bounds within which the underlying asset price is expected to remain until the option's expiration. These bounds ensure that the option strategy remains within a manageable risk level, taking into account both potential gains and losses.
The total risk exposure must remain within predefined upper and lower bounds, which are calculated using the Black-Scholes-Merton Model with specified probabilities, ensuring that the asset price stays within an acceptable range.
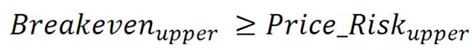

These constraints ensure that the asset price is expected to remain within the specified breakeven range up to the option’s expiration date. By setting these bounds, the strategy controls the risk exposure arising from price fluctuations while aiming for potential returns within a safe price range. The four options can be represented as a Short Iron Condor strategy, as shown in Figure 1. This optimization model provides a structured approach to maximizing returns for the Short Iron Condor strategy while accounting for various risk levels and other constraints outlined in this study.
4. Datasets and Experimental Designs
In this study, we use a dataset of option chains from 23 U.S. stocks and ETFs, with specific option contracts listed in Table 1, to determine the optimal Short Iron Condor strategies. The dataset is based on historical data from September 2023. One key aspect of the dataset is the inclusion of options with maturity periods of 5, 10, 15, and 20 days from the snapshot dates, allowing for a detailed analysis across different time frames. By applying the strategy to these varying maturities, we can compare performance and evaluate the strategy’s effectiveness over different periods. This combination of diverse maturity intervals and comprehensive historical data provides a solid basis for assessing the strategy under different market conditions, ensuring the results are reliable and broadly applicable.
In this methodology, the optimization model was run separately for 23 assets with maturity periods of 5, 10, 15, and 20 days to determine the optimal Short Iron Condor strategy for each scenario. A five-day maturity reflects typical weekly trading cycles, while a twenty-day maturity corresponds to a monthly trading cycle. This structure allows for a detailed analysis of the strategy's performance over both short-term (weekly) and medium-term (monthly) horizons, offering insights into how the Short Iron Condor strategy performs across different time frames in the options market.
For the experimental setup, three different input factors, outlined in Table 2, have been examined for the optimization model applied to the short iron condor strategy: Maximum Loss Limit, Price Risk Level, and Days to Maturity. The Maximum Loss Limit determines the maximum level of loss the option strategy can incur. The Price Risk Level, representing the expected price fluctuations, is used as an input for each asset in the Black-Scholes-Merton model to calculate the upper and lower bounds for the price, ensuring the return stays positive within the breakeven range. Days to Maturity indicates how many days remain until the option strategy expires.
The experimental setup consists of 324 scenarios, created by combining 9 distinct max loss limits, 9 price risk levels, and 4 maturity periods. All these scenarios are conducted for 23 assets listed in Table 1. This comprehensive setup ensures a thorough evaluation of the strategy across a wide range of risk and time conditions, providing a robust analysis of the Short Iron Condor strategy’s flexibility in various market scenarios.
For each experiment, the optimization model aims to maximize the return while setting the maximum loss level below the predefined loss limit. The return on investment (ROI) was calculated by dividing the optimized return by the maximum loss value. This measure was used to quantify the risk-adjusted returns through the return-to-risk ratio, providing deeper insights into the strategy's effectiveness. ROI is a key indicator in evaluating the strategy, as it clearly captures the balance between the risk taken and the returns generated, offering a practical way to assess how well the strategy performs under different market conditions.
5. Finding and Results
For each of the 23 assets, the experiments outlined in Table 2 were conducted. The optimization model was used to determine the maximized return values and corresponding maximum loss levels within the defined loss limits, price risk levels, and maturity periods. The average return and ROI, calculated by dividing the optimized return by the maximum loss across 23 assets, offer clear insights into the strategy's effectiveness under different loss limits.
As shown in Table 3, increasing the loss limits allows for higher potential returns. However, this comes at the cost of reduced unit profitability, as indicated by a decrease in the average Return on Investment (ROI). This inverse relationship suggests that while higher loss limits can boost overall profit potential, they also reduce the efficiency of returns on a per-unit basis. This highlights the inherent trade-off between risk and reward within the evaluated parameters, emphasizing the balance required in managing risk to achieve optimal outcomes.
Furthermore, the aggregated results are visually represented in Figure 2, where each point represents an experiment and the corresponding optimization result. The figure clearly shows the overall trend: as the Loss Limits increase, the Return on Investment (ROI) consistently decreases. For each asset, there is a downward slope indicating that as the maximum loss increases, the ROI declines. This inverse relationship suggests that while increasing the loss threshold exposes assets to greater risk, it does not result in proportionally higher returns, highlighting the diminishing returns associated with increased risk-taking. This is similar to real-life situations like insurance policies, where paying higher premiums for more coverage does not necessarily result in proportionally higher benefits, as the marginal utility of the additional protection diminishes beyond a certain point.
As shown in Table 4, our findings from the experiments indicate that increasing price risk levels leads to a decrease in both average return and ROI. However, due to the nature of the Short Iron Condor strategy, where returns are capped from the top and risks are capped from the bottom, increasing price fluctuations both upwards and downwards results in reduced profit potential, which in turn lowers profitability per unit of risk. Normally, when an asset's volatility increases, the expected return also rises, but in this strategy, the capped structure leads to the opposite effect. No matter how much price volatility increases, the returns diminish due to the capped profit and loss limits. A similar scenario occurs in portfolios where Take Profit (TP) and Stop Loss (SL) mechanisms are used, as increased volatility does not necessarily lead to higher returns when strict caps are in place.
In Table 5, the analysis shows that as the maturity period increases, both the average return and average ROI improve. However, there is a noticeable decline in the average ROI per day as the maturity period extends. This indicates that while longer maturity periods result in higher overall returns, the efficiency of returns on a daily basis decrease. Thus, shorter maturity periods may offer more efficient returns, whereas longer maturities yield higher cumulative gains but at a slower daily rate. The return based on the risk carried daily decreases as the maturity period extends, indicating that the marginal benefit of holding risk for longer periods diminishes. This suggests that while longer-term strategies may yield higher overall returns, the added value of taking on extended risk decreases over time. This is similar to real-life investment scenarios where short-term strategies, such as daily or weekly trades, can provide quicker returns due to short-term price movements. However, these require more attention and often incur higher transaction costs. In contrast, long-term investments may yield higher overall returns, but the daily return efficiency decreases as the gains are spread out over a longer period. Thus, the marginal benefit of holding risk for longer periods diminishes, similar to what is observed in the analysis.
Our findings suggest that investors and risk managers should carefully evaluate the diminishing returns on risk as maturity periods extend. Additionally, increasing the maximum loss level does not provide additional marginal benefits from the increased risk. In a capped return and risk environment, higher volatility further reduces the return per unit of risk. Therefore, optimizing the balance between risk and return can lead to more efficient outcomes. This analysis challenges the traditional belief that extending the time horizon or increasing risk exposure will always yield better results. A more strategic approach is required to maximize return efficiency over time.
6. Conclusions
Analyzing 2023 data on the 14 most traded US equity and 9 ETF options, with maturities ranging from 5 to 20 days, the research identified a clear connection between risk, measured by maximum loss and price risk, and the maximum achievable returns in short iron condor strategies.
According to the optimization results of the Short Iron Condor strategy, as the maximum loss limits increase, the risk levels rise, leading to higher potential returns. However, the risk-adjusted returns, measured by the return-to-risk ratio, showed a decline as risk levels increased. Additionally, increasing price volatility, which widens both the upper and lower bounds, further reduced the average return and ROI levels, indicating that greater price fluctuations do not necessarily lead to proportionately higher returns in this strategy. Furthermore, extending the maturity period further reduced this ratio. These findings highlight the critical impact of both risk levels, price volatility, and holding duration on returns, emphasizing the complex relationship between risk and return in short iron condor strategies.
These findings can be illustrated through an analogy using the images in Figure 3. In the first image, we see a person crossing a narrow road with four boxes, while in the second image, a person crosses a wider road carrying seven boxes. The increase in the number of boxes represents the potential for greater returns, but as the width of the road increases, representing a longer duration, the risk also grows. Furthermore, the traffic congestion in both images symbolizes the likelihood of encountering obstacles, and the more boxes one carries, the greater the risk of dropping them. Similarly, in investing, higher returns often come with greater risk, and the longer the holding period or the more risk taken, the higher the chances of encountering challenges or losses along the way.
Carrying more boxes can lead to higher rewards, just like increasing risk can lead to higher returns in investment strategies. However, as the road (or duration) becomes longer and wider, the risk of something going wrong also increases. Similarly, in investing, while longer durations and higher risk can yield greater potential returns, they also come with a higher likelihood of encountering challenges along the way.
In conclusion, the key takeaways from this study can be summarized as follows:
- Higher risk levels (maximum loss values) lead to greater potential returns but reduce risk-adjusted returns (ROI).
- Increasing price volatility does not always result in proportional returns and can decrease average ROI, where risk and returns are capped.
- Extending the holding duration (maturity period) increases total returns, but the return-to-risk ratio decreases, indicating that while returns grow, the efficiency of those returns relative to risk declines over longer periods.
- Optimizing the balance between risk and return is crucial, as increasing risk does not always enhance return efficiency, particularly in strategies with limited profit potential.
- Optimizing holding period and risk exposure ensures that returns are maximized while managing increased risks in more volatile or longer-term positions.
In future studies, we plan to explore the risk-return relationship in Bear Call and Bull Put Spread strategies by incorporating price direction forecasting. These directional strategies offer a different approach to risk management, as they rely heavily on accurate predictions of price movements. By analyzing how forecasting the price direction affects the risk and return dynamics, we aim to provide deeper insights into how these strategies compare to neutral strategies like the Short Iron Condor. This will help investors better understand the trade-offs involved in directional options trading and the potential for optimizing returns while effectively managing the associated risks.
References
- Abdymomunov, A.; Kang, K.H.; Kim, K.J. Can credit spreads help predict a yield curve? Journal of International Money and Finance 2016, 64, 39–61. [Google Scholar] [CrossRef]
- Ang, A.; Hodrick, R.J.; Xing, Y.; Zhang, X. High idiosyncratic volatility and low returns: International and further US evidence. Journal of Financial Economics 2009, 91, 1–23. [Google Scholar] [CrossRef]
- Bali, T.G.; Peng, L. Is there a risk–return trade-off? Evidence from high-frequency data. Journal of Applied Econometrics 2006, 21, 1169–1198. [Google Scholar] [CrossRef]
- Bauer, R.; Cosemans, M.; Eichholtz, P. Option trading and individual investor performance. Journal of Banking & Finance 2009, 33, 731–746. [Google Scholar]
- Bekaert, G.; Wu, G. Asymmetric volatility and risk in equity markets. The review of financial studies 2000, 13, 1–42. [Google Scholar] [CrossRef]
- Board, J.; Sutcliffe, C.; Patrinos, E. The performance of covered calls. The European Journal of Finance 2000, 6, 1–17. [Google Scholar] [CrossRef]
- Brandt, M.W.; Kang, Q. On the relationship between the conditional mean and volatility of stock returns: A latent VAR approach. Journal of Financial Economics 2004, 72, 217–257. [Google Scholar] [CrossRef]
- Broadie, M.; Chernov, M.; Johannes, M. Model specification and risk premia: Evidence from futures options. Journal of Finance 2007, 62, 1453–1490. [Google Scholar] [CrossRef]
- Bruder, B.; Gaussel, N. Risk-return analysis of dynamic investment strategies. 2011. Available at SSRN 246 5623. [CrossRef]
- Campbell, J.Y.; Hentschel, L. No news is good news: An asymmetric model of changing volatility in stock returns. Journal of financial Economics 1992, 31, 281–318. [Google Scholar] [CrossRef]
- Chiang, T.C.; Li, H.; Zheng, D. The intertemporal risk-return relationship: Evidence from international markets. Journal of International Financial Markets, Institutions and Money 2015, 39, 156–180. [Google Scholar] [CrossRef]
- Chordia, T.; Goyal, A.; Sadka, G.; Sadka, R.; Shivakumar, L. Liquidity and the post-earnings-announcement drift. Financial Analysts Journal 2009, 65, 18–32. [Google Scholar] [CrossRef]
- French, K.R.; Schwert, G.W.; Stambaugh, R.F. Expected stock returns and volatility. Journal of financial Economics 1987, 19, 3–29. [Google Scholar] [CrossRef]
- Ghysels, E.; Santa-Clara, P.; Valkanov, R. There is a risk-return trade-off after all. Journal of financial economics 2005, 76, 509–548. [Google Scholar] [CrossRef]
- Goldberg, C.S.; Veitch, J.M. Country risk and financial integration—A case study of South Africa. Research in International Business and Finance 2010, 24, 138–145. [Google Scholar] [CrossRef]
- Grieves, R. Butterfly trades. Journal of Portfolio Management 1999, 26, 87–95. [Google Scholar] [CrossRef]
- Hong, H.; Sung, H.C.; Yang, J. On profitability of volatility trading on S&P 500 equity index options: The role of trading frictions. International Review of Economics & Finance 2018, 55, 295–307. [Google Scholar]
- Hui, C.H.; Lo, C.F.; Yeung, V.; Fung, L. Valuing foreign currency options with a mean-reverting process: a study of Hong Kong dollar. International Journal of Finance & Economics 2008, 13, 118–134. [Google Scholar]
- Hull, J.C. Options, Futures, and Other Derivatives; Kirby Street, London, UK: Pearson, 2022; pp. 268–287. [Google Scholar]
- Kim, D.; Kim, T.S.; Min, B.K. Future labor income growth and the cross-section of equity returns. Journal of Banking & Finance 2011, 35, 67–81. [Google Scholar]
- Kongsilp, W.; Mateus, C. Volatility risk and stock return predictability on global financial crises. China Finance Review International 2017, 7, 33–66. [Google Scholar] [CrossRef]
- Lo, S.K.; Lu, Q.; Wang, C.; Paik, H.Y.; Zhu, L. A systematic literature review on federated machine learning: From a software engineering perspective. ACM Computing Surveys (CSUR) 2021, 54, 1–39. [Google Scholar] [CrossRef]
- Markowitz, H.M. Foundations of portfolio theory. The journal of finance 1991, 46, 2328831. [Google Scholar] [CrossRef]
- Niblock, S.J.; Sinnewe, E. The performance of covered call writing strategies on the Australian stock market. Accounting & Finance 2018, 58, 1115–1135. [Google Scholar]
- Shivaprasad, S.P.; Geetha, E.; Kishore, L.; Matha, R. Choosing the right options trading strategy: Risk-return Trade-off and Performance in Different Market Conditions. Investment Management & Financial Innovations 2022, 19, 37–50. [Google Scholar]
- Yu, J.; Yuan, Y. Investor sentiment and the mean–variance relation. Journal of Financial Economics 2011, 100, 367–381. [Google Scholar] [CrossRef]
Figure 1.
The strategy of the short iron condor.
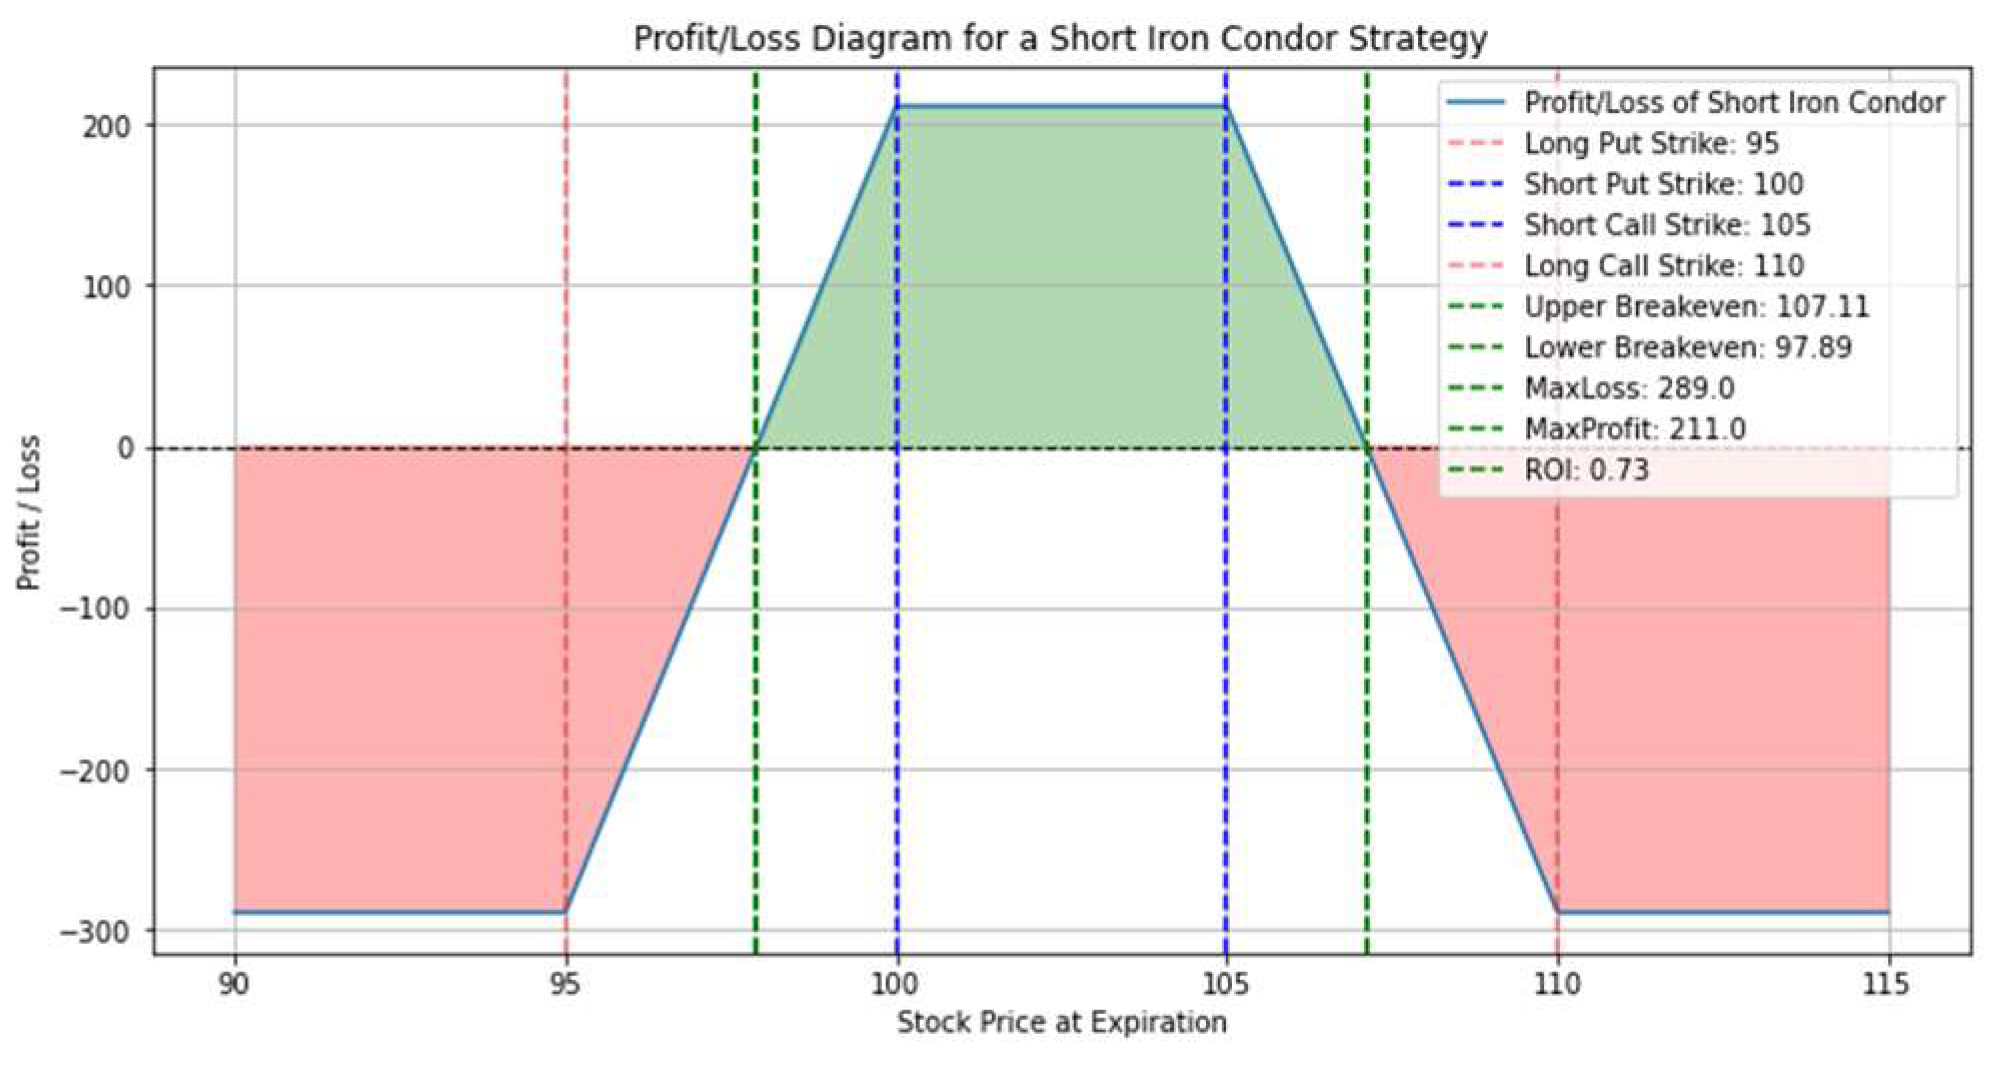
Figure 2.
Maximum Loss vs ROI.
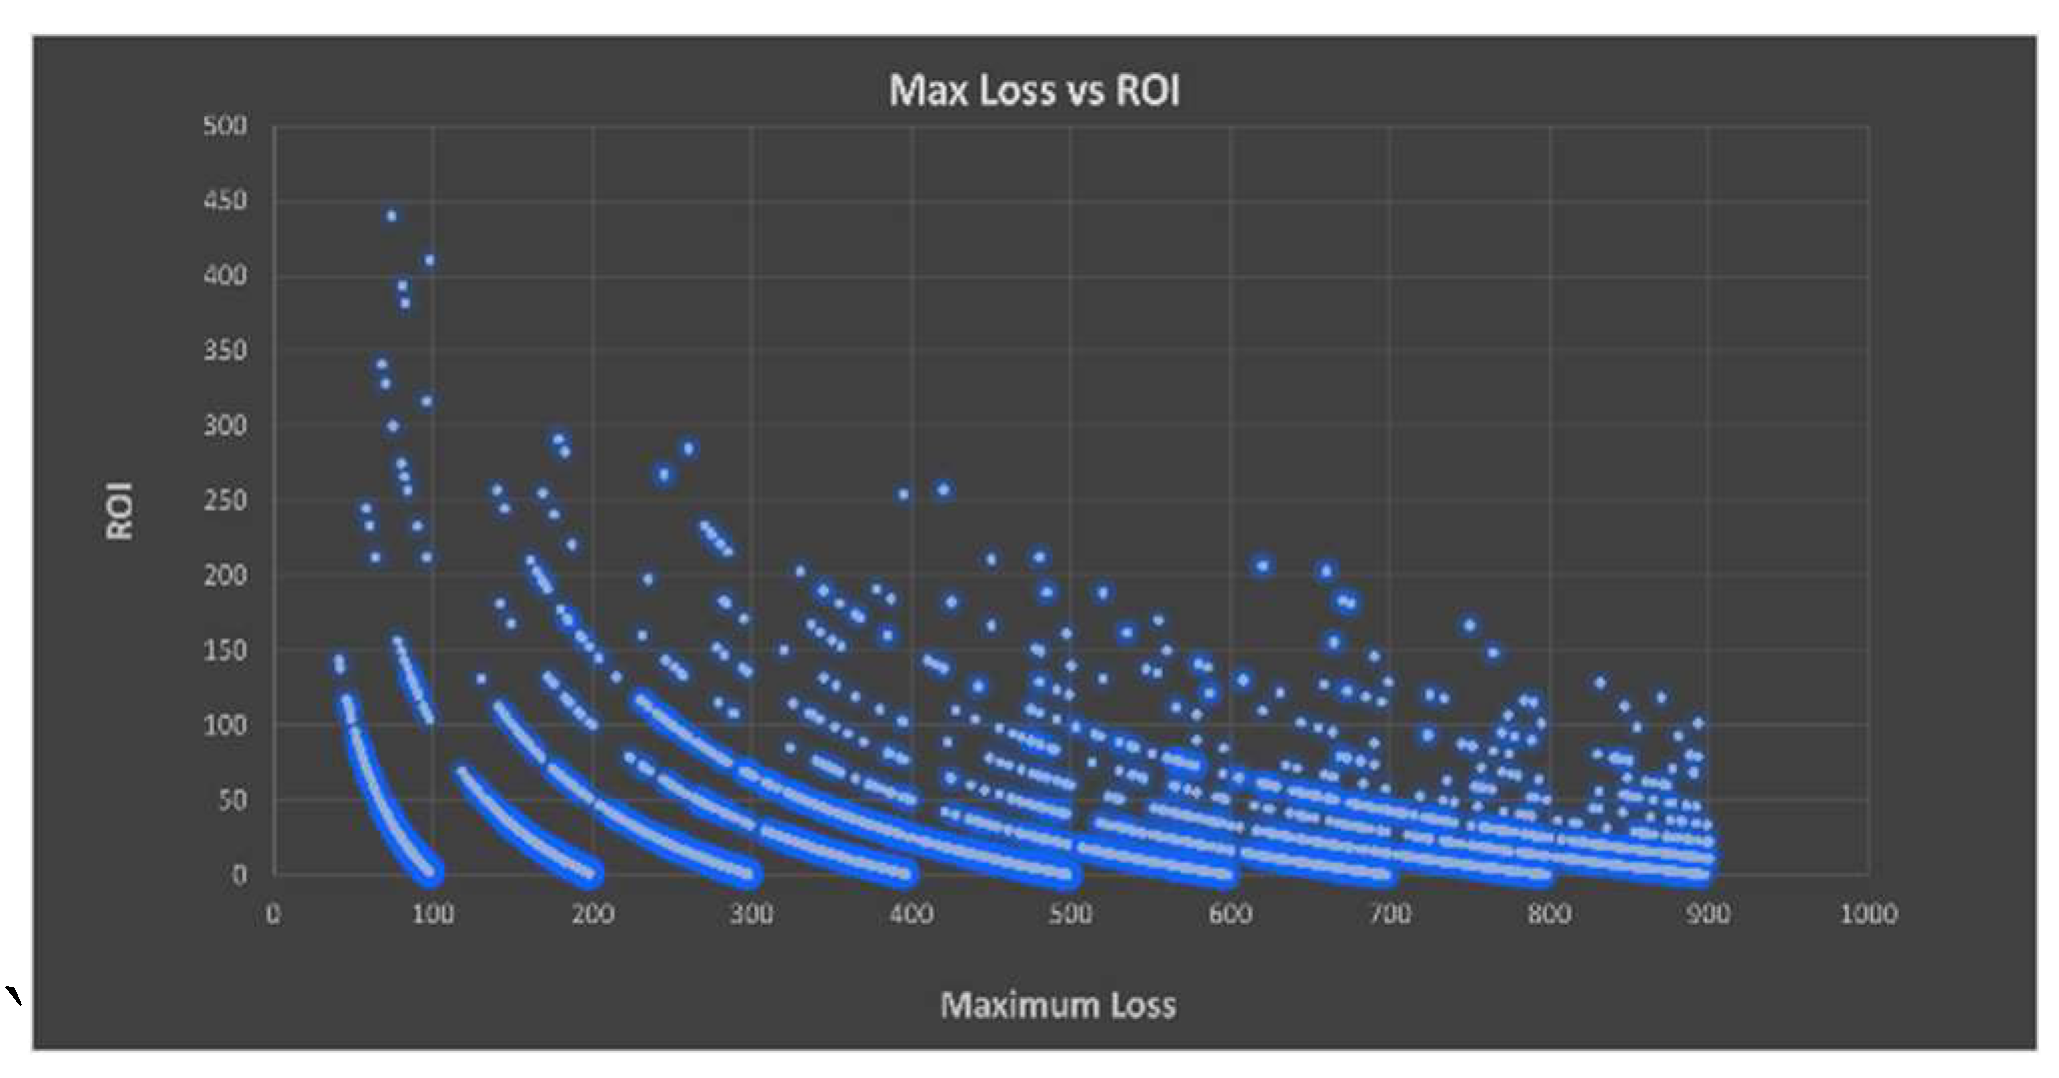
Figure 3.
Illustration of the Maturity Days, Return, Maximum Loss.


Table 1.
Us Stocks and ETFs.
| Symbols | Name |
|---|---|
| AAPL | Apple Inc. |
| AMC | AMC Entertainment |
| AMD | Advanced Micro Devices |
| AMZN | Amazon.com Inc. |
| ARKK | ARK Innovation ETF |
| BABA | Alibaba Group |
| BAC | Bank of America Corp. |
| EEM | iShares MSCI Emerging Markets ETF |
| EWZ | iShares MSCI Brazil ETF |
| F | Ford Motor Company |
| GOOGL | Alphabet Inc. (Google) |
| HYG | iShares iBoxx Corporate Bond ETF |
| META | Meta Platforms, Inc. |
| MSFT | Microsoft Corporation |
| NFLX | Netflix, Inc. |
| NIO | NIO Inc. |
| NVDIA | NVIDIA Corporation |
| QQQ | Invesco QQQ ETF |
| SPY | SPDR S&P 500 ETF |
| TLT | iShares 20+ Year Treasury Bond ETF |
| TQQQ | ProShares UltraPro QQQ ETF |
| TSLA | Tesla, Inc. |
| UVXY | ProShares Ultra VIX ST Futures ETF |
Table 2.
Experimental Design Setups.
| Max Loss Limits (USD) |
Price Risk Levels (Probabilities) |
Days to Maturity |
|---|---|---|
| 100 | 0.01 | 5 |
| 200 | 0.1 | 10 |
| 300 | 0.2 | 15 |
| 400 | 0.3 | 20 |
| 500 | 0.4 | |
| 600 | 0.5 | |
| 700 | 0.6 | |
| 800 | 0.7 | |
| 900 | 0.8 |
Table 3.
Comparison of Loss Limits, Average Return and ROI.
| Max Loss Limits | Average of Return | Average of ROI |
|---|---|---|
| 100 | 30 | 40.7 |
| 200 | 55 | 33.7 |
| 300 | 78 | 31.3 |
| 400 | 97 | 29.5 |
| 500 | 94 | 23.3 |
| 600 | 102 | 21.8 |
| 700 | 113 | 20.8 |
| 800 | 122 | 19.6 |
| 900 | 131 | 18.8 |
Table 4.
Comparison of Price Risk Levels, Average Return and ROI.
| Max Loss Limits | Average of Return | Average of ROI |
|---|---|---|
| 0.01 | 304,86 | 81,53 |
| 0.1 | 178,90 | 46,34 |
| 0.2 | 119,25 | 31,57 |
| 0.3 | 84,22 | 21,85 |
| 0.4 | 60,07 | 15,87 |
| 0.5 | 40,91 | 9,94 |
| 0.6 | 27,88 | 6,71 |
| 0.7 | 19,20 | 4,47 |
| 0.8 | 9,60 | 2,13 |
Table 5.
Days to Maturity Based Comparisons.
| Days to Maturity | Average of Return | Average of ROI | Average of ROI per Day |
|---|---|---|---|
| 5 | 64,3 | 18,7 | 3,7 |
| 10 | 88,8 | 22,8 | 2,3 |
| 15 | 109,2 | 28,4 | 1,9 |
| 20 | 112,8 | 28,9 | 1,4 |
Disclaimer/Publisher’s Note: The statements, opinions and data contained in all publications are solely those of the individual author(s) and contributor(s) and not of MDPI and/or the editor(s). MDPI and/or the editor(s) disclaim responsibility for any injury to people or property resulting from any ideas, methods, instructions or products referred to in the content. |
© 2024 by the authors. Licensee MDPI, Basel, Switzerland. This article is an open access article distributed under the terms and conditions of the Creative Commons Attribution (CC BY) license (http://creativecommons.org/licenses/by/4.0/).
Copyright: This open access article is published under a Creative Commons CC BY 4.0 license, which permit the free download, distribution, and reuse, provided that the author and preprint are cited in any reuse.


