Submitted:
04 November 2024
Posted:
05 November 2024
You are already at the latest version
Abstract
This paper presents an economic feasibility analysis for constructing a 100 MW floating solar power plant in Korea, aimed at utilizing idle water spaces to mitigate geographical limitations for large-scale renewable energy projects. Employing both Discounted Cash Flow (DCF) analysis and Real Options Analysis (ROA), the study evaluates the economic viability and strategic flexibility of the project under future market uncertainties. The DCF method reveals an NPV of 11,863 thousand USD and a B/C ratio of 1.1, indicating baseline feasibility. However, the ROA demonstrates the value of adaptive strategies, with real option values showing that plant expansion (to 200 MW) is economically advantageous under favorable conditions. This approach supports strategic decision-making aligned with Korea’s renewable energy targets. The study emphasizes the importance of incorporating market uncertainties into feasibility assessments and proposes detailed strategies for expanding renewable energy generation.
Keywords:
floating solar power plant
; economic feasibility analysis
; Real Option Analysis (ROA)
; renewable energy strategy
; market volatility
1. Introduction
The global share of renewable energy in power generation is on a steady rise, with solar energy emerging as a cornerstone of sustainable energy development. In recent years, solar power generation has experienced significant global growth, with innovative installation methods such as floating solar panels on underutilized water bodies gaining notable attention. Traditional land based solar power plants require extensive land areas, leading to substantial costs associated with land acquisition and leasing. In contrast, floating solar installations provide a cost-effective alternative by mitigating these land related expenses. Furthermore, floating solar systems allow for more efficient energy generation than their land-based counterparts, as they encounter fewer obstructions such as buildings or infrastructure that impede sunlight exposure[1].
In Korea, mountainous terrain and limited land availability pose challenges for the development of large-scale, land-based solar facilities. Recently, efforts have intensified to implement floating solar power generation systems within the country. However, these floating solar projects face substantial uncertainties, particularly related to the volatility of future generation outputs and fluctuations in electricity sales prices, which complicate the achievement of stable, long-term operations[2]. In light of these uncertainties, conducting a rigorous economic feasibility analysis is essential prior to project initiation.
Traditional valuation techniques, such as Discounted Cash Flow (DCF) analysis, assess a project’s potential by estimating future cash flows and discounting them using the weighted average cost of capital to determine present value. However, these approaches often fail to accommodate the level of flexibility necessary in today’s volatile energy markets. Within this context, the Real Options Valuation (ROV) method offers a more robust framework for evaluating renewable energy projects, such as floating solar power installations, by incorporating market uncertainty and decision-making flexibility, thus providing a more advanced mechanism for assessing economic feasibility [3].
To encourage the adoption of new and renewable energy sources, Korea has introduced the Renewable Energy Portfolio Standard (RPS), a mandatory policy framework aimed at increasing the share of renewable energy in power generation and incentivizing private investment by promoting long-term profitability for these projects[4]. Under the current RPS system, the profit structure for power generation companies is primarily influenced by the System Marginal Price (SMP) applied to generated electricity and revenue from Renewable Energy Certificate (REC) sales. In recent years, SMP and REC prices have displayed heightened volatility, influenced by external factors such as rising oil prices, with a stabilizing downward trend that has adversely affected the profitability of power generation companies. Given the current RPS framework, maintaining stable profit margins for power operators remains challenging due to various market dynamics, which in turn has slowed the proliferation of renewable energy projects due to significant uncertainty surrounding SMP and REC prices.
This study proposes the construction of a solar power plant utilizing idle water surfaces to expand the deployment of floating solar power generation in Korea and investigates its economic feasibility. To assess the long-term profitability of floating solar power plants, this study reviews Korea’s current RPS system and conducts an economic feasibility analysis that incorporates project uncertainty. Specifically, the study applies the Real Options Valuation (ROV) approach to account for uncertainties in electricity sales prices that impact future profitability, thereby evaluating the value of decision-making flexibility. Through this methodology, this study seeks to provide a more precise assessment of the economic feasibility of floating solar power projects and aims to contribute to strategic decision-making processes for Korea’s renewable energy initiatives.
This paper is structured as follows: Chapter 2 presents the theoretical background of DCF and Real Options Valuation (ROV) economic evaluation methods, alongside a review of prior studies that have analyzed the economic feasibility of renewable energy investment projects using ROV. Chapter 3 investigates the expansion potential of floating solar power and conducts comparative case analysis to elucidate the valuation differences between DCF and ROV methodologies. Chapter 5 outlines the academic contributions of this study’s findings and delineates its limitations.
2. Theoretical Background and Literature Review
2.1. Theoretical Background
2.1.1. Discounted Cash Flow (DCF) method
The discounted cash flow (DCF) method is an economic evaluation technique that converts future cash flows to their present value using a discount rate, facilitating a comprehensive assessment of a project value. Classic cost benefit analysis approaches within the DCF framework include Net Present Value (NPV), Benefit Cost Ratio (B/C), and Internal Rate of Return (IRR). In this study, we aim to determine the economic feasibility of the business by employing the Net Present Value method and the Benefit Cost Ratio method[25].
- Net Present Value (NPV)
The Net Present Value (NPV) method evaluates the economic feasibility of a project by calculating the present value of net benefits, which is derived by subtracting the present value of costs from the present value of benefits, as formulated in Equation (1). Following this calculation, investment costs are deducted to determine the viability of the project. An NPV result that is positive suggests that the project is economically justifiable and therefore recommended for implementation. Conversely, a negative NPV indicates that the project is not economically viable, as projected costs surpass expected benefits, thus advising against project initiation. This NPV framework provides a quantitative basis for decision-making in project feasibility studies, grounded in financial projections [5].
In this model, denotes the benefit at time t, represents the cost at time t, is the applied discount rate, indicates the investment period, and refers to the initial investment cost.
The net present value (NPV) method offers the advantage of clearly and concisely conveying key insights due to its straightforward and transparent valuation approach. However, it is limited by its reliance on fixed assumptions and the potential for subjective interpretation within the calculation process. Additionally, the NPV method does not adequately account for fluctuating market conditions and inherent risk factors associated with dynamic market environments.
- B/C ratio
The Benefit-Cost (B/C) ratio method is employed to assess the economic feasibility of projects by determining the ratio of the present value of anticipated benefits to the present value of projected costs. This method provides a quantitative basis for evaluating project viability, as expressed in Equation (2). Specifically, if the B/C ratio exceeds 1, the project is deemed economically viable, indicating that the expected benefits outweigh the costs, thus justifying the investment. Conversely, if the B/C ratio is less than 1, the project may be regarded as economically unfeasible, suggesting limited investment potential due to projected costs exceeding anticipated benefits[6].
2.1.2. Real Option Valuation (ROV)
- The concept of real options
The concept of real options originates from financial derivatives, specifically financial options, which confer the right to buy or sell a financial asset. A real option, however, extends this principle to tangible, non-financial assets, such as infrastructure projects or real estate investments. While the mechanics remain similar—granting the holder the choice to proceed or withdraw—the focus shifts from financial products to real-world investments. In both cases, the flexibility to act (or not) is valuable, allowing the investor to capitalize on favorable circumstances or avoid adverse conditions.
Financial options are broadly classified into call and put options. A call option grants the holder the right to purchase the underlying asset at a pre-determined price on or before a specified expiration date, provided an option premium is paid. Conversely, a put option provides the right to sell the asset at a pre-set price within the same timeframe. Additionally, options are categorized based on their exercise timing: American options allow exercise at any point before expiration, whereas European options restrict exercise to the expiration date.
In contrast to traditional valuation methods, such as the discounted cash flow (DCF) approach, real options analysis incorporates the dimension of time and the value of flexibility in decision-making. The DCF method evaluates project feasibility on a binary basis, often accepting or rejecting a project purely on its net present value (NPV). If NPV is positive, the project proceeds; if negative, it is dismissed. Real options, however, offer a more nuanced view. A project with a negative NPV is not immediately deemed unprofitable but instead is subject to further review, acknowledging potential future opportunities. Even a project with a positive NPV can be delayed, if strategic flexibility suggests waiting could yield more favorable conditions.
Real options thus bring an adaptive, dynamic approach to valuation, enabling managers to adjust to changing conditions by postponing, expanding, scaling back, or even abandoning projects as needed. Unlike the rigid and static DCF method, which relies on assumptions made at a single point in time, real options analysis is prepared for unpredictability and uncertainty, preserving project liquidity and minimizing potential losses as conditions evolve. As illustrated in Figure 1, this approach secures the project’s flexibility to respond to uncertainty over time, mitigating potential risks and enhancing project resilience in the face of future uncertainties [7].
- Real option types
Real options can be assessed by selecting the most suitable option among various alternatives based on the specific business context, such as deferring an investment, or expanding or contracting project scope. Table 1 presents the types of real options commonly utilized across industries, illustrating how different options can be applied to enhance strategic decision-making under varying conditions of uncertainty and market dynamics [8].
- Binomial option model
Among the methods for calculating real options, the binomial option model is a straightforward and practical approach in which value adjustments occur discretely within an uncertain future business environment. The fundamental principle of the binomial option model is that the price of real assets and the corresponding option values fluctuate based on two potential outcomes—an upward or downward movement—at each period. Table 2 presents the variables employed in the binomial option model [9,10,11,12,13,14,15,16].
In this study, the variables u, d and p are derived from Equation (3), which serves as a foundational component for analyzing the relationships between these parameters. This equation is integral to the methodology applied, providing a systematic approach for deriving accurate values that support the overall research objectives.
The fundamental procedure of the binomial option pricing model relies on a binomial lattice framework with a designated maturity period and forward deferral. In this model, the underlying asset S either increases by an upward coefficient u or decreases by a downward coefficient d in each time period. This progression is calculated through a forward-rolling process, continuing until the maturity date is reached. When the option value is denoted as it can be represented in the form . Building upon this foundation, the research progresses by first selecting an option model appropriate for the research objective, applying it, and subsequently implementing a reverse cycle process to determine the option’s final value. In this model, the valuation process for each option begins at its expiration and proceeds in a reverse sequence, ultimately converging to the final option value
The expansion and contraction option represent a strategic choice to expand or reduce the scale of a project by increasing or decreasing the investment amount in response to unfavorable market conditions. At the expansion option’s expiration, its value is determined by selecting the greater of two scenarios: the value of continuing the project without expansion versus the value of expanding the project size, as indicated in Equation (4). Prior to maturity, the option’s value is similarly the maximum between holding the expansion option unexercised and the value upon exercising it, as described in Equation (5).
In instances of business expansion, where the expansion cost is and the project value increases by , the value at each node is calculated accordingly. At the contraction option’s expiration, its value is determined by selecting the greater of two scenarios: the value of continuing the project without downsizing versus the value of reducing the project size, as indicated in Equation (6). Prior to maturity, the option’s value is similarly the maximum between holding the downsize option unexercised and the value upon exercising it, as described in Equation (7). In instances of business downsizing, where the present value of the asset decreases by and the reduced investment amount decreases by , the value at each node is calculated accordingly.
In project management financial analysis, the abandonment option provides a strategic means to sell a project to recover its residual value if market conditions deteriorate. At the expiration of the option, its value equals the greater of the project’s value at expiration or its residual value upon abandonment, as represented in Equation (8). Prior to expiration, as outlined in Equation (9), the option’s value is determined by the higher of two potential values: the value of holding the abandonment option without exercising it or the value upon its exercise. This abandonment option operates as an American put option, allowing early exercise if it proves beneficial. If the project’s residual value is represented by A and the annual investment amount by , the value at each node is calculated accordingly. In this context, the "abort option" is used interchangeably with the abandonment option, indicating the choice to terminate the project under unfavorable market conditions.
2.2. Literature Reviews
In order to perform a real option economic evaluation, uncertainty factors that affect project profitability must be derived and volatility estimated. Volatility is a quantitative measure of the degree of uncertainty of a project, and it represents the potential range of future value, so it is very important to estimate reasonable volatility. In this study, we review previous studies that evaluated economic feasibility by applying real options to renewable energy power generation projects and examine major uncertainty factors. Zhang et al. (2017) evaluated China's solar power generation project using the real options method, considering four uncertainty factors, including carbon emissions price, investment cost of new and renewable energy project, and government subsidy. Additionally, it was shown that when uncertainty exists, the real options method is more effective than the NPV method [17]. Kim et al. (2014) analyzed the economic value and optimal exercise timing of investment in wind power generation projects in Korea based on a real options approach considering the uncertainty of fossil fuel power generation costs. As a result of the analysis, it was confirmed that investment in the Korean wind power generation project is economically feasible from the perspective of real options [18]. Walsh et al. (2014) considered carbon emissions price uncertainty to analyze the optimal investment timing for CCS technology application in the UK. As a result of the analysis, it was confirmed that the application of CCS technology is not appropriate at the current price level [19]. Biondi et al. (2015) evaluated the economic feasibility of Italian solar power complexes by considering the volatility of electricity sales price and solar power generation installation costs and derived the optimal investment time. As a result of the analysis, it was confirmed that if uncertainty is taken into account, the investment period for the Italian solar power generation project can be delayed [20]. Siddiqui et al. (2006) derived the optimal investment time by considering the uncertainty of electricity prices and liquefied natural gas prices involved in power generation projects through real options [21]. Ho Park and Nam. (2018) analyzed the investment economic feasibility of a fuel electric power generation facility project using real options. The optimal investment threshold was derived by considering both cases where the SMP price follows geometric Brownian motion and mean reversion process [22]. Maeda et al. (2019) evaluated the economic feasibility of wind power plants installed in Texas, USA, considering electricity sales price and generation costs. It was suggested that the economic feasibility of wind power projects considering uncertainty and decision-making flexibility was 45.9% greater than NPV [23]. Qu et al. (2021) found that the high volatility of SMP and REC sales prices weakens the incentive to invest in new and renewable energy, and the intention to invest in Energy Storage System (ESS), which can reduce uncertainty in the new and renewable energy power generation business. It was judged to have an influence on the decision [24].
This study distinguishes itself from previous research on project valuation using the real options method in three significant ways. First, regarding the subject matter, this study introduces a novel application of the real options technique to the economic evaluation of a floating solar power plant construction project—an area unaddressed in prior studies. Second, unlike previous studies, which did not consider Korea’s 2024 Renewable Portfolio Standard (RPS) system, this analysis incorporates both the regulatory framework and electricity sales pricing under the current RPS system. This approach provides a meaningful contribution by establishing an evaluative framework tailored to the latest regulations and market conditions for new and renewable energy projects in Korea. Third, this research further examines the value of both expansion and abandonment options specific to floating solar power generation. Through a virtual case analysis, it explores the development potential of floating solar power plant construction, offering a comprehensive analysis of the project’s feasibility and strategic flexibility under varying market conditions.
3. Case Study
3.1. Project Overview
This study aims to conduct an economic evaluation of a large-scale floating solar power plant construction project utilizing idle sea space in Korea. The proposed power plant is located in Gunsan-si, Jeollabuk-do, and is envisioned as a floating solar power facility. Gunsan City currently operates the ‘Saemangeum New Renewable Energy Power Plant,’ which has a total capacity of 2.6 GW. The type of power plant proposed in this study is anticipated to reduce project costs and enhance operational efficiency by integrating with the existing power system of the region.
The cost data for the power generation facility utilized in this study were adjusted based on real world cases, with appropriate levels verified through expert consultations. The specifications for the floating solar power plant equipment and operational standards are as follows: the plant has a power generation capacity of 100 MW, with floating solar panels installed. The panels' power generation efficiency is assumed to be 85%, with an annual degradation rate of 1%. The estimated average daily power generation time in Gunsan City is 3.6 hours, and the plant is expected to operate year-round (365 days). The project assumes that construction will be completed, and operations will commence in 2024, with a total construction period of two years.
3.2. Project Valuation Using Discounted Cash Flow (DCF)
In this section, the DCF method is employed to evaluate the project's economics based on its cash flow. The DCF approach discounts future cash flows to determine the project's net present value (NPV) and benefit-cost (B/C) ratio, providing a foundation for assessing value without accounting for the uncertainties of future market conditions or the value of flexible decision making.
The data required for valuation using the discounted cash flow (DCF) method can be categorized into cost data and benefit data, with the detailed components outlined as follows. Cost data comprises CAPEX (Capital Expenditure), OPEX (Operational Expenditure), and financial costs. CAPEX pertains to the funds allocated for the acquisition of physical assets, such as equipment. In contrast, OPEX represents ongoing expenditures required for operations that do not contribute to asset creation. In this study, CAPEX costs include expenses related to design, permitting, and construction. OPEX costs encompass operation and maintenance (O&M), safety management expenses, internet costs, and insurance premiums as Table 3.
Financial costs were assessed by considering the grace period, repayment period, and interest rate associated with debt financing (80%), along with the inflation rate and the risk-free interest rate.
3.2.1. Cost Data Collection

Table 3.
Details of the case study.
| Items | Value | Method | Sources & Reference | |
|---|---|---|---|---|
| Facility Stangard | Generation capacity |
100MW | Floating solar power generation using idle space at sea | Assumed based on actual case data |
| Generation hours (hour) |
3.6 | 10-year average solar radiation | [25] | |
| Energy efficiengy | 85% | Assumed to be 85% | [26] | |
| Reduction rate | 1% | Assumed to be 1% | [26] | |
| Cost Data | Construction cost (thousand USD) | 118,116 | Assumed based on actual case data, verified by experts | - |
| O&M cost (million USD) |
1% | Assumed to be 1% of annual sales | [27] | |
| Benefit Data | SMP (USD/kWh) | 0.1 | Average price of summation of SMP and REC data for last 20 years | [27] |
| REC (USD/kWh) | ||||
| REC weight | 1.2 | Installation on water (over 3000kW) | [27] | |
| Financial Cost | Inflation | 3.5% | Last 30 years average inflation data in South Korea | [27] |
| Discount rate | 5% | Recommended by IEA | [28] | |
| Risk-free interest rate | 5% | Average value of the three-year treasury bonds of the South Korea from 2003 to 2023 | [29] | |
3.2.2. Benefit Data Collection
The benefit data consists of electricity sales prices, REC weights, and government subsidies. The electricity sales price is composed of the SMP (System Marginal Price) and REC (Renewable Energy Certificate). In calculating electricity sales revenue, the REC is adjusted using a weight that reflects the government's renewable energy policy. The REC weights, which differ depending on the energy source, are structured to promote investment in prioritized renewable technologies. The adjusted value is calculated by multiplying the base REC price by the REC weight, which subsequently impacts the overall profitability of the project. This system aligns with policy objectives, incentivizing the adoption of specific renewable energy sources. In this study, as shown in Table 4, a REC weight of 1.2 was used.
3.2.3. Project Valuation
This section assesses the economic feasibility of solar power plants based on specified project data. The Net Present Value (NPV), Benefit-Cost (B/C) ratio, and breakeven point were analyzed using the Discounted Cash Flow (DCF) method, with the results summarized as follows. The NPV calculated through Equation (1) is 11,863 thousand USD, while the B/C ratio derived from Equation (2) is 1.1. Since the NPV (11,863 thousand USD) is greater than zero, it indicates that the project is economically viable and can proceed. The B/C ratio result of 1.1, being greater than 1, also supports the conclusion of economic feasibility. However, a B/C ratio of 1.1 suggests economic feasibility but implies limited profitability. It was observed that the breakeven point is reached approximately in the 7th year as Figure 2 and Table 5.
This project demands a substantial initial construction cost of 118,116 thousand USD. Given the significant capital required and the difficulty in reversing decisions once construction is underway, hesitation exists regarding the implementation of a project with a B/C ratio of only 1.1. Nevertheless, these findings are limited in that they only account for current fixed cost values and do not consider future market uncertainties. To address this, an economic evaluation that incorporates market environment uncertainties and accounts for strategic decision-making flexibility in response to market changes is necessary. In this study, the economic feasibility was reevaluated using Real Options Analysis (ROA) in Section 3.3.
3.3. Project Valuation Using Real Option Analysis (ROA)
This section conducts an economic evaluation that incorporates market environment volatility and the value of strategic decision-making using Real Options Analysis (ROA). First, the parameters necessary for ROA analysis are estimated, and the Real Option Value (ROV) is calculated using a binomial lattice model. The ROV is determined under different scenarios by applying types of expansion and abandonment options. By comparing the ROV with the Net Present Value (NPV), the analysis identifies the value of market environment uncertainties and decision-making.
3.3.1. Volatility Estimation
Estimating volatility is crucial for assessing real options analysis (ROA). Volatility is defined as the measure of uncertainty or variability in the value of an underlying asset or project over time. It reflects the degree of fluctuation in potential outcomes, impacting the value of options to invest, defer, or abandon a project. High volatility enhances the value of real options by offering greater opportunities for strategic decision-making, as it indicates potential significant changes in project profitability or associated risks. Previous studies have identified that the key uncertainty factors significantly influencing the profitability of renewable energy plant construction projects are power generation output and electricity selling prices. Recently, the electricity selling price in Korea has shown a marked downward trend, accompanied by a highly uncertain market environment. Therefore, this study aims to quantify the volatility of electricity selling prices in Korea and incorporate it into the estimation.
While there are various methods to calculate volatility, this study employed the logarithmic cash flow return method. This approach calculates volatility based on the variability of cash flow estimates, which are also used in determining the underlying asset value. The logarithmic cash flow return method has been utilized in numerous studies[30,31,32,33,34,35,36]. Using the electricity selling price data shown in Table 6, volatility was estimated at 35%.
3.3.2. Expansion Option
This section aims to assess the project value by considering the potential scale-up of the floating solar power plant. The DCF analysis revealed that the NPV amounted to 11,863 thousand USD, with a benefit-cost (B/C) ratio of 1.1, indicating modest project profitability. However, if future market conditions become more favorable due to higher electricity selling prices or policy shifts, there may be opportunities to exercise expansion options to achieve additional profits. This study seeks to evaluate the value of expansion options, taking into account the uncertainty of future electricity selling prices. The results can provide valuable insights into the feasibility of developing and implementing the proposed floating solar power plant. If the expansion option value assessed through Real Options Analysis (ROA) surpasses the expansion value calculated through DCF analysis, pursuing the expansion option may be justified.
In this section, the option parameters for the Real Options Analysis (ROA) were calculated as presented in Table 7, considering an American Call expansion option type. Here, denotes the strike price at which the expansion option is exercised. The analysis assumed the construction and operation of a 100 MW power generation facility, with the cost of constructing the newly expanded facility reduced through integration with adjacent power generation sites. The variable E represents the expansion factor, indicating the extent of project expansion. In this study, the power plant was assumed to be scaled up by a factor of two, resulting in a total capacity of 200 MW. The Saemangeum Solar Power Plant operates 300 MW of land-based solar power along with various other power generation facilities, which supports the assumption of constructing a 200 MW floating solar power plant as reasonable. The term represents the option exercise periods, with 10 years used to capture market uncertainties over the next decade. As large-scale floating solar power plants using idle sea spaces have not yet been built in Korea, long-term monitoring of project stability is essential for such ventures.
- Result
In this section, a ROA based on the binomial lattice model was conducted using option parameters and Equation(4),(5). The real option valuation using the binomial lattice model followed these steps: First, a basic binomial lattice model was constructed. As explained in the theoretical framework, the real option value based on the binomial model is represented by a binomial tree that reflects the value fluctuations of the underlying asset through the iterative forward process, using the upward (u) and downward (d) factors applied to the underlying asset (S). The constructed tree is displayed, with values presented above each node in the Figure 3. Second, the present value at each preceding stage was sequentially calculated by applying the risk-neutral probability (p), upward factor (u), and downward factor (d) to the value of the underlying asset at t=10, obtained through the forward induction process. The option values related to project expansion were recorded below each node in the Figure 3. Third, the final value of the expansion option was determined. The value of the final option at T=1 was calculated as 223,154 thousand USD, encompassing the value of the currently operating power plant's underlying asset. This study aimed to isolate the value of the expansion option itself. The final expansion option value, referred to as the Real Option Value, was confirmed to be 93,175 thousand USD as Table 8. Fourth, the differences between Discounted Cash Flow (DCF) and Real Options Analysis (ROA) for the expansion options were examined. The following interpretation can be made when applying DCF analysis to the expansion options: the present value of the project’s cash flows amounted to 129,979 thousand USD. If the expansion project were executed at the present time, the additional profit generated would be 129,979 thousand USD, while the construction costs for the expansion would total 70,870 thousand USD. The NPV using the DCF approach can be computed as (129,979 - 70,870 thousand USD), resulting in a final NPV of 59,109 thousand USD.
For the purpose of simplifying these calculations, Python code was employed, as illustrated in Appendix A.
3.3.3. Abandonment Option
This section aims to evaluate the project value by considering the abandonment option for the operation of the floating solar power plant. According to the results of the DCF analysis, the project yields a NPV of 11,863 thousand USD and a B/C ratio of 1.1, indicating that while the project is profitable, the margin of profit is limited. In the event of a further decline in electricity sale prices, additional financial gains could be realized by ceasing operations and recovering the residual value of the invested assets. These findings underscore the potential for a strategic operational plan for the floating solar power plant as proposed in this study.
In this section, the option parameters for ROA were calculated considering the American put option type for abandonment, as presented in Table 9. The strike price, , represents the threshold at which the abandonment option is exercised. By ceasing the operation of the existing 100 MW power generation facilities, additional profits can be obtained through the recovery of the residual value. In this study, the residual value was assumed to be 40% of the initial construction cost. The parameter represents the option exercise period, which was set to 10 to incorporate market uncertainties over the next 10 years. Notably, in Korea, there has not yet been a case where a large-scale floating solar power plant was developed using unused sea space, highlighting the necessity of long-term project stability monitoring.
- Result
In this section, a ROA was conducted using a binomial lattice model with the parameters and Equation(8),(9). The final option value at was determined to be 132,925 thousand USD, which includes the value of the underlying asset represented by the currently operating power plant. This study specifically aims to isolate the value of the abandonment option. The calculated value of the abandonment option, termed the Real Option Value, was confirmed to be 2,946 thousand USD.
For the purpose of simplifying these calculations, Python code was employed, as illustrated in Appendix B.
Figure 4.
Abandonment Option Flow.
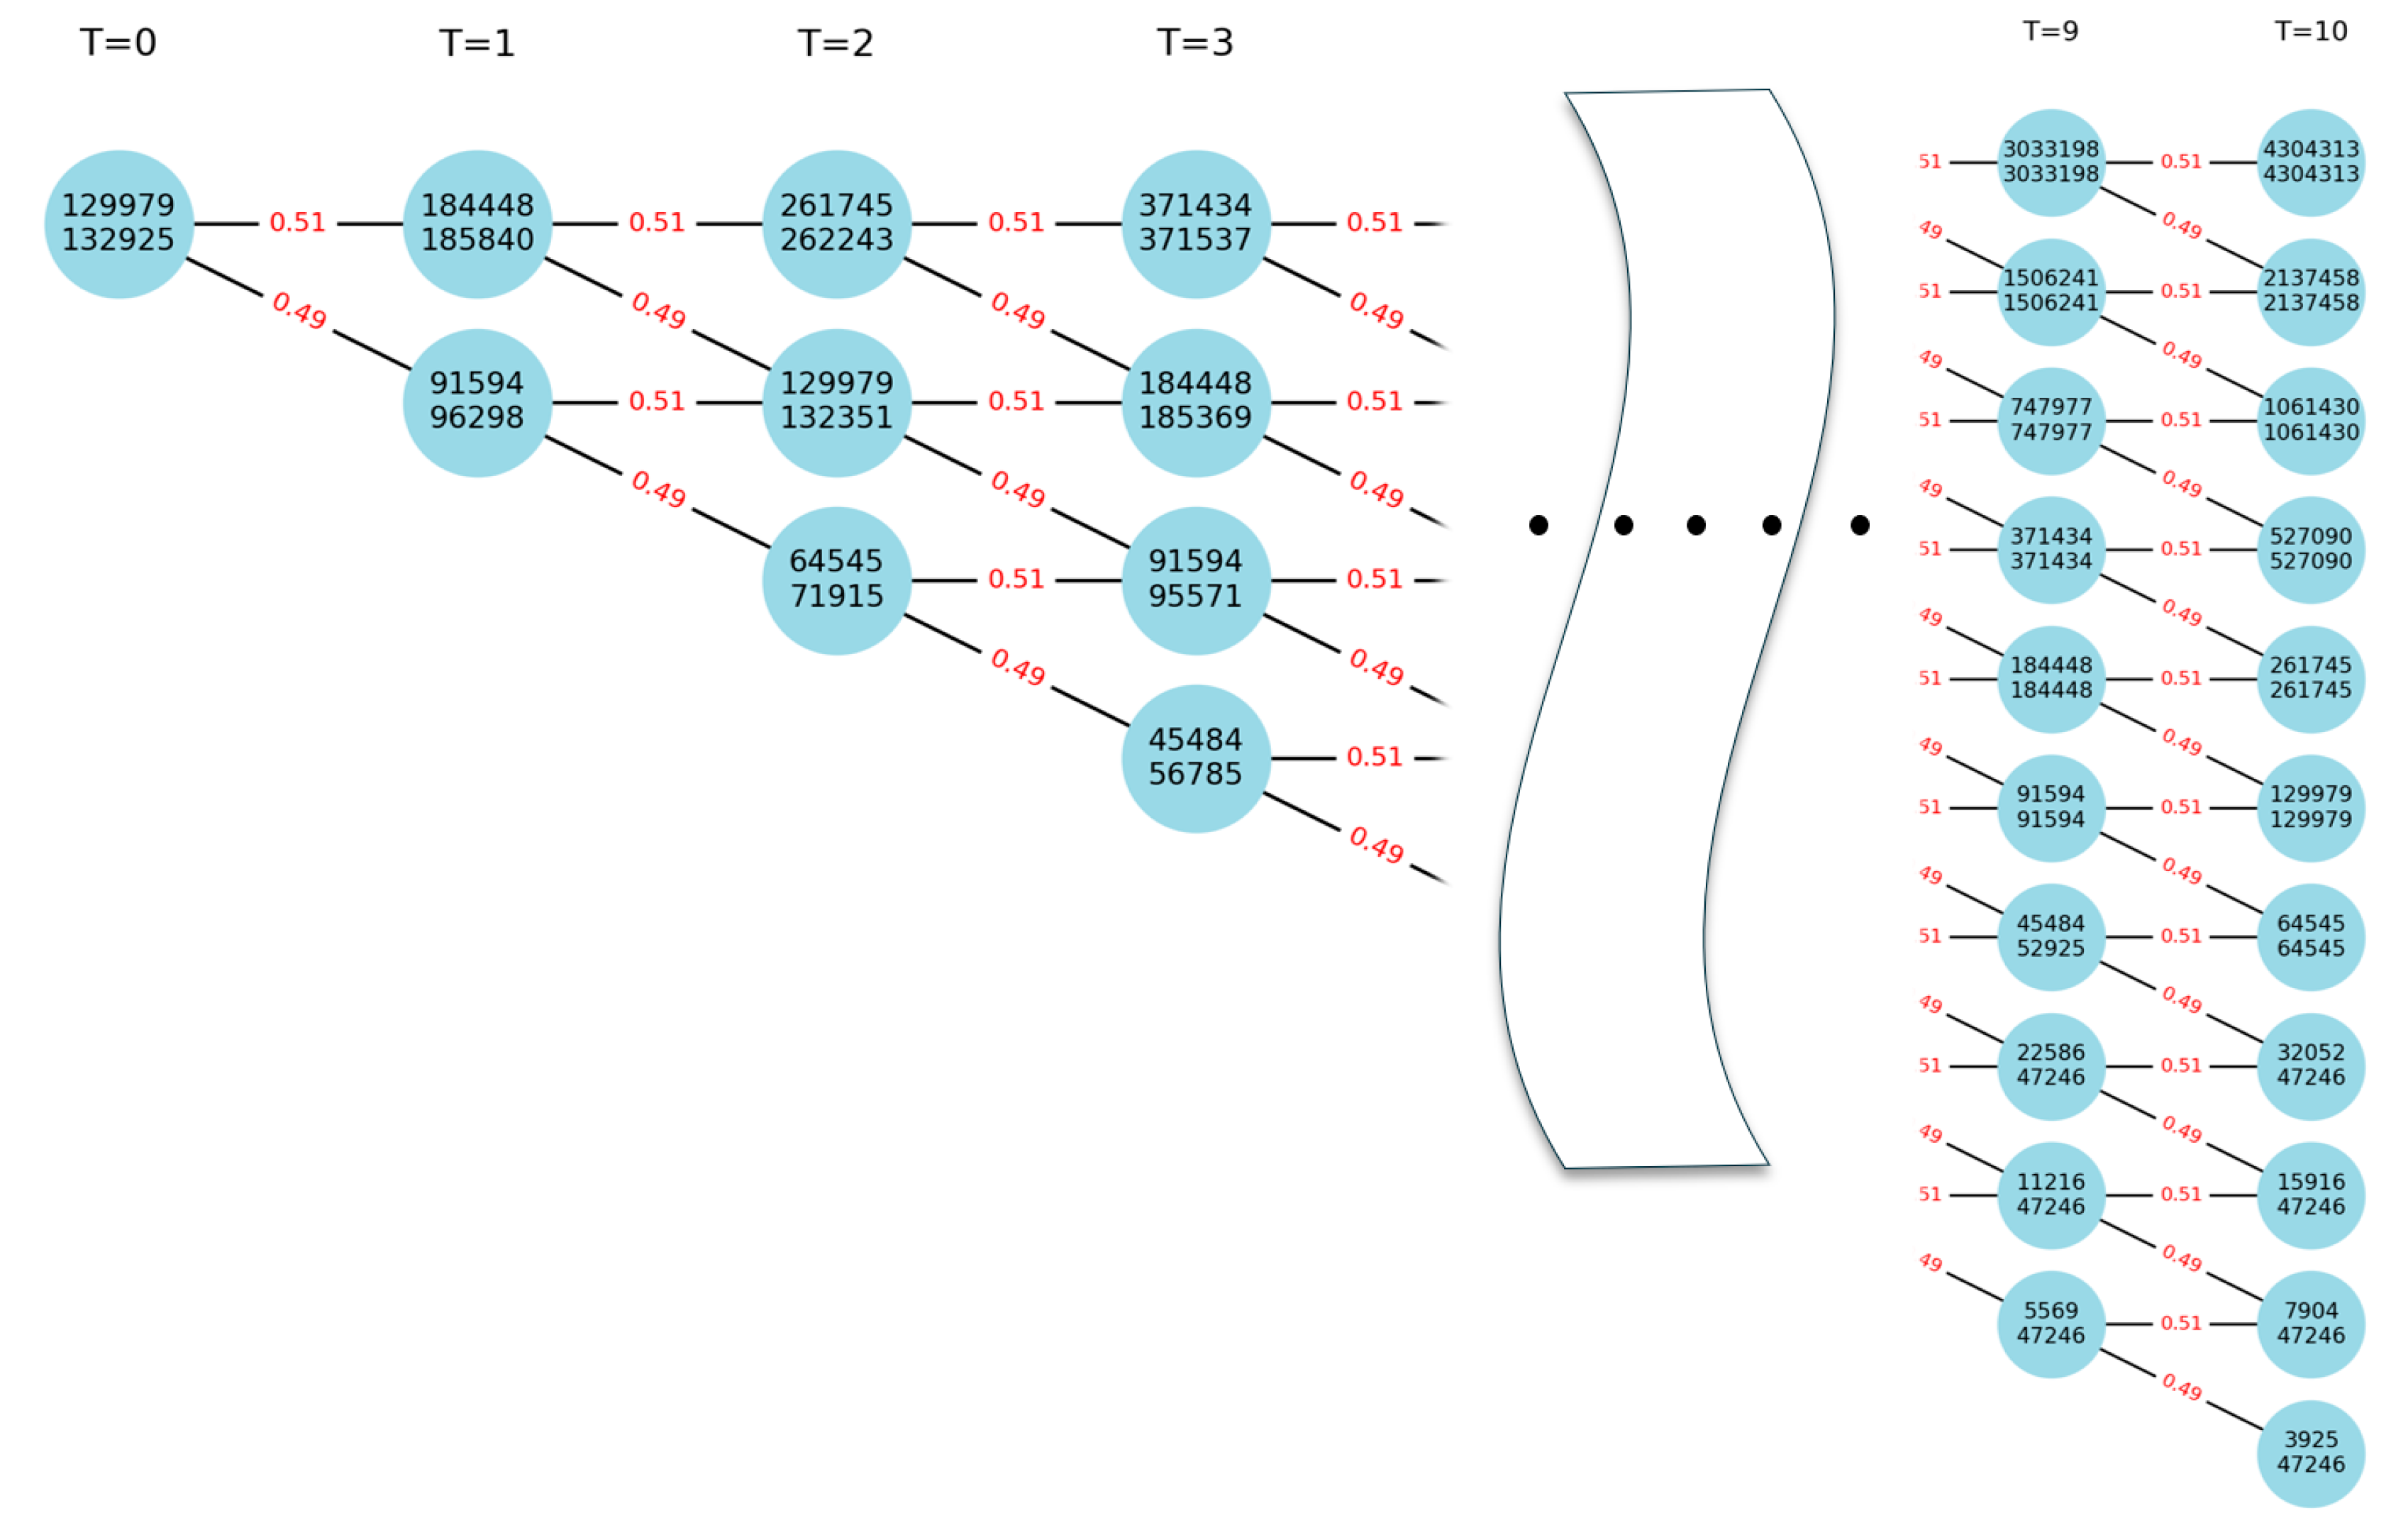
Table 10.
Abandonment Option Results.
| NPV | 11,863 thousand USD |
| ROV(Abandonment) | 2,946 thousand USD |
4. Discussion
In this section, we examine the optimal operational strategy for the floating solar power plant project based on the economic evaluation results derived from this study. The NPV, Expansion Option Value, and Abandonment Option Value were calculated as 11,863, 93,175, and 2,946 thousand USD, respectively, as detailed in Table 11. The NPV represents the value of operating the power plant under current conditions, while the Expansion Option Value incorporates the market outlook over the next 10 years, reflecting the value of expansion decisions. The Abandonment Option Value also considers the market conditions over the next decade, representing the value associated with the decision to cease operations.
The analysis results indicate that maintaining the current operations of the floating solar power plant is a more rational strategy compared to exercising the abandonment option. Additionally, the potential for higher profits through future expansion underscores the value of continued operation. This finding suggests that developing a large-scale floating solar power plant utilizing Korea's coastal idle areas is economically viable and represents a promising project with substantial potential for future expansion.
5. Conclusions
The increasing global share of solar energy is notable. Recently, the construction of floating solar power plants utilizing idle water spaces has been on the rise. Floating solar power plants offer several advantages: First, unlike land-based solar power generation, they incur no land purchase or rental costs, which can substantially reduce initial construction expenses and significantly enhance project profitability. Second, given the appropriate construction conditions, there is the added advantage of unrestricted land use, allowing for large-scale power plant expansion. Renewable energy facilities require considerable land for installation; however, Korea’s geographical constraints, including limited land area and numerous mountainous regions, pose challenges to the development of large-scale renewable energy projects. To meet the government’s renewable energy development and deployment goals, strategies that overcome these geographical limitations are essential. This paper proposes the construction of large-scale renewable energy facilities by leveraging idle spaces within the country. Specifically, it suggests the development of a 100 MW floating solar power plant utilizing available sea surface areas.
The proposed type of power plant involves significant initial construction costs and presents challenges in reversing decisions once construction begins. Therefore, conducting an economic feasibility analysis that incorporates future market uncertainties is crucial before project implementation. In this study, both Discounted Cash Flow (DCF) analysis and Real Options Analysis (ROA) were employed for economic evaluation. While the DCF method is straightforward to compute, it has the limitation of treating future market conditions as fixed values, failing to capture market uncertainties effectively. In contrast, ROA has the advantage of accounting for uncertainties in future market environments and reflecting the value of strategic decision-making in response to market changes.
This study assumes the operation of a 100 MW floating solar power plant as of 2024. The DCF analysis yielded a NPV of 11,863 thousand USD and a B/C ratio of 1.1, indicating economic feasibility. This result suggests that constructing such a power plant in Korea under similar project conditions in 2024 is viable. However, the B/C ratio of 1.1 implies limited assurance of stable profitability. To incorporate future market uncertainties into the economic evaluation, ROA was applied. The analysis monitored market changes over a 10-year period and calculated the option value for doubling the plant’s capacity (to 200 MW) under favorable market conditions, yielding a Real Option Value of 93,175 thousand USD. Additionally, the option value for abandoning plant operation under unfavorable market conditions was estimated, resulting in a Real Option Value of 2,946 thousand USD. Optimal operational strategies were derived based on these option values. The strategies include: (1) maintaining the current scale (100 MW) for 10 years, (2) expanding to 200 MW, or (3) ceasing plant operations, with corresponding values of 11,863, 93,175, and 2,946 thousand USD, respectively.
These findings indicate that while the current B/C ratio for the project is 1.1 in the existing renewable energy market, scaling up the operation is reasonable when considering future market uncertainties. This insight supports the Korean government’s strategic efforts to increase the share of renewable energy in the national energy supply.
The main contributions of this study are as follows: First, it provides specific types and operational strategies for power plants aimed at expanding renewable energy generation in Korea. Second, it performs and compares economic evaluations using both DCF and ROA, confirming the importance of incorporating market condition uncertainties into economic analyses and reflecting strategic decision-making values. Third, it conducts an economic feasibility assessment of power plant construction as of 2024, factoring in Korea’s current Renewable Portfolio Standards (RPS) and potential future changes in the renewable energy market. The proposed project case was based on real world examples; however, detailed technical reviews to calculate precise cost data are necessary for practical implementation. Fourth, the automated calculation algorithm presented in this study improves the accuracy and speed of complex Real Options calculations. Future research will focus on estimating specific data through technical, policy, and environmental reviews and performing ROV with consideration for reduction and compound options.
Author Contributions
All authors read and approved the final manuscript. Seoungbeom Na revised the manuscript and participated in designing the study. Youngwoong Lee interpreted the data and participated in revising the manuscript. Woosik Jang, corresponding author, provided direction of study and revised the manuscript for the final version.
Acknowledgments
This work is supported by the Korea Agency for Infrastructure Technology Advancement(KAIA) grant funded by the Ministry of Land, Infrastructure and Transport (Grant RS-2023-00245737).
Conflicts of Interest
The authors declare no conflict of interest.
Appendix A
| 1. | 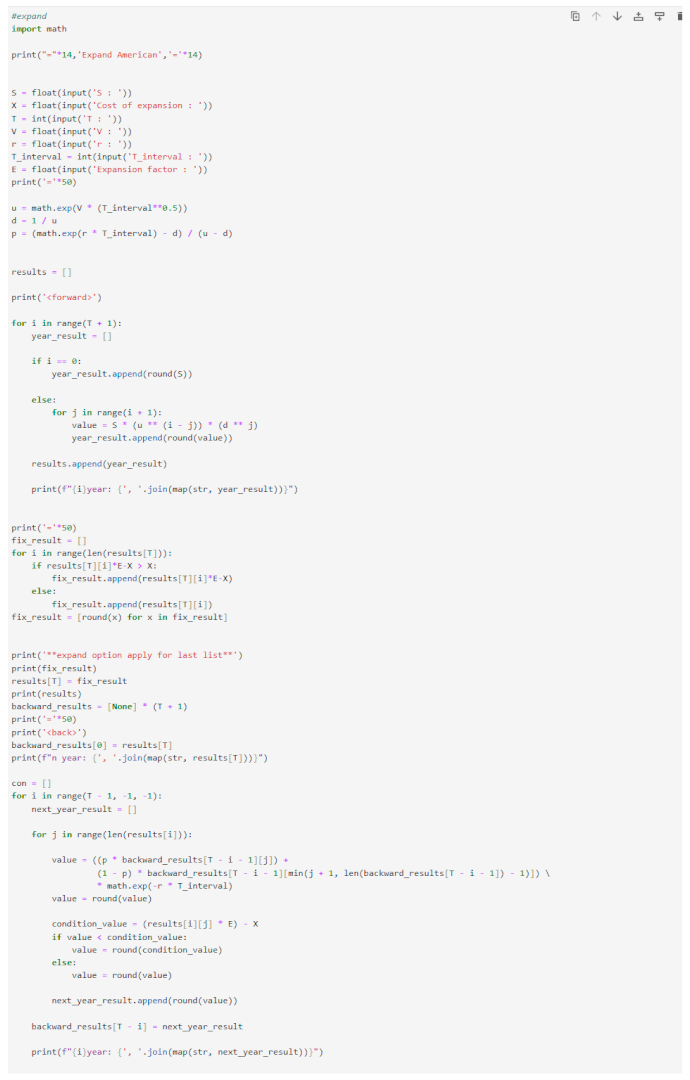 |
| Appendix A. python code(expansion) |
Appendix B
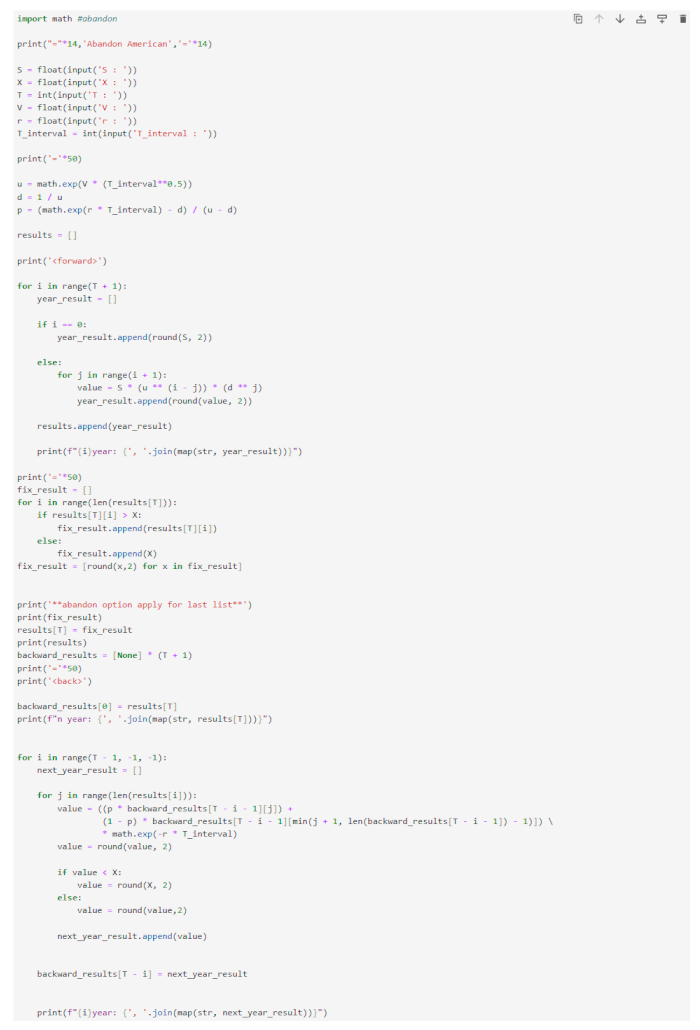
Appendix B. python code(abandonment)
References
- Cuce, E.; et al. Floating PVs in Terms of Power Generation, Environmental Aspects, Market Potential, and Challenges. Sustainability 2022, 14(5), 2626. [Google Scholar] [CrossRef]
- Suh, J.; et al. Comparison of Electric Power Output Observed and Estimated from Floating Photovoltaic Systems: A Case Study on the Hapcheon Dam, Korea. Sustainability 2019, 12(1), 276. [Google Scholar] [CrossRef]
- Di Bari, A. A Real Options Approach to Valuate Solar Energy Investment with Public Authority Incentives: The Italian Case. Energies 2020, 13, 4181. [Google Scholar] [CrossRef]
- Shin, J.; et al. "Analyzing public preferences and increasing acceptability for the Renewable Portfolio Standard in Korea. Energy Economics 2014, 42, 17–26. [Google Scholar] [CrossRef]
- Pema, W. APPLICATION OF DEPRECIATION NET PRESENT VALUE AND INTERNAL RATE OF RETURN IN ENGINEERING PROJECTS A BRIEF LITERATURE REVIEW. Journal of Applied Engineering, Technology and Management 2022, 2(1), 25–30. [CrossRef]
- Arrow, K. et al. Determining Benefits and Costs for Future Generations. Science 2013, 341, 349 - 350. [CrossRef]
- Guthrie, G. Real options analysis as a practical tool for capital budgeting. Pacific Accounting Review 2013, 25, 259–277. [Google Scholar] [CrossRef]
- Armstrong, M.; et al. Incorporating technical uncertainty in real option valuation of oil projects. Journal of Petroleum Science and Engineering 2004, 44, 67–82. [Google Scholar] [CrossRef]
- Zdeněk, Z. Generalised soft binomial American real option pricing model (fuzzy-stochastic approach). Eur. J. Oper. Res 2010, 207, 1096–1103. [Google Scholar] [CrossRef]
- Michailidis, A.; Mattas, K. Using Real Options Theory to Irrigation Dam Investment Analysis: An Application of Binomial Option Pricing Model. Water Resources Management 2007, 21, 1717–1733. [Google Scholar] [CrossRef]
- Hauschild, B.; Reimsbach, D. Modeling sequential R&D investments: a binomial compound option approach. Business Research 2015, 8, 39–59. [Google Scholar] [CrossRef]
- Emmanuel, F. S. et al. Performance Measure of Binomial Model for Pricing American and European Options. Appl. Comput. Math 2014, 3(6-1), 18-30. [CrossRef]
- Rambaud, S.C.; Pérez, A.M.S. The option to expand a project: its assessment with the binomial options pricing model. Operations Research Perspectives 2017, 4, 12–20. [Google Scholar] [CrossRef]
- D. Ashton et al. Binomial basis for linear information dynamics: real options, dividends and the valuation of equity. Accounting and Finance 2005, 45, 323-350. [CrossRef]
- Wang, T.; Dyer, J. Valuing Multifactor Real Options Using an Implied Binomial Tree. Decis. Anal 2010, 7, 185–195. [Google Scholar] [CrossRef]
- Leisen, D.; Reimer, M. Binomial models for option valuation - examining and improving convergence. Applied Mathematical Finance 1995, 3, 319–346. [Google Scholar] [CrossRef]
- Zhang, M.et al. Optimal design of subsidy to stimulate renewable energy investments: The case of China. Renewable & Sustainable Energy Reviews 2017, 71, 873-883. [CrossRef]
- Kim, K.T.; et al. Evaluation of R&D investments in wind power in Korea using real option. Renewable & Sustainable Energy Reviews 2014, 40, 335-347. [CrossRef]
- Walsh, D.; et al. When to invest in carbon capture and storage technology: A mathematical model. Energy Economics 2014, 42, 219–225. [Google Scholar] [CrossRef]
- Biondi, B.; et al. The 2015 European Thyroid Association Guidelines on Diagnosis and Treatment of Endogenous Subclinical Hyperthyroidism. Eur Thyroid J. 2015, 4(3), 149–63. [Google Scholar] [CrossRef]
- Siddiqui, A.; Marnay, C. Distributed Generation Investment by a Microgrid under Uncertainty. Energy 2006, 33, 1729–1737. [Google Scholar] [CrossRef]
- Park, H.; Nam, Y. A Real Options Analysis on Fuel Cell Power Plant considering Mean Reverting Process of Electricity Price, Environmental and Resource Economics Review, 2018, 27(4), 613-637. [CrossRef]
- Maeda, M. and Watts, D. The unnoticed impact of long-term cost information on wind farms’ economic value in the USA. – A real option analysis. Applied Energy 2019, 241, 540-547.
- Qu, J.; Jeon, W. Price and subsidy under uncertainty: Real-option approach to optimal investment decisions on energy storage with solar PV. Energy & Environment 2021, 33, 263 - 282. [CrossRef]
- Korea Meteorological Administration. Acailable online: http://data.kma.go.kr.
- Jordan, D.C.; Kurtz, S.R. Photovoltaic Degradation Rates-an Analytical Review. Progress in Photovoltaics: Research and Applications 2013, 21, 12–29. [Google Scholar] [CrossRef]
- Na, S.; Kim, K.; Jang, W.; Lee, C. Real Options Analysis for Land and Water Solar Deployment in Idle Areas of Agricultural Dam: A Case Study of South Korea. Sustainability 2022, 14, 2297. [Google Scholar] [CrossRef]
- International Energy Agency. Available online: https://www.iea.org/reports/world-energy-investment-2024/overview-and-key-findings.
- Ministry of Economy and Finance Korea Treasury Bond. Available online: https://ktb.moef.go.kr/eng/aucResDetail.do?nttId=634&bbsId=BBSMSTR_000000000004.
- Kodukula, P.; Papudesu, C. Project Valuation Using Real Options: A Practitioner's Guide; J. Ross Publishing: Fort Lauderdale, FL, USA, 2006; ISBN 978-193-215-943-1. [Google Scholar]
- Amram, M.; Kulatilaka, N. Real Options: Managing Strategic Investment in an Uncertain World (Financial Management Association Survey and Synthesis), 1st ed.; Oxford University Press: Oxford, UK, 1998; ISBN 978-087-584-845-7. [Google Scholar]
- Kim, K.; Kim, J.S. Economic Assessment of Flood Control Facilities under Climate Uncertainty: A Case of Nakdong River, South Korea. Sustainability 2018, 10, 308. [Google Scholar] [CrossRef]
- Kim, K.; Ha, S.; Kim, H. Using Real Options for Urban Infrastructure Adaptation under Climate Change. J. Clean. Prod. 2017, 143, 40–50. [Google Scholar] [CrossRef]
- Kim, K.; Jeong, H.; Ha, S.; Bang, S.; Bae, D.H.; Kim, H. Investment Timing Decisions in Hydropower Adaptation Projects Using Climate Scenarios: A Case Study of South Korea. J. Clean. Prod. 2017, 142, 1827–1836. [Google Scholar] [CrossRef]
- Oh, S.; Kim, K.; Kim, H. Investment Decision for Coastal Urban Development Projects Considering the Impact of Climate Change: Case Study of the Great Garuda Project in Indonesia. J. Clean. Prod. 2018, 178, 507–514. [Google Scholar] [CrossRef]
- Kim, K.; Park, T.; Bang, S.; Kim, H. Real Options-Based Framework for Hydropower Plant Adaptation to Climate Change. Eng. Manag. J. 2017, 33, 04016049. [Google Scholar] [CrossRef]
Figure 1.
Value of real options.
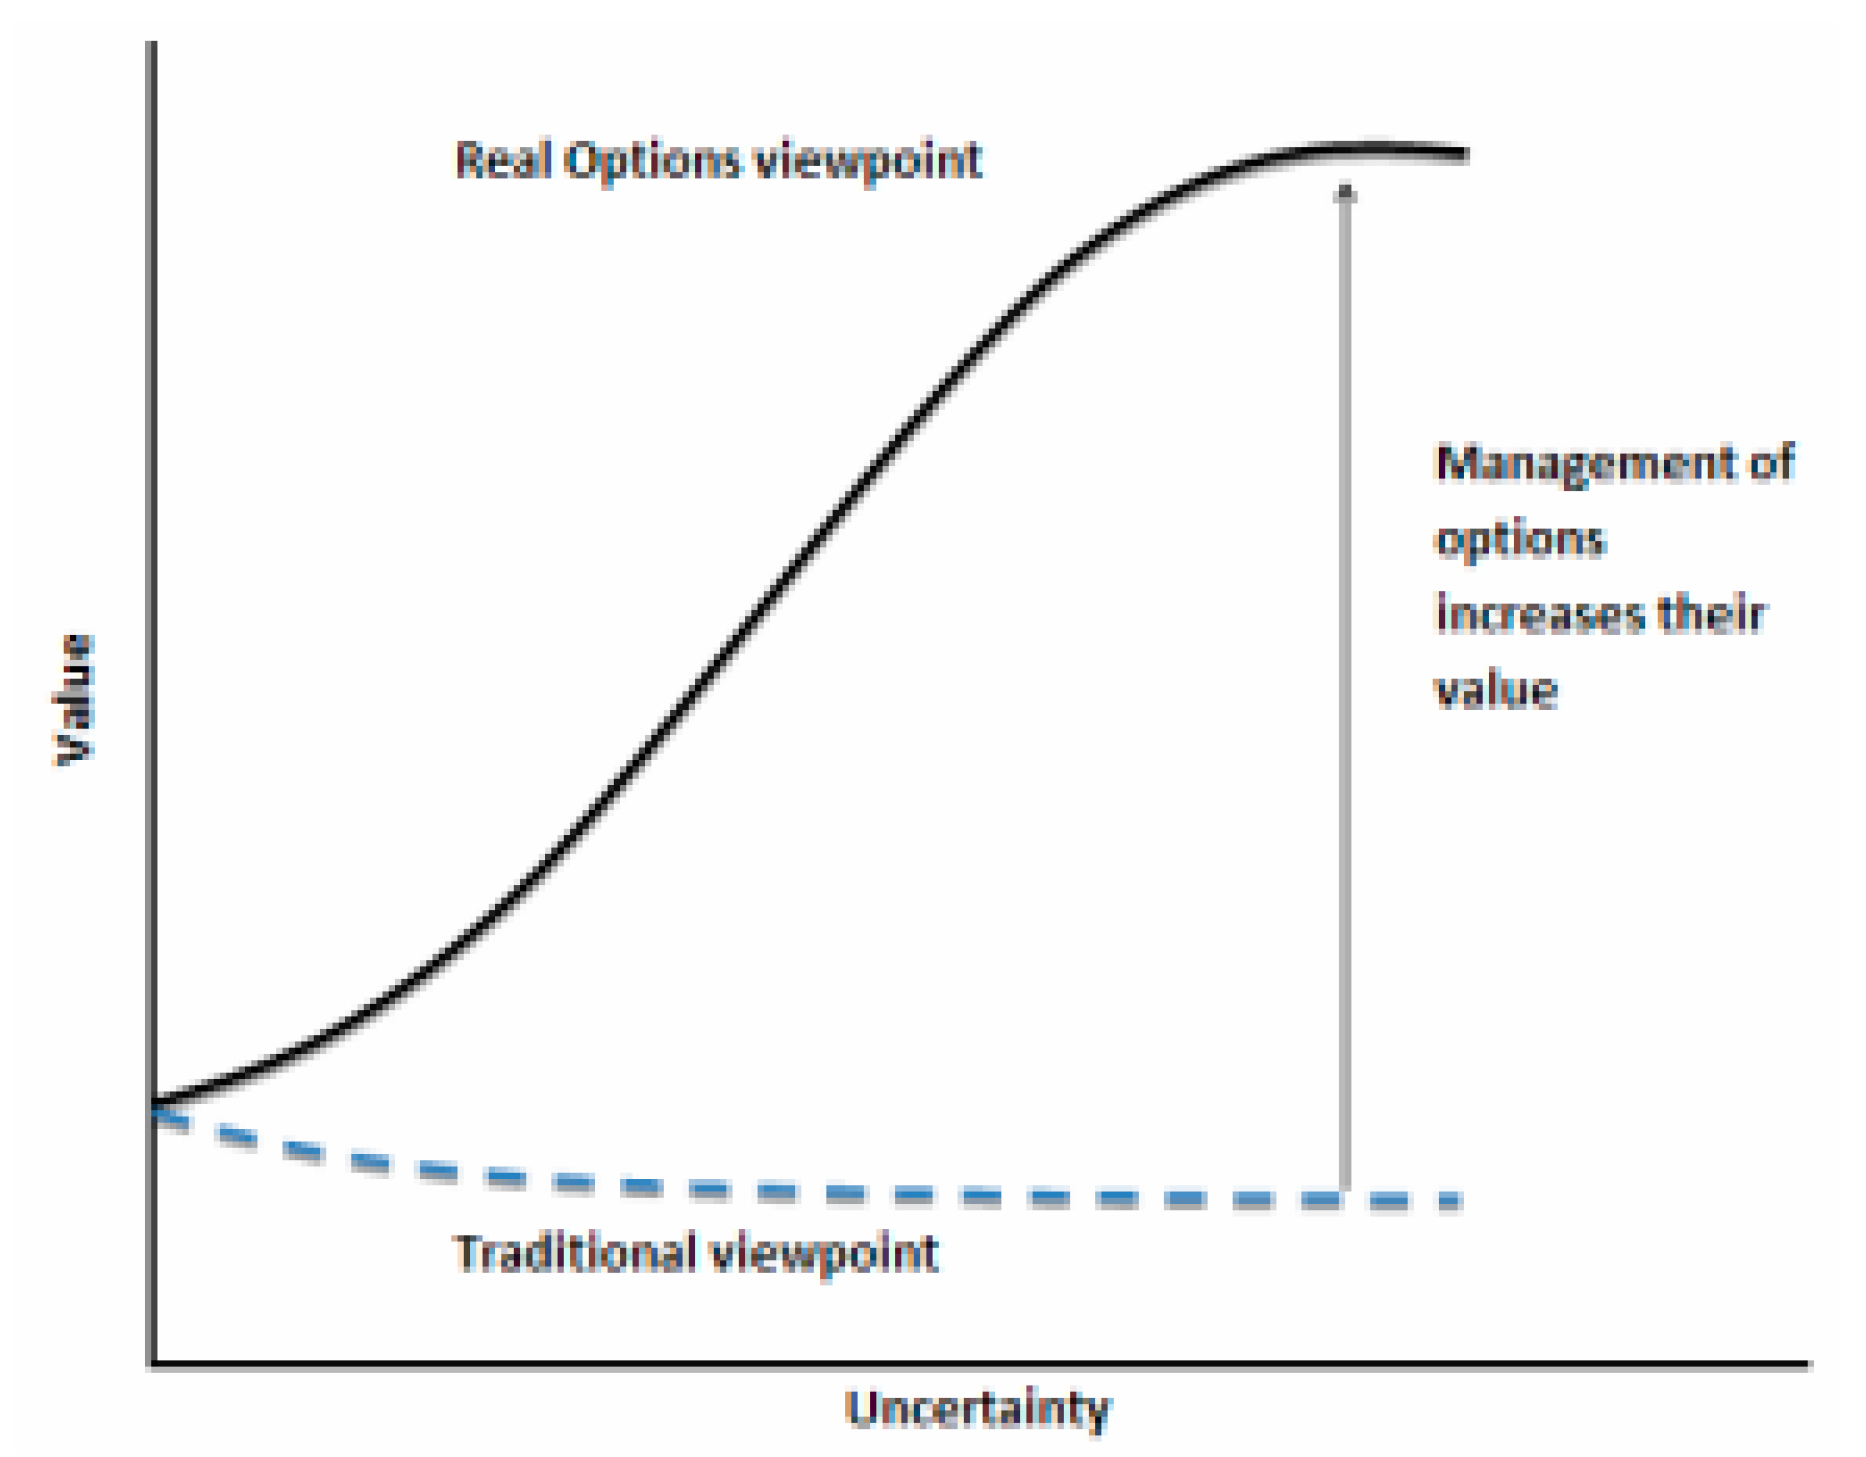
Figure 2.
DCF Evaluation.
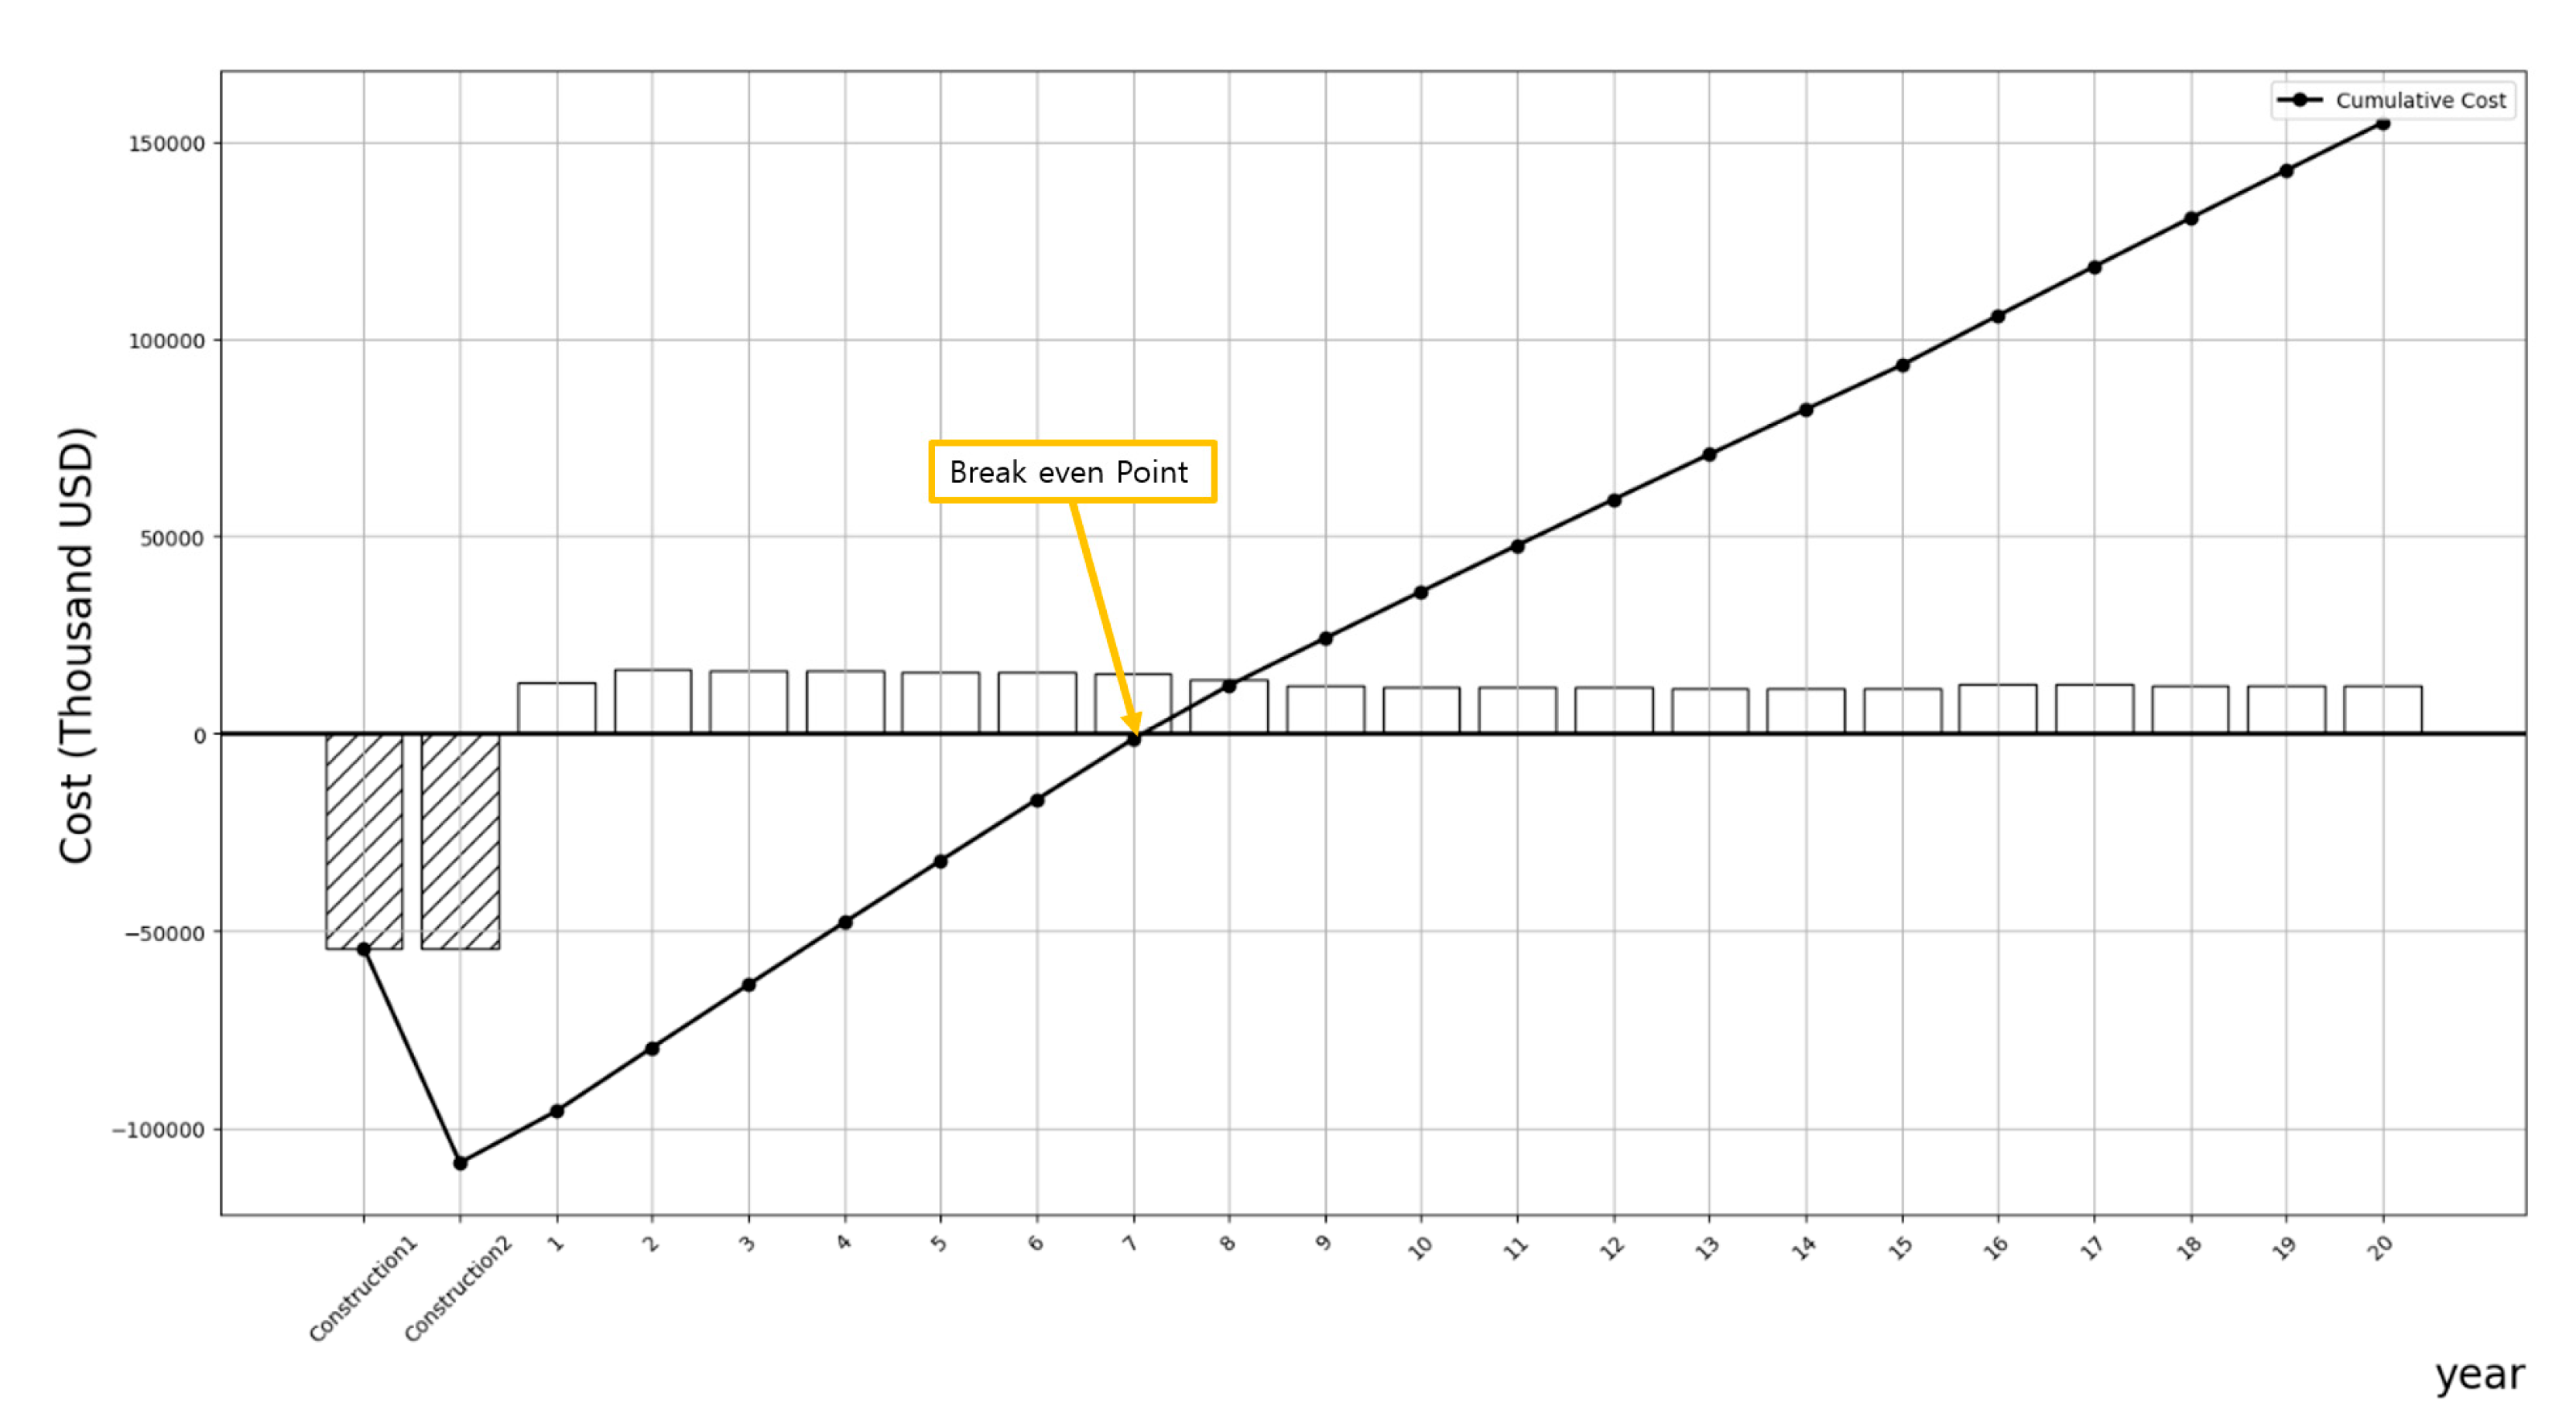
Figure 3.
Expansion Option Flow.
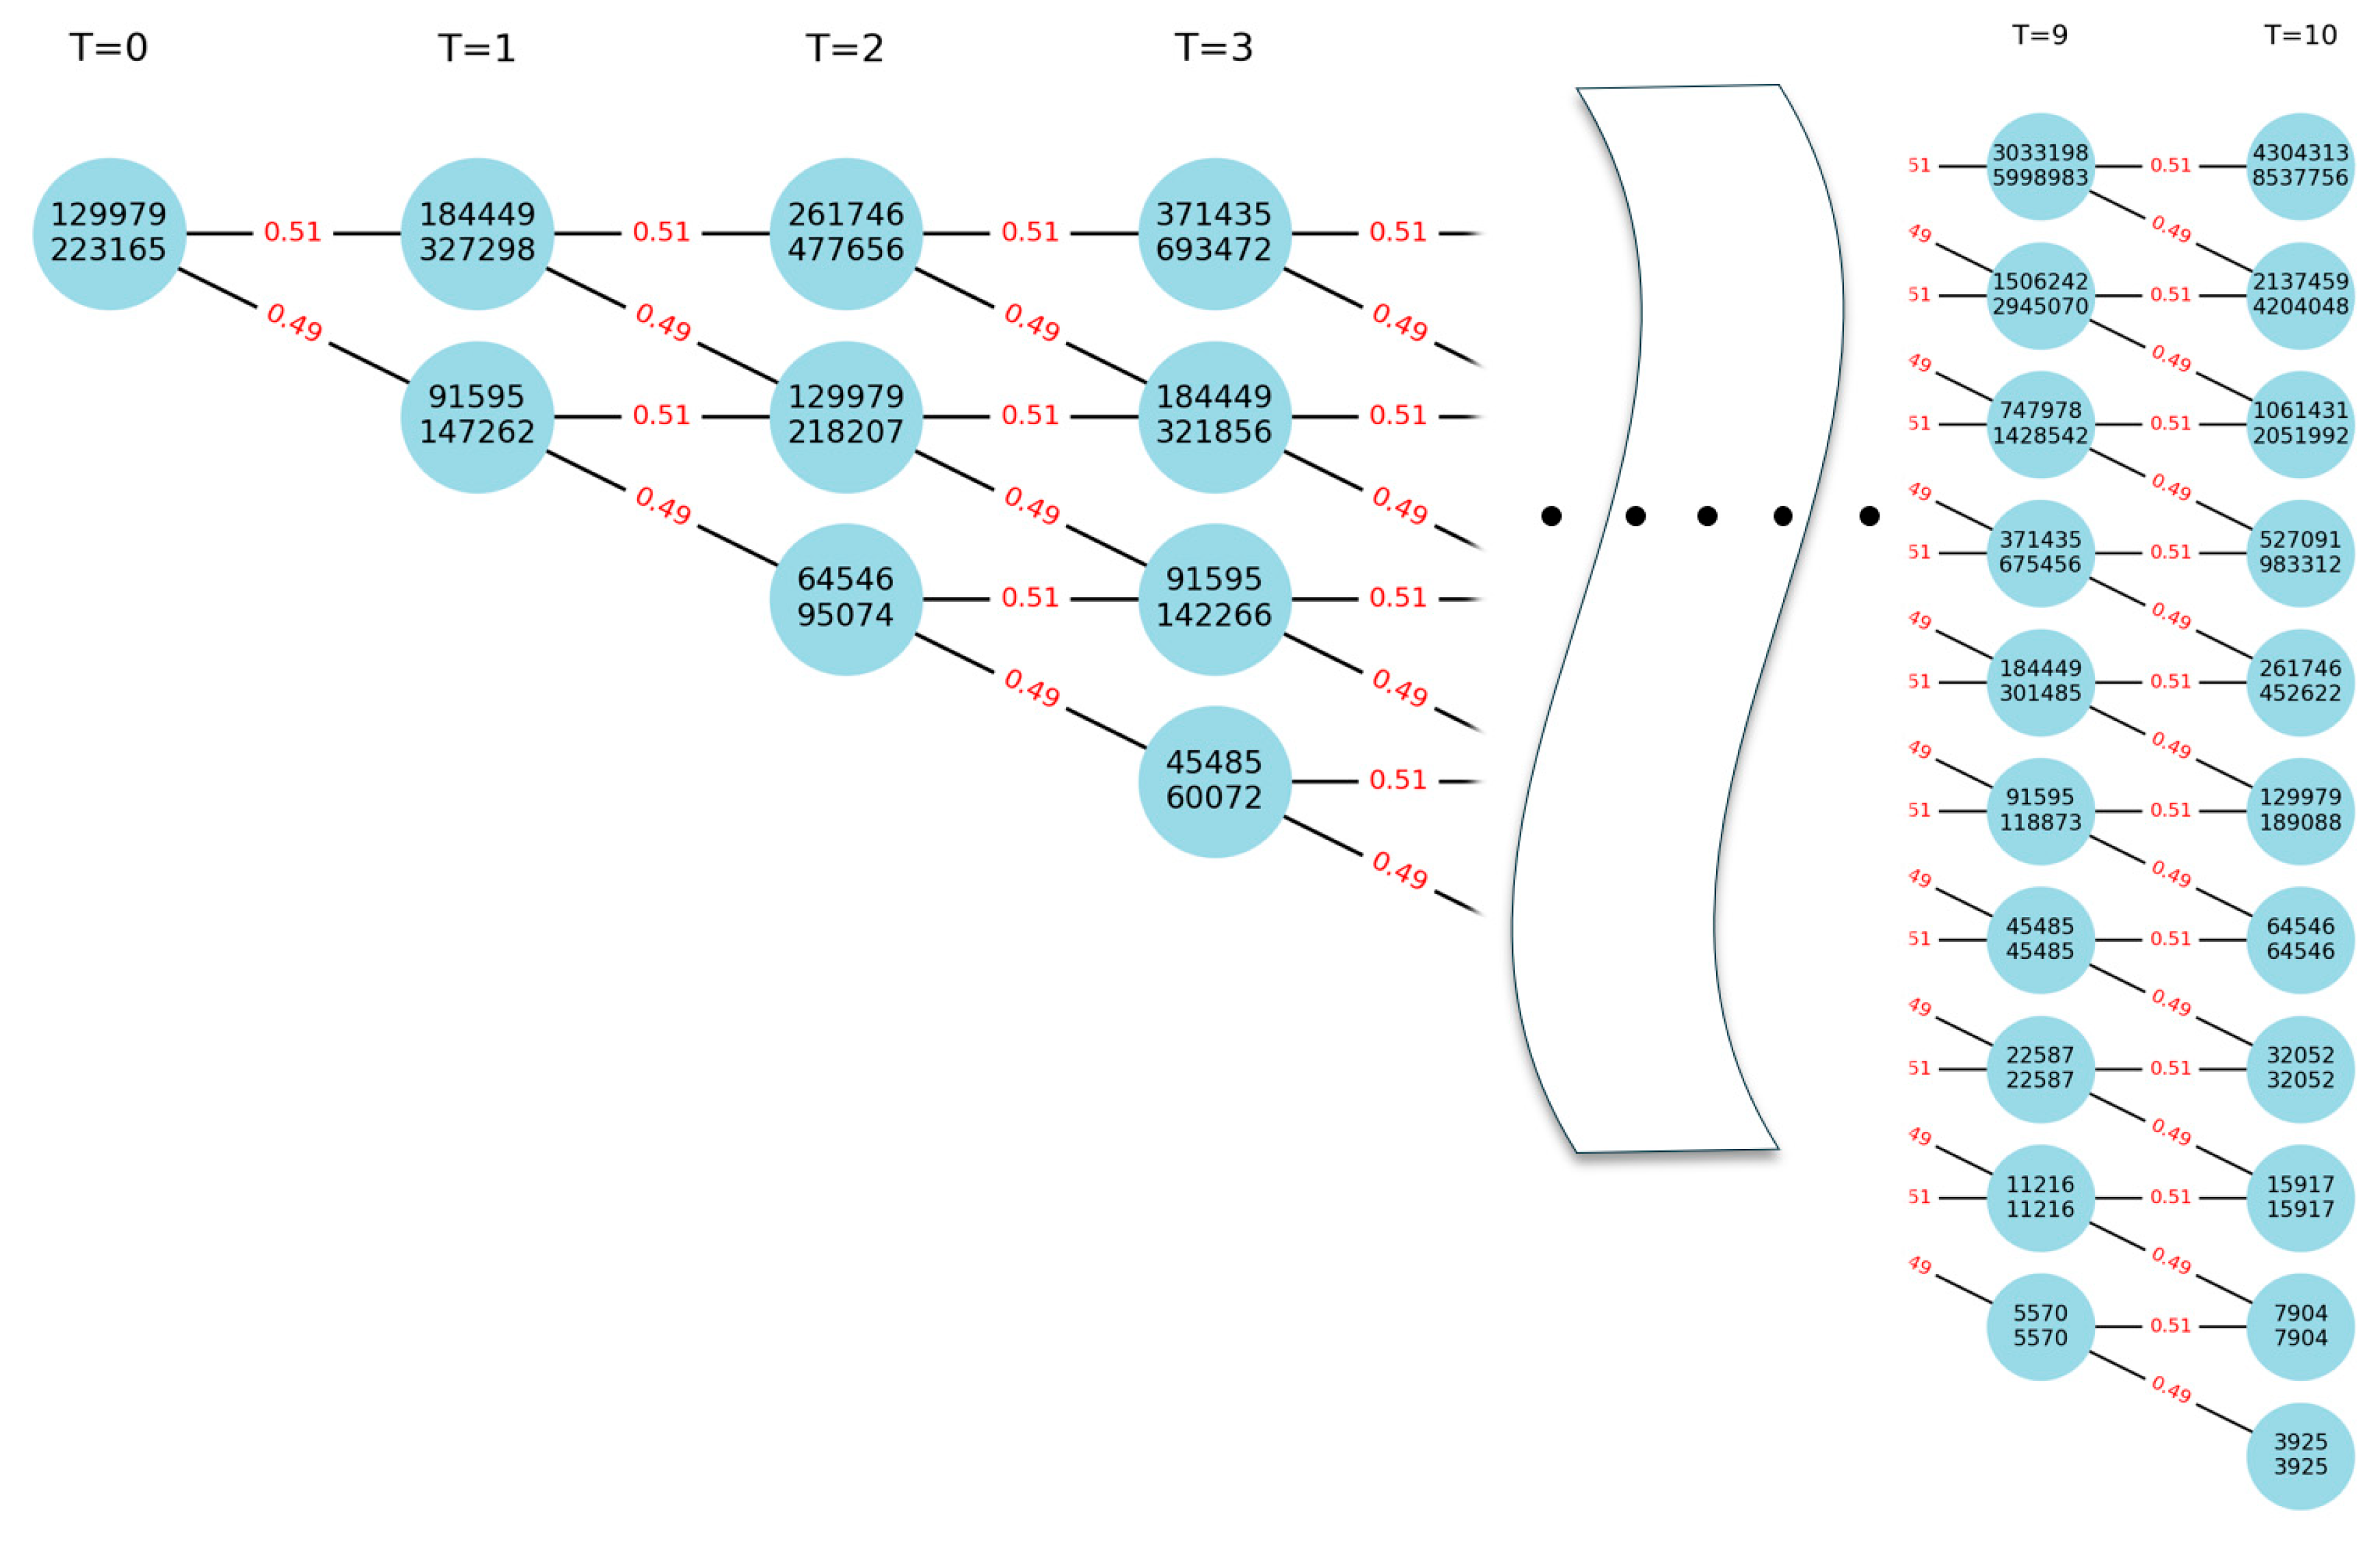
Table 1.
Real option types.
| Option Type | Meaning | Application Field |
|---|---|---|
| Deferral | delay the development timing | Construction, Real estate development, etc |
| Expansion/Contraction | expand or contract the scale | Consumer goods, Fashion Industry, etc. |
| Switching Option | change outputs | Petroleum Industry, Chemical Industry, etc. |
| Growth Option | required for additional investments | Social Infrastructure Investment, etc. |
| Abandonment Option | recover operational scale and asset value | Finance, Aviation, Transportation, etc. |
| Staged Option | decide on scale adjustments or withdrawal | Venture Capital, R&D, etc. |
| Compound Option | multiple options coexist | All industries, related projects |
Table 2.
Parameters of Binomial Model.
| Parameter | Description |
|---|---|
| Underlying Asset Value | |
| Strike Price | |
| Volatility | |
| Risk-Free Interest rate | |
| Option Life | |
| Time Step | |
| Up Factor | |
| Down Factor | |
| Risk-Neutral Probability |
Table 4.
REC weight of a solar power in South Korea (2024).
| REC weight | Installation type | Capacity(kW) |
|---|---|---|
| 1.2 | Installation on the ground | Below 100 |
| 1.0 | 100 ~ 3,000 | |
| 0.8 | Over 3,000 | |
| 1.5 | Installation on the roof of buildings and facilities | Below 3,000 |
| 1.0 | Over 3,000 | |
|
1.6 1.4 1.2 |
Installation on water | Below 100 100 ~ 3000 Over 3000 |
| 1.0 | For self-consumption | |
Table 5.
DCF Results.
| NPV | 11,863 thousand USD |
|---|---|
| B/C | 1.1 % |
| Breakeven Period | 7 year |
| Decision | Go (Low returns) |
Table 6.
REC weight of a solar power in South Korea.
| Year | SMP (USD/kWh) | REC (USD/kWh) | |
|---|---|---|---|
| 2024 | 0.08 | 0.04 | |
| 2023 | 0.09 | 0.04 | |
| 2022 | 0.08 | 0.05 | |
| 2021 | 0.08 | 0.06 | |
| 2020 | 0.07 | 0.06 | |
| 2019 | 0.08 | 0.05 | |
| 2018 | 0.08 | 0.08 | |
| 2016 | 0.07 | 0.11 | |
| 2015 | 0.09 | 0.08 | |
| 2014 | 0.12 | 0.09 | |
| 2013 | 0.13 | 0.15 | |
| 2012 | 0.14 | 0.15 | |
| Average | 0.09 | 0.08 |
Table 7.
Expansion option parameters for ROA.
| Parameter | Value |
|---|---|
| 129,979 thousand USD | |
| 70,870 thousand USD | |
| ET | 210 years |
| 35% | |
| 5% | |
| 1 |
Table 8.
Expansion Option Results.
| NPV | 11,863 thousand USD |
| ROV(Expansion) | 93,175 thousand USD |
Table 9.
Abandonment option parameters for ROA.
| Parameter | Value |
|---|---|
| 129,979 thousand USD | |
| 47,246 thousand USD | |
| 10 years | |
| 35% | |
| 5% | |
| 1 |
Table 11.
Optimal Operation Plan.
| DCF | Expansion | Abandonment | |
|---|---|---|---|
|
Value (thousand USD) |
11,863 | 93,175 | 2,946 |
Disclaimer/Publisher’s Note: The statements, opinions and data contained in all publications are solely those of the individual author(s) and contributor(s) and not of MDPI and/or the editor(s). MDPI and/or the editor(s) disclaim responsibility for any injury to people or property resulting from any ideas, methods, instructions or products referred to in the content. |
© 2024 by the authors. Licensee MDPI, Basel, Switzerland. This article is an open access article distributed under the terms and conditions of the Creative Commons Attribution (CC BY) license (https://creativecommons.org/licenses/by/4.0/).
Copyright: This open access article is published under a Creative Commons CC BY 4.0 license, which permit the free download, distribution, and reuse, provided that the author and preprint are cited in any reuse.


