
Submitted:
04 November 2024
Posted:
05 November 2024
You are already at the latest version
Abstract
The global industries are gradually moving towards the development of low-carbon, however, construction industry has significant energy consumption and carbon emissions. To making the promotion of industrialized construction with low-carbon and energy-efficient, prefabricated buildings are one of important ways to achieve environmental sustainability. This study first investigated the development and status of prefabricated concrete component factories in Fujian Province about regional distribution and production conditions and collecting data of carbon emissions, time and costs to create a multi-objective optimization model for intelligent and collaborative production. All while keeping costs as low as possible, using ant colony algorithms meets low-carbon and promotes sustainable development of prefabricated buildings. With the number of iterations, the overall cost shows a downward during the optimization process. According to optimization modes, the result of slabs indicates the minimum production cost (5.7023 million with carbon emissions 1154.85 tons), and a cost difference of 10000 can result in a maximum carbon emissions difference of 50 tons while minimizing costs to be the primary goal. Compared with general production, the optimization of collaborative production reduces both costs and carbon emissions. Meanwhile, focused on normal and rush mod, the cost reduced more than 20% can be down to 50% on carbon emissions. Therefore, effectively reducing carbon emissions in the component production will contribute to the sustainability of the construction industry.
Keywords:
low-carbon
; prefabricated building
; algorithms
; optimization
; data-driven
1. Introduction
The fifth report released by the Intergovernmental Panel on Climate Change (IPCC) shows that the construction industry accounts for 40% of global energy consumption and 36% of global carbon emissions [1]. A transition in the construction industry under low-carbon policies is imperative. In 2022, China’s "14th Five-Year Plan for the Development of the Construction Industry" proposed the integrated development of smart construction and new industrialized building methods, with plans for over 30% of new buildings to be prefabricated [2]. Currently, the prefabricated components of these buildings (like walls, floors, and stairs) are manufactured in factories, quickly transported and assembled on-site [3]. Because of high level of mechanization and standardization, prefabricated buildings can significantly reduce carbon emissions compared to traditional cast-in-place with concrete operations [4]. Therefore, the intelligent construction of prefabricated buildings has become an important transforming way of the construction industry in China [5].
Driven by policies, the increase in new prefabricated buildings has also increased the demand for prefabricated components, and the sustainability of prefabricated buildings is crucial to the development of China's low-carbon construction industry. Based on this, this study first investigated the development and status of prefabricated concrete component factories in Fujian Province, analyzing the regional distribution and production conditions, and collecting data on the carbon emissions, time, and costs associated as the three main objectives of production decision. Based on the actual needs of the prefabricated residential project in Fujian Province, a data-driven platform with ICT-BIM has been established. RFID technology is used to record dynamic information about components to create a multi-objective optimization model for collaborative production in the factories. It determines the current research gaps, and finds the optimal collaborative path under constraints of project duration and carbon emissions, all while keeping costs as low as possible. The study uses ant colony algorithms with multiple objectives to build an intelligent optimization model relationship between carbon output, time, and cost for procurement in prefabricated components. It tried to improve the current situation where decisions in prefabricated component factories are based on traditional experience, and promotes sustainable development in the industry.
2. Literature Review
Prefabricated buildings have better energy-saving characteristics [3,6]. Common prefabricated components include prefabricated structures such as wooden, light steel frame, steel and concrete. Among these, the energy consumption and carbon emissions from the first two have the least environmental impact [7]. Many studies have focused on the carbon emissions related to prefabrication technology from material production to on-site installation, indicating that this technology can reduce construction carbon emissions by 20-30% [7,8]. Compared to traditional cast-in-place construction, prefabricated buildings have a significantly positive impact on the ecological environment, resource conservation, energy saving, and carbon reduction [9]. The carbon emissions during the lifecycle are the highest [10,11], and important factors affecting this include the amount of carbon emissions, cost, and time. Therefore, how to reduce carbon levels will also impact the time and cost needed for production decisions. As a result, a number of studies [12,13,14] on the sustainable development of prefabricated buildings explore energy savings and emissions reduction through algorithms, simulations, and quantitative analysis, they focused on different pathways for carbon reduction [15,16,17,18].
Many studies used smart algorithms to tackle issues related to prefabricated buildings, such as genetic algorithms, simulated annealing algorithms, particle swarm optimization algorithms, ant colony algorithms and tabu search algorithms [19,20], to optimize the production sequence, transportation routes, storage strategies and to achieve goals like minimizing production costs, shortening construction times and reducing environmental pollution [21,22]. For example, to identify and evaluate carbon emissions in the production process of prefabricated components, the unit flow method, the fixed mold table method and the life cycle assessment method are used [23]. Taking the minimum completion time and minimum delay loss as optimization goals, a genetic algorithm decision support system is constructed to arrange production management [24]. In terms of component layout in the factory, a production combination optimization model based on heuristic algorithm is constructed [25]. Also considering resource constraints, a model optimization that improves the traditional genetic algorithm is proposed [26].
In addition, genetic algorithm, differential evolution algorithm and imperial competition algorithm are used to solve the problem of minimizing the total weighted advance and delay costs in the uncertainty and sequence of component production [27]. Considering the parallel work of serial machines in the production line, a prefabricated component production scheduling model was established using a genetic algorithm [28]. In addition, the dynamic flow shop scheduling model based on demand fluctuations is mainly used to integrate demand change factors such as lead time advance, emergency component insertion and order cancellation [22,29].
Multi-objective optimization techniques are commonly applied in scheduling and resource allocation of production. Generally, a comprehensive study is conducted on duration, cost, and quality in the engineering field [30]. The bi-objective shortest path problem was used ant colony algorithms to solve [31], and the problem about multi-mode with duration-cost discussed how to reduce the impact of uncertainty on project performance [32]. A project in Brazil assessed the factors affecting the energy performance of buildings, that using an improved algorithm for multi-objective optimization [33], and the other parameter optimization method that balancing emissions, time and costs proposing a multi-objective optimization model where were reduced by 11.7%, 7.7%, and 6.7% [34]. To integrate carbon emission factors into the decision-making process, it constructed optimal decision model with costs and carbon footprints [35]. For identifying the optimal implementation plan, it improved the ant colony algorithm to tackle the multi-objective optimization [36].
The applications of multi-objective optimization and intelligent algorithms have entered a new stage. This research uses the ant colony algorithm to solve intelligent optimization of the multi-objective model in collaborative production where basic data (carbon emissions, time, cost) are obtained from prefabricated factories surveyed.
3. Methodology and Materials
3.1. The Procedures
This study takes the carbon emission reduction of the construction industry as the goal, summarizes and analyzes the information about concrete components of prefabricated buildings and surveys production through prefabricated factories with concrete component in Fujian Province. In terms of the carbon emissions, costs and time involved in producing process for prefabricated walls and prefabricated stairs as the scope, it drives data to explore optimized collaborative production model based on cost. Therefore, the research mainly includes the following three parts, as illustrated in Figure 1.
(1) Through on-site investigation and production data collection at the prefabricated component factories in Fujian Provincial such as production status, development level and operation mode, it analyzes to provide reference for projects related to prefabricated buildings.
(2) Based on production data and its corresponding multi-attribute indicators, data mining is conducted with correlation analysis of carbon emissions, time, and cost, and an empirical model of component production is established.
(3) According to empirical model, the ant colony algorithm is used for multi-objectives optimization model on collaborative production of prefabricated components.
3.2. A Survey of Prefabricated Components Factories
This study investigated the distribution and operation of concrete prefabricated factories in Fujian Province. From 2018 to 2023, the number of component factories doubled from 15 to 30, as shown in Figure 2. According to China's requirements for establishing a prefabricated concrete component factory, the following conditions must be met: (1) it must have the capacity to produce components of prefabricated building such as slabs, beams, columns, stairs, wall panels, air conditioning panels, balcony slabs , etc.; (2) at least one automated assembly line must be equipped; (3) the annual designed production capacity should be no less than 50,000 m3; (4) it must be officially in production and meet quality standards. It investigated the operations of slabs, walls and staircase with concrete components in 30 prefabricated factories and sorted out 13 processes, as shown in Table 1 and Figure 3.
3.3. The Design of Multi-Objective Model
3.3.1. Problem Description
Due to the randomness of order reception, concrete prefabrication factories will implement various production modes to cope with different production conditions in actual production, which can mainly be categorized into three modes: saving, normal and rush. Commonly, concrete prefabrication factories collaborate to complete the required quantity for a project. The research question addressed in this paper is how to complete the production task under the constraints of prefabricated component delivery times while achieving relatively low costs and carbon emissions, as shown in Figure 3. Suppose there is an existing project that requires X units of specified size prefabricated components, distributed among N prefabrication factories that are located nearby. Based on data gathered from on-site investigations, each prefabricated factory involves 13 production processes, with each process having three production modes: "Saving" , "Normal" , "Rush" (Mode 1, Mode 2, Mode 3) corresponding with Parameters with carbon emissions-cost-time (CE-C-T) as Figure 4. The objective is to optimize the multi-objective on Mode and Parameter of the existing N prefabrication factories, using intelligent algorithms to determine an optimization result.
3.3.2. Design and Solution of Model
A single prefabricated component factory requires multiple processes to produce a component. Each process has multiple production modes, and each production mode requires different parameters (CE-C-T). In order to meet the constraints for different projects, collaborative production and corresponding models are usually required based on the actual conditions. Based on this, this study optimizes the selection of prefabricated factories and task allocation in the production stage to verify the decision-making scheme of the model.
The modeling work includes two parts, establishing the multi-objective model and solving the optimization model. The three major elements of the multi-objective model include decision variables (task allocation and mode), objective function (cost) and constraints (carbon emissions and time). The solution is divided into two problems, including solving factories production planning and selecting model, that is, the two problems are not independent. Each problem needs to call the calculation results of the other problem during the solution process, and iteratively calculate at the same time to obtain the optimal solution. It solves the optimization model through multiple iterative calculations for the two problems based on variable types.
Further explanation of these three functions for decision variables, objective function and constrains, that decision variables are production quantity of the prefabricated component factory as and no. of production process is . Objective function is the minimum total cost as . The constraints are production quantity, carbon emission limit, and time limit. The total production time in a single factory is as shown in equation (1), and the factory with the longest production time must not exceed the maximum time limit, as shown in equation (2).
Symbol definition of the model:
:The production quantity of the nth factory
: Total production quantity
:Mode 1 of the kth process in the nth factory
:Selection mode of the kth process in the nth factory
:Cost of producing a single component in mode m
:Carbon emissions of producing a single component in mode m
:Time of producing a single component in mode m
:Number of steam curing kilns
:Total production time of factory
:Total cost limit
:Total carbon emissions limit
:Total time limit
In the constraints, 、 are variable parameters that change depending on the path. Each path has its own optimal production plan. Therefore, this study uses the ant colony algorithm to determine the path and obtains the constant term of the linear model, and then uses it as the input module for the linear solver. The production plan derived from this is then sent back to the ant colony for multiple iterations to achieve optimized results.
3.4. The Method of Algorithm Solving
This research uses the Ant Colony Optimization algorithm (ACO) to solve the model of component factories and determine the minimum cost. Starting with the production plan obtained through linear solving as a known condition, it calculates the most recent path, then uses a linear solver to get the production plan, and through multiple iterations, arrives at the optimal solution. The specific process and setup parameters of ACO are described in Table 2.
4. Optimization of Intelligent Algorithms by Data-Driven
4.1. A Project with Collaborative Production in Prefabricated Factories
The project of prefabricated buildings located in the southeastern area of Fujian Province requires a total of 3,000 slabs, 3,000 walls and 800 stairs, which are planned to be completed by two nearby concrete prefabricated component factories. Currently, both Factory A (F-A) and Factory B (F-B) use automated production lines with 20 steam-curing kilns, and each component has 13 processes (P1,P2,...,P13)and 3 modes (M1, M2, M3). In order to meet the constraints of project requirements and with the goal of low total cost, it collaborated with two factories to optimize the production planning and production modes under low carbon emissions, as Figure 5. Taking the production time, cost and carbon emissions of each process with three modes required to solve the model as the basic data, this paper drives data from component factories in Fujian Province. Taking Factory A as an example, the production data of a slab is as shown in Table 3. Under the normal state of process 1(P1-M2), it takes 20 minutes for standardized size and costs for 110 RMB with carbon emission for 2.67/kg.CO2.
4.2. Optimization Modes of Prefabricated Components Production
First, the optimization path was solved based on the production time of 30 days for slabs, and the top ten options for the optimal solution that met all preset conditions were proposed, as described in Table 4. These display the optimal execution modes for each process corresponding to the various constraints, along with their objective function values. These display the optimal execution modes for each process corresponding to the various constraints, along with their objective function values. Taking optimization mode 1 as the production plan in this case, Factory A is assigned to produce 1,245 slabs, with the execution modes for each process set as 0, 0, 0, 1, 0, 1, 0, 0, 1, 0, 2, 0, 1. Here, 0, 1, 2 represent the choice of M1, M2, M3 for that process. For instance, if process 1 has an execution mode numbered 0, it indicates that Factory A opts for a saving production mode for process 1, and the same applies to the other steps and, Factory B.
The production requirement for this project is 3,000 slabs, with a total cost of 5.7023 million RMB and total carbon emissions of 1,154.85 tons. According to Table 5, Optimization mode 1 indicates the minimum production cost (C=5.7023 million, EC=1,154.85 tons), and Optimization mode 8 (C=5.7119 million, EC=1,153.8 tons) shows the minimum carbon emissions solution. It can also be seen that when minimizing costs is the primary optimization goal, a cost difference of 10,000 RMB can result in a maximum carbon emissions difference of 50 tons, shown as Figure 6. This indicates that with little change in production costs, adjustments in allocation quantities and production paths during multi-factories collaboration can effectively lower carbon emissions.
In order to further understand the convergence of the algorithm, it uses the cost decrease curve with the number of iterations to express the convergence trend that is obvious and t smooth, as shown in Figure 7. Therefore, the ACO algorithm has certain feasibility and high efficiency in solving optimization problems. To sum up, the method proposed in this research can perform combinatorial optimization on the production allocation and mode selection under the conditions of satisfying various constraints, which can make cost lower and reduce carbon emissions during the process. Therefore, under the intelligent analysis of data-driven algorithms for the objective function during iterative processes, the model has better convergence and is feasible for application.
Among the 3,000 of prefabricated walls required for production, the production time is 40 days and the total cost is 6.1058 million RMB for carbon emissions are 1,188.68 tons. According to Table 5, Optimization mode 4 indicates the minimum solution for carbon emissions (C=6.1142 million, EC=1185.90 tons). When the lowest cost is the first optimization goal of the walls, the cost difference is 15,000 RMB to be able to reach the maximum carbon emission difference for 65 tons.
The production time of prefabricated component stairs is 15 days, which the optimized analysis process is the same as slabs and walls. The total cost of required 800 stairs is 1.9448 million RMB, and total carbon emissions are 410.71 tons. Applying the multi-objective optimization model solving for collaborative production, the maximum cost gap is 20,800 RMB and the maximum gap of carbon emissions is 7.05 tons. Compared with prefabricated slabs and walls, in collaborative production aiming at low cost, it is difficult to reduce the carbon emissions of mass production through production paths.
4.3. Results
In order to verify the effect of this model for cost-carbon optimization, it takes prefabricated component slabs as an example. The results of the intelligent optimization model were compared with a single path for M1, M2 and M3. That is only a single production path under the same production plan, and the results of cost and carbon emissions are shown in Table 6. The study found that the costs and carbon emissions in the situations of M2 and M3 (Normal mode and Rush mode) are much higher than those of M1 (Saving mode). And there has 7 modes of M1 not to meet production time limit. The two prefabricated factories in this project, the actual total cost of adopting M1 is still higher than that result of the intelligent optimization model, which shows that it can reduce the total production cost and achieve lower carbon emissions by optimizing conditions.
Comparing the costs and carbon emissions of the intelligent optimization model summarized in Table 6 with the single production path, the average cost reduction is approximately 1.52%, and the carbon emissions are reduced by 0.23%. Compared with the M2(normal mode), the reduced value of cost and carbon emissions are 23.1% and 52.27%. Compared with M2(the rush mode, the average cost is reduced by 22% and carbon emissions are reduced by 49%.
5. Conclusions
With the development of industrialization, low carbon and intelligence in the construction industry, the demand of prefabricated buildings is increasing year by year that promotes the increase in the number of prefabricated component factories. Effectively reducing carbon emissions in the component production stage will contribute to the sustainability of the construction industry. This research conducts multi-objective model and optimizes solutions for collaborative production of multiple factories. With the number of iterations, the overall cost shows a downward during the optimization process. Compared with general production, the optimization of production collaboration reduces both costs and carbon emissions. The highlight is focused on normal and rush mode. When the cost is reduced by more than 20%, carbon emissions can be reduced by about 50%. It shows that multi-mode of collaborative production will reduce the cost of the project's prefabricated components and can bring the lowest carbon emissions under optimized cost conditions. Therefore, the study seeks the optimal mode of collaborative production through intelligent data-driven in prefabricated component factories to improve the production, which will help the development of prefabricated buildings and promote environmental sustainability.
Author Contributions
Conceptualization, C.L. Ho; methodology, C.L. Ho and C. C. Wang; software, C. C. Wang; validation, Qi Shenjun; formal analysis, Zhang Zichen; investigation, Zhang Zichen; resources, Qi Shenjun; data curation, Qi Shenjun; writing—original draft preparation, C.L. Ho and Zhang Zichen; writing—review and editing, C.L. Ho and C. C. Wang; supervision, C.L. Ho; project administration, Qi Shenjun. All authors have read and agreed to the published version of the manuscript.
Funding
This research received no external funding.
Data Availability Statement
Not applicable.
Conflicts of Interest
The authors declare no conflict of interest.
References
- IPCC. Climate Change 2023 Synthesis Report. Contribution of Working Groups I, II and III to the Sixth Assessment Report of the Intergovernmental Panel on Climate Change 2023, 35–115.
- Lu, H.; You, K.; Feng, W.; Zhou, N.; Fridley, D.; Price, L.; de la Rue du Can, S. Reducing China’s building material embodied emissions: Opportunities and challenges to achieve carbon neutrality in building materials. iScience 2024, 27, 109028. [Google Scholar] [CrossRef] [PubMed]
- Gao, Y.; Li, Z.; Zhang, H.; Yu, B.; Wang, A. carbon emission analysis model for prefabricated construction based on LCA. Journal of Engineering Management 2018, 32, 30–33. [Google Scholar]
- Dahiya, D.; Laishram, B. Life cycle energy analysis of buildings: A systematic review. Building and Environment 2024, 252, 111160. [Google Scholar] [CrossRef]
- Ullah, H.; Zhang, H.; Huang, B.; Gong, Y. BIM-Based Digital Construction Strategies to Evaluate Carbon Emissions in Green Prefabricated Buildings. Buildings 2024, 14, 1689. [Google Scholar] [CrossRef]
- Bian, J.; Liu, C.; Zuo, C.; Hao, J.; Ma, W.; Duan, B.; Chen, C.; Liu, J. Reducing Carbon Emissions from Prefabricated Decoration: A Case Study of Residential Buildings in China. Buildings 2024, 14, 550. [Google Scholar] [CrossRef]
- Tavares, V.; Lacerda, N.; Freire, F. Embodied energy and greenhouse gas emissions analysis of a prefabricated modular house: The “Moby” case study. Journal of Cleaner Production 2019, 212, 1044–1053. [Google Scholar] [CrossRef]
- Cheng, Z.; Zhang, T.; Zhou, X.; Li, Z.; Jia, Y. Life cycle environmental and cost assessment of prefabricated components manufacture. Journal of Cleaner Production 2023, 415, 137888. [Google Scholar] [CrossRef]
- Hao, J.L.; Cheng, B.; Lu, W.; Xu, J.; Wang, J.; Bu, W.; Guo, Z. Carbon emission reduction in prefabrication construction during materialization stage: A BIM-based life-cycle assessment approach. Science of the Total Environment 2018, 723, 137870. [Google Scholar] [CrossRef]
- Yazdani, M.; Kabirifar, K.; Fathollahi-Fard, A.M.; Mojtahedi, M. Production scheduling of off-site prefabricated construction components considering sequence dependent due dates. Environmental Science and Pollution Research 2021, 1–17. [Google Scholar] [CrossRef]
- Liu, W.; Tao, X.; Mao, C.; He, W. Scheduling optimization for production of prefabricated components with parallel work of serial machines. Automation in Construction 2023, 148, 104770. [Google Scholar] [CrossRef]
- Lim, T.K.; Gwak, H.S.; Kim, B.S.; Lee, D.E. Integrated carbon emission estimation method for construction operation and project scheduling. KSCE Journal of Civil Engineering 2016, 20, 1211–1220. [Google Scholar] [CrossRef]
- Zhu, H.; Hong, J.; Shen, G.Q.; Mao, C.; Zhang, H.; Li, Z. The exploration of the life-cycle energy saving potential for using prefabrication in residential buildings in China. Energy and Buildings 2018, 166, 561–570. [Google Scholar] [CrossRef]
- Sebaibi, N.; Boutouil, M. Reducing energy consumption of prefabricated building elements and lowering the environmental impact of concrete. Engineering Structures 2020, 213, 110594. [Google Scholar] [CrossRef]
- Wang, H.; Wang, Y.; Zhao, L.; Wang, W.; Luo, Z.; Wang, Z.; Luo, J.; Lv, Y. Integrating BIM and machine learning to predict carbon emissions under foundation materialization stage: Case study of China's 35 public buildings. Frontiers of Architectural Research 2024, 13, 876–894. [Google Scholar] [CrossRef]
- Zhang, X.; Chen, H.; Sun, J.; Zhang, X. Predictive models of embodied carbon emissions in building design phases: Machine learning approaches based on residential buildings in China. Building and Environment 2024, 258, 111595. [Google Scholar] [CrossRef]
- Liu, G.; Chen, R.; Xu, P.; Fu, Y.; Mao, C.; Hong, J. Real-time carbon emission monitoring in prefabricated construction. Automation in Construction 2020, 110, 102945. [Google Scholar] [CrossRef]
- Wang, Q.; Guo, W.; Xu, X.; Deng, R.; Ding, X.; Chen, T. Analysis of carbon emission reduction paths for the production of prefabricated building components based on evolutionary game theory. Buildings 2023, 13, 1557. [Google Scholar] [CrossRef]
- Xiang, Y.; Ma, K.; Mahamadu, A.; Florez-Perez, L.; Zhu, K.; Wu, H. Embodied carbon determination in the transportation stage of prefabricated constructions: A micro-level model using the bin-packing algorithm and modal analysis model. Energy and Buildings 2023, 279, 112640. [Google Scholar] [CrossRef]
- Cao, W.; Sun, Y. Evolutionary game analysis of collaborative prefabricated buildings development behavior in China under carbon emissions trading schemes. Sustainability 2024, 16, 8084. [Google Scholar] [CrossRef]
- Li, X.; Xie, W.; Xu, L.; Li, L.; Jim, C.Y.; Wei, T. Holistic life-cycle accounting of carbon emissions of prefabricated buildings using LCA and BIM. Energy and Buildings 2022, 266, 112136. [Google Scholar] [CrossRef]
- Du, J.; Dong, P.; Sugumaran, V. Dynamic production scheduling for prefabricated components considering the demand fluctuation. Intelligent Automation and Soft Computing 2020, 26, 715–723. [Google Scholar] [CrossRef]
- Liu, G.; Gu, T.; Xu, P.; Hong, J.; Shrestha, A. A production line-based carbon emission assessment model for prefabricated components in China. Journal of Cleaner Production 2019, 209, 30–39. [Google Scholar] [CrossRef]
- Ko, C.H. An integrated framework for reducing precast fabrication inventory. Journal of Civil Engineering and Management 2010, 16, 418–427. [Google Scholar] [CrossRef]
- Dong, Y.H.; Jaillon, L.; Chu, P.; Poon, C.S. Comparing carbon emissions of precast and cast-in-situ construction methods - A case study of high-rise private building. Construction and Building Materials 2015, 99, 39–53. [Google Scholar] [CrossRef]
- Xie, L.; Chen, Y.; Chang, R. Scheduling optimization of prefabricated construction projects by genetic algorithm. Applied Sciences 2021, 11, 5531. [Google Scholar] [CrossRef]
- Yazdani, M.; Kabirifar, K.; Fathollahi-Fard, A.M.; Mojtahedi, M. Production scheduling of off-site prefabricated construction components considering sequence dependent due dates. Environmental Science and Pollution Research 2021, 1–17. [Google Scholar] [CrossRef]
- Liu, W.; Tao, X.; Mao, C.; He, W. Scheduling optimization for production of prefabricated components with parallel work of serial machines. Automation in Construction 2023, 148, 104770. [Google Scholar] [CrossRef]
- Chen, K.; Xu, G.; Xue, F.; Zhong, R.Y.; Liu, D.; Lu, W. A physical internet-enabled Building Information Modelling system for prefabricated construction. International Journal of Computer Integrated Manufacturing 2018, 31, 349–361. [Google Scholar] [CrossRef]
- Calis, G.; Yuksel, O. An improved ant colony optimization algorithm for construction site layout problems. Journal of building construction and planning research 2015, 3, 221. [Google Scholar] [CrossRef]
- Ghoseiri, K.; Nadjari, B. An ant colony optimization algorithm for the bi-objective shortest path problem. Applied Soft Computing 2010, 10, 1237–1246. [Google Scholar] [CrossRef]
- Hazır, Ö.; Haouari, M.; Erel, E. Robust scheduling and robustness measures for the discrete time/cost trade-off problem. European Journal of Operational Research 2010, 207, 633–643. [Google Scholar] [CrossRef]
- Maciel, T.D.S.; Cruz, A.S.; Torres, M.; et al. Multi-objective optimization of school building envelope for two distinct geometric designs in southern Brazil. Indoor and Built Environment 2023, 32, 1778–1797. [Google Scholar] [CrossRef]
- Lu, Q.; Chen, Y.; Zhang, X. Grinding process optimization considering carbon emissions, cost and time based on an improved dung beetle algorithm. Computers & Industrial Engineering 2024, 197, 110600. [Google Scholar] [CrossRef]
- Daskin, M.; Benjaafar; Li Y. Carbon footprint and the management of supply chains: insights from simple models. IEEE transactions on automation science and engineering: a publication of the IEEE Robotics and Automation Society 2013, 10, 99–116. [CrossRef]
- Li, Y.; He, Y. Multi-objective optimization of construction project based on improved ant colony algorithm. Tehnički vjesnik 2020, 27, 184–190. [Google Scholar] [CrossRef]
Figure 1.
The conceptual framework of optimization model.
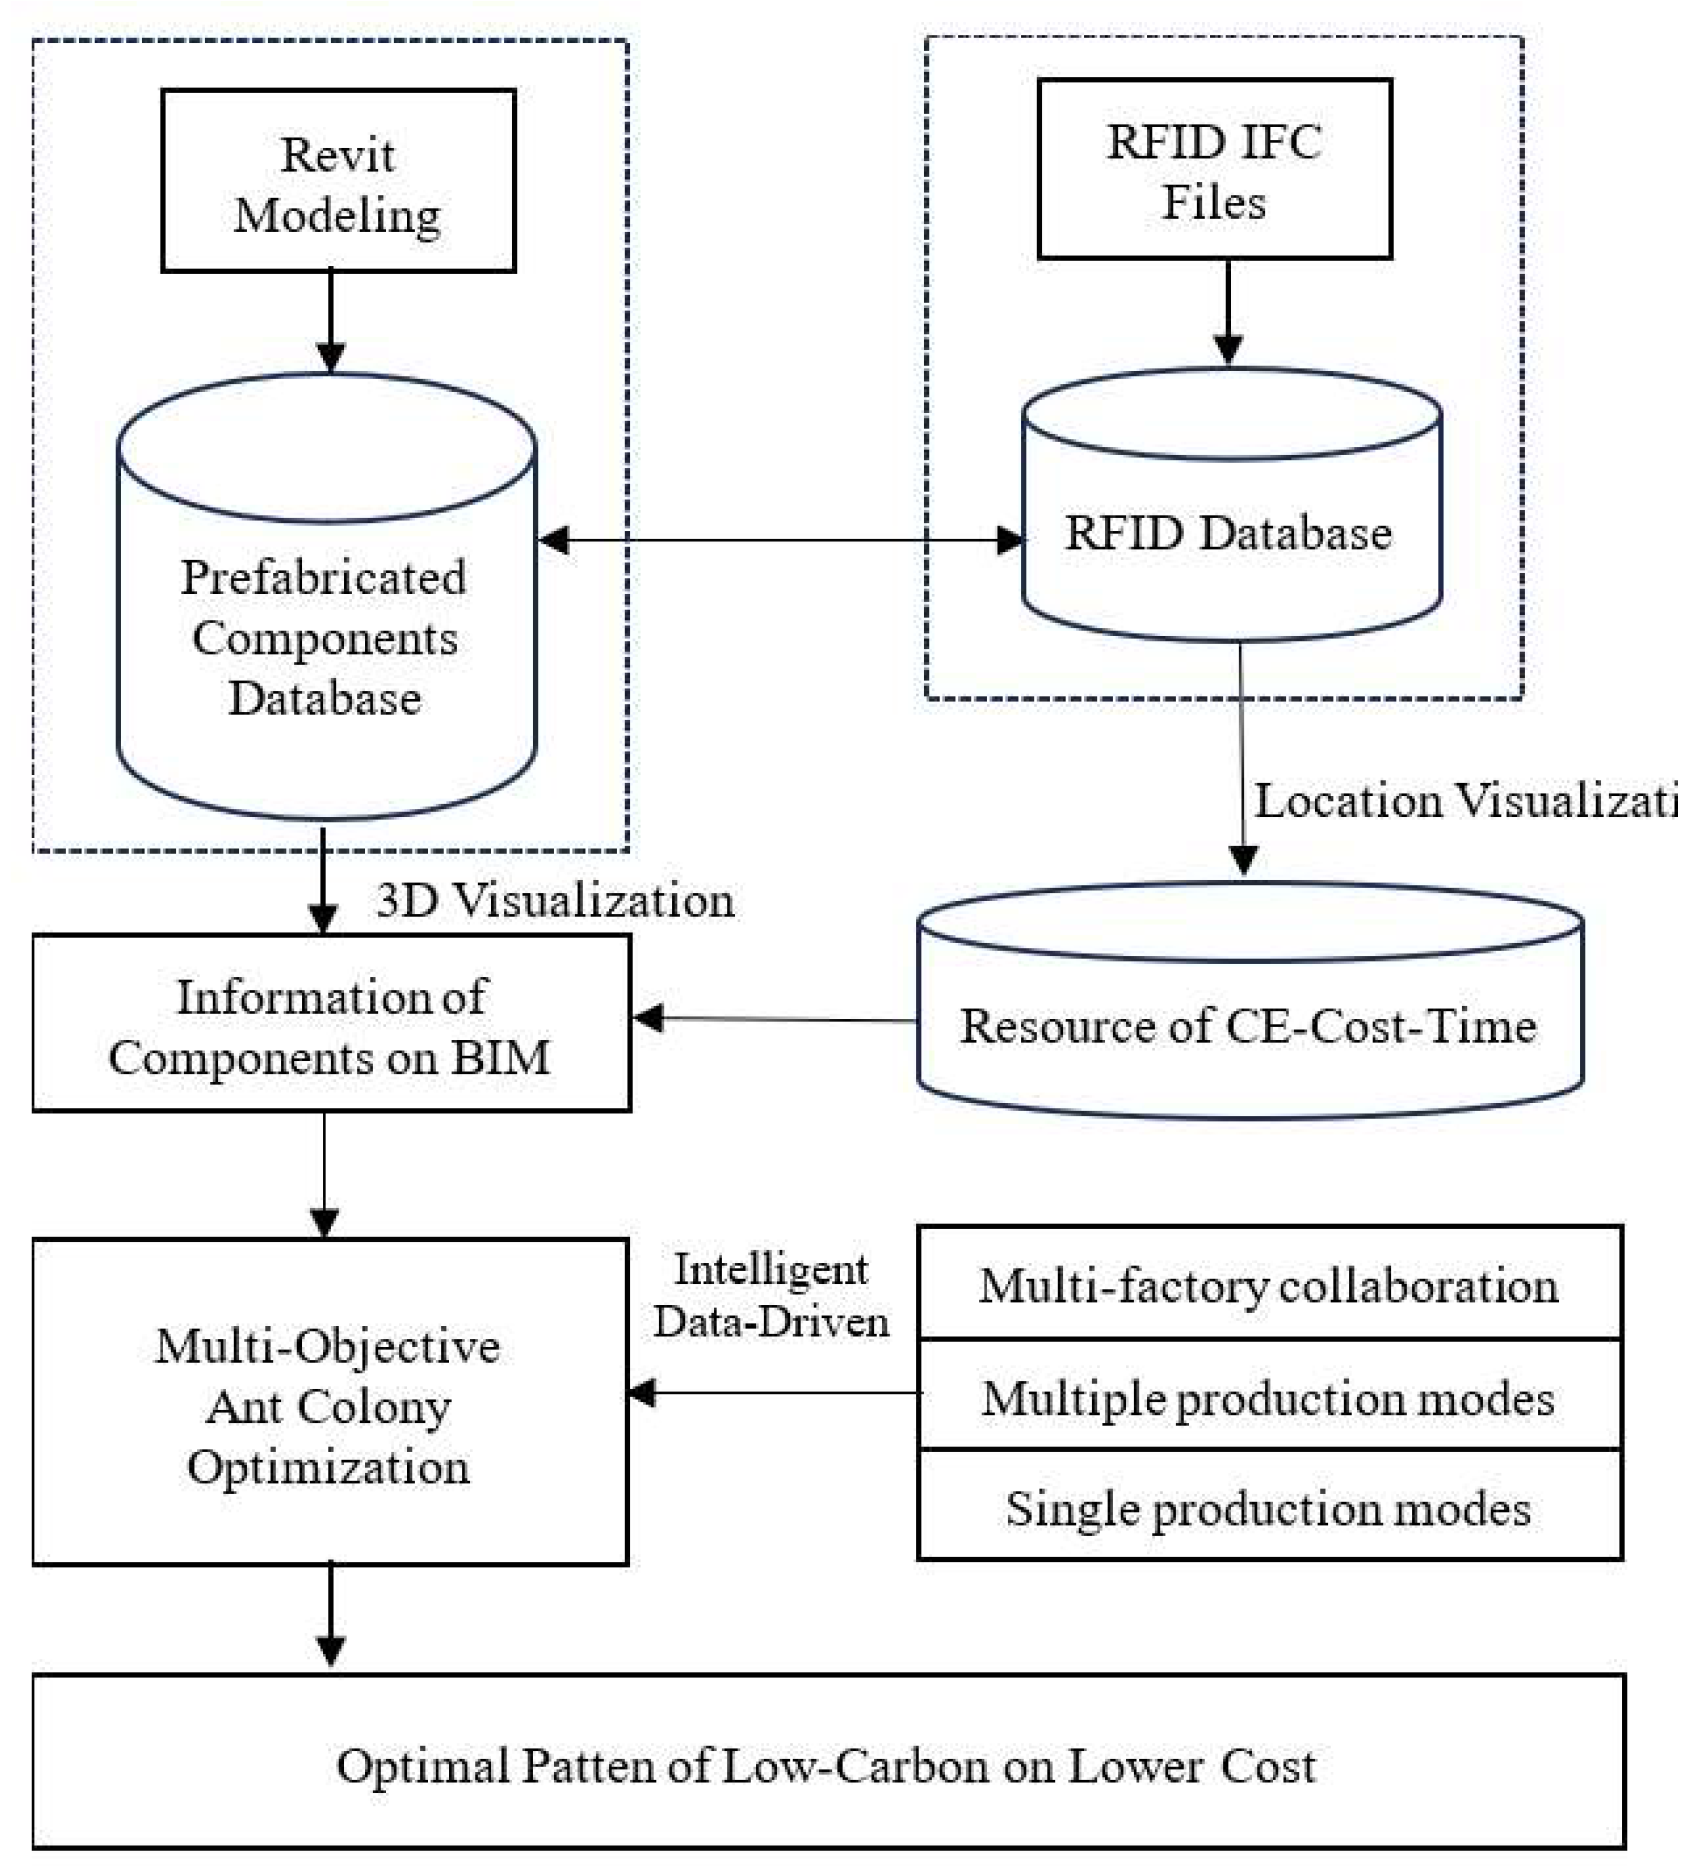
Figure 2.
The distribution and changes of prefabricated concrete component factories in Fujian Province.
Figure 2.
The distribution and changes of prefabricated concrete component factories in Fujian Province.
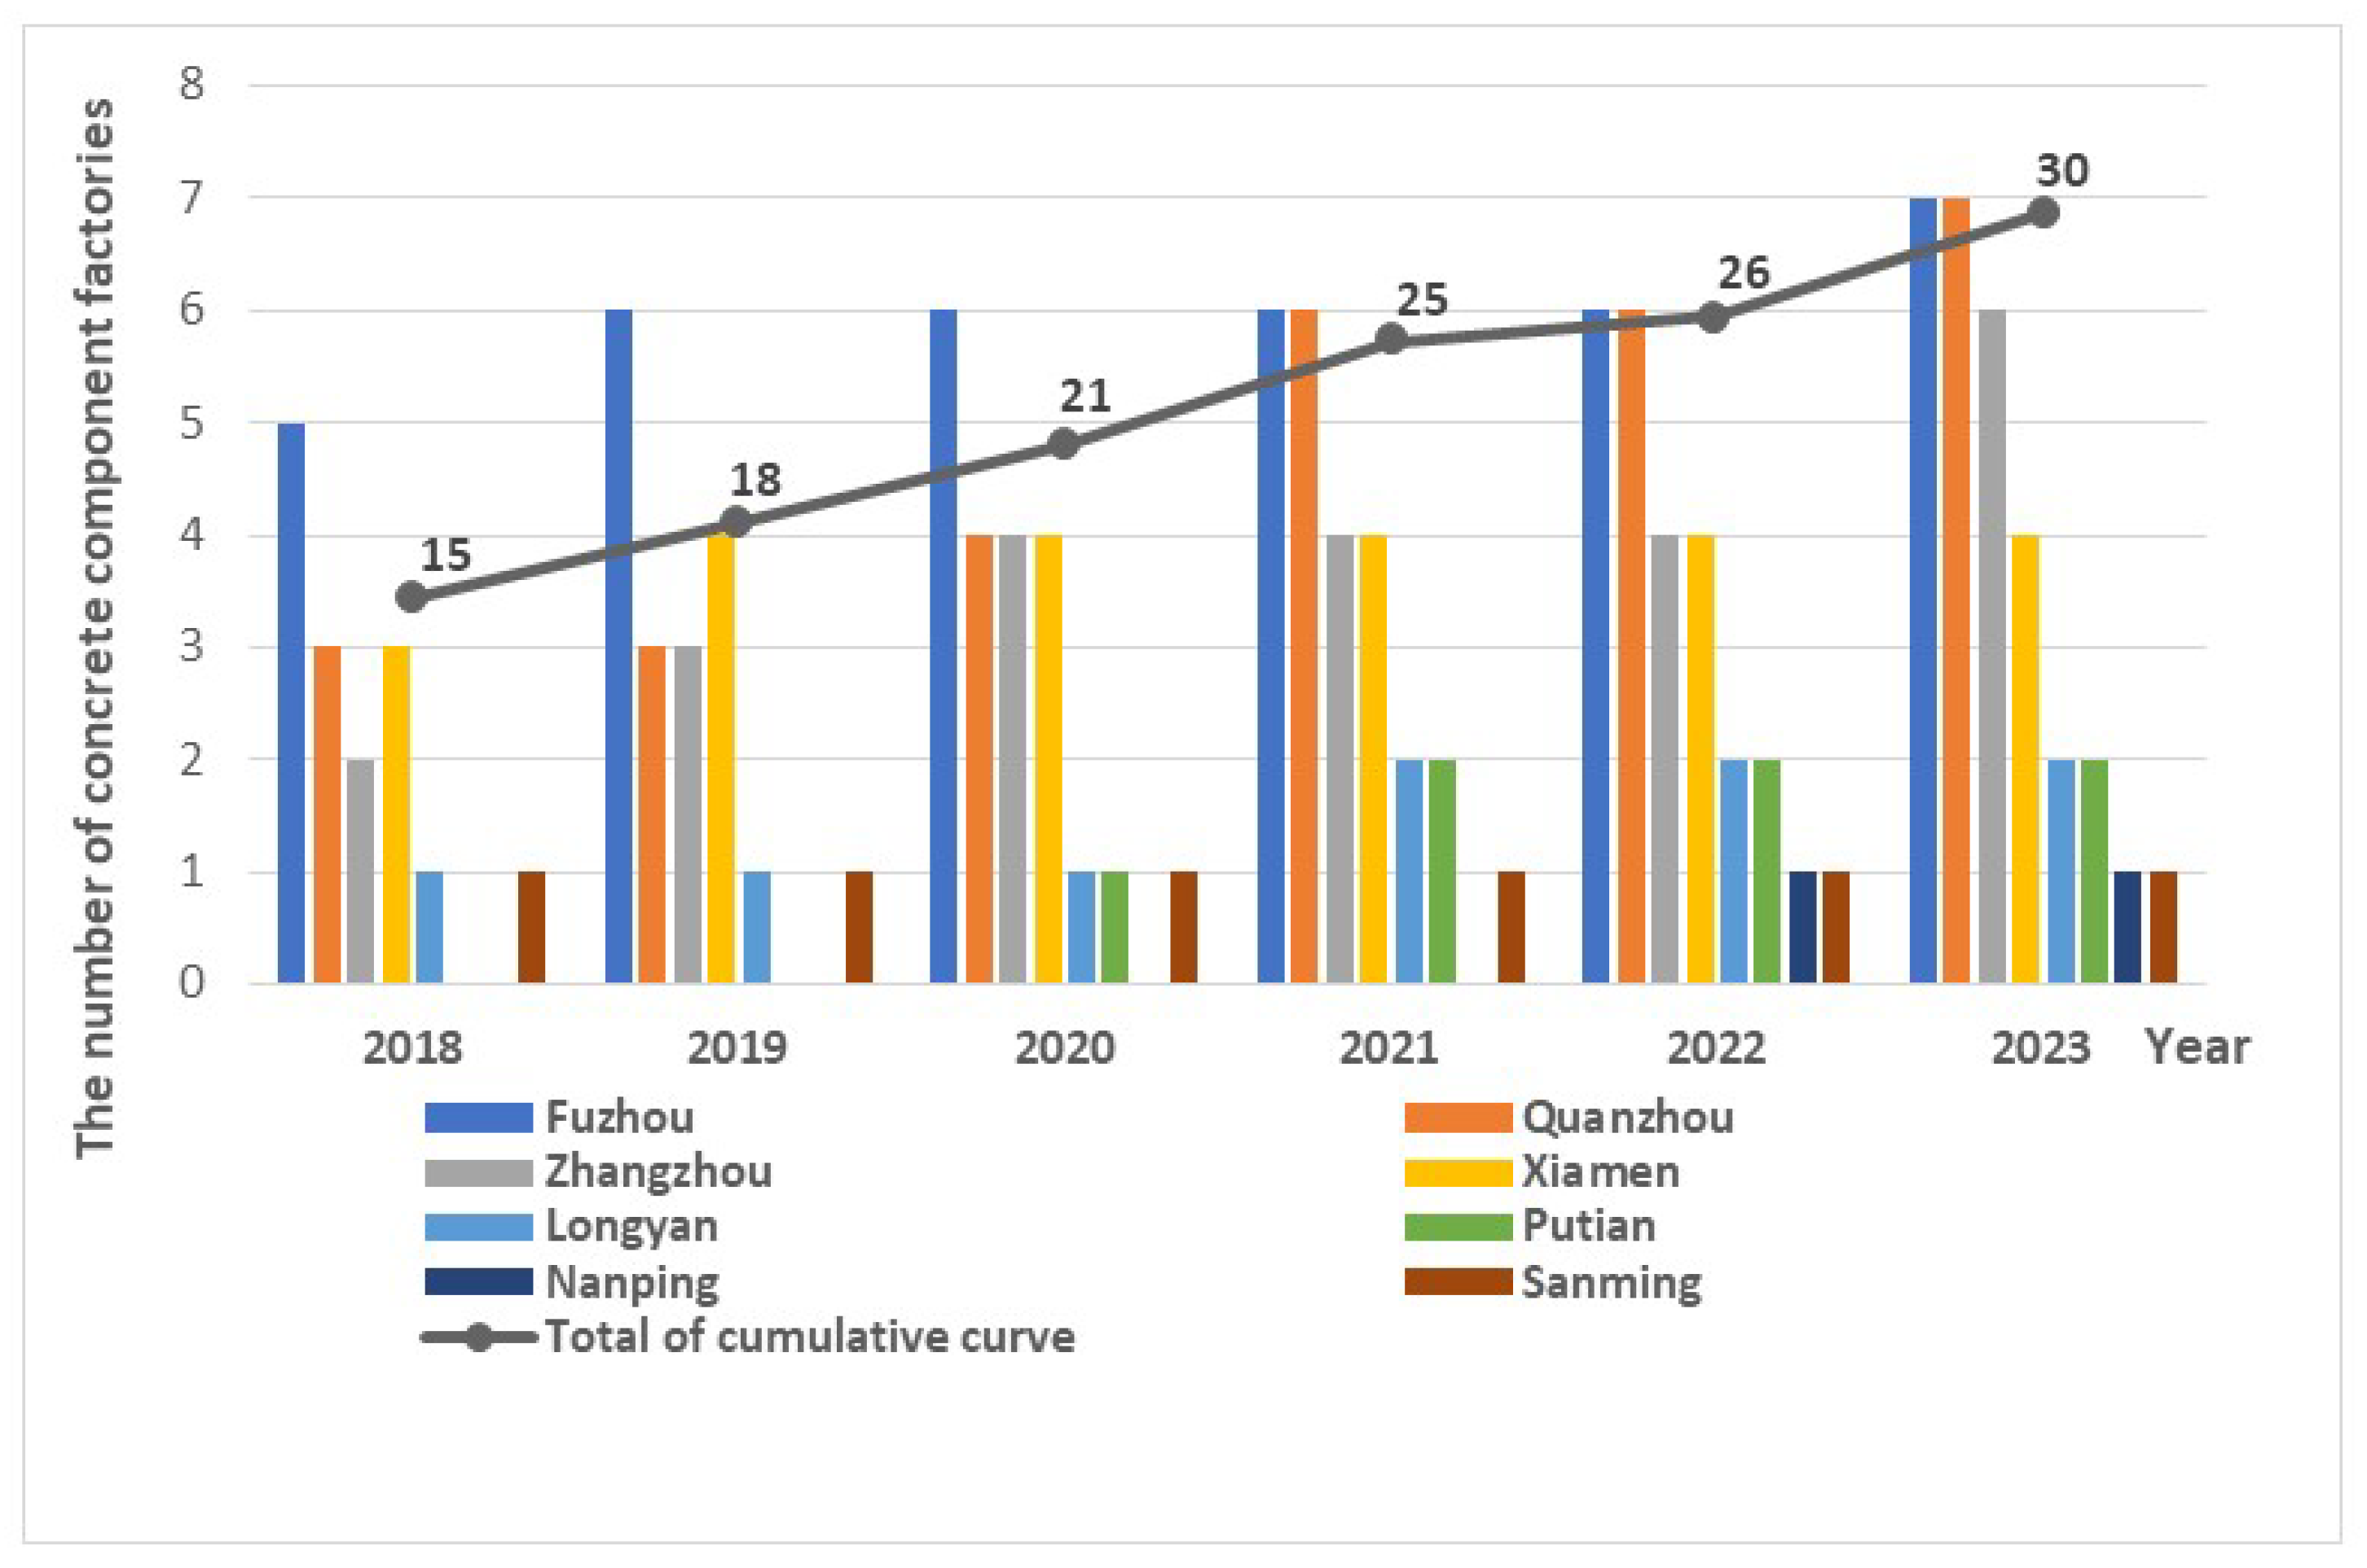
Figure 3.
The production processes of concrete component for slabs.
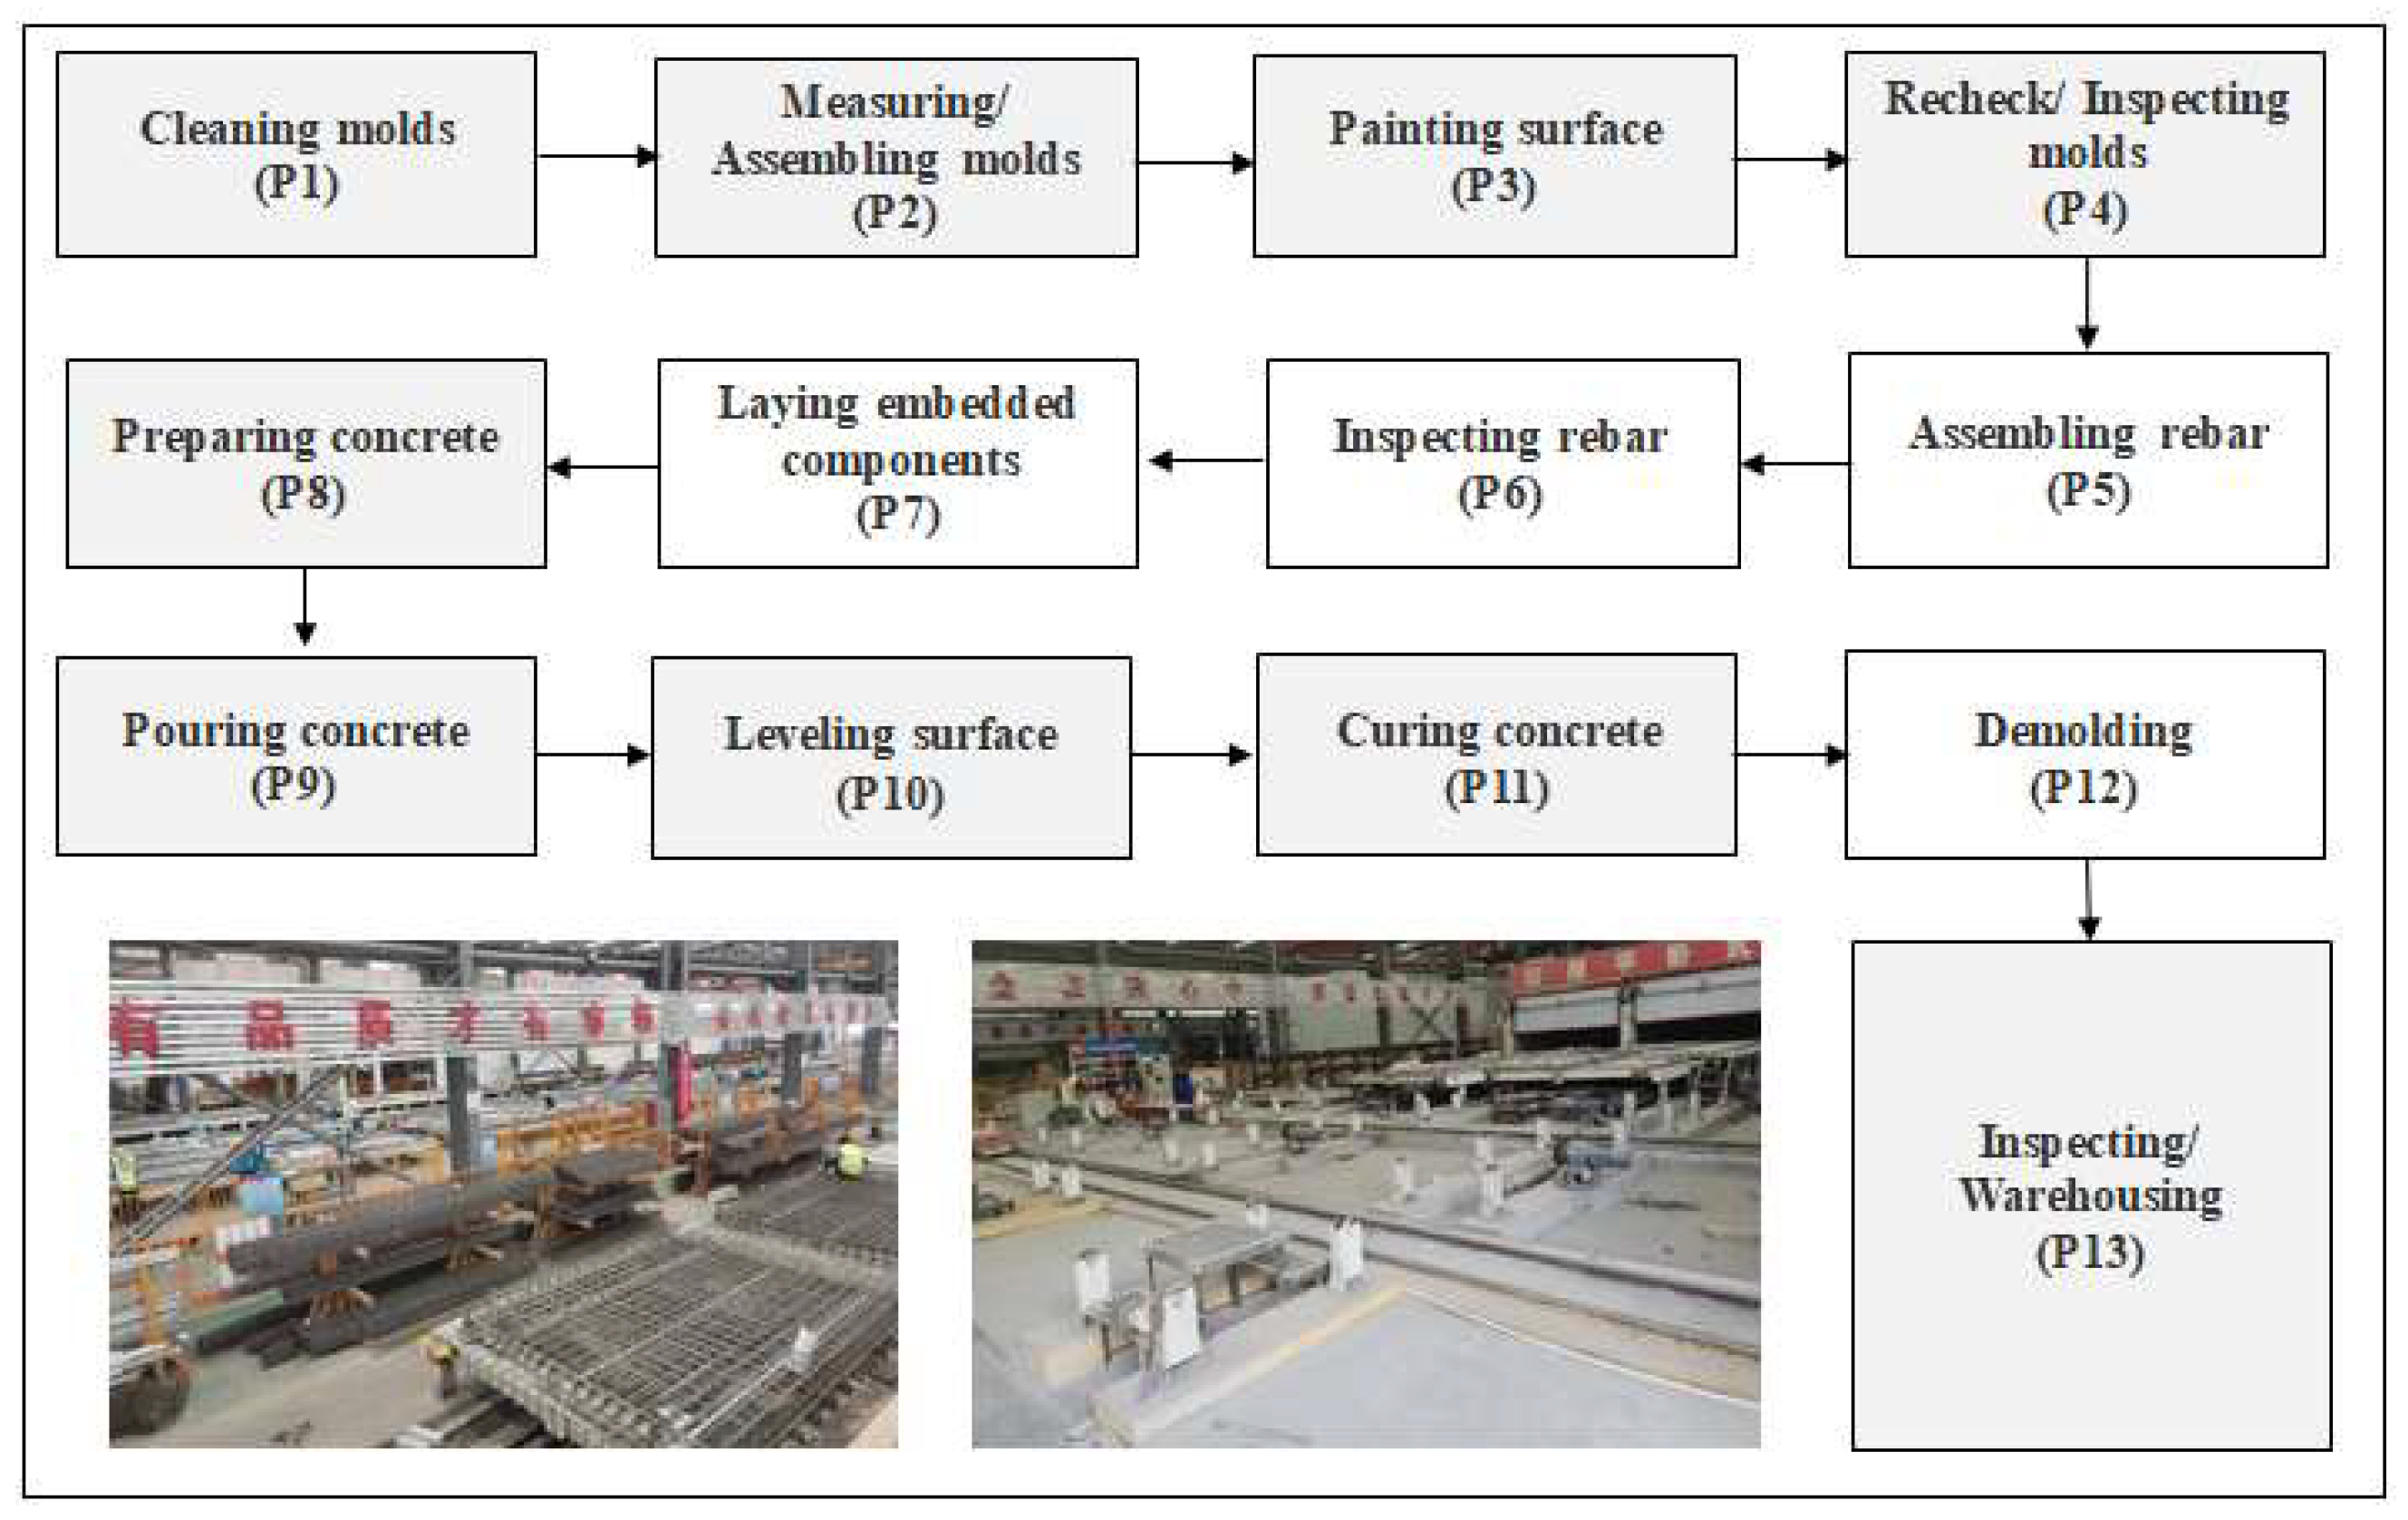
Figure 4.
The framework of multi-objective model .
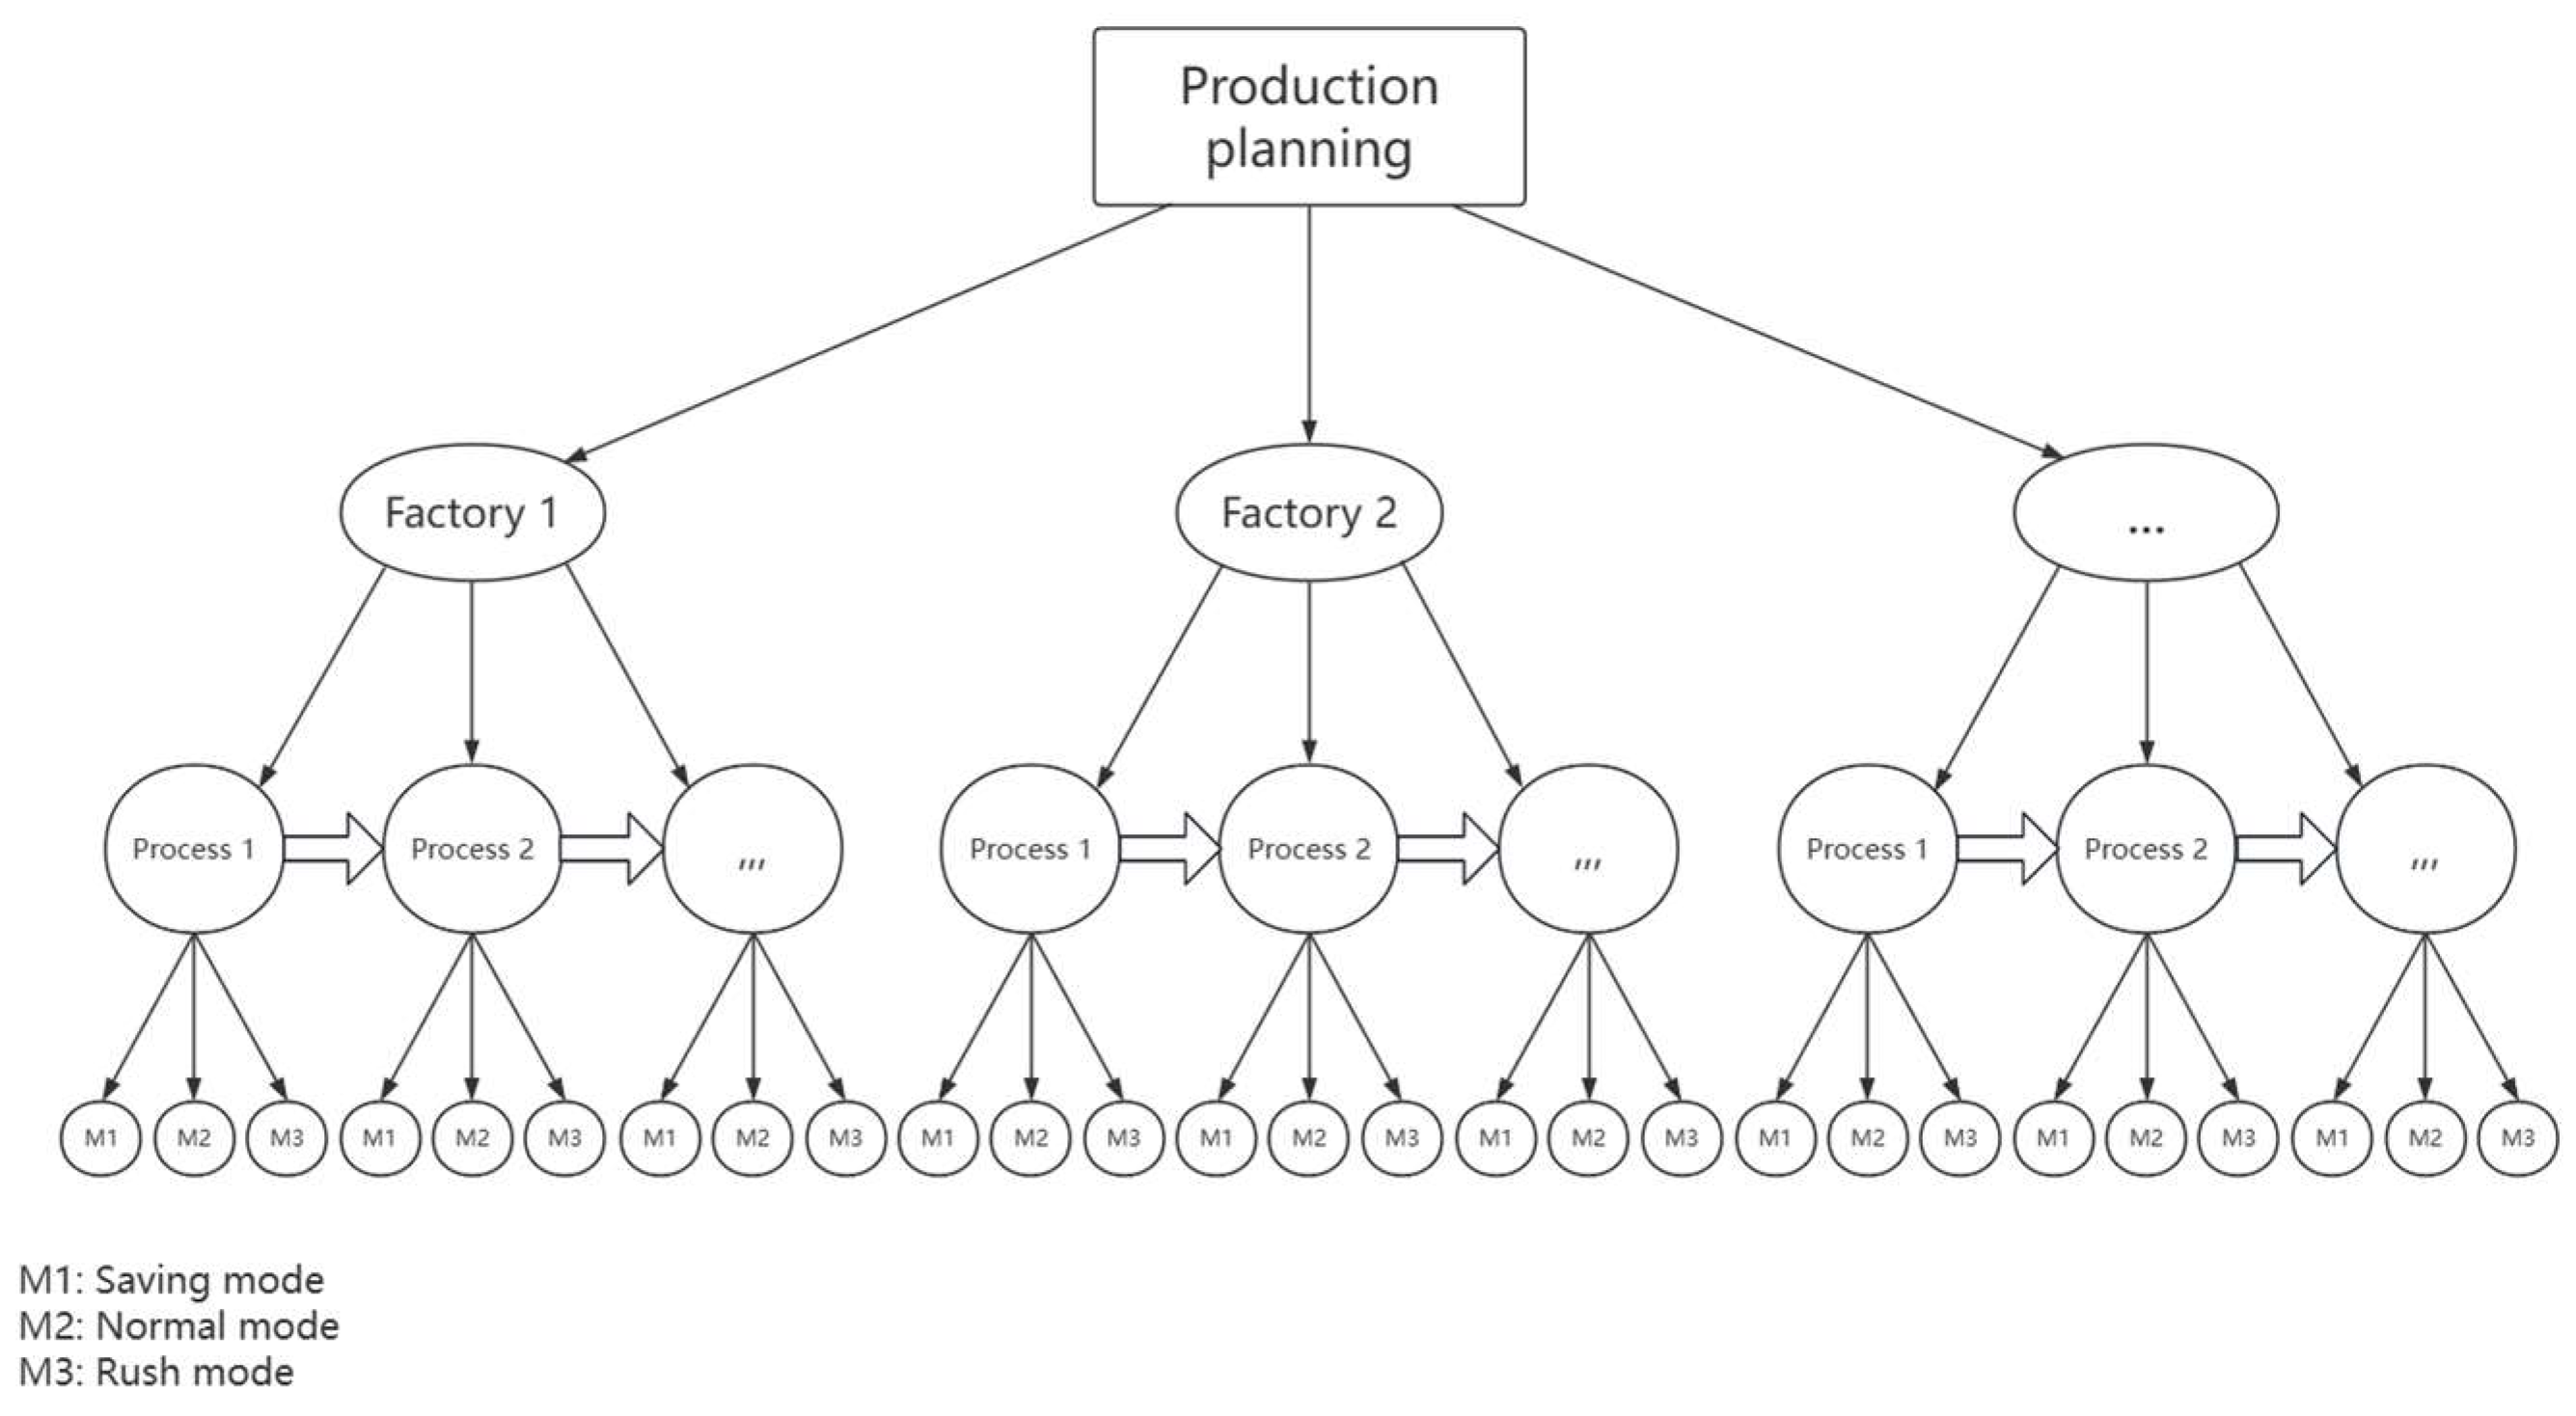
Figure 5.
The Schematic diagram of optimizing the production planning.
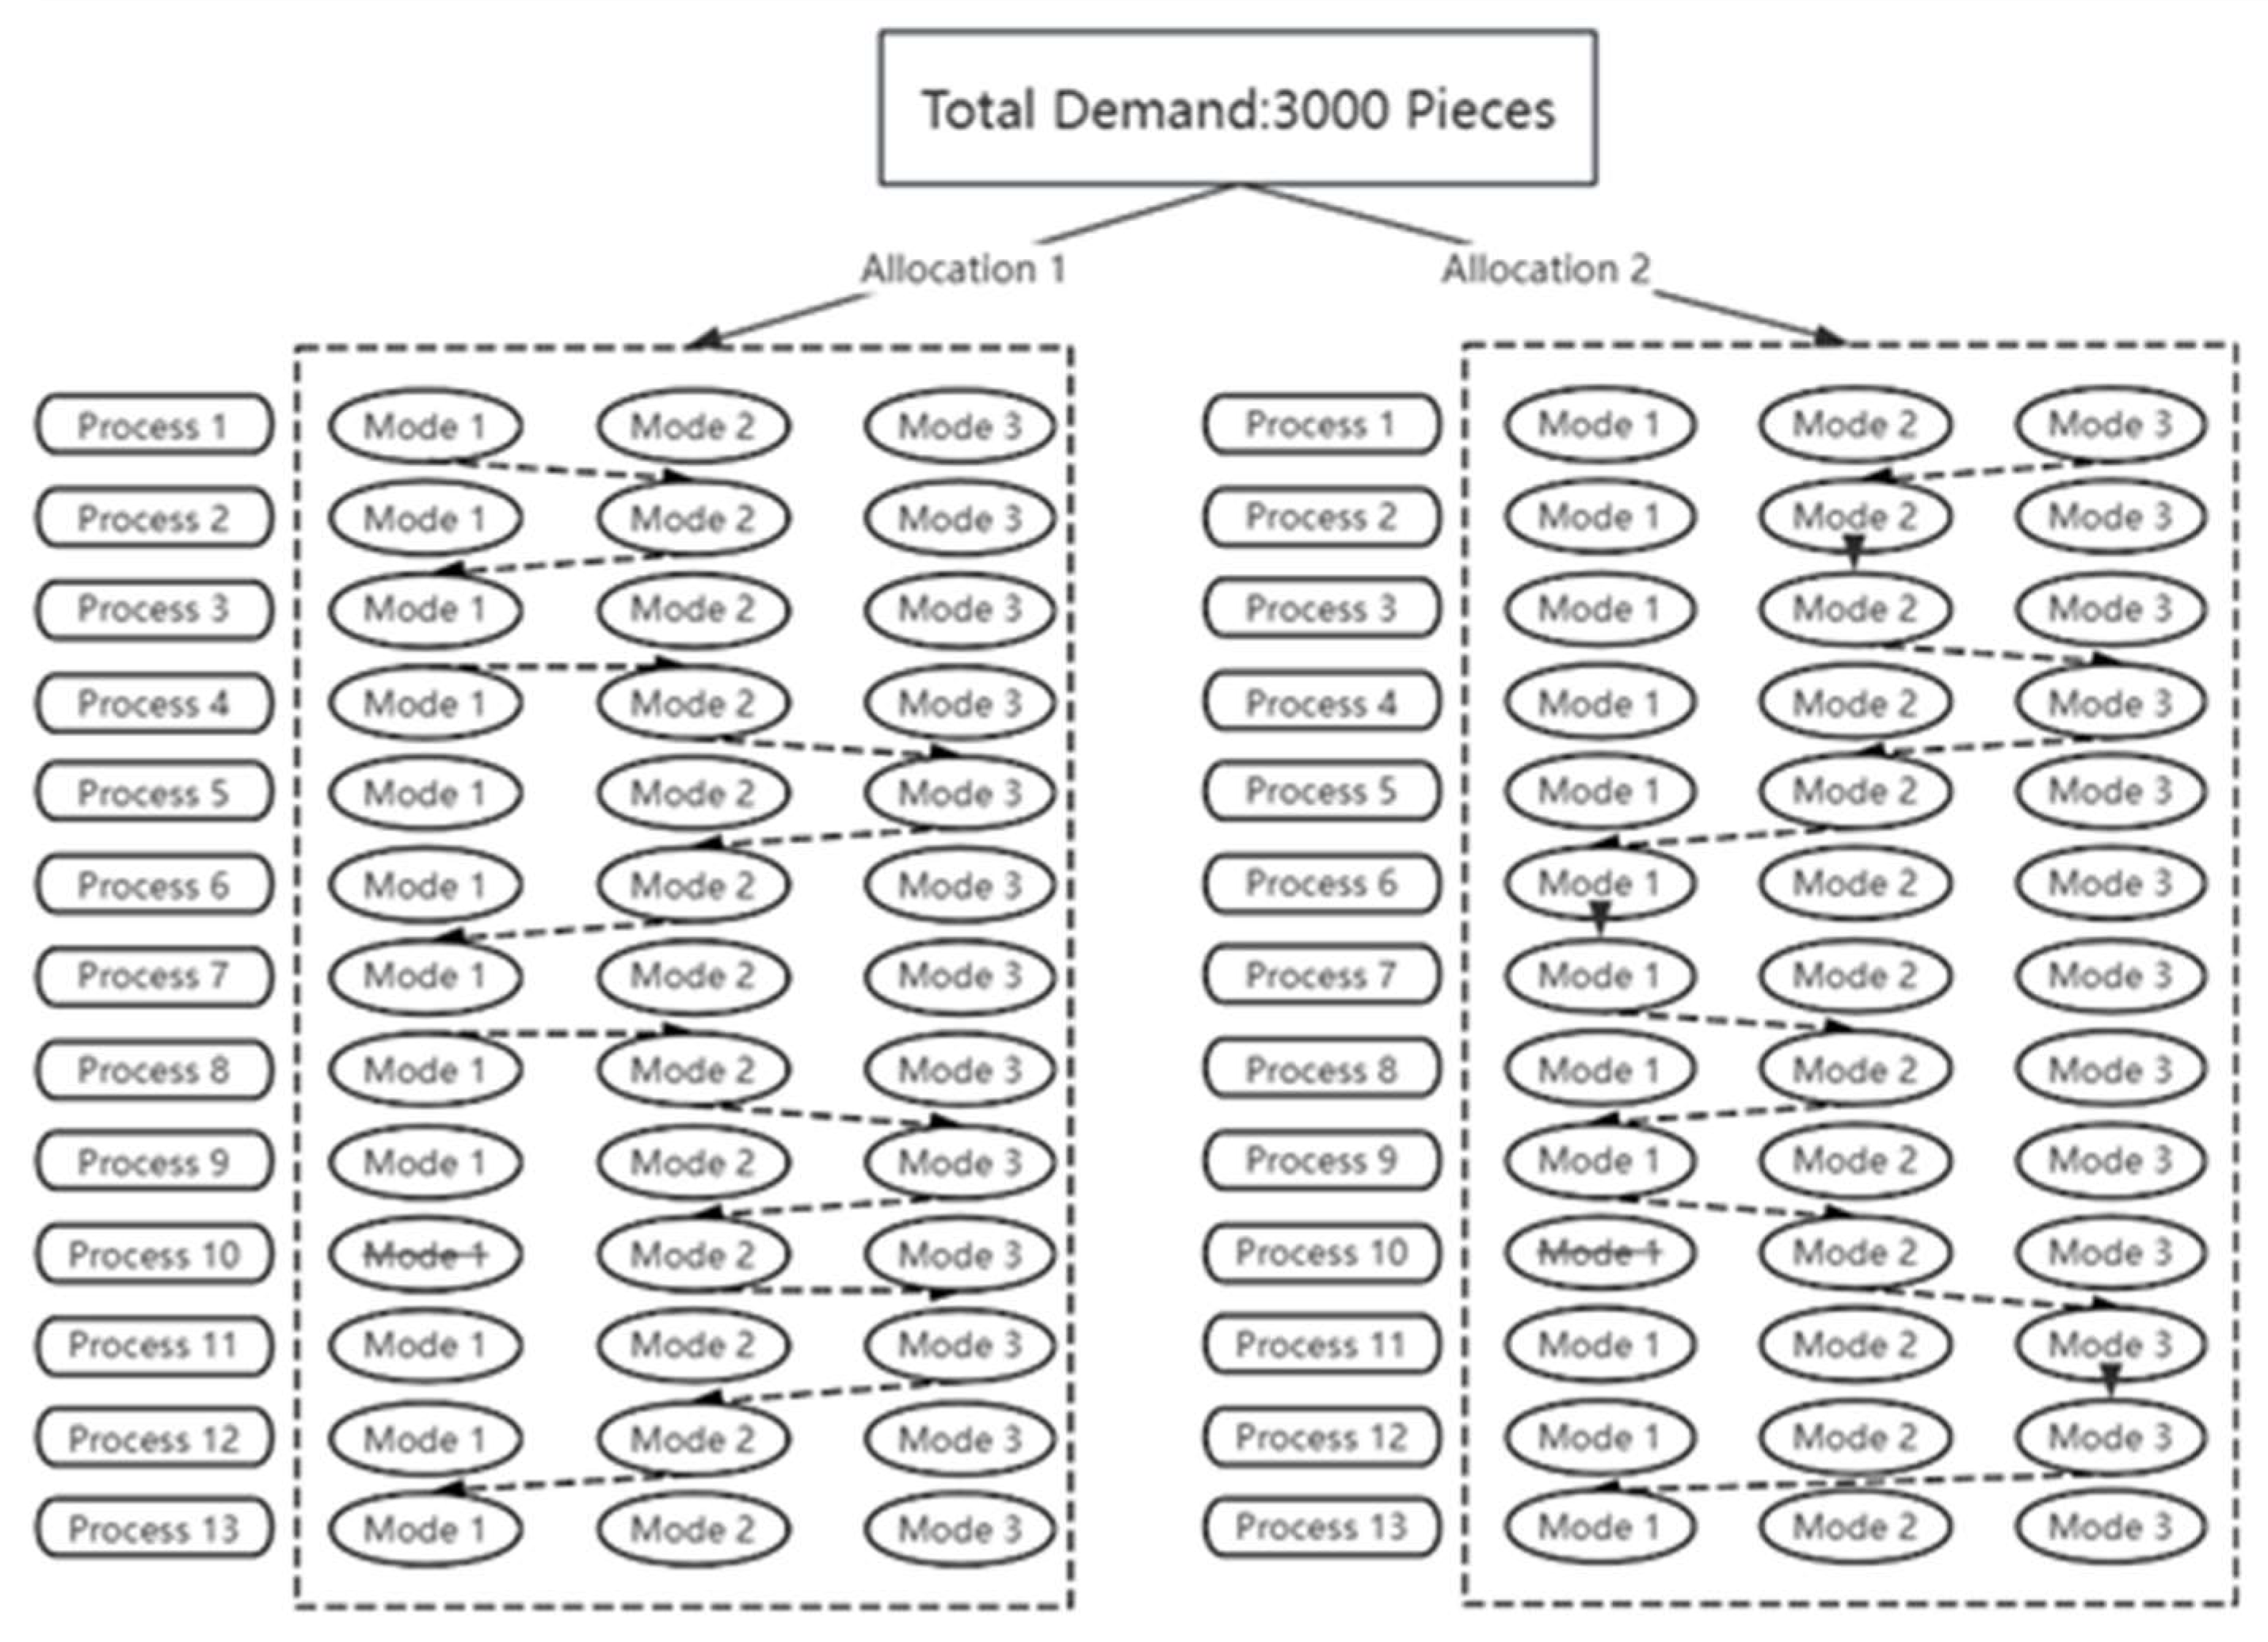
Figure 6.
The top ten of optimization mode with Cost-CE of slabs.
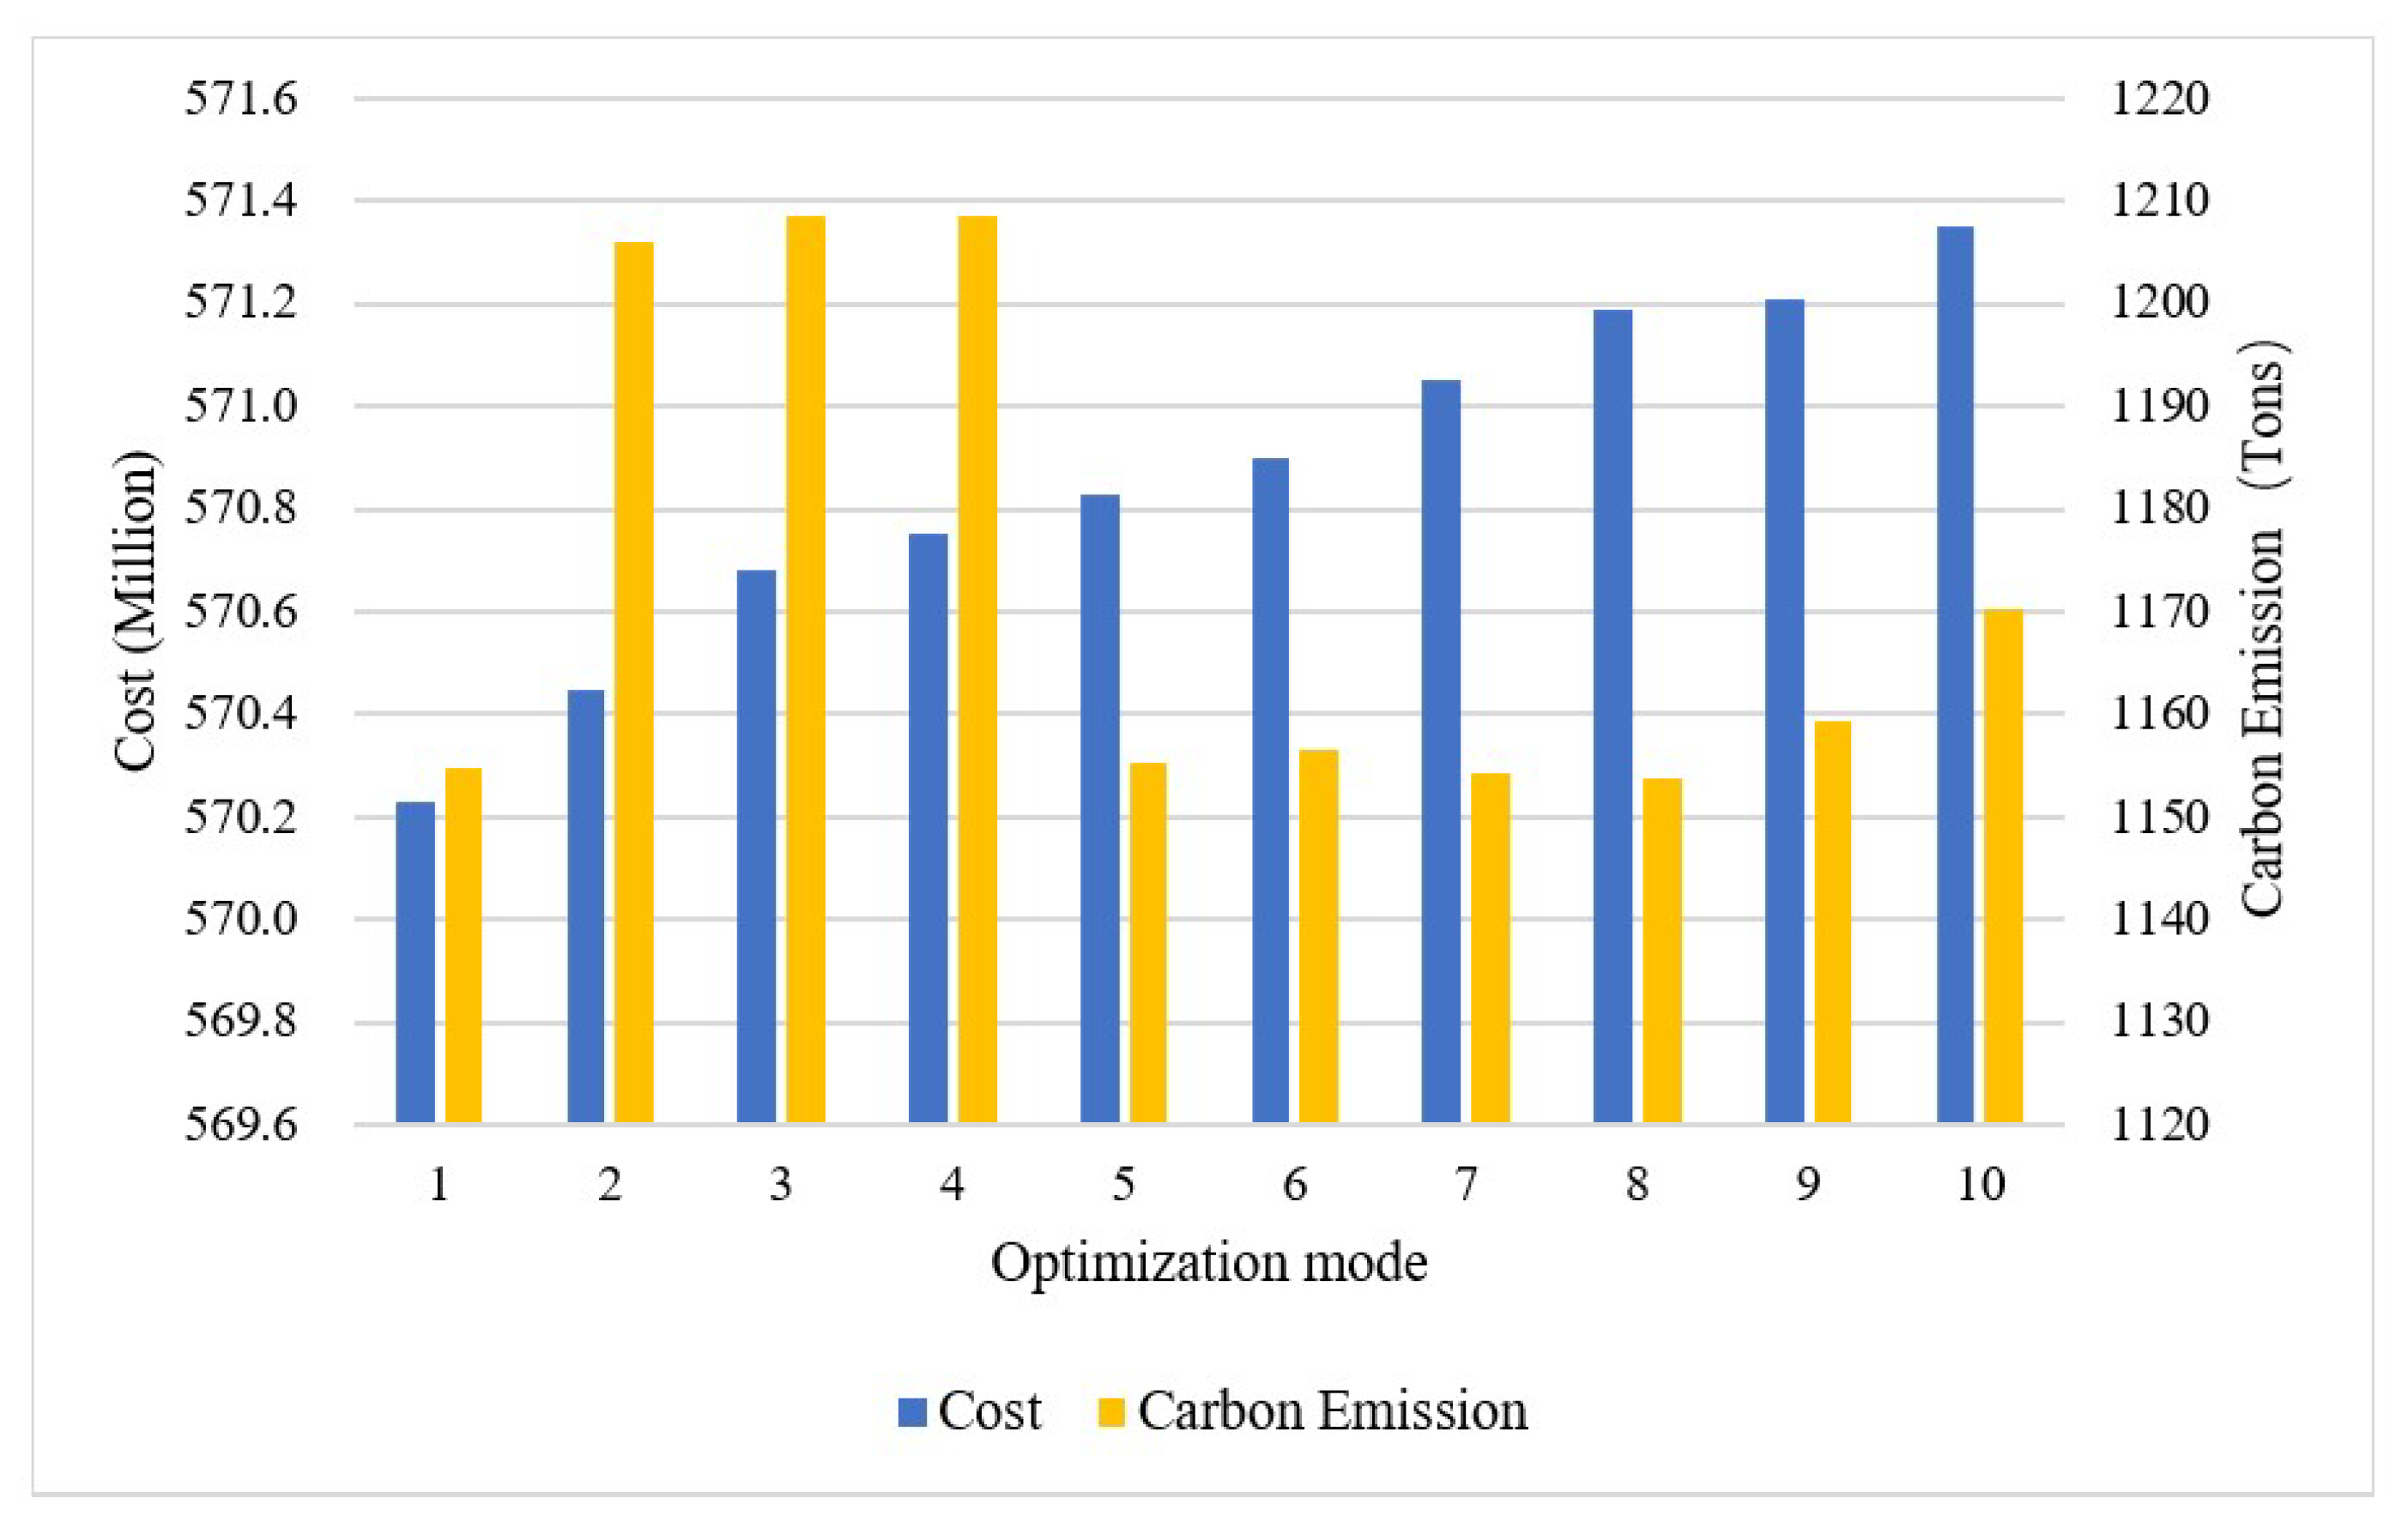
Figure 7.
The downward trend of number of iterations with cost on slabs.
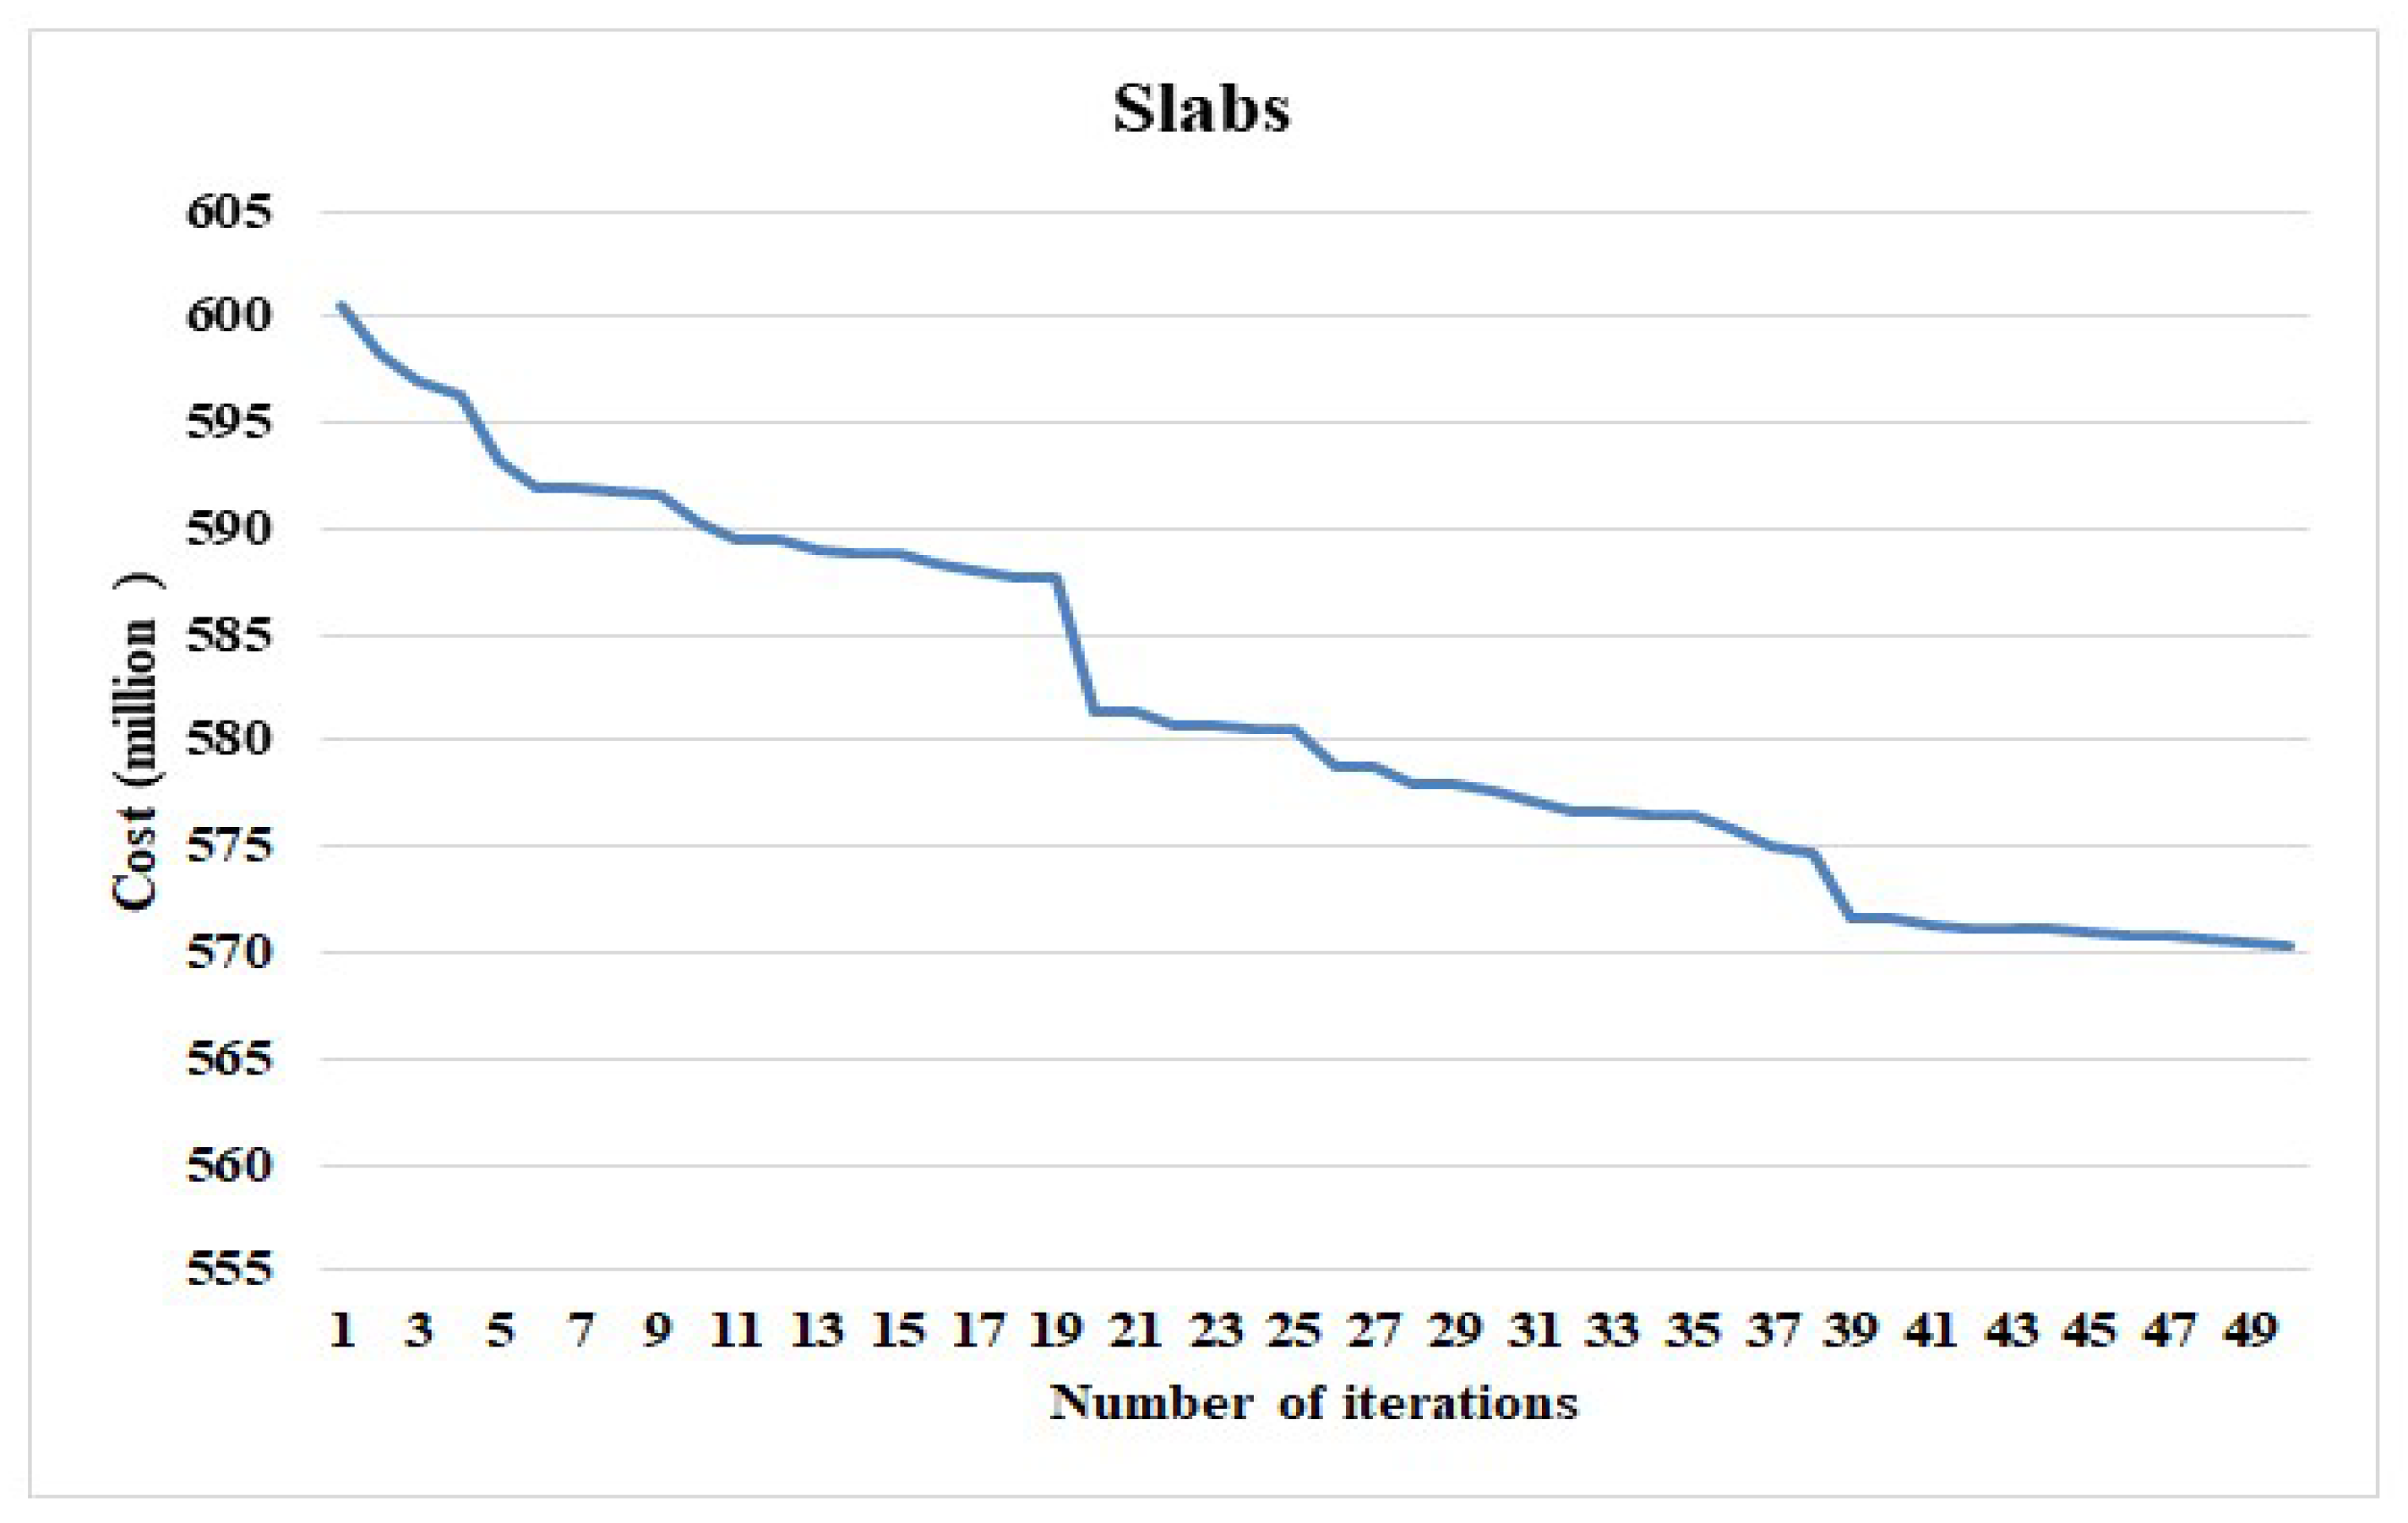

Table 1.
The production capacity of component factories in various regions from 2018 to 2023 (unit: 10,000 m3).
Table 1.
The production capacity of component factories in various regions from 2018 to 2023 (unit: 10,000 m3).
| Area | 2018 | 2019 | 2020 | 2021 | 2022 | 2023 |
| Fuzhou | 97 | 105 | 105 | 105 | 105 | 121 |
| Longyan | 18 | 18 | 18 | 36 | 36 | 36 |
| Nanping | 0 | 0 | 0 | 0 | 9 | 9 |
| Putian | 0 | 0 | 7 | 13 | 13 | 13 |
| Quanzhou | 30 | 30 | 35.5 | 50.5 | 50.5 | 60.5 |
| Sanming | 13 | 13 | 13 | 13 | 13 | 13 |
| Xiamen | 80 | 90 | 90 | 90 | 90 | 110 |
| Zhangzhou | 27 | 33 | 59 | 59 | 59 | 70.4 |
| Total | 265 | 289 | 327.5 | 366.5 | 375.5 | 432.9 |
Table 2.
The specific processes of ACO.
| No. | Operate process | Setup parameters |
| 1 | Initialize basic parameters |
Number of ant, I=10 Iterations, T=50 Pheromone evaporation factor, ρ=0.5 Pheromone constant, Q=10 Pheromone factor, α=4 Heuristic function factor, β=2 |
| 2 | Map Initialization |
|
| 3 | Initialize ant colony |
(3) |
| 4 | Calculate transfer probabilities and coverage Path Planning |
(4) |
| 5 | Update pheromones |
are both penalty factors. |
| 6 | Judgment cycle | Through continuous iteration, the maximum number of iterations is reached to optimal mode. |
Table 3.
Production data of a slab in Factory A.
| No. | Process | M1 | M2 | M3 | ||||||
|
Time (min.) |
Cost |
(kg.CO2) |
Time (min.) |
Cost |
(kg.CO2) |
Time (min.) |
Cost |
(kg.CO2) |
||
| 1 | P1 | 24 | 100 | 3.29 | 20 | 110 | 2.67 | 15 | 120 | 2.2 |
| 2 | P2 | 15 | 33 | 0.08 | 12 | 42 | 0.09 | 8 | 42 | 0.08 |
| 3 | P3 | 7 | 12 | 0.06 | 6 | 14 | 0.06 | 4 | 14 | 0.06 |
| 4 | P4 | 7 | 17 | 0.02 | 5 | 18 | 0.03 | 4 | 20 | 0.03 |
| 5 | P5 | 24 | 155 | 0.75 | 20 | 165 | 0.77 | 17 | 175 | 0.78 |
| 6 | P6 | 10 | 28 | 0.03 | 5 | 22 | 0.03 | 3 | 24 | 0.03 |
| 7 | P7 | 20 | 480 | 0.11 | 15 | 490 | 0.15 | 12 | 510 | 0.14 |
| 8 | P8 | 17 | 570 | 421.35 | 23 | 982 | 820.25 | 15 | 1080 | 702.65 |
| 9 | P9 | 25 | 35 | 7.25 | 20 | 42 | 5.87 | 12 | 45 | 4.06 |
| 10 | P10 | 15 | 21 | 2.26 | 10 | 25 | 2.12 | 8 | 33 | 1.75 |
| 11 | P11 | 480 | 418 | 0.02 | 420 | 375 | 0.02 | 390 | 382 | 0.02 |
| 12 | P12 | 15 | 38 | 6.85 | 10 | 42 | 4.68 | 6 | 75 | 4.22 |
| 13 | P13 | 11 | 22 | 10.74 | 12 | 25 | 11.43 | 6 | 27 | 8.67 |
1 The Currency of Cost is RBM dollar.
Table 4.
The top ten optimization modes of the path with quantity for slabs.
| Optimization mode |
F-A Quantity |
F-A Path |
F-B Quantity |
F-B Path |
| 1 | 1245 | [0,0,0,1,0,1,0,0,1,0,2,0,1] | 1755 | [0,0,1,1,0,1,0,0,1,1,2,2,0] |
| 2 | 1673 | [0,0,0,1,0,2,0,0,1,0,1,0,0] | 1327 | [1,0,0,1,2,1,1,0,0,0,1,2,2] |
| 3 | 1688 | [1,0,2,0,0,2,0,0,0,1,1,1,0] | 1312 | [1,2,1,0,1,0,1,0,0,1,1,1,1] |
| 4 | 1688 | [0,0,0,0,0,2,0,0,0,0,2,0,2] | 1312 | [2,1,1,0,0,1,2,0,0,1,2,0,0] |
| 5 | 1253 | [0,2,1,1,0,2,0,0,1,0,2,1,0] | 1747 | [0,0,0,0,1,1,1,0,2,0,1,2,1] |
| 6 | 1260 | [2,1,1,2,0,0,0,0,0,0,1,0,1] | 1740 | [0,0,2,0,0,2,0,0,1,0,2,1,2] |
| 7 | 1260 | [0,1,0,2,1,2,0,0,1,0,2,0,0] | 1740 | [0,0,0,0,0,1,0,0,2,1,2,1,0] |
| 8 | 1223 | [0,1,0,2,0,0,0,0,0,1,1,1,1] | 1777 | [0,0,2,1,1,2,1,0,2,1,1,2,1] |
| 9 | 1260 | [0,2,0,0,0,0,0,0,1,2,1,0,2] | 1740 | [0,1,2,0,1,2,1,0,1,0,1,1,0] |
| 10 | 1283 | [0,0,2,0,0,0,1,0,0,2,2,0,0] | 1717 | [0,1,1,0,1,1,2,0,0,0,1,0,2] |
Table 5.
The top ten of the optimization mode with Cost and CE.
| Optimization mode | Slab | Wall | Stair | |||
|
Cost (million ) |
CE (ton) |
Cost (million ) |
CE (ton) |
Cost (million ) |
CE (ton) |
|
| 1 | 570.23 | 1154.85 | 610.58 | 1188.68 | 194.48 | 410.71 |
| 2 | 570.45 | 1206.08 | 611.03 | 1250.55 | 195.13 | 412.16 |
| 3 | 570.68 | 1208.63 | 611.09 | 1251.68 | 195.28 | 405.11 |
| 4 | 570.75 | 1208.63 | 611.42 | 1185.9 | 195.52 | 407.36 |
| 5 | 570.83 | 1155.23 | 611.48 | 1190.7 | 195.89 | 405.84 |
| 6 | 570.9 | 1156.58 | 611.78 | 1245.15 | 195.91 | 407.12 |
| 7 | 571.05 | 1154.4 | 611.93 | 1239.68 | 196.16 | 413.05 |
| 8 | 571.19 | 1153.8 | 612.15 | 1246.5 | 196.45 | 412.24 |
| 9 | 571.21 | 1159.43 | 612.31 | 1246.65 | 196.48 | 410.73 |
| 10 | 571.35 | 1170.3 | 612.38 | 1244.18 | 196.56 | 409.12 |
1 The Currency of Cost is RBM.
Table 6.
Comparing of Cost-CE between single mode (M1) and optimization mode for components production.
Table 6.
Comparing of Cost-CE between single mode (M1) and optimization mode for components production.
| Mode | M1 | M2 | M3 | ||||||
| Time limit |
Cost reduction(%) |
CE reduction (%) |
Time limit |
Cost reduction(%) |
CE reduction(%) |
Time limit |
Cost reduction(%) |
CE reduction(%) |
|
| 1 | F | 1.64 | 0.43 | T | 23.24 | 52.85 | T | 22.13 | 49.66 |
| 2 | T | 1.56 | 0.18 | T | 23.04 | 51.22 | T | 22.13 | 46.74 |
| 3 | T | 1.52 | 0.11 | T | 23.00 | 51.13 | T | 22.10 | 46.61 |
| 4 | T | 1.51 | 0.11 | T | 23.00 | 51.13 | T | 22.09 | 46.61 |
| 5 | F | 1.54 | 0.47 | T | 23.16 | 52.84 | T | 22.05 | 49.63 |
| 6 | F | 1.52 | 0.42 | T | 23.14 | 52.79 | T | 22.04 | 49.56 |
| 7 | F | 1.50 | 0.61 | T | 23.12 | 52.88 | T | 22.02 | 49.65 |
| 8 | F | 1.48 | 0.31 | T | 23.12 | 52.87 | T | 22.00 | 49.74 |
| 9 | F | 1.47 | 0.18 | T | 23.10 | 52.68 | T | 22.00 | 49.43 |
| 10 | F | 1.45 | -0.53 | T | 23.07 | 52.26 | T | 21.98 | 48.93 |
| Average | 1.52 | 0.23 | - | 23.10 | 52.27 | - | 22.05 | 48.66 | |
1 “T” means is to meet time limit, and “F” means is not to meet time limit.
Disclaimer/Publisher’s Note: The statements, opinions and data contained in all publications are solely those of the individual author(s) and contributor(s) and not of MDPI and/or the editor(s). MDPI and/or the editor(s) disclaim responsibility for any injury to people or property resulting from any ideas, methods, instructions or products referred to in the content. |
© 2024 by the authors. Licensee MDPI, Basel, Switzerland. This article is an open access article distributed under the terms and conditions of the Creative Commons Attribution (CC BY) license (http://creativecommons.org/licenses/by/4.0/).
Copyright: This open access article is published under a Creative Commons CC BY 4.0 license, which permit the free download, distribution, and reuse, provided that the author and preprint are cited in any reuse.


