Submitted:
05 November 2024
Posted:
05 November 2024
You are already at the latest version
Abstract
Keywords:
1. Introduction
2. Equivalent Circuit Modeling of Lithium-Ion Batteries
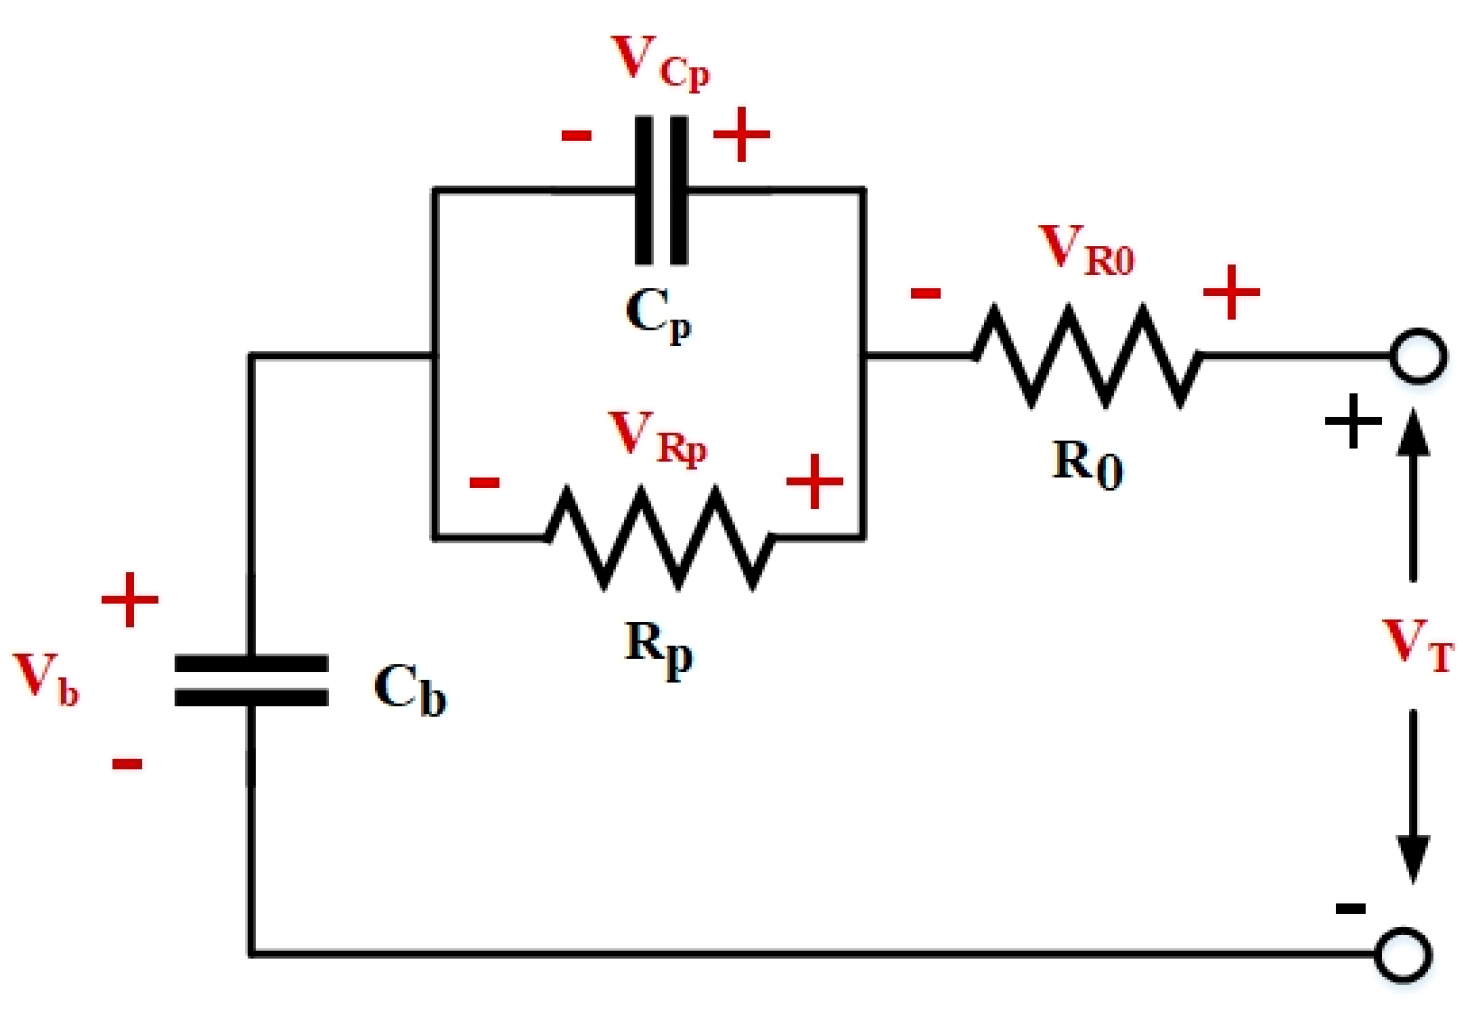
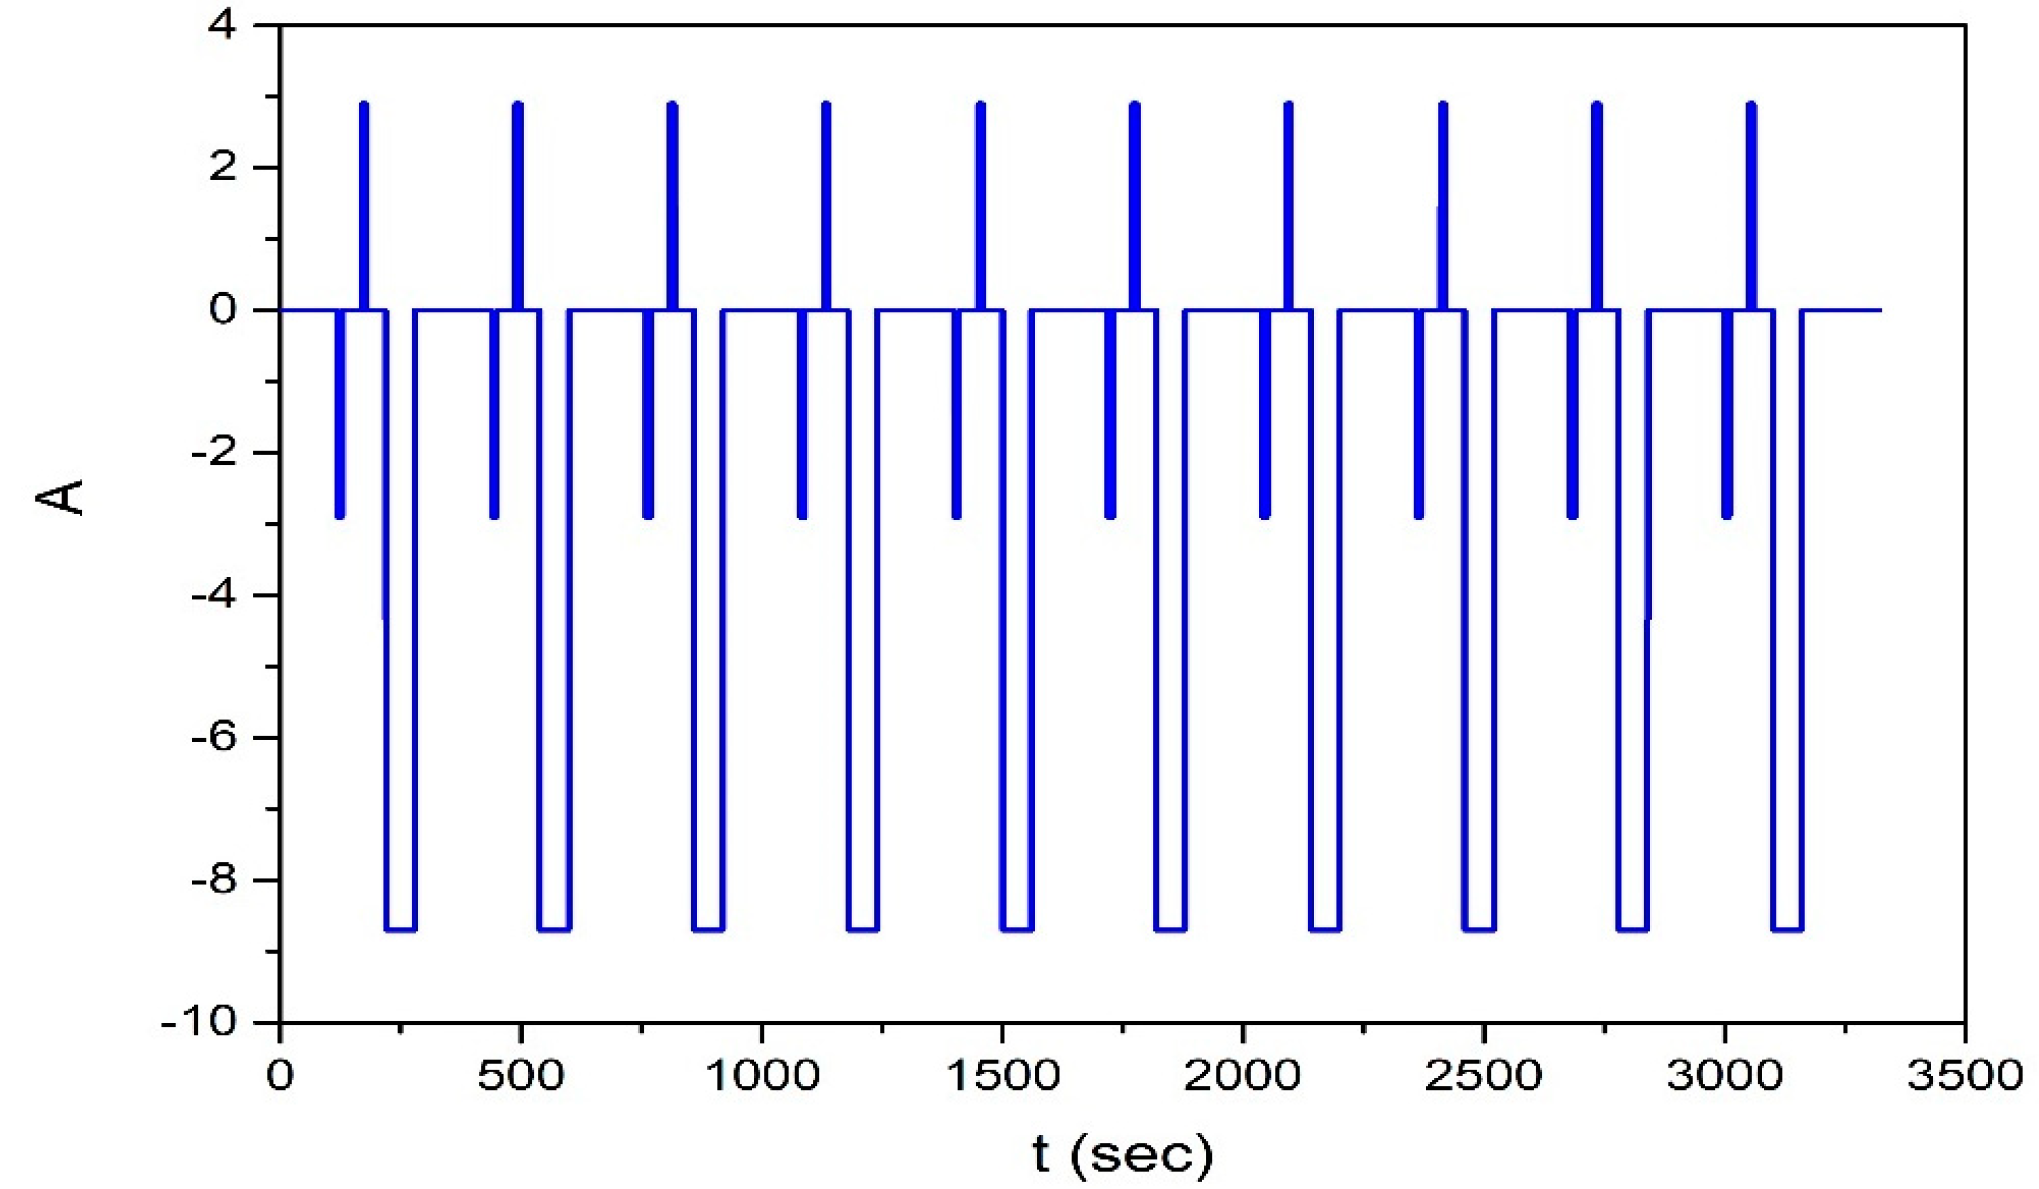
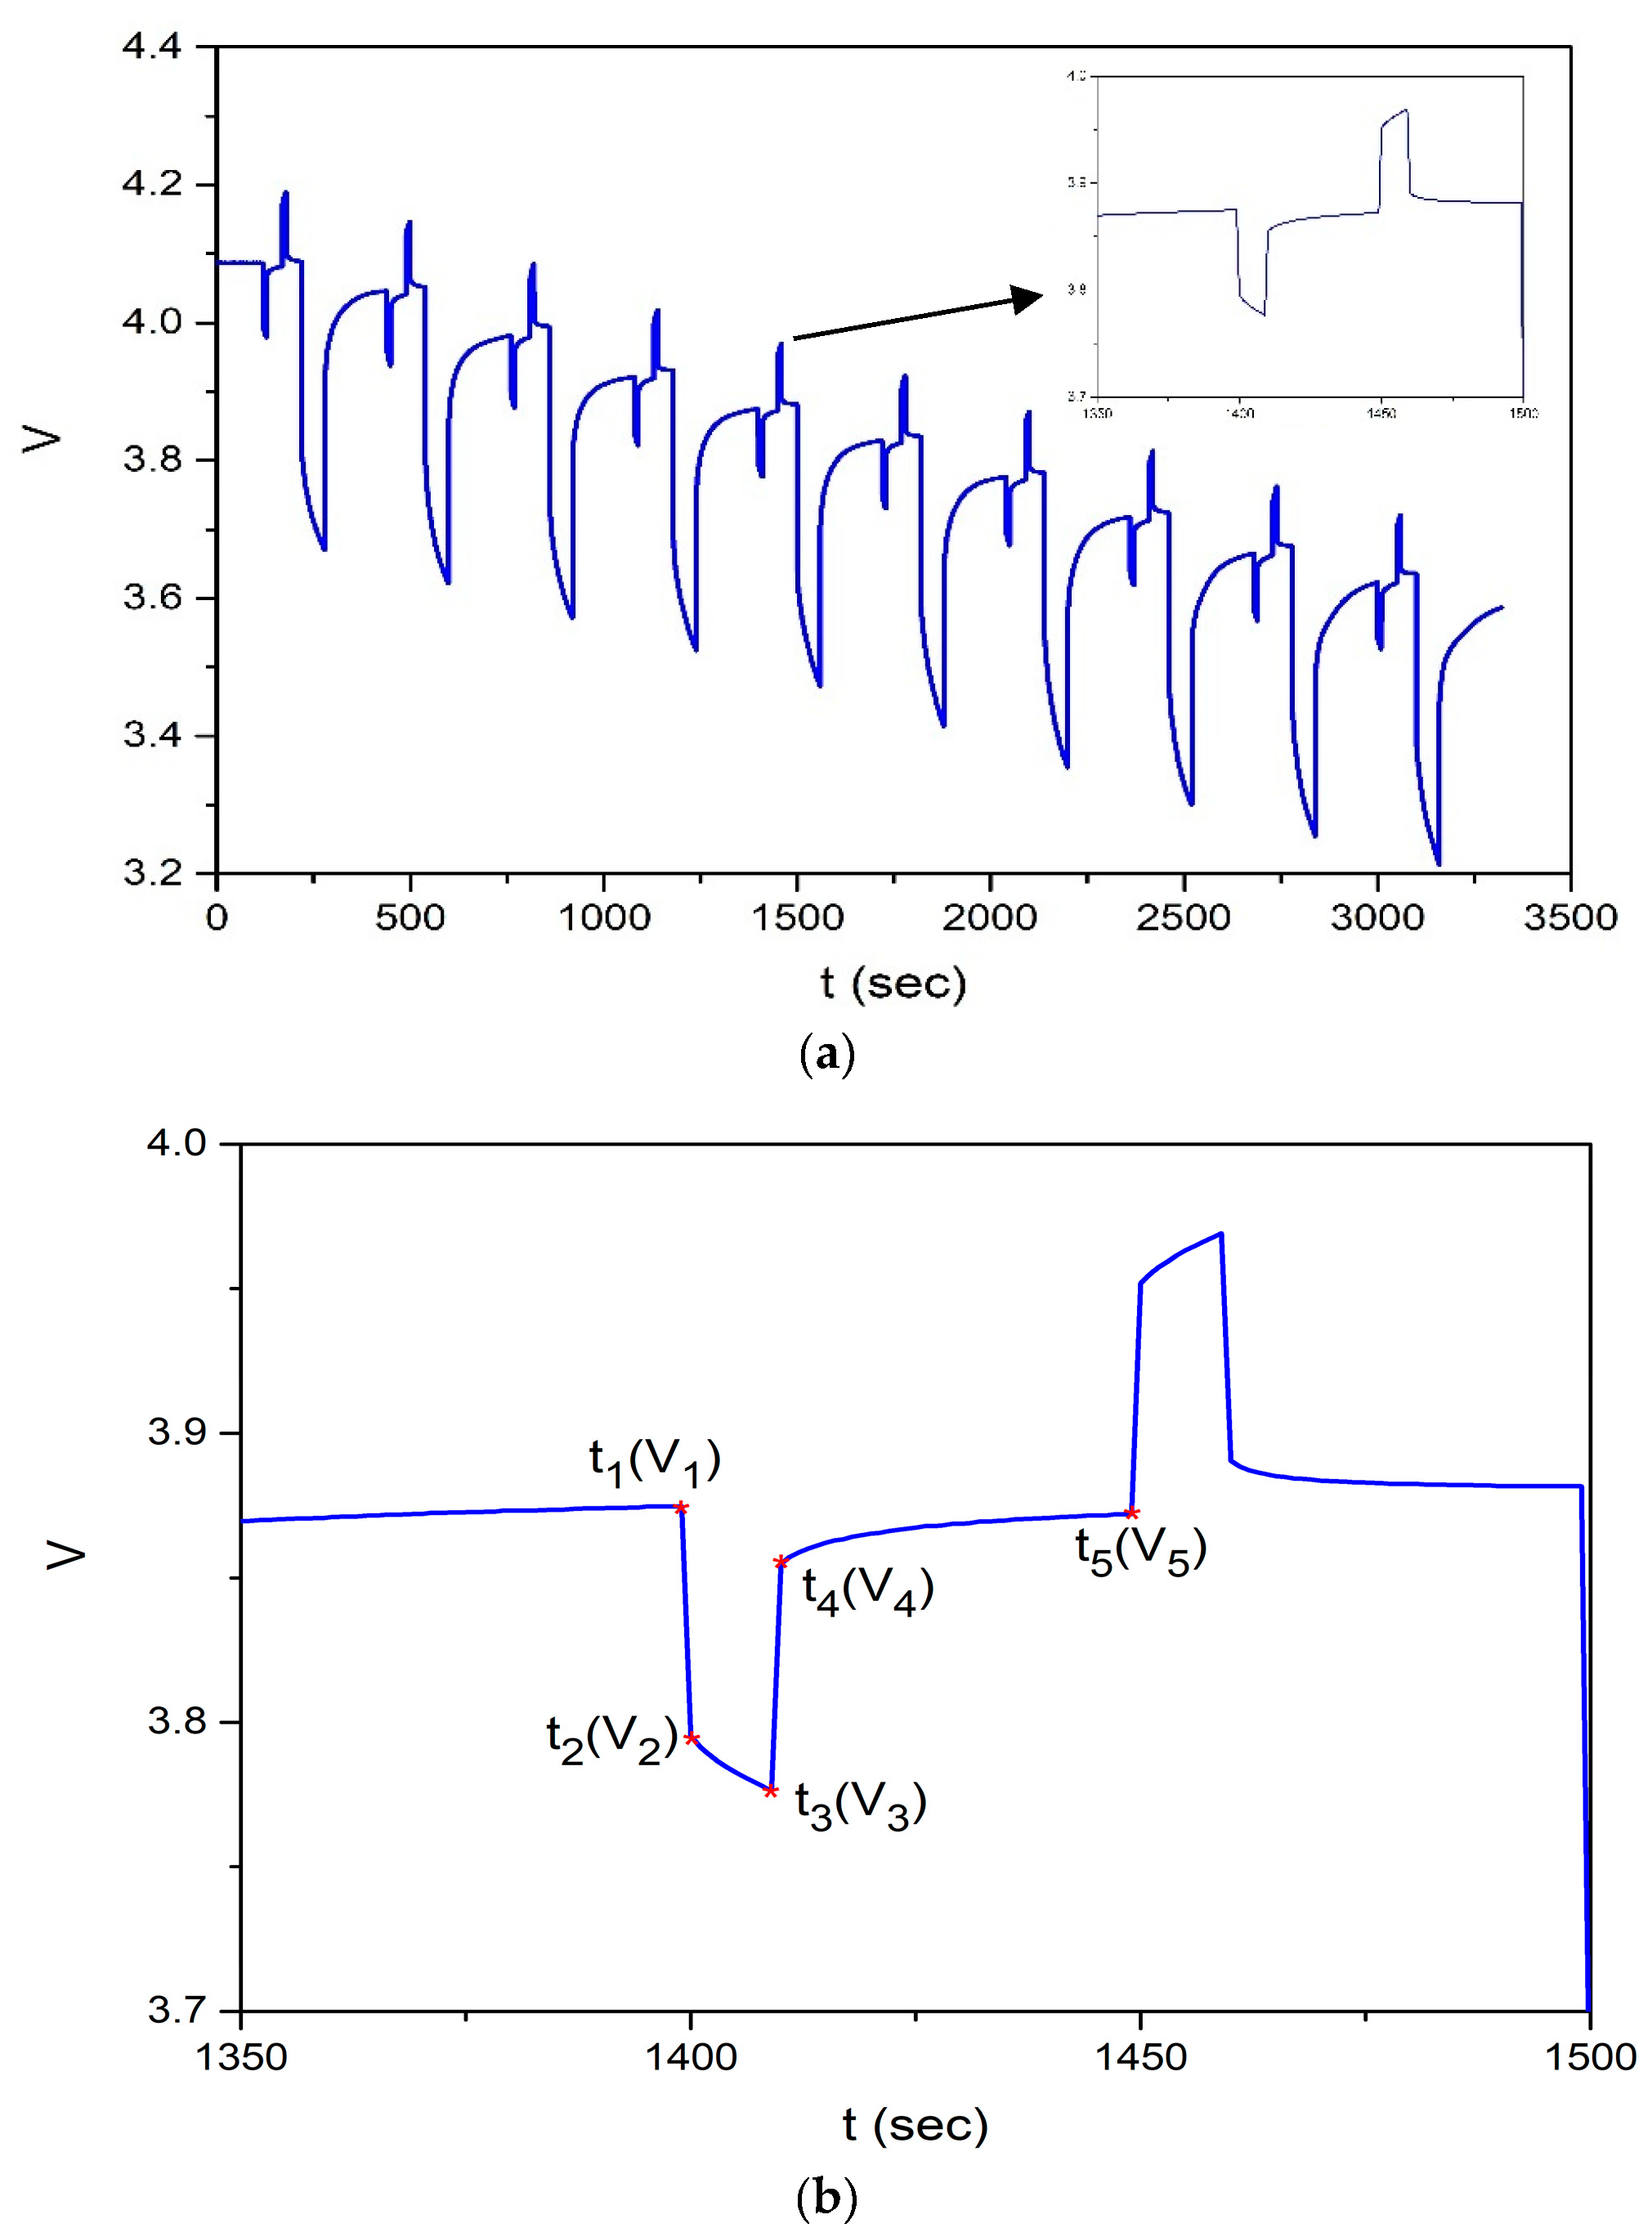
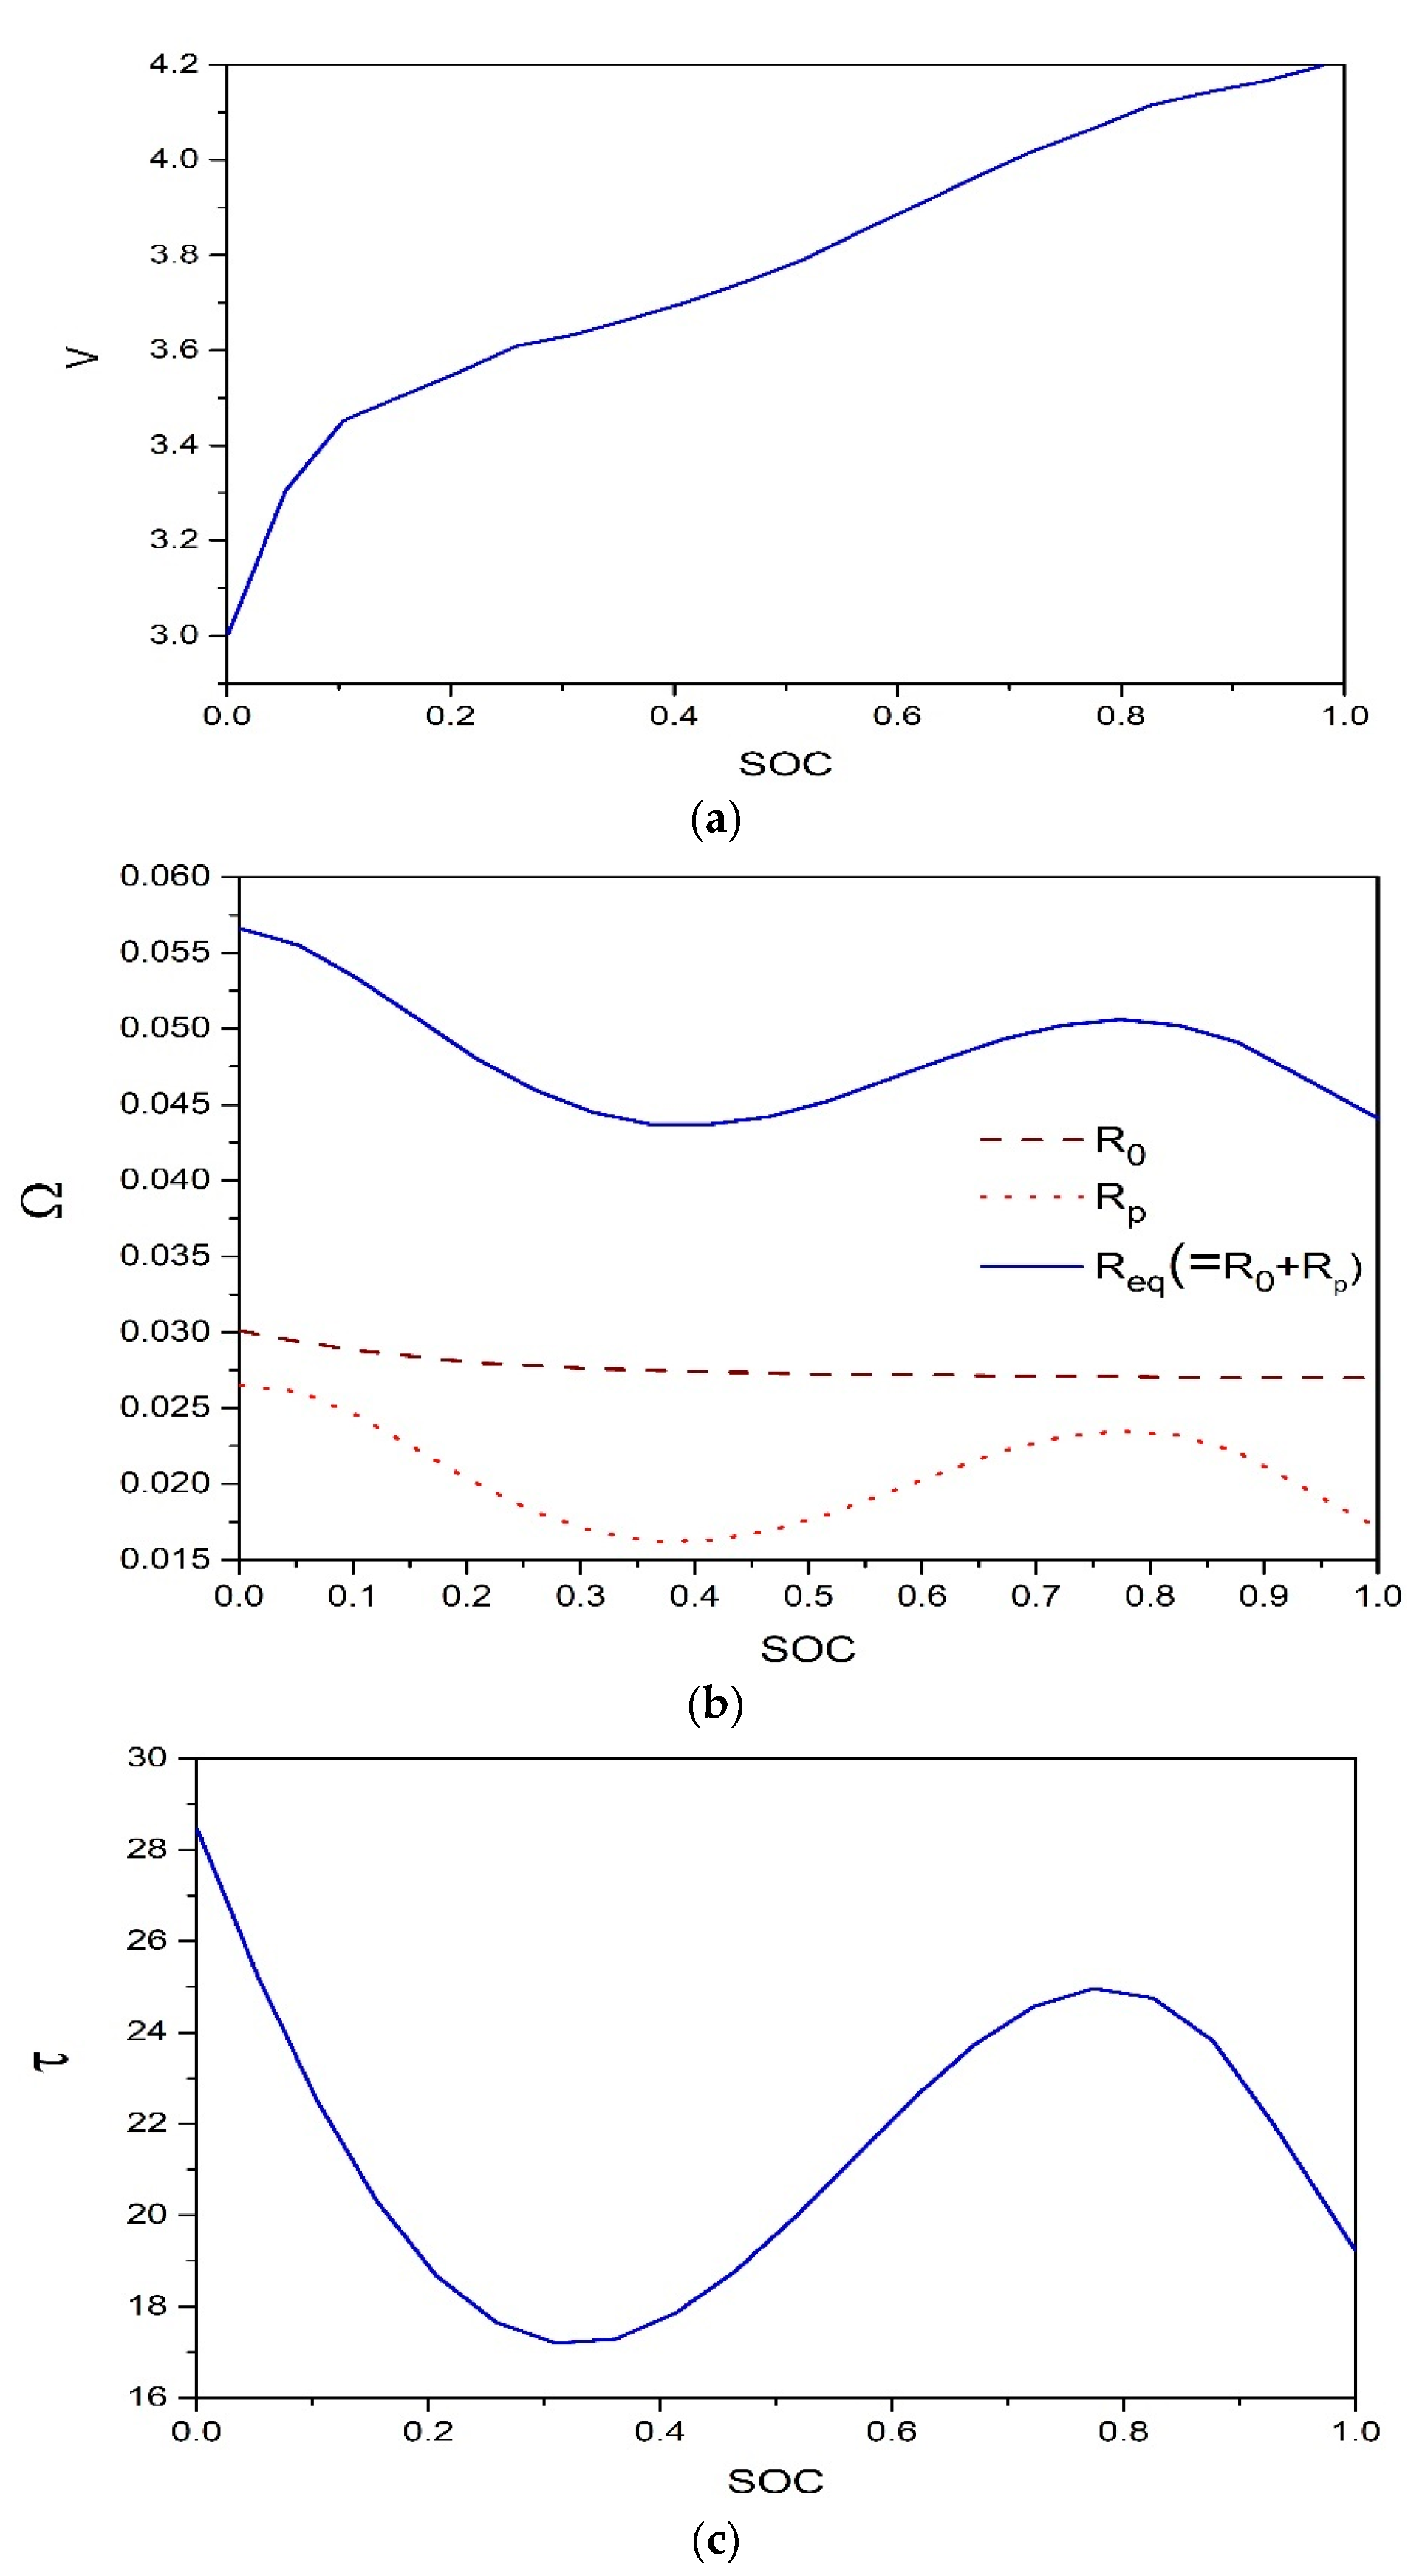
2.1. Modeling of the Equivalent Circuit Model and Parameter Identificaiton of the Lithium-Ion Battery
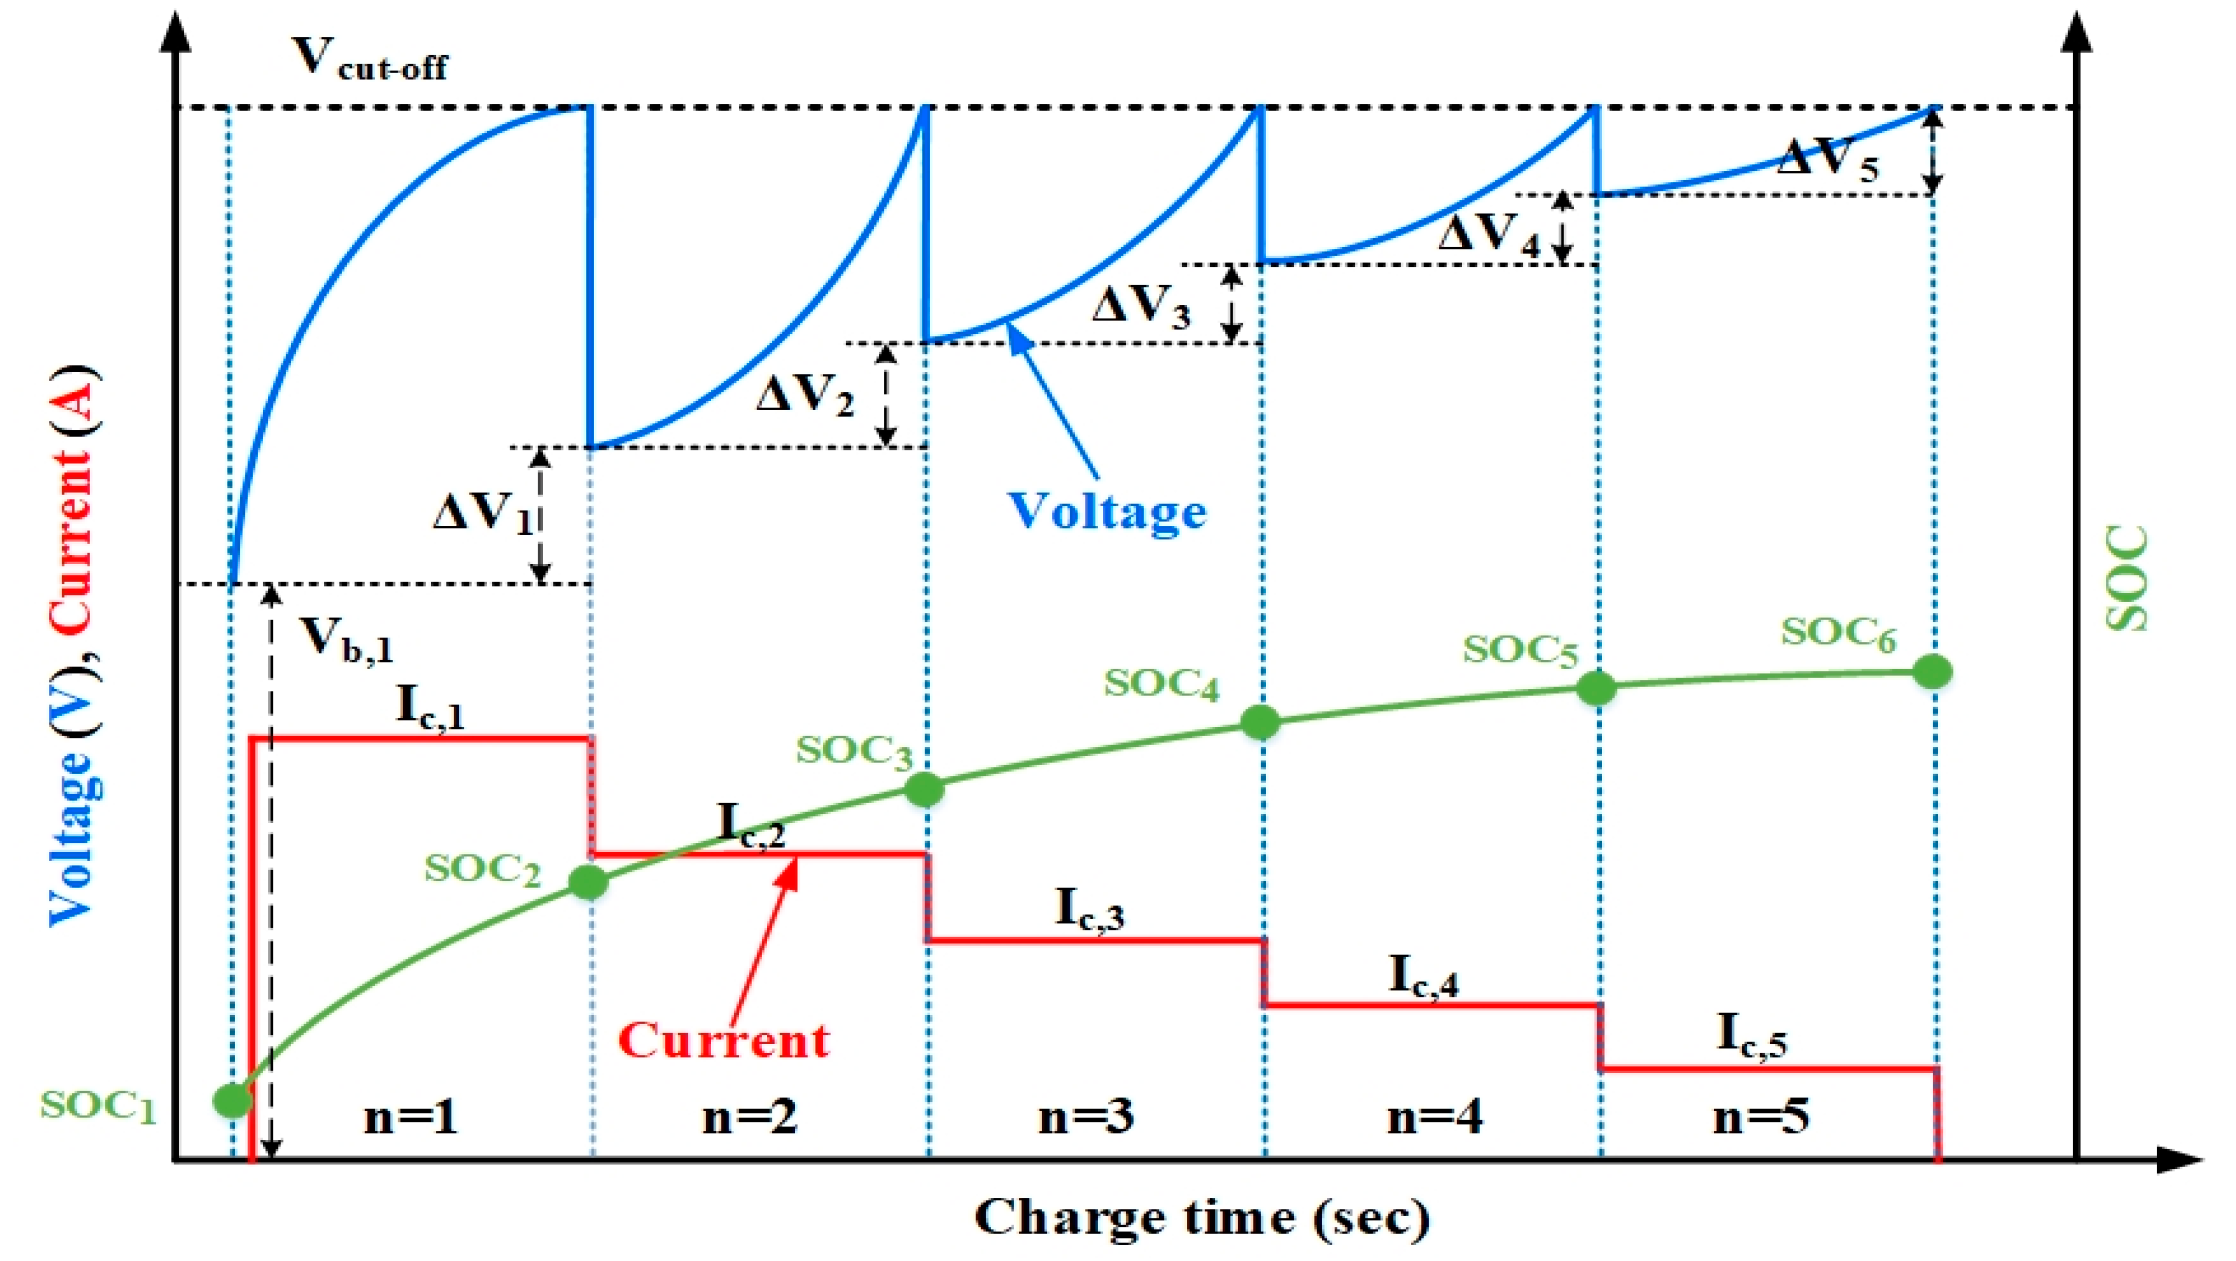
2.2. Mathematical Description of the MSCC Charging Method
2.3. Objective Function Formulation for OCP
3. Metaheuristic Optimization Algorithm for OCP Searching Protocol
3.1. Inspiration for MOA
3.2. Overview of the Dandelion Optimization Algorithm
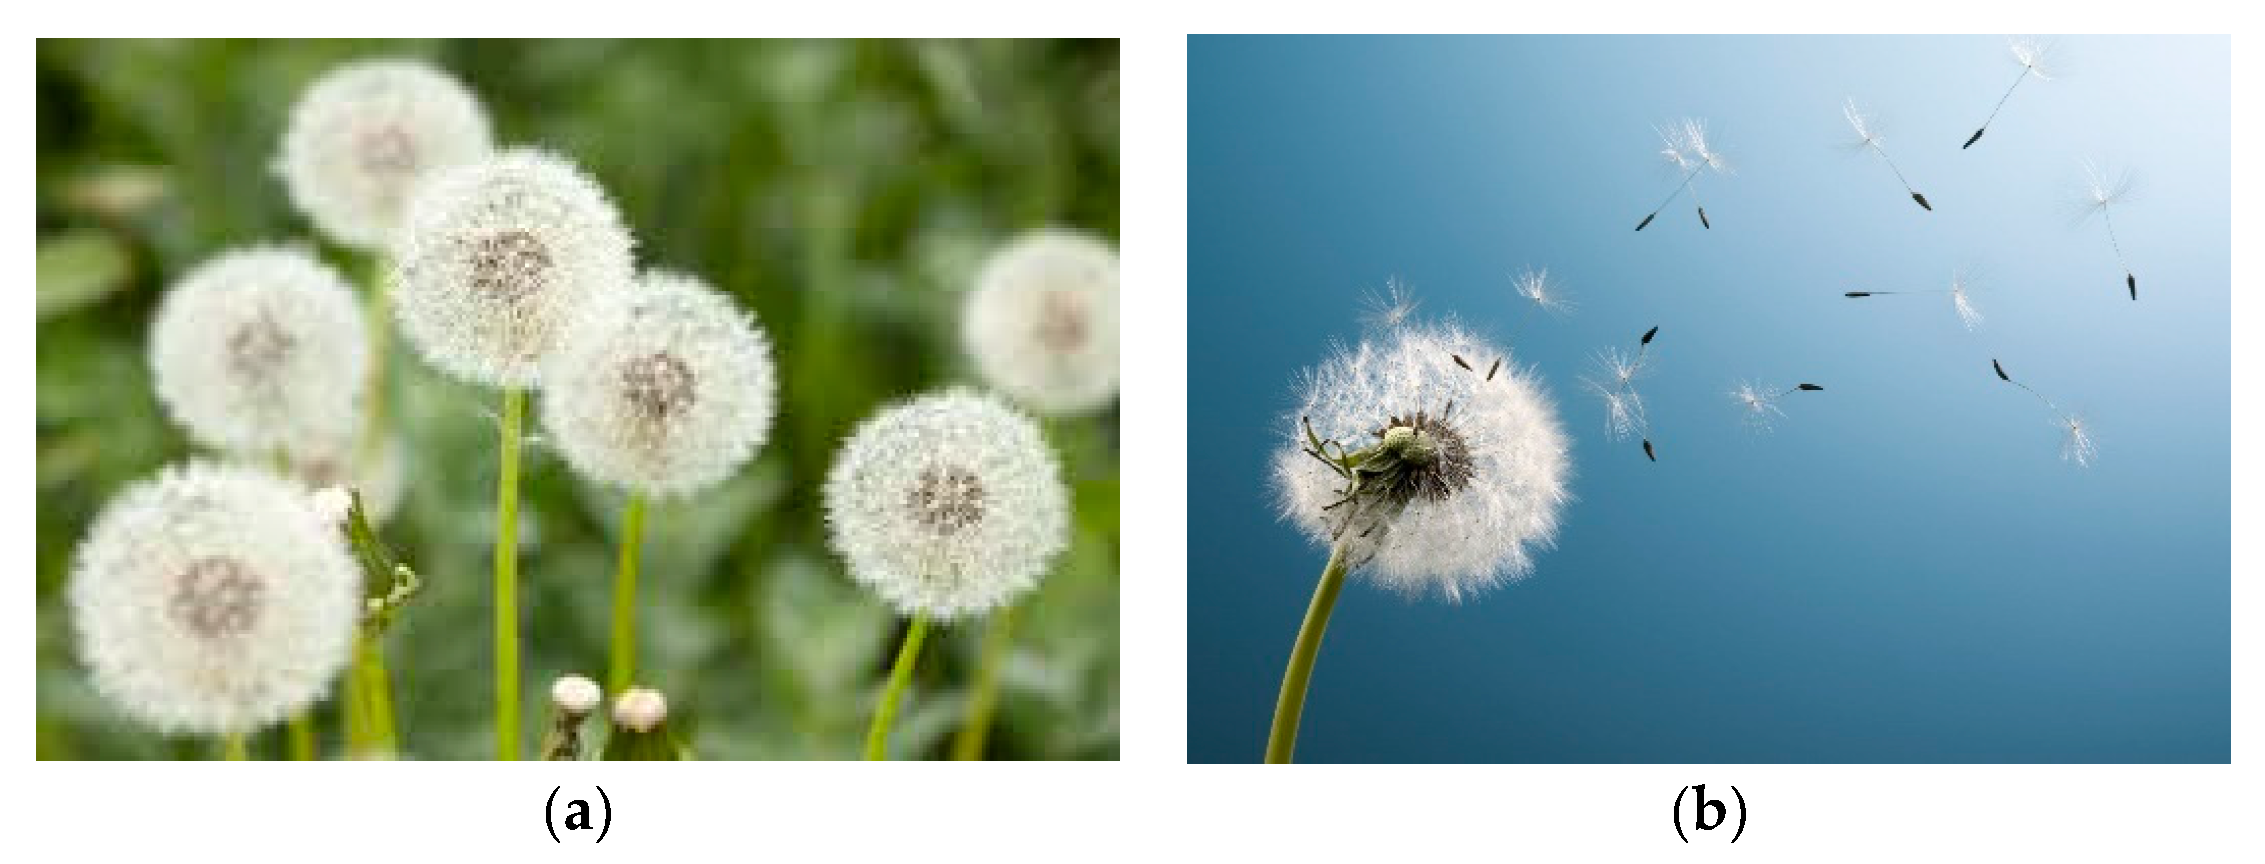
3.2.1. Inspiration
3.2.2. Mathematical Model
Rising Stage
Descending Stage
Landing Stage
4. Simulation and Experiment Results and Discussions
4.1. Computing Parameter Setting
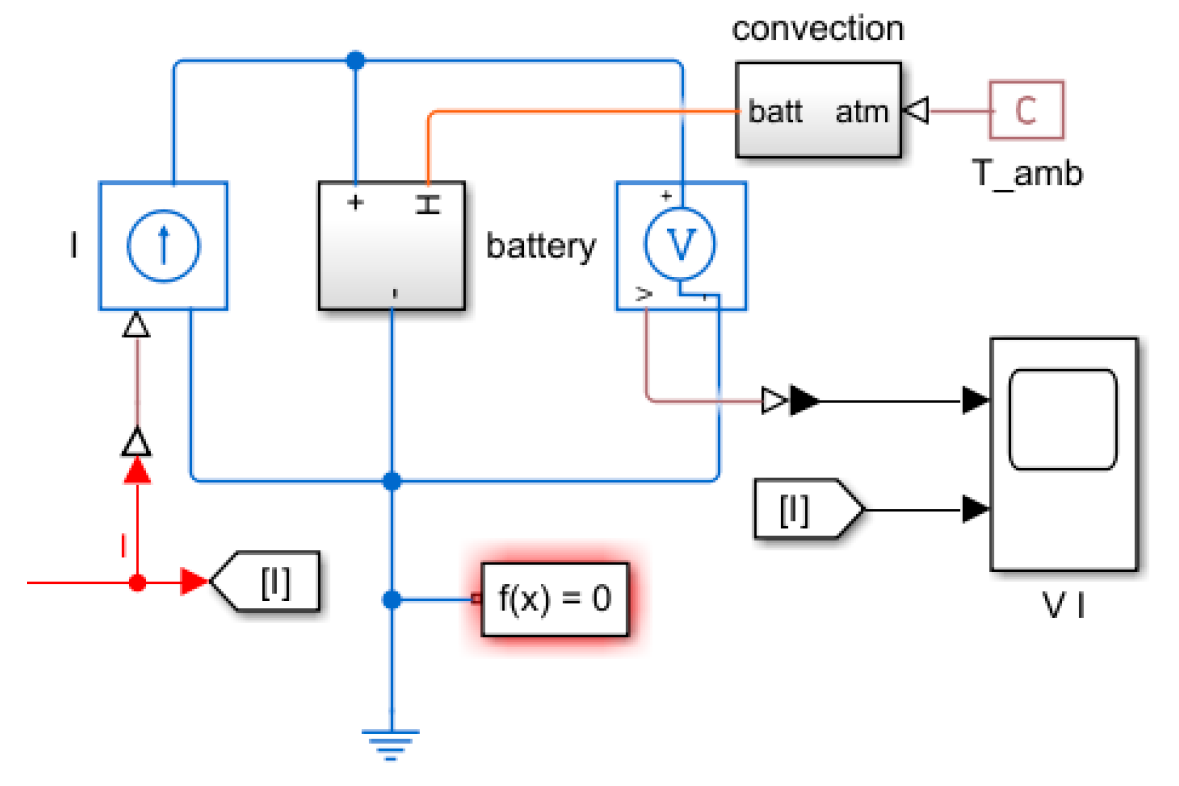
4.2. Simulation Results
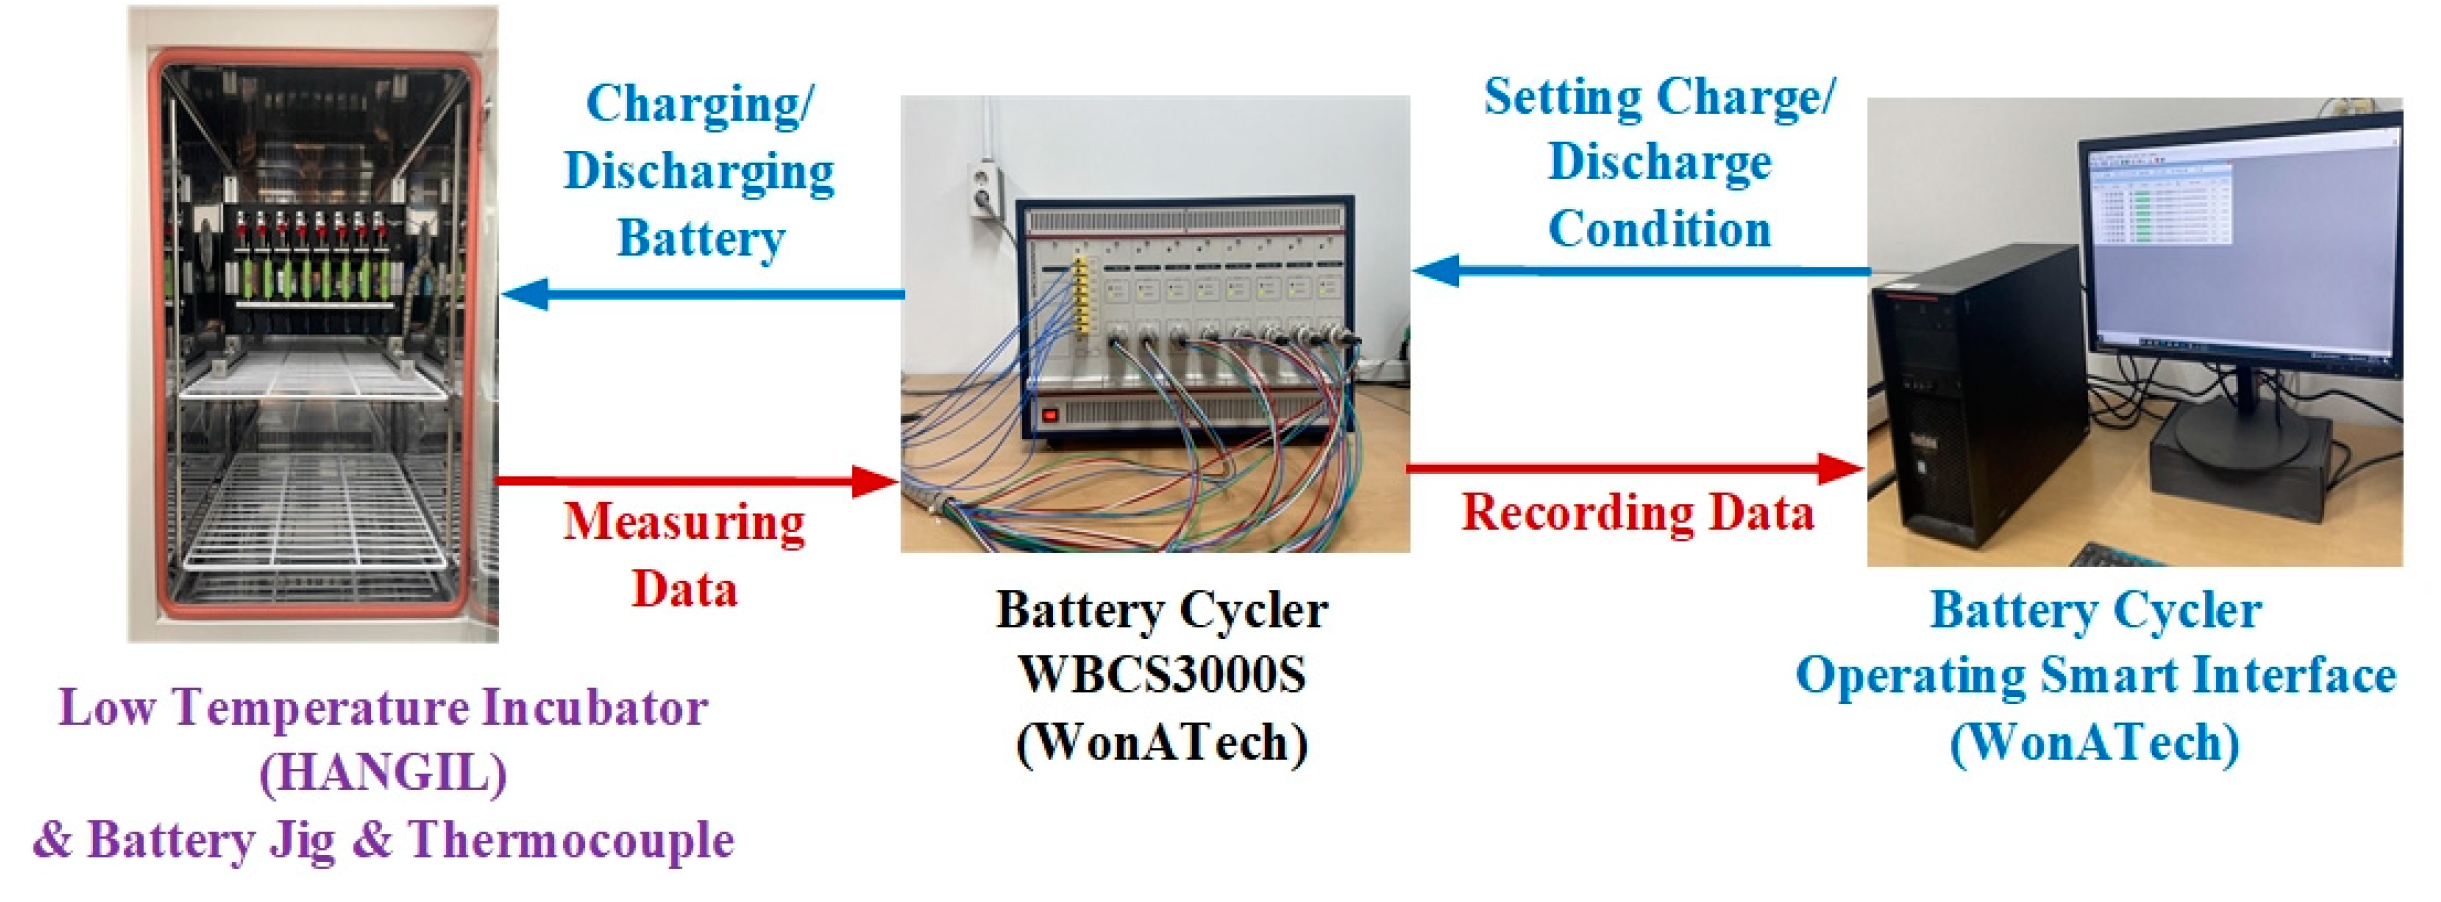
4.2. Experimental Results
7. Conclusions
Author Contributions
Funding
Acknowledgments
Conflicts of Interest
References
- Fleury,X ; Noh, M.H.; Geniès, S.; Thivel, P.X.; Lefrou, C.; Bultel, Y.; Fast-charging of lithium iron phosphate battery with ohmic-drop compensation method: Ageing study, J. Energy Storage, 2018, 16, 21–36, https://doi.org/10.1016/j.est.2017.12.015.
- Wassiliadis, N.; Schneider, J.; Frank, A.; Lin, X. ; Jossen, A; Lienkamp, M ; Review of fast charging strategies for lithium-ion battery systems and their applicability for battery electric vehicles, J. of Energy Storage, 2021, 44, 103306, https://doi.org/10.1016/j.est.2021.103306. [Google Scholar]
- Notten, P.H.; Op Het Veld, J.H.G.; van Beek, J.R.G. ; Bosstcharging Li-ion Batteries: A challenging new charging concept. J. of Power Sources, 2005, 145, 89–94. [Google Scholar] [CrossRef]
- Keil, P.; Jossen, A. ; Charging protocols for lithium-ion batteries and their impact on cycle life-an experimental study with different 18650 high-power cells, J. of Energy Storage, 2016, 6, 125–141. [Google Scholar] [CrossRef]
- Amanor-Boadu, J.M.; Guiseppi-Elie, A.; Sanchez-Siencio, E. ; The impact of pulse charging parameters on the life cycle of Lithium-ion ploymer batteries. Energies 2018, 11, 2162. [Google Scholar] [CrossRef]
- Fang, H.; Depcik, C.; Lvovich, V. ; Optimal pulse-modulated lithium-ion battery charging algorithm, J. of Energy Storage, 2018, 15, 359–367. [Google Scholar] [CrossRef]
- Gao, Y.; Zhang, X.; Cheng, Q.; Guo, B.; Yang, J. ; Classification and review of the charging strategies for commercial Lithium-ion batteries. IEEE Access 2020, 7, 43511–43524. [Google Scholar] [CrossRef]
- Kannan, D.R.R.; Weatherspoon, M.H. ; The effect of pulse charging on commercial lithium nickel cobalt oxide (NMC) cathode lithium-ion batteries, J. of Power Sources, 2020, 479, 229085. [Google Scholar] [CrossRef]
- Vo, T.T.; Chen, X.; Shen, W.; Kapoor, A. ; New charing stragegy for lithium-ion batteries based on the integration of Taguchi method and state of charge estimation, J. of Power Sources, 2015, 273, 413–422. [Google Scholar] [CrossRef]
- Lee, A.H.; Chen, M.Y.; Hsu, C.H. , Jiang, J. A.; Implementation of a SOC based four stage constant current charger for Li-ion batteries, J. Energy Storage, 2016, 18, 528–537. [Google Scholar]
- Zhang, Y.; Xu, S.; Wu, T. Multi-stage constant current charging strategy considering SOC intervals and voltage thresholds. Global Energy Interconnection 2022, 2, 143–163. [Google Scholar] [CrossRef]
- Lee, C. H. , Wang, X. J., Lin, K. Y.; Jiang, J.A.; Experiment-based determination of the optimized current level to achieve multiple constant current charging for Lithium-ion batteries, IEEE Trans. Aserosp. Electron Syst., 2023, 59, 2648–2657, https://doi.org/10.1109/taes.2022.3217426. [Google Scholar]
- Huang, Q.Y.; Liu, Y.J.; Chen, G. J.; Luo, Y.F.; Liu, C.L. ; Optimization of the SOC-based multi-stage current constant current charging strategy using coyote optimization algorithm, J. of Energy Storage, 2024, 77, 109867. [Google Scholar] [CrossRef]
- Zhao, L.; Lin, M.; Chen, Y. ; Least-squares based Coulomb counting method and its application for state-of-charge (SOC) estimation in eletric vehicles, Inter. J. of Energy Research, 2016, 40, 1389–1399. [Google Scholar] [CrossRef]
- Li, Y.; Wang, C. , Gong, J. ; A combination Kalman filter approach for state of charge estimation of lithium-ion battery considering model uncertainlty, Energy, 2016, 109, 933–946. [Google Scholar]
- Yong, S.; Zilin, M.; Gongyou, T.; Zheng, C.; Nong, Z. ; Estimatoin method of state-of-charge for lithium-ion battery used in hybrid electric vehicles based on variable structure extended Kalman filter, Chinese J. of Mechanical Eng., 2016, 29, 717–726. [Google Scholar]
- He, Z.; Chen, D.; Pan, C.; Chen, L.; Wang, S. ; State of charge estimation of power Li-ion batteries using a hybrid estimation algorithm based on UKF, Electrochima Acta, 2016, 211, 101–109.
- Lee, C.H.; Chang, T.W.; Hsu, S.H.; Jiang, J.A. ; Taguchi-based PSO for searching an optimal four-stage charge pattern of Li-ion battries, J. of Eenergy Storage, 2019, 21, 301–309. [Google Scholar] [CrossRef]
- Li, Y.; Li, K.; Xie, Y.; Liu, B.; Liu, J.; Zheng, J.; Li, W. ; Optimization of charging strategy for lithium-ion batery packs based on complete battery pack model, J. of Energy Storage, 2021, 37, 102466. [Google Scholar] [CrossRef]
- Li, Y.; Li, K.; Xie, Y.; Liu, J.; Fu, C.; Liu, B. ; Optimized charging of lithium-ion battery for electric vehicles: Adaptive multistage constant current-constant voltage charging strategy, Renewable Energy, 2020, 46, 2688–2699. https://doi.org/10.1016/j.renene.2019.08.077.
- Liu, Y.H.; Luo, Y.F. ; Search for an Optimal rapid-charging pattern for Li-ion batteries using the Taguchi approach, IEEE Trans. on Industrial Electr., 2010, 57, 3963–3971. [Google Scholar] [CrossRef]
- Khan, A.B.; Choi, W. ; Optimal charge pattern for high-performance multistage constant current charge method for the Li-ion batteries, IEEE Trans. on Energy Conversion, 2018, 33, 1132–1140. [Google Scholar] [CrossRef]
- Wang, S.C.; Liu, Y.H. ; A PSO-based fuzzy-controlled searching for the optimal charge pattern of Li-ion batteries, IEEE Trans. on Industrial Electr., 2015, 62, 2983–2993. [Google Scholar] [CrossRef]
- Jiang, L.; Li, Y.; Huang, Y.; Huang, Y.; Yu, J.; Qiao, X.; Wang, Y.; Huang, C. ; Optimization of multi-stage constant current charging pattern based on Taguchi method for Li-ion battery, Applied Energy, 2020, 259, 114148. https://doi.org/10.1016/j.apenergy.2019.114148.
- Alhaider, M.M.; Ahmed, E.M.; Aly, M.; Serhan, H.A.; Mohamed, E.A.; Ali, Z.M. ; New temperature-compensated multi-step constant-current charging method for reliable operation of battery energy storage systems, IEEE Access, 2020, 8, pp 27961-27972. https://doi.org/10.1109/access.2020.2972391.
- Atta, P.M.; Grover, A.; Jin, N.; Severson, K.A.; Markov, T.M.; Liao, Y.H.; Chen, M.H. , Cheong, B.; Perkins, N.; Yang, Z.; Herring, P.K.; Aykol, M.; Harris, S.J.; Braatz, R.D.; Ermon, S.; Chueh,W.C.; Closed-loop optimization of fast-charging protocols for batteries with machine learning, Nature, 2020, 578, 392–402. https://doi.org/10.1038/s41586-020-1994-5.
- Chen, G.J.; Liu, Y.H.; Wang, S.C.; Luo, Y.F.; Yang, Z.Z. ; Searching for the optimal current pattern based on grey wolf optimizer and equivalent circuit model of Li-ion batteries, J. of Energy Storage, 2021, 33, 101933. [Google Scholar] [CrossRef]
- Wang, S.C.; Zhang, Z.Y. ; Research on optimum charging current profile with multi-stage constant current based on bio-inspired optimization algorithms for Lithium-ion batteries, Energies, 2023, 16, 7641. https://doi.org/10.3390/en16227641.
- Kumar, K.; Pareek, K. ; Fast charging of lithium-ion battery using multistage charging and optimization with Grey relational analysis, J. of Energy Storage, 2023, 68, 107704. [Google Scholar] [CrossRef]
- Mathieu, R.; Briat, O.; Gyan, P.; Vinassa, J.M. ; Fast charging for electric vehicles applications: Numerical optimization of a multi-stage charging protocol for lithium-ion battery and impack on cycle life, J. of Energy Storage, 2021, 40, 102756. [Google Scholar] [CrossRef]
- Mirjahili, S.; Lewis, A.; Sadiq, A.S. ; Automous particles groups for particle swam optimization, Arabian J. for Science and Eng., 2015, 39, 4683–4697. [Google Scholar]
- Mirjalili, S.; Mirjalili, S.M.; Lewis, A. ; Grey wolf optimizer, Advances in Engineering Software, 2014, 69, 46–61.
- Chou, J.S.; Truong, D.N. ; A novel metaheuristic optimizer inspired by behaviior of jellyfish in ocean, Appllied Mathematics and Comp. , 2021, 389, 125535. [Google Scholar]
- Zhao, S.; Zhang, T.; Ma, S.; Chen, M. ; Dandelion optimizer: A nature-inspired methaheuristic algorithm for engineering applications, Engineering Applications of Artificial Intell. , 2022, 114, 105075. [Google Scholar]
- Hentunen, A.; Lehmuspelto, T.; Suomela, J. ; Time-domain parameter extraction method for Thevenin-equivalent circuit battery models, IEEE Trans. on Energy Conversion, 2014, 29, 558–56. https://doi.org/10.1109/tec.2014.2318205.
- Takyi-Aninakwa, P.; Wang, S.; Zhang, H.; Appiah, E.; Bobobee, E.D.; Fernadez, C. ; A strong tracking adaptive fading-extended Kalman filter for the state of charge estimation of lithium-ion batteries, Eneregy Research, 2022, 46, 16427–16444. https://doi.org/10.1002/er.8307.
- Yuthanava, T.; Khomfoi, S.; Phophongviwat, T. ; Modeling Li-ion battery using measurement data, Third Inter. Symposium on Instrumen. Control Artificial Intell. and Robotics, Thailand, 2023, 131-134.
- Ayyarao, T.S.L.V.; Ramakrishna, N.S.S.; Elavarasan, R.M.; Polumanthi, N.; Rambabu, M.; Saini, G.; Khan, B.; Alatas, A.B. ; War strategy optimization algorithm: A new effective metheuristic algorithm for global optimization, IEEE Access, 2022, 10, 25073–252105.
- Zhong, C.; Li, G.; Meng, Z. ; Beluga whale optimization: A novel nature-inspired methaheuristic algorithm, Knowdge-Based Systems, 2022, 251, 109215.
- Houssein, E.; Saad, M.R.; Hashim, F.; Shalban, H.; Hassaballah, M. ; Levy flight distribution: A new metaheuristic algorithm for solving engineering optimization problems, Engineering Applications of Artificial Intell. , 2020, 94, 103731, https://doi.org/10.1016/j.engappai.2020.103731. [Google Scholar]
- Abdollahzadeh, B.; Gharehchopogh, F.S.; Mirjalili, S. ; African vultures optimization algorithm: A new nature-inspired metaheuristic algorithm for global optimizaion problems, Computer & Industrial Eng. , 2021, 158, 107408. [Google Scholar]
- https://gardenerspath.com, https://treehugger.com.

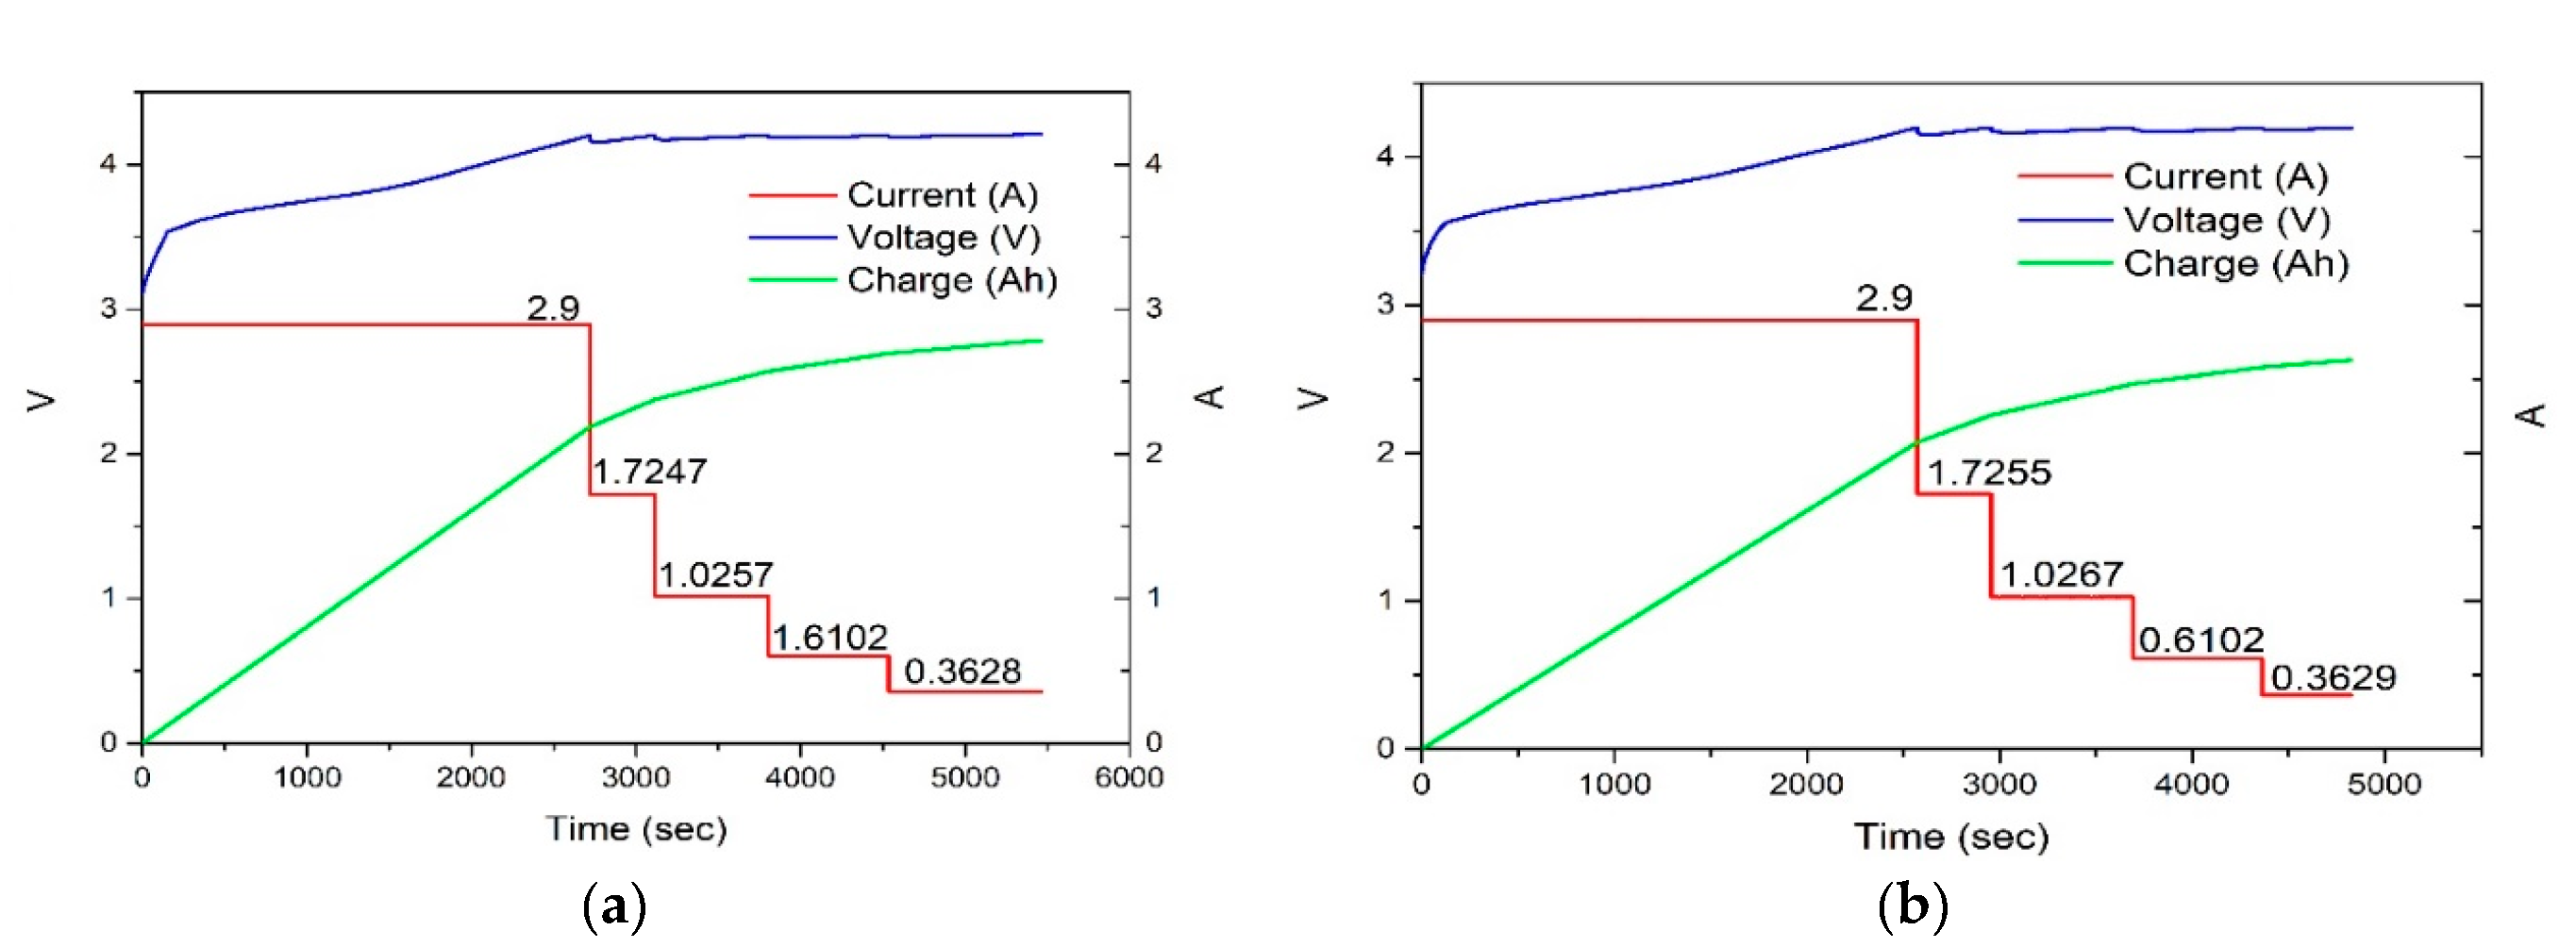
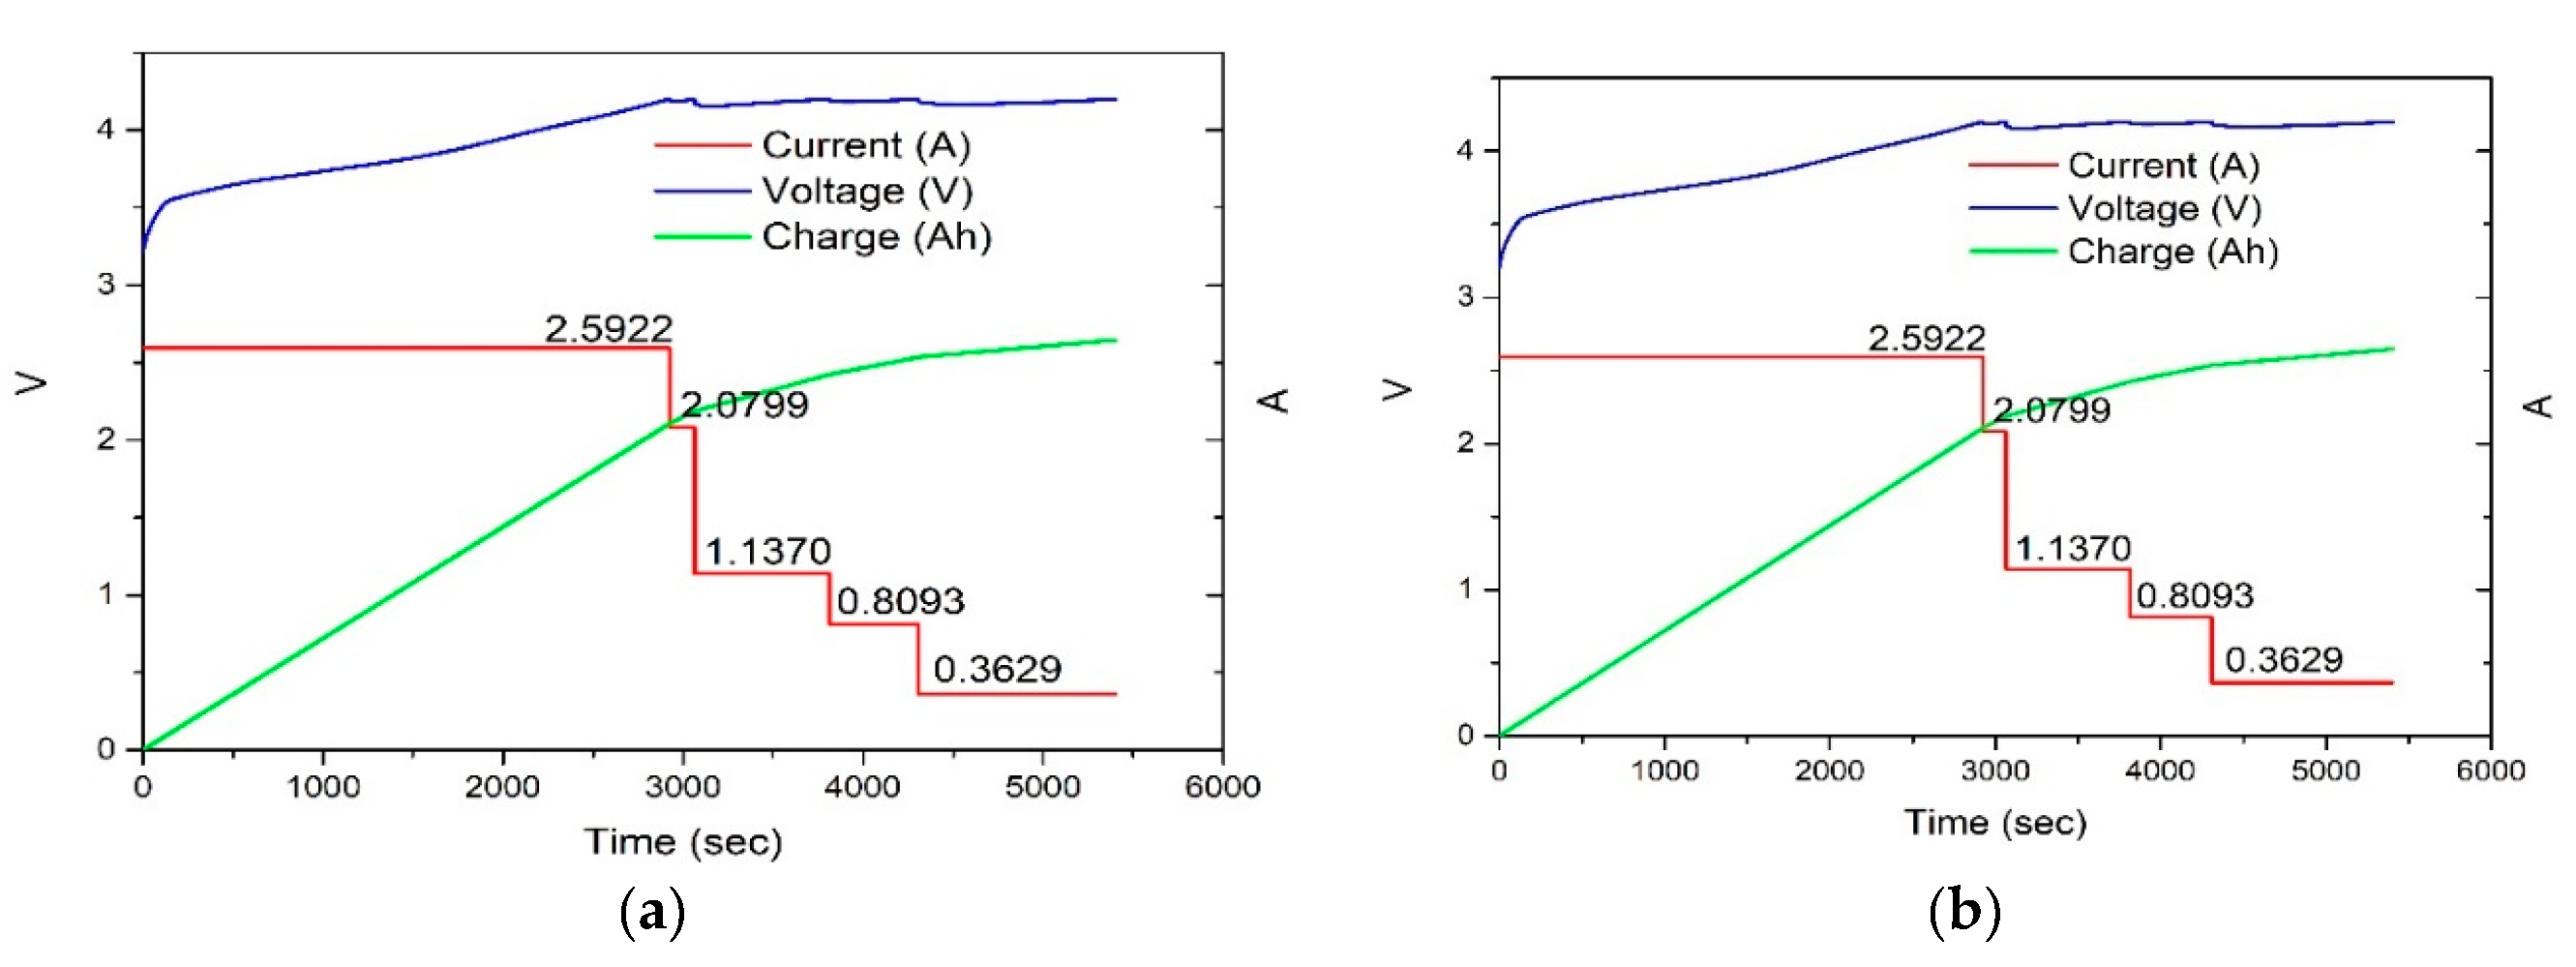
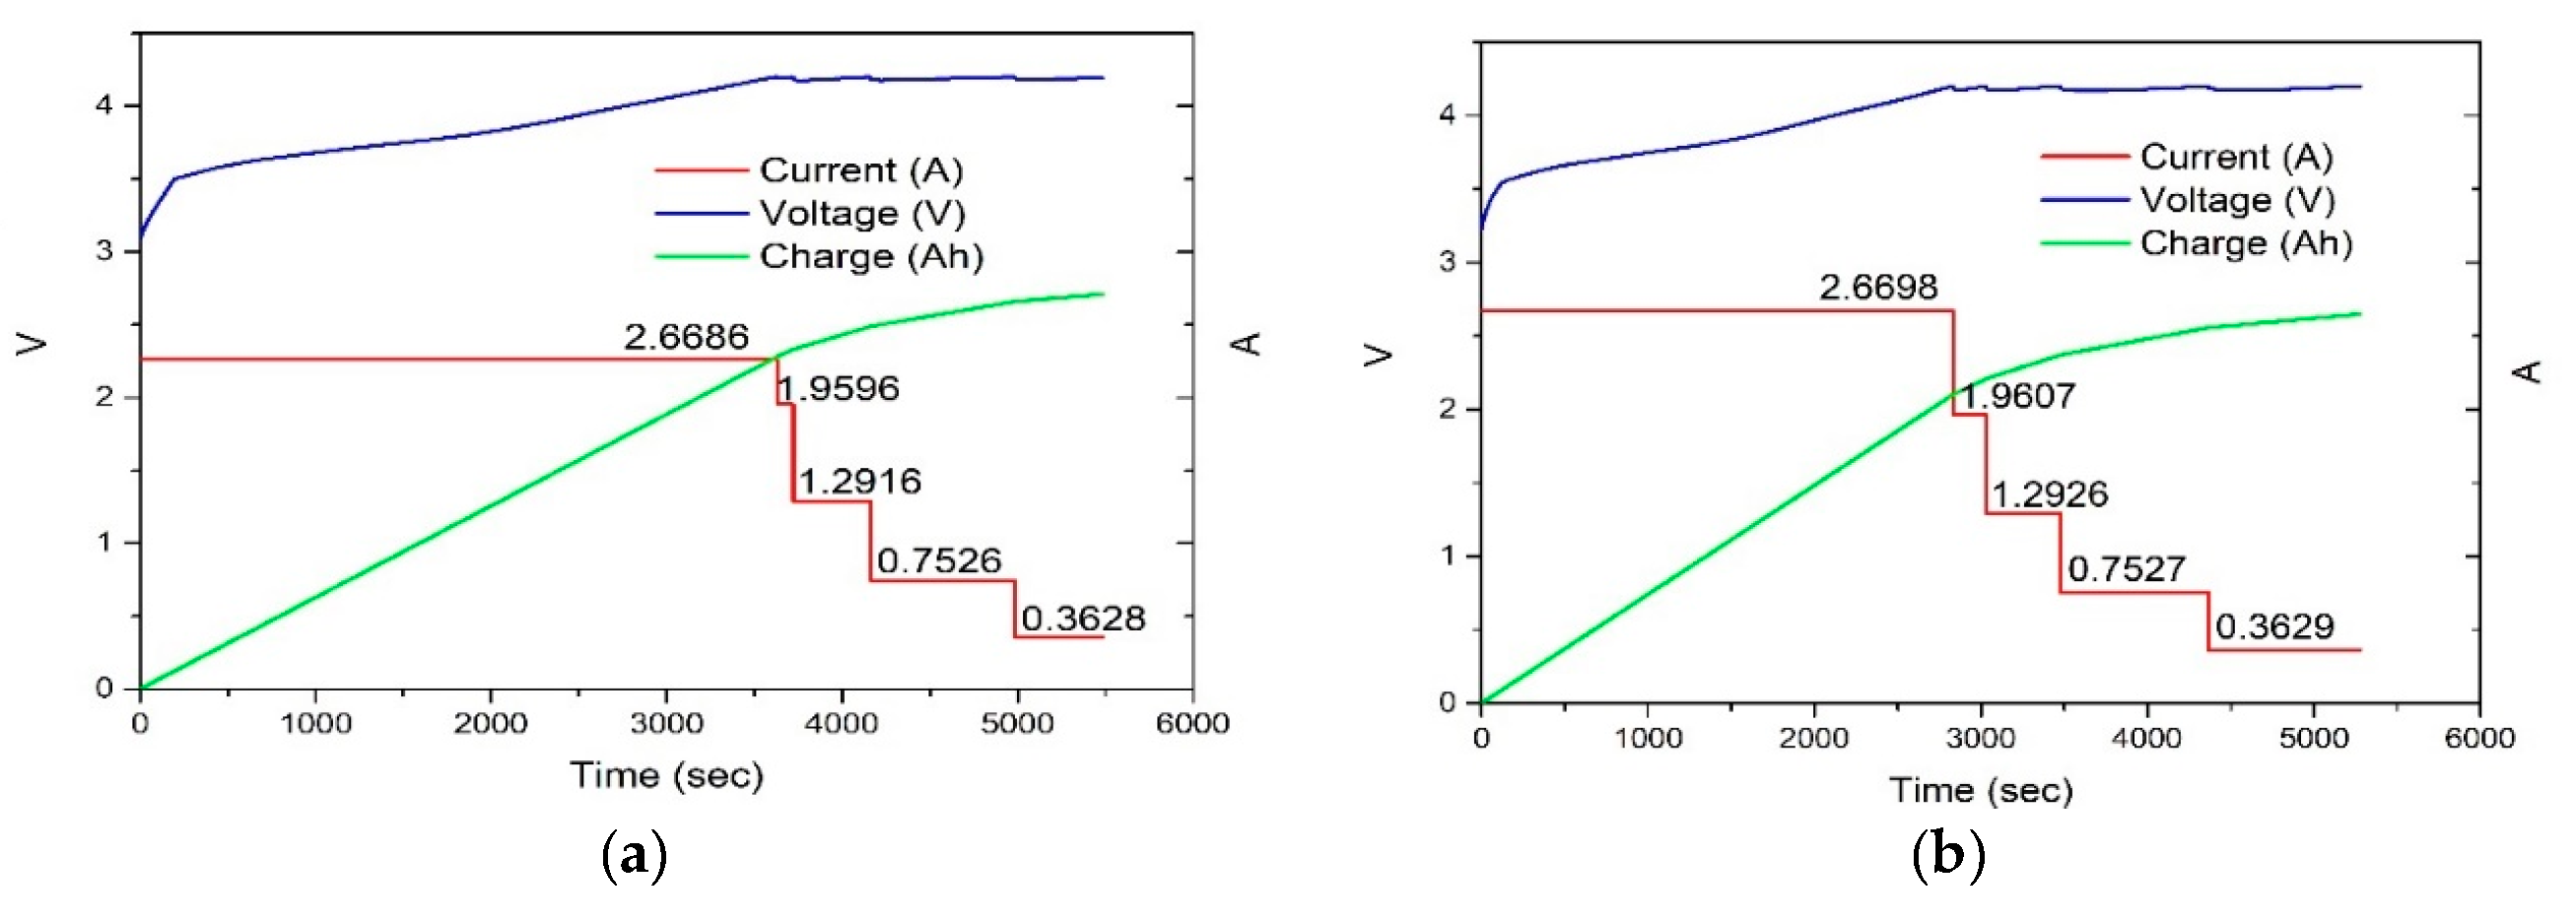
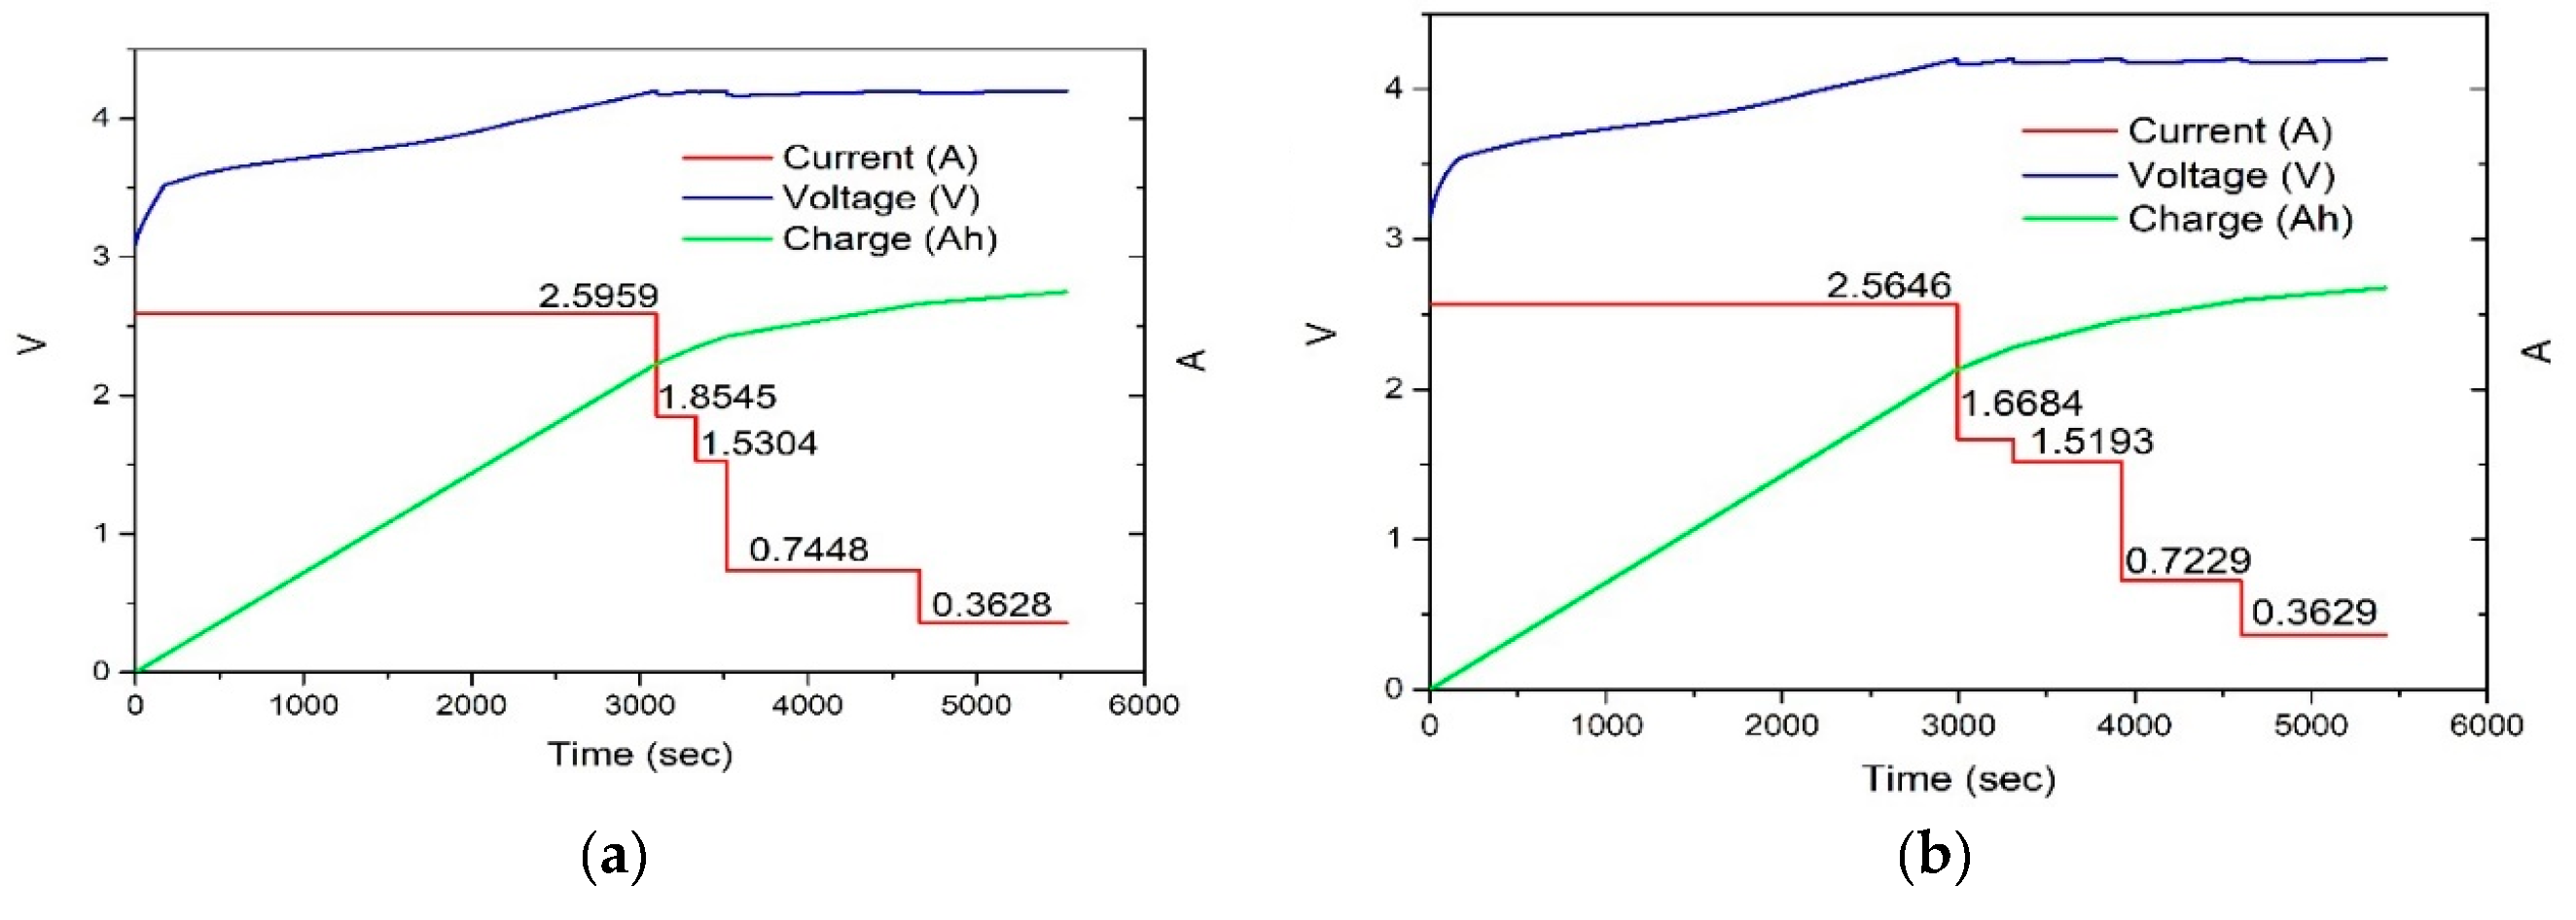
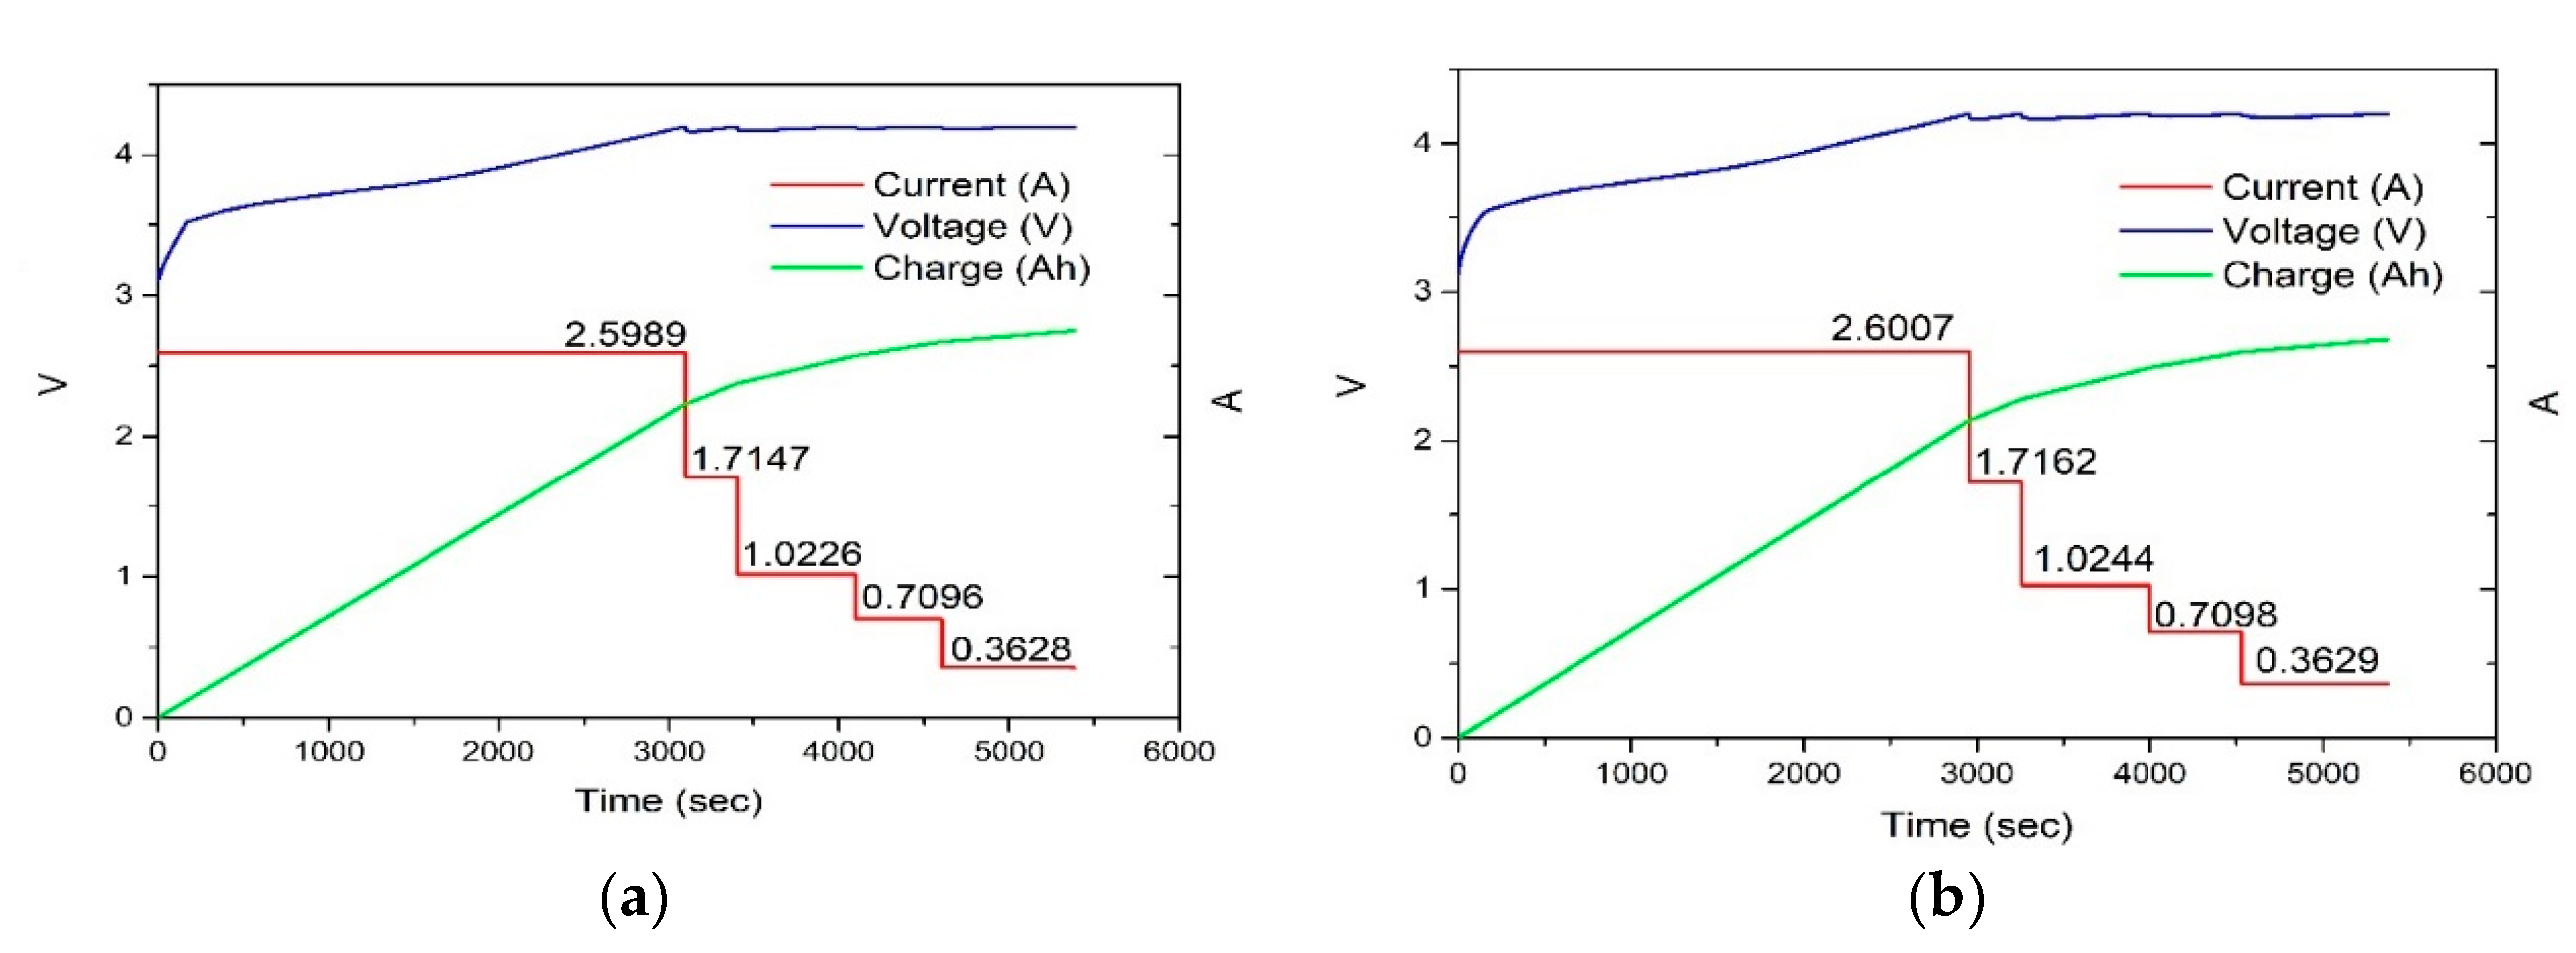
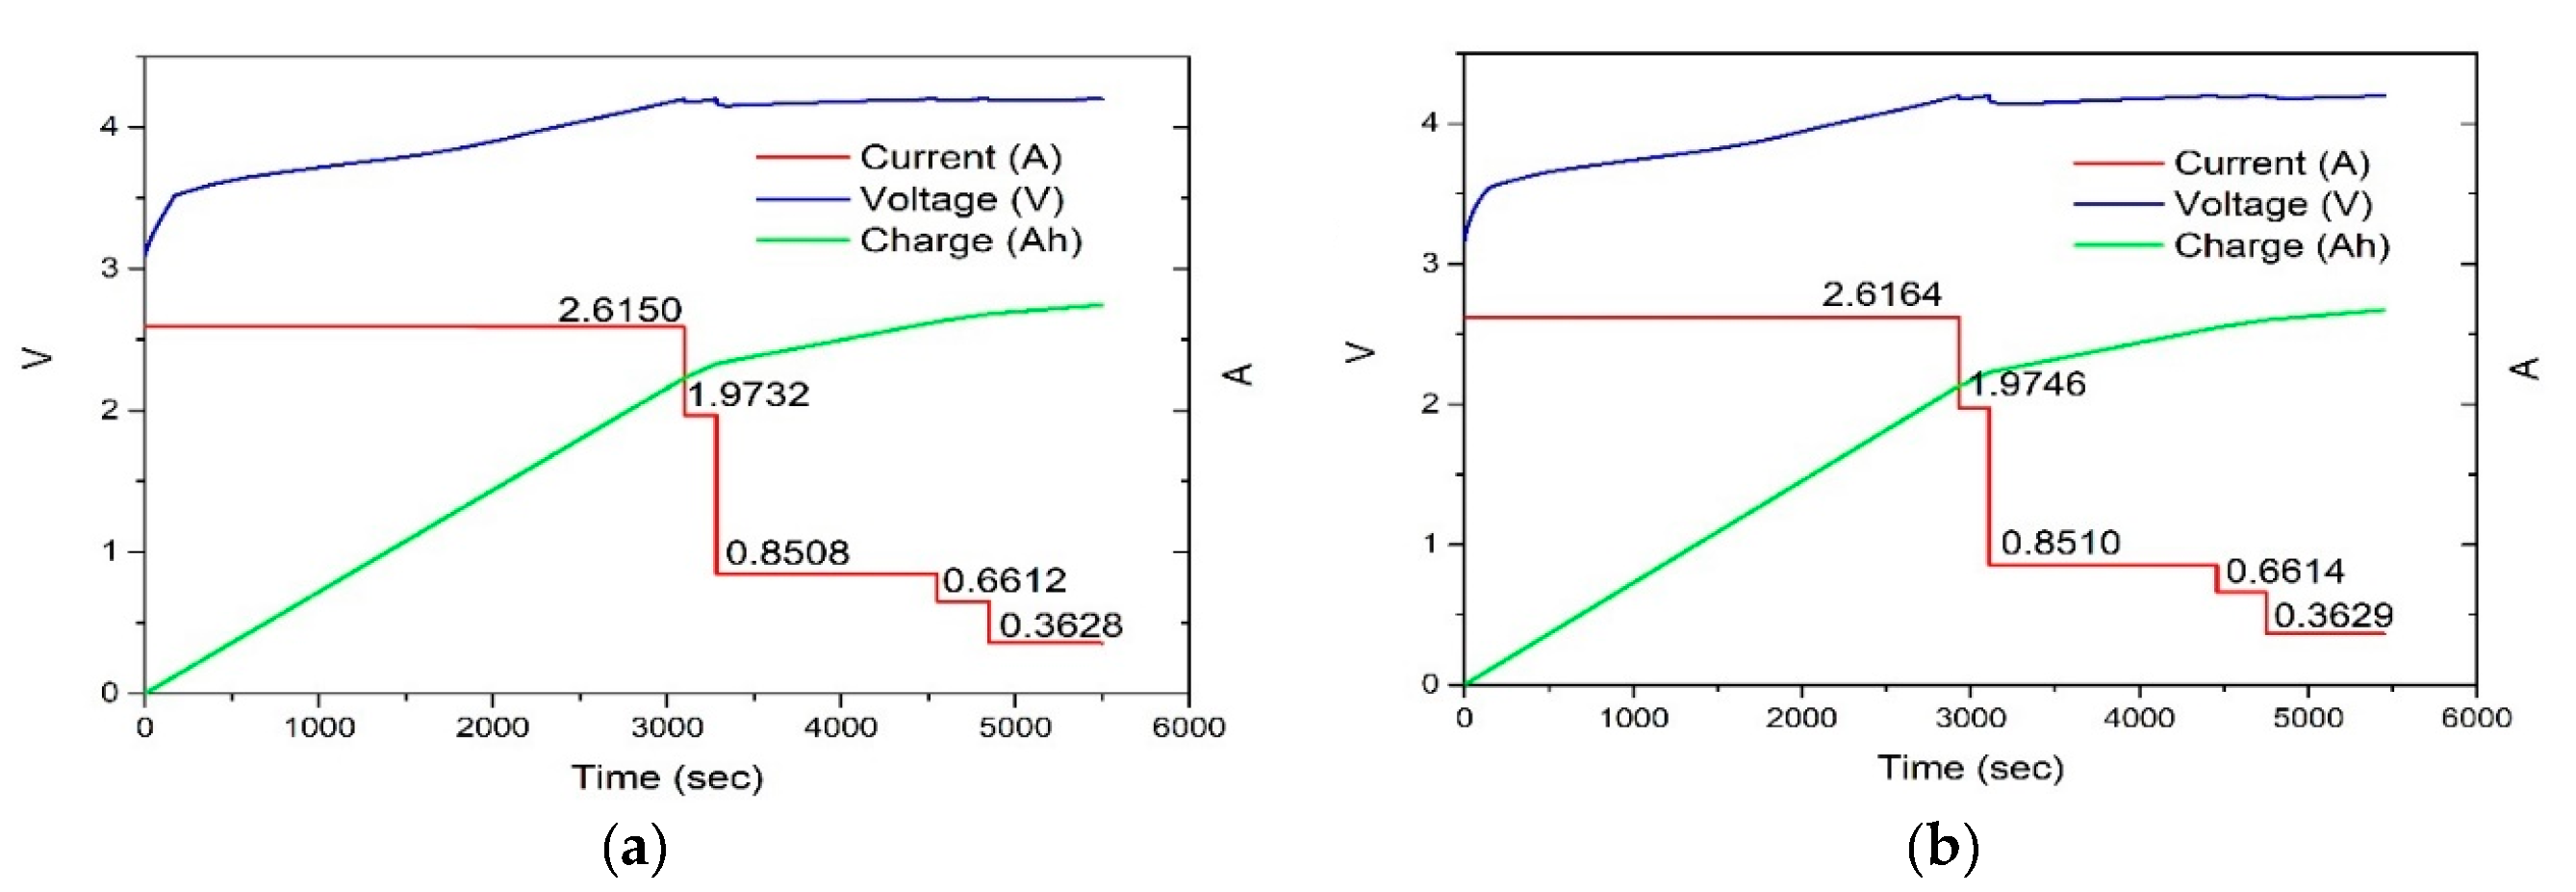
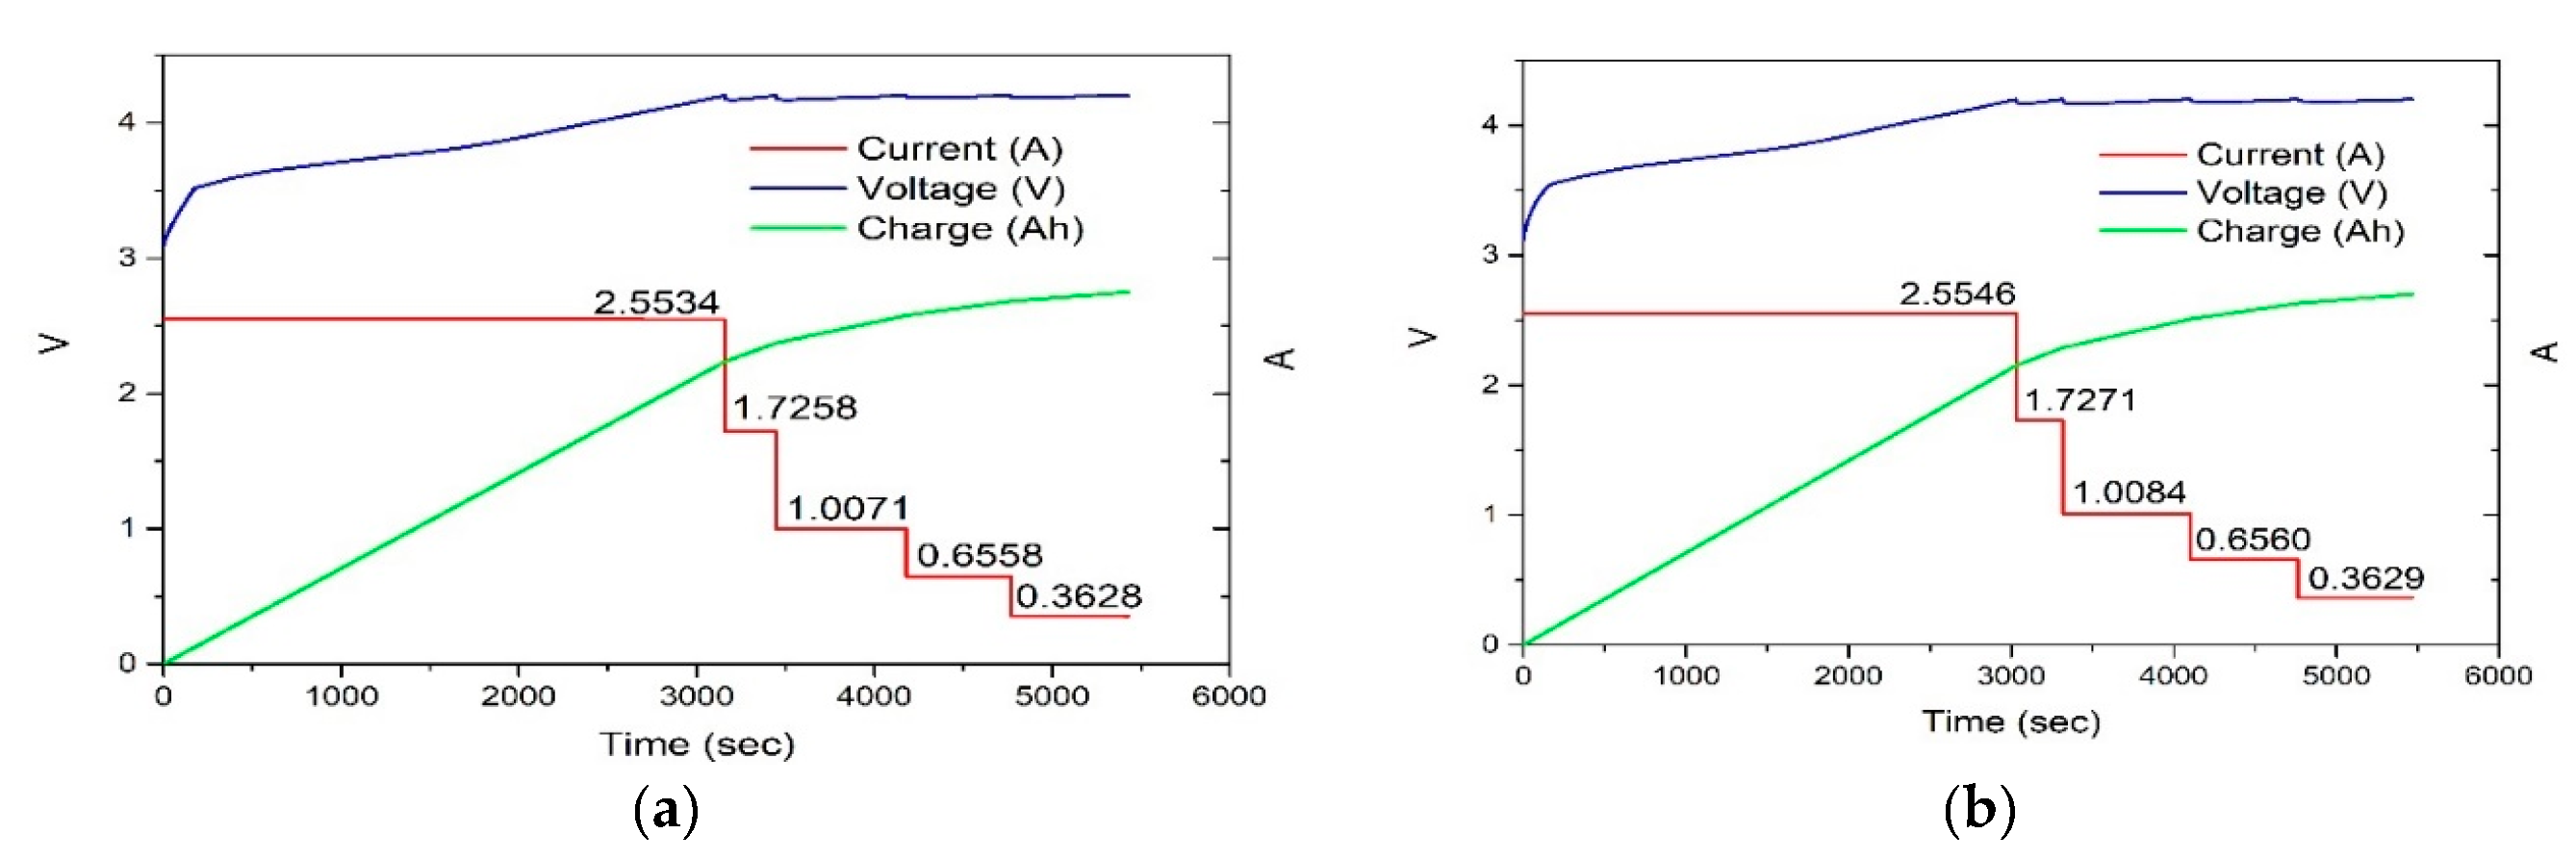
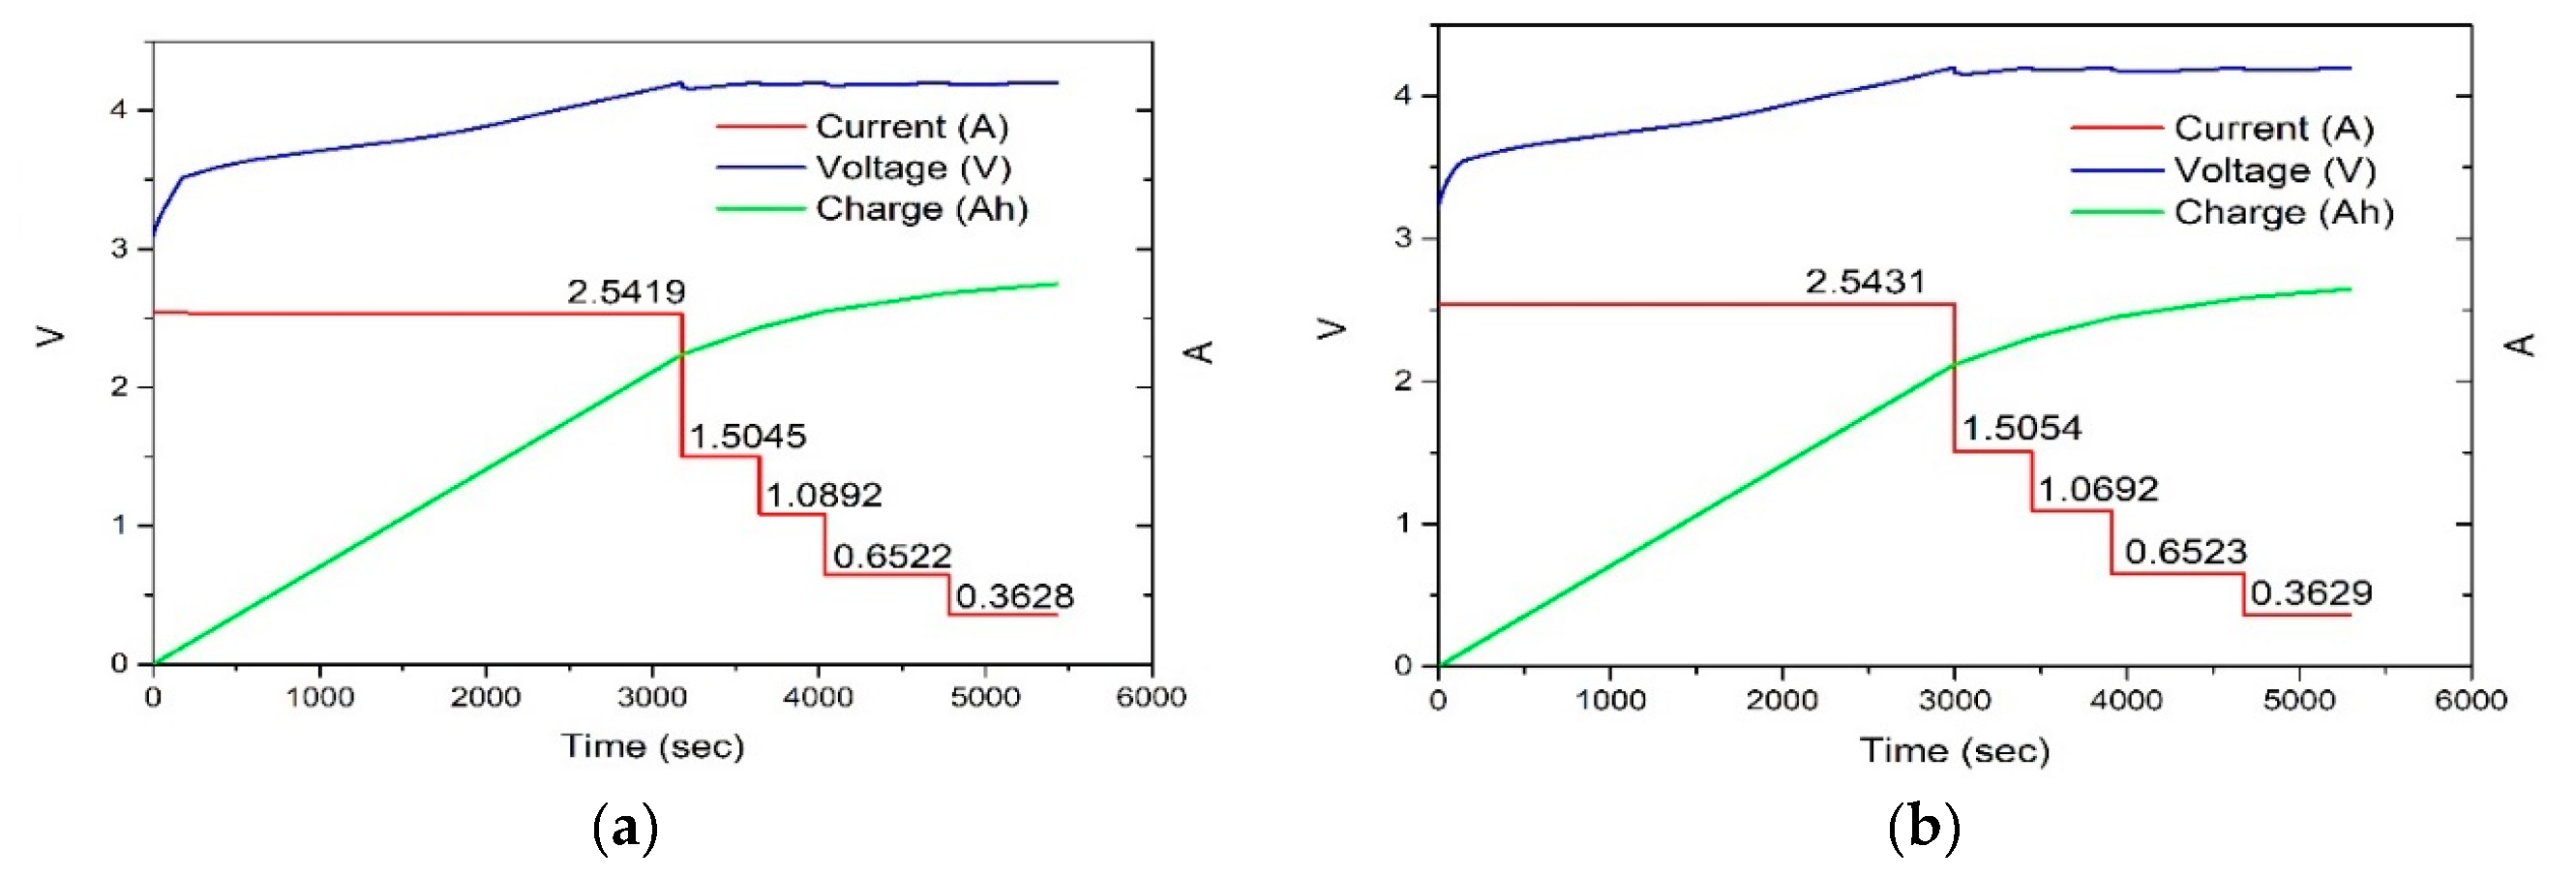

| Parameter | Value |
|---|---|
| Nominal Capacity | |
| Nominal Voltage Cut-off Voltage |
|
| Standard Charge | |
| Dimensions | |
| Temparature |
| C-rate | Charge Time (sec) | Temperature (°C) |
| 0.5 | 9910 (Tc,max) | 26 (tc,max) |
| 2 | 4250 (Tc,min) | 42 (tc,max) |
| Algorithm | Particle No. Iteration No. Tuning parameter |
| PSO | |
| WSO JSA |
N/A |
| GWO BWO LFDA AGTO |
N/A N/A N/A |
| DO |
| Algorithm | FC CT(sec) MCT(deg) EL(J) |
| 1C CC-CV | |
| FM | |
| PSO | |
| WSO JSA |
|
| GWO BWO LFDA AGTO |
|
| DO |
| Algorithm | |
| 1C CC-CV FM |
- - - - |
| PSO | |
| WSO JSA |
|
| GWO BWO LFDA AGTO |
|
| DO |
| Algorithm | FC CT(sec) MCT(°C) EL(J) |
| 1C CC-CV | |
| FM | |
| PSO | |
| WSO JSA |
|
| GWO BWO LFDA AGTO |
|
| DO |
| Algorithm | |
| 1C CC-CV FM |
- - - - |
| PSO | |
| WSO JSA |
|
| GWO BWO LFDA AGTO |
|
| DO |
| Algorithm | FC CT MCT CE Total Score |
| 1C CC-CV | |
| FM | |
| PSO | |
| WSO JSA |
ab |
| GWO BWO LFDA AGTO |
|
| DO |
Disclaimer/Publisher’s Note: The statements, opinions and data contained in all publications are solely those of the individual author(s) and contributor(s) and not of MDPI and/or the editor(s). MDPI and/or the editor(s) disclaim responsibility for any injury to people or property resulting from any ideas, methods, instructions or products referred to in the content. |
© 2024 by the authors. Licensee MDPI, Basel, Switzerland. This article is an open access article distributed under the terms and conditions of the Creative Commons Attribution (CC BY) license (http://creativecommons.org/licenses/by/4.0/).


