Preprint
Article

Precision Mapping of Seagrass Habitats Using Multispectral Drones and Machine Learning

This version is not peer-reviewed.

Submitted:

04 November 2024

Posted:

06 November 2024

You are already at the latest version

Abstract
Seagrass beds and salt marshes play a crucial role in preserving and restoring estuarine ecosystems, providing essential services such as carbon sequestration, water filtration, and habitat for diverse marine life. Mapping these areas, particularly in remote locations, is challenging but essential for effective conservation efforts. This study explores the use of drones equipped with multispectral cameras to map seagrass meadows and salt marshes in estuarine environments. The methodology involved composing images into a multilayer multidimensional dataset, performing exploratory data analysis and principal component analysis, and utilizing Random Forest supervised classification to generate detailed maps. Applied to a case study of the Mira River in southern Portugal, this approach achieved mapping accuracies as high as 94% with kappa values of 0.91. These results demonstrate the efficacy of drone-based multispectral imaging and advanced analytical techniques in accurately mapping and monitoring critical estuarine habitats, offering a valuable tool for conservation and restoration initiatives.
Keywords: 
Subject: 
Environmental and Earth Sciences  -   Remote Sensing

1. Introduction

Seagrass beds comprise some of the most heterogeneous landscape structures of shallow water estuarine and marine ecosystems in the world and are reported to be in decline globally [1,2]. These beds play important ecological roles in coastal ecosystems, providing high-value services, are typically considered ecosystem engineers, are crucial in structuring assemblages, and are important sinks for organic carbon, providing co-benefits [3,4].
The intertidal seagrass beds of Zostera noltii in the Mira estuary (SW coast, Portugal) are undergoing a natural recovery process after a major collapse in 2008, the causes of which are still unknown [5]. Since 2009, an uneven natural recovery has been observed, with some seagrass beds having high biomass, while others have very low biomass values, with clear changes in the temporal and spatial distribution of seagrass beds in Mira estuary [6,7].
An effective restoration method and strategy for the recovery of a seagrass bed must be based on the knowledge of its ecological status and particularly based in the knowledge of the dynamic of its spatial and temporal distribution and variability. Monitoring, by mapping the temporal and spatial distribution of seagrass beds, provides an essential reference to plan a successful strategy for seagrass habitat recovery. Figure 1 represents the mapping of Z. noltii and Salt Marsh in the mouth of the Mira River, on the spring of 2022.
Often the seagrass areas are not easily accessible thus constituting a problem to accurately map the extension of the different ecotypes which implies a poor characterization of the evolution and the recovery stage process.
Among the prevalent methodologies, the utilization of satellite data remains the most widely adopted for identifying and mapping seagrass bed regions (e.g. [2,8,9]). This approach is proven to be successful specially when combining the near infrared bands (NIR) with visible light in the normalized vegetation index (NDVI) (e.g. [10,11]). The drawback is the low temporal and spatial resolution of the free access data, not providing the necessary dates and resolution for accessing the species distribution.
Light unmanned aerial vehicles, i.e. drones, are the perfect tool for accessing these areas, and can provide high resolution imagery that is key to identify and map these ecosystems [12,13]. These images when acquired with enough overlap can be used to create digital elevation models (DEM) that are another important variable to study these areas.
Furthermore, the coupling of drones with multispectral cameras enhances the power of distinguishing the different ecotypes providing enhanced information to fully understand these systems. This is especially true when using a near-infrared band that help to identify the health of the vegetation [8]
This innovative approach is combined with Machine Learning (ML) methods to map the seagrass beds of the Mira estuary and to verify the quality of the results, providing insights to the application of this methodology in worldwide seagrass beds. The use of ML, namely Random Forest methods (RF) has already proven to be useful when applied in satellite images (e.g. [2,14]). Our work uses the same approach but with very high spatial resolution, testing its application in mapping the seagrass beds of the Mira estuary.

2. Materials and Methods

The initial recognition and the first studies of the presence of Z. noltii beds were done by field studies in accessible areas.
For this study a Mavic 2 PRO drone equipped with a Sentera NDVI multispectral camera (SNMC) was used. This setup collects two groups of images, one with the Hasselblad camera from the drone and another one from the SNMC. Both groups of images were processed in the Agisoft software to create an orthorectified image and using the Hasselblad camera images a digital elevation model (DEM) was created from the point cloud that is generated from the overlapping images.
The orthorectified images were resampled using a script written in R programming language (R Core Team 2024). The final ground surface distance (GSD) is of 5 cm. The orthorectified images were combined in a single raster that was used for all the analytical procedures.
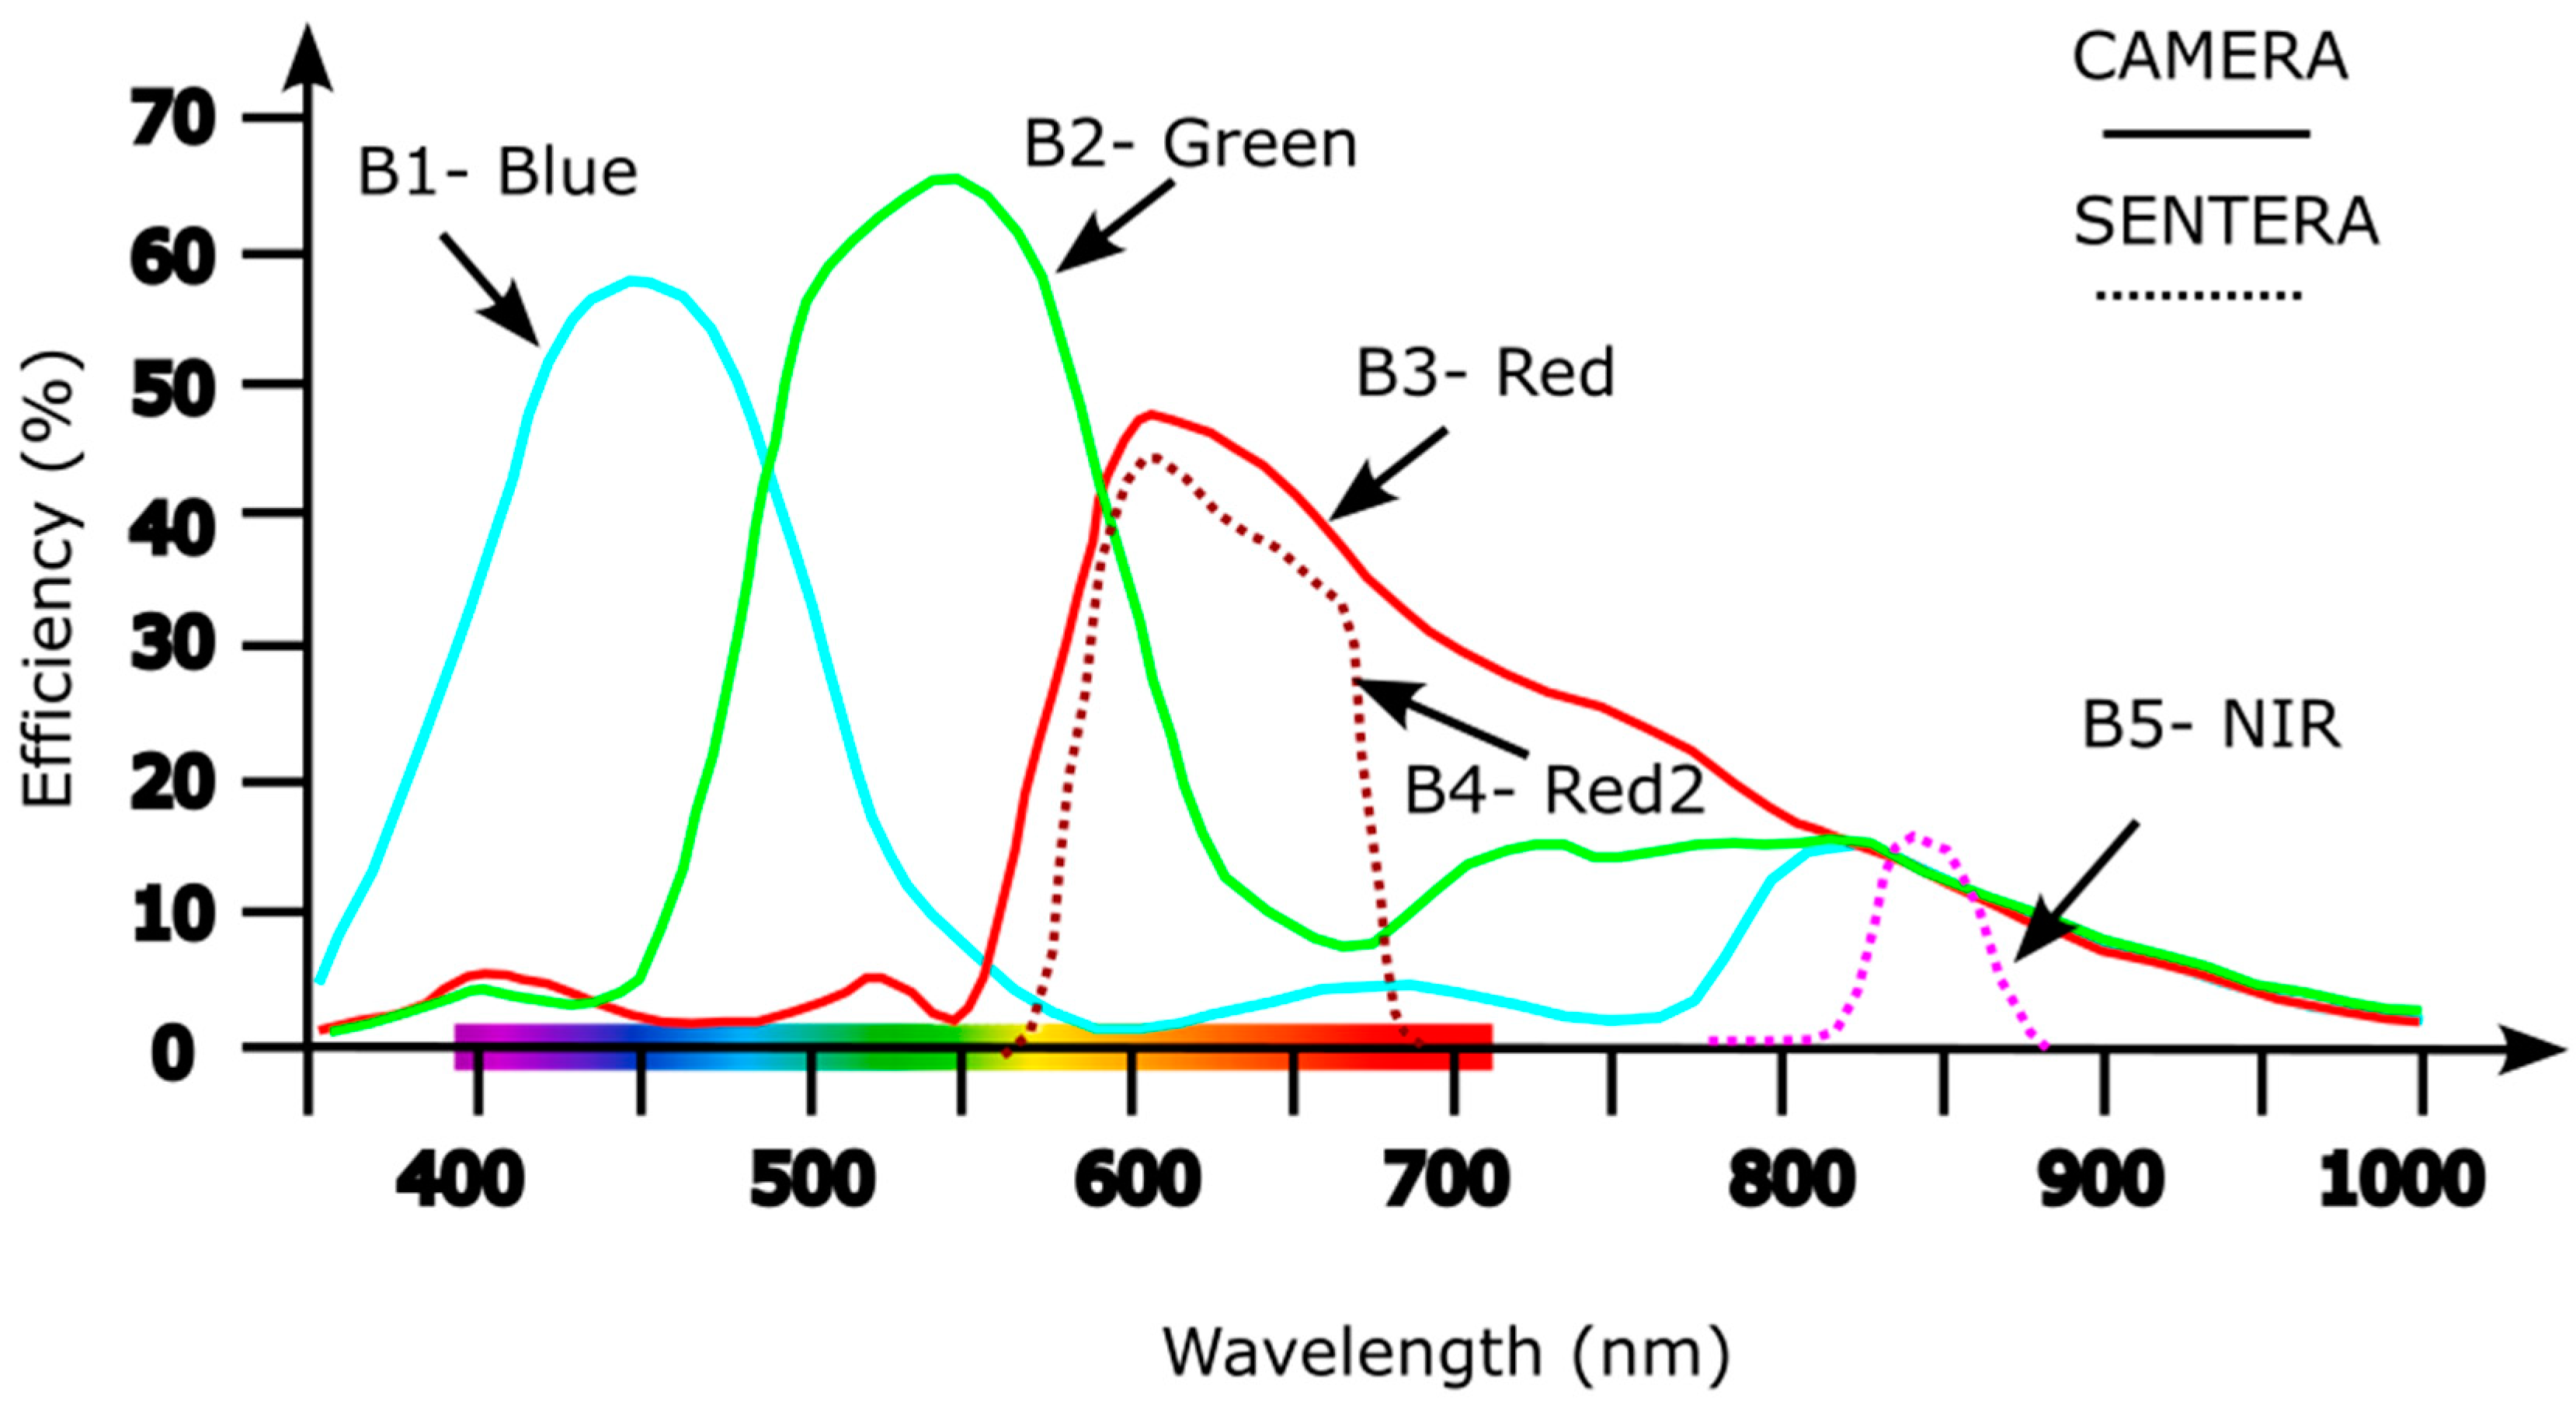
The sensors installed in the cameras have different spectral sensitivities and range (Figure 2) and for each of the bands in the raster stack were assigned a number that correspond to: B1- Blue, B2-Green, B3-Red, B4-Red2 and B5- NIR (near infrared).
The analytical procedures include the exploratory data analysis (EDA), evaluation of band ratio indexes in this case the Normalized Difference Vegetation Index (NDVI), principal components analysis (PCA) and classification using both K-means and Random Forest (RF) machine learning approaches. The K-Means was tested for 3 to 10 clusters whereas RF was done with 250 trees.
Accuracy was measured using the formula [15]:
A c c u r a c y = T r u e   P o s i t i v e s + T r u e   N e g a t i v e s T o t a l   N u m b e r   o f   I n s t a n c e s
And the Kappa value [15] is calculated by:
K = P 0 P e 1 P e
Where:
  • P 0 is the observed accuracy (i.e., the actual agreement between predicted and true values),
  • P 0 is the expected agreement (i.e., the agreement expected by chance).
One must remember that Kappa values range from -1 to 1, where: i) A value of 1 indicates perfect agreement; ii) Zero indicates no agreement better than chance; iii) Negative values suggest agreement worse than chance. In practice, a high accuracy can be misleading with imbalanced data, but a high Kappa value suggests that the model is performing well beyond chance.
For this study not all the seagrass beds from the Mira estuary were studied, it was selected the seagrass area located in the Moinho da Asneira (Figure 3), it is strongly representative of the natural recovery after a major collapse in 2008 [5].
The focus of the study was the characterization and mapping of the two main ecotypes present in the area, i.e. a) Zostera noltii and b) adjacent Salt Marsh, identifying all the other landscape elements as unclassified. We are aware that several other categories of elements are present in the area (e.g., terrestrial vegetation or human infrastructures, c.f. Figure 4); however, all of these were consolidated into a single category.

3. Results

The results are discussed on two different levels, that is: i) the data description and exploratory data analysis, including principal component analysis, ii) the application of Machine Learning approaches (ML) unsupervised (K-Means) and supervised (Random Forest) for cartographic support.

3.1. Exploratory Data Analysis

3.1.1. Atlas of RGB Signatures

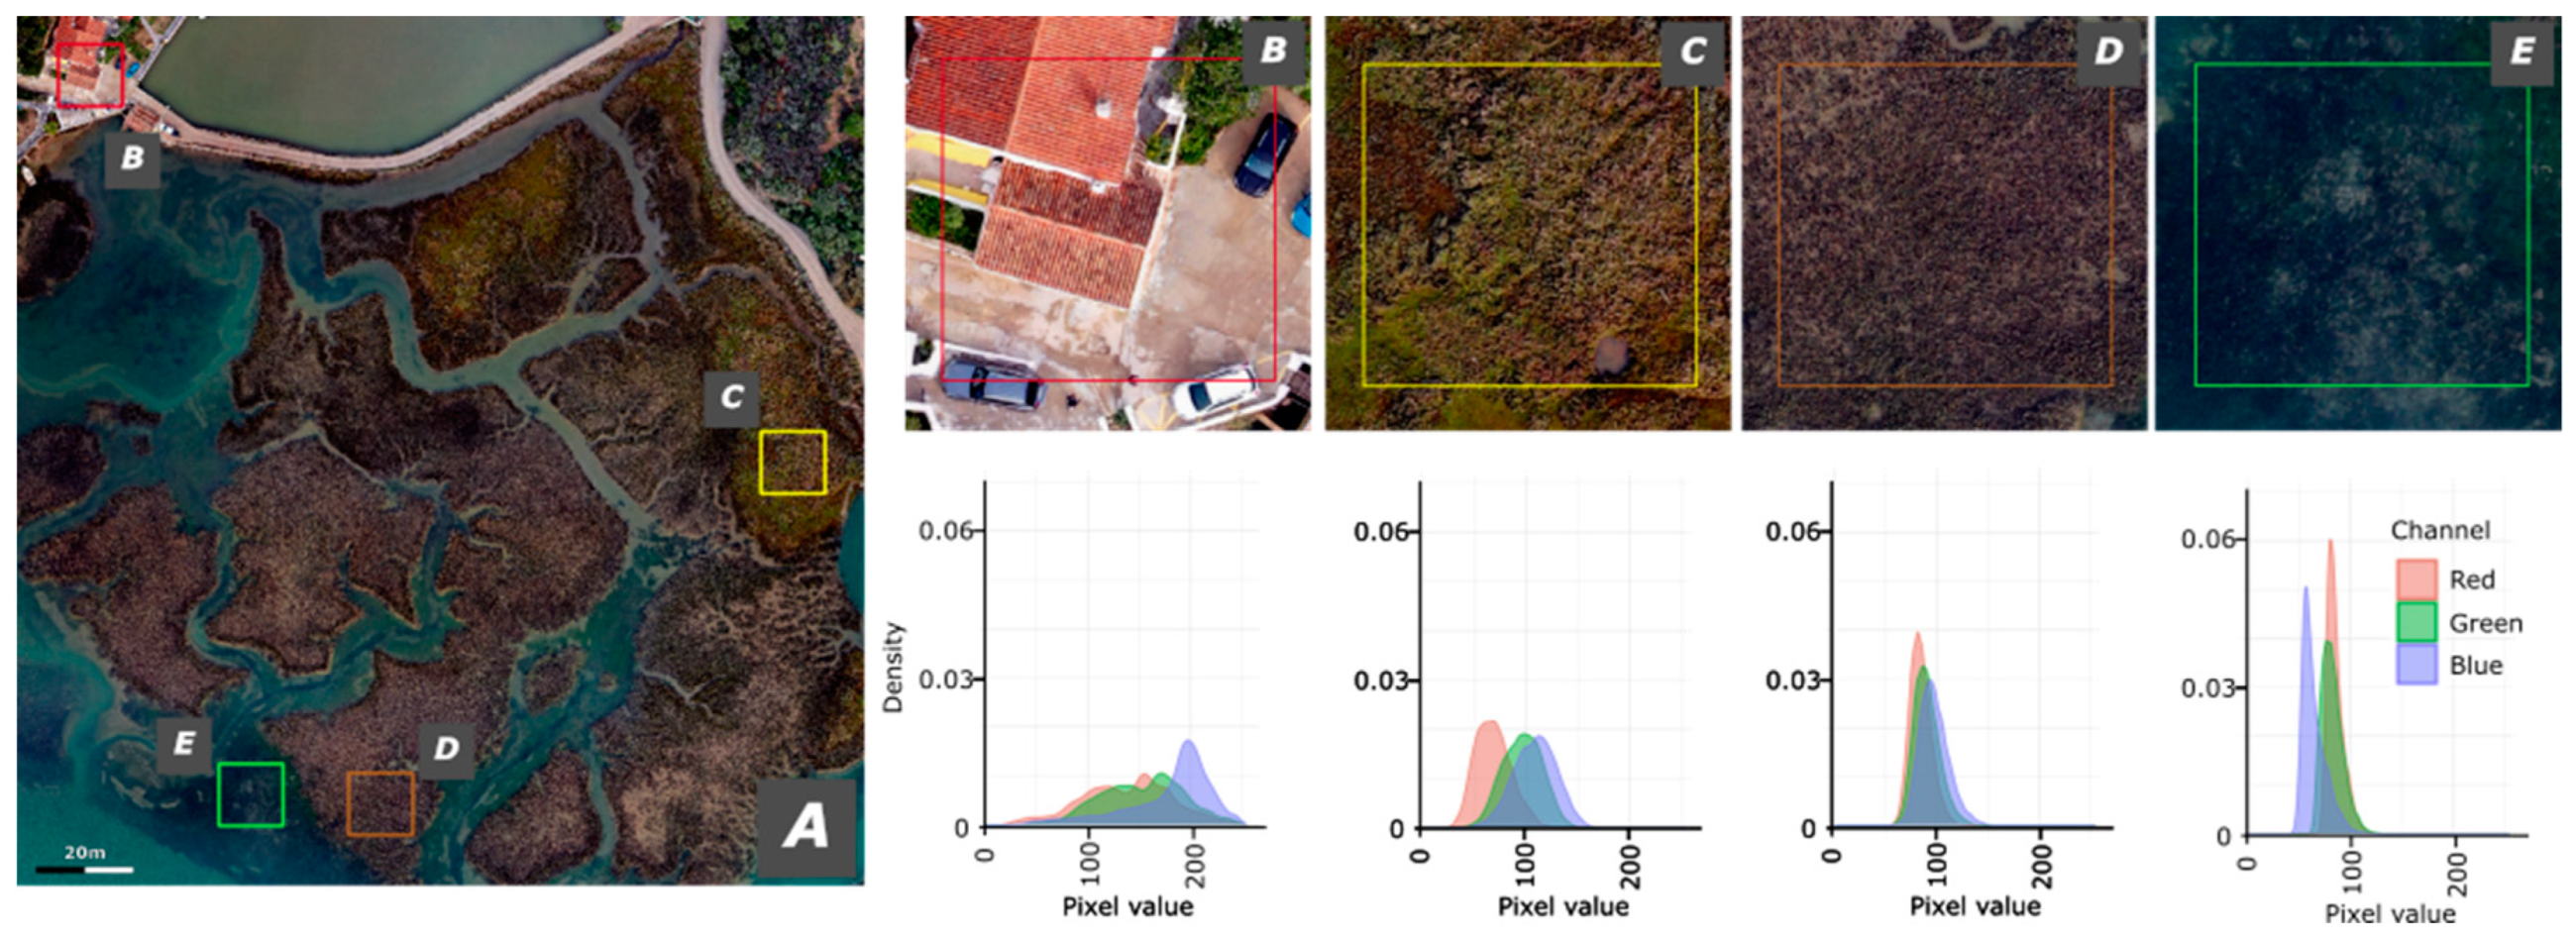
For a better understanding and characterization of the different typologies several field visits were carried. These were always complemented by photographic support of the ecotypes observed. For characterizing the ecotypes and its spectral response the visible (RGB) spectral signature is presented in Figure 4.
The human infrastructures have a more dispersed spectrum in which green and red have two peaks while blue is negatively asymmetric. The land vegetation is almost symmetrical in all the three bands with the Red band presenting the lower pixel values, followed by the Green band and the Blue with the highest values. For the Salt Marsh areas the three bands are almost coincident with a more leptokurtic tendency and peak pixel values between 75 and 100. Z. noltii presents the more pronounced peaks with the Blue band presenting lower pixel values, Green with intermediate values and Red with the higher values.

3.1.2. The 5 Band Spectral Signatures

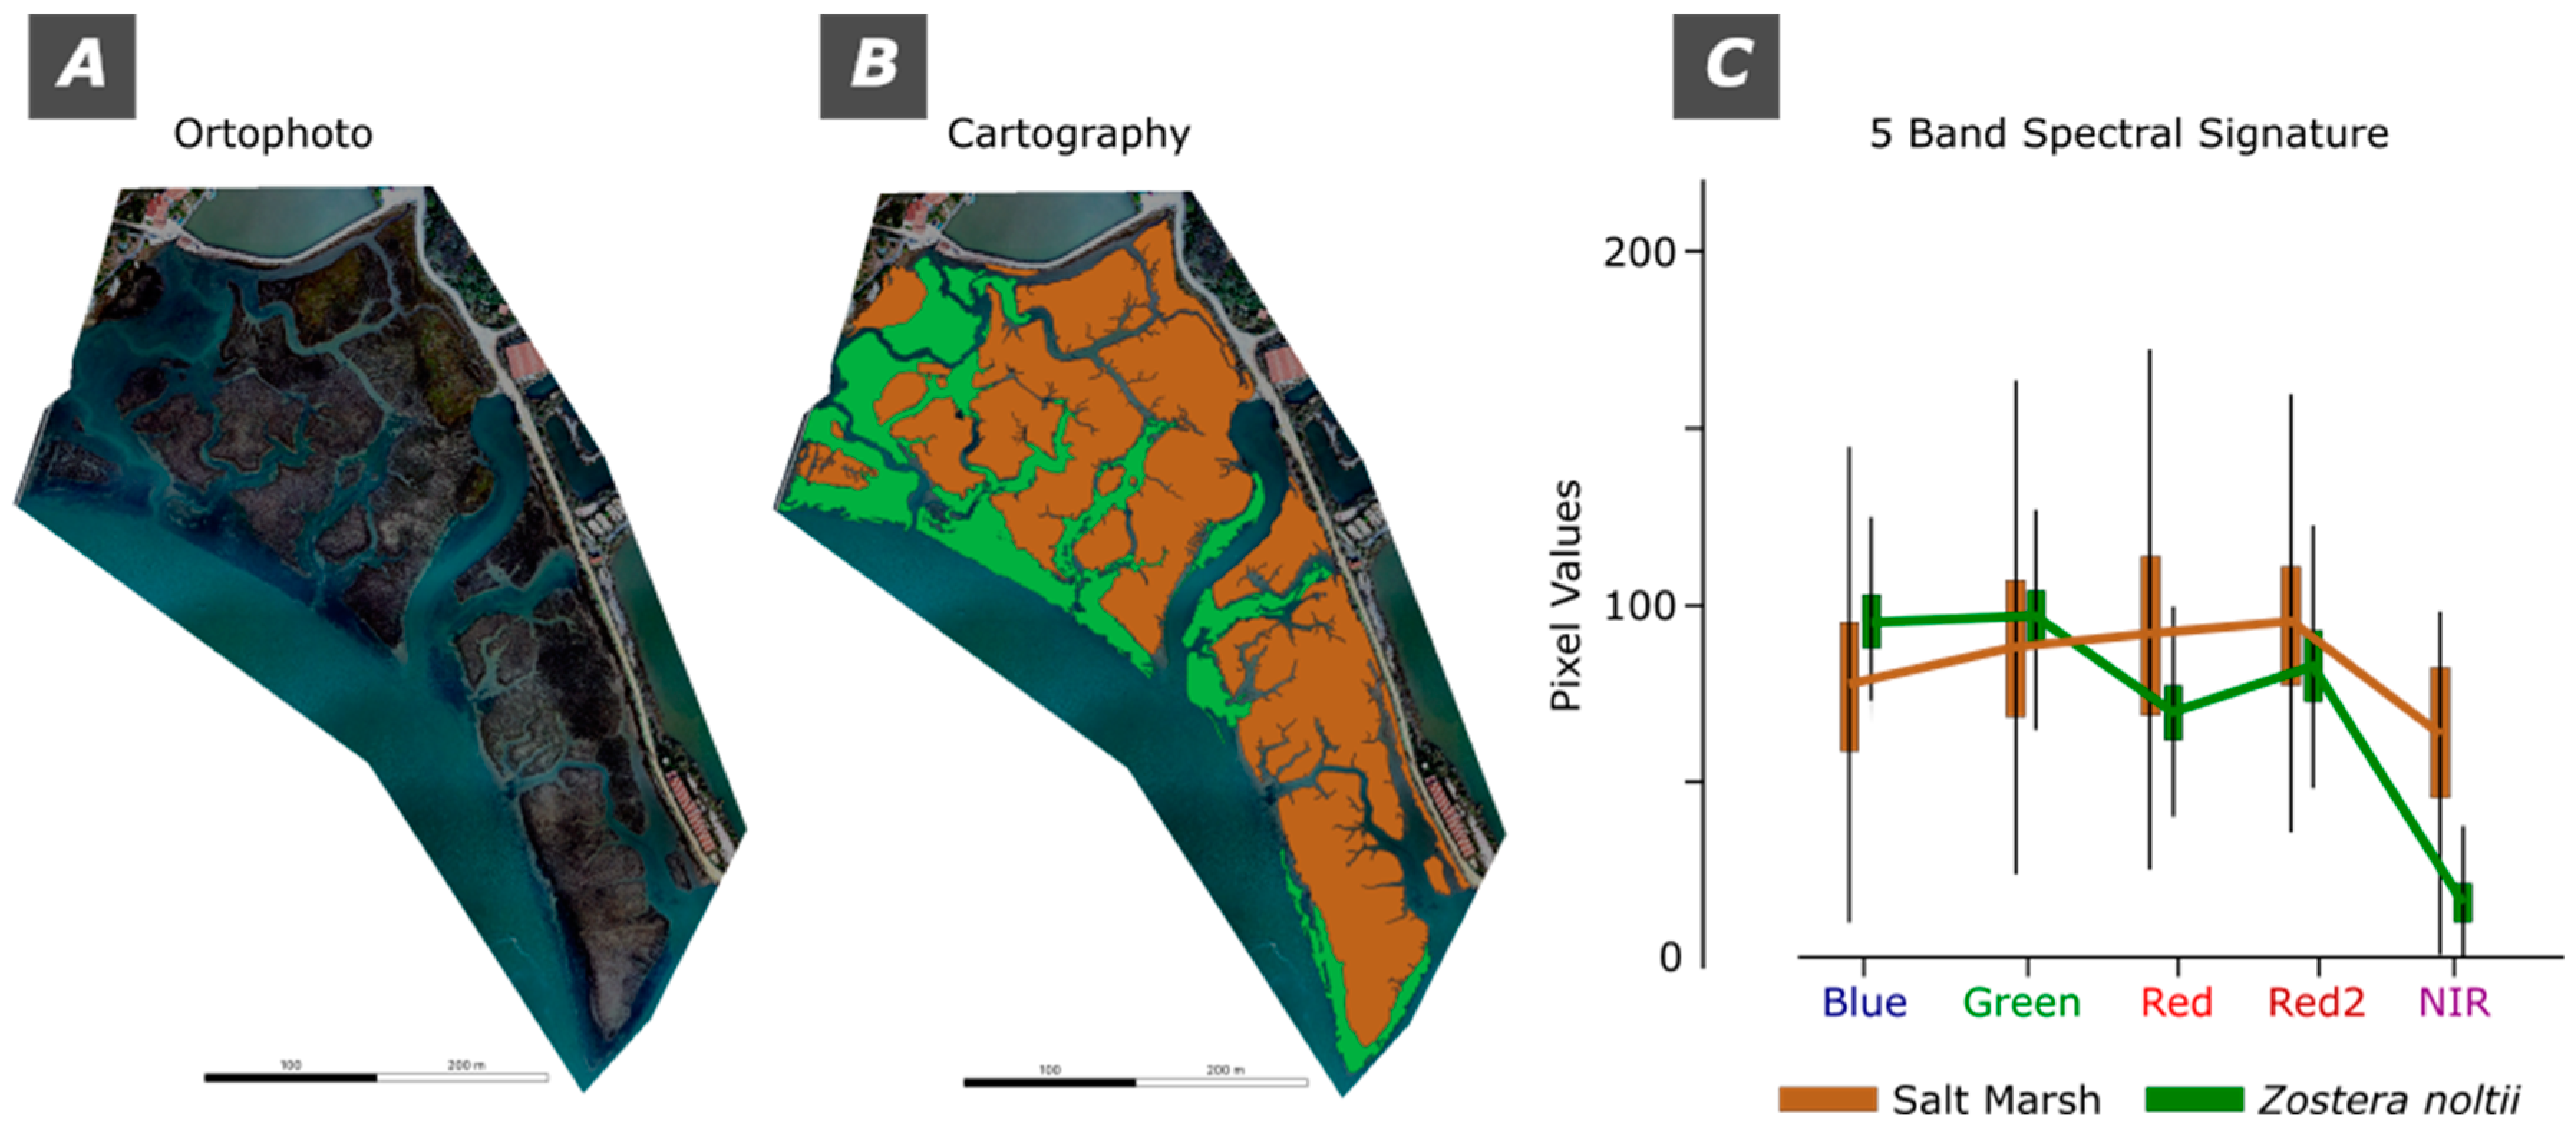
For a more precise study of the Salt Marsh and Z. noltii spectral signature a composition of the 5 bands set was subsetted and the corresponding pixel values are presented as spectral signatures (Figure 5).
The results demonstrate that for the Blue and Green bands the Z. noltii has higher pixel values than the Salt Marshes, whereas for Red, Red2 and NIR bands it is the Salt Marshes that have the higher values. Noteworthy, is also the extremely low values in the NIR region for the Z. noltii.

3.1.3. The Normalized Difference Vegetation Index (NDVI)

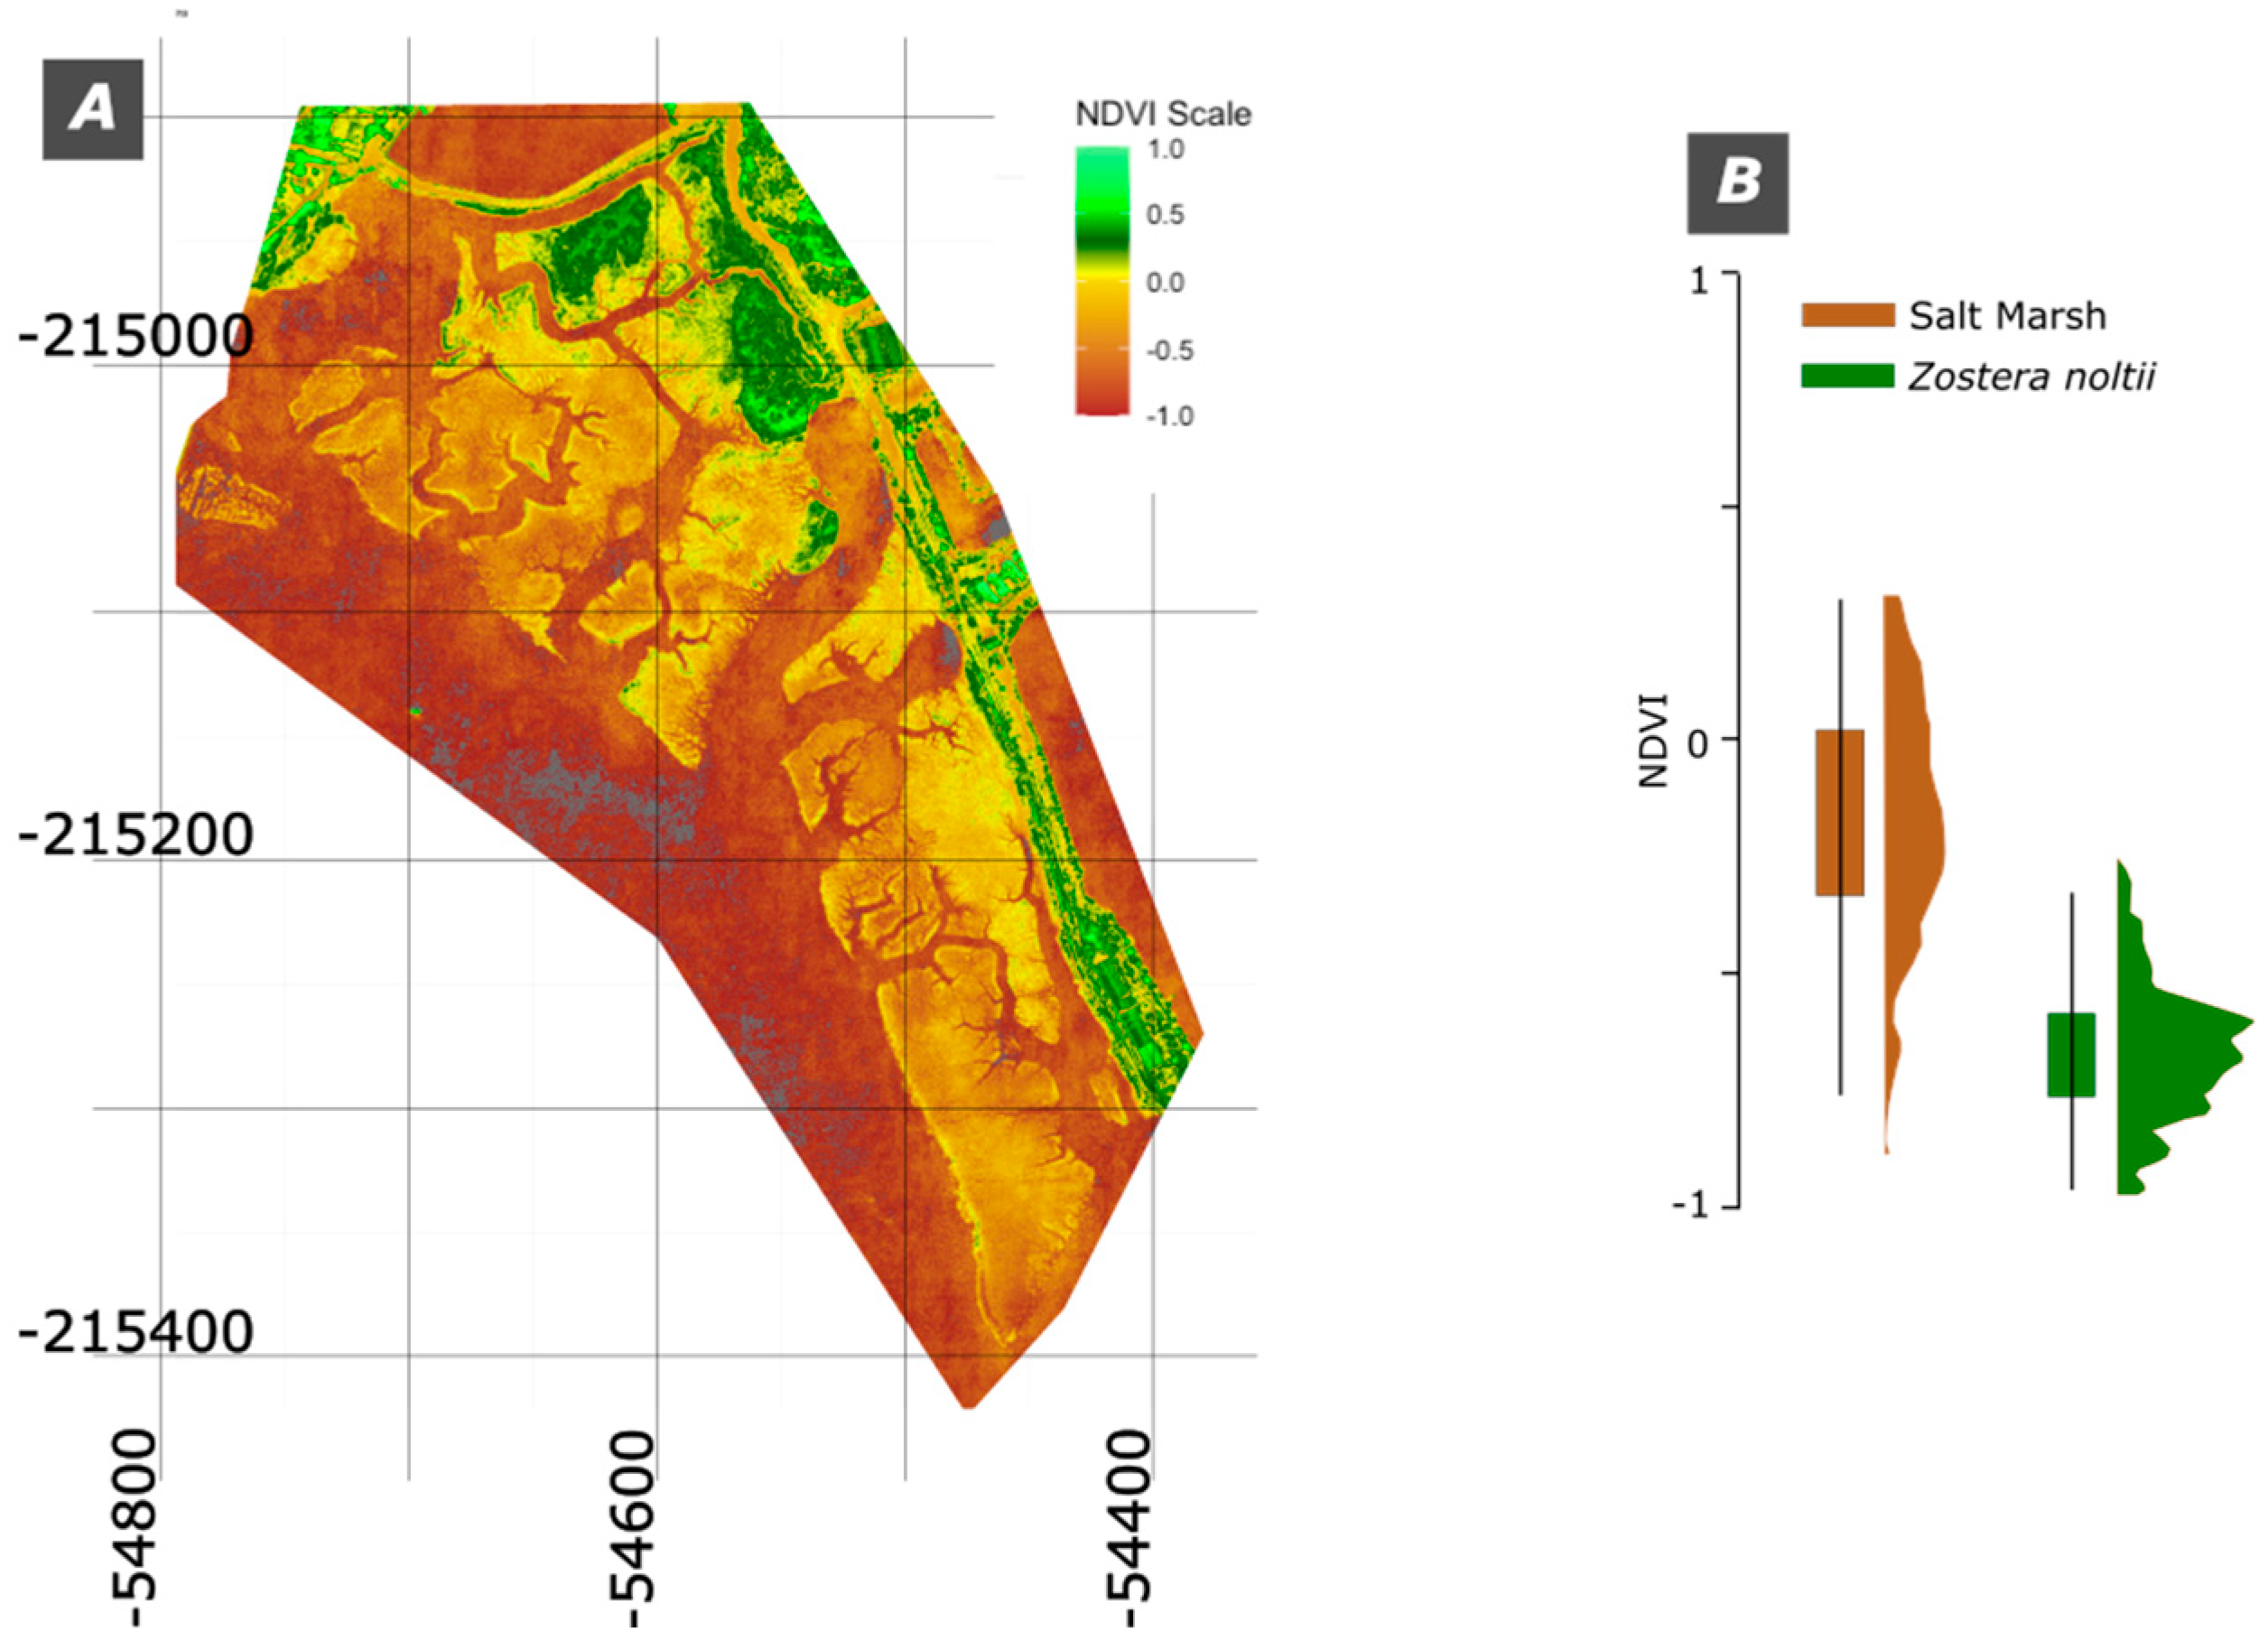
A common way of evaluating the healthiness of the vegetation is to evaluate the NDVI of the images (e.g. [16]). The Normalized Difference Vegetation Index (NDVI) is an indicator of vegetation health, derived from the interaction of vegetation with infrared and red light wavelengths. NDVI values range from -1 to +1, where higher values indicate healthier vegetation, values close to zero correspond to bare soil, and negative values denote water or non-vegetative surfaces.
The results obtained are presented in the map of Figure 6A, showing that the Salt Marsh has a slightly higher spectral signature than the Z. noltii (Figure 6B). The areas with land vegetation are the ones that display the higher values of NDVI. Noteworthy is the fact that the distribution of the values of NDVI from the Salt Marsh have a platykurtic distribution whereas the Z. noltii has a more clustered pattern (Figure 6B). The lower values of Z. noltii are somewhat explained by being partially submersed by water.

3.1.3. Principal Components Analysis (PCA)

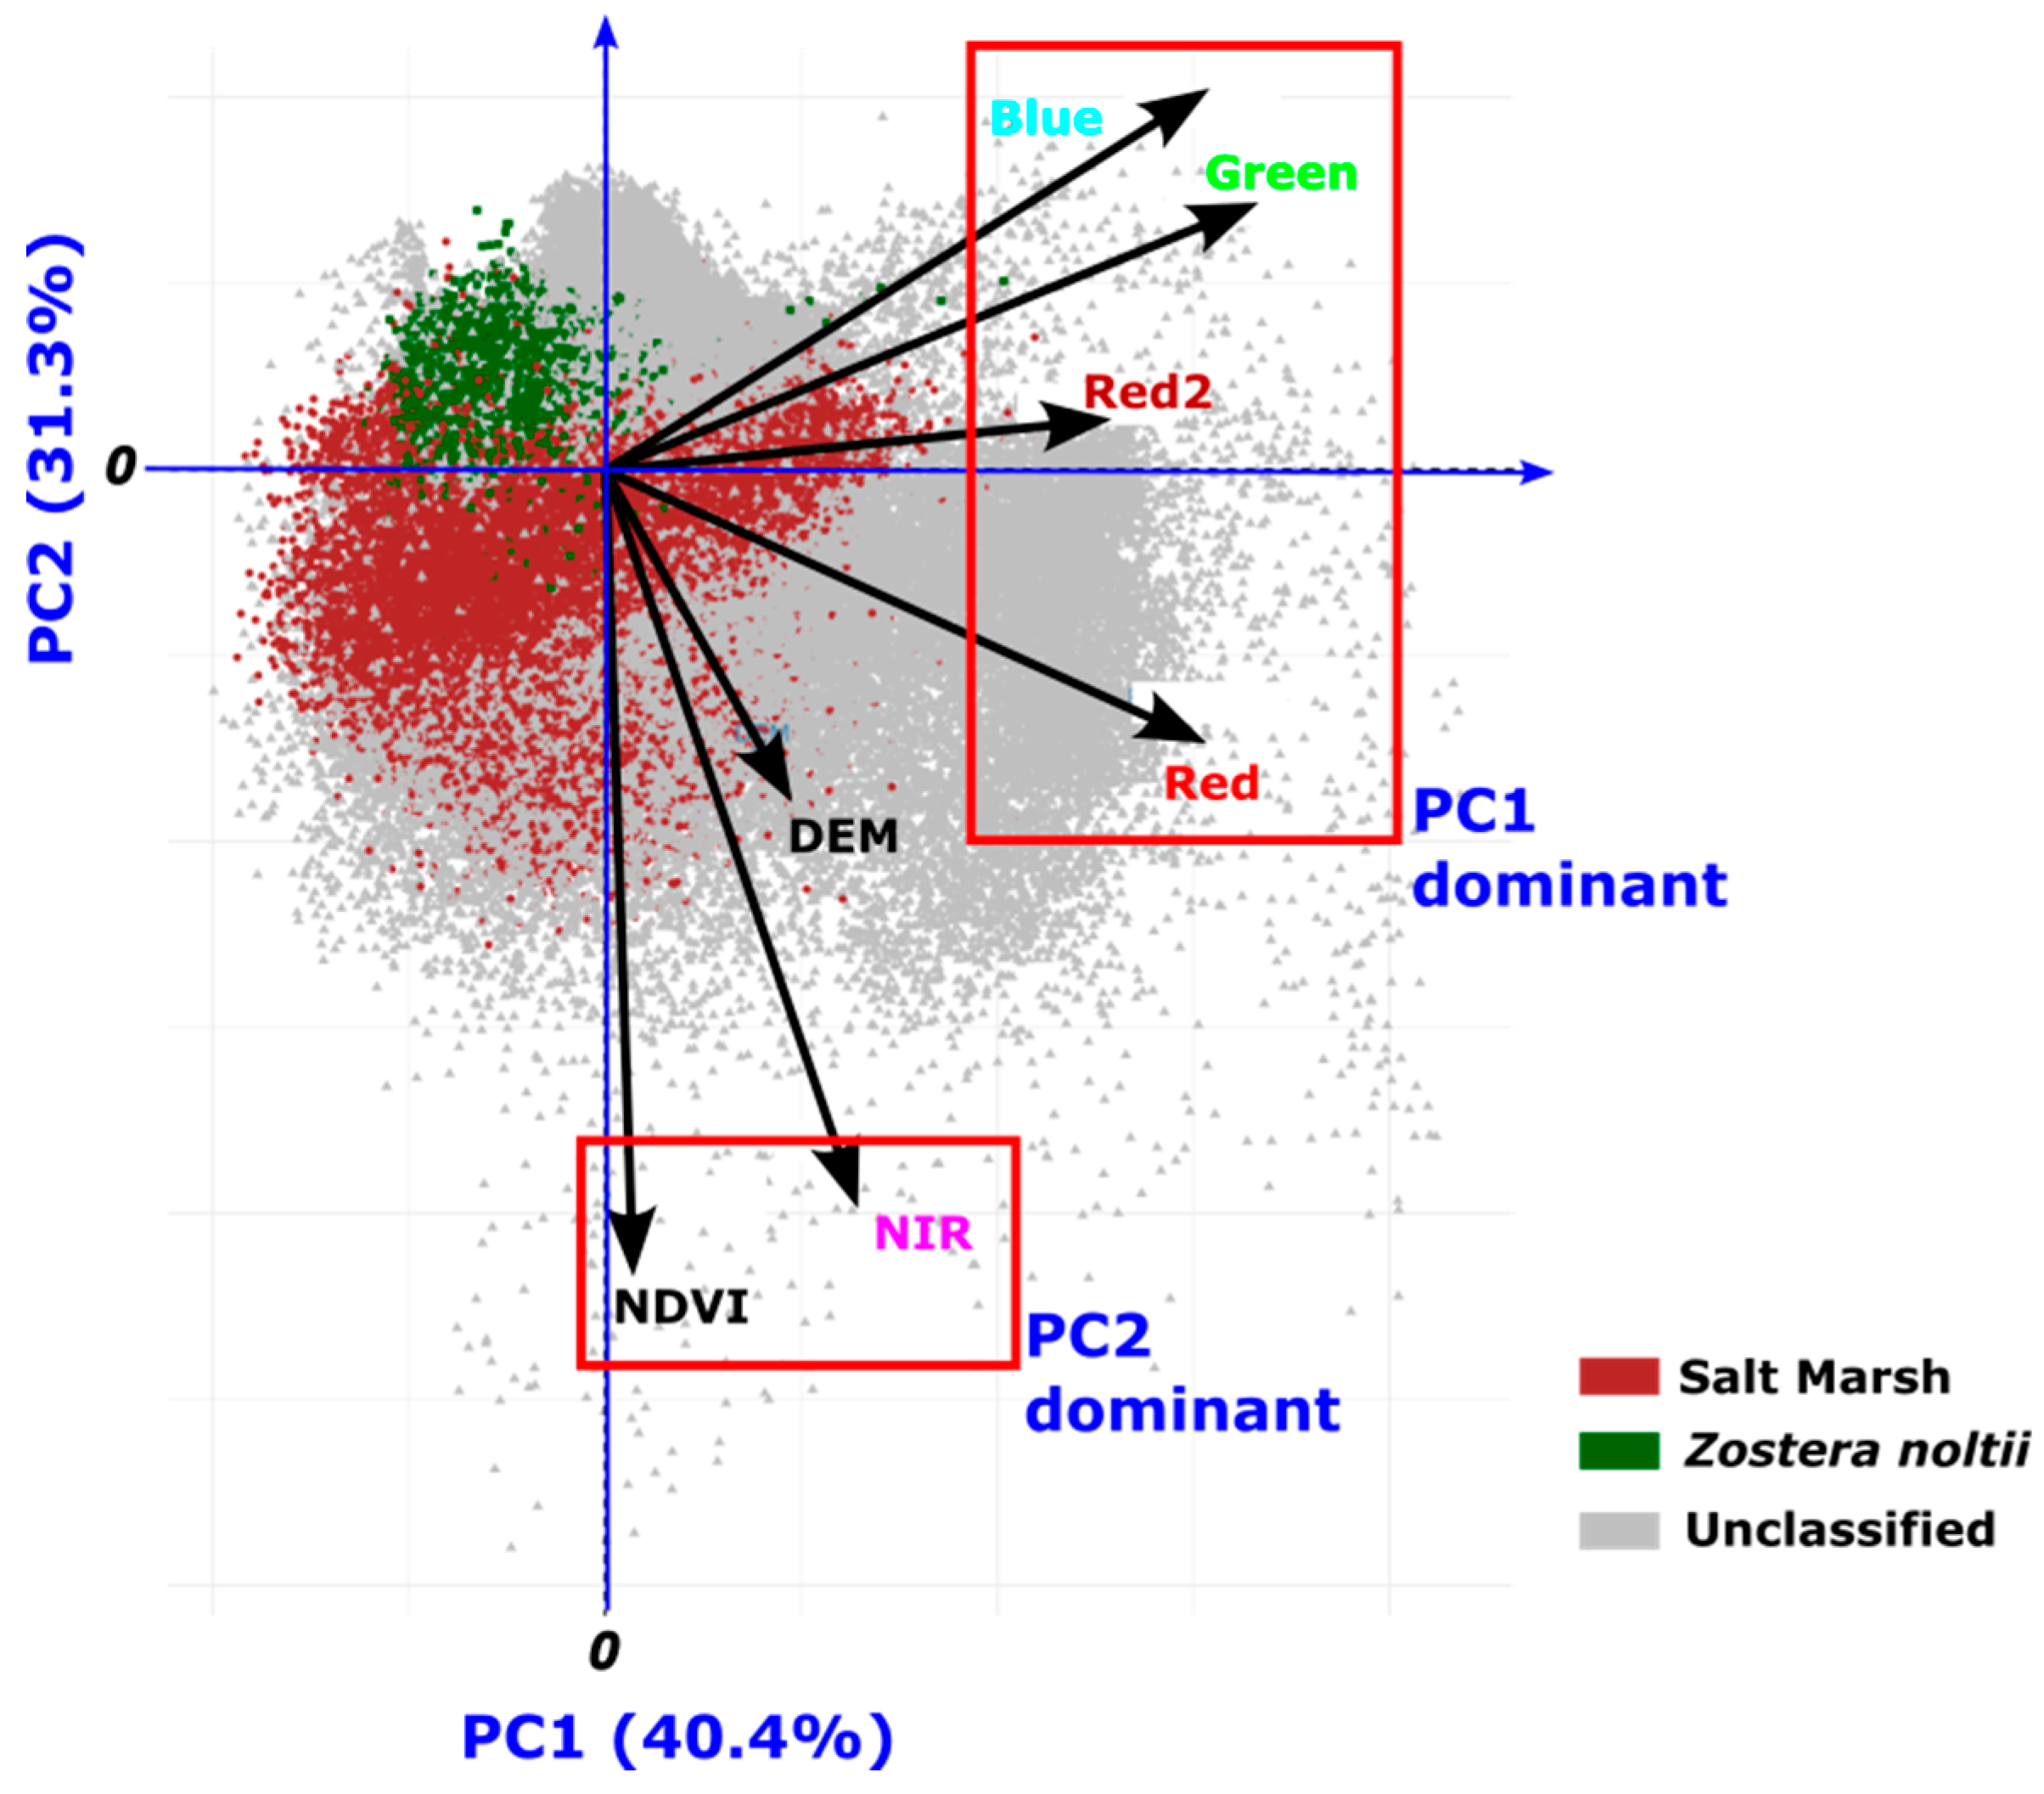
Principal components analysis is a powerful tool for dimension reduction and analysis of the influence of each variable in the overall distribution of the data. For the PCA analysis a matrix combining the multispectral data, i.e. bands Blue, Green, Red, Red and NIR and DEM and NDVI data was created. This matrix was used to calculate the PCA using the “prcomp “function from the R stats package [17]. The results are presented in a biplot in Figure 7. PC1 explains 40.4% of the variance and PC2 31.3% hence a total of 71.7% of the variance is explained by these two components. PC1 is mostly dominated by positive values of the RGB variables, i.e. Blue, Green, Red and Red2, whereas PC2 is dominated by negative values for the NDVI and NIR variables. Curiously the elevation (DEM component) is not dominant in none of these dimensions.
The distribution of the Salt Marsh and Z. noltii observations can be separated majorly by the PC2 Component (c.f. Figure 7 and Figure 8).
For a better visualization of the different components the score values were used to create maps of the PC1 and PC2 components. These maps are useful in visualizing spatial patterns, trends, and clusters in the data after dimensionality reduction (Figure 8). The PC1 maps with high values mainly the roads (see Figure 8A), having water intermediate values and the Salt Marsh and Zostera noltii areas the lower values. Regarding the PC2 map the positive values are mostly water areas whereas the Salt Marsh has the most negative values (Figure 8B). These observations agree with the ones made from the biplot (Figure 7).

3.2. Machine Learning (ML) Approaches

In this section, we explore the use of ML algorithms to map and classify Salt Marsh and Z. noltii habitats using the multispectral drone imagery. Leveraging the strengths of unsupervised and supervised learning, we employ K-Means clustering and Random Forest classification to analyze complex spectral data and identify distinct vegetation types. K-means clustering, an unsupervised algorithm, helps in identifying natural clusters within the multispectral data, enabling preliminary separation of the different regions. Following this, the Random Forest classifier—a robust supervised learning technique—is used to refine the classification, distinguishing between Salt Marsh and Z. noltii with high accuracy. By combining these approaches, we aim to provide an efficient and accurate methodology for habitat mapping, supporting the ecological monitoring and conservation efforts.

3.2.1. K-Means Classification and Maps

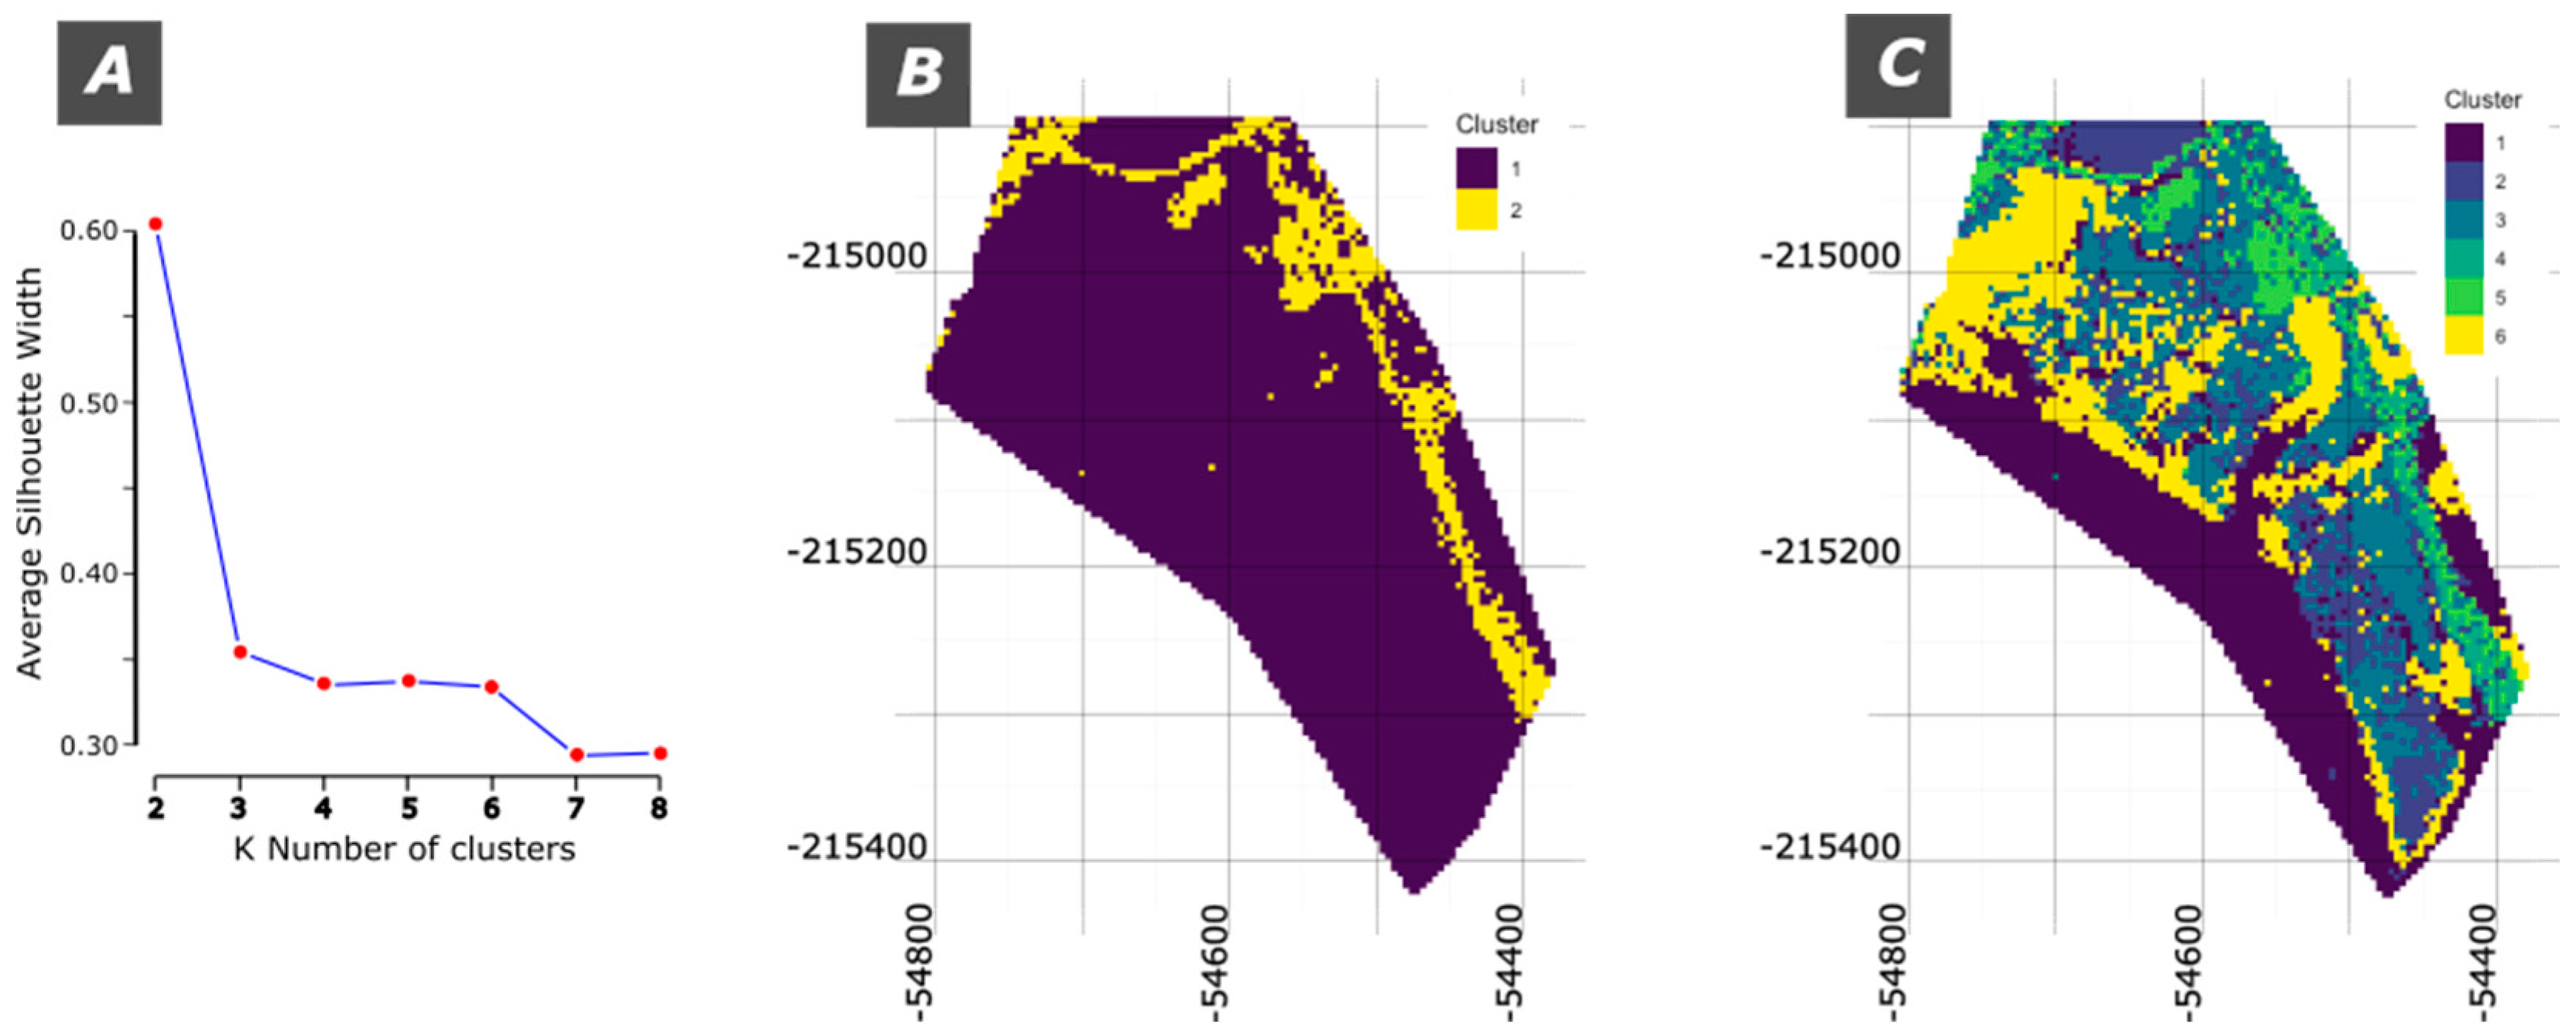
For the K-Means classification a stratified sample of all the pixels was considered containing 250000 pixels. For evaluating the quality of the results, the silhouette average width (SAW) is considered. It is calculated by averaging the silhouette scores of all data points, where each score measures how similar a point is to its own cluster compared to others.
Figure 8A displays the values for SAW from 2 to 8 k clusters. It is noticeable that k=2 clusters is the best performing value (c.f. Figure 9B). For k between 3 and 6 clusters the values do not change much corresponding to a plateau. The lower silhouette scores in these configurations suggest that these cluster structures are not as reliable for distinguishing between different types or spectral characteristics.
For demonstration purposes the maps of k = 2 and k = 6 are shown in Figure 9B and C, respectively.
The map with k=2, i.e. with 2 clusters (Figure 9A) identifies most of the area as cluster 1, that includes water and all the ecotypes. The cluster 2 corresponds mainly to the road or bare soil.
The map with k = 6 is more complex but several terrain characteristics can be identified: i) cluster 1 is primarily water; ii) cluster 3 is mostly Salt Marsh; iii) cluster 4 is mostly the road; iv) cluster 6 is predominantly Z. noltii. Clusters 2 and 5 mix several terrain characteristics.
Correspondence tables were created to evaluate the number of pixels that fall in each category. Table 1 presents the correspondence table for a classification considering 2 clusters, where the clusters attributed to each pixel are compared with its ecotype classification.
As previously verified Cluster 1 mixes the main categories whereas cluster 2 mostly corresponds to unclassified (road in the case) area.
Table 2 presents the pixels classification for a 6-clustering classification. This table confirms the previously presented results from the 6-cluster map (Figure 9C). The highlighted values in the table correspond to the best classification for the classified ecotypes.

3.2.2. Random Forest Classification and Maps

Random Forest (RF) leverages spectral differences in the multispectral imagery to classify pixels effectively. It can handle complex, non-linear relationships making it ideal for distinguishing the ecotypes based on subtle spectral patterns, resulting in accurate, reliable maps.
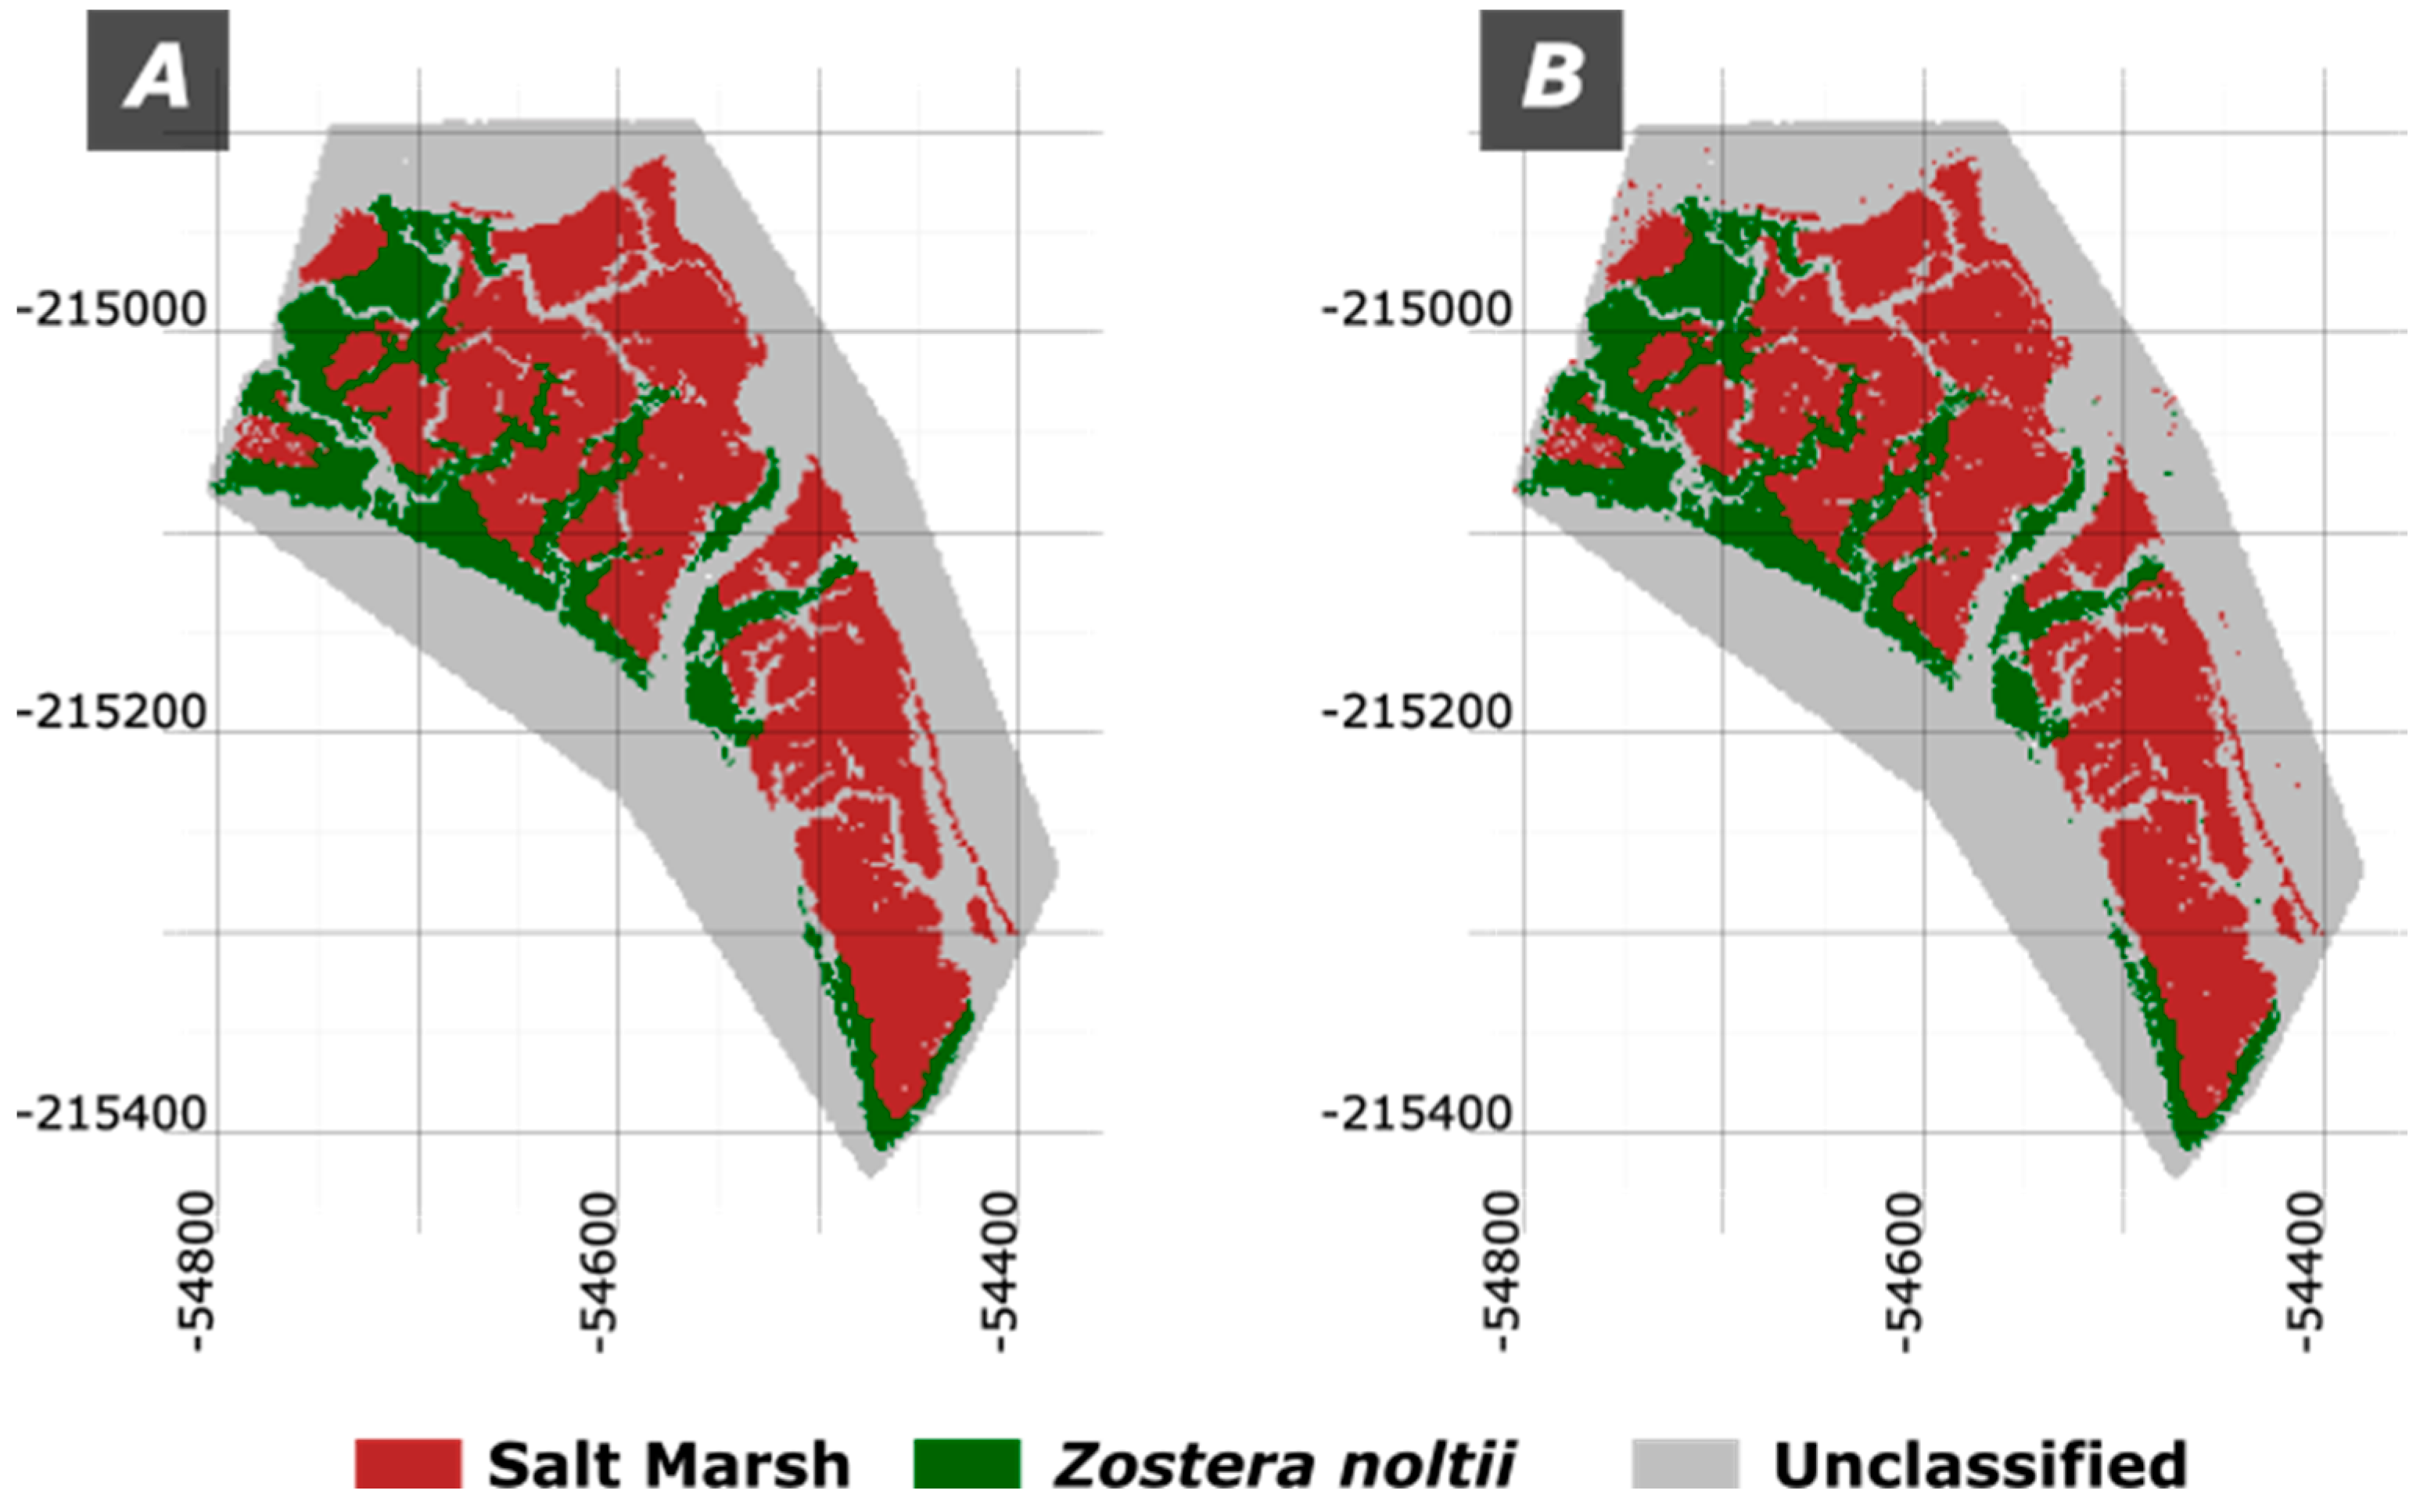
For evaluating the performance of RF for classifying a stratified subset containing 250000 pixels was created. This subset was further divided in 70% of the data for training the model and 30% for testing.
The results obtained (Figure 10) are quite impressive with an overall accuracy of 94.41%, and a kappa value of 0.9145, revealing an almost perfect match between the defined ecotypes (Figure 10A) and the classified by the RF model (Figure 10B).
For further evaluating the results, the confusion matrix is presented in Table 3.
The diagonal values represent the number of correctly classified instances for each class, indicating that a significant proportion of Salt Marsh, Zostera noltii and Unclassified category pixels were accurately identified by the model. However, the matrix also reveals some misclassifications: 828 Salt Marsh pixels were categorized as unclassified, while 230 were incorrectly labeled as Z. noltii. Similarly, for the Unclassified group, 1332 pixels were misclassified as Salt Marsh, and 716 as Z. noltii. For Z. noltii, 168 pixels were incorrectly identified as Salt Marsh, and 921 as unclassified.

4. Discussion

The visible light signatures obtained for different landscape typologies in the Moinho da Asneira area reveal distinct patterns that allow for effective differentiation between ecotypes and other land use cases, such as human infrastructure. The dispersed spectral signature of human infrastructure, with dual peaks in the Red and Green bands and an asymmetric Blue distribution, likely reflects the diversity of materials (such as bare soil, roof tiles, and metals) that interact with light differently. This varied response complicates the classification but also serves as a unique indicator, distinguishing human-made areas from natural landscapes. In contrast, the symmetrical distribution of RGB bands in land vegetation, where Blue has the highest values, Green is intermediate, and Red is lowest, aligns with expected photosynthetic activity. This pattern is characteristic of healthy vegetation and aids in separating vegetated land areas from other ecotypes. The similar spectral response across the RGB bands in Salt Marsh areas, combined with a leptokurtic peak between pixel values of 75 and 100, suggests a homogenous spectral signature that may be associated with the specific vegetation or soil characteristics unique to Salt Marsh ecosystems.
The distinct spectral signature observed for Z. noltii areas, characterized by pronounced peaks in all three bands, especially in the Red band, provides a valuable basis for its identification in multispectral analyses. The lower pixel values in the Blue band and higher values in the Red band indicate a unique spectral response that differentiates Z. noltii from other vegetative types, likely due to its specific pigmentation and structural properties.
This characteristic pattern supports the use of RGB spectral signatures for ecological mapping and suggests that multispectral imaging, combined with field validation, can effectively differentiate ecotypes.
The five-band spectral signatures for Salt Marsh and Z. noltii reveal significant differences in their reflectance patterns across the visible and near-infrared (NIR) spectrum, as illustrated in Figure 5. Zostera noltii exhibits higher pixel values in the Blue and Green bands compared to Salt Marsh areas, suggesting a stronger reflectance in these regions, potentially due to its unique leaf structure or pigmentation, which reflects more light in these wavelengths. Conversely, Salt Marshes have higher reflectance in the Red, Red2, and NIR bands, indicating different physiological or structural properties, such as higher chlorophyll content or soil background influence. The notably low values in the NIR band for Z. noltii are especially significant, as they likely reflect lower biomass or distinctive water content absorption characteristics, making NIR an effective band for differentiating it from Salt Marsh vegetation.
One must consider the Zostera noltii’s unique environment—partly submerged underwater—impacts its reflectance values, particularly in the Red and Red2 bands. As light penetrates water, longer wavelengths like red and near-infrared (NIR) are absorbed more readily, leading to significantly lower pixel values in these bands for submerged vegetation compared to vegetation exposed to air, such as Salt Marshes. This water absorption effect reduces the reflectance in the Red and NIR bands, resulting in notably lower values, which contrast with the higher reflectance observed in Salt Marsh vegetation in the same bands. Consequently, the lower Red, Red2 and NIR values for Z. noltii serve as important spectral markers that differentiate it from terrestrial vegetation, emphasizing the need to account for water presence when interpreting spectral signatures.
The NDVI results for Salt Marsh and Z. noltii in the Moinho da Asneira area align with existing literature that underscores NDVI’s value in assessing vegetation health and biomass. Salt Marsh areas demonstrated slightly higher NDVI values than Z. noltii, which corresponds with findings by [2,12,18,19], who observed that partial submersion tends to reflect lower values in the NIR spectrum compared to fully terrestrial vegetation.
The NDVI’s sensitivity to NIR reflectance makes it especially suited for assessing above-ground biomass in vegetated landscapes, as confirmed by [2,18] who used NDVI to monitor seasonal changes and vegetation dynamics in intertidal areas. In our results, the platykurtic distribution of NDVI values in Salt Marsh areas indicates a broader spread of health and density variations, while the more clustered distribution for Z. noltii suggests uniformity, potentially due to the homogeneity of the seagrass beds in submerged environments [20].
The lower NDVI values for Z. noltii can be attributed to its partial submersion, which absorbs NIR radiation, thereby reducing NDVI values. Benmokhtar [21] noted similar limitations when using NDVI to estimate biomass in submerged vegetation, as water presence can interfere with accurate NIR readings. Despite these challenges, NDVI remains a valuable tool for remote monitoring of submerged ecosystems. Studies like [18,21] have demonstrated that NDVI can help distinguish sparse from dense Z. noltii beds, facilitating habitat classification even under challenging coastal conditions.
The Principal Component Analysis (PCA) delivers an approach for characterizing Z. noltii by identifying and isolating key spectral and environmental factors that differentiate it from other vegetation types. Seagrass beds of Z. noltii studies have shown that the species’ spectral response can be influenced by factors such as water coverage, sediment type, and seasonal variations, which affect reflectance in visible and near-infrared wavelengths [21,22].
The PCA results reveal meaningful patterns that assist in the separation of the landscape features based on their spectral and environmental characteristics. PC1, which explains 40.4% of the variance, is primarily influenced by the RGB bands (Blue, Green, Red, and Red2), capturing the variation in visible light reflectance. High values of PC1 mainly correspond to non-vegetative surfaces, such as roads, which typically exhibit high reflectance in the visible spectrum, while lower PC1 values are associated with vegetated or water-covered areas. This distribution highlights the effectiveness of PC1 in differentiating artificial from natural landscapes, where vegetative areas and water, with their lower visible reflectance, are clearly distinguishable from man-made surfaces.
The PC2, explains an additional 31.3% of the variance, it is heavily influenced by negative values of NDVI and NIR bands, which are essential for identifying vegetation health and density. Notably, both ecotypes are separated along this axis, with Salt Marsh showing more negative PC2 values, indicative of its distinct spectral response in the NIR band due to dense biomass and soil exposure. Zostera noltii, partly submerged, exhibits a different NDVI and NIR response due to water absorption, resulting in higher PC2 values.
The K-Means results can be evaluated using the silhouette average width (SAW). The analysis across different values of k (from 2 to 8) suggests that k = 2 yields the highest silhouette score, indicating the most cohesive and well-separated clusters. At this level, the classification primarily divides the landscape into two broad categories: one encompassing water, vegetation, and mixed ecotypes, and another that mainly identifies roads or bare soil. This broad classification, however, does not provide fine detail on specific ecotypes, as many of them, including Salt Marsh and Z. noltii, fall into the same cluster. The limitation here lies in the inability of k = 2 to resolve subtle spectral differences between ecotypes, making it effective for general differentiation but inadequate for detailed ecological mapping in this case.
Increasing the number of clusters to k = 6 introduces a more nuanced representation, where specific terrain features become more identifiable. In this configuration, the map successfully isolates individual characteristics such as water, Salt Marsh (partly), roads, and Z. noltii (partly), with other clusters capturing mixed terrain features.
The correspondence table for k = 6 further confirms this enhanced classification, as it shows a clearer alignment between clusters and ecotypes. Although the silhouette scores are lower at k = 6, indicating reduced clustering cohesion, this configuration provides a more ecologically meaningful classification that aligns better with the observed landscape characteristics. This balance between accuracy and interpretability highlights the effectiveness of k-means clustering in distinguishing complex ecological patterns when appropriate cluster numbers are chosen, making k = 6 a suitable choice for more detailed habitat mapping.
The RF classification results demonstrate a high level of accuracy in distinguishing between Salt Marsh, Z. noltii, and unclassified areas, with an overall accuracy of 94.41% and a kappa value of 0.9145. This strong performance is indicative of Random Forest’s capability to handle complex, non-linear relationships in multispectral data, enabling precise classification based on subtle spectral differences between ecotypes. The high kappa value suggests that the model’s classifications align closely with the actual ecotypes, supporting its reliability for habitat mapping.
When compared to similar studies, such as [21], who utilized RF combined with SPOT 7 satellite imagery to map Zostera noltii with 95% accuracy, these results affirm RF’s suitability for seagrass classification even in high-resolution drone imagery, where spectral variability may be higher due to local environmental factors.
The RF model’s ability to correctly classify the majority of Salt Marsh and Z. noltii pixels suggests that it effectively captures their unique spectral signatures, aligning with [23], who noted that seasonal and sediment-induced spectral variations in Zostera noltii can be distinguished with high accuracy using vegetation indices and Machine Learning.
Despite its high accuracy, the confusion matrix reveals some misclassifications, particularly between Salt Marsh and unclassified areas, as well as between Zostera noltii and unclassified pixels. These errors may stem from spectral overlap between ecotypes and non-vegetative features or due to water absorption effects on NIR reflectance, which can reduce the spectral distinction for submerged or partially submerged Zostera noltii, as discussed by [18]. Furthermore, environmental factors such as substrate type and sediment brightness, as identified by [22,24], could contribute to misclassification between vegetative and bare soil areas, as these factors alter the spectral reflectance in the visible bands.

5. Conclusions

This study validates the utility of drone-based multispectral imaging as a high-resolution, efficient approach for mapping and monitoring vegetated estuarine habitats. The spectral data collected by the drones enable effective differentiation of ecotypes, with distinct RGB signatures serving as reliable indicators of habitat types such as Salt Marsh and Zostera noltii. The ability to distinguish these landscape features using relatively simple imaging techniques highlights the drone’s potential as a scalable solution for habitat mapping, and other ecological management activities. Furthermore, combining drone spectral data with field observations enhances the accuracy and depth of analysis, allowing for a more comprehensive understanding of complex coastal ecosystems. This integration of field-based and Remote Sensing methods supports the development of more precise and practical tools.
The Principal Component Analysis (PCA) refines this methodology by identifying and isolating critical spectral signatures, which simplify the classification process and focus attention on the most informative spectral differences between ecotypes. Mapping the principal component scores spatially provides a clearer visualization of these distinctions, offering a structured approach to identifying meaningful patterns within the landscape. The PCA results confirm that even subtle spectral characteristics can be leveraged to improve habitat classification, especially in environments where water presence and mixed substrates can complicate spectral signatures.
The proposed analysis also ascertains the value NDVI as a robust, scalable indicator for monitoring coastal vegetation habitats and capture the health status and density. It provides a straightforward measure of vegetation vitality, distinguishing densely vegetated areas from sparsely vegetated or submerged regions. This capacity to monitor vegetation health makes NDVI particularly valuable for long-term ecosystem management, allowing for consistent tracking of habitat conditions over time. When combined with other spectral indices or enhanced imaging techniques to mitigate water-related signal interference, NDVI proves to be a reliable tool for monitoring and managing estuarine vegetation.
Finally, the application of Machine Learning techniques adds a powerful dimension to this methodology. The K-means clustering, as an unsupervised approach, provides reasonable initial results for mapping ecotypes and is especially useful when labeled data is limited. However, the supervised Random Forest (RF) model exhibits a remarkable performance, achieving an overall accuracy of 94.41% and a Kappa value of 0.9145, indicating an almost perfect match between classified ecotypes and ground truth data.
The RF model’s reliability and accuracy make it a powerful tool for detailed habitat mapping in coastal and intertidal zones, supporting precise conservation and monitoring efforts. Collectively, these results underscore the effectiveness of integrating drone imaging, spectral analysis, and machine learning to create a high-performance tool for mapping estuarine habitats.

Author Contributions

Conceptualization, P.N. and H.A.; methodology, P.N. and H.A..; software, P.N.; validation, P.N., H.A., M.S. and M.Q.; data curation, P.N., M.S. and M.Q.; writing—original draft preparation, P.N.; writing—review and editing, P.N. and H.A. All authors have read and agreed to the published version of the manuscript.

Funding

This work is supported by national funding awarded by FCT—Foundation for Science and Technology, I.P., projects UIDB/04683/2020 (DOI: 10.54499/UIDB/04683/2020) and UIDP/04683/2020 (DOI: 10.54499/UIDP/04683/2020).

Data Availability Statement

The data is available upon request.

Acknowledgments

The authors acknowledge the invaluable collaboration of José Roseiro in some of the drone flights.

Conflicts of Interest

The authors declare no conflicts of interest.

References

  1. Unsworth, R.; Cullen-Unsworth, L.; Jones, B.; Lilley, R. The planetary role of seagrass conservation. Science 2022, 377, 609–613. [Google Scholar] [CrossRef] [PubMed]
  2. Pham, T.D.; Xia, J.; Ha, N.T.; Bui, D.T.; Le, N.N.; Tekeuchi, W. A Review of Remote Sensing Approaches for Monitoring Blue Carbon Ecosystems: Mangroves, Seagrassesand Salt Marshes during 2010–2018. Sensors 2019, 19, 1933. [Google Scholar] [CrossRef] [PubMed]
  3. Bos, A.; Bouma, T.; de Kort, G.; van Katwijk, M. Ecosystem engineering by annual intertidal seagrass beds: sediment accretion and modification. Estuar. Coast. Shelf Sci. 2007, 74, 344e348. [Google Scholar] [CrossRef]
  4. Fu, C.; Frappi, S.; Havlik, M. N.; Howe, W.; Harris, S. D.; Laiolo, E.; Duarte, C. M. Substantial blue carbon sequestration in the world’s largest seagrass meadow. Commun Earth Environ. 2023, 4, 474. [Google Scholar] [CrossRef]
  5. Branco, J.; Pedro, S.; Alves, A. S.; Ribeiro, C.; Materatski, P.; Pires, R.; Caçador, I.; Adão, H. Natural recovery of Zostera noltii seagrass beds and benthic nematode assemblage responses to physical disturbance caused by traditional harvesting activities. Journal of Experimental Marine Biology and Ecology. 2023, 502, 191–202. [Google Scholar] [CrossRef]
  6. Materatski, P.; Vafeiadou, A.M.; Ribeiro, R.; Moens, T.; Adão, H. A comparative analysis of benthic nematode assemblages from Zostera noltii beds before and after a major vegetation collapse. Estuar. Coast. Shelf Sci. 2015, 167, 256–268. [Google Scholar] [CrossRef]
  7. Duarte, B.; Matos, A.R.; Pedro, S.; Marques, J.C.; Adão, H.; Caçador, I. Dwarf eelgrass (Zostera noltii) leaf fatty acid profile during a natural restoration process: Physiological and ecological implications. Ecological Indicators. 2019, 106, 105452. [Google Scholar] [CrossRef]
  8. Chand, S.; Bollard, B. Detecting the Spatial Variability of Seagrass Meadows and Their Consequences on Associated Macrofauna Benthic Activity Using Novel Drone Technology. Remote Sens. 2022, 14, 160. [Google Scholar] [CrossRef]
  9. Monteiro, J. G.; Jiménez, J. L.; Gizzi, F.; Přikryl, P.; Lefcheck, J. S.; Santos, R. S.; Canning-Clode, J. Novel approach to enhance coastal habitat and biotope mapping with drone aerial imagery analysis. Scientific Reports 2021, 11. [Google Scholar] [CrossRef]
  10. Hamad, I.Y.; Staehr, P.A.U.; Rasmussen, M.B.; Sheikh, M. Drone-Based Characterization of Seagrass Habitats in the Tropical Waters of Zanzibar. Remote Sens. 2022, 14, 680. [Google Scholar] [CrossRef]
  11. Ha, N.T.; et al. A comparative assessment of ensemble-based machine learning and maximum likelihood methods for mapping seagrass using sentinel-2 imagery in tauranga harbor, new zealand. Remote Sensing 2020, 12, 355. [Google Scholar] [CrossRef]
  12. Traganos, D.; Aggarwal, B.; Poursanidis, D.; Topouzelis, K.; Chrysoulakis, N.; Reinartz, P. Towards Global-Scale Seagrass Mapping and Monitoring Using Sentinel-2 on Google Earth Engine: The Case Study of the Aegean and Ionian Seas. Remote Sens. 2018, 10, 1227. [Google Scholar] [CrossRef]
  13. Dekker, A. G.; Brando, V. E.; Anstee, J.; Fyfe, S. K.; Malthus, T. J. and Karpouzli, E. Remote sensing of seagrass ecosystems: use of spaceborne and airborne sensor. Seagrasses: Biology, Ecologyand Conservation, 2006, p. 347-359. [CrossRef]
  14. 4020-2983-7_15Yang, Z.; Bani, L.; Bordogna, G.; Zoffoli, M.L. "Assessing the fractional abundance of highly mixed salt-marsh vegetation using random forest soft classification." *Remote Sensing*, 2020, 12(19), 3224. [CrossRef]
  15. Powers, D. Evaluation: from precision, recall and F-measure to ROC, informedness, markedness and correlation. arXiv preprint 2020, arXiv:2010.16061. [Google Scholar]
  16. Légaré, B.; Bélanger, S.; Singh, R.K.; Bernatchez, P.; Cusson, M. Remote Sensing of Coastal Vegetation Phenology in a Cold Temperate Intertidal System: Implications for Classification of Coastal Habitats. Remote Sens. 2022, 14, 3000. [Google Scholar] [CrossRef]
  17. R Core Team. R: A Language and Environment for Statistical Computing; R Foundation for Statistical Computing: Vienna, Austria, 2024. [Google Scholar]
  18. Zoffoli, M.; Bani, L.; Bordogna, G. Sentinel-2 remote sensing of Zostera noltii-dominated intertidal seagrass meadows. Remote Sens. Environ. 2020, 240, 111678. [Google Scholar] [CrossRef]
  19. Valle, M.; Palà, V.; Lafon, V.; Dehouck, A.; Garmendia, J.M.; Borja, Á.; Chust, G. Mapping estuarine habitats using airborne hyperspectral imagery, with special focus on seagrass meadows. Estuar. Coast. Shelf Sci. 2015, 164, 433–442. [Google Scholar] [CrossRef]
  20. Benmokhtar, S.; Robin, M.; Maanan, M.; Boutoumit, S.; Badaoui, B.; Bazaïri, H. Monitoring the Spatial and Interannual Dynamic of Zostera noltei. Wetlands. 2023, 43, 43. [Google Scholar] [CrossRef]
  21. Benmokhtar, S.; Robin, M.; Maanan, M.; Bazairi, H. Mapping and Quantification of the Dwarf Eelgrass Zostera noltei Using a Random Forest Algorithm on a SPOT 7 Satellite Image. ISPRS Int. J. Geo-Inf. 2021, 10, 313. [Google Scholar] [CrossRef]
  22. Bargain, A.; Robin, M.; Le Men, E.; Huete, A.; Barillé, L. Spectral response of the seagrass zostera noltii with different sediment backgrounds. Aquatic Botany 2012, 98, 45–56. [Google Scholar] [CrossRef]
  23. Bargain, A.; Robin, M.; Méléder, V.; Rosa, P.; Menn, E.; Harin, N.; Barillé, L. Seasonal spectral variation of zostera noltii and its influence on pigment-based vegetation indices. Journal of Experimental Marine Biology and Ecology 2013, 446, 86–94. [Google Scholar] [CrossRef]
  24. Taddia, Y.; Pellegrinelli, A.; Corbau, C.; Franchi, G.; Staver, L.W.; Stevenson, J.C.; Nardin, W. High-Resolution Monitoring of Tidal Systems Using UAV: A Case Study on Poplar Island, MD (USA). Remote Sens. 2021, 13, 1364. [Google Scholar] [CrossRef]
Figure 1. Location of the Mira River estuarine areas.
Preprints 138493 g001
Figure 2. Spectral sensitivity and range for the different sensors used in the drone mapping.
Preprints 138493 g002
Figure 3. The cartography of the Zostera noltii and Salt Marsh in the study area.
Preprints 138493 g003
Figure 4. Atlas of the RGB spectral signature of the landscapes the Moinho da Asneira region. A) Ortophoto; B) human infrastructures; C) Land vegetation; D) Salt Marsh and E) Zostera noltii.
Preprints 138493 g004
Figure 5. The spectral signature of the Salt Marsh and Zostera noltii. A) Orthophoto; B) Cartography of Salt Marsh and Zostera noltii; C) 5 band spectral signature.
Preprints 138493 g005
Figure 6. The NDVI values. A) NDVI map; B) NDVI boxplot.
Preprints 138493 g006
Figure 7. Biplot of PCA analysis for the Moinho da Asneira area.
Preprints 138493 g007
Figure 8. Maps of the PC1 and PC2 components for the Moinho da Asneira region.
Preprints 138493 g008
Figure 9. K-Means clustering maps. A) Silhouette results; B) K-Means for 2 clusters map; C) K-Means for 6 clusters.
Preprints 138493 g009
Figure 10. RF classification maps. A) Stratified sample; B) RF classification map.
Preprints 138493 g010
Table 1. Correspondence table between clusters and ecotypes for a 2-cluster classification.
Ecotypes Cluster 1 Cluster 2
Salt Marsh 86561 5054
Zostera noltii 35685 1
Unclassified 101519 21180
Table 2. Correspondence table between clusters and ecotypes for a 6-cluster classification.
Ecotypes Cluster 1 Cluster 2 Cluster 3 Cluster 4 Cluster 5 Cluster 6
Salt Marsh 2341 20612 50028 63 5106 13465
Zostera noltii 7413 104 593 0 1 27575
Unclassified 62260 20800 6423 8925 9561 14730
Table 3. Confusion matrix for the Random Forest classification with a 70% training and 30% test data set.
Salt Marsh Zostera noltii Unclassified
Salt Marsh 26242 230 828
Zostera noltii 168 9711 921
Unclassified 1332 716 34852
Disclaimer/Publisher’s Note: The statements, opinions and data contained in all publications are solely those of the individual author(s) and contributor(s) and not of MDPI and/or the editor(s). MDPI and/or the editor(s) disclaim responsibility for any injury to people or property resulting from any ideas, methods, instructions or products referred to in the content.
Copyright: This open access article is published under a Creative Commons CC BY 4.0 license, which permit the free download, distribution, and reuse, provided that the author and preprint are cited in any reuse.
Alerts
Prerpints.org logo

Preprints.org is a free preprint server supported by MDPI in Basel, Switzerland.

Subscribe

© 2025 MDPI (Basel, Switzerland) unless otherwise stated