
Submitted:
05 November 2024
Posted:
06 November 2024
You are already at the latest version
Preprints on COVID-19 and SARS-CoV-2
Abstract
The scope of the research work described in this article involved identifying the effects of the COVID-19 pandemic on the urban public transport system in a medium-sized city and its adjacent metropolitan area, using as reference information the number of tickets effectively sold in order to determine the fluctuation in the volume of passengers on the different bus lines before, during and after the pandemic. At the methodological level, a combined approach was employed, involving, on the one hand, the collection of open access public data from institutional repositories and in-formation provided by the government and, on the other hand, network analysis and graphical mapping using GIS tools. The results obtained at the micro level (individualised study of each urban bus line) reveal a significant decrease in the number of passengers during the pandemic, showing the effect of mobility restrictions and the fear of contagion. However, a gradual recovery in post-pandemic demand has been observed, highlighting a large variability in recovery patterns between different bus lines. Such a situation could be attributable to several factors, such as the socio-demographic characteristics of the areas served, the frequency of the service, connectivity with other modes of transport and users' perception of the quality of the service. At the macro level (comparison between urban and interurban transport), lines with higher demand prior to the pandemic have shown greater resilience and faster recovery. However, urban transport has ex-perienced a more uniform and accelerated recuperation than interurban transport, with significant percentage differences in the years analysed. This disparity could be explained by the greater dependence of inhabitants on urban transport for their daily trips, due to its greater frequency and geographical coverage. Interurban transport, on the other hand, shows a more fluctuating demand and a lower dependence of users. Finally, the lack of previous research focused on the impact of the pandemic in sparsely populated rural areas restricts the ability to establish a solid frame of ref-erence and generalise the results of this study. The authors consider that more detailed future research, including a comparative analysis of different alternative transport modes in inter-urban settings and considering a broader set of socio-demographic variables of passengers, is needed to better understand mobility dynamics in these areas and their evolution in the context of the pandemic.
Keywords:
public bus transportation
; rural areas
; demographic challenge and depopulation
; patterns of displacement mobility
; COVID‐19
; GIS
1. Introduction
The SARS-CoV-2 health crisis has not only drastically transformed global mobility but has also caused a slowdown in the transport sector [1,2] disrupting travel patterns and social dynamics around the world. The public transport sector has been particularly affected [3,4,5] suffering massive reductions in ridership due to restrictive policies imposed by governments and widespread fears that such spaces represent a high risk of contagion among the population [6]. Research carried out by the research indicates that quickly spreading infectious diseases have a significant impact on society's lifestyle and mobility behaviour. In fact, in research conducted by [10] has shown a significant reduction in the number of public transport users on the metro due to SARS infection. The identification of this new highly contagious infectious disease, whose spread is favoured in closed and crowded environments, has generated a significant social and health impact. Public transport has become a focus of attention in terms of disease prevention and control, as it concentrates large numbers of people in small spaces, generating a significant change in the patterns of use of essential services [11,12,13].
The outbreak of SARS-CoV-2 has triggered a radical transformation in urban mobility patterns globally [14,15,16]. Containment measures implemented in many countries, particularly in Europe [17,18,19,20], have led to a drastic reduction in population movement, highlighting the unprecedented impact of this health crisis on the dynamics of cities. In addition, the implementation of mobility restrictions, such as the closure of Europe's external borders to non-essential travel, was a containment measure adopted in order to mitigate the spread of the virus [21,22]. The implementation of mobility restrictions on the African continent occurred at a later stage compared to Europe, reflecting the staggered geographical spread of the pandemic [23]. Moreover, as it appeared in [24] the Americas mobility patterns have undergone substantial modifications. The implementation of restrictive measures reinforced the public perception of public transport as a high-risk environment, which in turn negatively impacted on its safety and operational efficiency [25]. Despite some recovery, demand for public transport in many cities has not returned to pre-pandemic levels, evidencing a persistent unevenness in urban mobility patterns, influenced by factors such as risk perception and alternative transport options. Simultaneously, other measures adopted to curb the spread of the virus included strict containment [26], the cancellation of mass events, the limitation of public transport capacity, the closure of workplaces and the implementation of teleworking policies [27]. The restrictive measures imposed resulted in a substantial decrease in urban mobility, significantly restricting activities outside the home and reducing available transport options. The pandemic exposed the inherent vulnerability of public transport systems to large-scale disruptive events, underlining the imperative need to rethink their design and operations to ensure long-term safety and sustainability.
The identification of public transport as a potential source of contagion has led to a profound alteration in urban mobility patterns. Fear of contagion and social distancing policies have led to a general decline in the use of public transport [28]. Tourists and local residents alike, relying significantly on public transport in urban environments, are highly sensitive to factors influencing perceptions of safety and security, which directly affect their mobility decisions [29]. Public transport systems have experienced unprecedented disruption as a result of the pandemic. Demand for these systems has shown a marked temporal and spatial variability, reflecting the implementation of different restrictive measures and the adaptation of users to the new circumstances.
Focusing on the European continent, Spain has proved to be one of the countries most affected by the pandemic, revealing itself as an ideal context for the development of numerous research projects aimed at understanding the profound socioeconomic and cultural changes induced by this health crisis. In particular, special attention has been paid to the transformation of mobility patterns and the new profile of public transport users [30,31]. Research has shown that the pandemic has led to a profound transformation in urban mobility patterns, characterised by an increased adoption of telematic modes of work and study, an increase in the perceived risk associated with the use of public transport, a growing preference for more sustainable and healthier modes of transport, and a reconfiguration of travel patterns [32]. The study developed by [33] reveals a significant decline in demand for urban public transport in medium-sized Spanish cities during the COVID-19 pandemic, followed by a gradual recovery. Despite differences in size and demographic characteristics, Cáceres, as a case study, presents mobility patterns similar to those observed in other cities. These results underline the need to adapt public transport policies to the new realities that have emerged after the health crisis.
The existing literature on the impacts of the pandemic on public transport provides a multifaceted view of this phenomenon. The study by [34], has established a baseline by analysing general changes in mobility patterns, while [35] it has delved into social inequalities in access to transport. Moreover, [36] has provided methodological tools for estimating and forecasting short-term demand, thus complementing the understanding of the challenges facing public transport systems in the post-COVID era. Research by some authors has provided valuable evidence on changes in public transport demand and mobility patterns during the state of alarm. In [37], it has been shown that urban mobility experienced a significant decrease, especially in the case of bus transport, while in [38] it has identified a generalised reduction in traffic intensity. However, the latter study has not been able to establish a clear relationship between traffic intensity and average speeds. These findings highlight the complexity of changes in urban mobility during the pandemic and the need for further research to fully understand the causes and consequences of these changes. In [39] A comprehensive analysis of the evolution of demand for regular public passenger transport in the context of the COVID-19 pandemic has been carried out. The results of this study reveal a significant decline in ridership both during the period of confinement and in the following months, although there is a trend towards gradual recovery. These findings suggest that, while the pandemic has caused profound changes in mobility patterns, public transport demand shows signs of adapting to the new reality, posing important challenges for future public transport planning and management.
Essentially, the studies analysed on the impacts of the pandemic on public transport have used mobile phone-based mobility data (Big Data) and surveys to analyse changes in mobility patterns. While these approaches have provided valuable information, they have limitations. Mobility data, such as those used by [40] provide an overview of changes in mobility on a large scale, but do not allow identification of the specific mode of transport, as noted by [35]. On the other hand, surveys, while useful in capturing user perceptions, often present problems of representativeness. The combination of both data sources, together with other complementary sources, could prove essential to gain a more complete understanding of changes in public transport demand and their implications for transport planning and management. To complement studies based on mobility data and surveys, several authors [33,35,37,39,41,42,43,44] have used the quantification of ticket sales and the use of contactless payment systems to analyse the impact of COVID-19 on public transport. This methodology has provided accurate data on passenger numbers, giving a more detailed picture of the evolution of demand and complementing the results obtained from other sources of information. The pandemic has created a unique opportunity to reorient transport systems towards more sustainable models. Studies such as [45] and [46] have shown a shift in user preferences towards more active and less polluting modes of transport. Public policies implemented in response to the pandemic, such as increasing the frequency of public transport services and promoting teleworking, have played a crucial role in this process. Fare reduction measures, proposed by authors such as [32] and [47], could further strengthen this trend.
The change in public transport user behaviour during the pandemic has led to a profound transformation in urban mobility patterns, challenging the goals of the 2030 Agenda. Sustainable Development Goal 11 seeks to promote safe, affordable and sustainable transport systems [48], yet the health crisis has led to an increase in the use of private vehicles, to the detriment of public transport. Fear of contagion and the perceived risk associated with public transport, as highlighted by [49], have hindered the achievement of this goal. This situation poses important challenges for urban planning and sustainable mobility, requiring the implementation of innovative measures to encourage the use of public transport and reduce dependence on private vehicles.
This research work arises from the concern to identify the impact of the pandemic caused by COVID-19 on daily mobility in a medium-sized city, where urban public transport by bus is positioned as the essential mode of transport for people living in neighbourhoods far from the city centre and with limited economic resources, as well as an efficient means of transport for tourists. The main objective of this research is to determine the impact of the pandemic on the mobility habits of regular users of urban public transport by bus, taking as a reference the number of tickets sold and the different lines connecting different parts of the city. In addition, it is considered essential to identify a common pattern in the behaviour of urban transport by finding differences or similarities with the interurban public transport service in the area of influence of the city studied, which is in a rural and demographically long-lived area. The search for this trend, together with the implementation of GIS tools, will make it possible to explain the patterns of behaviour in the use of public transport. In this way, we seek to understand the possible changes in the mobility of users during the onset of health crises.
2. Materials and Methods
The research carried out in this article is based on the procedural development of a methodology consisting of five sequential stages: (1) an exhaustive review of the existing literature, (2) obtaining preliminary data through searches in public repositories that offer open access to information, (3) collecting and requesting documentation related to urban public transport from government administrations, (4) processing the information using statistical analysis techniques, and (5) using Geographic Information Systems (GIS) tools in order to carry out a spatial analysis. Figure 1 illustrates the procedure carried out in this research, providing a visual representation of the previous stages described.
The research developed in this article is based on an exhaustive methodological process aimed at analysing the impact that the COVID-19 pandemic has had on the urban public bus transport service in a medium-sized city, with neighbourhoods located in peripheral areas outside the central urban core. The research approach was developed in several phases, starting first with a systematic review of the scientific literature. The aim of this phase was to identify key articles that had addressed the relationship between urban mobility, public transport in times of pandemic and the effects of confinement policies on population mobility. This review was based on academic sources, specialised databases and case studies, with the aim of establishing a theoretical framework to support the research.
Once the theoretical basis had been consolidated, we proceeded to identify the fundamental sources of information in the research that were of an institutional nature, including both open access public data provided by local and regional administrations, as well as information obtained through direct collaboration with the transport service concessionary company. In this regard, public administrations provided essential information regarding mobility policies implemented during the pandemic, traffic restrictions, as well as public transport usage figures during the study period (four years). In addition, information was collected on bus routes in the study area, frequency of services and variations in transport demand before, during and after the critical period of the pandemic.
The Department of Public Services of the Cáceres City Council provided a considerable component of the data analysed in the study. In response to the academic request made by the researchers, they provided a detailed database covering the period from 2019 to 2022. This dataset included the number of passengers per existing bus line as well as the type of ticket used. This allowed for a detailed analysis of user behaviour during the course of the pandemic. The company SuBus Grupo de Transporte, S.L. (responsible for the concession of the service), also collaborated by providing additional relevant information for the investigation. In addition, institutional repositories were consulted, including the National Institute of Statistics (INE), from which essential demographic data were extracted in order to understand the structure of the population in the study area. The data provided were classified by five-year age groups and also by sex, allowing for a detailed analysis of the population composition. It was also decided to collect economic data relating to: the average net income per household, the main economic activities carried out in the study area, as well as the percentage of the population employed in each economic sector.
Statistical processing and analysis of the data was an essential component of the study. Network analysis techniques were used to identify patterns in the recovery of public transport use after the pandemic and emerging trends in urban mobility. The analyses developed made it possible to uncover patterns not evident to the naked eye, providing a more complete understanding of the aspects that affected user behaviour during the pandemic. Finally, the results were graphically represented using Geographic Information Systems (GIS) tools, specifically ArcGIS Pro software. The spatial representation contributed to an explicit visualisation of the changes in mobility in the study area, allowing the findings to be displayed effectively. The graphical visualisation of the data not only facilitated its interpretation, but also provided an accurate perspective on the impact of the pandemic on public transport and urban Mobility.
2.1. Study Area
The research carried out in this article focuses on the municipality of Cáceres, a world heritage city located in the centre of Extremadura (Spain). In order to determine the impact that the COVID-19 pandemic has had on urban public transport in the city, Figure 2 shows the delimitation of the study area.
The municipality of Cáceres, the largest in Spain with more than 1,500 km² and the capital of its province, plays a central role as the socio-economic, administrative and commercial hub of the Extremadura region. Its influence extends to all the surrounding municipalities, making the area a true metropolitan area. This area is part of the Network of Sustainable Municipalities of Cáceres (RMSC), which includes a total of 21 towns, including Malpartida de Cáceres, Arroyo de la Luz, Casar de Cáceres and Trujillo, among others. It is also worth mentioning the smaller local entities outside the urban centre (Valdesalor and Rincón de Ballesteros) and the small hamlet of Estación Arroyo-Malpartida. Cáceres has established itself as a point of reference in the cultural, tourist and economic spheres within the study area, thanks to a communications network that facilitates travel between the different municipalities. These roads include the A-66 (which crosses the province from north to south) and the A-58 (which connects Cáceres and Trujillo with the A-5 motorway). In addition to the dual carriageways, there are national and regional roads linking the municipalities of the RMSC with the city of Cáceres. In addition, there is also the road network managed by the Cáceres Provincial Council, which extends the connections between the municipalities with a smaller number of citizens. According to data from the National Statistics Institute (INE, 2022), the population of Cáceres is 95,456 inhabitants. The age structure reveals a regressive population pyramid, characterised by a high percentage of adult and elderly population. The low birth rate and the low number of young people generate negative vegetative growth, indicating a trend towards population ageing and population decline in the long term.
Figure 1.
Population of Cáceres city.
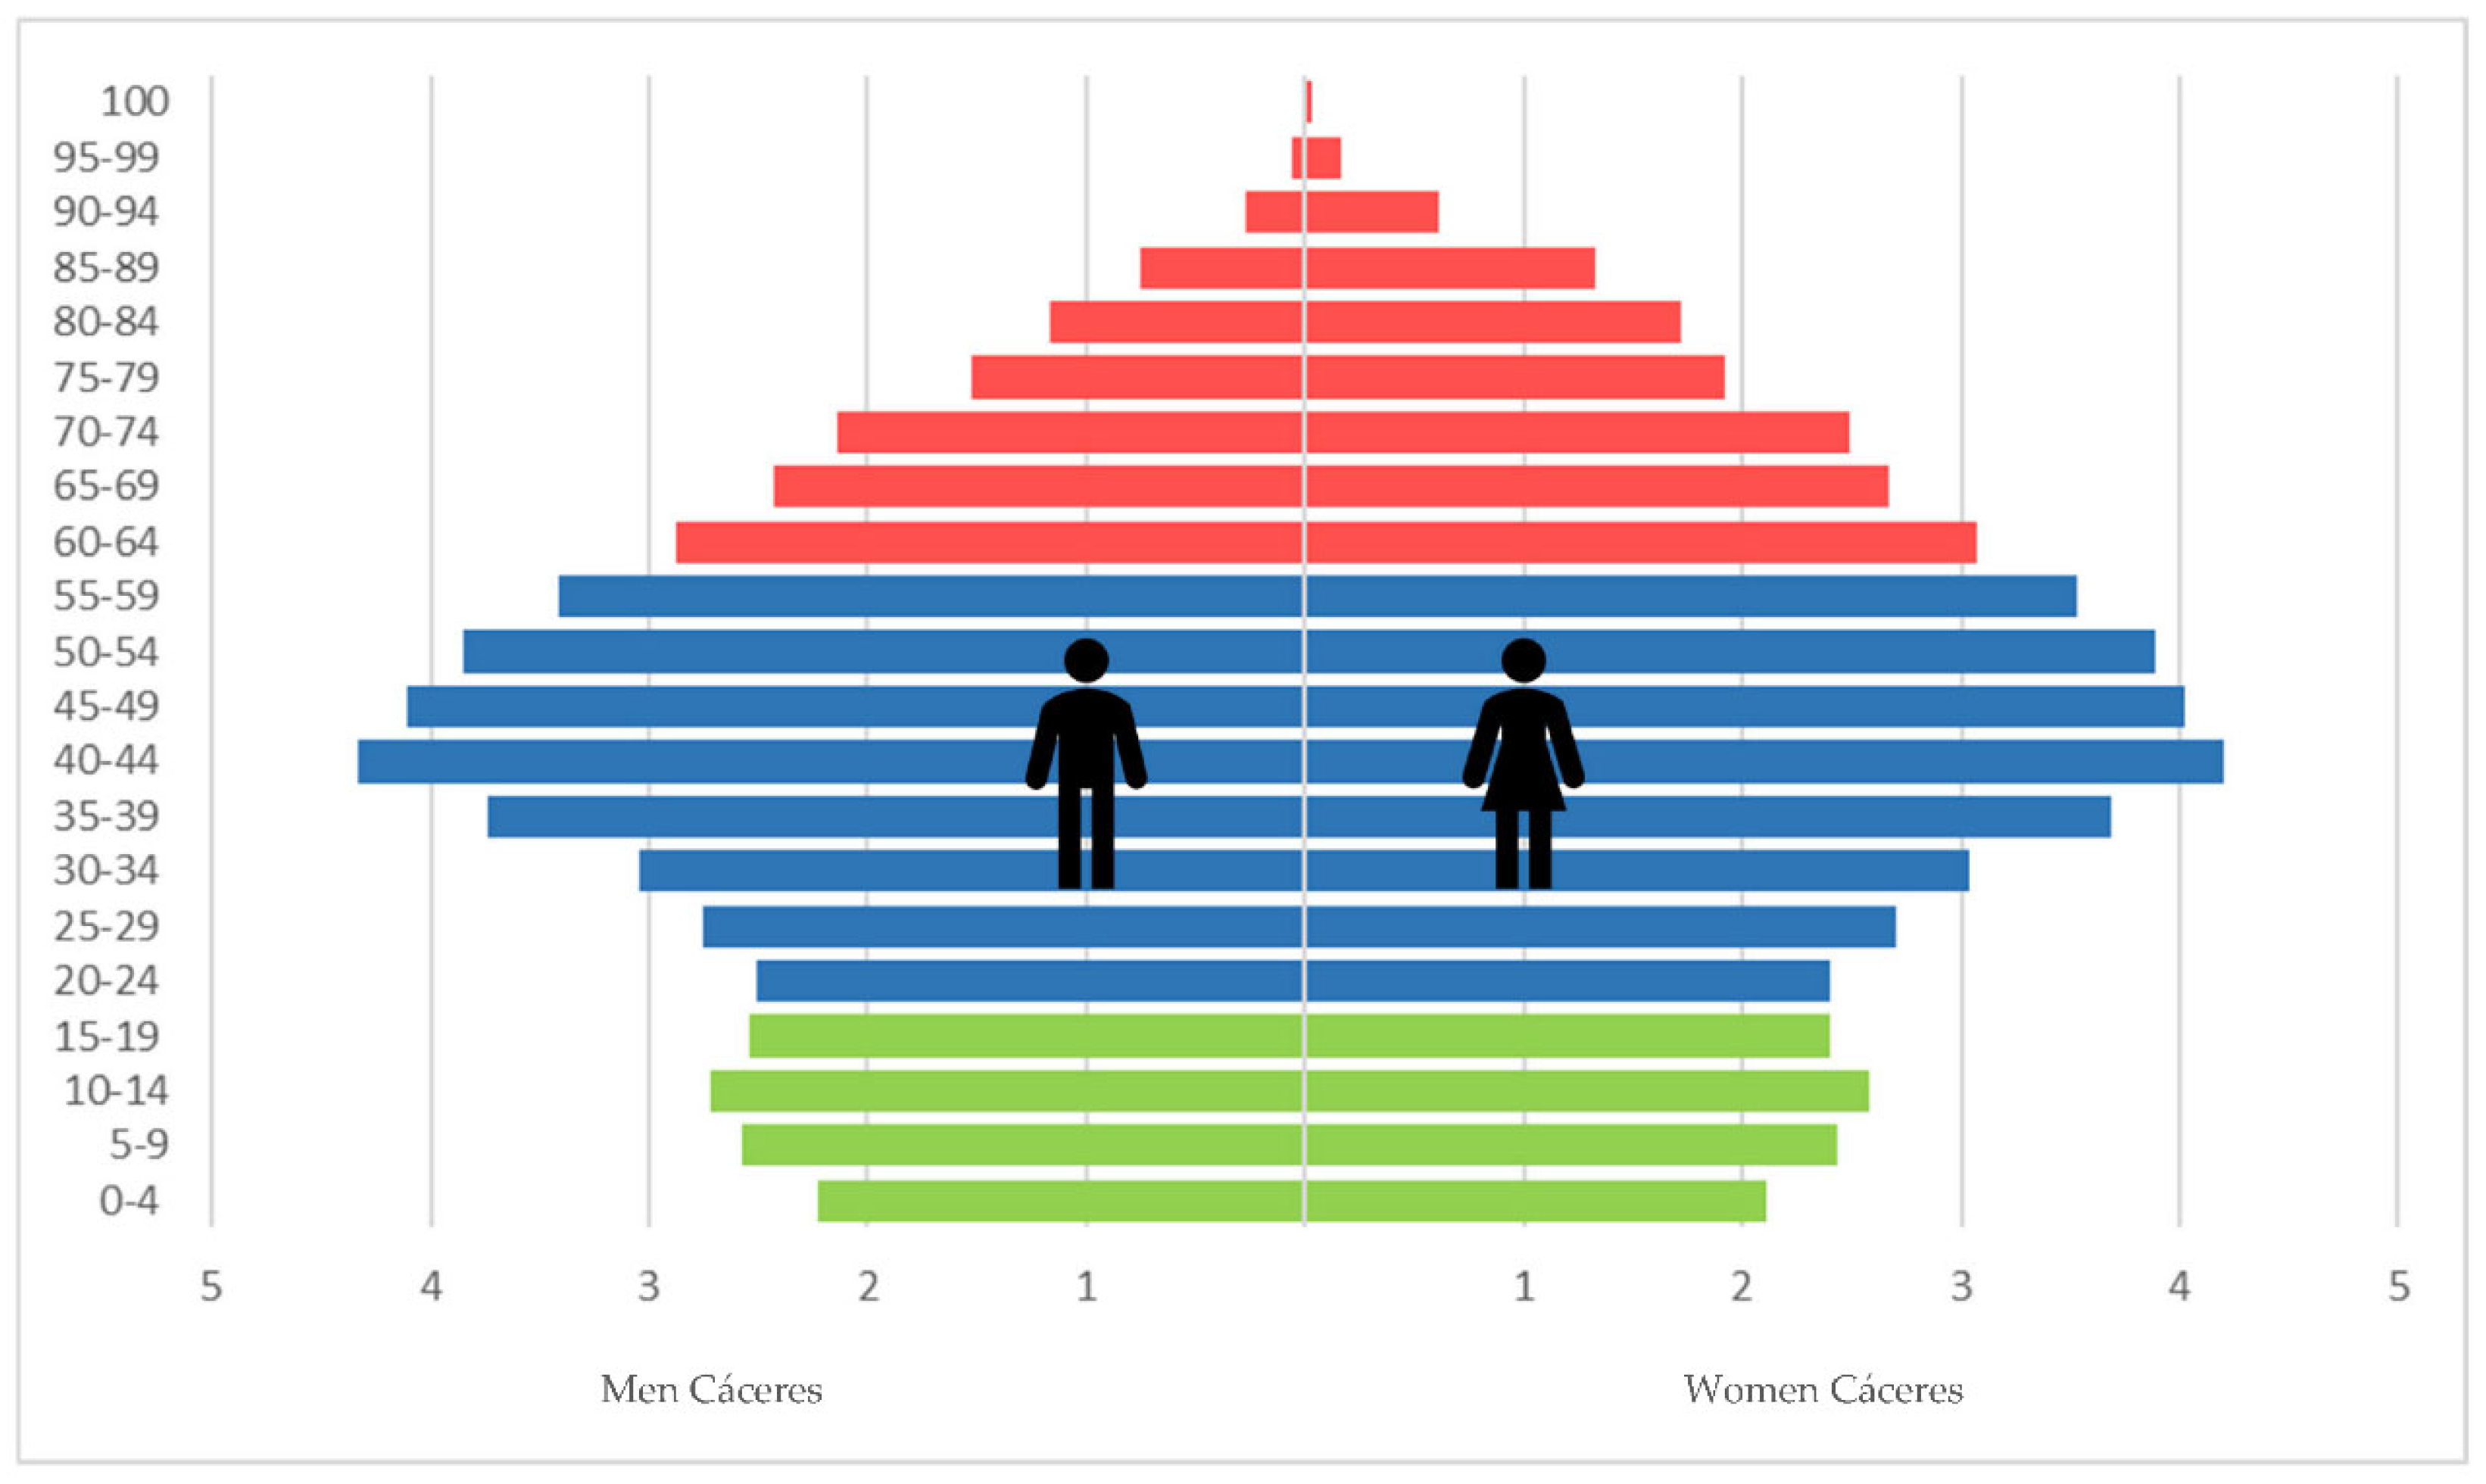
The population pyramid exhibits a relatively broad base, suggesting a sustained generational turnover. This demographic dynamic could be attributed to the migratory flows of women of childbearing age, who, with above-average fertility rates, contribute to the maintenance of the young population. However, the highest population concentration is observed in the 40-50 age groups, which denotes a mature age structure. At the same time, there is a progressive growth in the older population, which indicates a trend towards an ageing population.
The productive structure of the municipality of Cáceres is characterised by a marked tertiarisation, with the service sector as the main economic engine. This sector, which includes activities such as tourism, hotels and public services, accounts for 89% of the employed population. In contrast, the primary and secondary sectors have a marginal share, with 1.5% and 9.4% of the employed population respectively. This configuration is explained by the scarcity of natural resources and the limited industrial infrastructure, which restricts the development of agricultural or farming activities.
2.2. Description of Bus Line
In the study area, an urban public transport network consisting of eight regular bus lines has been identified, which articulate mobility between the city centre and the suburbs. In addition, four special lines with different operational characteristics have been identified. The latter include on-demand services, such as the Ferial line, active during specific cultural or musical events, as well as complementary lines connecting adjacent localities, such as Rincón de Ballesteros and Estación Arroyo-Malpartida. The service to the University Campus, although with two variants, has been considered as a single line for the purposes of this analysis. Figure 4 provides a graphical representation of the routes of the regular lines, visualising the territorial coverage of the network.
Figure 4 reveals an extensive urban public transport network, consisting of a total of 239.7 kilometres of bus routes. This network ensures a wide territorial coverage, connecting not only the neighbourhoods of the urban core, but also the peripheral areas of the city. The configuration of the routes, as shown in the figure, facilitates the mobility of citizens and contributes to the sustainability of the urban system. For a deeper understanding of the structure and operation of the public transport network, we recommend consulting Annex A, which presents a detailed characterisation of each line, including variables such as length, number of stops and route.
3. Results
The results of this research are presented from two complementary perspectives: (1) a micro analysis, focusing on the individualised study of each bus line, with special attention on those with the highest demand and on the impact that the COVID-19 pandemic has had on their patterns of use; and (2) a macro analysis, which seeks to establish comparisons between urban and interurban public transport in the area of influence of Cáceres, with the aim of identifying similarities and differences in their dynamics.
3.1. Individual Analysis of the Lines
The results of the analysis of urban public transport ticket sales reveal heterogeneity in the response of different bus routes to the health crisis. While all routes experienced a significant decline in demand during the pandemic, with a 59.7% drop in 2020 compared to 2019, the patterns of recovery have been diverse. Some routes have managed to recover a considerable proportion of their passengers, while others remain below pre-pandemic levels, despite showing signs of growth. The data indicate a trend towards normalisation of demand, rising to 73.8% in 2021 and 92.2% in 2022 compared to 2019, although full recovery has not yet been achieved. Analysis of the main lines (L1-L8) reveals a generalised decline in demand during the COVID-19 pandemic, followed by a gradual recovery. However, the magnitude of this recovery has varied considerably between the different lines, which is explained by the diversity of factors influencing demand, such as route characteristics, user mobility patterns and socio-economic conditions. Elements such as frequency of service, journey times and perception of safety have played a key role in the evolution of demand following the health crisis. Special lines, characterised by their on-demand operation and lower frequency, show very different demand patterns to regular lines. Lines such as Rincón de Ballesteros and Estación Arroyo-Malpartida show marginal demand, representing less than 1% of total sales. The Ferial line, with a seasonal operation linked to cultural events, shows peaks in demand during periods of celebration, although its overall contribution to total sales is limited. In contrast, the service to the University Campus, despite its interruption during the holiday period, has consolidated its position as the third most used line, representing 17.2% of total sales, which shows its importance for the university community.
In summary, the results obtained show significant heterogeneity in demand recovery patterns between the different bus lines. While some routes have managed to exceed pre-pandemic demand levels (2019), others have stagnated below these values. This variability in recovery is evident in Figure 5, which presents a detailed comparison of the evolution of demand on each line.
The results of the analysis show a large variability in demand recovery patterns between the different bus lines. While lines L4 and L8 have exceeded pre-pandemic levels, most of the main lines have not yet reached full recovery. Special lines have more complex demand patterns, influenced by factors such as seasonality, the nature of the events served and health restrictions. The Ferial line, for example, has experienced significant growth due to the revival of cultural events. Despite these differences, analysis of the temporal patterns of recovery suggests a common trend across most routes, indicating that factors such as risk perception and changes in mobility habits have similarly influenced demand on all lines.
Analysis of the data reveals a pattern of post-pandemic recovery common to most bus lines in and around the city of Cáceres. Despite a drastic drop in demand in 2020, an exponential growth trend is observed from 2021 onwards. While all lines show this general trend, there are significant variations in the speed and magnitude of the recovery. Lines such as L4 and L8 stand out for exceeding pre-pandemic levels, suggesting a particular resilience of these routes. These findings contrast with initial expectations, as factors such as the promotion of sustainable mobility and the increase in teleworking might have led to a decrease in the use of public transport. However, empirical evidence indicates a sustained demand, even higher than expected in some cases.
Although more than 15 million passengers used the urban transport service in Cáceres during the period analysed, demand is not evenly distributed between the different lines. Figure 6 shows the variability in ticket sales for each line (L1-L8) over the years studied. This heterogeneity in demand can be attributed to various factors, such as the socio-demographic characteristics of the areas served, the frequency of the service, connectivity with other modes of transport and users' perception of the quality of the service.
Analysis of the demand for public transport on the different lines reveals heterogeneous patterns of evolution. Although lines L2 and L8 stand out for registering the highest passenger volumes, their time trajectories show significant differences. Line L8 shows a sustained growth trend throughout the period analysed, while line L2 experiences a decline in demand, particularly pronounced in the last year. This contrast in trends suggests the influence of specific factors on each route, such as changes in socio-economic conditions in the areas served, competition from other modes of transport or the implementation of urban mobility policies. The rest of the main lines exhibited more stable demand patterns throughout the period analysed, with no significant fluctuations. Special lines, characterised by lower demand and intermittent operation, showed more variable behaviour. In particular, the lines connecting to Arroyo-Malpartida Station, Rincón de Ballesteros and the fairgrounds did not present statistically significant data due to the temporary nature of their operations. In contrast, the service to the university campus, despite being considered a special line, exhibited similar stability to the main lines, suggesting a more constant and predictable demand.
In terms of the distribution of total demand, lines L8, L2, SC and L1 accounted for 50% of the total number of users, representing 21%, 19%, 17% and 12% respectively. This concentration of demand on a small number of lines underlines the importance of these routes for the city's public transport system and the need to optimise resources on these lines. Analysis of demand throughout the year reveals clear seasonal patterns. A general decline in passenger numbers is observed during the months of August and April, coinciding with the summer and Easter holidays respectively. These declines are mainly attributed to the decrease in economic activity and the departure of students and workers from the city. However, a significant increase in demand is detected during the month of May, associated with the celebration of cultural and musical events that attract a greater number of visitors. The COVID-19 pandemic caused an exceptional drop in demand during April 2020, due to mobility restrictions, fear of contagion and the limitation of bus capacity to 50% (in addition to the difficulty of maintaining social distance in confined spaces).
3.2. Analogies Between Urban and Interurban Transport
In the second phase of this research, a comparative analysis of the urban and interurban transport lines operating in the study area was carried out. Although the analysis of passenger flows between the RMSC and Cáceres was excluded, the temporal evolution and demand patterns of the 12 interurban and 14 urban lines identified were analysed in depth. The results reveal significant differences in the operation and demand of both types of lines, which underlines the need for a differentiated approach in their management and planning. Nevertheless, establishing a comparative analysis allows us to obtain a more comprehensive vision of mobility systems at the provincial level, contributing to a better understanding of the dynamics of transport in urban and interurban contexts.
The results presented in Figure 7 and Figure 8 reveal a positive trend common to both urban and interurban transport lines in the study area: a gradual recovery of passenger flow during the period 2019-2022. However, a more detailed analysis of the quantitative data reveals a marked difference in the volume of tickets sold. While interurban transport in the RMSC registered 776,882 tickets, urban transport in the municipality of Cáceres exceeded 15 million in the same time period. This disparity, although partly explained by the difference in population (41,031 inhabitants on average in the RMSC vs. 95,814 in Cáceres), suggests the existence of other factors, such as the density of the urban network, the frequency of services and the socio-economic characteristics of the population, which could influence the demand for each mode of transport.
Passenger flow on each transport line is closely linked to the population density of the area and the mobility habits of residents. Although there is a general trend of recovery after the COVID-19 pandemic, not all routes have managed to reach pre-pandemic levels of demand. Taking 2019 as a reference year, in which ticket sales settled at 100%, a comparative analysis has been carried out to assess the impact of the health crisis in subsequent years. The results, visualised in Figure 9 and Figure 10, allow us to identify the most affected lines and analyse the possible causes of these variations, considering factors such as connectivity, service frequency and the socio-economic characteristics of the areas served.
Both figures show a pattern of staggered growth in the number of users of the transport services analysed, indicating a progressive recovery of demand after the pandemic. This increase in the use of public transport is in line with the Sustainable Development Goals, promoting sustainable mobility and reducing dependence on private transport. In particular, routes with the highest passenger volumes before the pandemic have demonstrated greater resilience. The JEV-008 route, which connects three key municipalities in the province, has experienced 79% growth compared to 2019, far exceeding pre-pandemic levels. On the other hand, although route JEV-010, which links Trujillo with Cáceres, has come significantly closer to 2019 levels (97%), it has not yet managed to exceed them. The VAC-051 route, meanwhile, has not reached pre-pandemic levels either.
In the field of urban transport, lines 8 and 4 have shown a remarkable recovery, even exceeding pre-pandemic demand levels by 4.3% and 1.6%, respectively. Line 8 in particular, as a transversal route connecting the northern and southern ends of the city, plays a crucial role in the urban mobility of Cáceres, connecting the peripheral neighbourhoods with the city centre. This route is essential for those residents who rely on public transport, especially considering the difficulties of accessing the centre by private vehicle. As for special transport, the Ferial line has seen a significant increase in the number of users, although its seasonal nature and limited demand exclude it from the main analysis.
A comparison between the urban and interurban transport systems in Cáceres is essential to understand the dynamics of mobility in the city and to assess the impact of factors such as the COVID-19 pandemic. In order to facilitate this comparison, Figure 11 and Figure 12 show the evolution of transport demand in relation to the year 2019. These graphical representations allow the identification of common and specific trends in each mode of transport, contributing to a better understanding of the phenomenon under study.
In the analysis of interurban transport, lines JEV-008, JEV-009 and JEV-011 have been excluded. Line JEV-008, which connects Herreruela, Aliseda, Malpartida de Cáceres and Cáceres, has experienced exceptional growth in demand, reaching an increase of 179% compared to 2019. This significant increase could mask the general trends of the other lines, so it has been decided to exclude it from the main analysis. On the other hand, lines JEV-009 and JEV-011, which connect Santa Marta de Magasca and Brozas with Cáceres, respectively, show a low volume of passengers and a very different time evolution from the rest of the lines. Given their low representativeness and their limited contribution to the understanding of general demand patterns, it has been decided not to include them in this study. After eliminating the outlier lines, a common pattern of behaviour is observed in the remaining nine lines. All of them show a significant decrease in transport demand during 2020, coinciding with the onset of the COVID-19 pandemic. Mobility restrictions and the health measures implemented, such as the reduction in capacity and the mandatory use of masks, explain this drop in the use of public transport. From 2021 onwards, a gradual recovery in demand can be observed, although pre-pandemic levels are not reached. To model this time evolution, a third degree polynomial curve has been fitted to the average data of the nine lines. The resulting equation, y = -8.7107x³ + 82.361x² - 237.18x + 263.53, provides a good approximation to the empirical data and allows us to estimate the average passenger flow by year, with x = 1, 2 and 3 for the years 2019, 2020 and 2021, respectively.
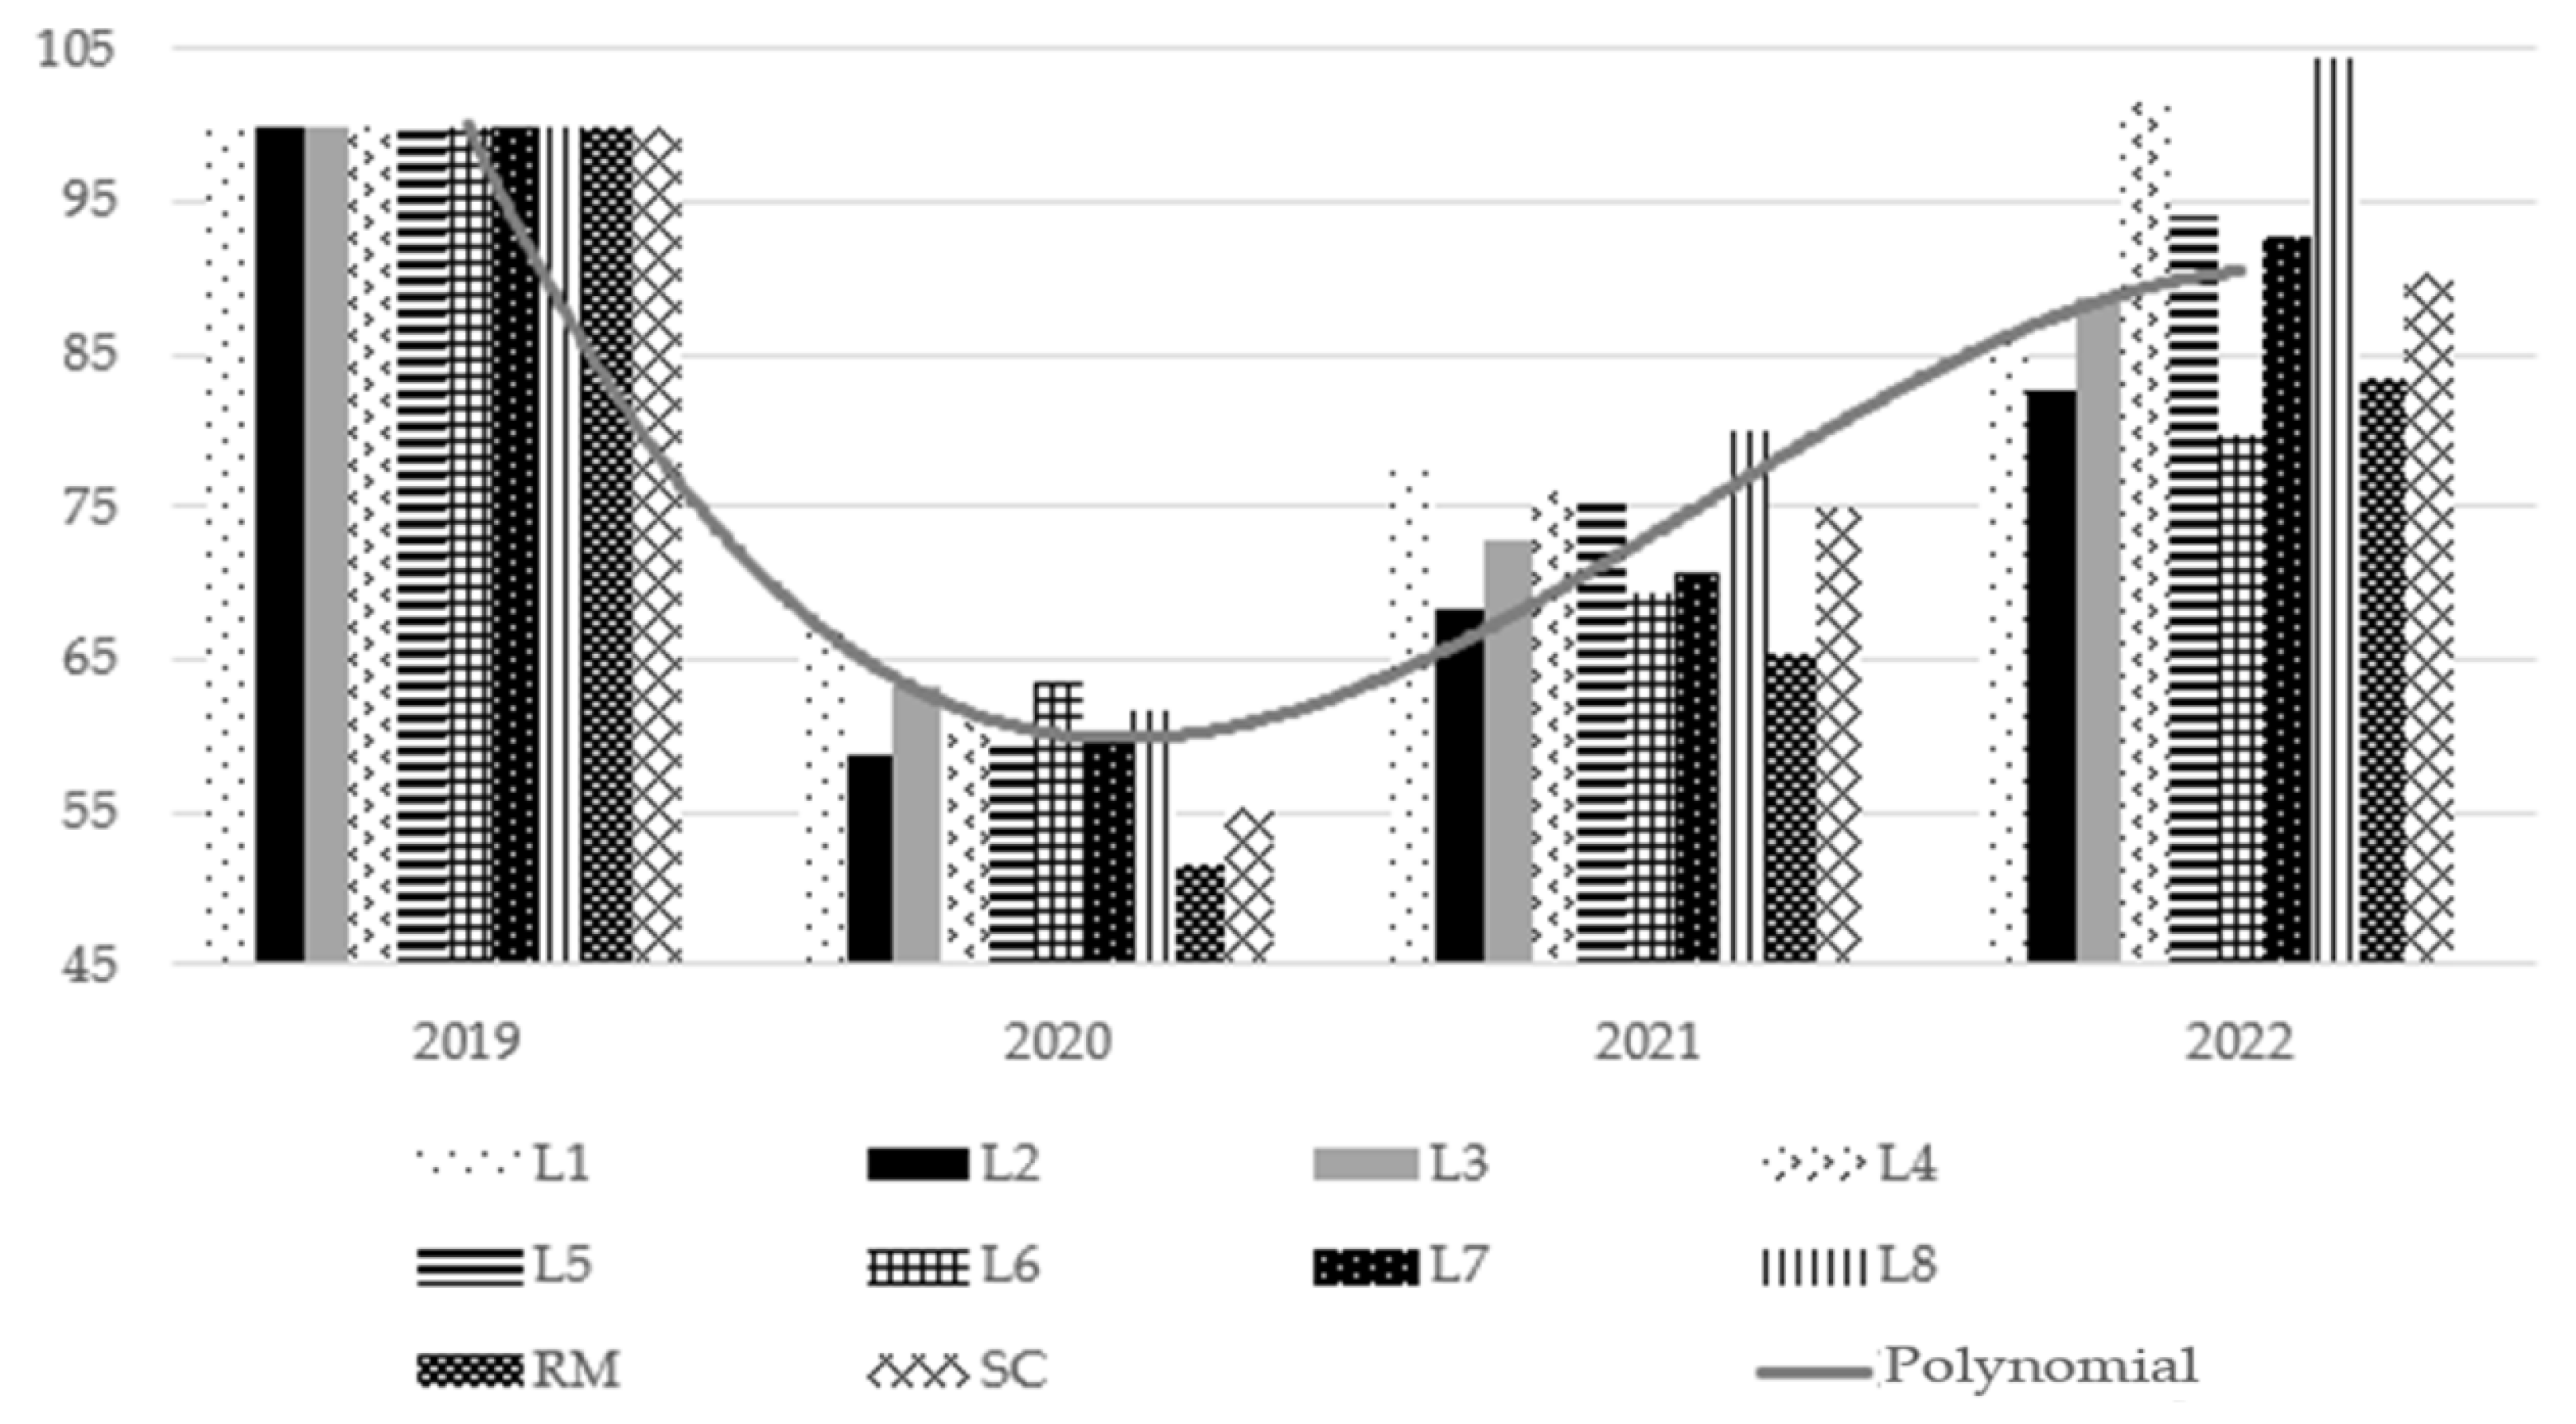
In the case of urban transport (Figure 12), a pattern similar to that of interurban transport is observed. After excluding the special lines (Rincón de Ballesteros, Estación Arroyo-Malpartida and Ferial) which either have low frequency or low demand or are special services that only operate on specific dates (which could distort the pattern of behaviour being analysed), there is a significant decrease in the number of users in 2020, coinciding with the start of the COVID-19 pandemic. Subsequently, there is a gradual recovery in demand. As in interurban transport, a third degree polynomial curve (y = -7.9824x³ + 74.186x² - 206.85x + 240.65) has been fitted to model the temporal evolution of demand, obtaining results consistent with those observed in interurban transport.
Comparison between the two transport systems reveals similar patterns of behaviour, but also significant differences. In both cases, the lines with the highest demand prior to the pandemic have shown greater resilience and a faster recovery. However, urban transport has experienced a more uniform and accelerated recovery than interurban transport, with significant percentage differences in the years analysed. This disparity could be explained by the greater dependence of the inhabitants of Cáceres on urban transport for their daily journeys, due to its greater frequency and geographical coverage. Interurban transport, on the other hand, shows a more fluctuating demand and a lower dependence on it on the part of users.
4. Discussion
The challenge of this research was to assess the impact of the COVID-19 pandemic on the mobility patterns of public transport bus users in the city of Cáceres (including its peripheral neighbourhoods and nearby interurban areas), with special attention to the decrease in the number of passengers and changes in travel habits during and after the health crisis. The results obtained reveal a significant decrease of 59.7% in the number of passengers during 2020 compared to 2019, evidencing the effect of mobility restrictions and fear of infection [50]. However, a gradual recovery in demand has been observed from 2021 onwards, reaching 73.8% and 92.2% of the pre-pandemic level in 2021 and 2022, respectively, suggesting an adaptation of users to the new normality and a progressive return to public transport. In medium-sized cities, the bus emerges as the mainstay of the collective public transport system [51]. Given the economic and structural unfeasibility of implementing metro or tram systems in these types of cities [52], the bus is the only viable alternative to guarantee the mobility of citizens. Its role is essential, not only to meet daily commuting needs, but also to contribute to the sustainable development of these cities. Moreover, the adoption of public bus transport as the predominant mode of mobility in medium-sized cities has a direct and positive effect on reducing congestion from private car use. Recent studies [53] have shown that an increase in the use of public transport can significantly reduce the volume of traffic in urban areas, reducing the number of cars on the road by 10-20%. This decrease in demand for private transport is particularly beneficial in cities with limited road infrastructure, where road expansion is not always a viable option. By concentrating more passengers in fewer vehicles, the bus contributes to decongesting roads, optimising urban mobility and reducing travel times for both public transport users and private car drivers.
In addition to its contribution to reducing car congestion, the use of public transport by bus has a positive effect on air quality and environmental sustainability. The COVID-19 pandemic has raised public awareness of the importance of adopting more sustainable modes of transport and reducing dependence on the private car [54]. Previous studies such as in [55] have shown that air pollution in medium-sized cities is closely related to intensive car use. Each additional vehicle on the road contributes to an increase in greenhouse gas emissions, aggravating global problems such as climate change and local problems such as respiratory diseases [56]. Therefore, the promotion of public bus transport stands as a key strategy to mitigate these environmental problems and improve the quality of life of citizens. Furthermore, electrification and hybridisation of bus fleets are promising solutions to reduce pollutant emissions associated with public transport. Studies such as [57] show that electric buses can reduce CO2 emissions by up to 70%, while hybrid buses offer reductions of between 30% and 40% compared to conventional vehicles. The implementation of these technologies, supported by public policies that encourage their adoption, is essential to ensure the sustainability of public transport in medium-sized cities and contribute to climate change mitigation [58].
It can be seen that public bus transport not only offers environmental benefits, but also plays a key role in promoting social equity and accessibility. In peripheral and sparsely populated areas, such as those included in our study [59,60] where the population often faces mobility barriers, the bus becomes an essential service to ensure social inclusion. In medium-sized cities, many inhabitants, for economic, physical or preference reasons, do not have a private vehicle. Public bus transport enables these groups to access basic services such as work, education and health, reducing social inequalities and improving the quality of life of citizens [61].
Similarly, the availability of an efficient and affordable public transport system is essential to improve the quality of life of the most vulnerable segments of the population. Previous studies as [62] have shown that, in medium-sized cities, transport policies that prioritise accessibility can reduce socio-economic inequalities by facilitating the mobility of those groups with fewer resources. By lowering transport costs and expanding opportunities for access to jobs and services, public bus transport acts as a catalyst for inclusive economic development, enabling greater participation of the population in the social and economic life of the city. Therefore, public bus transport not only has an impact on the mobility of citizens, but also has a significant influence on urban planning and sustainable development. An efficient public transport system encourages a more compact and densified urban development pattern by encouraging the location of activities and housing in close proximity to bus routes. This trend reduces urban sprawl and contributes to more efficient land use, resulting in more compact cities with better integrated services [63].
From an SDG perspective, public bus transport not only contributes to urban mobility, but also plays a key role in building more sustainable cities. By reducing demand for car-dedicated road infrastructure such as parking and new roads, the bus frees up urban space and encourages investment in active transport modes such as cycling and walking. Integrating public transport with cycleway and pavement networks [64] promotes healthier lifestyles and reduces car dependency, contributing to cleaner, more liveable and resilient cities in the long term [65]. However, the public bus transport sector has experienced a significant contraction as a consequence of the COVID-19 pandemic [66]. Social distancing measures and reduced vehicle capacity led to a drastic decrease in transport demand, resulting in considerable economic losses for companies in the sector [67]. The results of our study, based on the analysis of ticket sales data, corroborate this trend. In medium-sized cities such as Cáceres, a reduction of more than half in the number of users was observed during the year 2020. Despite a gradual recovery, by 2022 demand had not yet fully recovered, reaching only about 75% of pre-pandemic levels. Despite the significant decline in demand during the early years of the pandemic, a gradual recovery trend in the use of public bus transportation has been observed in the inter-urban area of Cáceres. This recovery can be attributed to the population's need for mobility, despite private transportation alternatives. Although some users have resorted to private vehicles, public transport remains an essential option for many [68]. The study developed in this article, covering a four-year period (2019-2022), allows for a broader comparison before and after the health crisis, complementing previous research that focused on shorter periods of confinement and de-escalation [34] or on long-term analyses [33].
Finally, the use of Geographic Information Systems (GIS) tools [50], has allowed our research to identify patterns of mobility and public transport use before, during and after the pandemic [69]. These spatial analyses are essential to understand the changes in the mobility habits of the population and, consequently, to design more efficient transport policies adapted to the new demands. For example, there has been a significant increase in demand for bus lines connecting central areas with peripheral neighbourhoods, coinciding with the reactivation of social and cultural activities.
5. Conclusions
The main objective of this research was to determine the impact of the COVID-19 pandemic on the mobility habits of regular users of urban public transport by bus in a medium-sized Spanish city, taking as a reference the number of tickets sold and the different connecting lines between different points of the city. In addition, the aim was to identify a common pattern with the interurban public transport service in the metropolitan area of influence of the city studied (which is located in a rural and demographically long-lived area). The search for this trend together with the implementation of GIS tools, have attempted to advance in the description of the evolution of the mobility behaviour of users.
The analysis of the main urban public transport lines reveals a generalized decrease in demand during the COVID-19 pandemic (due to both health restrictions and fear of contagion), followed by a gradual recovery. This fact highlights the vulnerability of public transport to health crises. Comparative analyses between urban and interurban transport show significant differences in their post-pandemic recovery patterns. Although both modes share common trends, such as greater resilience in lines with higher initial demand, urban transport has shown a more accelerated and homogeneous recovery. This disparity could be explained by the greater frequency and geographic coverage of urban service, which makes it a more attractive option for daily commuting. Interurban transport, on the other hand, shows a more seasonal demand and less dependence on users, which could explain a slower and more heterogeneous recovery.
Likewise, the scarcity of previous research that has specifically evaluated the impact of the pandemic in rural areas of low population density significantly limits the possibility of establishing robust comparisons and generalizing the findings obtained. The authors suggest that future research should broaden the spectrum of analysis, incorporating other alternative modes of transport in inter-urban settings and considering sociodemographic variables of users, such as age, sex, and socioeconomic status, among others, to obtain a more complete profile of the impact of the pandemic on the mobility of these populations.
Finally, the measures implemented by local authorities, such as improving the frequency of services and reducing fares, have been fundamental in mitigating the impact of the pandemic and stimulating the recovery of demand. These results reaffirm the essential role of public transport as a tool to promote social equity and environmental sustainability, contributing to the creation of healthier and more liveable cities. For all these reasons, it is considered essential to continue investing in public policies that promote the use of public transport (more efficient and equitable) in cities, to the detriment of other more polluting and less affordable means of travel.
Author Contributions
M.J.-E. and R.G.E. conceived and designed the research. J.G.V. performed the calculations with SIG and edited the maps with ArcGIS. M.J.-E., J.M.V.N., R.G.-E. and J.G.V. wrote and revised the paper. M.J.-E., R.G.-E. and J.G.V. made the formal analysis and supervised the paper. All authors have read and agreed to the published version of the manuscript.
Funding
This publication has been made possible thanks to funding granted by the Consejería de Economía, Ciencia y Agenda Digital de la Junta de Extremadura, and by the European Regional Development Fund of the European Union through the contribution to the MATERIA research group under reference TRP014.
Data Availability Statement
The data presented in this study are available on request from the corresponding author. The data are not publicly available due to ethical restrictions.
Acknowledgments
We would like to formally express our gratitude to the technical staff of the Department of Public Services and Mobility of the City Council of Cáceres, as well as the Directorate General of Mobility and Transport of the Regional Government of Extremadura. Special recognition is due to César Mateos Vicente and Francisco Javier Prieto Rodríguez for their kind attention.
Conflicts of Interest
The authors declare no conflicts of interest
Appendix A
The following list details the urban bus transportation lines operating in the study area. Each route plays a crucial role in the connectivity of all neighbourhoods, including the city's suburbs, providing transportation and improving mobility. A breakdown of the existing routes is presented, including specific details on their length, number of stops, etc.
Line 1: Plaza Obispo Galarza - Aldea Moret. It has a total length of 9.7 kilometres and runs from approximately the midpoint of the city, connecting with the mining district of the city, Aldea Moret. Throughout its route it has a total of 19 stops.
Line 2: Mejostilla - Espíritu Santo. It is one of the lines that best connects the periphery of the city with the nerve center of the city, having a length of 15.4 km and a total of 41 stops distributed from the neighborhood of the North Mejostilla, through Pinilla, the center of the city, to the neighborhood of Espiritu Santo.
Line 3: Nuevo Cáceres - University Hospital. As the name itself indicates, it connects the neighbourhood of Nuevo Cáceres with the university hospital complex of Cáceres located at the entrance of the A-58 towards Cáceres - Trujillo. This line facilitates the arrival of patients to the hospital as it passes through the centre of the city. In addition, university students can make use of this line as it accesses the city campus in a hidden way. This line has an extension of 20.5 km with a total of 41 stops.
Line 4: El Junquillo - CEFOT (Army Troop Training Centre Nº1). This line has 51 stops in its 95 km that connects the western district of the city, El Junquillo, with several surrounding neighbourhoods that are far from the city centre, such as Ceres Golf or Valdesalor. In addition, this line helps aspiring soldiers who stay at CEFOT during their training period to have access to the services and goods provided by the city on their days off.
Line 5: Las Capellanías Industrial Park - Charca Musia Industrial Park. The two large industrial estates of the city are connected by line 5, which runs from the northwest to the southeast, crossing the entire city. This line has a total of 42 stops along a 31 km route, but its route is modified on weekends and therefore there are differences between school days and non-teaching days.
Line 6: Plaza Obispo Galarza - Residencial Universidad. This is one of the shortest lines in terms of number of stops, with only 20 stops along its 11.7 km route. It connects the area of Obispo Galarza, close to the historical part of the city, and the residential area of the university, which is located on the northern side of the mountain of the city known as Sierra de la Mosca.
Line 7: Residential El Arco - Casa Plata. It has a total of 42 stops in an extension of 15.2 km in length that runs through the western part of the city to the southeast connecting the centre with the neighbourhoods of R-66 and the new neighbourhood in extension of Casa Plata.
Line 8: Barrio de San Pedro - Cáceres el Viejo. This line, together with line 2, are the two lines that best connect the outskirts of the city with the city centre, as their route passes through a large number of densely populated neighbourhoods. This line runs from the north to the south of the city with a number of 50 stops in its 24 kilometres.
Rincón de Ballesteros Service. This is an on-demand service, i.e., the minimum condition for this service to be provided is that there are two users. This service is provided only on Mondays, Wednesdays and Fridays, excluding holidays, departing from Rincón de Ballesteros at 08:30h and at 14:30h from Cáceres.
Arroyo - Malpartida Station Service. In this line the same happens as in the previous one, there must be at least two users for this service to be offered. This service is provided on Mondays, Wednesdays and Fridays, except holidays, departing from this district at 10:00h and at 15:30h from Cáceres.
Mejostilla Backup Line: Plaza de Toros - Campus. This is a recently created line to reinforce the urban transport to go to the university campus and above all to connect in a better way the neighbourhoods of Mejostilla, Gredos and Cáceres el Viejo with the faculties. This line includes 49 stops and has a length of 19.1 and 8.4 kilometres respectively, which are related to the two services offered by this line.
Fair Service. This is a special urban transport service that is available to users when some kind of musical or cultural event, etc., is held at the Cáceres fairgrounds. Its route is changeable since it depends on the administration where to locate the starting point of the route.
Campus Line: Plaza de América - Campus. This line is the one that accesses the university campus of Cáceres, facilitating the arrival of students to the respective faculties. It is located in the centre of the city, Plaza América, where a significant number of students live less than a 10-minute walk from this stop. This line has 21 stops with a length of 10.8 km.
Campus Backup Line: Isabel de Moctezuma Avenue - Campus. This service is in line with the previous one since it is a reinforcement of the main one, its destination and purpose is the same, with the difference that its terminus is located on Isabel de Moctezuma Avenue, another of the avenues/areas where a large number of students reside. This line has 31 stops along its 14-kilometer route.
References
- Abu-Rayash, A.; Dincer, I. Analysis of Mobility Trends during the COVID-19 Coronavirus Pandemic: Exploring the Impacts on Global Aviation and Travel in Selected Cities. Energy Res Soc Sci 2020, 68. [Google Scholar] [CrossRef] [PubMed]
- Rankavat, S.; Gurram, A.R.; Pawar, D.S.; Kushwaha, V. Study of COVID-19 Impact on Users’ Perception for Transport Modes Choice in India. IATSS Research 2023, 47, 73–83. [Google Scholar] [CrossRef]
- König, A.; Dreßler, A. A Mixed-Methods Analysis of Mobility Behavior Changes in the COVID-19 Era in a Rural Case Study. European Transport Research Review 2021, 13. [Google Scholar] [CrossRef] [PubMed]
- Echaniz, E.; dell’Olio, L.; Ibeas, Á. Modelling Perceived Quality for Urban Public Transport Systems Using Weighted Variables and Random Parameters. Transp Policy 2018, 67, 31–39. [Google Scholar] [CrossRef]
- Paiva, S.; Corcoba, V.; Mourao, F.; Paneda, X.G.; Melendi, D.; Garcia, R. Analysis of Mobility Changes Caused by COVID-19 in a Context of Moderate Restrictions Using Data Collected by Mobile Devices. IEEE Access 2022, 10, 8906–8915. [Google Scholar] [CrossRef]
- Tapiador, L.; Gomez, J.; Vassallo, J.M. Exploring the Relationship between Public Transport Use and COVID-19 Infection: A Survey Data Analysis in Madrid Region. Sustain Cities Soc 2024, 104. [Google Scholar] [CrossRef]
- Muley, D.; Shahin, M.; Dias, C.; Abdullah, M. Role of Transport during Outbreak of Infectious Diseases: Evidence from the Past. Sustainability 2020, 12, 7367. [Google Scholar] [CrossRef]
- Burdzik, R. Probability of transmission of SARS-CoV-2 virus pathogens in long-distance passenger transport. Archives of Transport 2023, 68, 21–39. [Google Scholar] [CrossRef]
- Das, S.; Boruah, A.; Banerjee, A.; Raoniar, R.; Nama, S.; Maurya, A.K. Impact of COVID-19: A Radical Modal Shift from Public to Private Transport Mode. Transp Policy 2021, 109, 1–11. [Google Scholar] [CrossRef]
- Wang, K.-Y. How Change of Public Transportation Usage Reveals Fear of the SARS Virus in a City. PLoS Pathog 2020, 16. [Google Scholar] [CrossRef]
- Ferguson, N.M.; Cummings, D.A.T.; Cauchemez, S.; Fraser, C.; Riley, S.; Meeyai, A.; Iamsirithaworn, S.; Burke, D.S. Strategies for Containing an Emerging Influenza Pandemic in Southeast Asia. Nature 2005, 437, 209–214. [Google Scholar] [CrossRef]
- Troko, J.; Myles, P.; Gibson, J.; Hashim, A.; Enstone, J.; Kingdon, S.; Packham, C.; Amin, S.; Hayward, A.; Van-Tam, J.N. Is Public Transport a Risk Factor for Acute Respiratory Infection? BMC Infect Dis 2011, 11. [Google Scholar] [CrossRef] [PubMed]
- Cartenì, A.; Di Francesco, L.; Henke, I.; Marino, T.V.; Falanga, A. The Role of Public Transport during the Second COVID-19 Wave in Italy. Sustainability 2021, 13, 11905. [Google Scholar] [CrossRef]
- Chinazzi, M.; Davis, J.T.; Ajelli, M.; Gioannini, C.; Litvinova, M.; Merler, S.; Pastore y Piontti, A.; Mu, K.; Rossi, L.; Sun, K.; et al. The Effect of Travel Restrictions on the Spread of the 2019 Novel Coronavirus (COVID-19) Outbreak. [CrossRef] [PubMed]
- Rasca, S.; Markvica, K.; Ivanschitz, B.P. Impacts of COVID-19 and Pandemic Control Measures on Public Transport Ridership in European Urban Areas – The Cases of Vienna, Innsbruck, Oslo, and Agder. Transp Res Interdiscip Perspect 2021, 10. [Google Scholar] [CrossRef] [PubMed]
- Martin, S.; Bergmann, J. (Im)Mobility in the Age of COVID-19. International Migration Review 2021, 55, 660–687. [Google Scholar] [CrossRef]
- Governo Italiano Registrato Alla Corte Dei Conti Il 9 de Marzo de 2020 Ufficio Controllo Atti PCM Ministeri Della Giustizia e Degli Affari Esteri e Della Cooperazione Internazionale.
- République França Décret 2020-293du 23 Mars 2020 Prescrivant Les Mesures Générales Nécessaires Pour Faire Face à L’épi-Démie de COVID-19 Dans Le Cadre de L’état D’urgence Sanitaire 2020.
- Laverty, A.A.; Millett, C.; Majeed, A.; Vamos, E.P. COVID-19 Presents Opportunities and Threats to Transport and Health. J R Soc Med 2020, 113, 251–254. [Google Scholar] [CrossRef]
- Poder Judicial Real Decreto 463/2020, de 14 de Marzo, Por El Que Se Declara El Estado de Alarma Para La Gestión de La Situación de Crisis Sanitaria Ocasionada Por El COVID-19. 2020.
- Linka, K.; Peirlinck, M.; Sahli Costabal, F.; Kuhl, E. Outbreak Dynamics of COVID-19 in Europe and the Effect of Travel Restrictions. Computer Methods in Biomechanics and Biomedical Engineering 2020, 23, 710–717. [Google Scholar] [CrossRef]
- Comisión Europea Viajes Durante La Pandemia de Coronavirus.
- Mogaji, E. Impact of COVID-19 on Transportation in Lagos, Nigeria. Transp Res Interdiscip Perspect 2020, 6. [Google Scholar] [CrossRef]
- Badr, H.S.; Du, H.; Marshall, M.; Dong, E.; Squire, M.M.; Gardner, L.M. Association between Mobility Patterns and COVID-19 Transmission in the USA: A Mathematical Modelling Study. Lancet Infect Dis 2020, 20, 1247–1254. [Google Scholar] [CrossRef]
- Gutiérrez, A.; Miravet, D.; Domènech, A. COVID-19 and Urban Public Transport Services: Emerging Challenges and Research Agenda. Cities Health 2021, 5, S177–S180. [Google Scholar] [CrossRef]
- (I) Ministerio de la Presidencia (I) Ministerio de La Presidencia, R. Con Las C. y M.D. Real Decreto 463/2020, 14 de Marzo, Por El Que Se Declara El Estado de Alarma Para La Gestión de La Situación de Crisis Sanitaria Ocasionada Por El COVID-19. 2020, Núm. 67.; 2020.
- Seguridad Nacional. Gabinete de la Presidencia El Gobierno Decreta El Estado de Alarma Para Hacer Frente a La Expansión de Coronavirus COVID-19. 2020.
- Musselwhite, C.; Avineri, E.; Susilo, Y. Restrictions on Mobility Due to the Coronavirus Covid19: Threats and Opportunities for Transport and Health. J Transp Health 2021, 20. [Google Scholar] [CrossRef]
- Vich, G.; Gutiérrez, A.; Delclòs-Alió, X.; Tomàs-Porres, J.; Miravet, D. Presence of Tourists and Perceived Safety from COVID-19 among Local Bus Users: Evidence from a Mediterranean City. Transp Res Interdiscip Perspect 2022, 14. [Google Scholar] [CrossRef] [PubMed]
- Oliver, N.; Barber, X.; Roomp, K.; Roomp, K. Assessing the Impact of the COVID-19 Pandemic in Spain: Large-Scale, Online, Self-Reported Population Survey. J Med Internet Res 2020, 22. [Google Scholar] [CrossRef] [PubMed]
- Díaz-Méndez, C.; Ramos-Truchero, G. From the Economic Crisis to the COVID-19 Pandemic in Spain: The Challenges for Healthy Eating in Times of Crisis. Int J Gastron Food Sci 2023, 31. [Google Scholar] [CrossRef] [PubMed]
- Al-Akioui, A.; Monzon, A. Spatial Analysis of COVID-19 Pandemic Impacts on Mobility in Madrid Region. Sustainability 2023, 15, 14259. [Google Scholar] [CrossRef]
- Dols, P.M.; Crespo, H.G. Impact of COVID-19 on Urban Public Transport in Medium-Sized Spanish Cities. Cuadernos Geograficos 2024, 63, 5–22. [Google Scholar] [CrossRef]
- Aloi, A.; Alonso, B.; Benavente, J.; Cordera, R.; Echániz, E.; González, F.; Ladisa, C.; Lezama-Romanelli, R.; López-Parra, Á.; Mazzei, V.; et al. Effects of the COVID-19 Lockdown on Urban Mobility: Empirical Evidence from the City of Santander (Spain). Sustainability 2020, 12, 3870. [Google Scholar] [CrossRef]
- Fernández Pozo, R.; Wilby, M.R.; Vinagre Díaz, J.J.; Rodríguez González, A.B. Data-Driven Analysis of the Impact of COVID-19 on Madrid’s Public Transport during Each Phase of the Pandemic. Cities 2022, 127. [Google Scholar] [CrossRef]
- González, A.B.R.; Wilby, M.R.; Díaz, J.J.V.; Pozo, R.F. Characterization of COVID-19’s Impact on Mobility and Short-Term Prediction of Public Transport Demand in a Mid-Size City in Spain. Sensors 2021, 21, 6574. [Google Scholar] [CrossRef]
- Orro, A.; Novales, M.; Monteagudo, Á.; Pérez-López, J.B.; Bugarín, M.R. Impact on City Bus Transit Services of the COVID-19 Lockdown and Return to the New Normal: The Case of A Coruña (Spain). Sustainability 2020, 12, 7206. [Google Scholar] [CrossRef]
- Linares-Unamunzaga, A.; Serrano-López, R.; Rojo-Arce, M. Impact on urban mobility of preventive measures against COVID-19 during the state of alarm. The particular case of a medium-sized city. 2021.
- Díaz de la Rosa, E. El Impacto de La Pandemia Del COVID-19 En El Transporte Público Regular de Pasajeros Por Carretera de Tenerife. 2021.
- Osorio Arjona, J. Analyzing Post-COVID-19 Demographic and Mobility Changes in Andalusia Using Mobile Phone Data. Sci Rep 2024, 14. [Google Scholar] [CrossRef]
- Zajfert, M. Urban Transport during the COVID-19 Pandemic: A Case Study of Poland. Public Transport 2024. [Google Scholar] [CrossRef]
- Jenelius, E.; Cebecauer, M. Impacts of COVID-19 on Public Transport Ridership in Sweden: Analysis of Ticket Validations, Sales and Passenger Counts. Transp Res Interdiscip Perspect 2020, 8. [Google Scholar] [CrossRef]
- Basso, F.; Frez, J.; Hernández, H.; Leiva, V.; Pezoa, R.; Varas, M. Crowding on Public Transport Using Smart Card Data during the COVID-19 Pandemic: New Methodology and Case Study in Chile. Sustain Cities Soc 2023, 96. [Google Scholar] [CrossRef] [PubMed]
- Lizana, M.; Choudhury, C.; Watling, D. Using Smart Card Data to Model Public Transport User Profiles in Light of the COVID-19 Pandemic. Travel Behav Soc 2023, 33. [Google Scholar] [CrossRef]
- Schiller, P.L.; Kenworthy, J. An Introduction to Sustainable Transportation: Policy, Planning and Implementation, 2nd ed.; Routledge: London, 2017. [Google Scholar] [CrossRef]
- Barbieri, D.M.; Lou, B.; Passavanti, M.; Hui, C.; Hoff, I.; Lessa, D.A.; Sikka, G.; Chang, K.; Gupta, A.; Fang, K.; et al. Impact of COVID-19 Pandemic on Mobility in Ten Countries and Associated Perceived Risk for All Transport Modes. PLoS One 2021, 16. [Google Scholar] [CrossRef]
- Creutzig, F. How Fuel Prices Determine Public Transport Infrastructure, Modal Shares and Urban Form. Urban Clim 2014, 10, 63–76. [Google Scholar] [CrossRef]
- Organización de las Naciones Unidas Objetivos de Desarrollo Sostenible. 2015.
- Gukalova, I. Pandemic Challenges for Transformation of Urban Environment and Public Spaces in Ukraine. 2024; ISBN 9783031439216. [Google Scholar] [CrossRef]
- Guerrero-Rodríguez, A.; Jiménez-Espada, M.; Gallego, J.A.G. Análisis de Movilidad Urbana En El Municipio de Villanueva de La Serena Durante La Pandemia COVID-19.
- Montañez, M.R. La Financiación Del Transporte Urbano: Un Reto Para Las Ciudades Españolas Del Siglo XXI. Investigaciones Europeas de Direccion y Economia de la Empresa 2014, 20, 1–4. [Google Scholar] [CrossRef]
- Allen; Allen [ According To.
- Litman, T.A.; Litman, T.; Steele, W.R. Land Use Impacts on Transport. How Land Use Factors Affect Travel Behavior. 2024.
- Union Internationale des Transports Publics El Transporte Público Es Seguro Frente a La COVID. 2020.
- Garcia-Ayllon, S. Impactos de La Pandemia En La Distribución Modal de La Movilidad Urbana y Sus Derivadas Medioambientales: El Caso Cartagena (España). 2023.
- D’Amato, G.; Cecchi, L.; D’Amato, M.; Annesi-Maesano, I. Climate Change and Respiratory Diseases. European Respiratory Review 2014, 23, 161–169. [Google Scholar] [CrossRef]
- Welle, B.; Kustar, A.; Hein Tun, T.; Albuquerque, C. Post-Pandemic, Public Transport Needs to Get Back on Track to Meet Global Climate Goals.
- Xylia, M.; Leduc, S.; Laurent, A.B.; Patrizio, P.; van der Meer, Y.; Kraxner, F.; Silveira, S. Impact of Bus Electrification on Carbon Emissions: The Case of Stockholm. J Clean Prod 2019, 209, 74–87. [Google Scholar] [CrossRef]
- Gutierrez Puebla, J. Indicadores de Accesibilidad En Transporte Publico En El Medio Rural: Una Propuesta Metodologica. Estud Geogr 1991, 52, 205–221. [Google Scholar] [CrossRef]
- Camarero, L.; Oliva, J. Exploring the Social Face of Urban Mobility: Daily Mobility as Part of the Social Structure in Spain. Int J Urban Reg Res 2008, 32, 344–362. [Google Scholar] [CrossRef]
- Berg, J.; Ihlström, J. The Importance of Public Transport for Mobility and Everyday Activities among Rural Residents. Soc Sci 2019, 8, 58. [Google Scholar] [CrossRef]
- Cervero, R. Linking Urban Transport and Land Use in Developing Countries. J Transp Land Use 2013, 6, 7–24. [Google Scholar] [CrossRef]
- Newman, P.; Kenworthy, J. Sustainability and cities: Overcoming automobile dependence. 1998.
- Banister, D. Inequality in Transport. Journal of the American Planning Association, Alexandrine Press, 2018; ISBN 978-0-906661-01-7. [Google Scholar]
- Salas-Zapata, L.; López-Ríos, J.M.; Gómez-Molina, S.; Franco-Moreno, D.; Martínez-Herrera, E. Healthy and Sustainable Cities: Strategies in the Search for Quality of Life. Revista Facultad Nacional de Salud Publica 2016, 34, 105–110. [Google Scholar] [CrossRef]
- Campisi, T.; Basbas, S.; Skoufas, A.; Akgün, N.; Ticali, D.; Tesoriere, G. The Impact of COVID-19 Pandemic on the Resilience of Sustainable Mobility in Sicily. Sustainability 2020, 12, 8829. [Google Scholar] [CrossRef]
- Porru, S.; Misso, F.E.; Pani, F.E.; Repetto, C. Smart Mobility and Public Transport: Opportunities and Challenges in Rural and Urban Areas. Journal of Traffic and Transportation Engineering (English Edition) 2020, 7, 88–97. [Google Scholar] [CrossRef]
- Jiménez-Espada, M.; Naranjo, J.M.V.; García, F.M.M. Identification of Mobility Patterns in Rural Areas of Low Demographic Density through Stated Preference Surveys. Applied Sciences 2022, 12, 10034. [Google Scholar] [CrossRef]
- Vega Naranjo, J.M.; González-Escobar, R.; Jiménez-Espada, M.; Vivas, J.G. Resilience of Interurban Public Transport and Impact of COVID-19 on Rural Connectivity in Sparsely Populated Regions. Land 2024, 13, 1778. [Google Scholar] [CrossRef]
Figure 1.
Methodology flowchart.
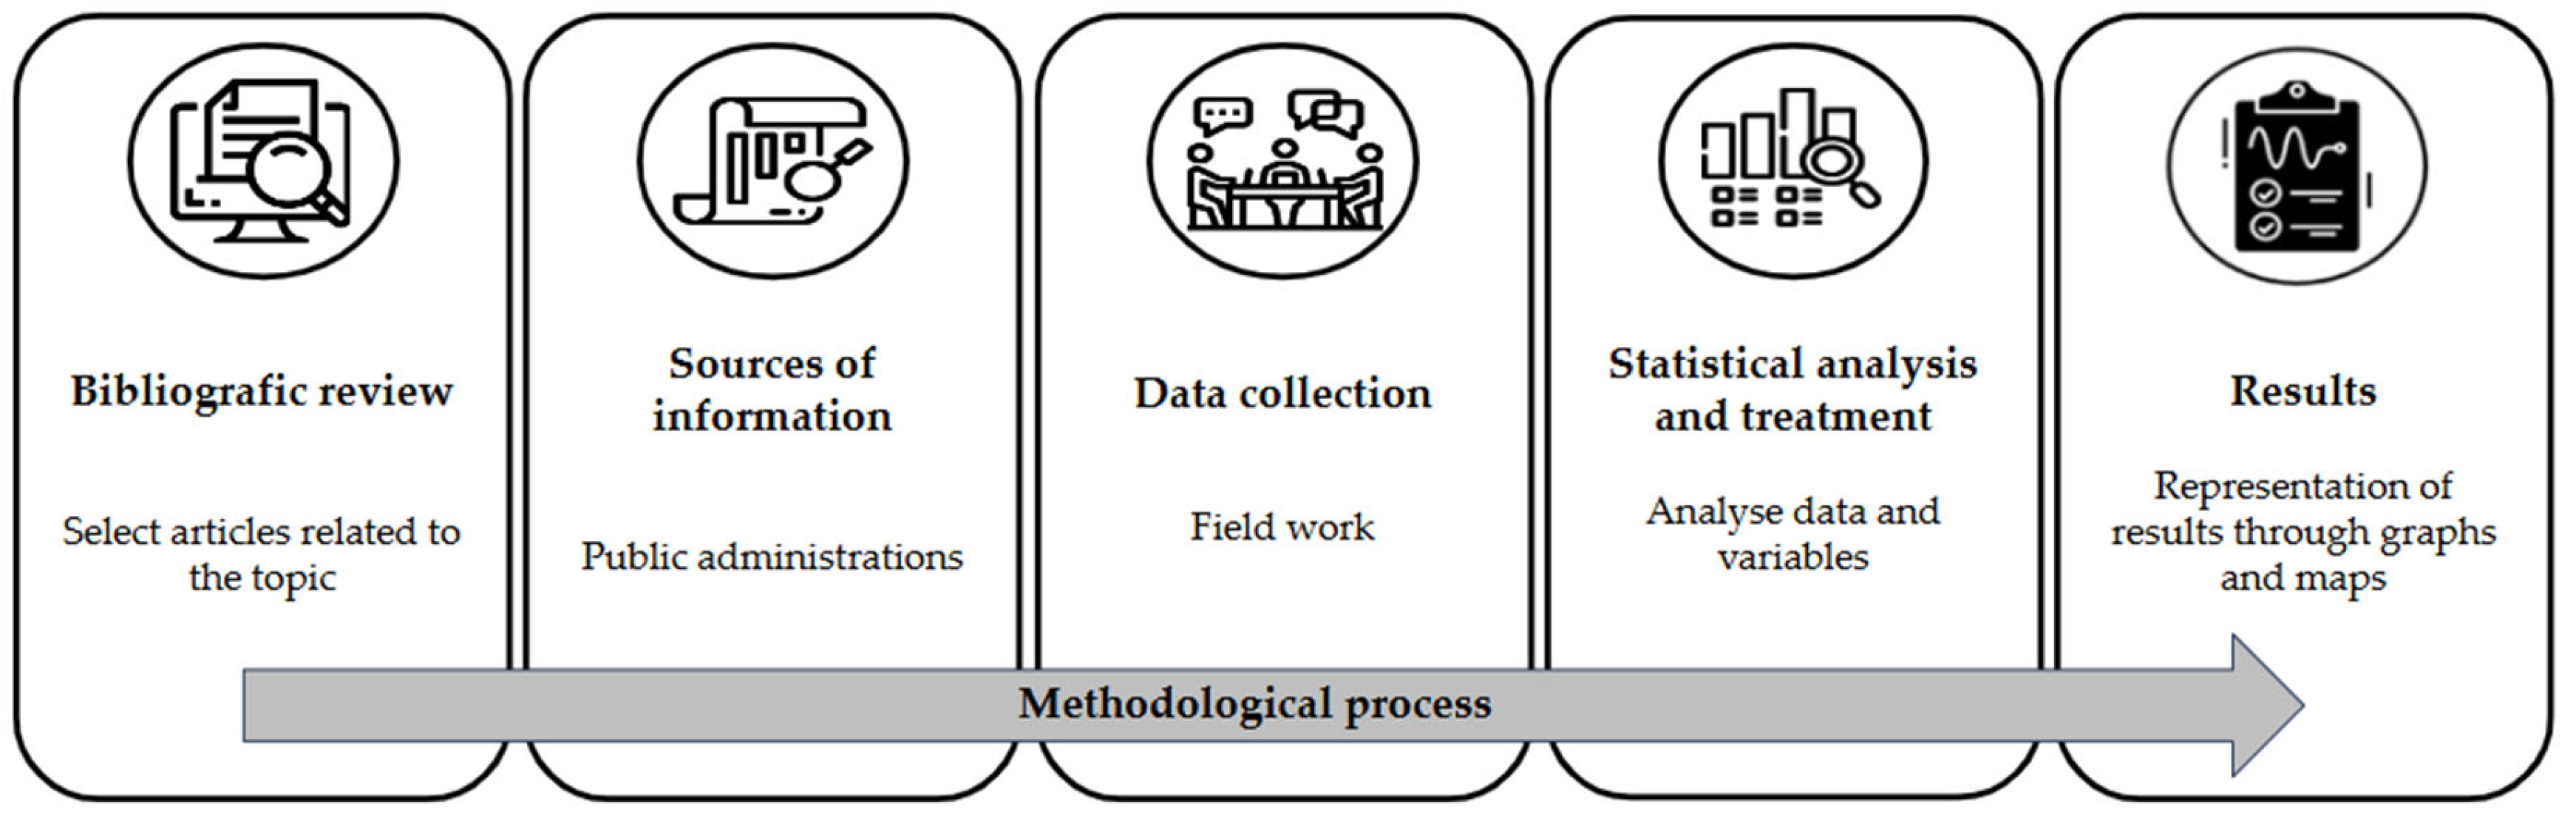
Figure 2.
Location map of the study area.
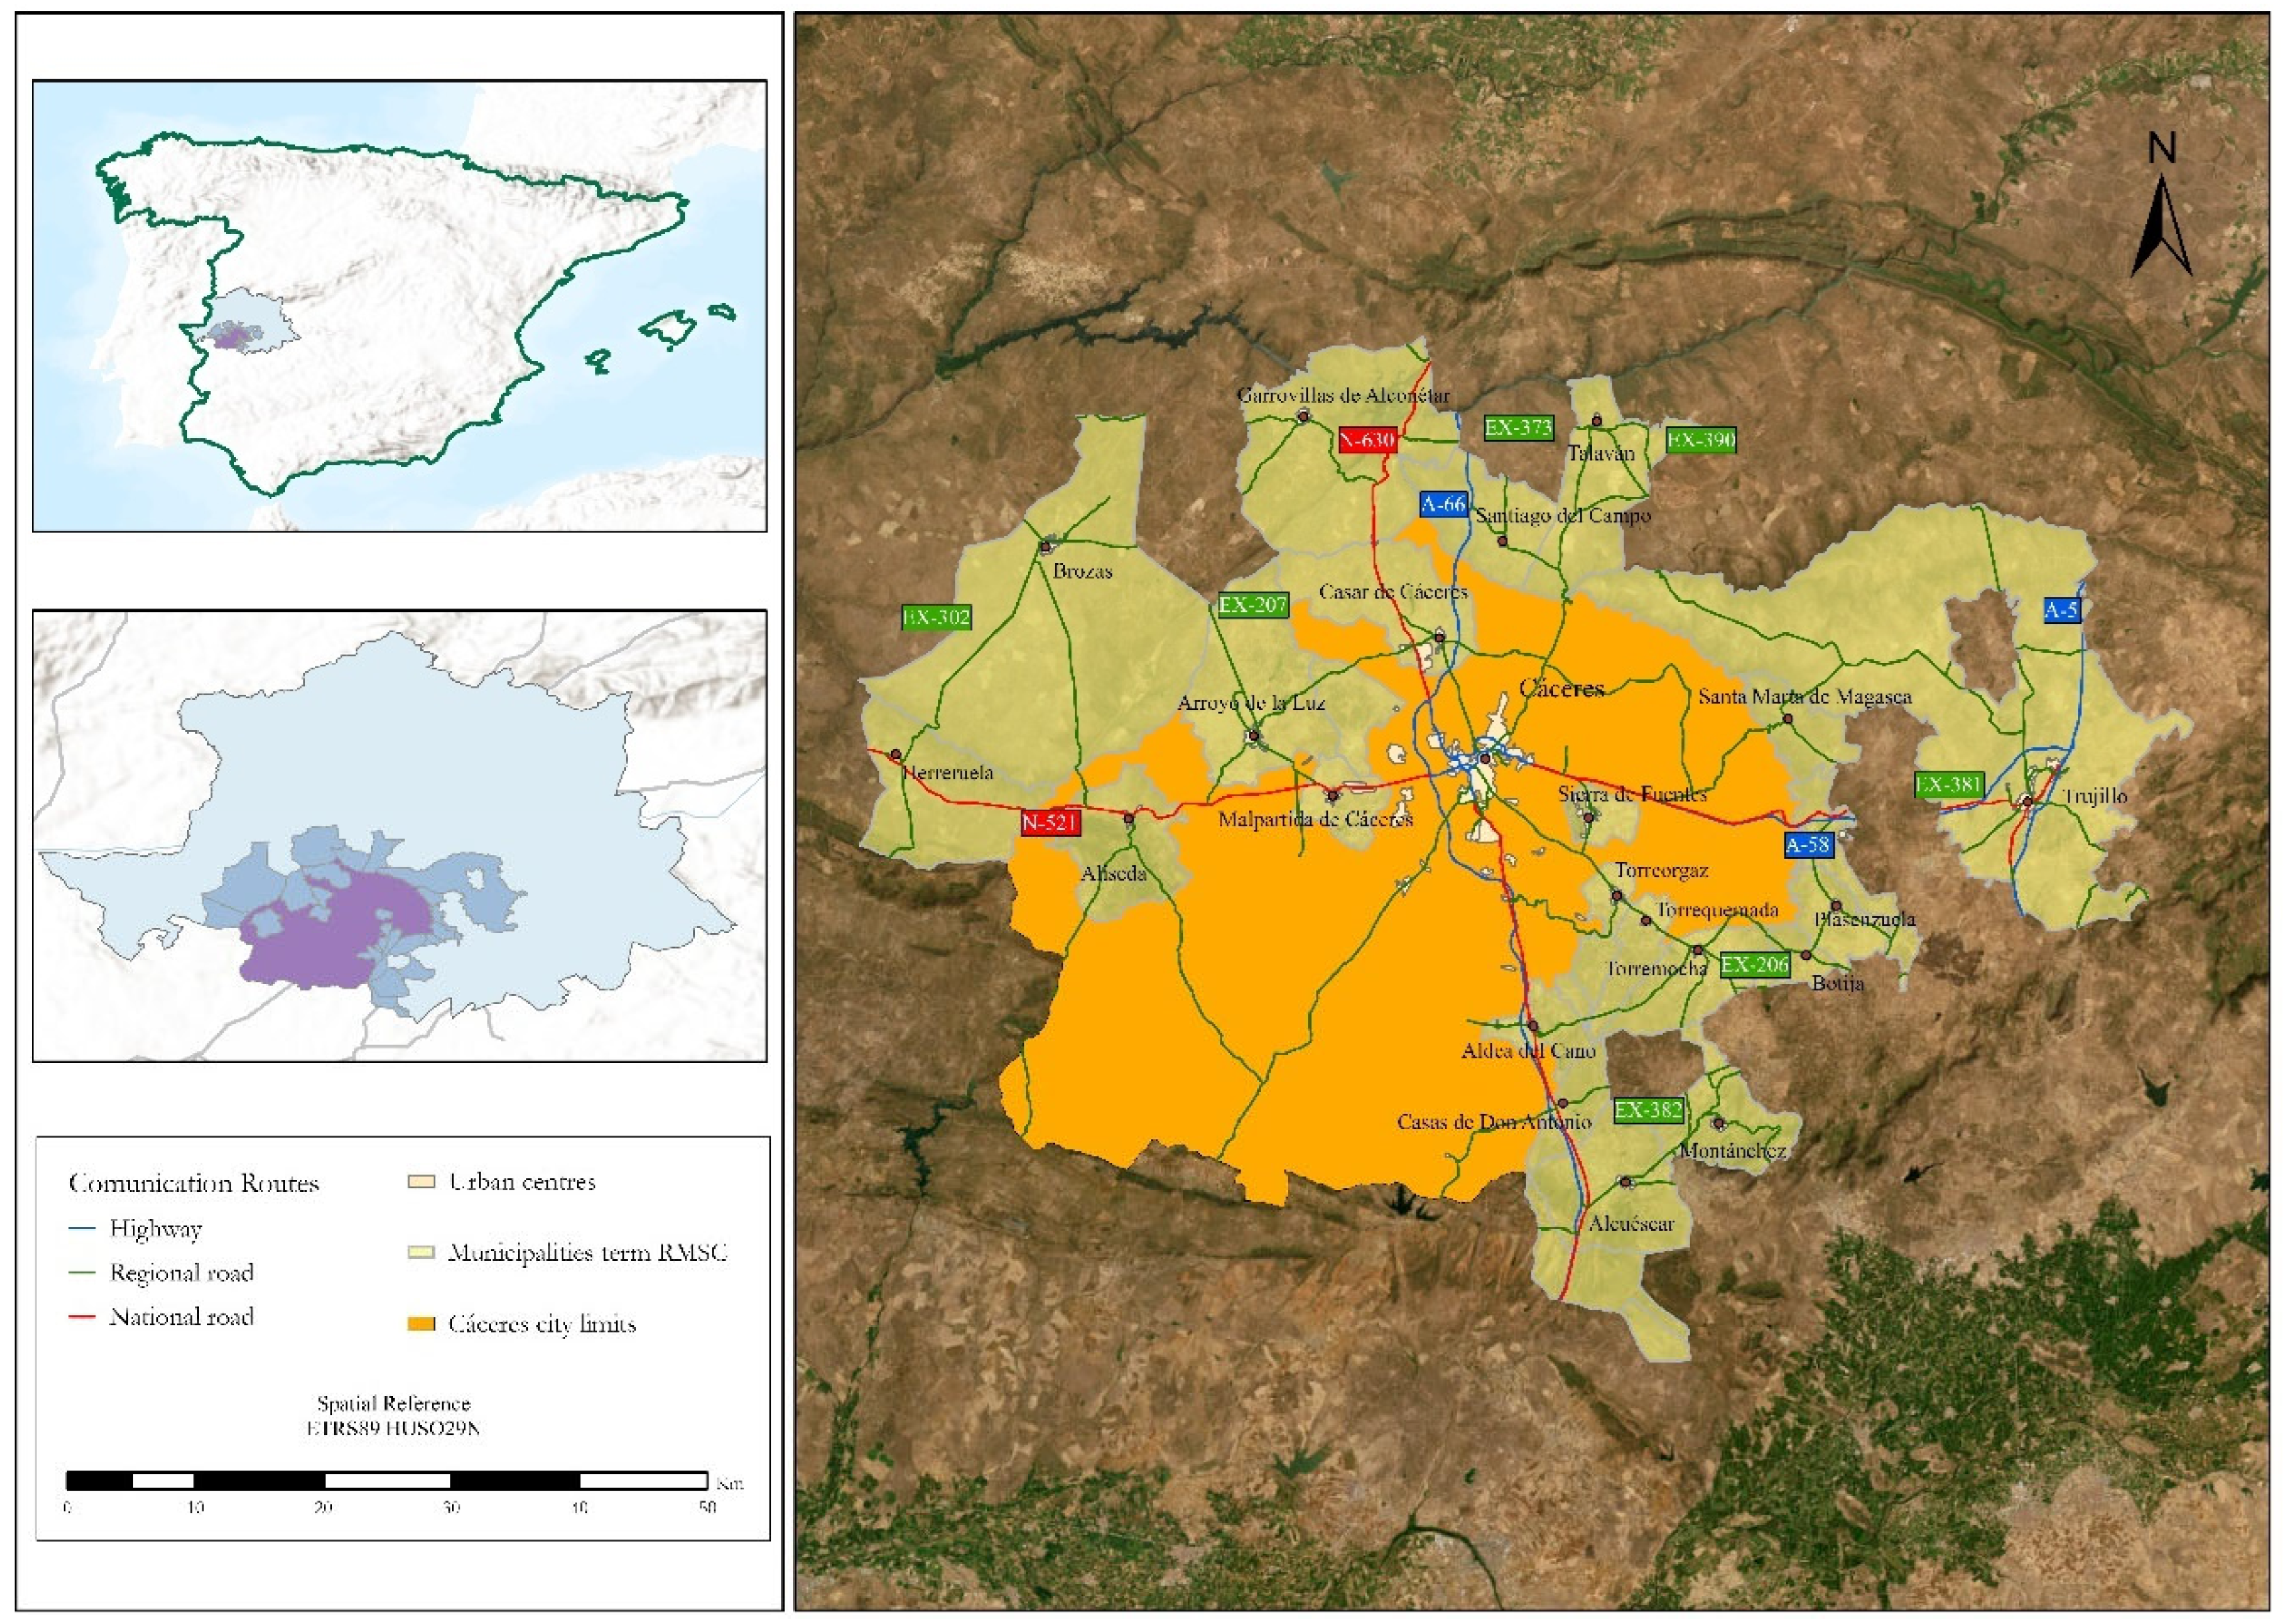
Figure 4.
Representation of the bus routes on the area of Cáceres.
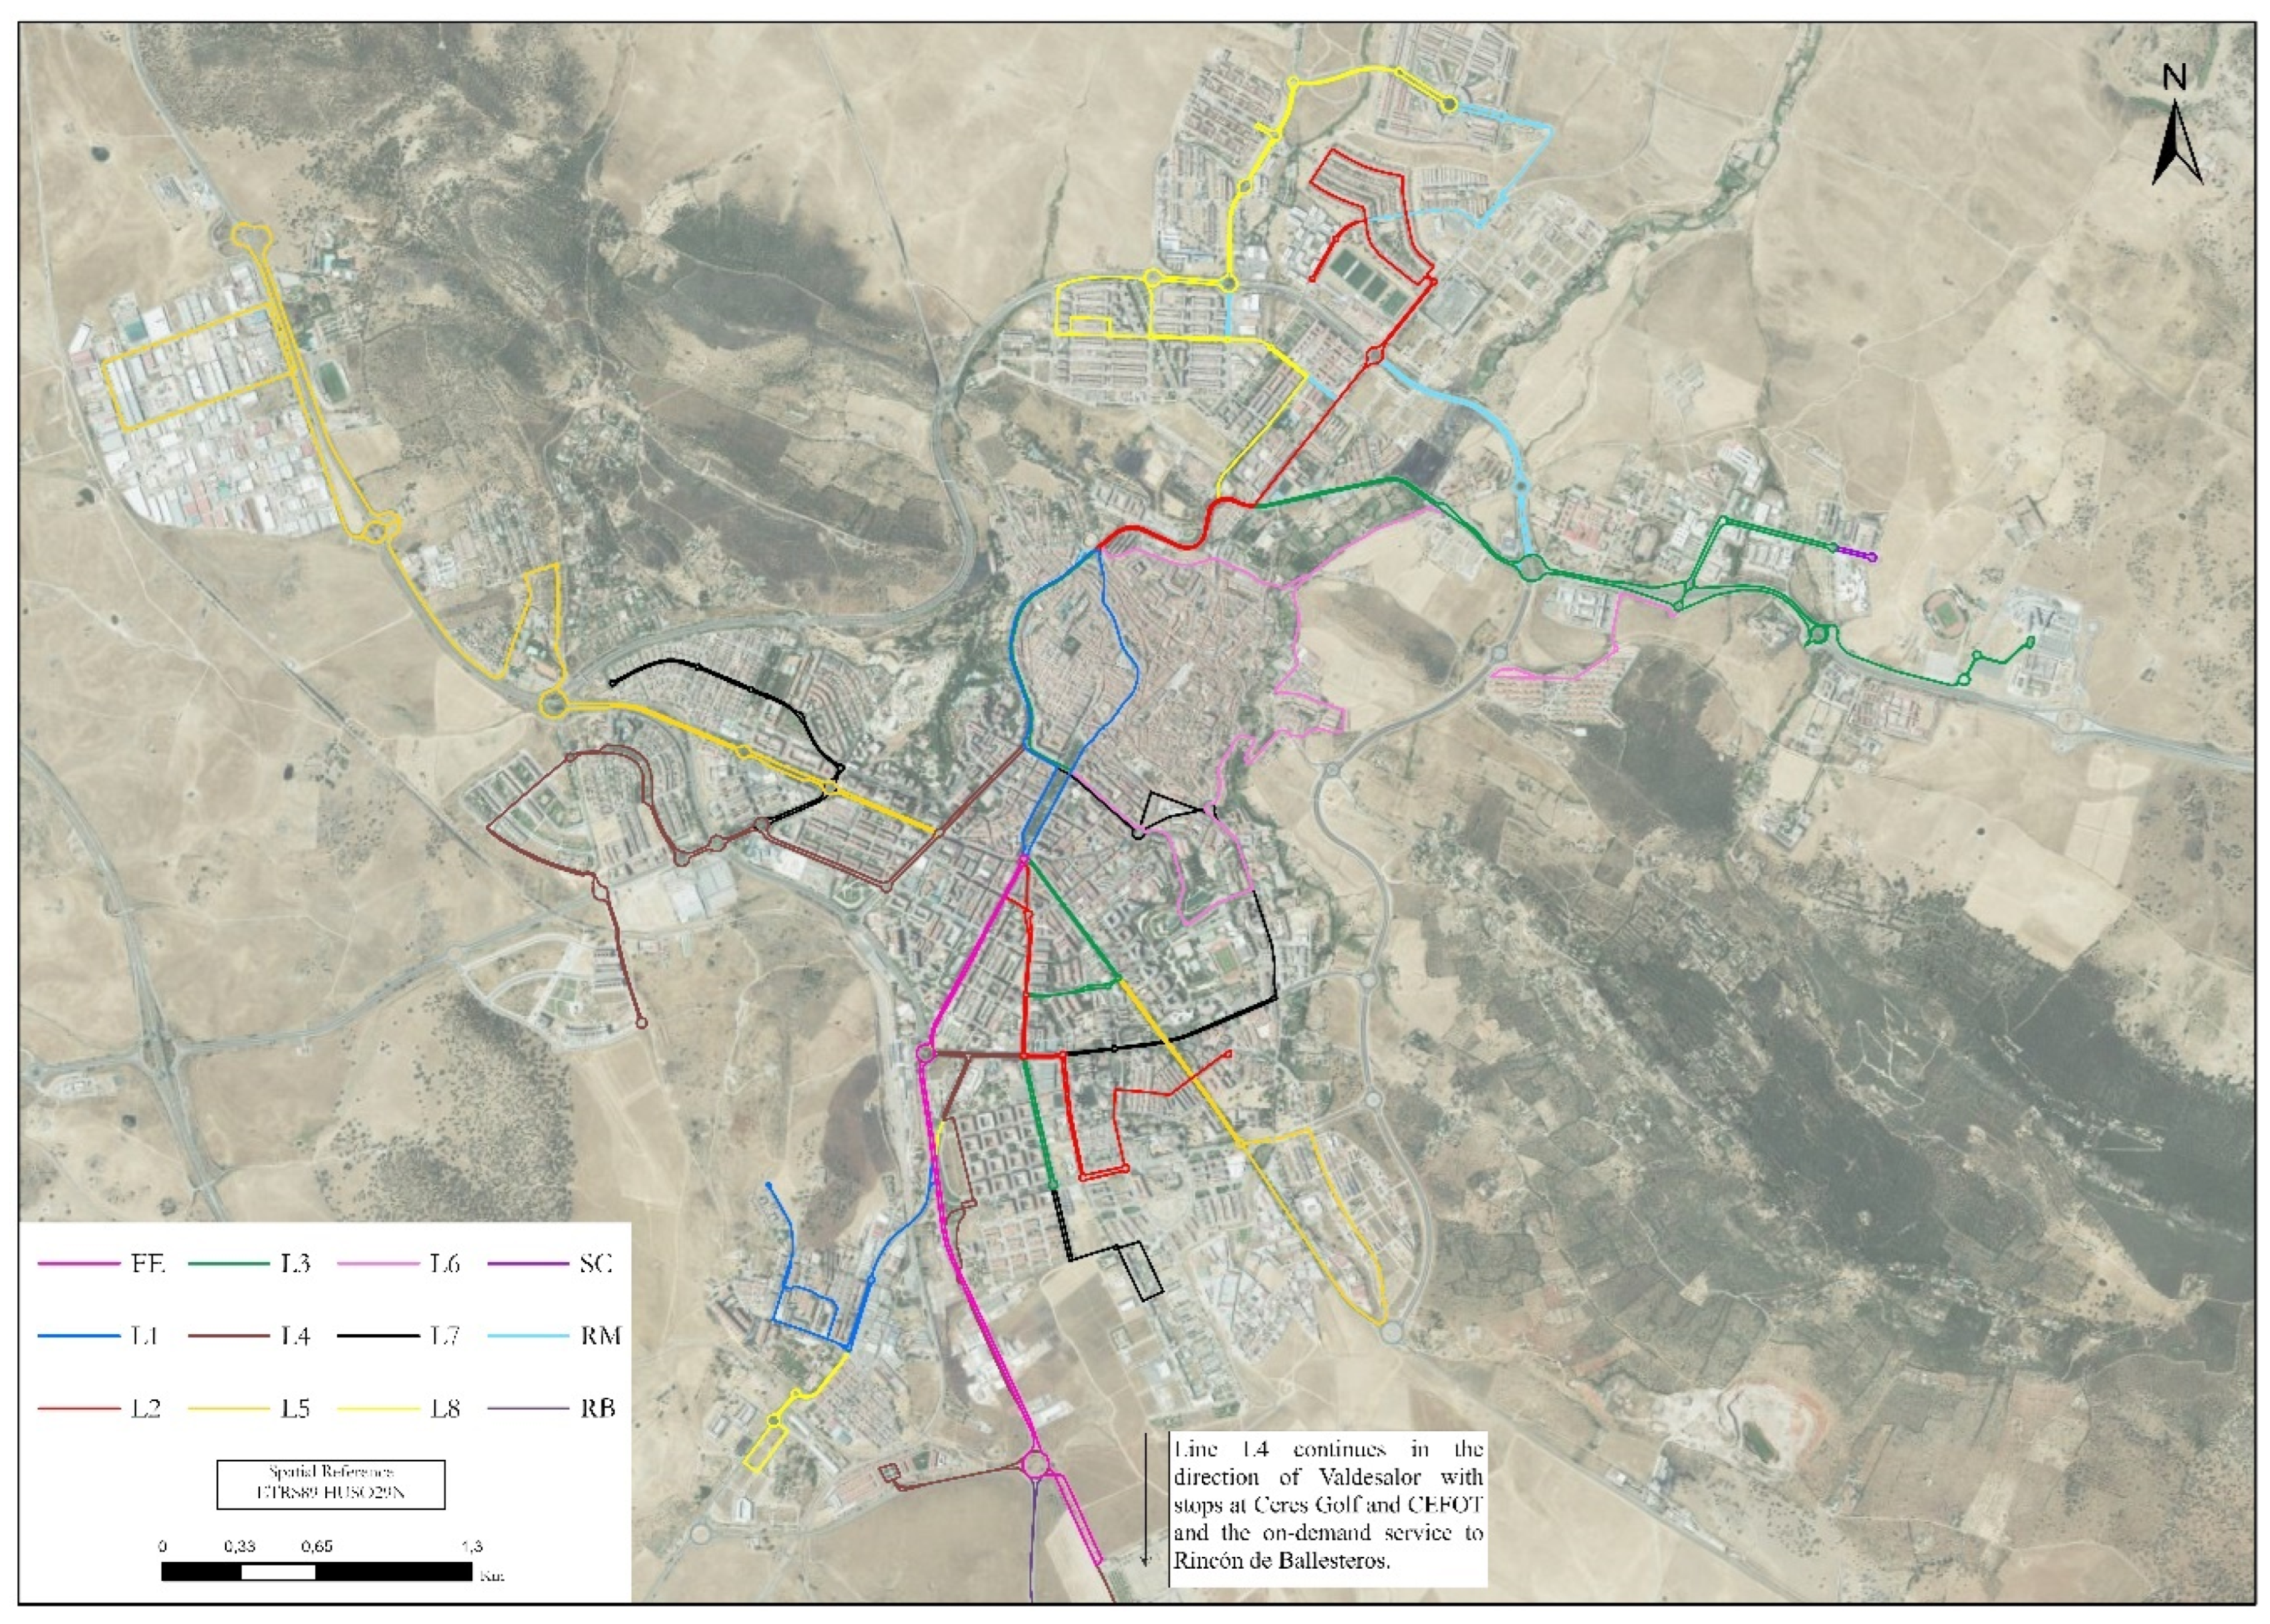
Figure 5.
Percentage of total tickets sold per year on each route compared to 2019.
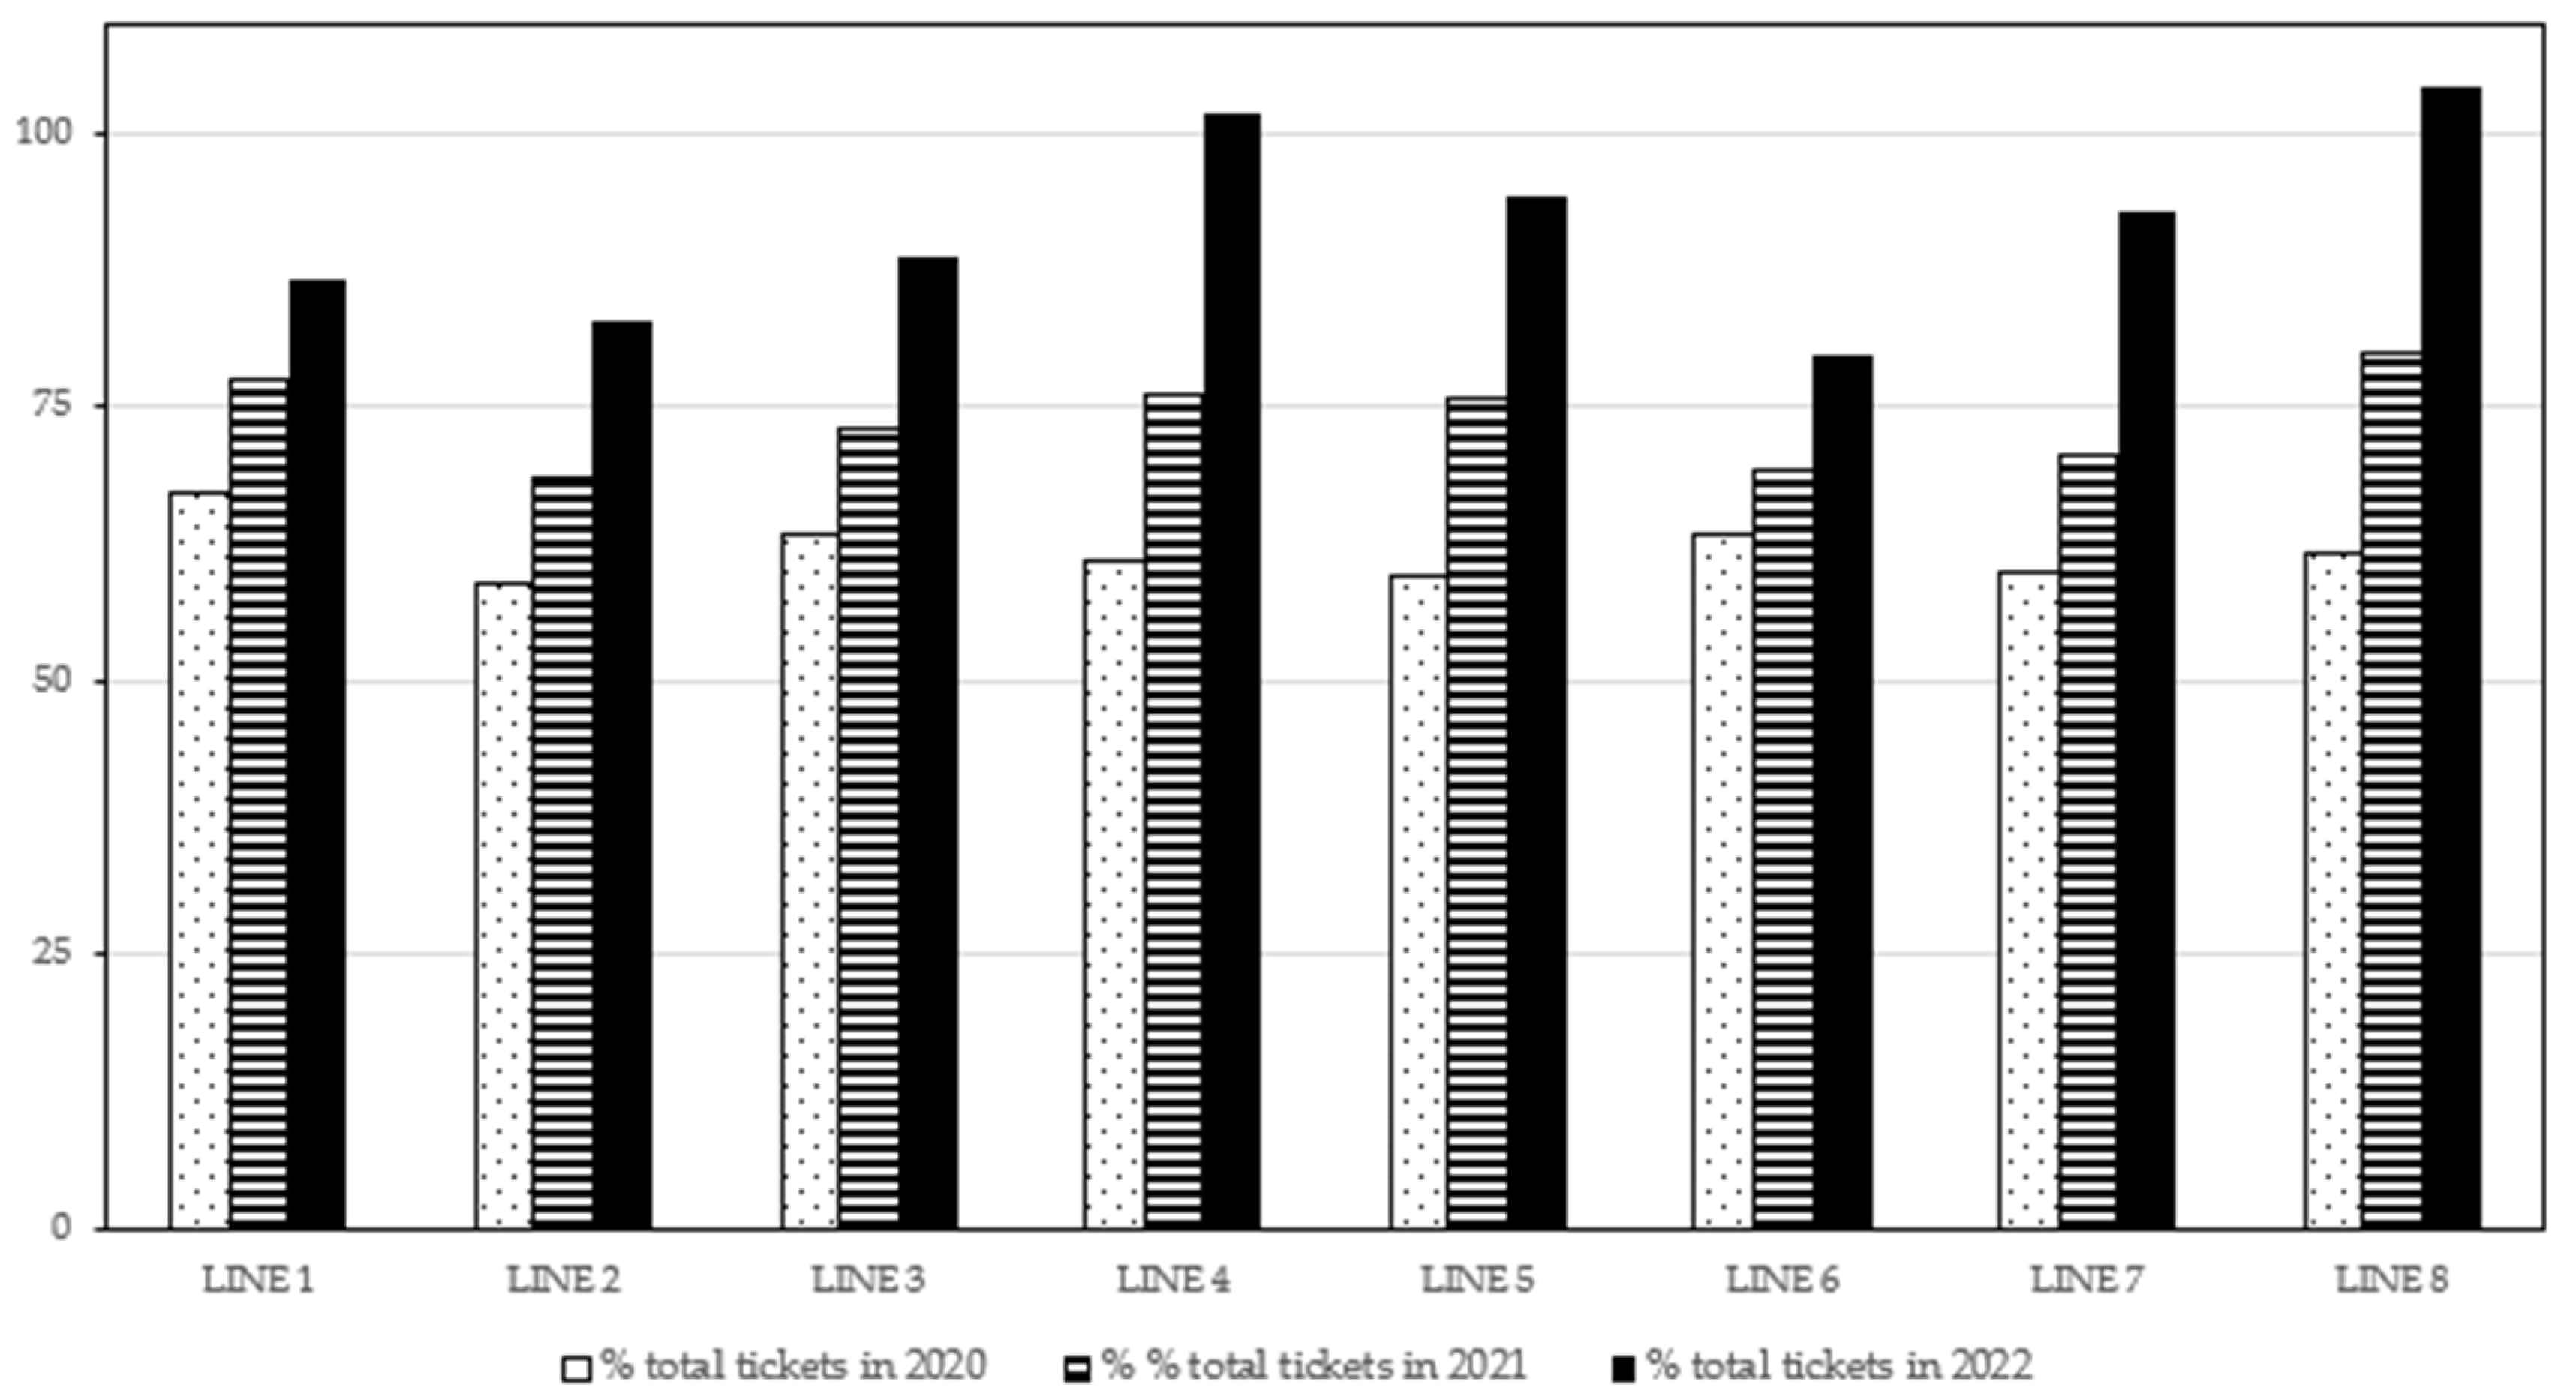
Figure 6.
Percentage of tickets sold per route each year.
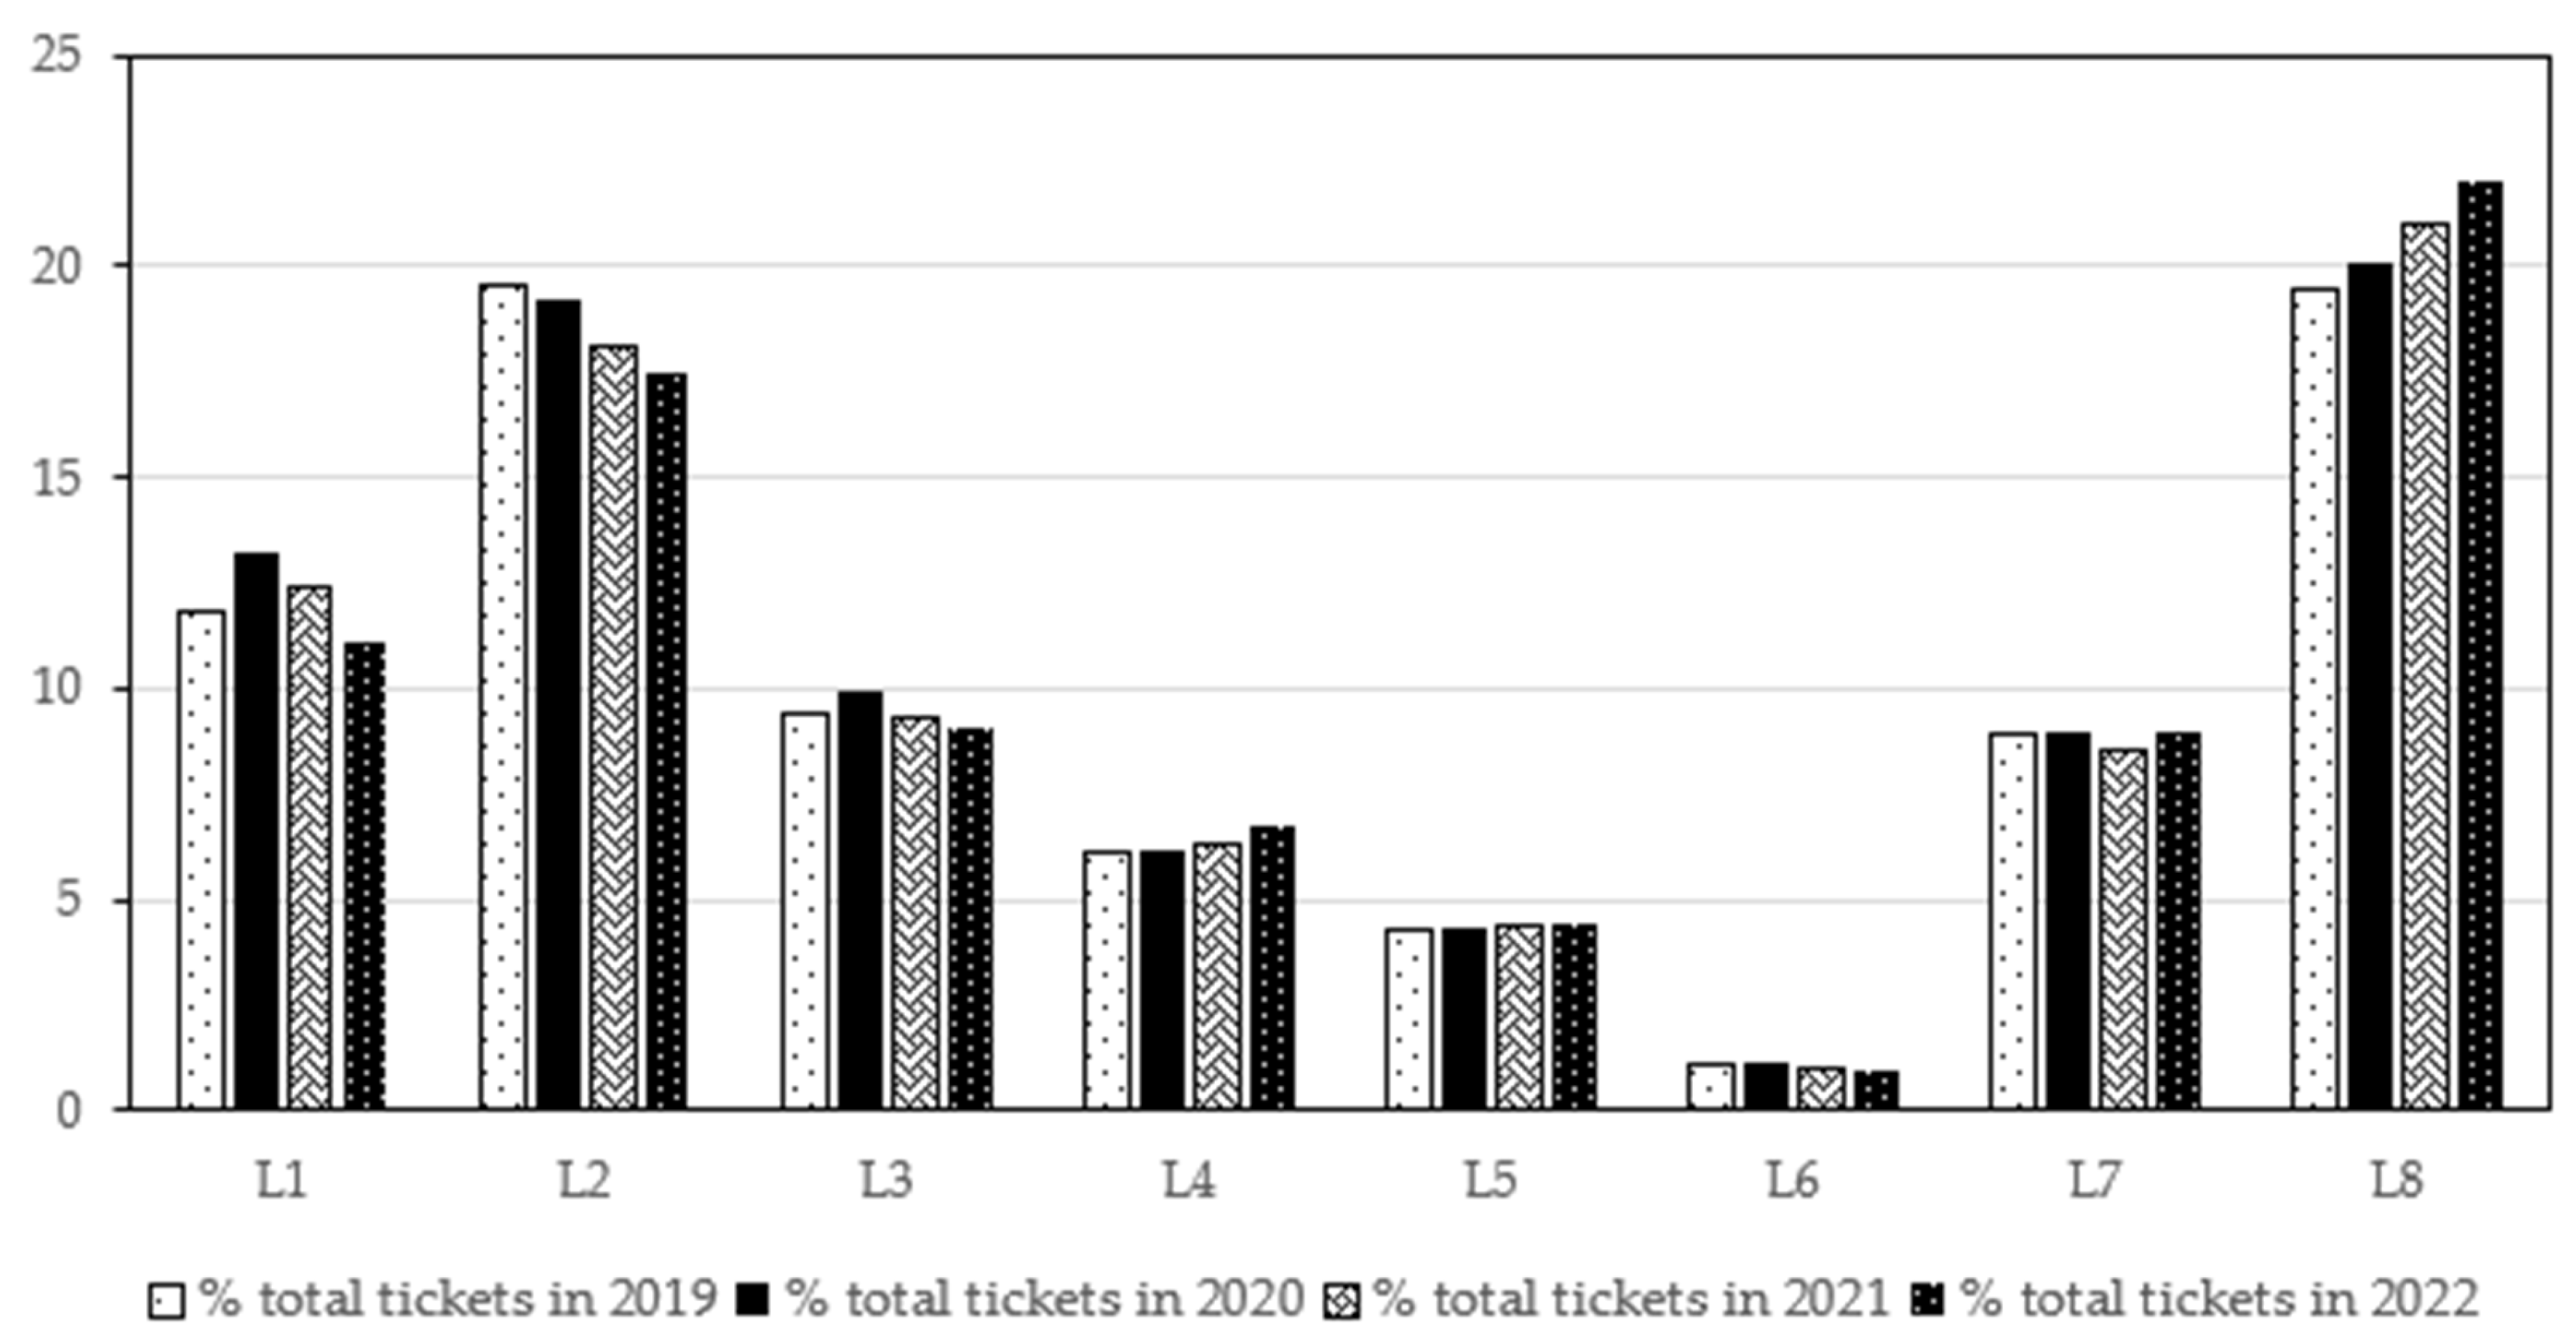
Figure 7.
Total number of tickets sold per intercity bus route and per year.
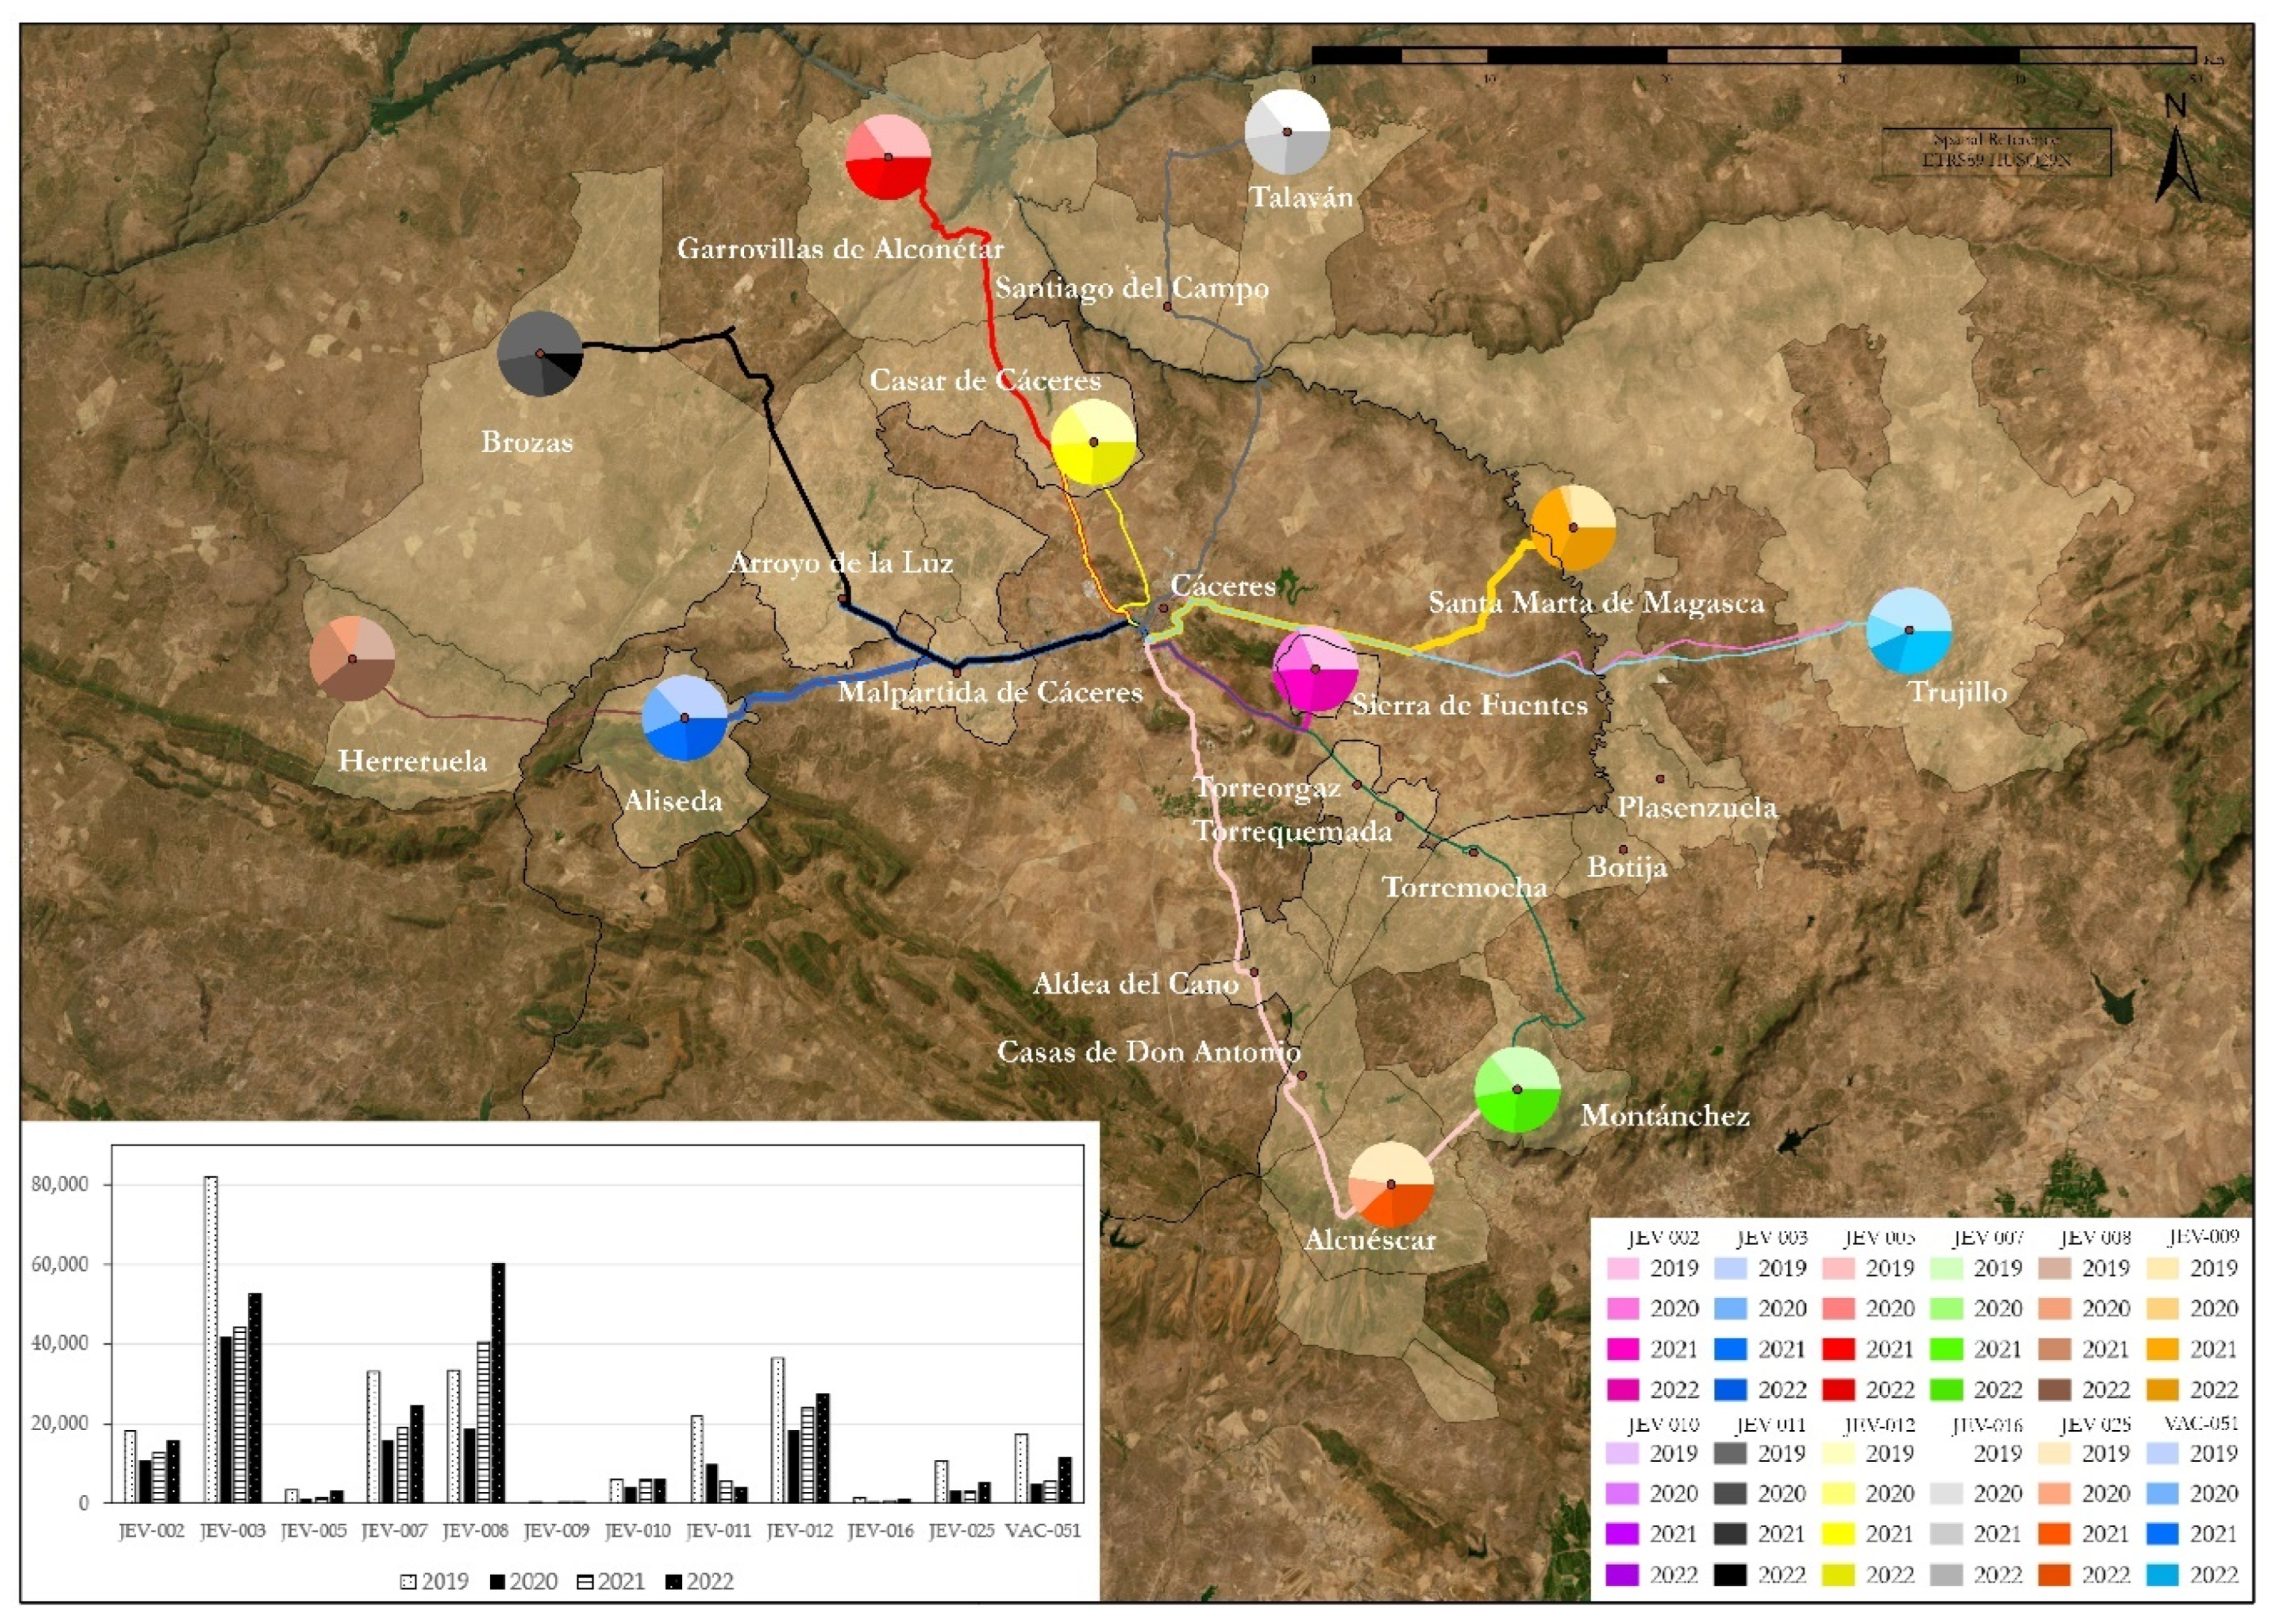
Figure 8.
Total number of tickets sold by Cáceres city bus lines and by year.
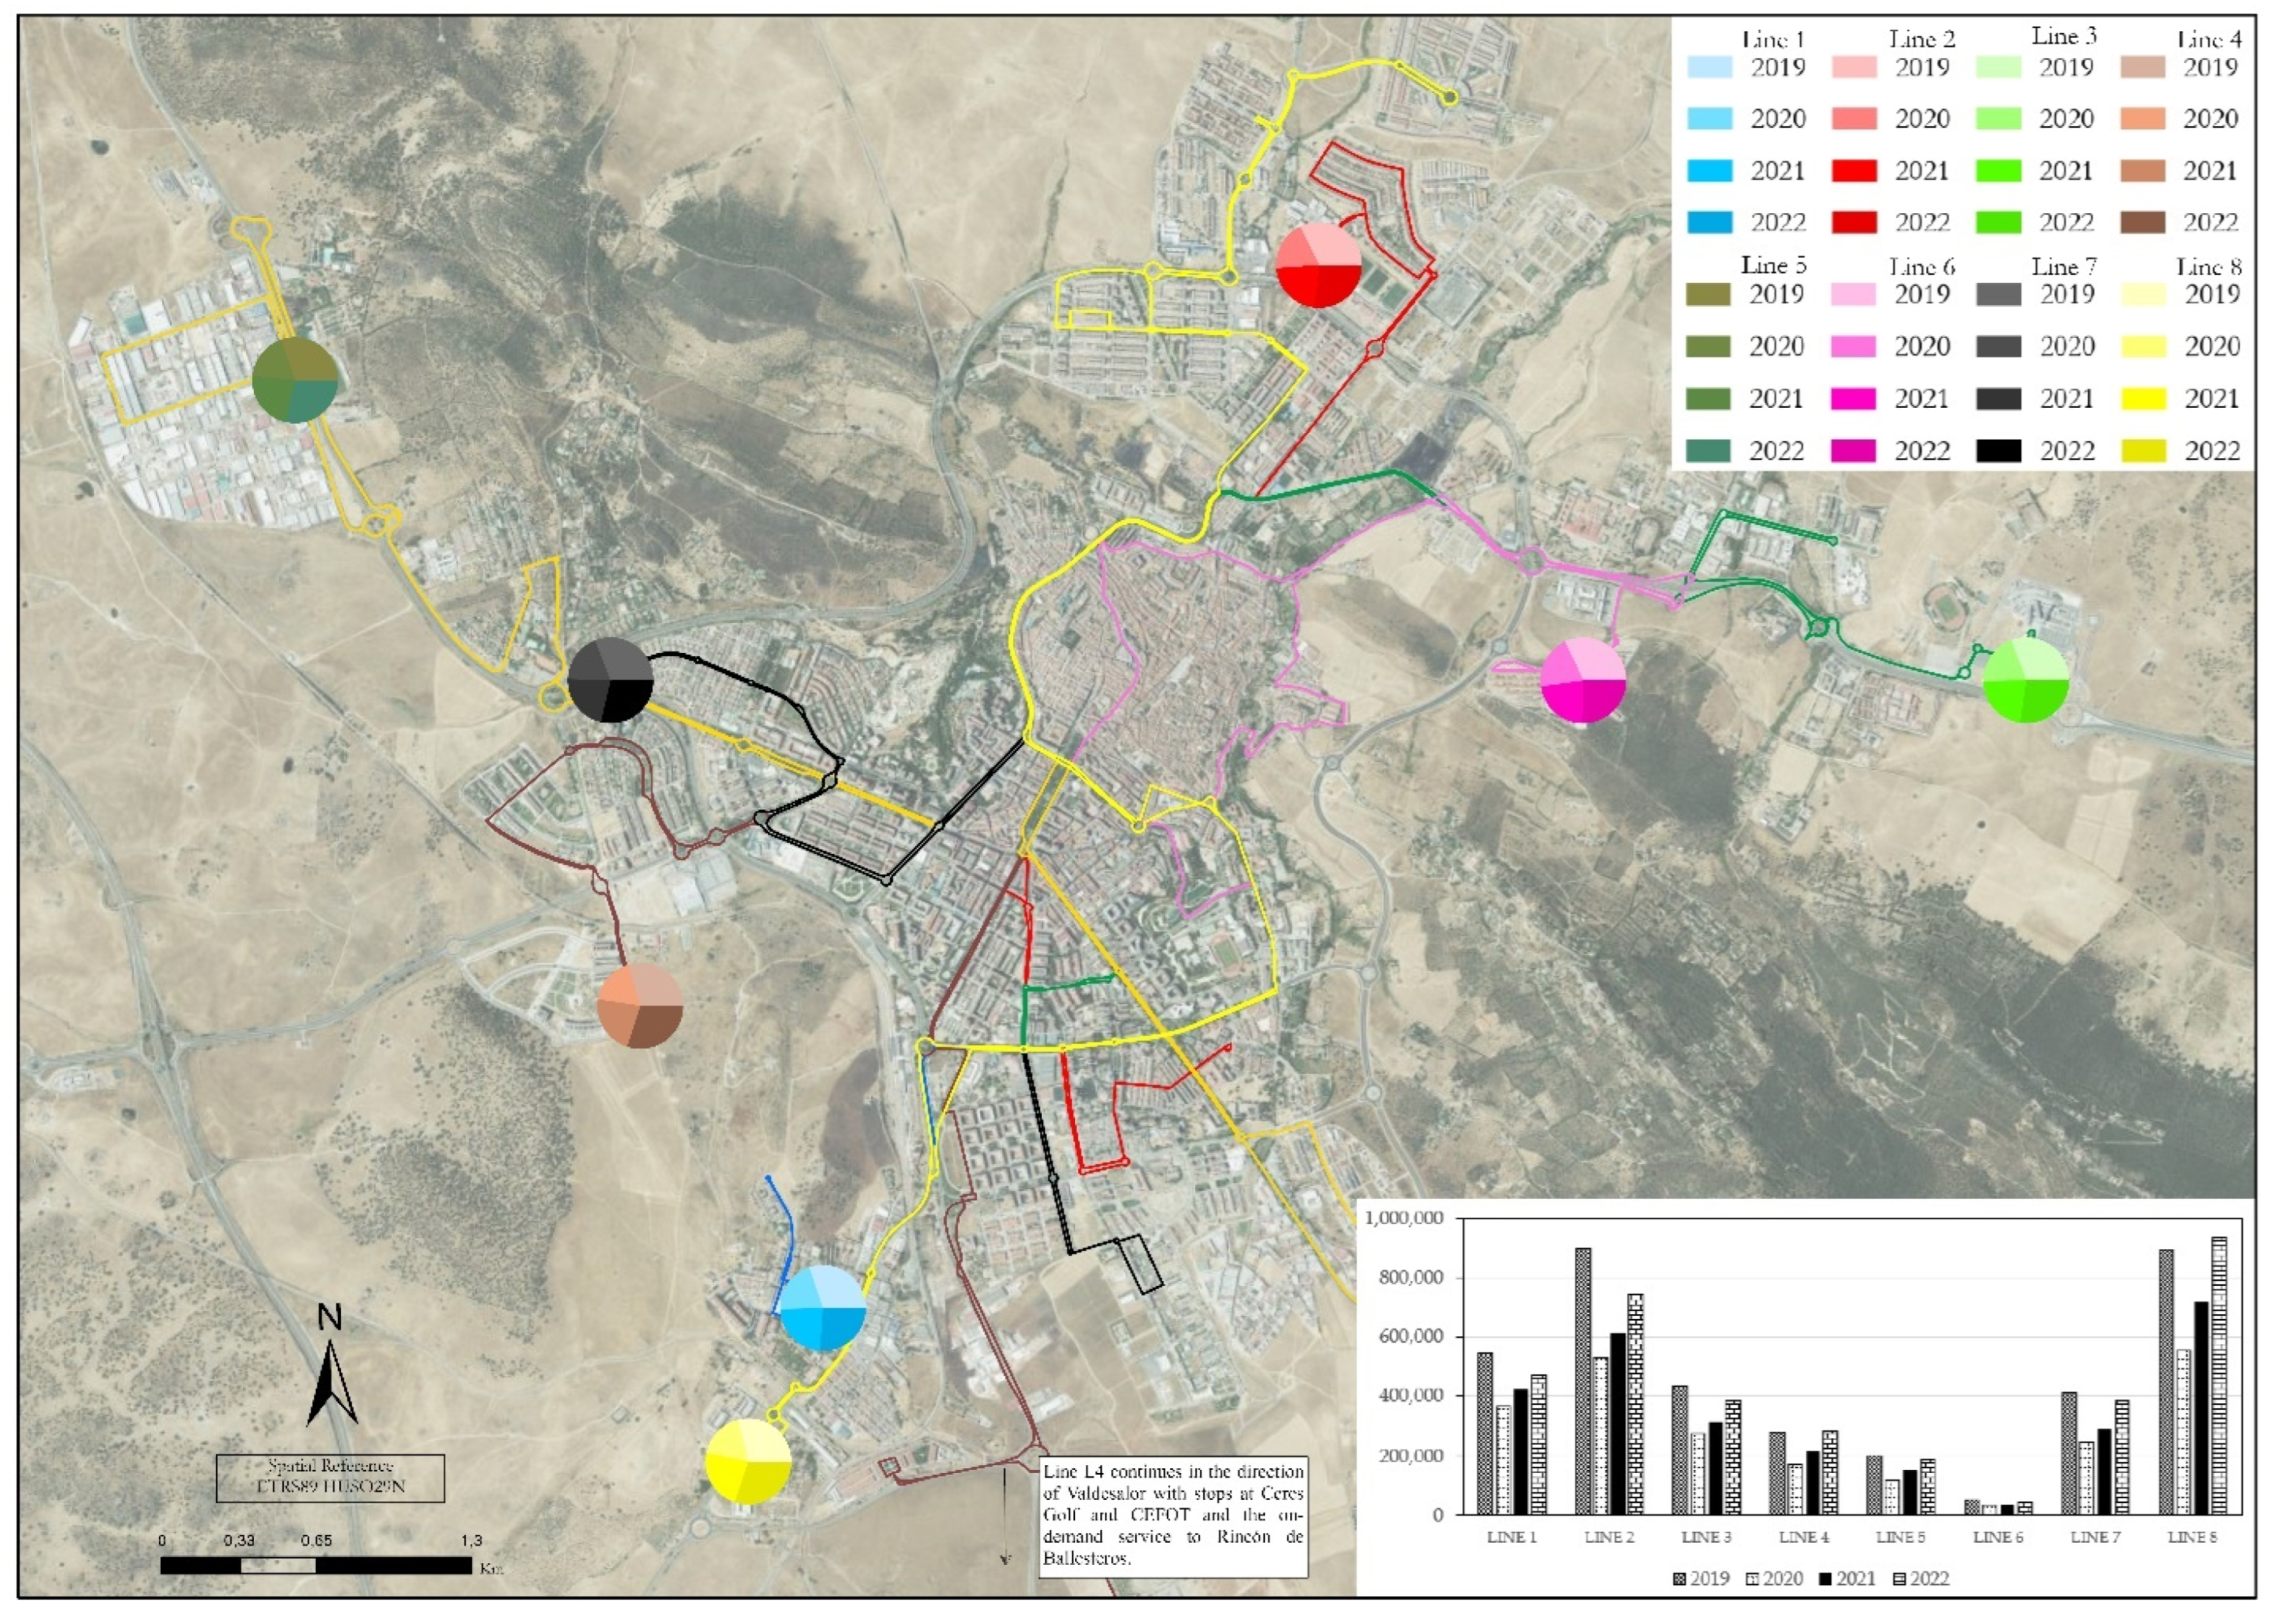
Figure 9.
Percentage of total tickets sold per year on each intercity bus route compared to 2019.
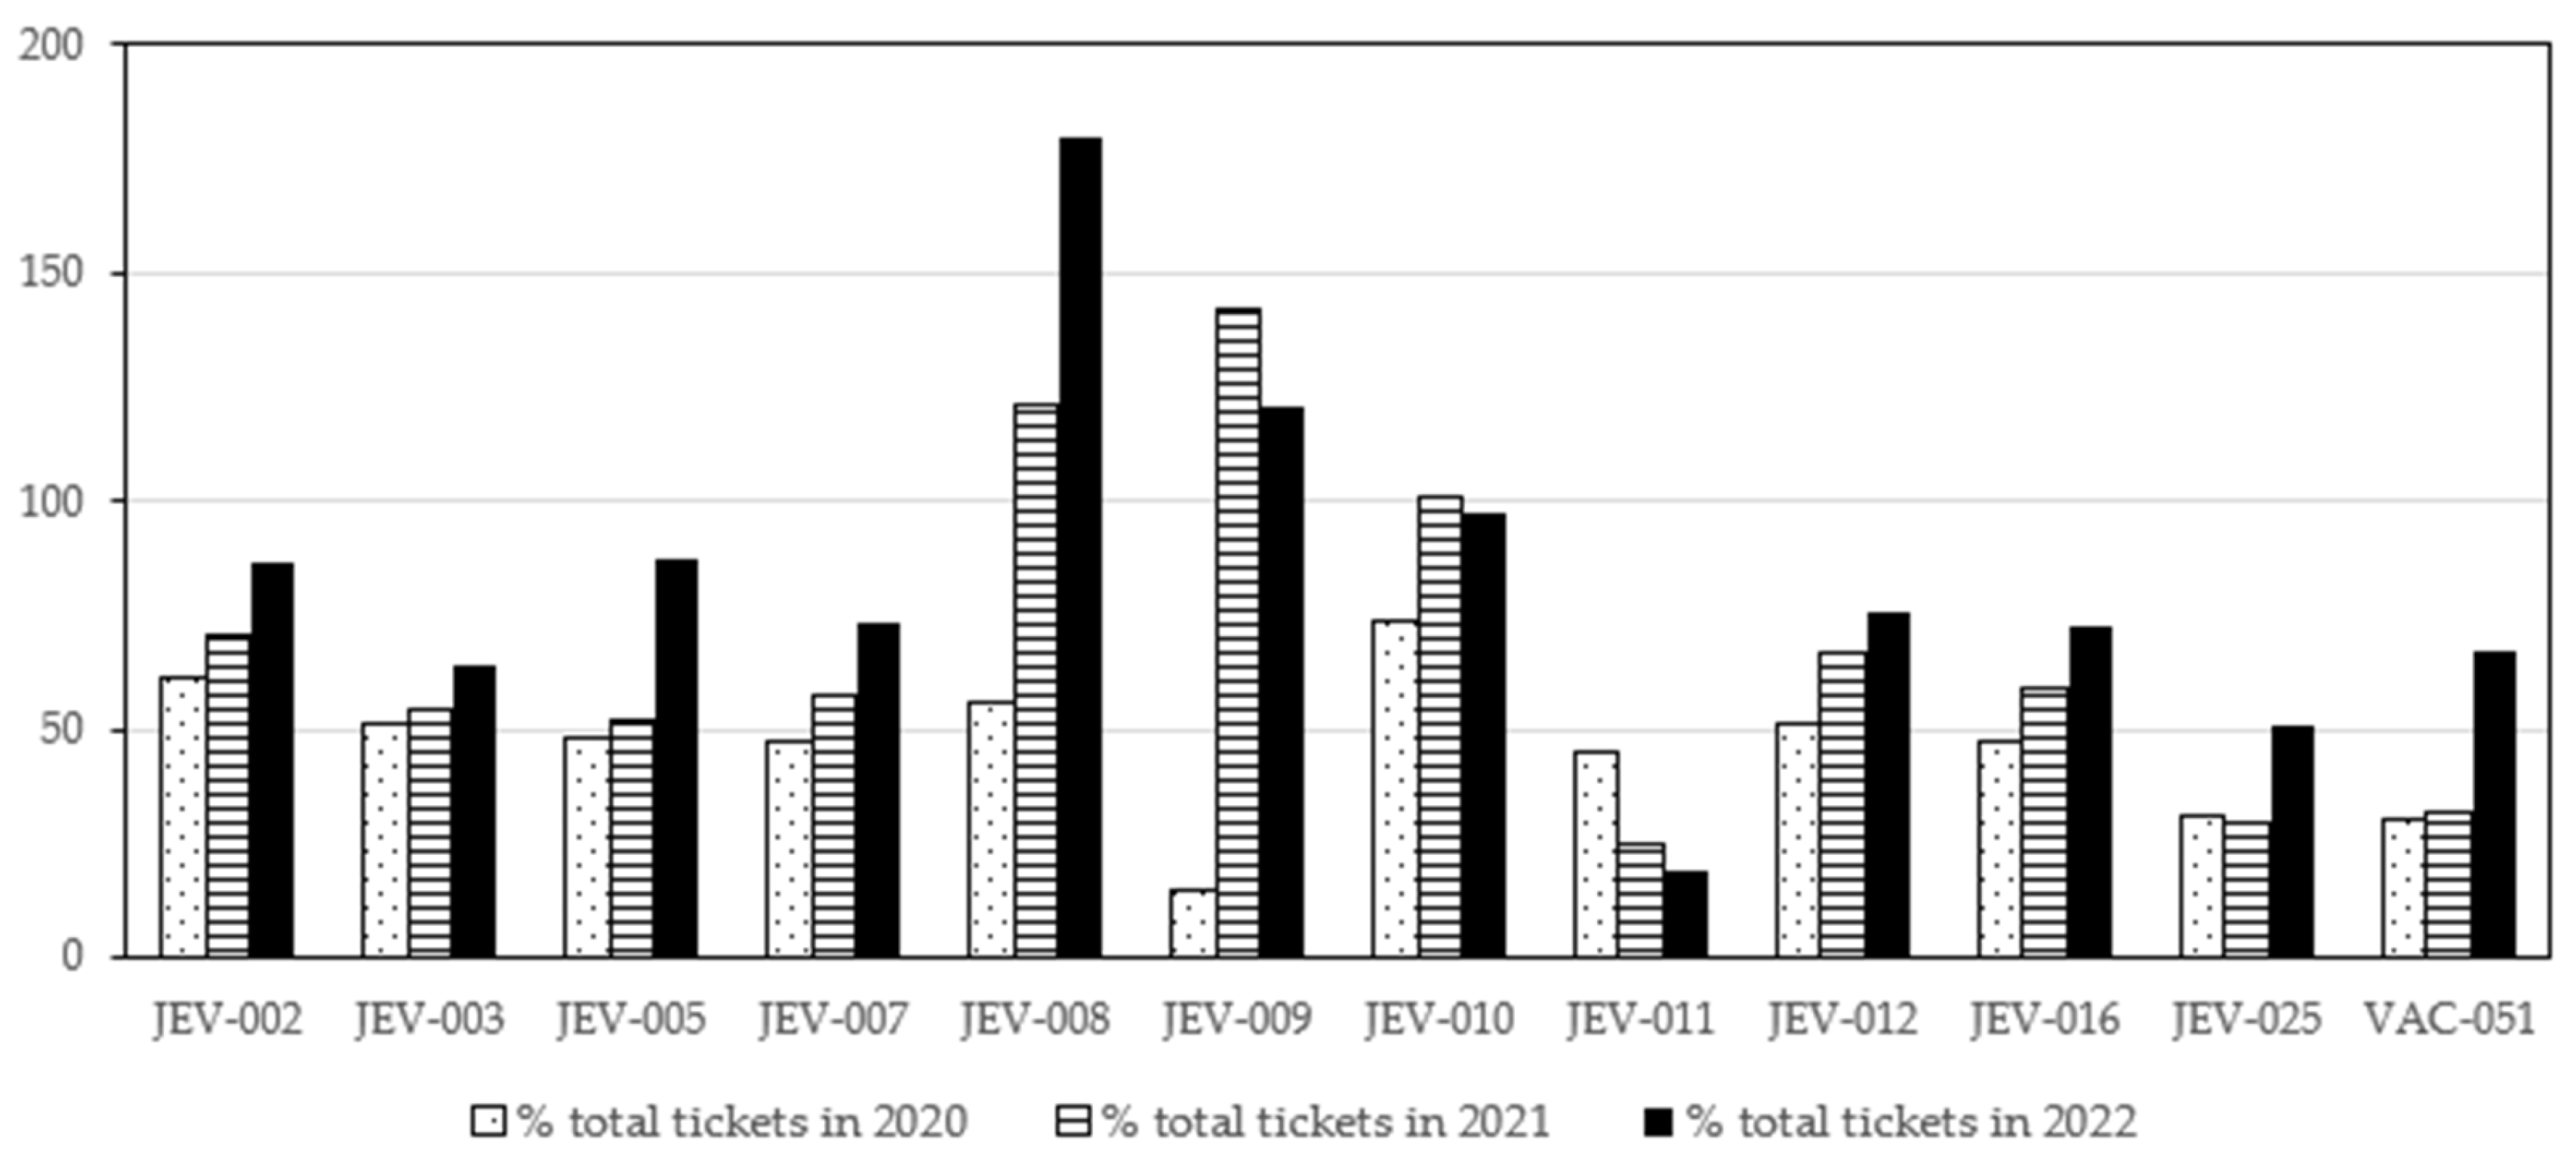
Figure 10.
Percentage of total tickets sold per year on each Cáceres urban transport route compared to 2019.
Figure 10.
Percentage of total tickets sold per year on each Cáceres urban transport route compared to 2019.
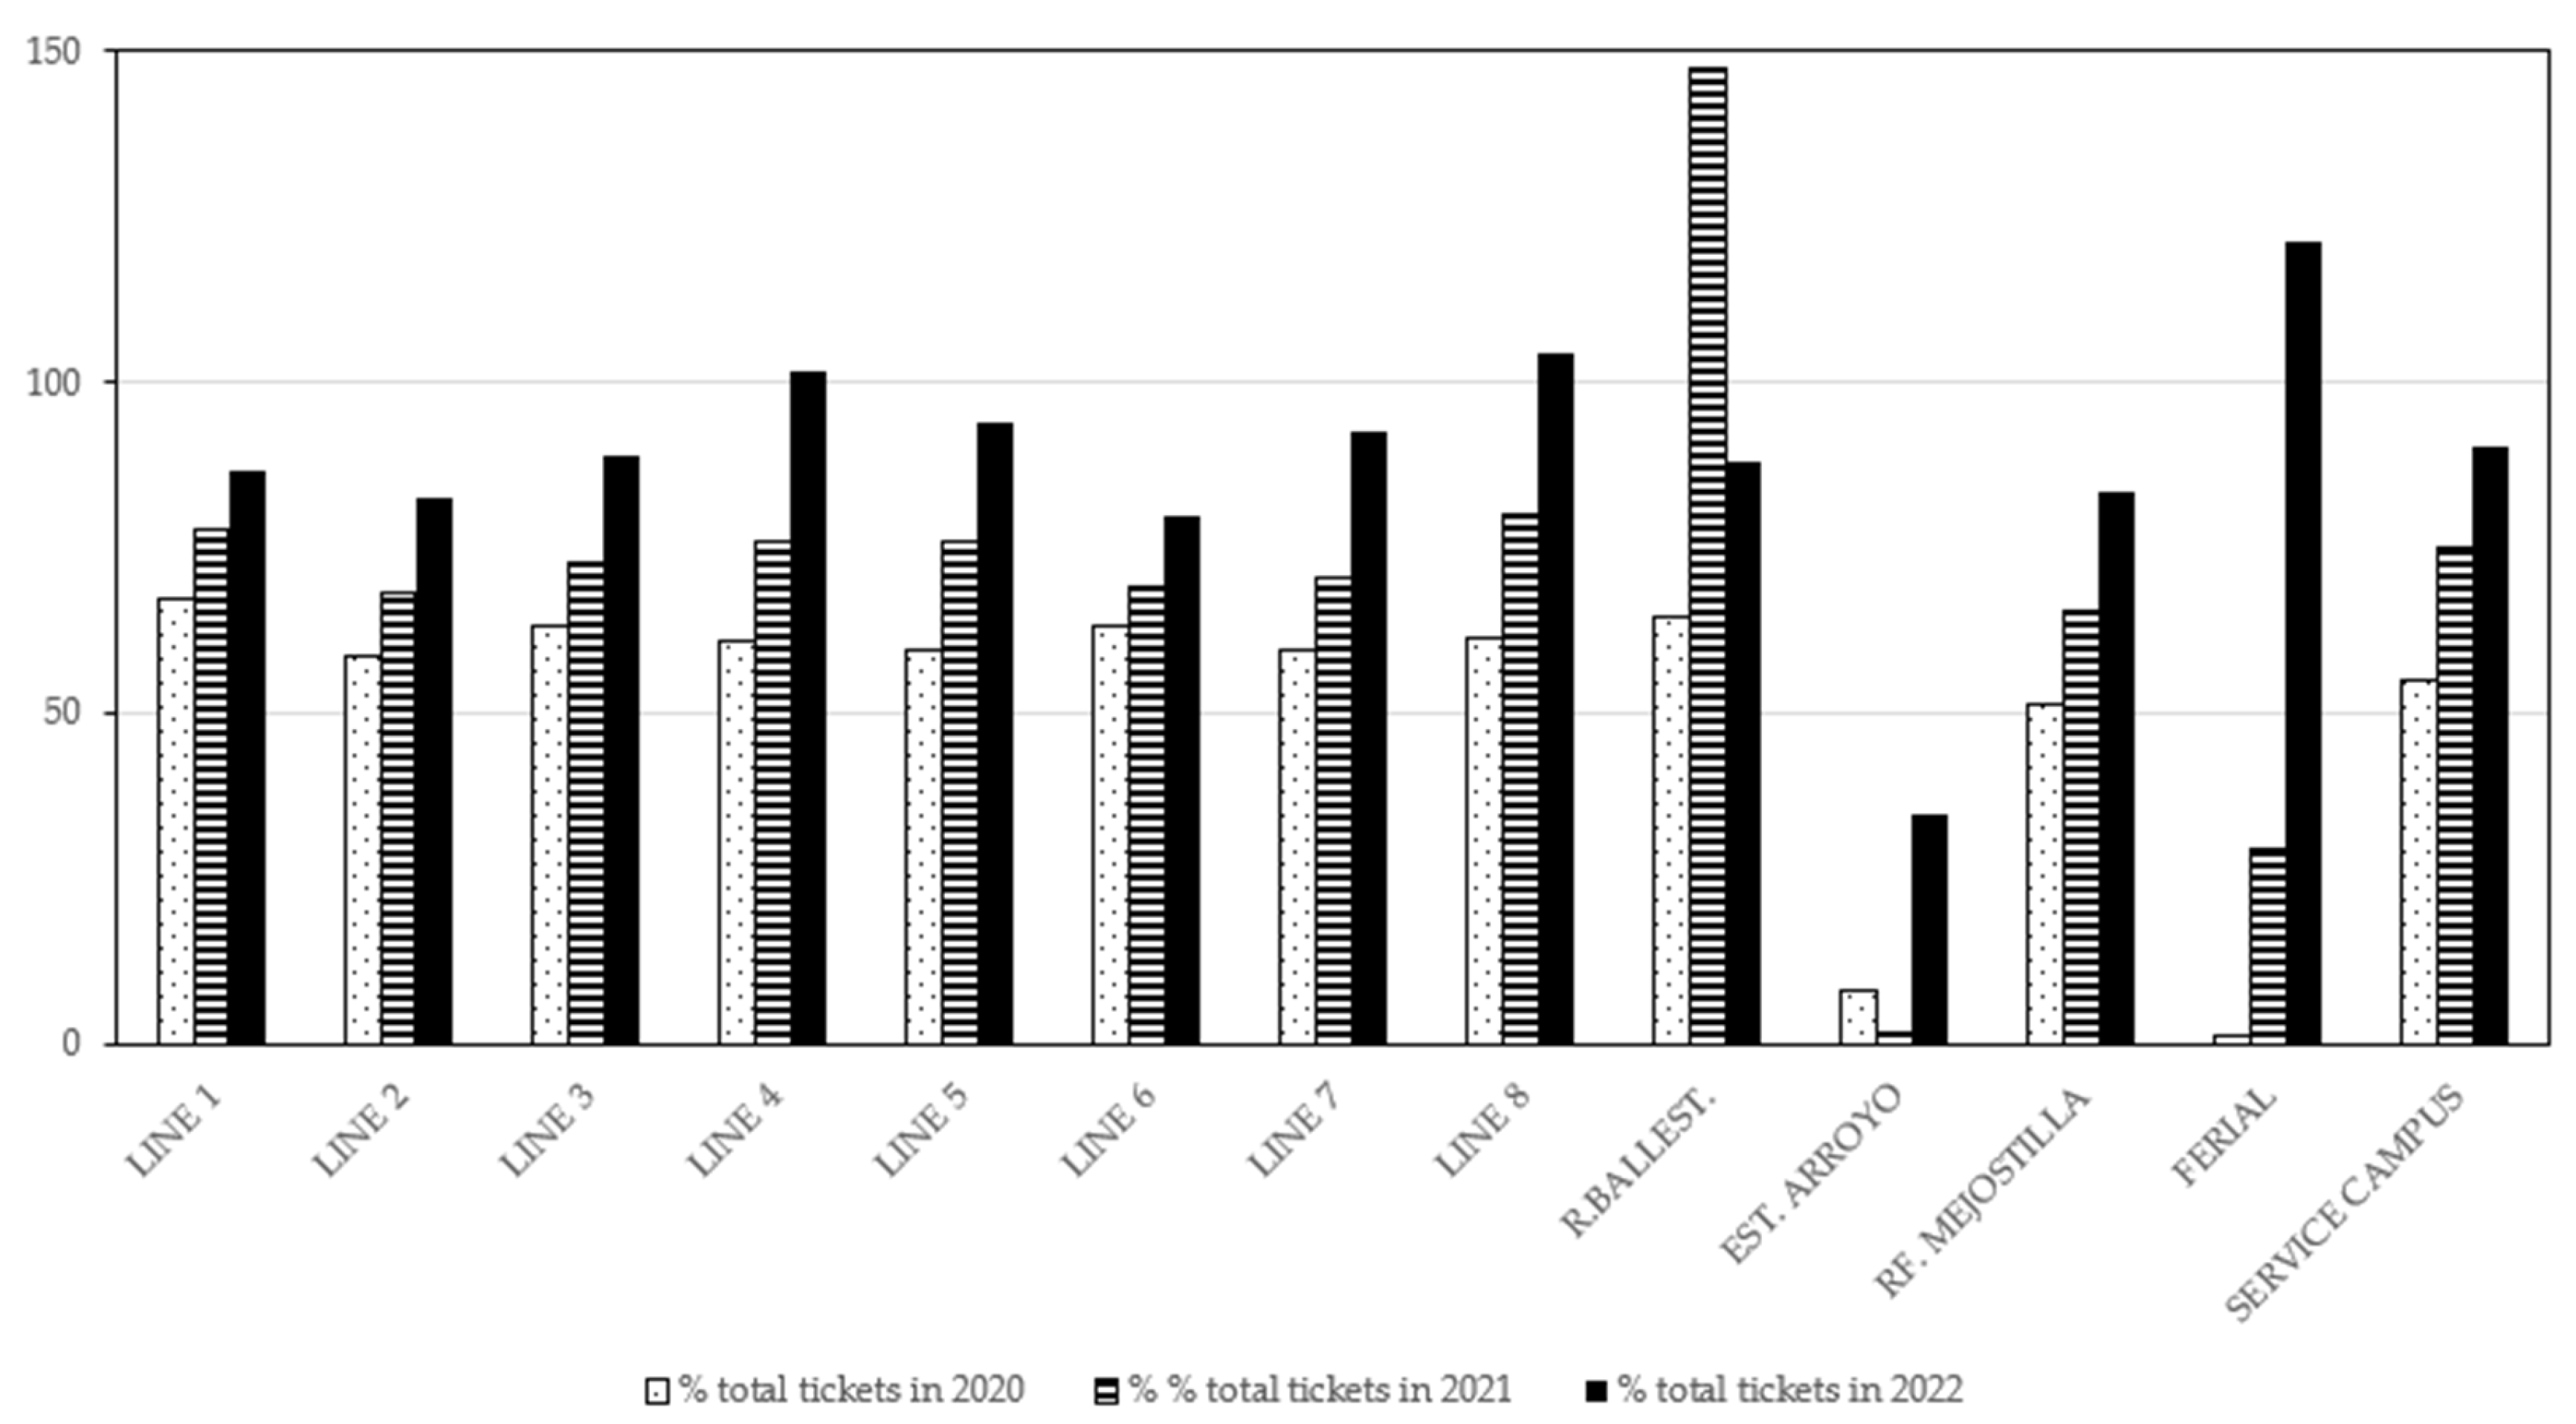
Figure 11.
Visualization of the trend and pattern of behaviour of intercity bus lines.
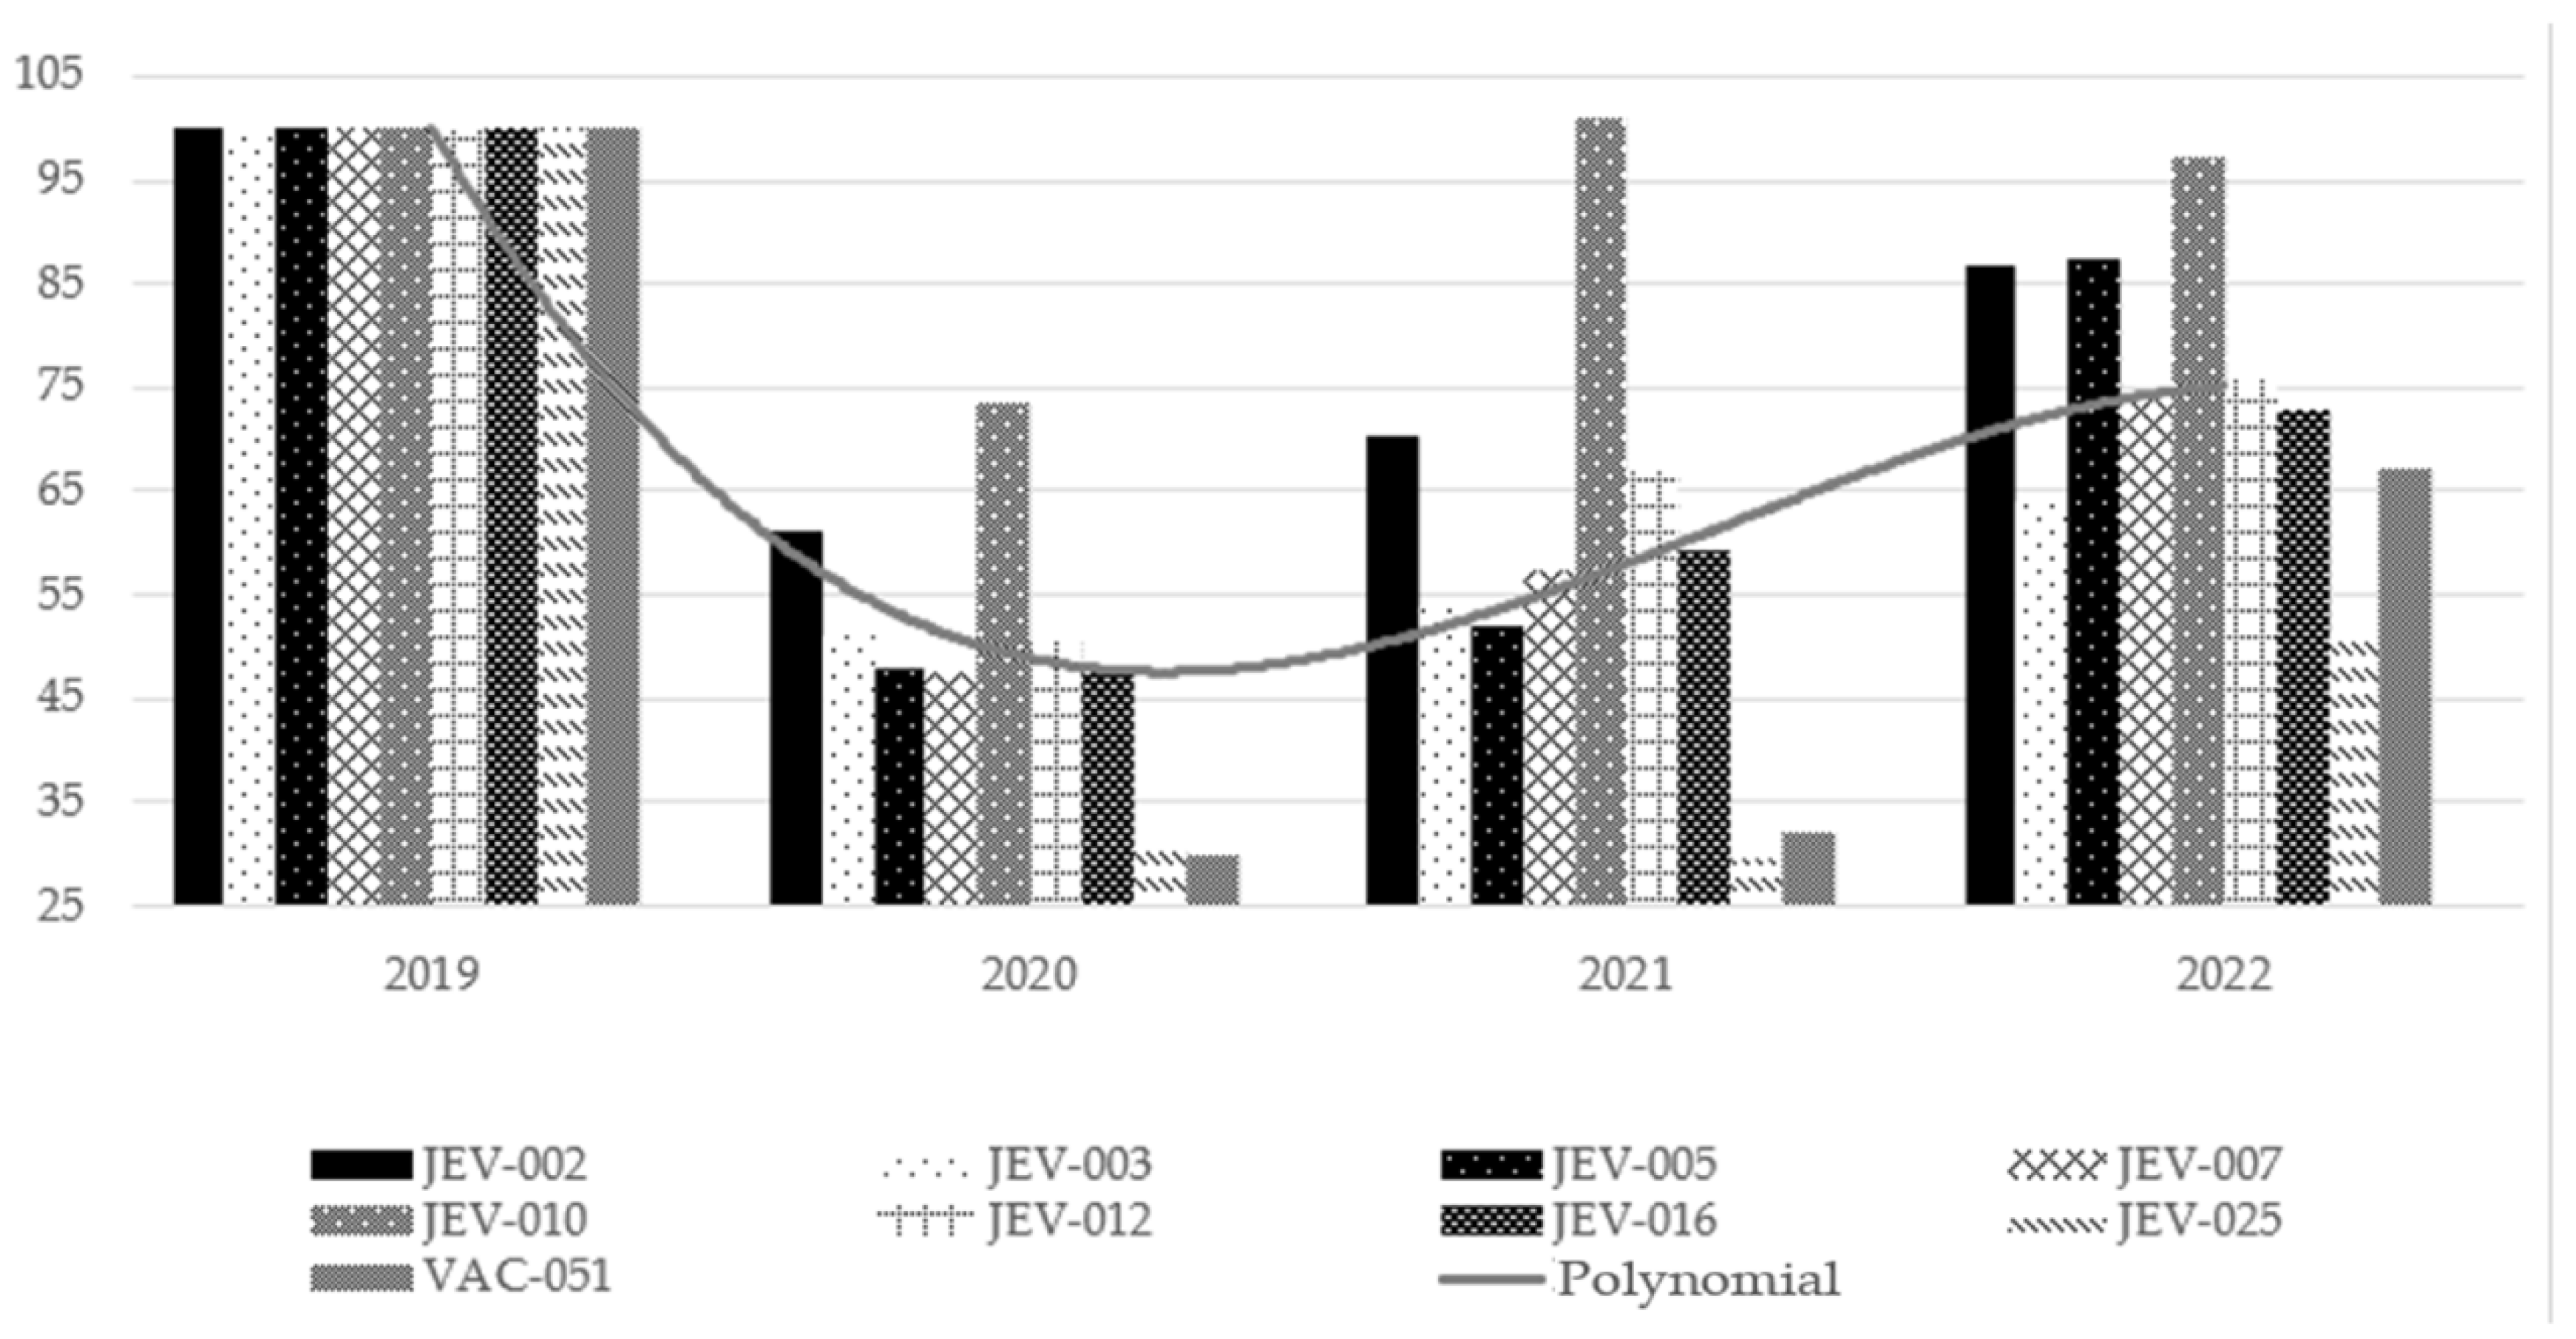
Figure 12.
Visualization of the trend and pattern of behaviour of the urban bus lines in the city of Cáceres.
Figure 12.
Visualization of the trend and pattern of behaviour of the urban bus lines in the city of Cáceres.
Disclaimer/Publisher’s Note: The statements, opinions and data contained in all publications are solely those of the individual author(s) and contributor(s) and not of MDPI and/or the editor(s). MDPI and/or the editor(s) disclaim responsibility for any injury to people or property resulting from any ideas, methods, instructions or products referred to in the content. |
© 2024 by the authors. Licensee MDPI, Basel, Switzerland. This article is an open access article distributed under the terms and conditions of the Creative Commons Attribution (CC BY) license (http://creativecommons.org/licenses/by/4.0/).
Copyright: This open access article is published under a Creative Commons CC BY 4.0 license, which permit the free download, distribution, and reuse, provided that the author and preprint are cited in any reuse.


