1. Introduction
In recent years, the global demand for energy has been continuously increasing, and traditional oil and gas resources are gradually depleting. Unconventional oil and gas resources, particularly shale gas, have become one of the main alternative energy sources since the 21st century [
1,
2,
3], and the geochemical characteristics of shale have become a research hotspot in recent years [
4,
5]. Previous studies have shown that China has a vast amount of shale gas resources, especially in the southern regions where marine shale gas resources are particularly abundant. Among them, the total volume of marine, transitional marine-continental, and continental shale gas resources in the Sichuan Basin is approximately 41. 5×10
12 m
3, which holds broad exploration prospects [
6,
7,
8]. Existing research has mainly focused on stratigraphic division and sedimentary evolution [
9,
10], tectonic deformation and evolution [
11,
12], the conditions for the formation of the Changxing-Feixianguan gas reservoir, the geological conditions of the shale gas in the Lower Cambrian Niutitang Formation, and the tectonic deformation of the Bashan foreland thrust belt and its impact on oil and gas accumulation [
13,
14].
Currently, there is limited research on the Paleozoic strata in the study area and its surroundings in terms of paleoenvironmental aspects, mainly focusing on the Upper Ordovician Wufeng Formation [
15], the Mianshannan-Banjiuguan Formation [
16], and the paleo-oxygen levels and organic matter enrichment of the Niutitang Formation shales in the Mianshan-Hannan uplift [
17]. Li Delu et al. [
18]conducted research on the shales of the Lower Paleozoic Niutitang and Longmaxi Formations, clarifying the source of siliceous shale in the northwestern Yangtze Plate, a warm and humid paleoclimate, and a continental margin depositional environment for the shale. However, there is a lack of research on the reservoir characteristics of Niutitang Formation, shale sedimentation rates, paleo-water media, and paleo-productivity, leading to an unclear understanding of the paleo-water media and paleo-productivity during the formation period of Niutitang Formation shales in the study area, which is not conducive to the research on shale gas accumulation in the study area.
Based on the aforementioned published papers, this article takes Niutitang Formation from the SZY1 well as the main research object for analysis. Employing geological and geochemical analytical methods such as X-ray diffraction (XRD), scanning electron microscopy (SEM), and elemental content determination, this study systematically analyzes the reservoir characteristics, major and trace elements, and rare earth elements of Niutitang Formation shales. Utilizing the Chemical Index of Alteration (CIA), elemental ratios, and other parameters, this study reconstructs paleoclimate, paleo-productivity, redox conditions, and hydrothermal fluid activity of study area, and discusses the storage performance, diagenetic processes, and paleo-water conditions of the shales.
2. Geological Settings
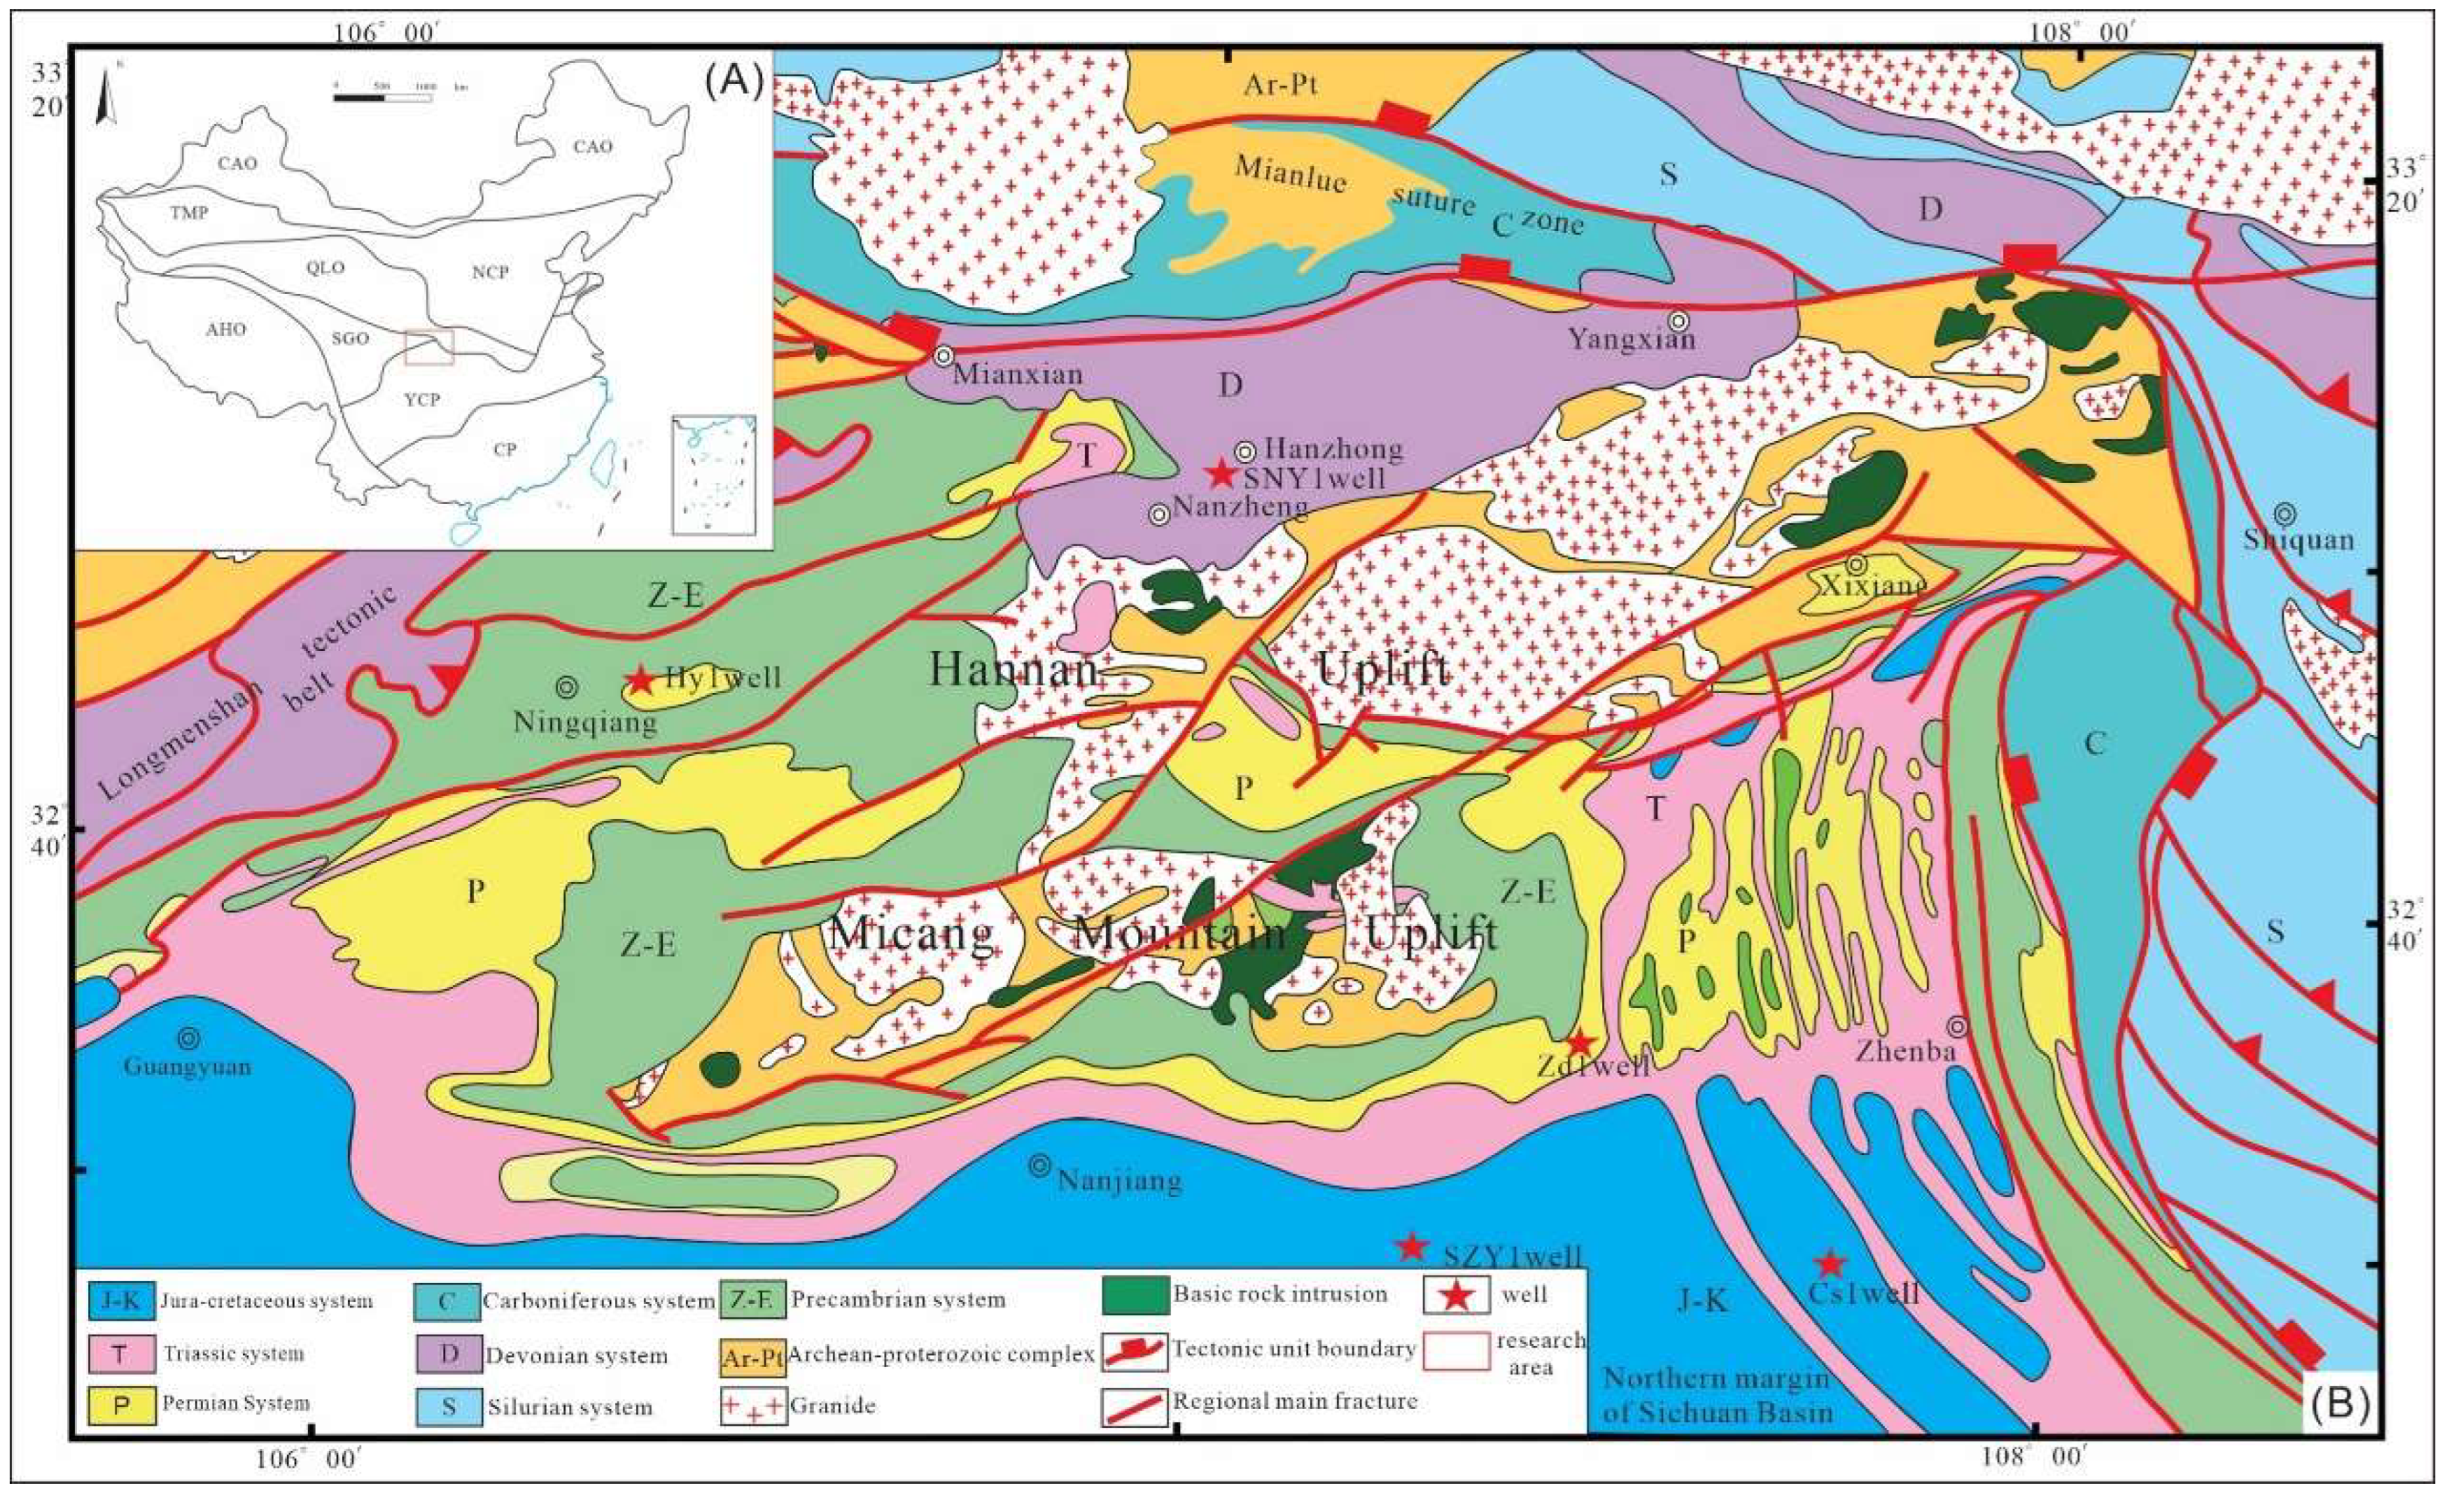
The study area is located at the junction and transitional zone between the eastern part of the Mianshan uplift on the northern edge of the Yangtze platform and the western segment of the Bashan arcuate structural belt on the southern edge of the Qinling orogenic belt (
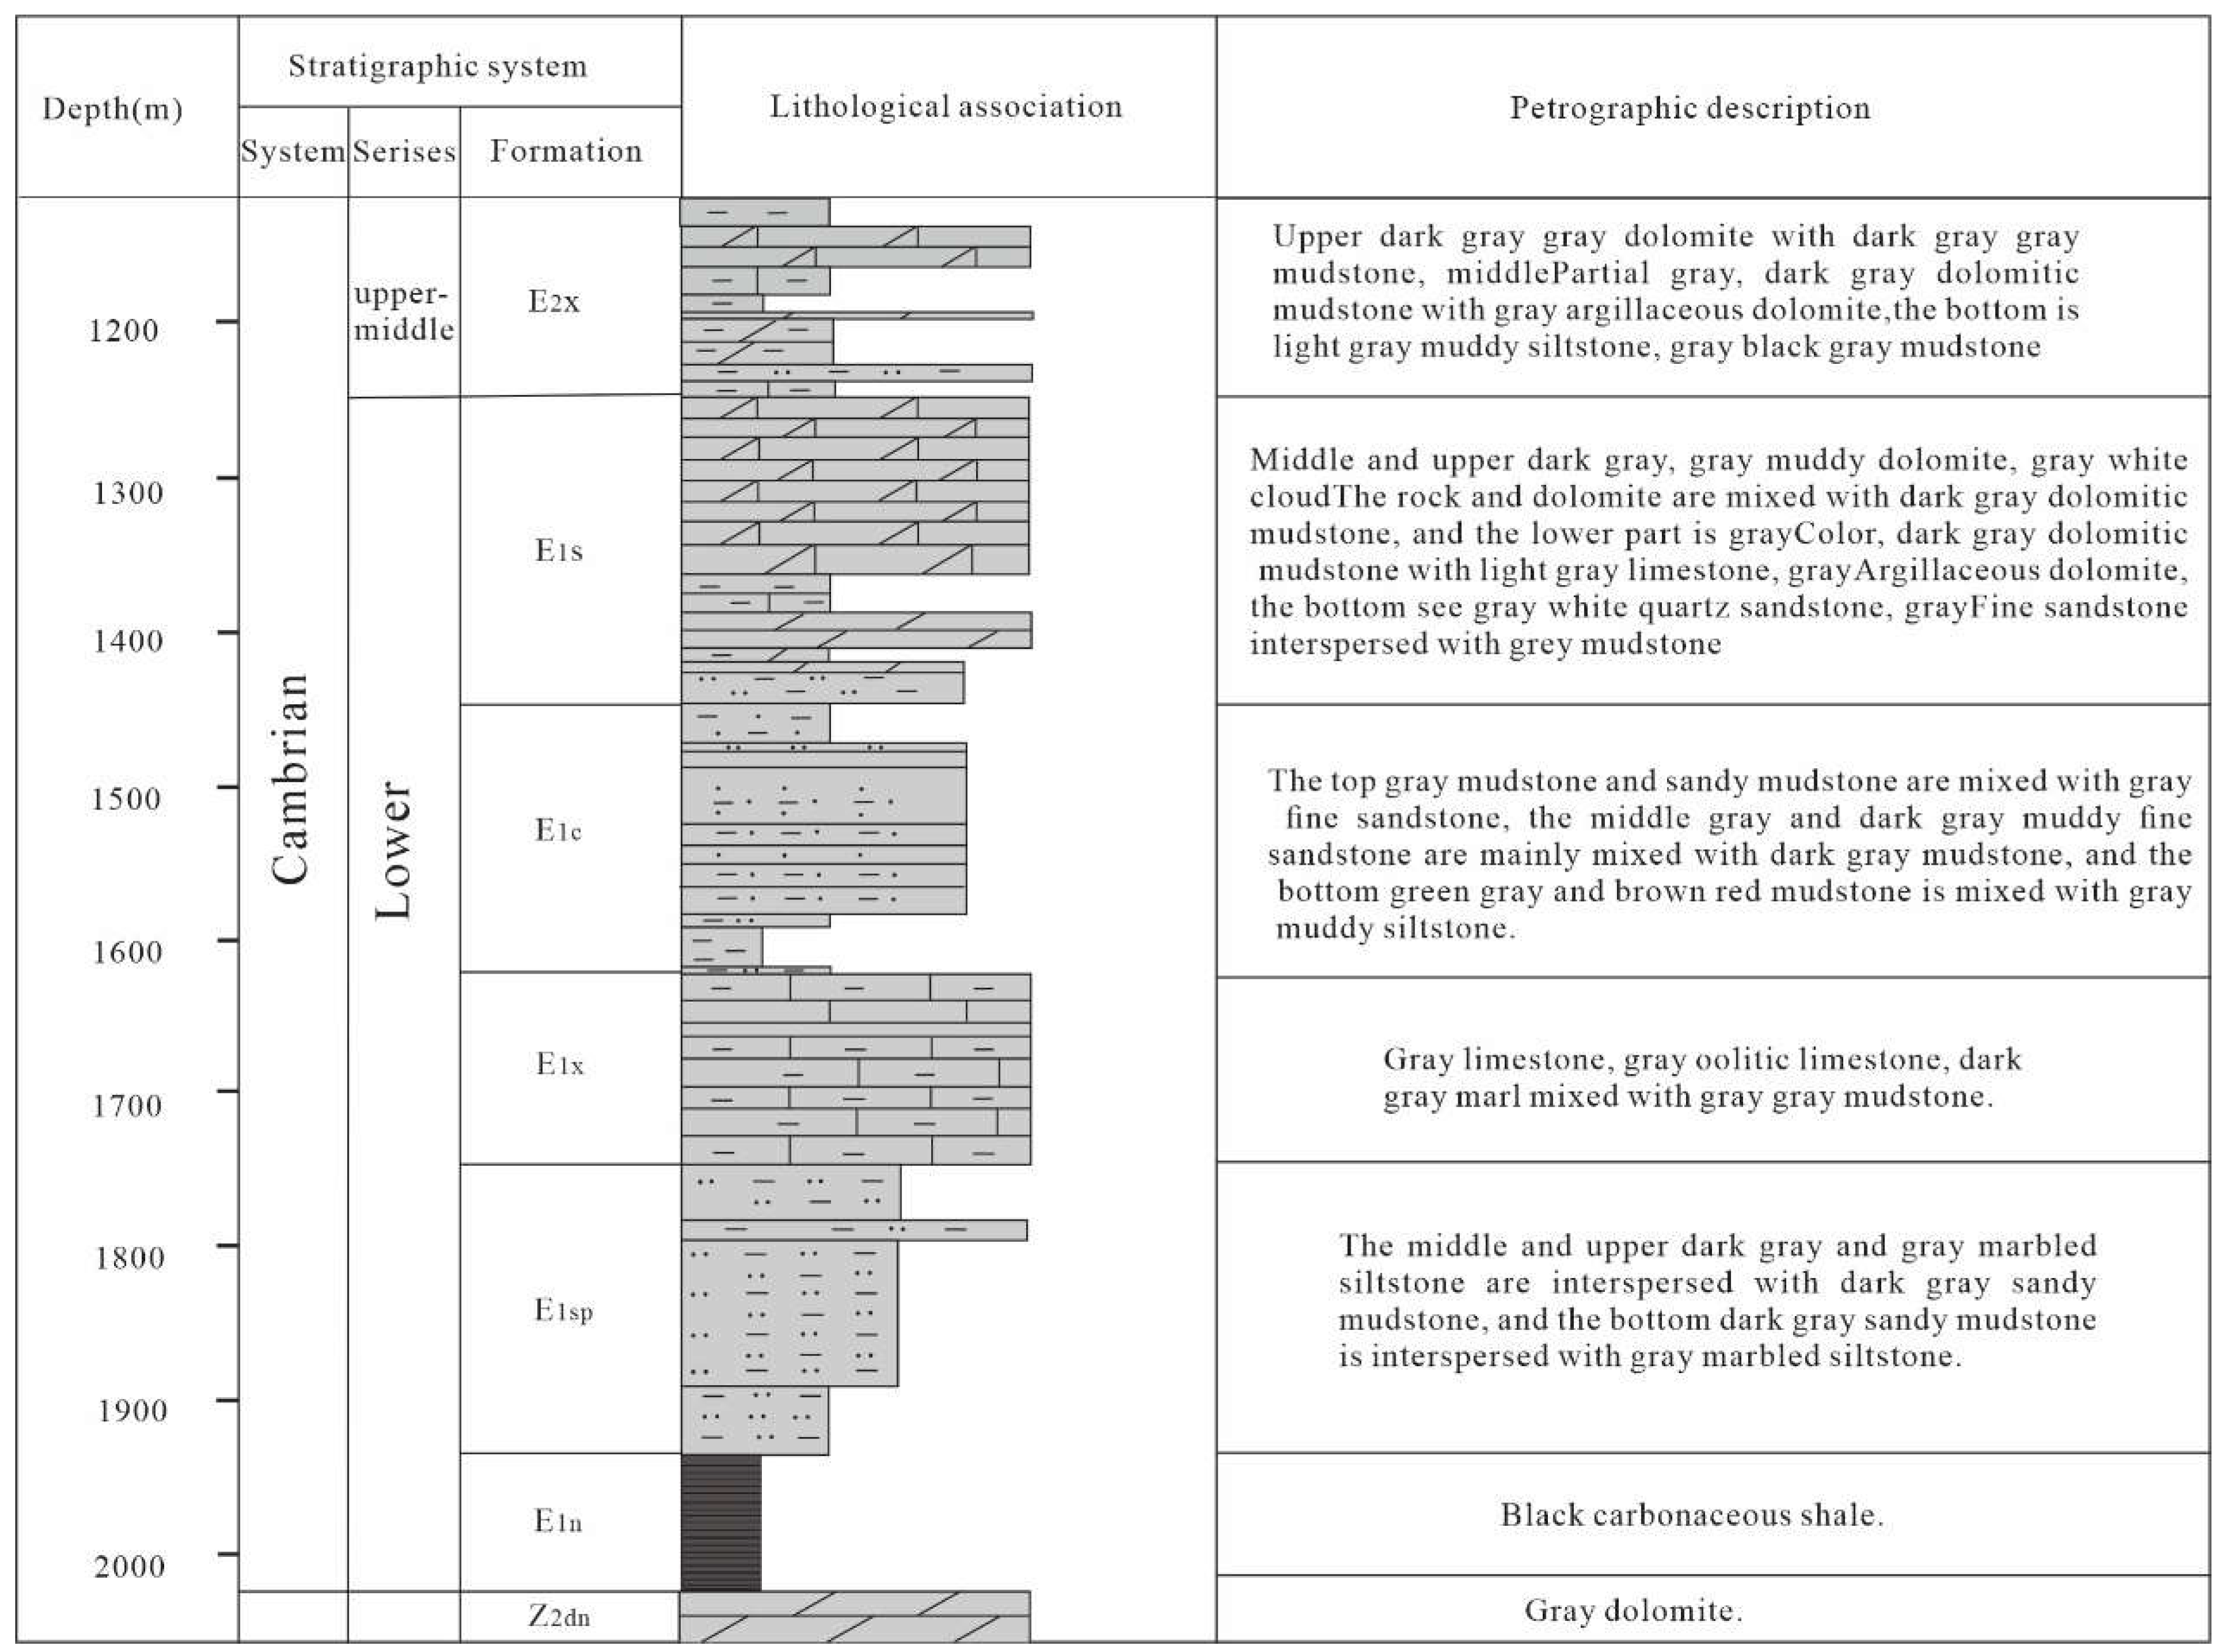
Figure 1). This paper takes the SZY1 well as an example for study, where the region has a rich stratigraphic sequence, including the Sinian Doushantuo Formation, Dengying Formation, Cambrian Niutitang Formation, Ordovician Baota Formation, Silurian Longmaxi Formation, Luojiaoping Formation, and Jurassic Shaximiao Formation, with the development of sandstone, shale, limestone, conglomerate, and mudstone (
Figure 2). These strata collectively record the geological evolution of the study area from the Paleozoic to the Mesozoic [
19]. Since the Paleozoic, the Sichuan Basin has experienced multiple episodes of tectonic movement, including the Caledonian, Indosinian, Yanshanian, and Himalayan orogenies [
20,
21]. The geological structure of Zhenba area has been influenced by multiple tectonic activities during Indosinian, Yanshanian, and Himalayan periods, leading to significant deformation, uplift, and the formation of fault structures, thus shaping the current geological framework [
22,
23,
24]. According to previous studies, the depositional environment of the area is diverse, including shore-clastic shelf deposits, interbedded mudstone and dolomite mixed shelf deposits, and open carbonate platform deposits, providing favorable conditions for the generation and accumulation of oil and gas [
25,
26]. Within the study area, structural deformation features, such as thrust fault belts and foreland thrust-fold belts, significantly affect the migration dynamics and accumulation mechanisms of oil and gas. The high-quality hydrocarbon source rocks in the area, such as the black shale of the Lower Cambrian Niutitang Formation and the Lower Silurian Longmaxi Formation, have high organic carbon content, and their thermal maturity has reached a high maturity stage, providing a solid geochemical foundation for the generation of hydrocarbon compounds. Therefore, the Lower Cambrian Niutitang Formation and the Lower Silurian Longmaxi Formation in the Zhenba area, as key target layers for shale gas exploration, possess superior geological conditions and have good potential for shale gas accumulation. The total gas content of Niutitang Formation in the ZD1 well is 1.84-6.04m
3/t, showing good gas content [
13,
27,
28]. The Wufeng Formation-Longmaxi Formation in the Han 1 well is a shallow marine-continental deposit, with the main type of organic matter being Type I kerogen, and the thermal evolution degree is high, having entered the thermally mature gas generation stage [
29]. Niutitang Formation in the SNY 1 well has good shale gas enrichment and preservation conditions, with high organic matter maturity,
Ro ranging from 2.48% to 4.36%, in a high evolution stage, and the kerogen type is Type I.
3. Sample and Experiments
All samples for this study were collected from the core of the SZY1 well in the study area, belonging to the Lower Cambrian Niutitang Formation. A total of 165 samples were collected, primarily consisting of black carbonaceous shale. The measured total organic carbon (TOC) content ranges from 1.24% to 12.28%, with an average value of 3.96%. The reflectance of bitumen is between 3.0% and 4.01%, indicating that the shale of Niutitang Formation is in a highly mature stage. The following are the methods used for sample testing:
(1) TOC Analysis
The TOC content of 128 samples was analyzed using a CS744 carbon and sulfur analyzer. Initially, the instrument was calibrated and preheated to the appropriate temperature. Subsequently, the samples were prepared by drying and removing impurities. Accurate weights of the samples were taken using a precision balance and placed into digestion tubes, followed by the addition of acid and heating to accelerate the digestion process, ensuring complete dissolution of the samples. After digestion, the digested solution was transferred to test tubes or cuvettes. The samples were then placed into the preheated instrument to initiate the TOC analysis, during which the instrument measures carbon content using infrared detection technology. The TOC content of each sample was recorded, and standard samples were used for quality control during the analysis. After the analysis, the instrument was cleaned, and the data were analyzed to calculate statistical parameters.
(2) Porosity and Permeability
Porosity and permeability tests were conducted on 72 samples using a CM-300 confining pressure porosity and permeability tester. Initially, the instrument was calibrated and checked for proper operation, and the samples were prepared by drying and removing impurities, along with the necessary reagents and materials. The samples were cleaned, cut, or polished to ensure a flat testing surface. Subsequently, holes were drilled into the samples, and they were mounted onto the tester's fixture. During the experiment, confining pressure was applied to simulate the stress state of subsurface rocks, and porosity was measured by injecting non-destructive fluids, while permeability was calculated by measuring fluid flow under confining pressure conditions. Accurate records of the test data for each sample were maintained, and after testing, the instrument was cleaned and quality control was performed. Finally, all sample data were organized and analyzed.
(3) X-ray Diffraction (XRD)
X-ray diffraction (XRD) whole rock analysis was conducted on 39 samples, and XRD clay analysis was performed on 152 samples using a Bruker D2 XRD instrument. The rock XRD experiments were completed at the Lanzhou Oil and Gas Resources Research Center of the Institute of Geology and Geophysics, Chinese Academy of Sciences, using a Rigaku Ultima IV X-ray diffractometer with a Cu-Kα radiation source. The experiments employed step-scan continuous scanning at a rate of 4°/min, with an operating voltage of 40 kV and a current of 40 mA.
(4) Emission Scanning Electron Microscopy (SEM)
Field emission scanning electron microscopy (SEM) was performed on 6 samples. The argon ion polishing-SEM experiments were completed at the Lanzhou Oil and Gas Resources Research Center of the Institute of Geology and Geophysics, Chinese Academy of Sciences. The samples were cut into blocks measuring 10 mm × 10 mm × 3 mm, and the polishing surface was chosen perpendicular to the bedding plane. After sandblasting with sand of different grain sizes, the samples were fixed onto the polishing instrument. An acceleration voltage of 8 kV and an ion beam incidence angle of 40° were set, and the samples were further polished with a high-energy Arion beam for 1 to 2 hours. Observations were made using a Zeiss Merlin Compact field emission scanning electron microscope with a maximum resolution of 1.6 nm.
(5) Major, Trace, and Rare Earth Element
The analysis of major and trace elements was completed at the Lanzhou Oil and Gas Resources Research Center of the Institute of Geology and Geophysics, Chinese Academy of Sciences. The samples were crushed to a particle size of 0.075 mm, and 50 mg of the powder sample was accurately weighed and placed into a polytetrafluoroethylene (PTFE) sealed container. At room temperature, 1.5 mL of high-purity nitric acid and 1.5 mL of high-purity hydrofluoric acid were added sequentially. The samples were then evaporated on a 140°C electric heating plate, followed by the addition of another 1.5 mL of high-purity nitric acid and 1.5 mL of high-purity hydrofluoric acid. After sealing with a cap and a steel jacket, the samples were heated in a 195°C oven for 48 hours. After cooling, the samples were evaporated again on a 140°C electric heating plate, and then 3.0 mL of pure nitric acid was added and evaporated once more. Subsequently, 3.0 mL of 50% nitric acid was added, the samples were sealed and heated in a 150°C oven for 24 hours. After the samples were completely digested and cooled, Rh internal standard solution was added, and the samples were diluted with deionized water to a Rh concentration of 10 ng/mL. Trace element testing was conducted using a British Nu AttoM ICP-MS plasma mass spectrometer.
4. Reservoir Characteristics of the Niutitang Formation
4.1. Lithological Characteristics
4.1.1. Lithofacies Classification
Lithofacies represent the integrated expression of rock characteristics of sedimentary rocks or sediments formed in specific depositional environments and also refer to the rock or rock associations formed in certain depositional settings [
30,
31]. There are significant differences in TOC content, brittle mineral content, and physical properties among the same lithofacies associations of different shale formations or different lithofacies associations within the same shale formation [
32,
33]. Previous methods for classifying marine shale include: (1) the application of a ternary diagram of rock-mineral composition combined with sedimentary microfacies to classify shale lithofacies types and association [
33]; (2) a "two-step method" for shale lithofacies classification based on TOC content and mineral composition [
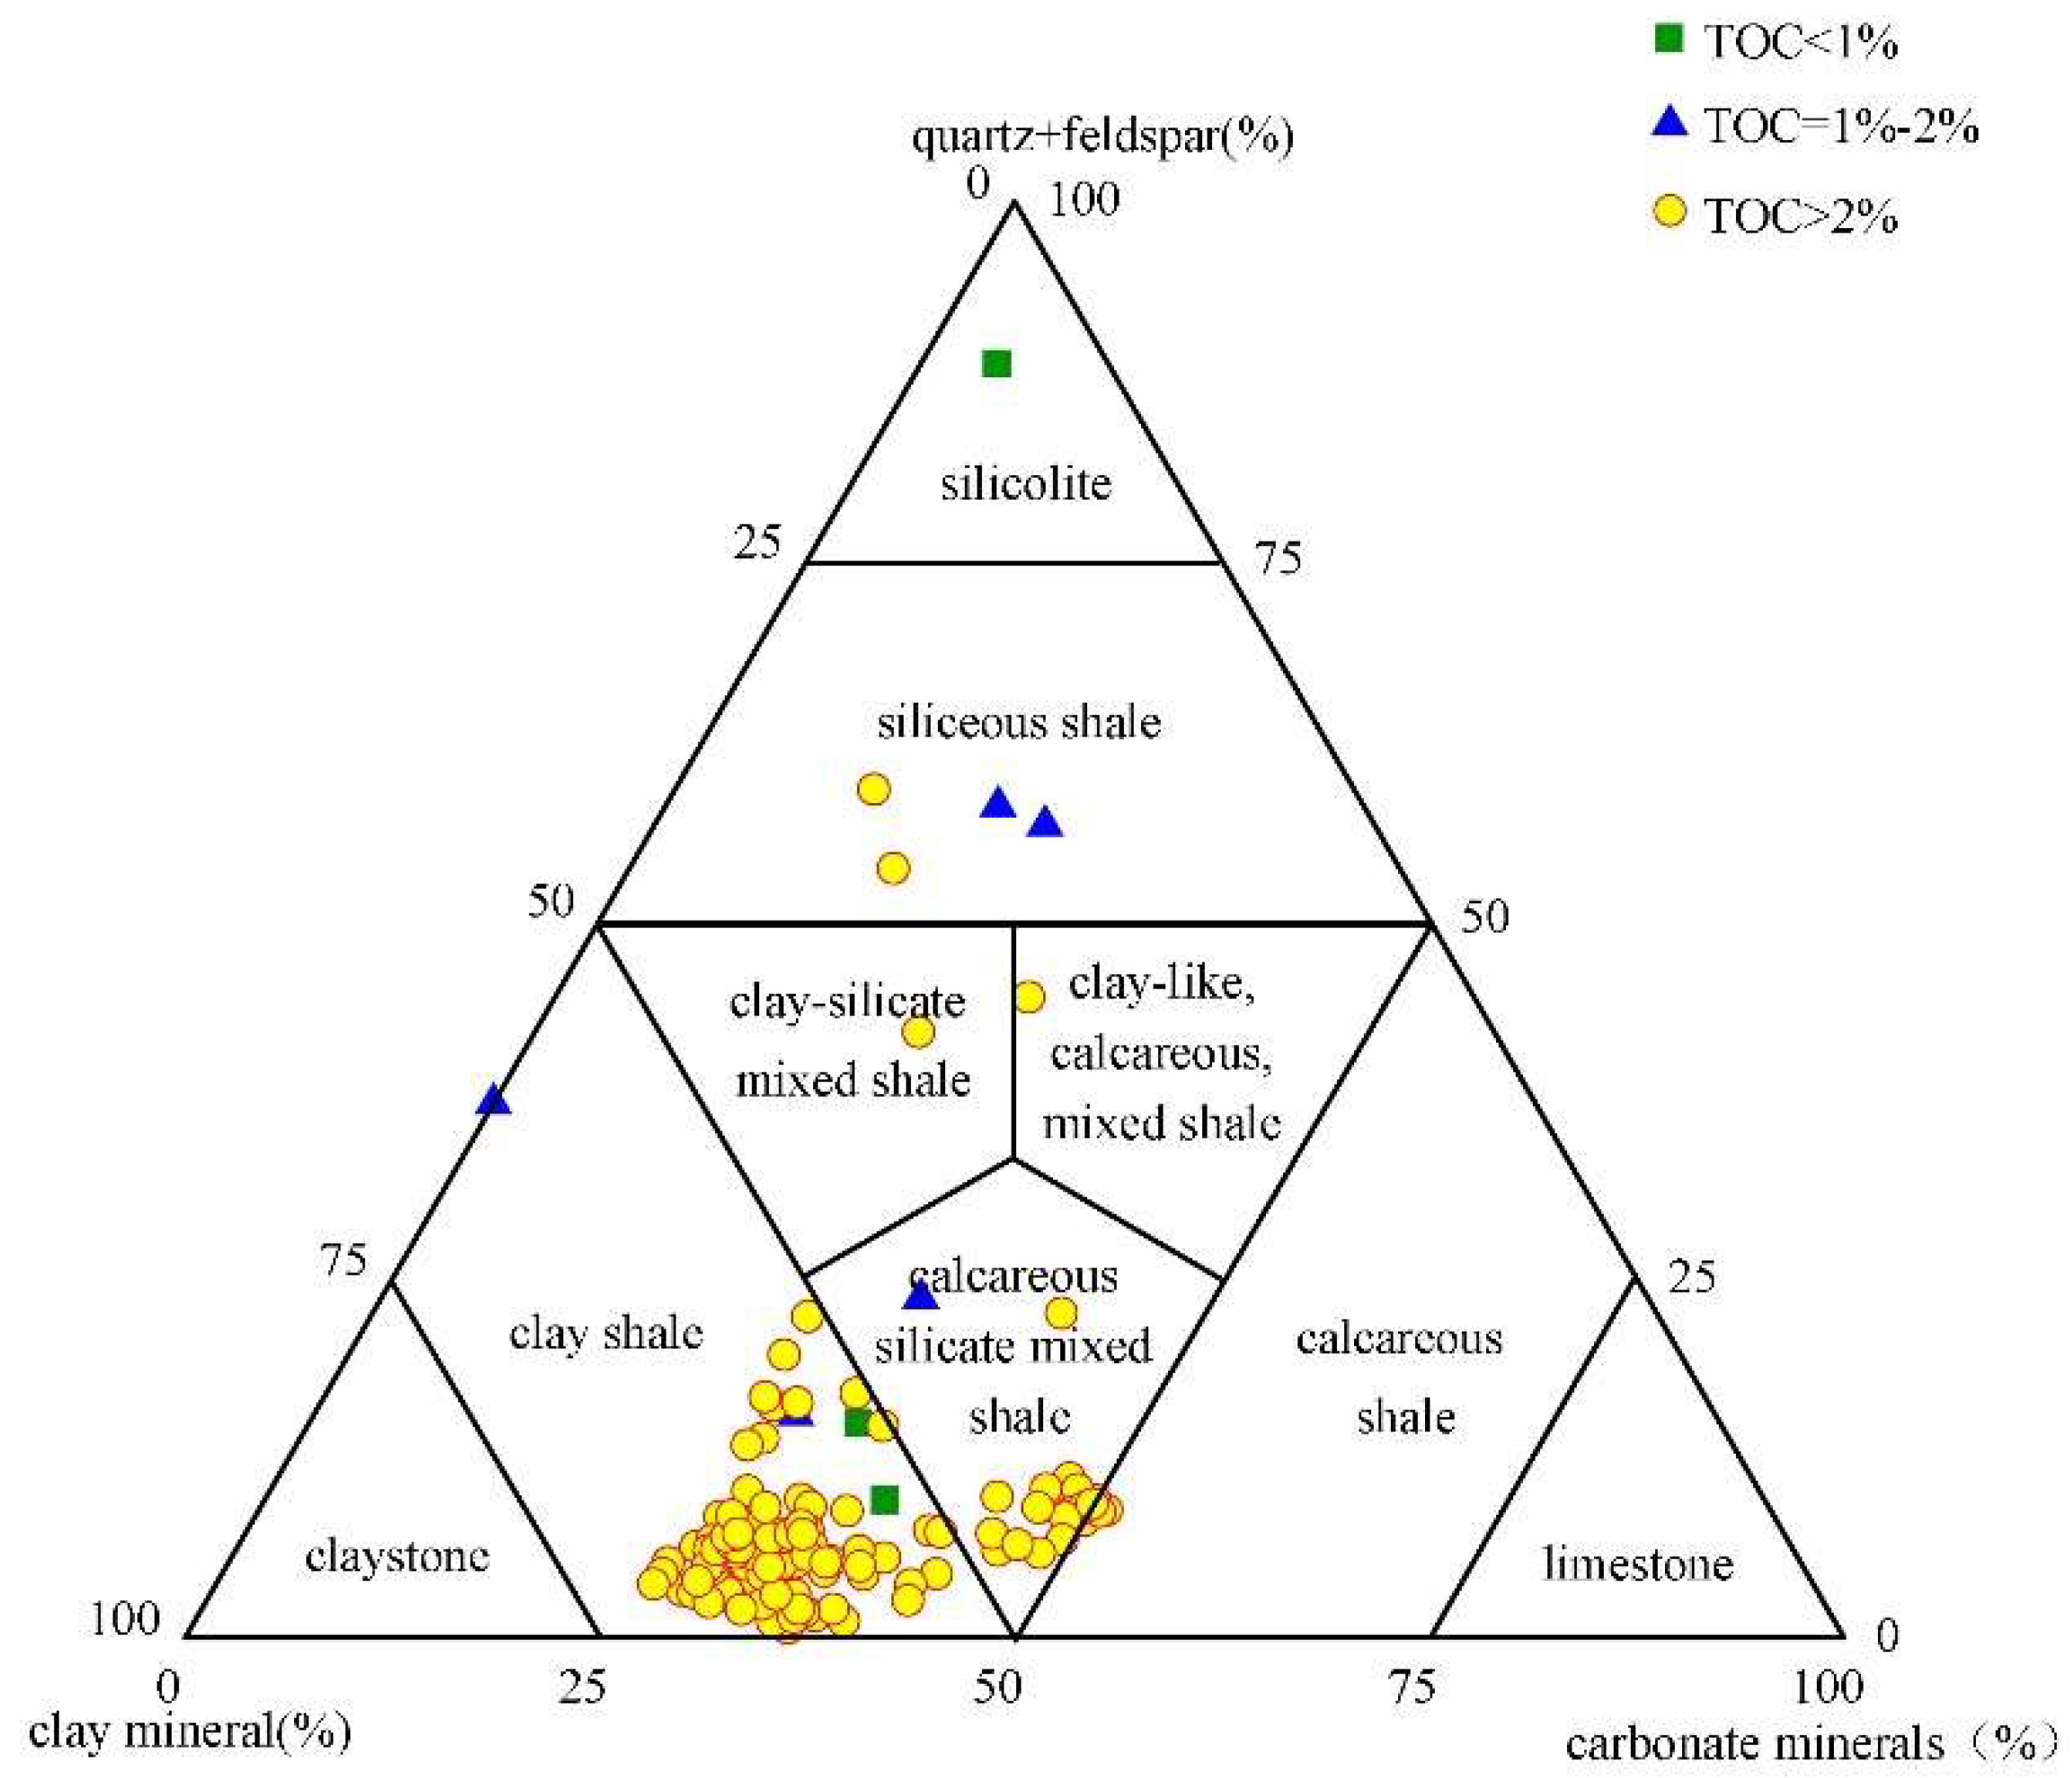
34]. This study intends to adopt the ternary classification method for marine shale of the Lower Paleozoic in the Sichuan Basin. The classification pattern diagram is established based on the content of three end-member mineral groups: feldspathic (quartz + feldspar), carbonate minerals, and argillaceous minerals, and this is used to analyze the lithofacies types of marine shale in the study area [
33]. In the study area, argillaceous shale is predominant (
Figure 3), with some calcareous silicic mixed shale, and a smaller amount of siliceous rocks and siliceous shale. There are very few shales with TOC <1% in the core samples collected in this study, and most samples have TOC content greater than 2%, indicating that the organic matter content of the shale layers in Niutitang Formation of the study area is relatively high, with good potential for hydrocarbon generation and storage capacity.
4.1.2. Petrological and Mineralogical Features
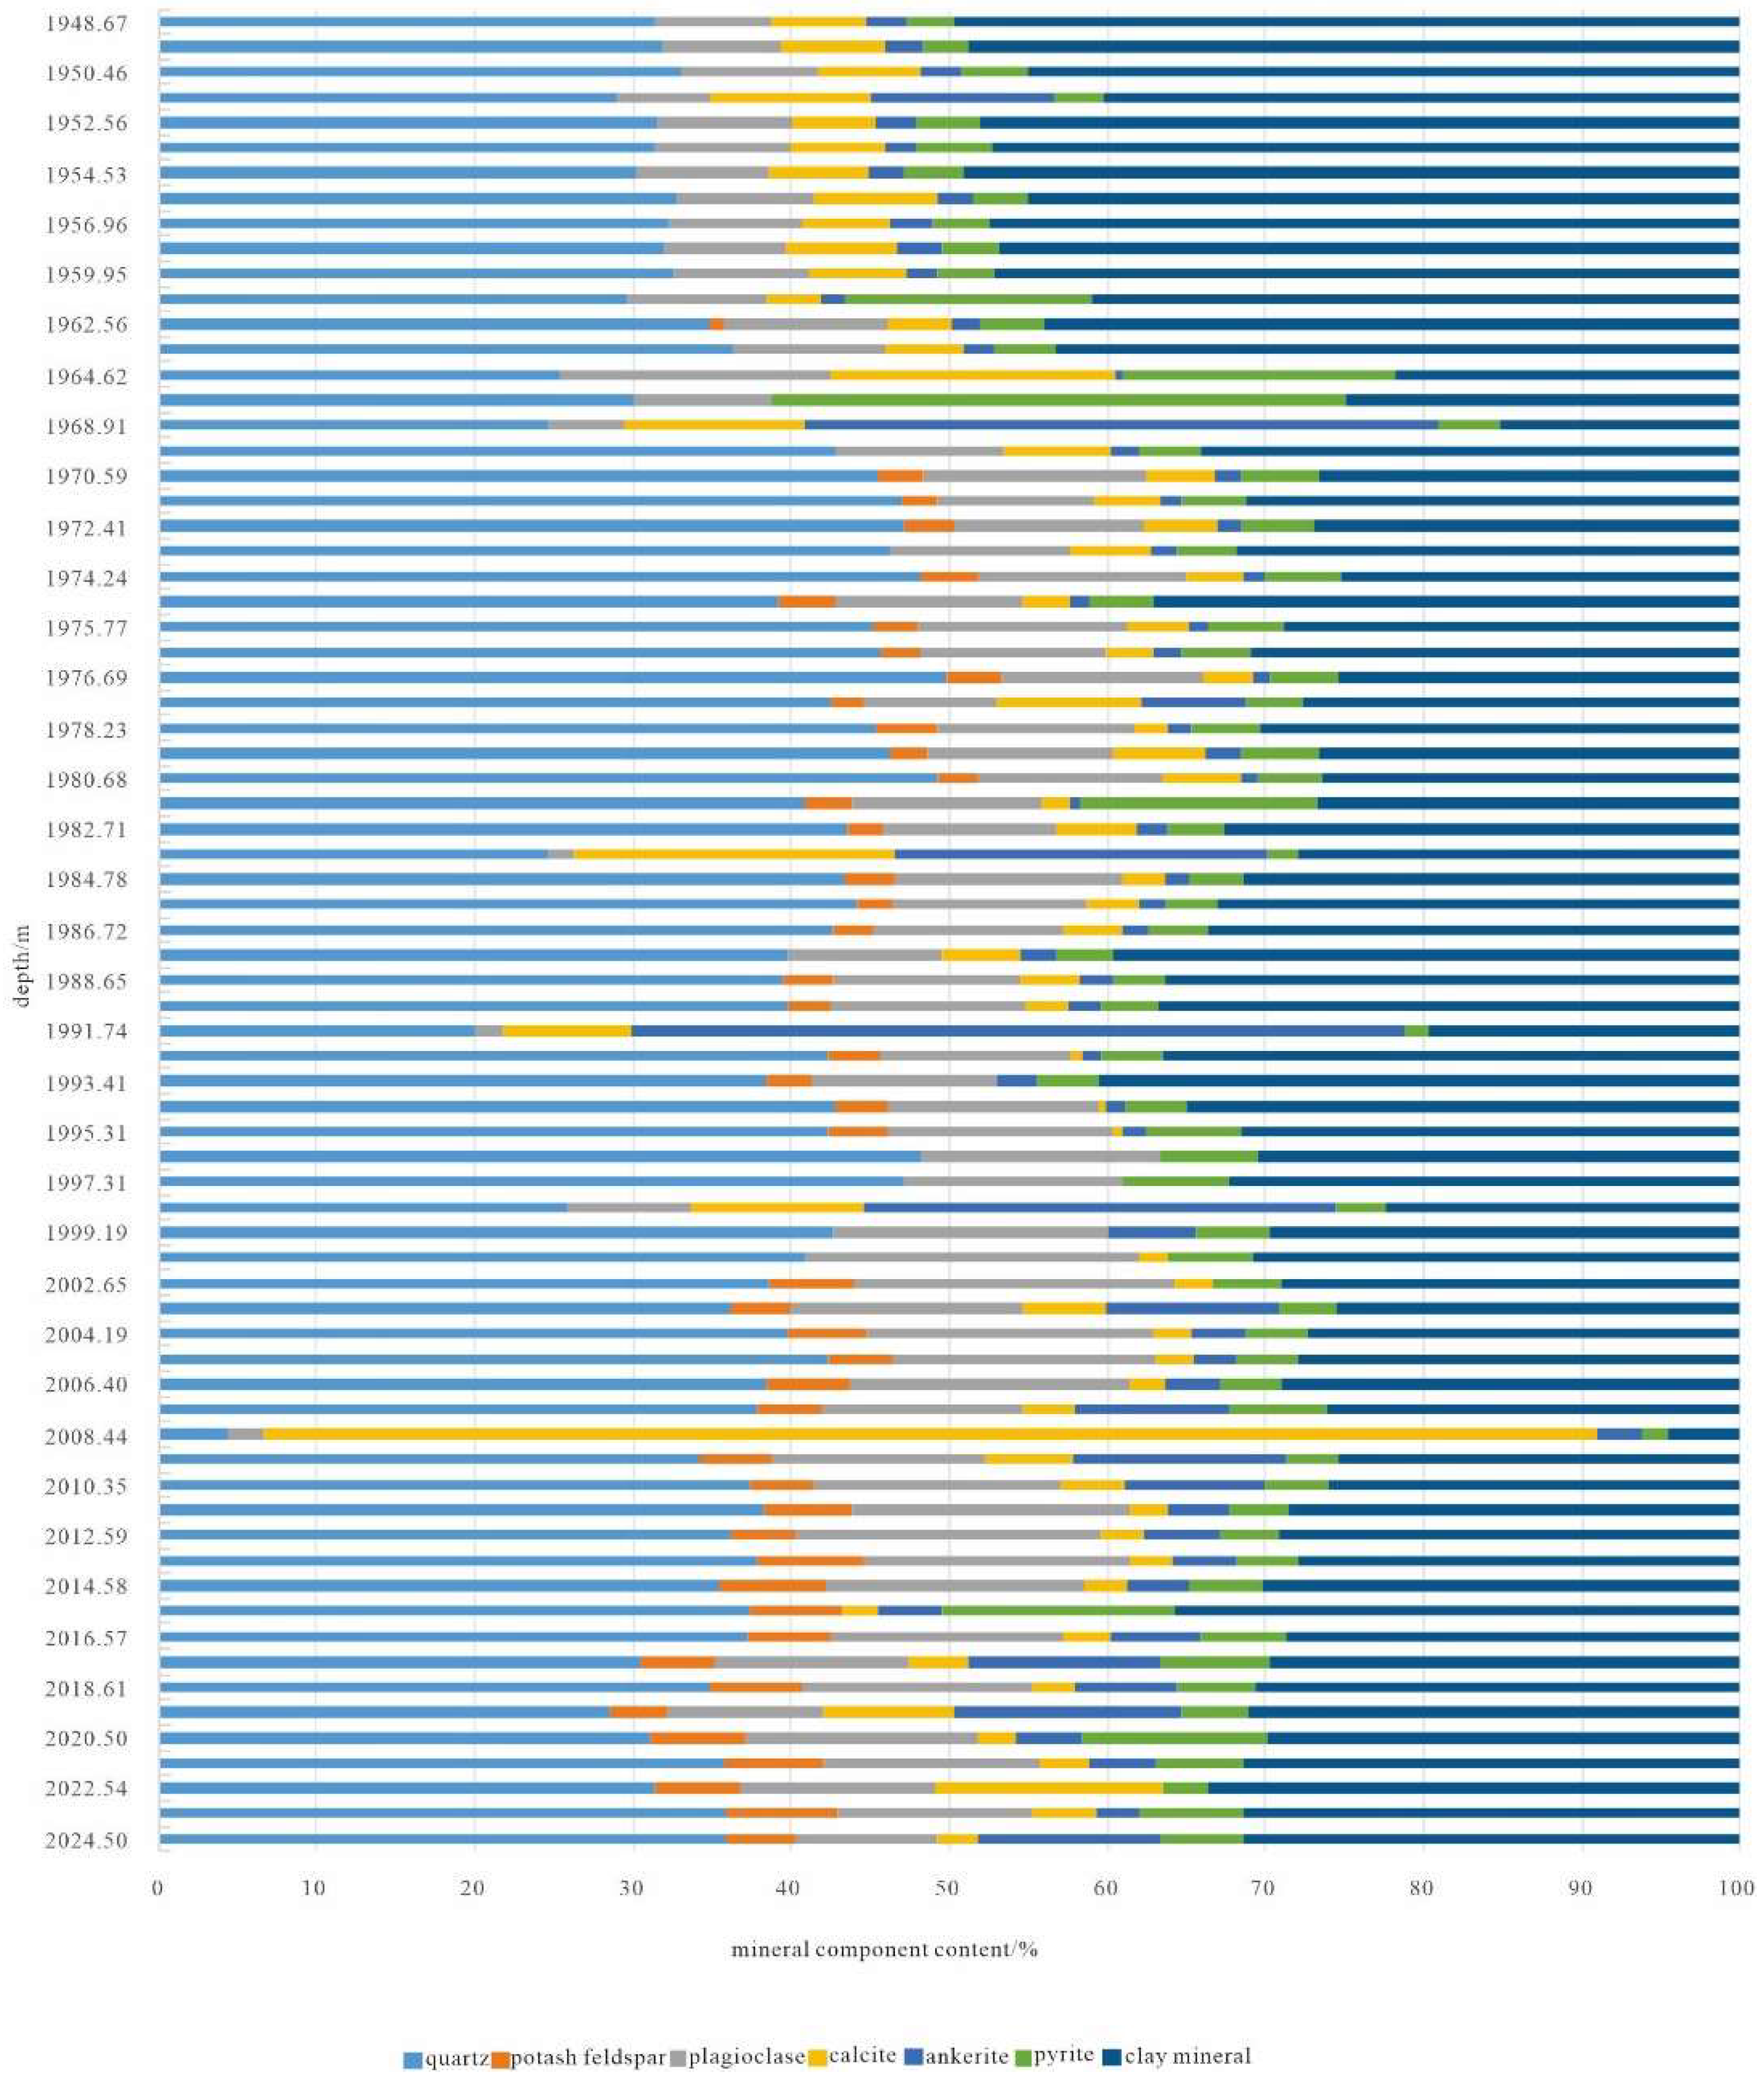
Based on X-ray diffraction (XRD) whole-rock diffraction experiments, the constituent minerals of Niutitang Formation shale in Zhenba area are primarily clay minerals, quartz, potassium feldspar, plagioclase, calcite, dolomite, and pyrite, with relatively high content of brittle minerals (
Figure 4). This indicates that the shale in this region is prone to fracturing under external forces, which is favorable for the subsequent exploration and development of shale gas. Analysis of the relative content map of clay minerals in the study area (
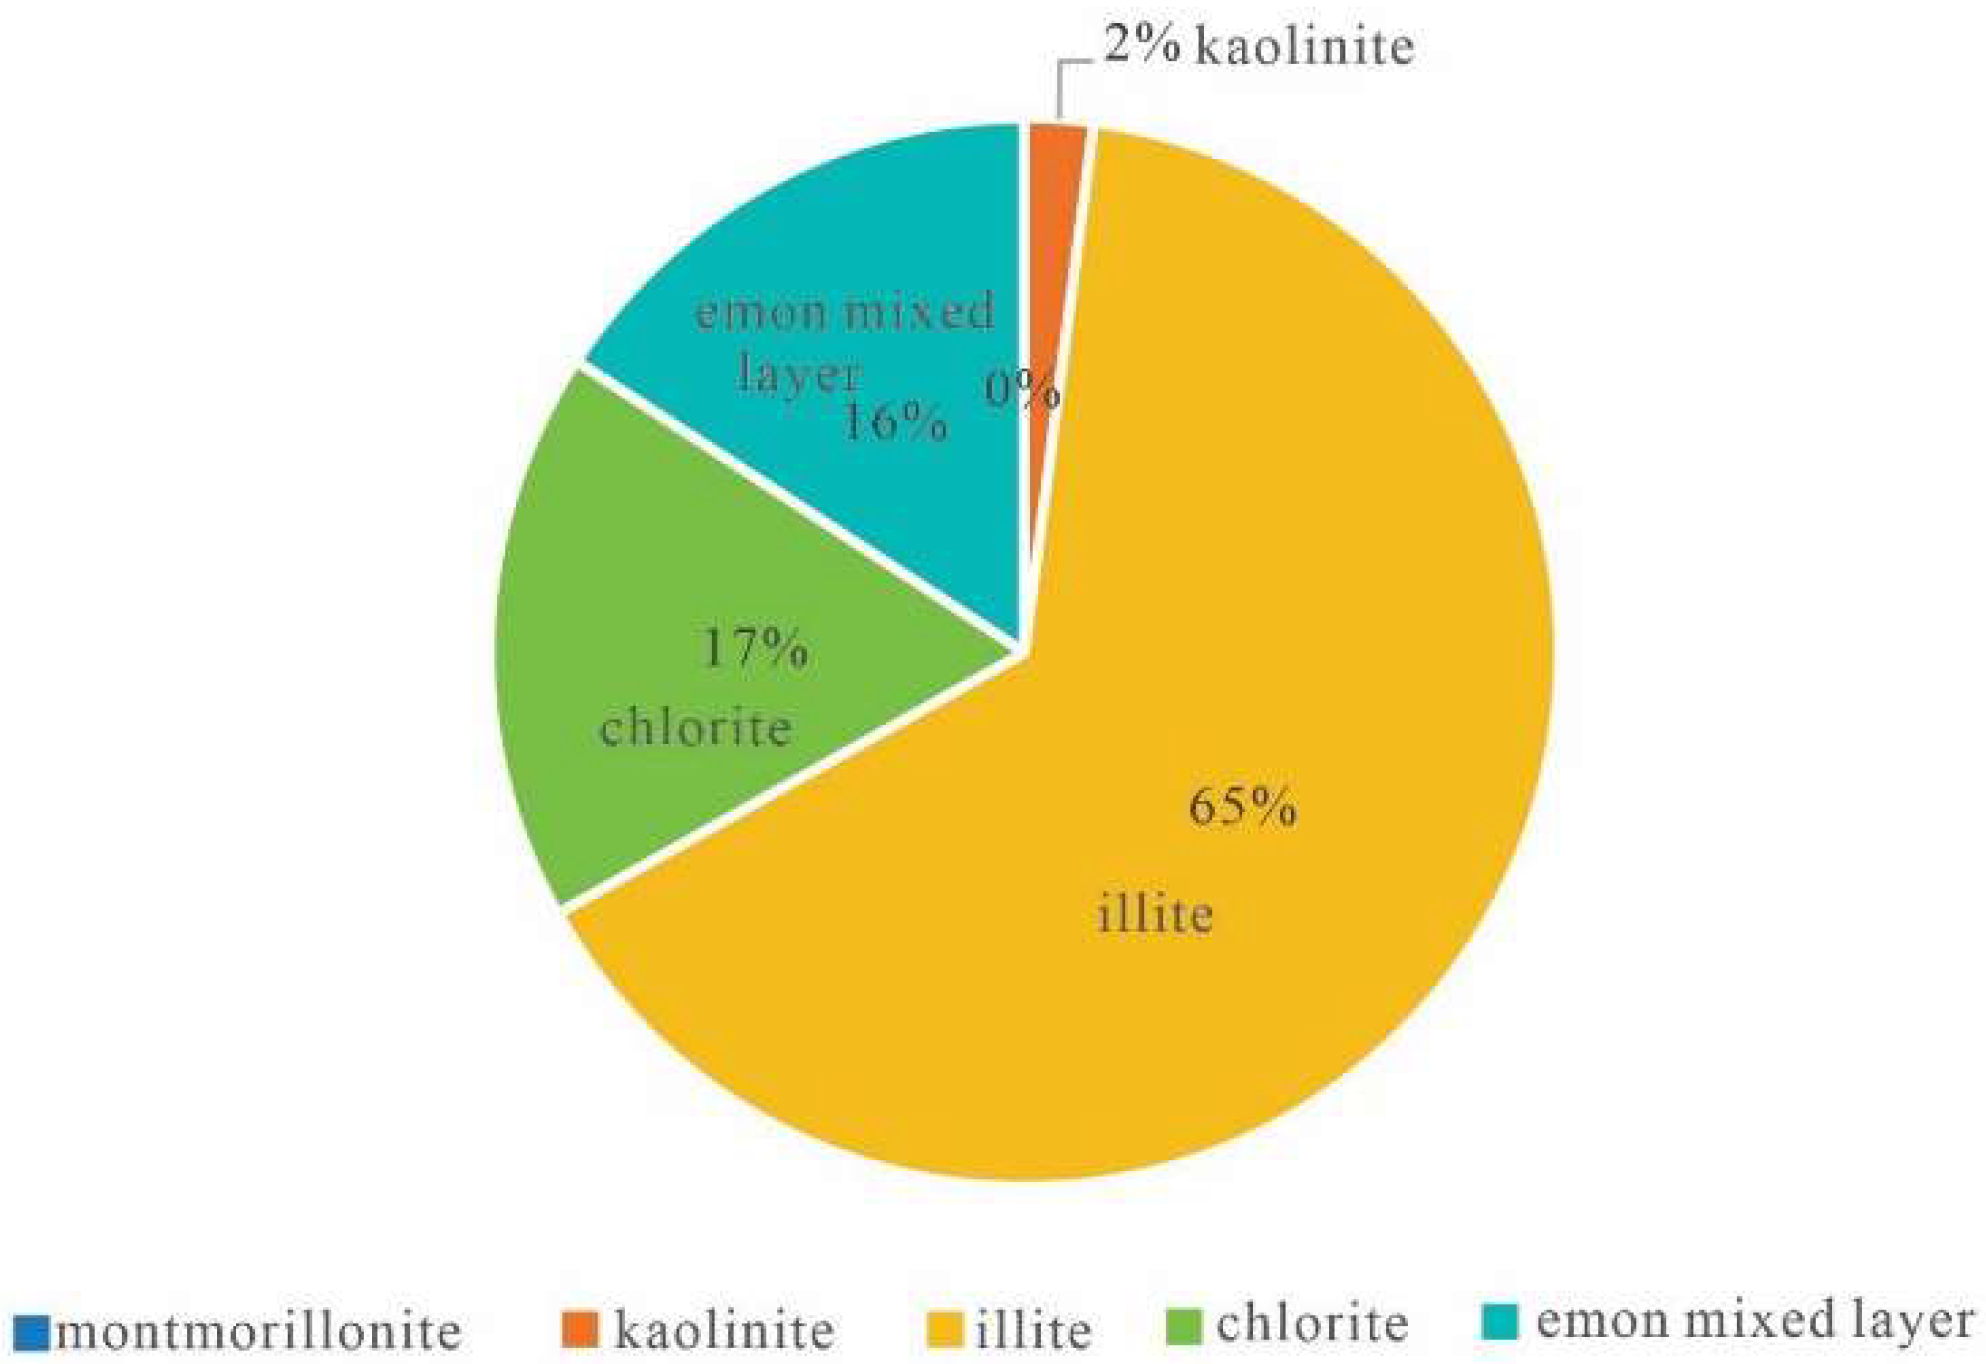
Figure 5) reveals that the clay minerals in Niutitang Formation shale, specifically illite, chlorite, and illite-smectite mixed layers, are abundant. The presence of these minerals confers a certain adsorption capacity, which is advantageous for the retention of shale gas.
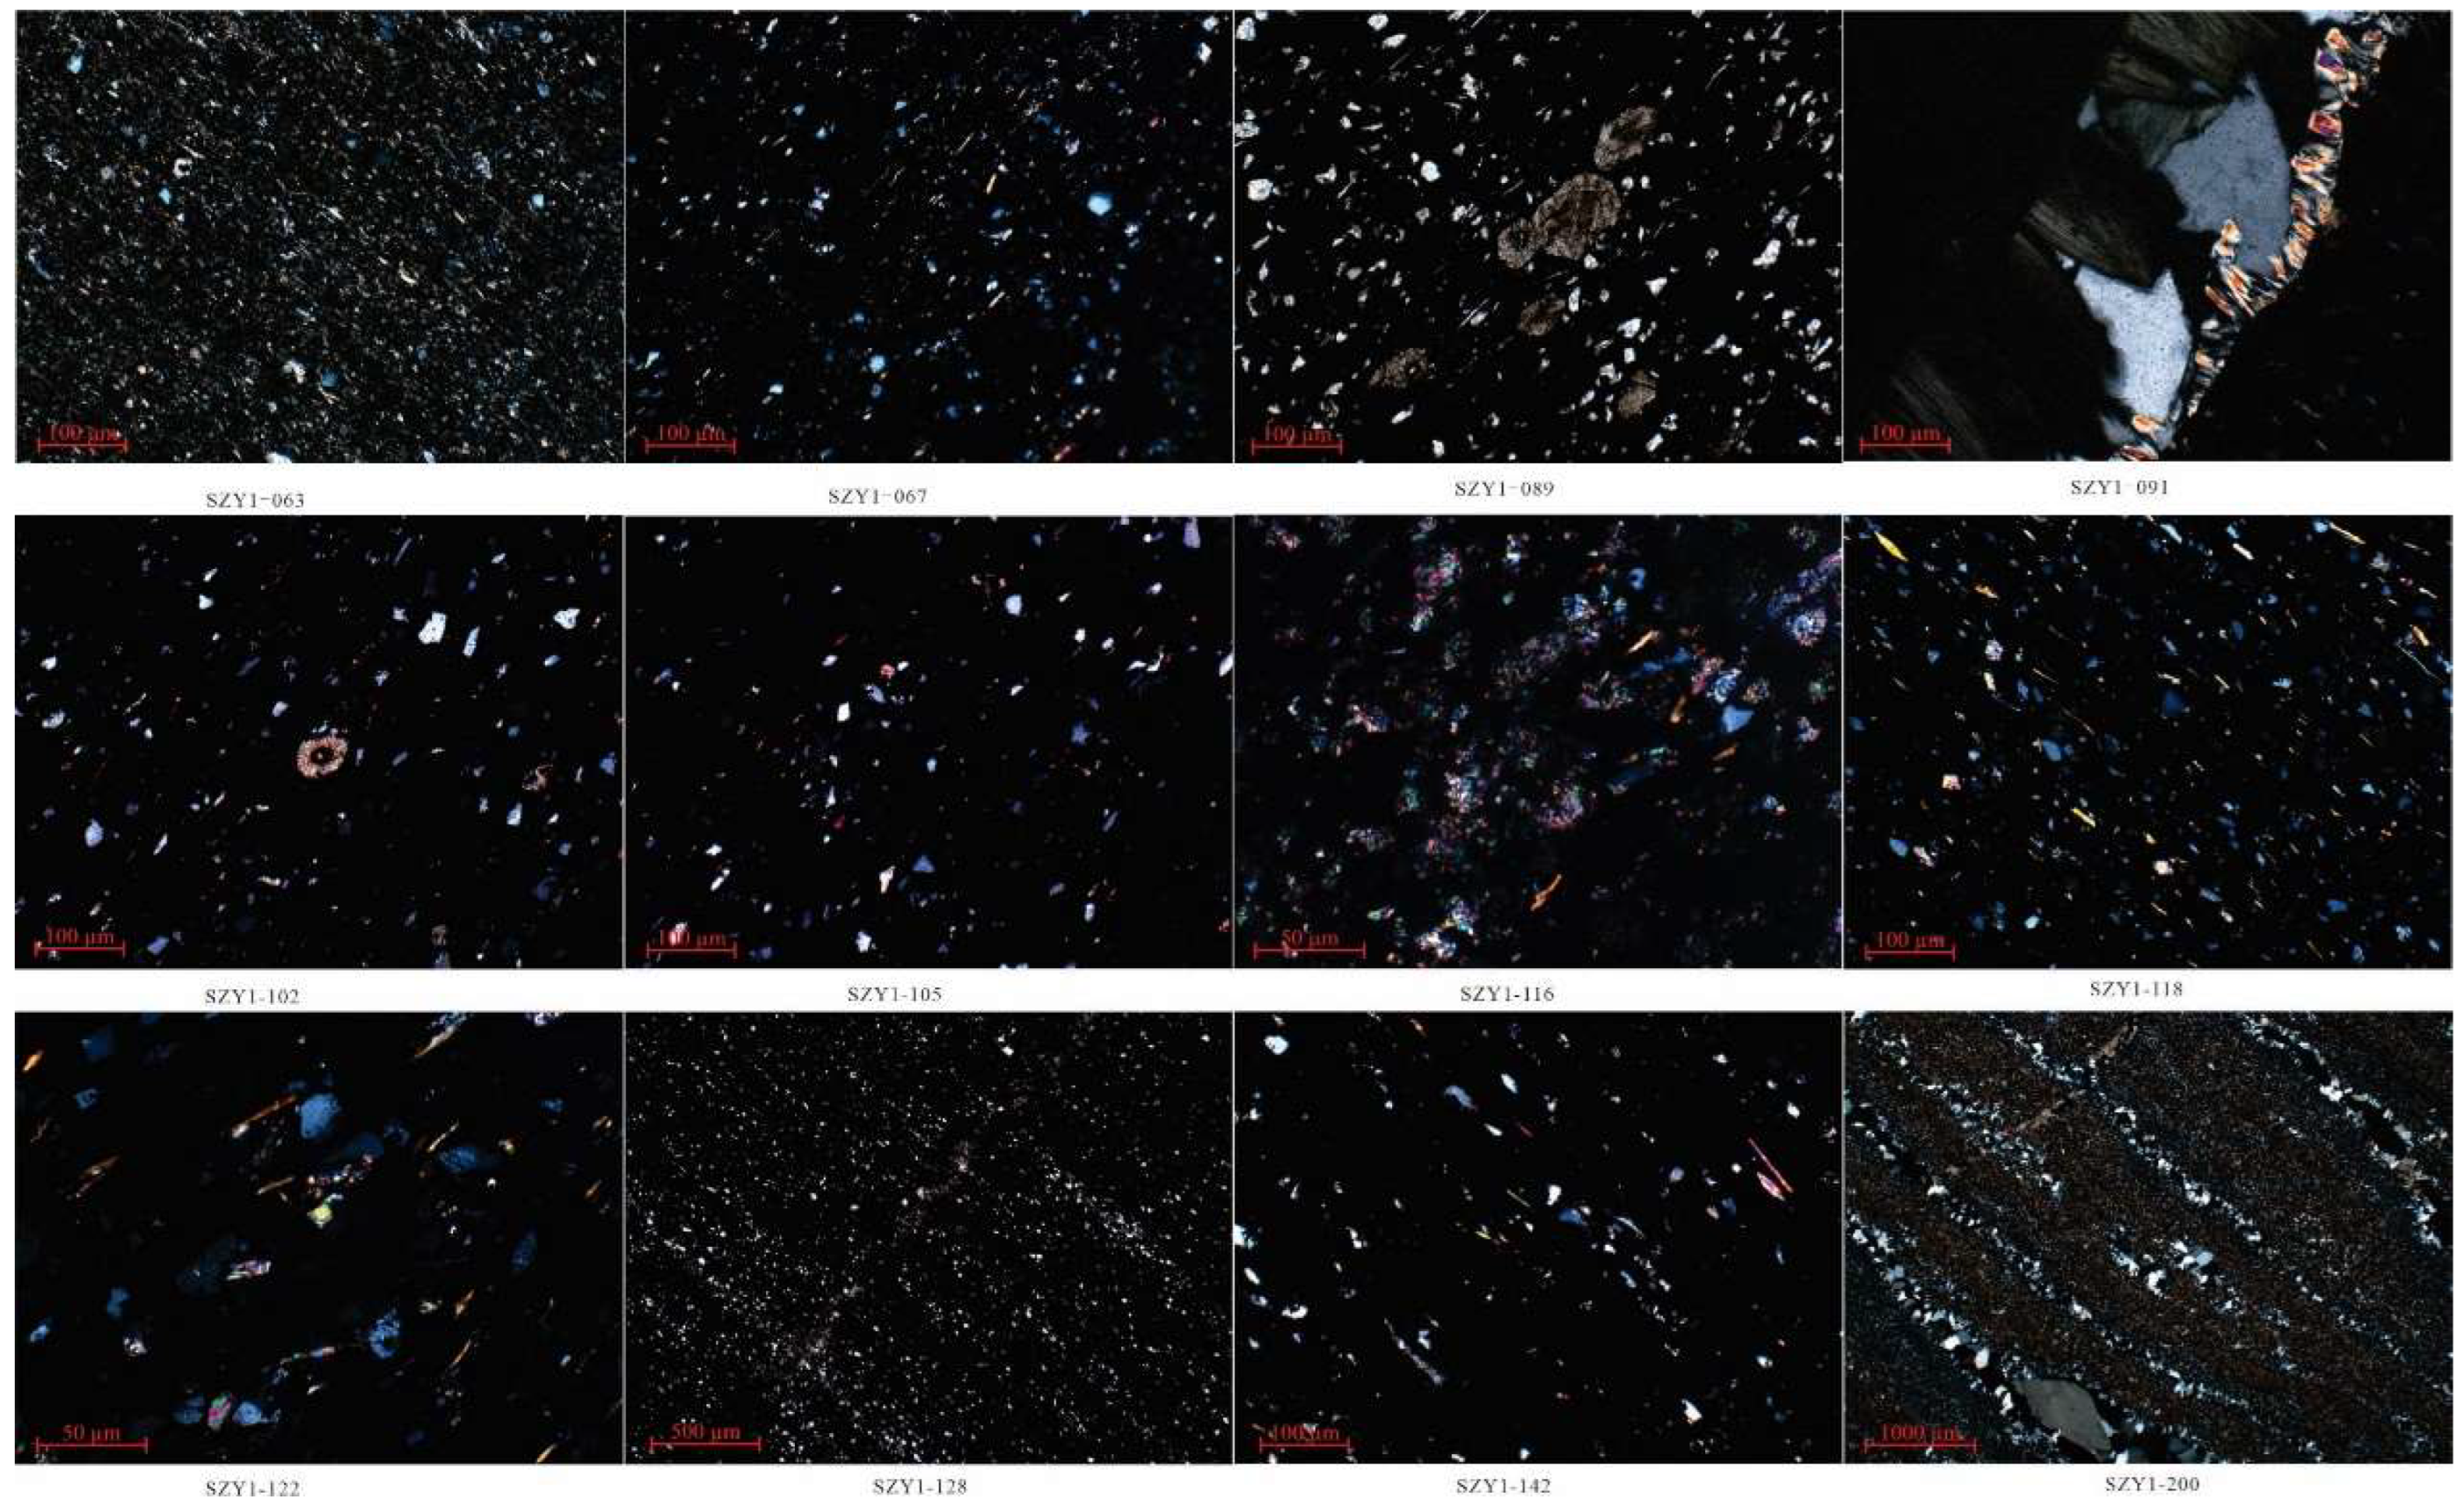
(SZY1-063: Quartz and feldspar are interbedded, with dissolution micro-fractures filled by calcite, at a depth of 1958.15 meters;SZY1-067: Inhomogeneous distribution of quartz, feldspar, and organic matter, massive structure, at a depth of 1959.99 meters;SZY1-089: Oolitic bioclastic cavities filled with calcite cement, at a depth of 1970.64 meters;SZY1-091: Development of silicate and silica cements within fractures, at a depth of 1971.63 meters;SZY1-102: Oolitic bioclastic cavities filled with calcite cement, massive structure, at a depth of 1976.72 meters;SZY1-105: High content of organic matter, overall black in color, at a depth of 1978.26 meters;SZY1-116: Peloidal dolomitic shale, with granular peloidal dolomite grains interspersed with organic matter, at a depth of 1983.81 meters;SZY1-118: Flaked mica minerals are nearly aligned, at a depth of 1984.82 meters;SZY1-122: Intergranular spaces filled with a significant amount of black organic matter, at a depth of 1986.74 meters;SZY1-128: Detrital quartz grains are distributed in a silty stratified pattern, at a depth of 1989.59 meters;SZY1-142: Developed horizontal bedding structures, with detrital particles aligned, at a depth of 1996.41 meters;SZY1-200: Micro-fractures filled with silica, dolomite, and bitumen, at a depth of 2027.86 meters)
Petrographic Observations Reveal, in the study area, Niutitang Formation shale is characterized by a high content of quartz and feldspar. Mica and other flaky minerals are often aligned parallel to the bedding direction, and laminated structures are developed with minor dissolution fractures filled by calcite and other minerals (
Figure 6.SZY1-063); the content of organic matter and argillaceous material is high, overall appearing black, with uneven distribution of quartz and feldspar detritus particles, generally exhibiting a massive structure without distinct bedding (
Figure 6.SZY1-067); the distribution of particles such as quartz and feldspar is uneven, with a high content of intraclasts, and it is common to find oolitic bioclastic cavities filled with calcite cement (
Figure 6.SZY1-089,
Figure 6.SZY1-102); the content of quartz detritus increases, showing a slightly horizontal laminated distribution, with developed fractures, within which carbonate and silica cements develop sequentially from the outside to the inside, and later re-activated by tectonic fracturing and re-cementation (
Figure 6.SZY1-091); no obvious lamination is developed, and apart from compaction, no other diagenetic processes are observed (
Figure 6.SZY1-105); the shale is of peloidal dolomite composition, with a matrix primarily consisting of granular peloidal dolomite, commonly interspersed with detrital particles such as quartz, and granular peloidal dolomite grains interspersed with organic matter, which is also relatively high in content; overall, a faint horizontal laminated structure is observed, with a certain degree of orientation of the detrital particles (
Figure 6.SZY1-116); the content of quartz detritus is high, with a large amount of black organic matter filling the intergranular spaces, and a common presence of a large number of flaky mica minerals that are nearly aligned; horizontal laminated structures are developed, mainly influenced by compaction (
Figure 6.SZY1-118,
Figure 6.SZY1-122); detrital quartz particles are distributed in a silty stratified pattern, with developed horizontal lamination and the development of a single micro-fracture, filled with calcite cement, detrital particles are nearly aligned, mainly influenced by compaction, with few other diagenetic processes observed (
Figure 6.SZY1-128,
Figure 6.SZY1-142); the matrix is of micritic dolomite, with numerous micro-fractures developed, filled with a large amount of silica and granular dolomite as well as bitumen; horizontal lamination is developed; diagenetic processes are dominated by micritic carbonate recrystallization, with silica and dolomitic cementation occurring within the fractures (
Figure 6.SZY1-200).
4.2. Reservoir Pores
Pores and fractures directly affect the permeability, storage capacity, and fluid flow of shale reservoirs, making them crucial factors in evaluating the quality of shale reservoirs [
35,
36,
37]. Shale pores can be categorized by size into three classes: micropores <2 nm, mesopores 2 to 50 nm, macropores >50 nm, and ultra macropores >100 nm [
38].
Scanning electron microscopy observations reveal that the pores in the Lower Cambrian Niutitang Formation shale of the study area are well developed. At 3000x magnification, quartz particles, muscovite, and pyrite grains are visible, along with the development of fractures and micro-fractures filled with bitumen and localized intergranular pores (
Figure 7a); intercry stalline pores in clay minerals measure 168 nm, micropores within organic matter measure 92 nm, and dissolution pores within calcite measure 160 nm, classifying as macropores and ultra macropores (
Figure 7b); at 6KX, framboidal pyrite intercry stalline pores filled with bitumen are visible, with micropores developed within the bitumen, and partially filled intercry stalline pores in clay minerals with localized development of intercry stalline pores (
Figure 7c); at 500X, overall view shows the development of layer-parallel fractures, with bitumen filling in fractures and micro-fractures, and framboidal pyrite particles visible (
Figure 7d); intergranular pores measure approximately 397 nm, and organic matter pores range from 95 nm to 192 nm, all classifying as ultra macropores (
Figure 7e); the long axis of mineral intercry stalline pores measures 774 nm, and organic matter pores range from 60 nm to 147 nm, with numerous micro-fractures developed internally (
Figure 7f); at 800X, large granular and framboidal pyrite are visible, with dissolution pores visible within calcite, and development of mineral intergranular pores (
Figure 7g); intergranular pores measure approximately 786 nm, organic matter pores measure about 156 nm, and pyrite intercry stalline pores measure about 92 nm (
Figure 7h); organic matter pore sizes range from about 28 nm to 326 nm (
Figure 7i); at 600X, an enlarged view of fractures shows the development of mineral intergranular pores around the fractures, with granular and framboidal pyrite dispersedly distributed (
Figure 7j); pyrite intercry stalline pores measure about 313 nm, organic matter micropores range from 221 nm to 263 nm, and micro-fracture widths measure about 538 nm (
Figure 7k); at 6.48KX, framboidal pyrite exhibits a small number of intercry stalline pores, clay mineral intercry stalline pores are predominantly linear, with organic matter partially filling and a small number of micropores developed (
Figure 7l); at 6.58KX, clay mineral intercry stalline pores appear linear, filled with organic matter and pyrite micro-particles, with organic matter developing micropores (
Figure 7m); mineral intergranular pores measure approximately 249 nm to 837 nm (
Figure 7n); organic matter micropore diameters range from 57 nm to 111 nm (
Figure 7o); at 49X, the overall view shows granular pyrite dispersedly distributed, with organic matter and micro-fractures aligned parallel to the layering (
Figure 7p); at 2.72KX, intergranular pores in clay minerals and mineral intergranular pores are visible, with some mineral particles exhibiting dissolution pores (
Figure 7q); internal pores within organic matter measure about 28.7 nm to 81.2 nm (
Figure 7r). The majority of the pores in Niutitang Formation shale in the study area are macropores and ultra macropores, with well-developed fractures, and the abundant development of pores and fractures provides important conditions for the storage and migration of shale gas [
39,
40].
4.3. Physical Property
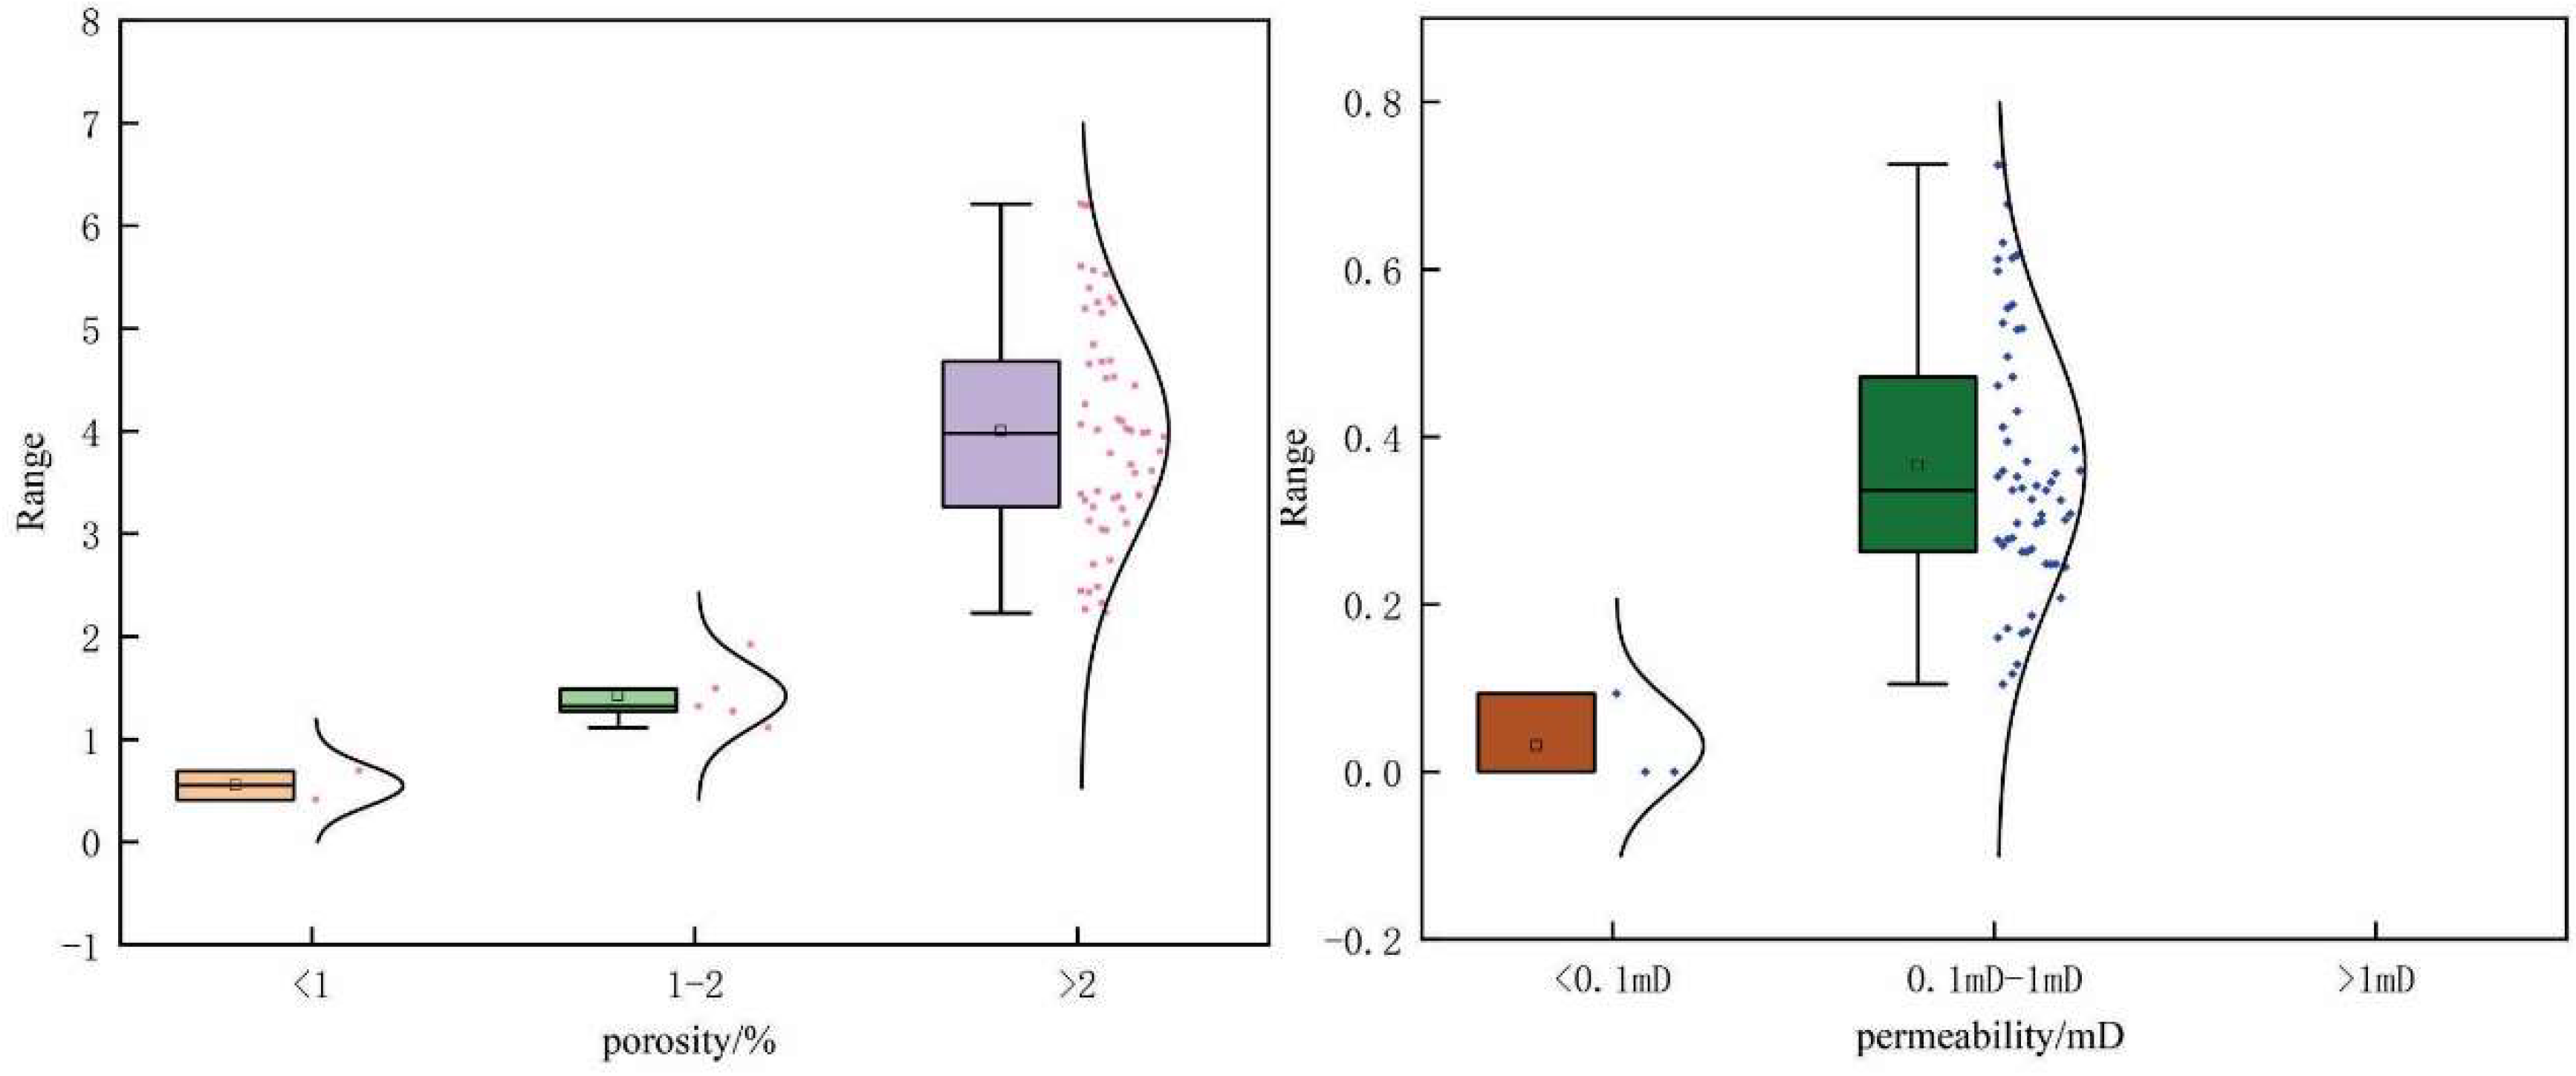
A total of 72 shale samples from the Lower Cambrian Niutitang Formation in the study area were subjected to physical property analysis. Among these, 62 shale samples exhibited porosity ranging from 0.41% to 6.21%, with an average porosity of 3.68%. Samples with porosity less than 1% accounted for 3.2%, those with porosity greater than 2% accounted for 88.7%, and those within the range of 1% to 2% accounted for 8%. The permeability of the 62 samples ranged from 0.000129 mD to 0.73 mD, with an average permeability of 0.35 mD. Samples with permeability less than 0.1 mD accounted for 4.8%, none had permeability greater than 1.0 mD, and those within the range of 0.1 mD to 1.0 mD accounted for 95.2%. Overall, according to
Figure 8, the samples exhibit characteristics of low porosity and low permeability, which is consistent with previous research findings [
41,
42,
43].
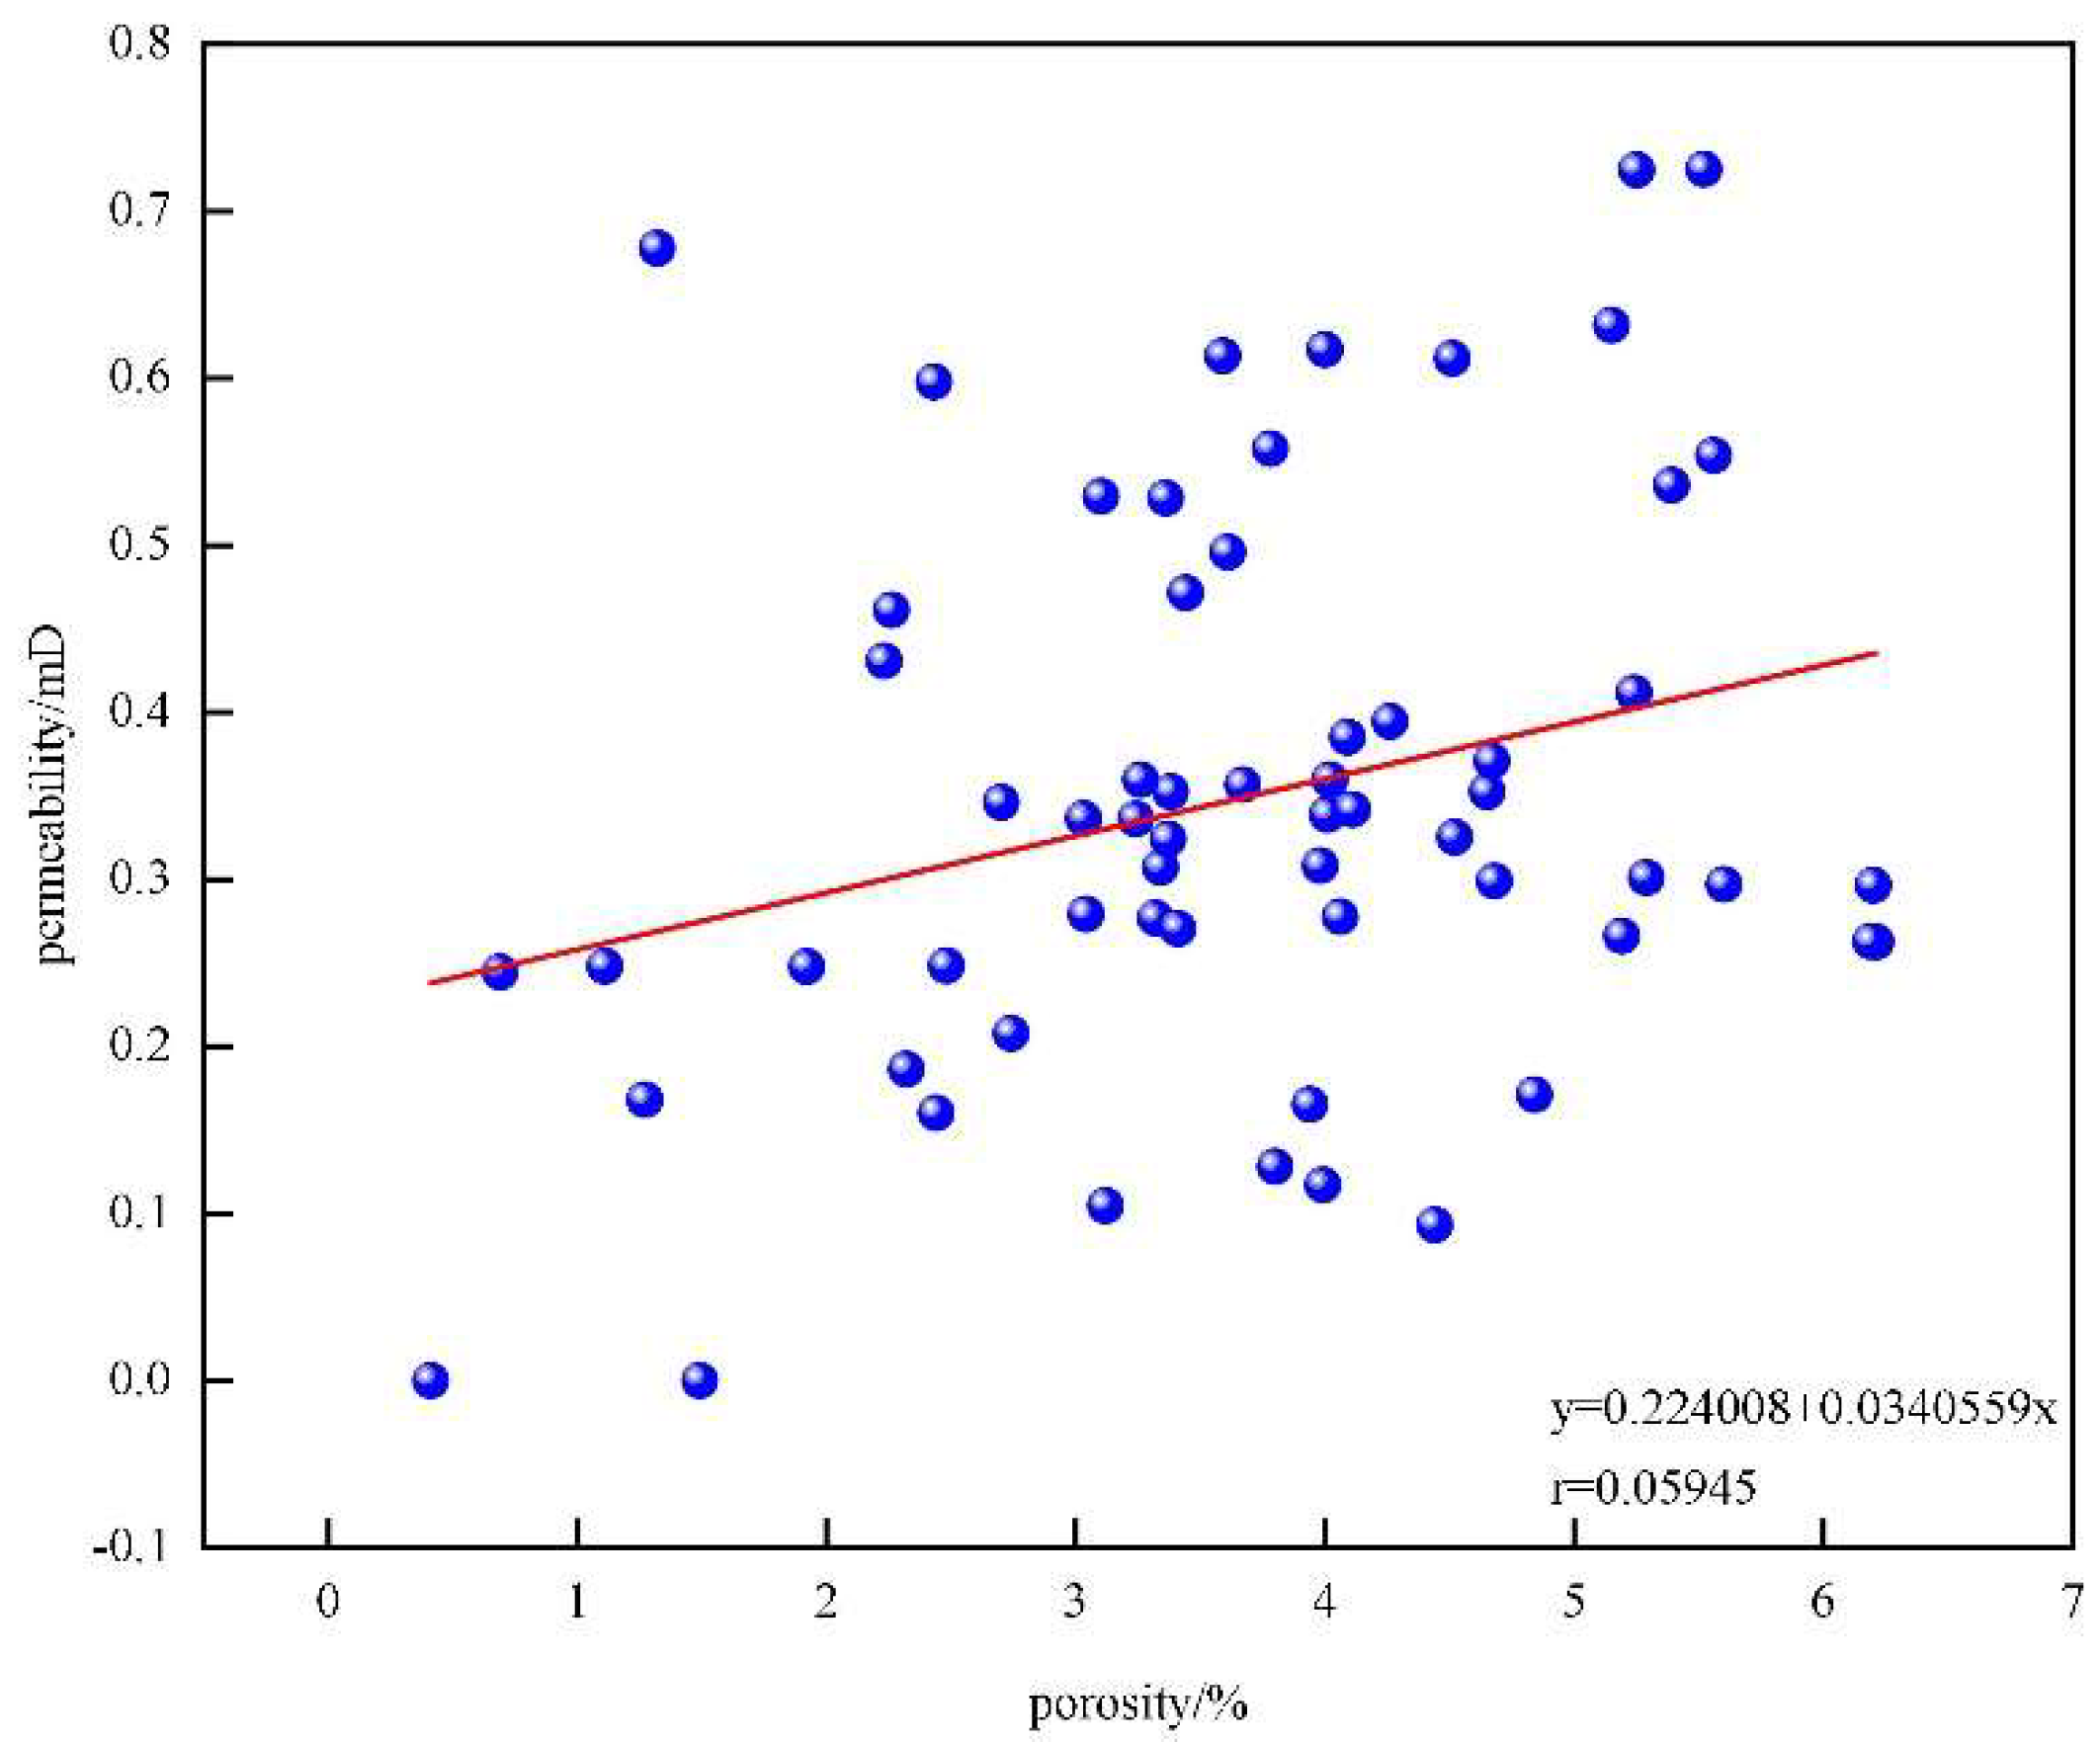
The correlation between porosity and permeability in the shale reservoirs of Niutitang Formation in the study area is relatively poor (
Figure 9), indicating a pronounced fracture-type reservoir characteristic, where fractures and pores significantly influence the reservoir's physical properties. The overall organic matter content of the shale samples is high, ranging from 11% to 69% with an average of 41.77%, which has the potential to alter the pore structure, affecting the connectivity of the pores and, consequently, the permeability.
5. Elemental Geochemistry
5.1. Major Element
(1) Major Element and Variation Patterns
Appendix Table A1 presents the primary analytical results of the shale samples. Among them, the abundances indicate that the three most abundant elements are SiO
2, Al
2O
3, and TFe
2O
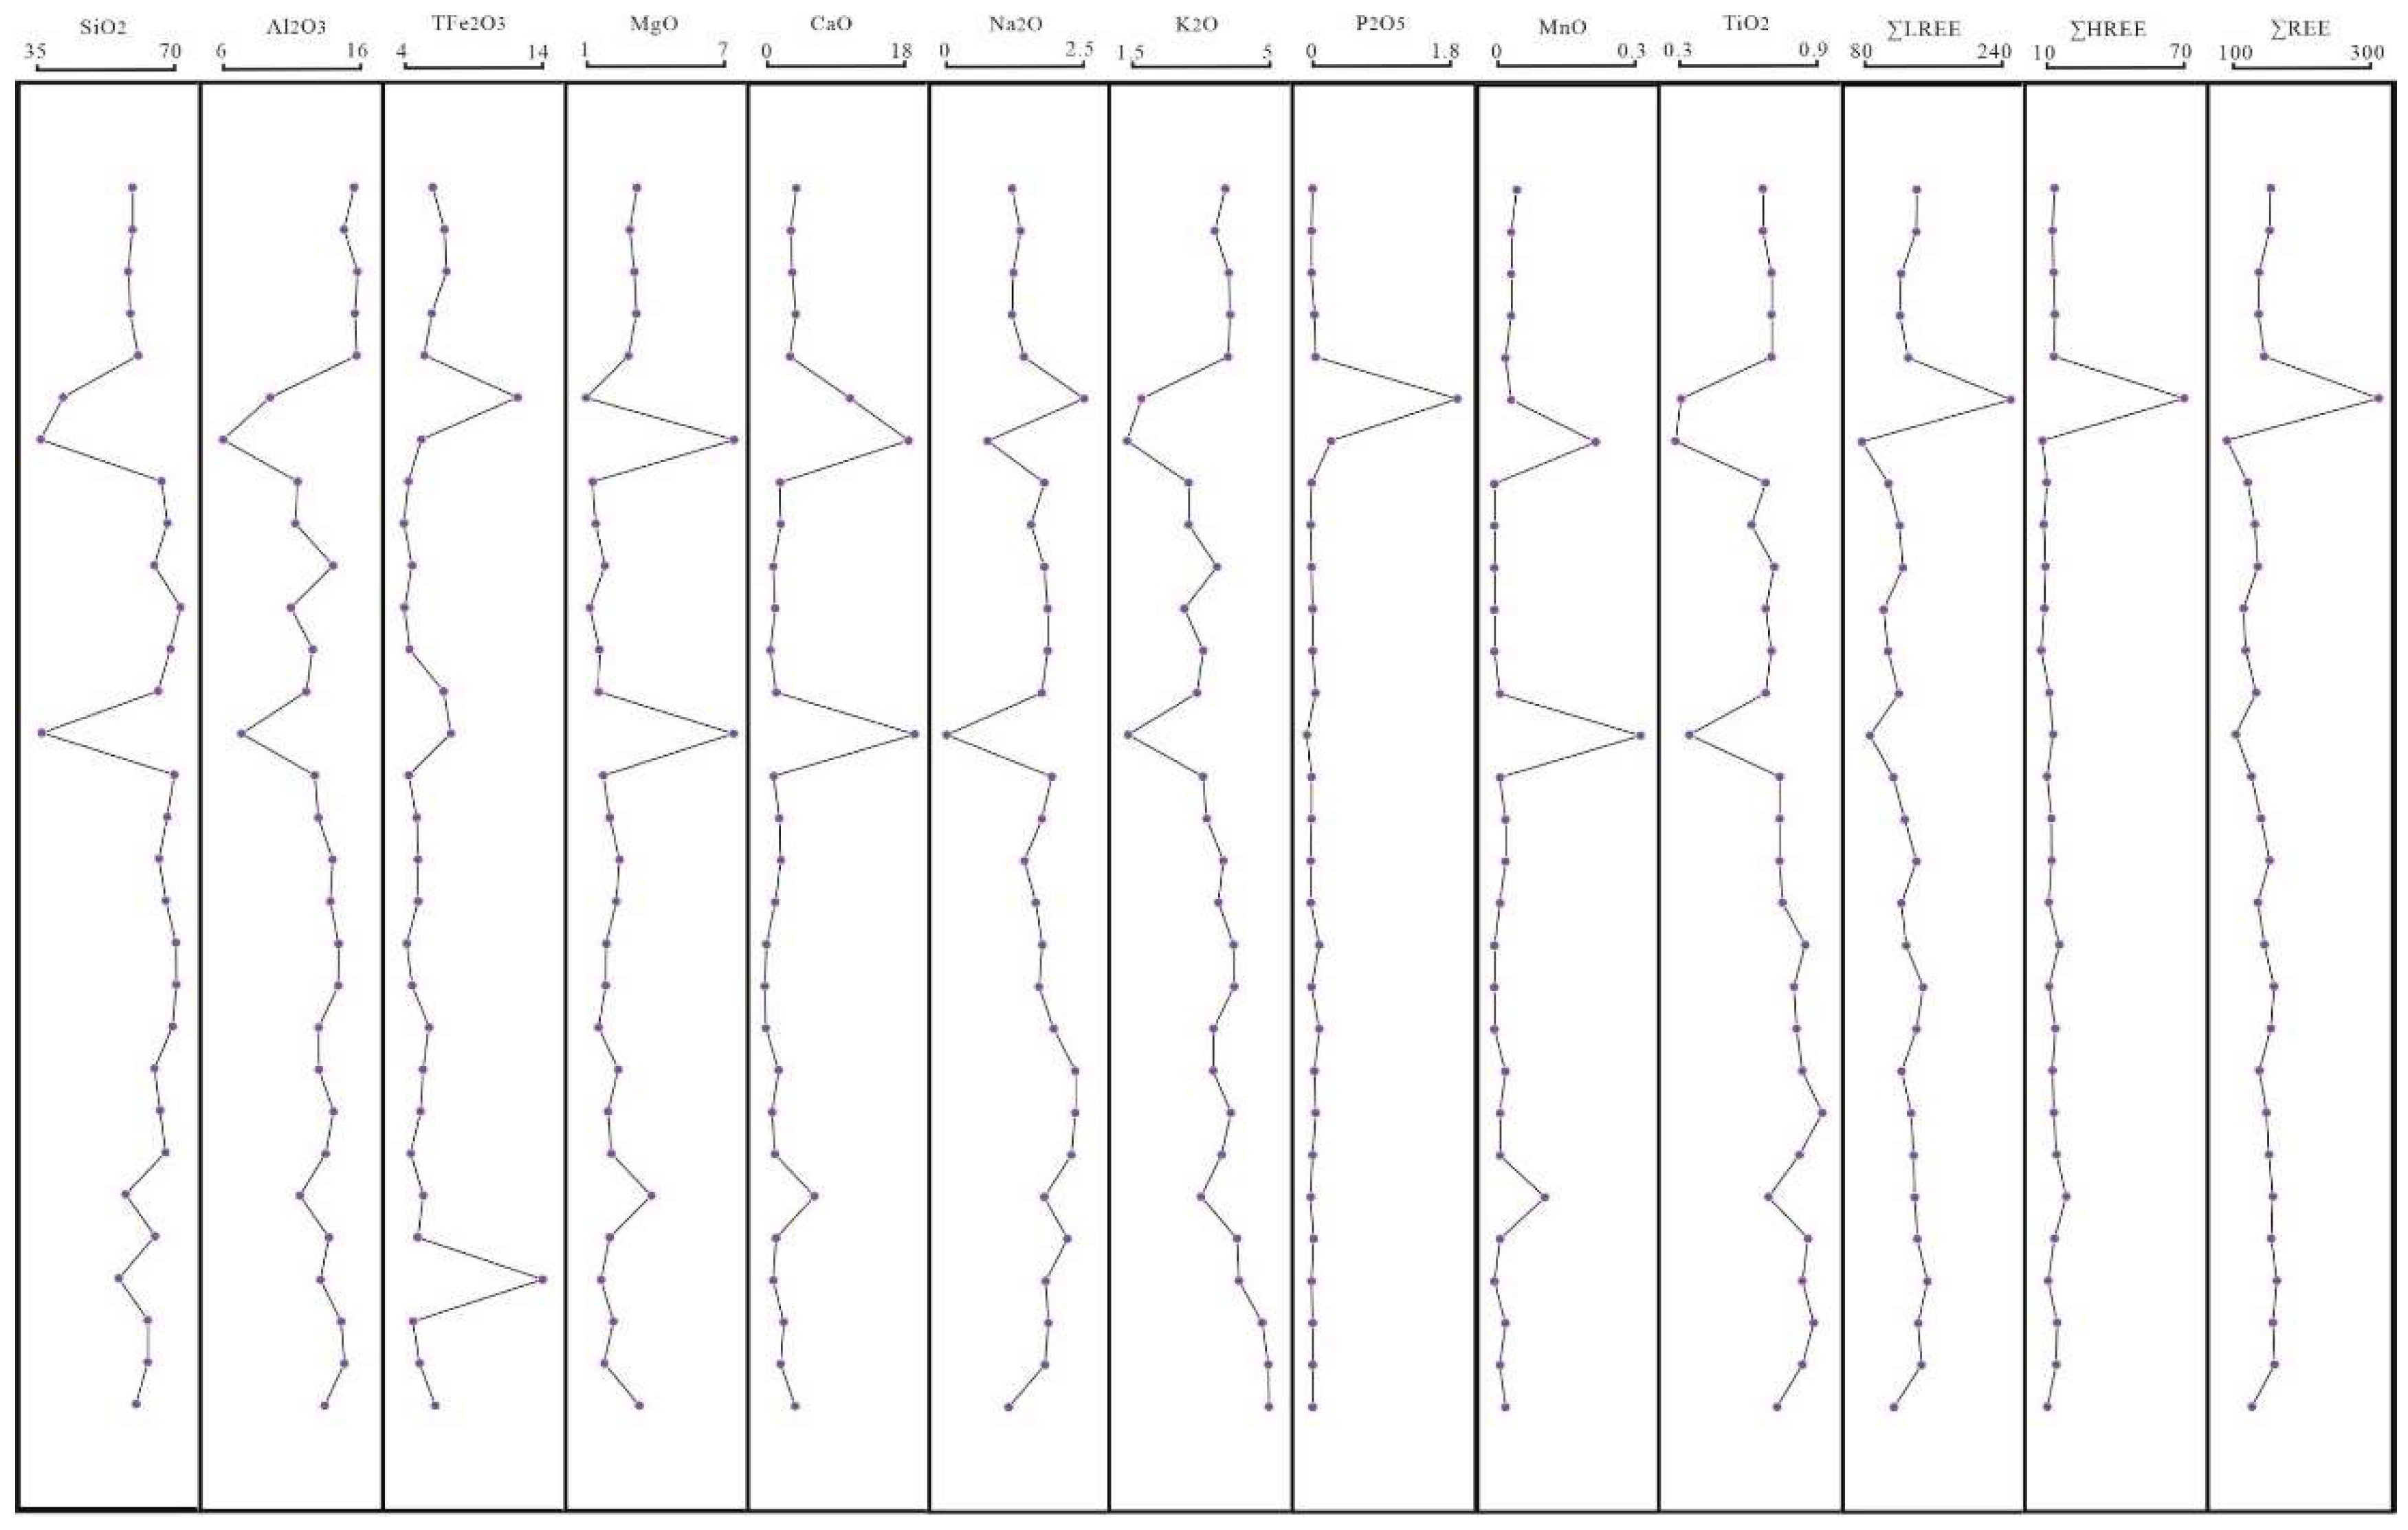
3, with average values of 56.39%, 12.81%, and 5.71%, respectively. The average concentrations of other major elements are all less than 5%. The overall content of major elements in the shale samples varies little, with no distinct vertical variation pattern, suggesting a relatively low degree of heterogeneity in the shale samples (
Figure 10). Variations in Al
2O
3 and TiO
2 concentrations can explain that the input of terrigenous clastic materials is relatively stable (
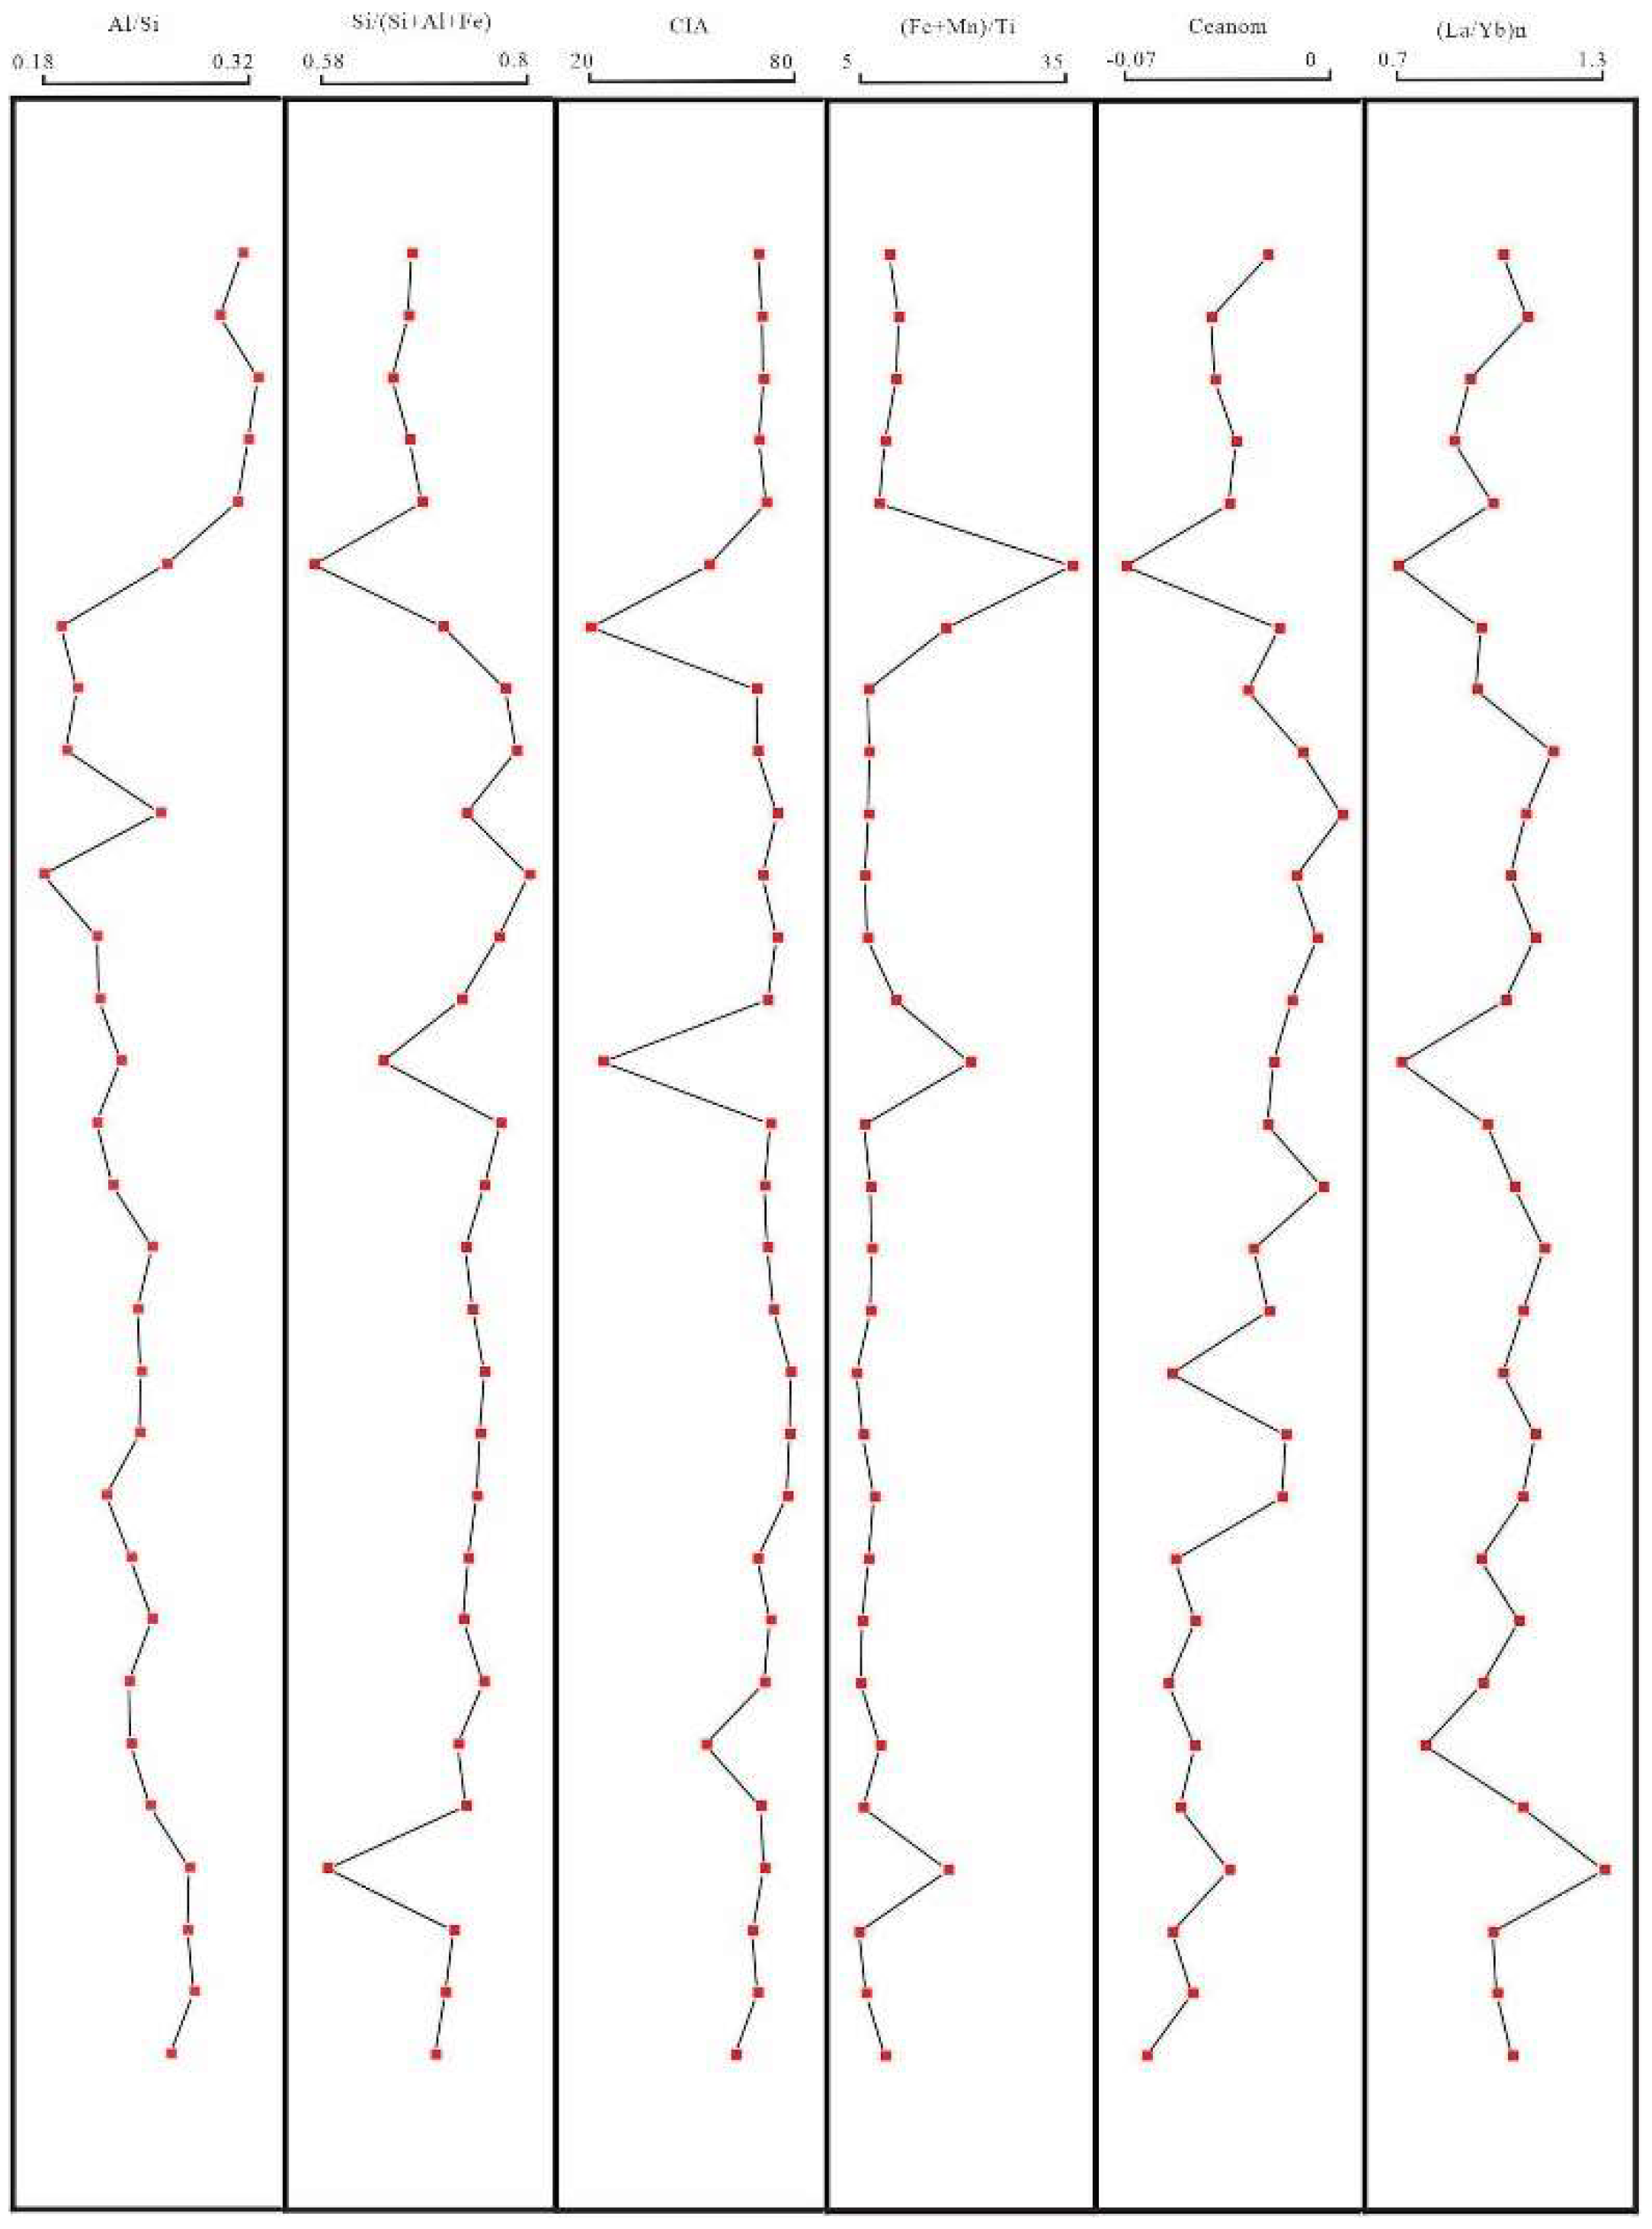
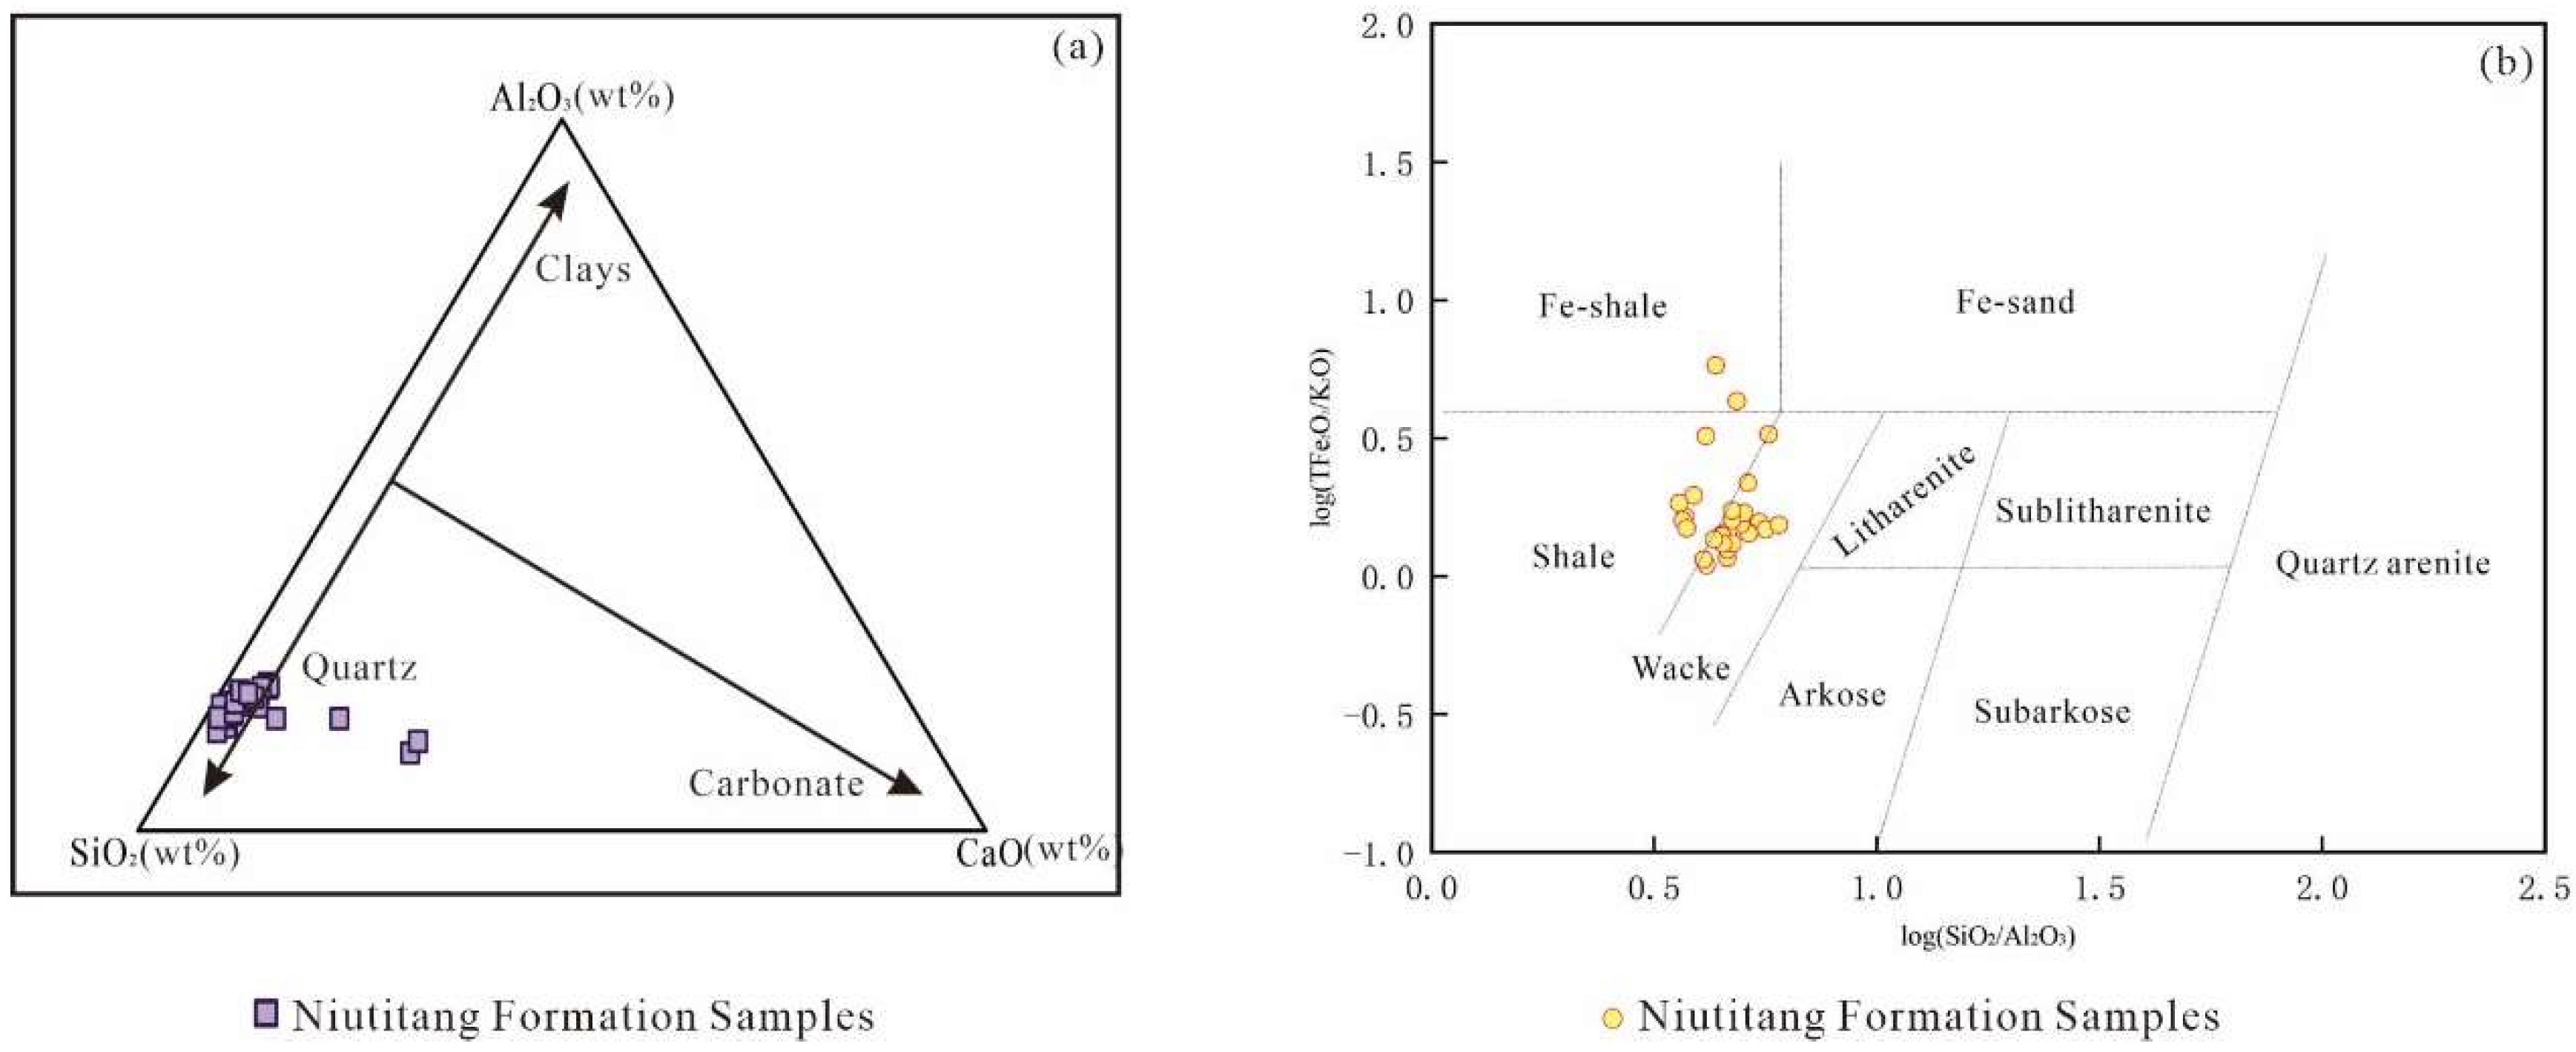
Figure 10). Silicon is primarily hosted in quartz and clay minerals within fine-grained sediments. The Al/Si ratio can, to some extent, reflect the minerals in the shale samples, and this ratio gradually decreases with increasing quartz content. The range of Al/Si ratios in the shale samples is 0.19 to 0.31, with an average value of 0.25 (Appendix Table A2,
Figure 11), indicating that the minerals are predominantly quartz (
Figure 12.a (the base map can refer to Cong He et al., 2016) [
44]), which is consistent with previous studies using XRD analysis. The lithological classification of shale is shale-type and wacke-type, with a small amount of Fe-shale-type (
Figure 12.b (the base map can refer to Cong He et al., 2016) [
44]). The Si / (Si + Al + Fe) ratio can be used to judge the proximity of the terrigenous source and is inversely proportional to the source distance. The range of Si / (Si + Al + Fe) in shale samples is 0.61 to 0.78, with an average value of 0.72 (Appendix Table A2), indicating that the shale samples were formed near a terrigenous source.
(2) Major Element Geochemical Analysis
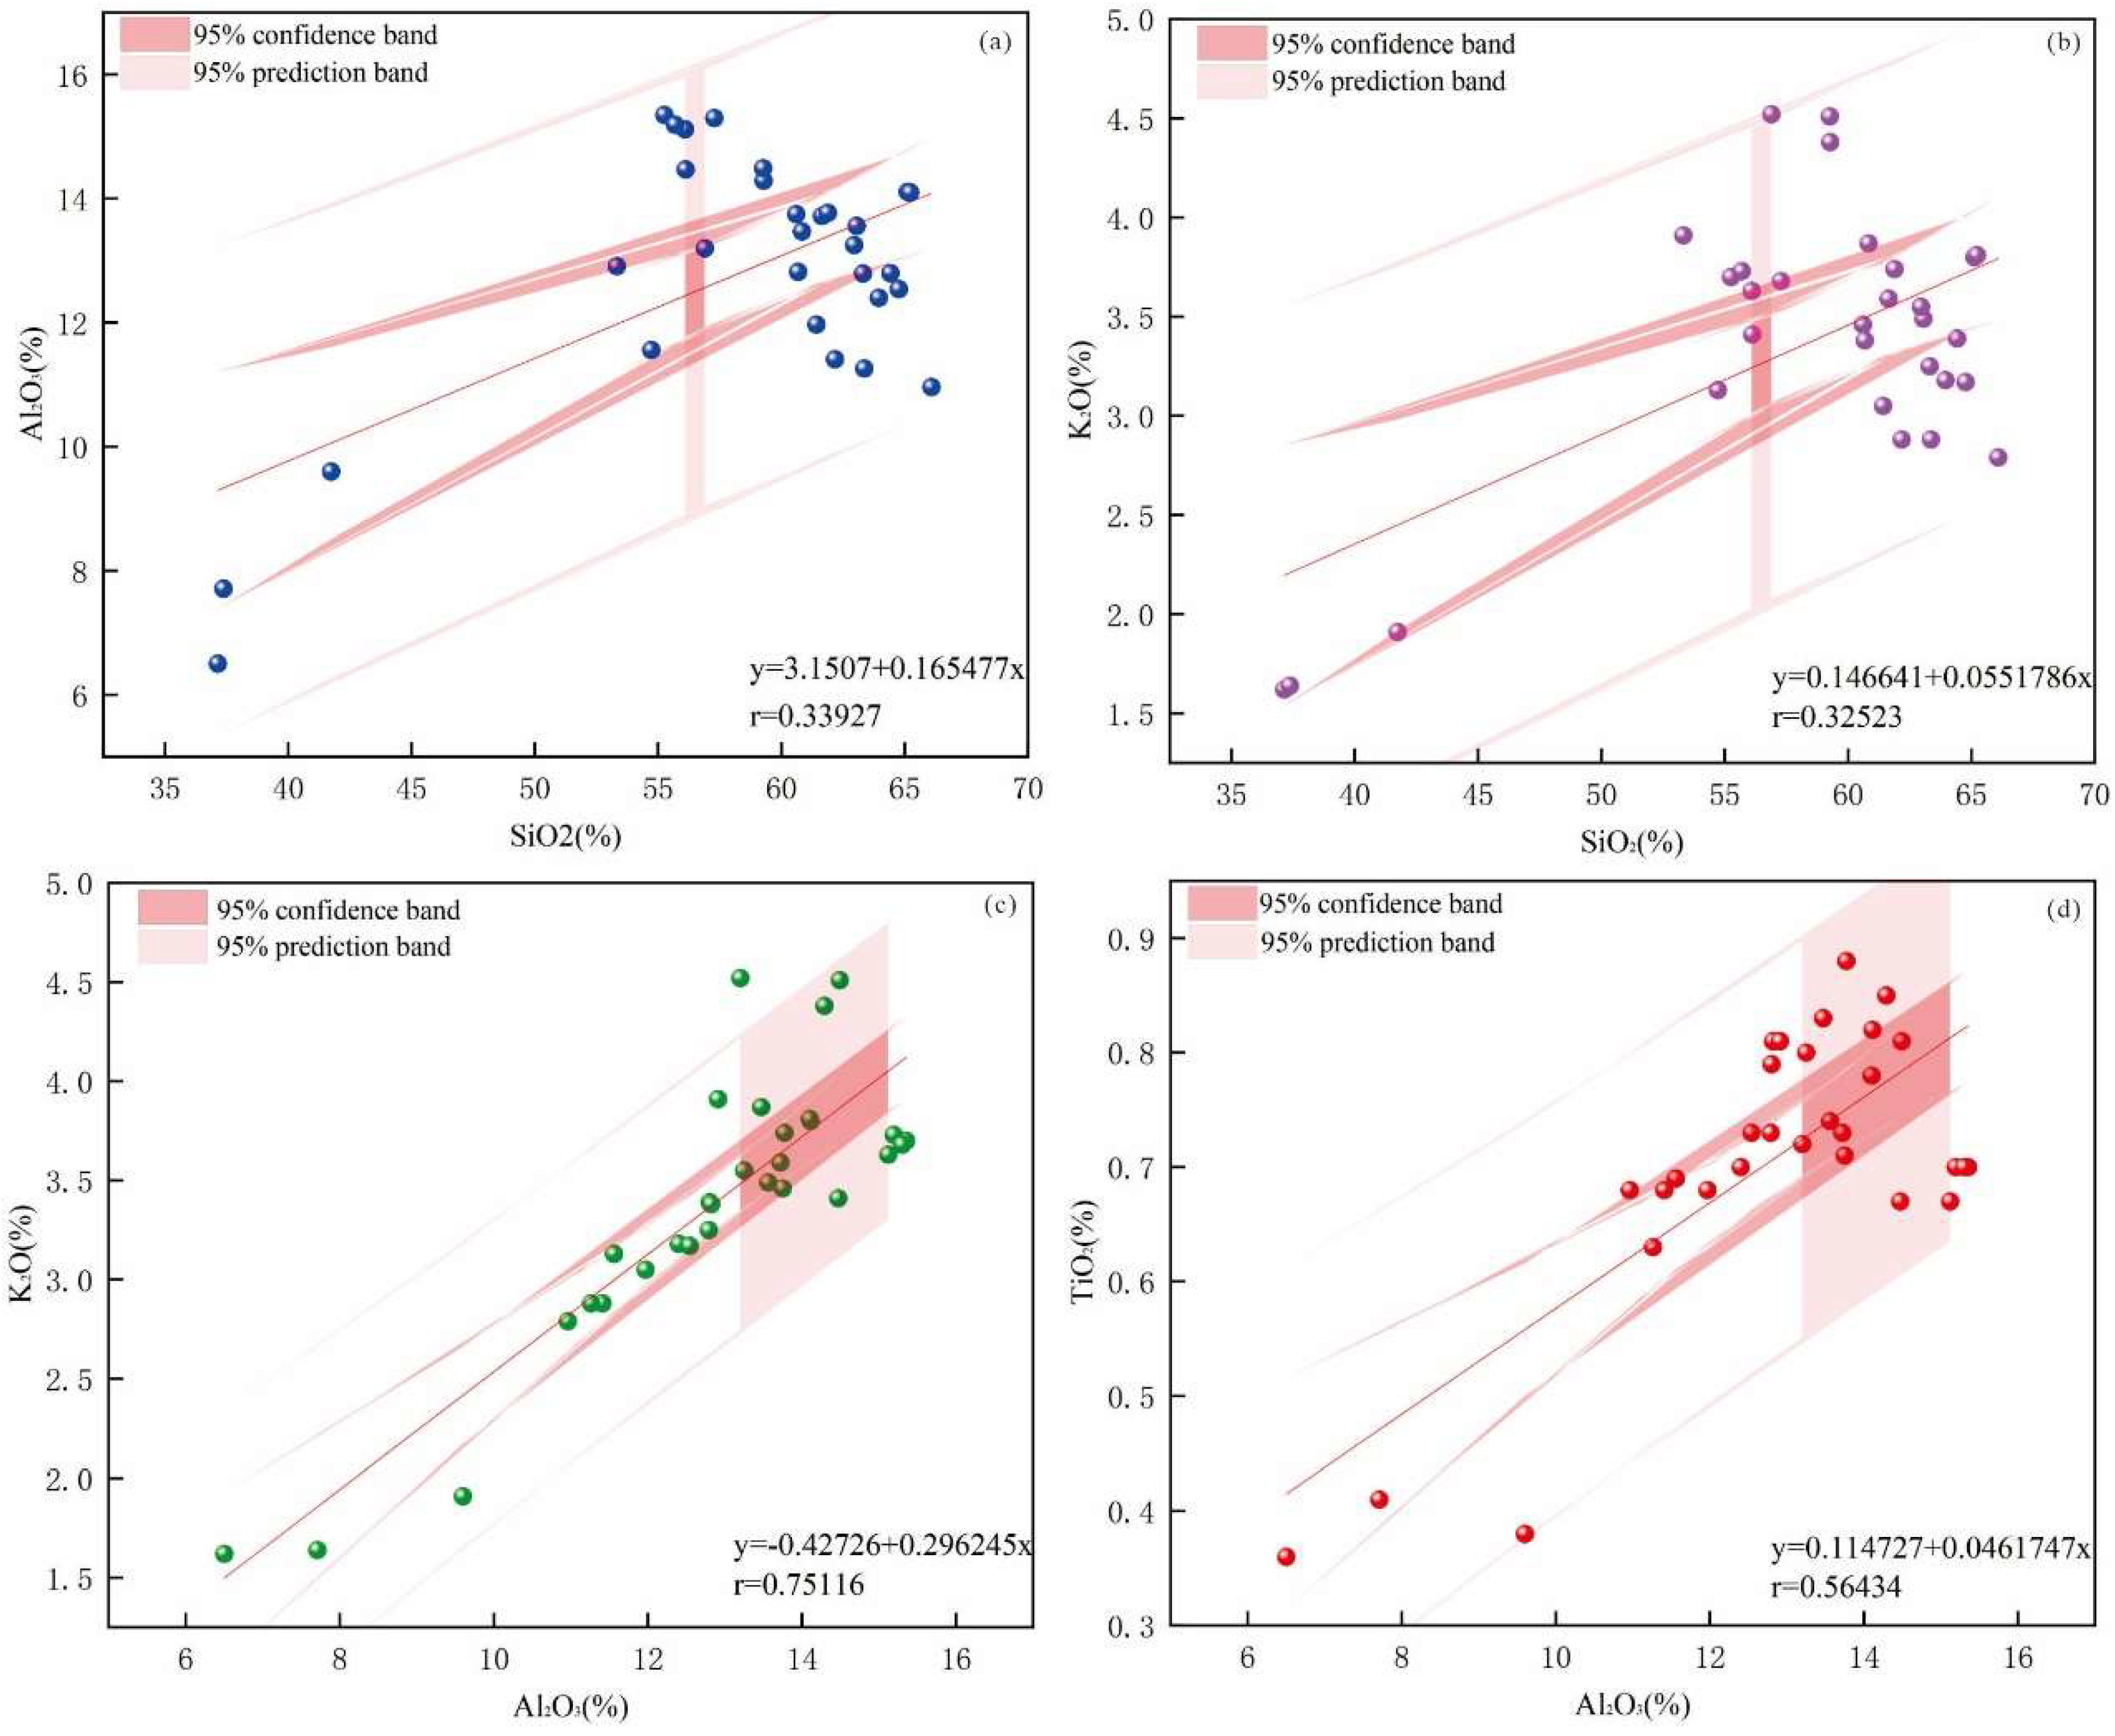
High Correlations of Elements Si, Al, K, and Ti (
Figure 13) suggest that they primarily originate from mixed clay minerals. The average Al/Si ratio of 0.25 indicates that SiO
2 predominantly exists in the form of quartz, with a portion present in clay minerals, which is consistent with the results of the previous X-ray diffraction (XRD) analysis (
Figure 4).
5.2. Trace Elements
Trace elements are typically present in low concentrations in sediments. The analysis results of trace elements in the shale from Niutitang Formation in the study area indicate that Sr, Zr, Ba, V, Zn, and Rb are among the more abundant elements, with average values exceeding 100 ppm(Appendix Table A3). Compared to the average values of the Upper Continental Crust (UCC) [
46,
47], elements such as Cr, Ba, V, Cu, Zn, Ga, As, Pb, Cs, U, Co, Ni, Mo, Cd, Li, Bi, and In are relatively enriched, while Sr, Zr, Sc, Rb, Th, Nb, Ta, and Be are relatively depleted. Notably, elements like Cr, Ba, V, and Cu are highly enriched, and Sr, Nb, and Ta are highly depleted. The enrichment of elements can generally be assessed using the Enrichment Factor (EF), defined as EF=(Ci/Cr)sample/(Ci/Cr)ucc, where Ci is the concentration of element i, and Cr is the concentration of the chosen reference element. Internationally, elements such as Fe, Al, Si, Ti, and Sc are often used as reference elements. For this study, the crustal element values are derived from Shaw (1986) [
46], and Al is used as the reference element, hence EF=(C
i/Al)sample/(C
i/Al)ucc.
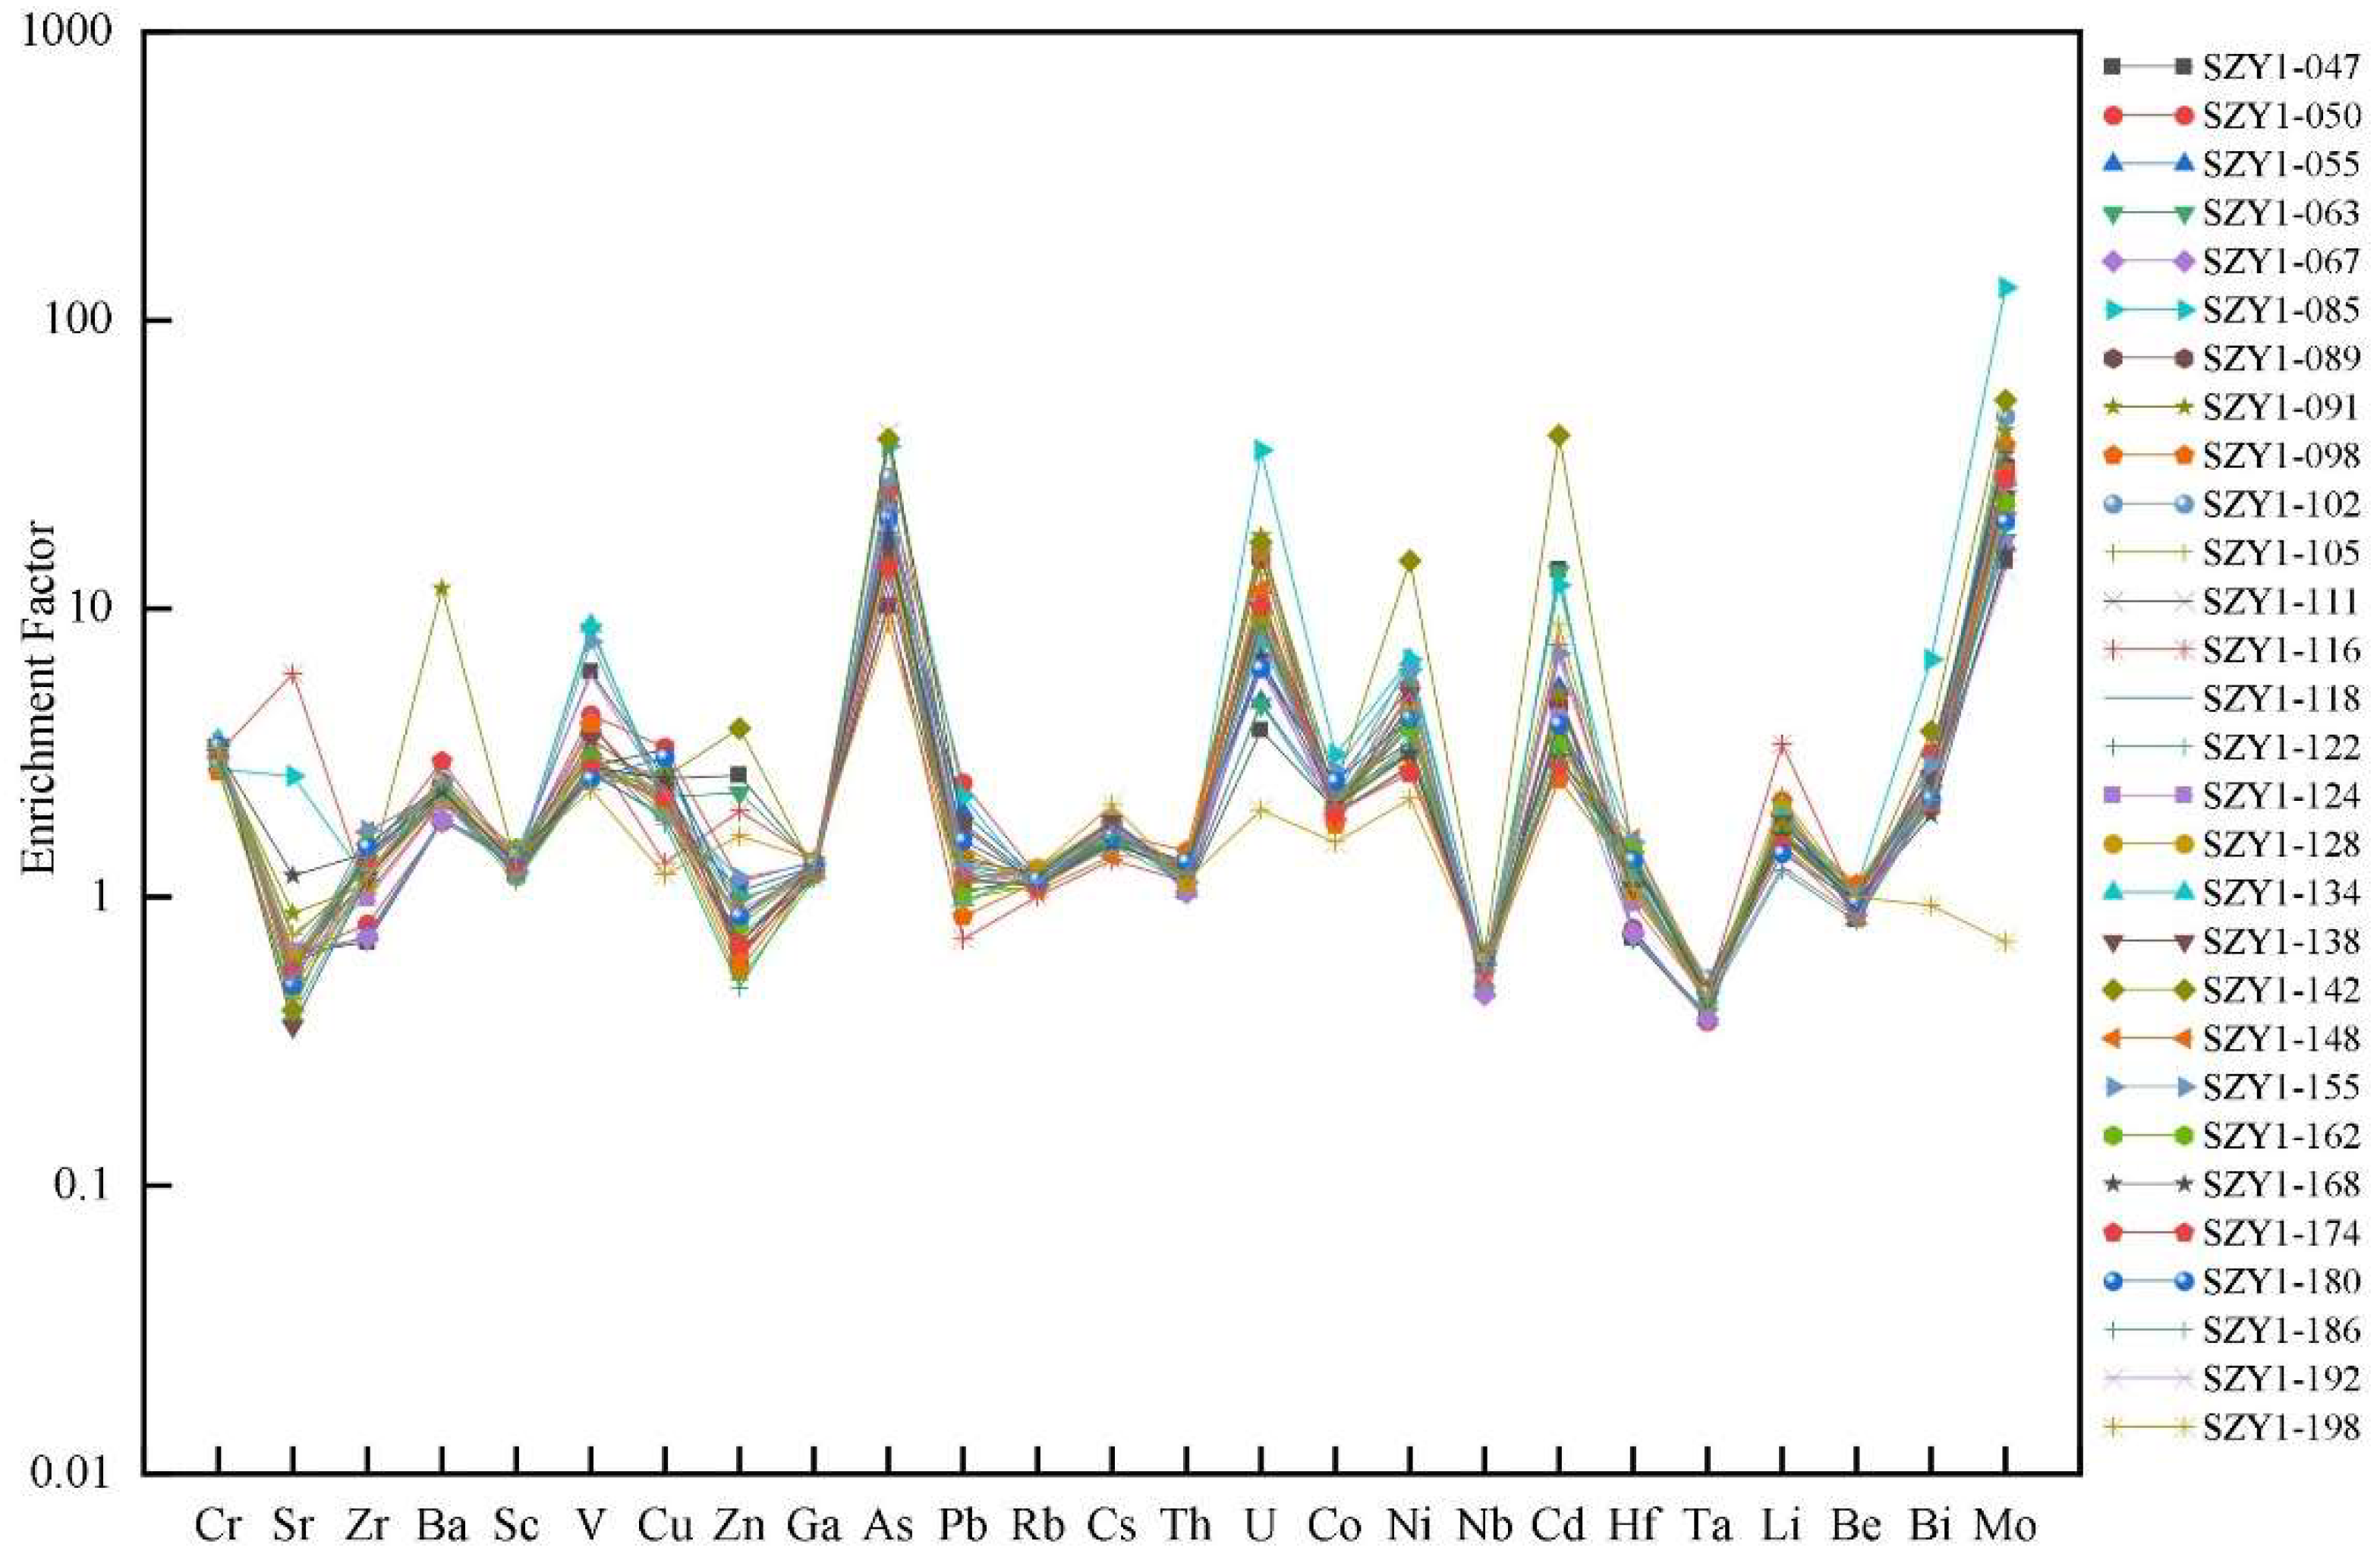
Sr is typically positively correlated with paleosalinity values, suggesting that the paleosalinity of the water body in the study area gradually decreased after the deposition of Niutitang Formation shale; Ba is associated with paleoproductivity and can reflect the content of organic matter. The average Enrichment Factor (EF) of Ba in this study's shale is 2.6 μg/g (Appendix Table A4), indicating deposition in a sedimentary center with a higher content of organic matter; The average EF values of As, U, and Ni are 19.90 μg/g, 10.47 μg/g, and 4.52 μg/g, respectively, and are relatively high (Appendix Table A4,
Figure 14). Among these, As enrichment can indicate a reducing environment, U enrichment in sedimentary rocks is usually related to reducing conditions, and Ni is associated with the content of organic matter. High Ni content may indicate an anoxic environment; The EF value of Sr in the shale of the study area is similar to that of the Chang 7 lake sedimentary oil shale in the Ordos Basin [
4], but lower than that of the Bilongcuo marine oil shale; The EF value of U is lower than that of the Chang 7 oil shale and higher than that of the Bilongcuo marine oil shale [
44]. The variation in EF is related to various factors, including the input of terrigenous detritus, redox conditions, primary productivity, and mineral content, paleoclimatic conditions, etc [
49].
5.3. Rare Earth Element
Rare earth elements (REEs) are known for their strong stability during weathering and diagenesis, making the total content of REEs a common proxy for reflecting and evaluating paleoenvironments and provenance [
50,
51]. The contents of rare earth elements in 29 shale samples are presented in Appendix Table A5. The total REE content in the shale samples is relatively low, ranging from 113 μg/g to 172.44 μg/g, with an average of 153.03 μg/g. In comparison, the average total REE content of Niutitang Formation shale from the southeastern margin of the Sichuan Basin is 156.252 μg/g [
52], and the average for the Lower Cambrian Niutitang Formation shale in the Yangtze Platform of South China is 156.54 μg/g [
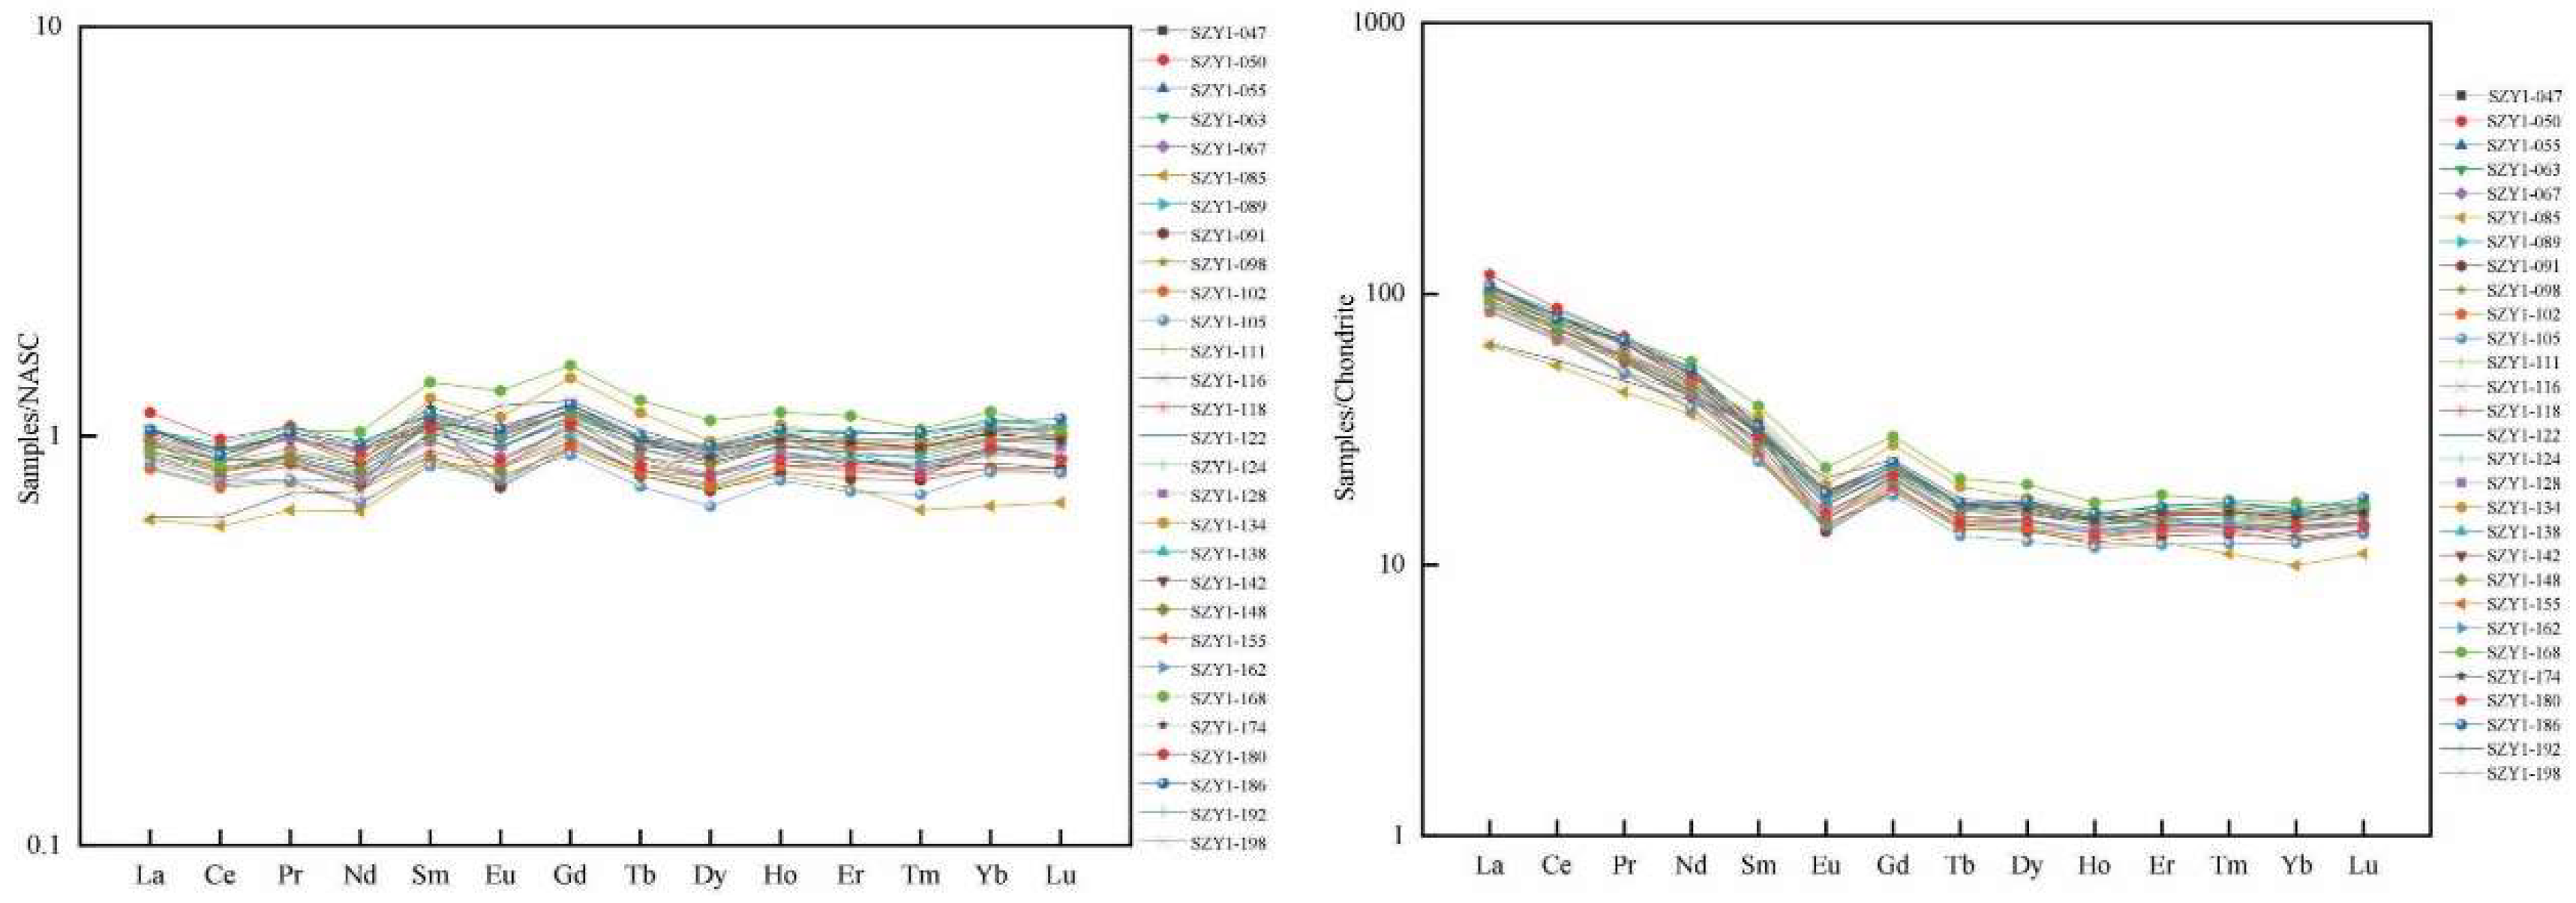
53], both of which are close to the ΣREE values in this study. The light rare earth elements (LREEs) range from 96.71 μg/g to 154.09 μg/g, and the heavy rare earth elements (HREEs) range from 16.29 μg/g to 24.71 μg/g (Appendix Table A5), with the LREE/HREE ratio varying between 5.17 to 8.397 (Appendix Table A2), indicating a relative enrichment of LREEs and depletion of HREEs. After normalization to the North American Shale Composite (NASC), the pattern shows a steeper slope for the LREEs and a flatter trend for the HREEs, with no significant Ce anomaly (
Figure 15a). Furthermore, normalization to chondrite reveals a flat and uniform pattern for all samples, suggesting that the REEs in the shale samples are controlled by a similar depositional environment and derived from the same terrigenous materials. Vertically, the trends of ΣLREE, ΣHREE, and ΣREE are quite similar, with a higher correlation between ΣLREE and ΣREE (
Figure 10). In sediments, organic matter can adsorb rare earth elements, especially LREEs, promoting their enrichment in sediments. The slight enrichment of LREEs over HREEs in these two REE patterns may be related to the concentration of organic matter, as suggested by Yin Jinthao et al. (2017) [
54].
6. Discussion
6.1. Tectonic Setting and Parent Rocks
Since the Paleozoic, the Sichuan Basin has undergone multiple phases of tectonic activity, including the Caledonian, Indosinian, Yanshanian, and Himalayan orogenies [
21]. During the Paleozoic to the Middle Triassic, two phases of weak extension and compression affected the structure of the marine platform. The subsequent evolution was characterized by the foredeep basins controlled by the Longmen Shan and Bashan fold-thrust belts along the western and northeastern margins of the basin, respectively [
20,
55].
Accompanying the occurrence of tectonic activity, the geochemical characteristics of shale vary under different tectonic settings. Trace elements and rare earth elements are relatively stable during the deposition of shale, thus they can be used to analyze the tectonic background and provenance attributes of the source area [
58,
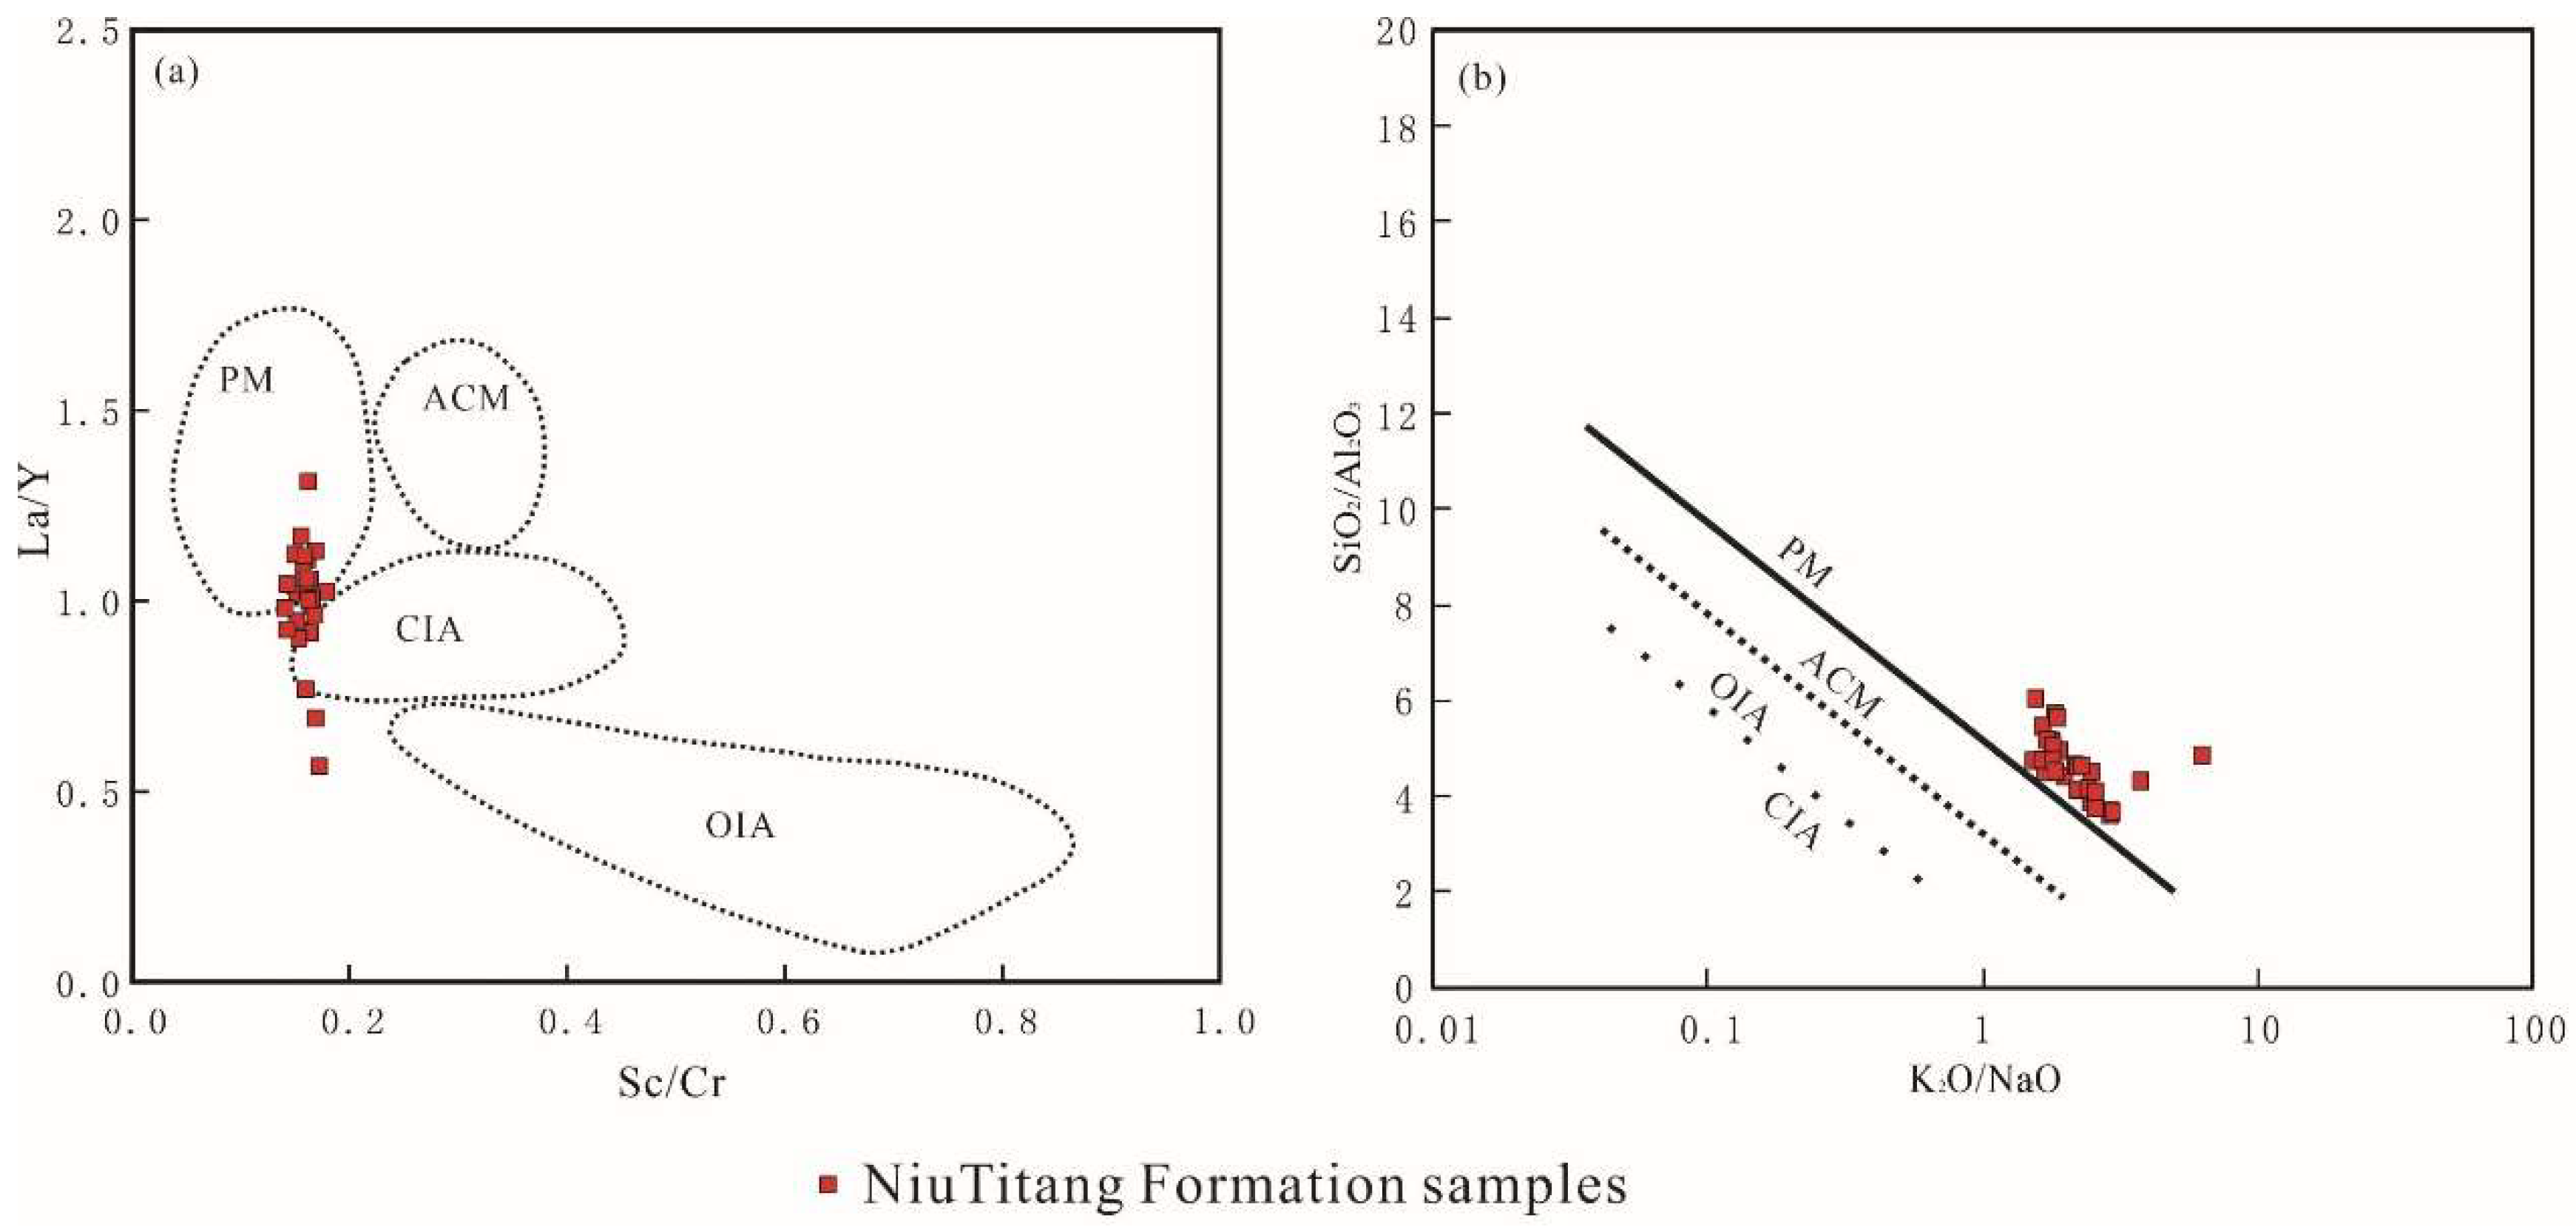
59]. Calculations of La/Y、Sc/Cr、SiO
2/Al
2O
3,and K
2O/Na
2O ratios and their corresponding data plotting reveal that the samples from the study area are concentrated, with the majority of them falling within the interior of a passive continental margin (
Figure 16a). In the bivariate plot of K
2O/Na
2O-SiO
2/Al
2O
3, all samples are located within the range of a passive continental margin (
Figure 16b). This indicates that the tectonic setting of the study area is that of a passive continental margin. The two patterns of rare earth element distribution in the shale samples from the study area (
Figure 15) show enrichment of light rare earth elements and a negative Eu anomaly, which is consistent with the characteristics of a passive continental margin. Therefore, it is concluded that the tectonic background of Niutitang Formation shale in the study area is predominantly that of a passive continental margin.
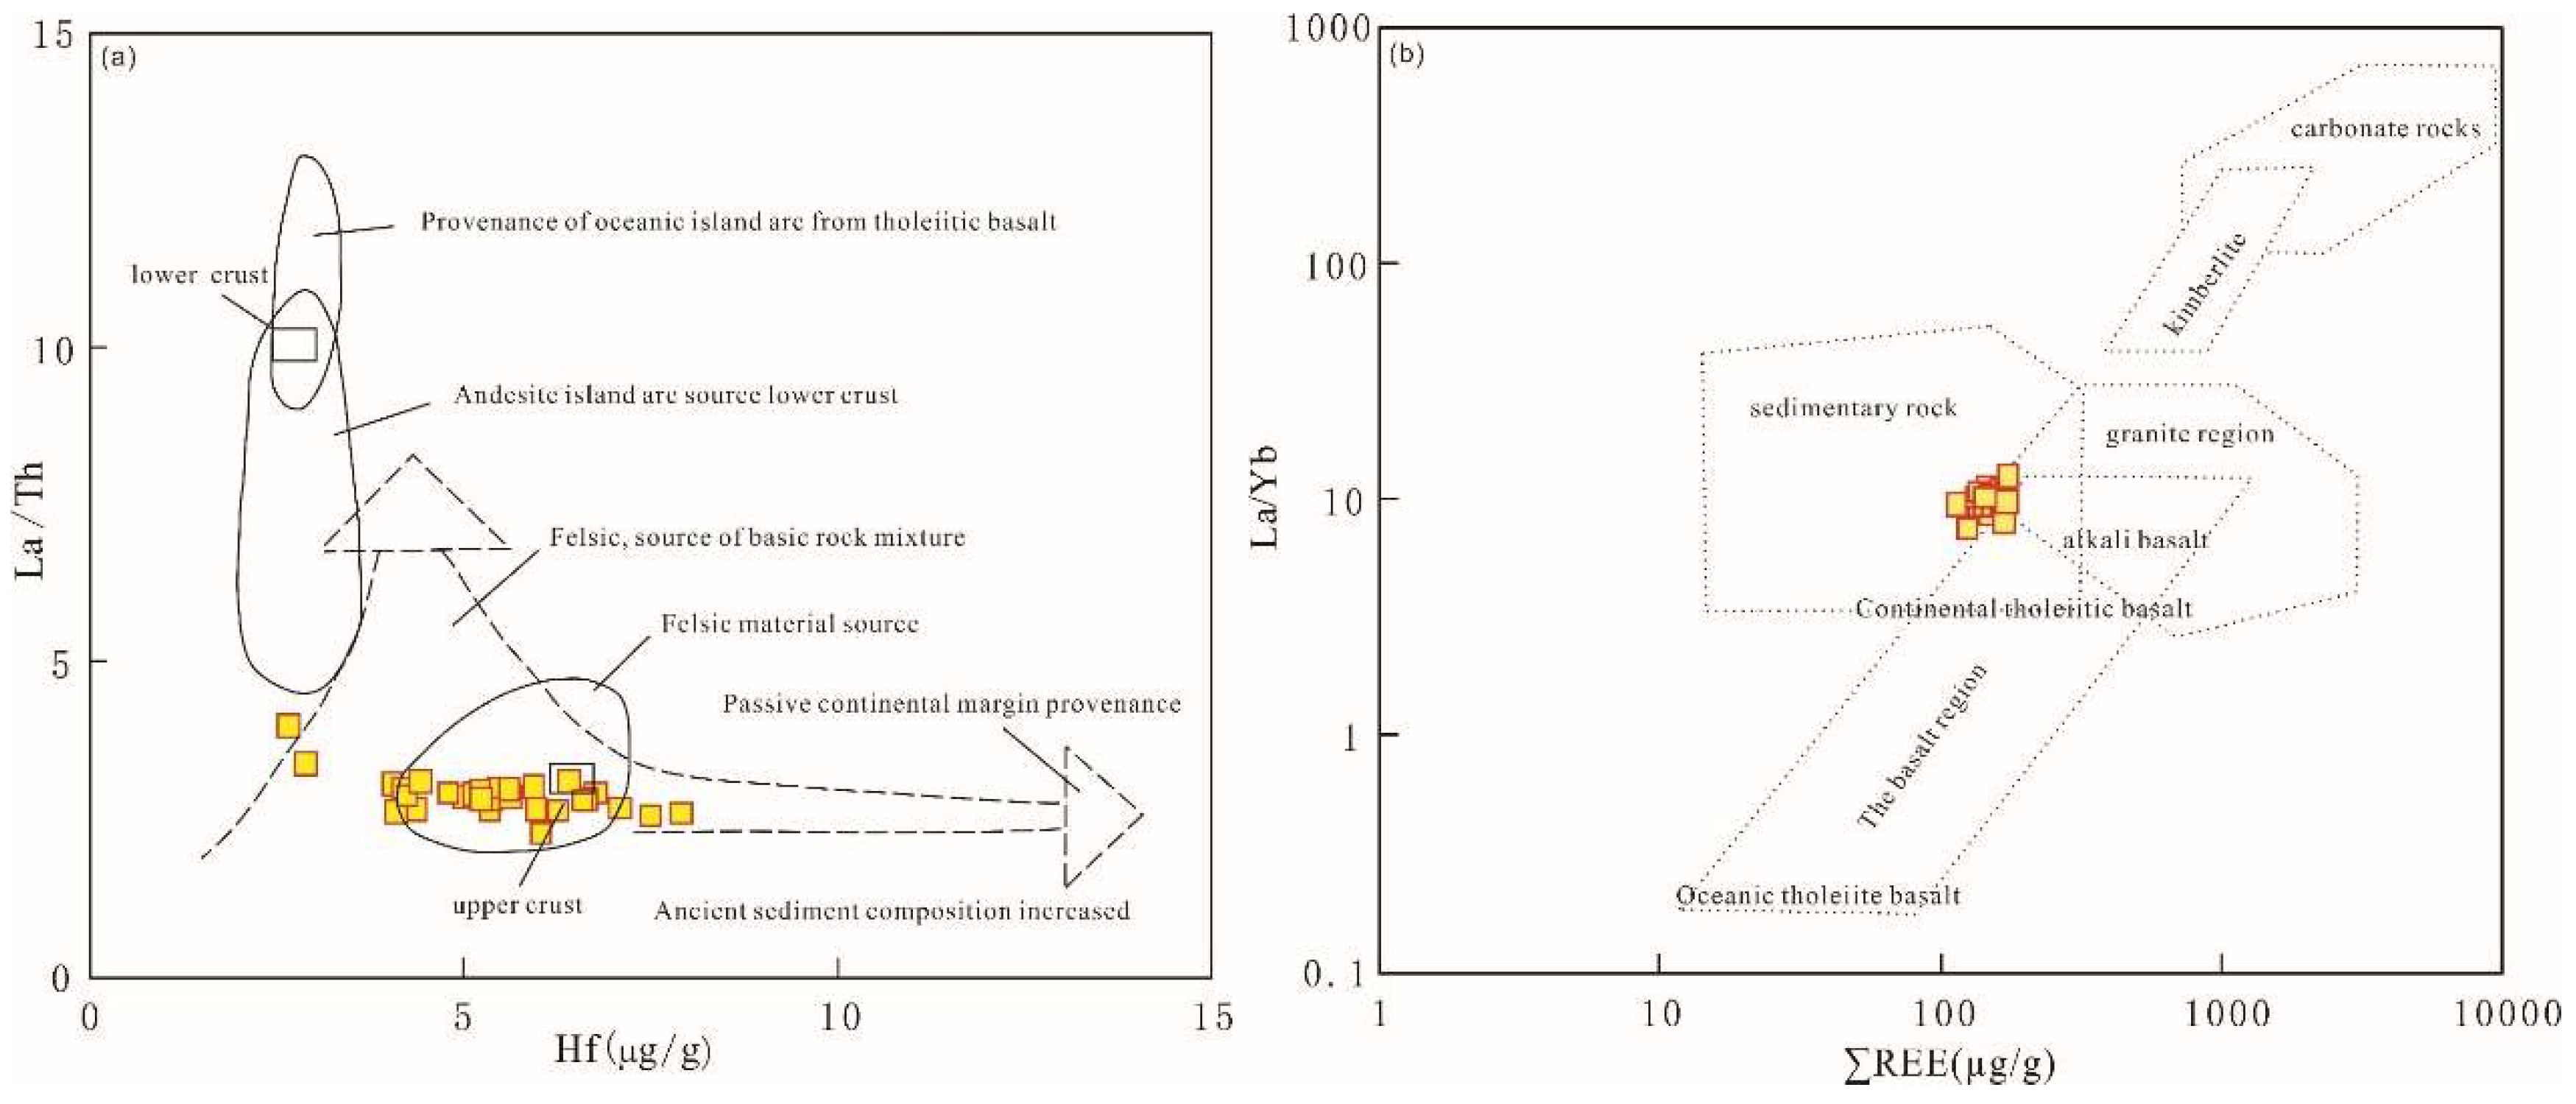
Trace element Hf-La/Th diagrams indicate that the samples from the study area predominantly plot within the felsic source region, with a few falling in the mixed felsic and mafic rock region and near the passive continental margin (
Figure 17a).The ΣREE-La/Yb diagram, which can be used to discern the provenance rock attributes [
62,
63], shows that the samples from Niutiitang Formation in the study area mainly plot at the intersection of sedimentary rocks, granites, and alkaline basalts, with a few in the continental tholeiitic basalt region (
Figure 17b). This reflects that the source rocks of Niutitang Formation shale are primarily sedimentary and granitic, suggesting a mixed provenance for Niutitang Formation in the study area.
6.2. Provenance Identification of Shale
Hydrothermal activity has a significant impact on shale sedimentation [
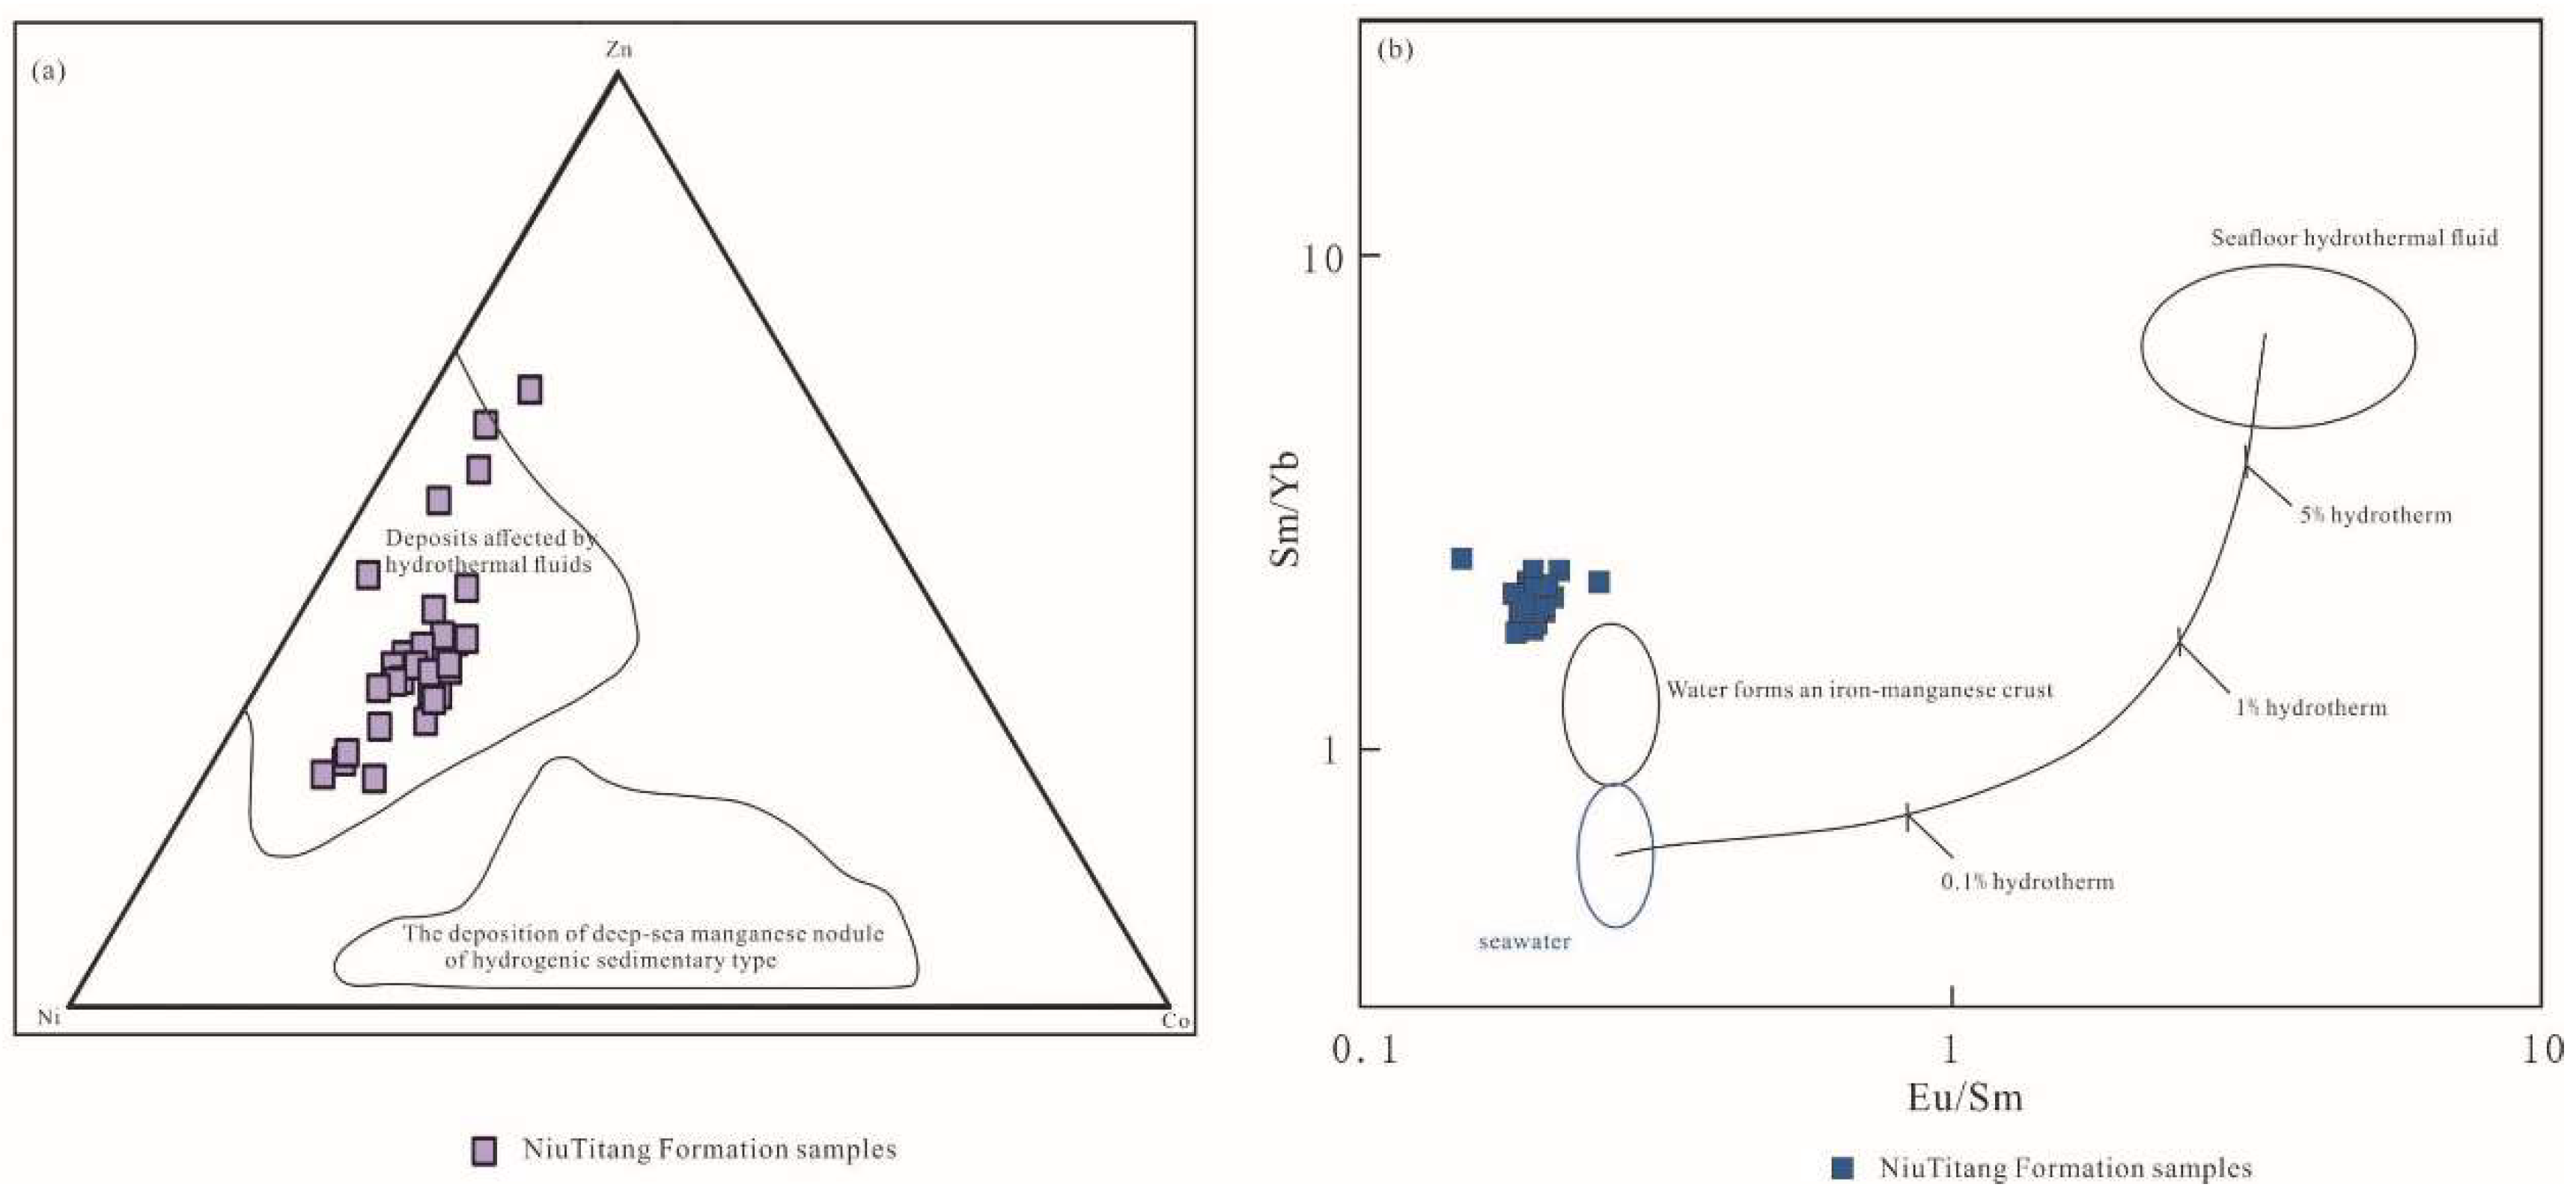
66], and the Zn-Ni-Co ternary plot is commonly used to assess hydrothermal influence [
67]. This diagram indicates that the samples are primarily located in the sedimentary area affected by hydrothermal fluids and its vicinity, reflecting the presence of hydrothermal activity (
Figure 18). The Eu/Sm-Sm/Yb plot can be used to determine the contribution of seawater and submarine hydrothermal fluids [
65]. The shale of Niutitang Formation in the study area is close to the ferromanganese crust formed in oozes, suggesting a very low proportion of hydrothermal fluids in the original solution (
Figure 18). The negative anomaly of Eu in the study area's samples is inconsistent with the positive anomaly of Eu in submarine hydrothermal fluids, further indicating that Niutitang Formation shale is deposited far from the center of hydrothermal activity.
6.3. Paleoclimate
Paleoclimate refers to the record of climatic conditions at the Earth's surface during geological history and the study of climate system changes on a geological timescale [
66,
67]. Variations in climate during the sedimentation process can also affect the enrichment and decomposition of elements. Studies have shown that elements such as Cr, Ni, Mn, Cu, Fe, Ba, Br, Co, Cs, Hf, Rb, Sc, Th, etc., are more enriched in warm and humid environments, while Sr, Pb, Au, As, Ca, Na, Ta, U, Zn, Mg, Mo, B, etc., are enriched in arid environments [
68]. Elements sensitive to climate change, such as Sr and Cu, are selected to study the paleoclimate, and their ratio Sr/Cu is used as a climatic indicator. A Sr/Cu ratio between 1 and 10 indicates a warm and humid climate, while a ratio greater than 10 indicates an arid and hot climate. The Sr/Cu values of Niutitang Formation samples in the study area range from 2.11 to 63.54, with most ratios falling between 1 and 10, suggesting that the paleoclimate during the deposition of Niutitang Formation was predominantly warm and humid, with occasional arid and hot climates.
The Chemical Index of Alteration (CIA) is also commonly used as a paleoclimatic indicator [
4,
69]. CIA values of 50-65, 65-85, and 85-100 respectively indicate cold and arid, warm and humid, and hot and humid climates during sedimentation [
18]. The CIA is calculated using the formula: CIA = 100 × [Al
2O
3/(Al
2O
3 + CaO* + Na
2O + K
2O)], where CaO*=CaO-(10/3)✖P
2O
5. The CIA of Niutitang Formation shale in the study area ranges from 27.69 to 71.93, with most samples having CIA values between 64 and 71, indicating a warm and humid climate (
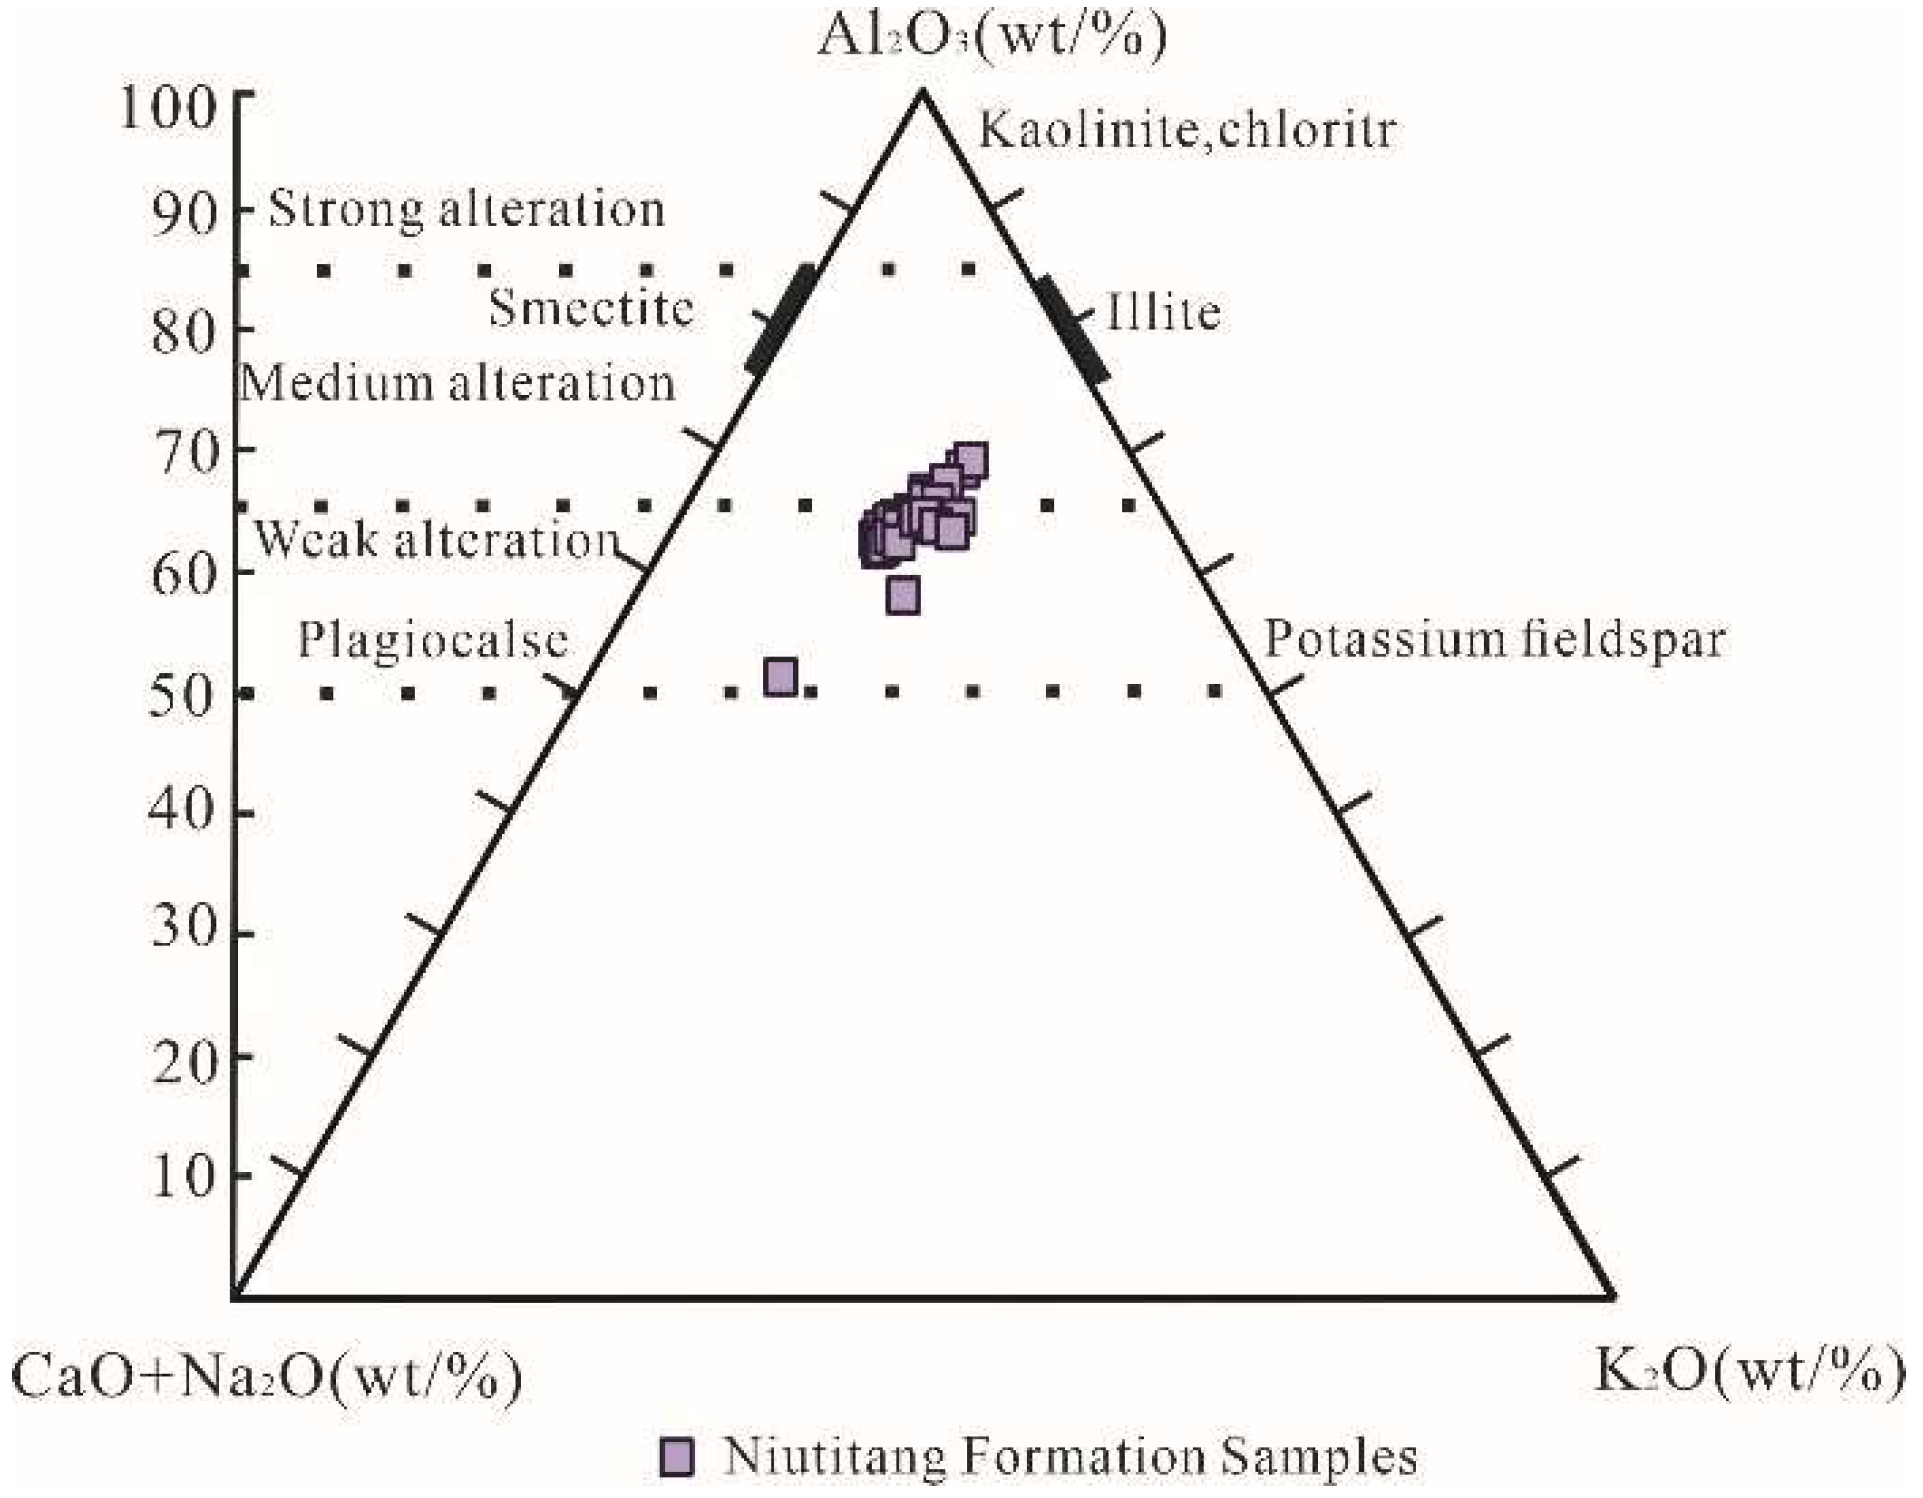
Figure 19). This is consistent with the results from the Sr/Cu ratio, and the ternary diagram of chemical weathering also shows results consistent with the CIA (
Figure 18). The Index of Compositional Variability (ICV) can also be used to assess the recycling of sediments, ICV = (Fe
2O
3 + K
2O + Na
2O + CaO* + MgO + MnO + TiO
2)/Al
2O
3. An ICV greater than 1 indicates that the tectonic setting of the area is more active, belonging to the first cycle of sedimentation with minimal influence from epigenetic processes; whereas an ICV less than 1 indicates a relatively stable tectonic setting, suggesting a recycling process of sediments [
70,
71]. The ICV of Niutitang Formation shale ranges from 0.90 to 4.51, with an average value of 1.38, indicating that the tectonic setting of Niutitang Formation is relatively active.
6.4. Hydrothermal Fluid Sedimentation
Major elements can be employed to reflect hydrothermal fluid activity [
72], and this activity is commonly analyzed using the ratio of (Fe+Mn)/Ti. A value of (Fe+Mn)/Ti greater than 15 indicates that the sediments in the study area have been influenced by hydrothermal activity [
73]. As can be seen from Appendix Table A2, the ratio of (Fe+Mn)/Ti in the shale samples varies between 6.68 and 21.04, suggesting that some shales have undergone hydrothermal fluid activity, while others have not. Furthermore, a distinct negative anomaly of Eu in the chondrite-normalized and North American Shale Composite (NASC)-normalized patterns indicates that the study area may have experienced hydrothermal fluid sedimentation to some extent.
6.5. Sedimentation Rate, Paleosol Environment, and Paleoproductivity
The sedimentation rate of shale can be inferred from rare earth elements (REEs); when REEs reside in the water body for a longer period and have ample contact with the sedimentary water body, they exhibit a higher degree of fractionation and a lower sedimentation rate. Conversely, a shorter residence time in the sedimentary water body results in lower fractionation and a higher sedimentation rate [
74]. La and Yb respectively indicate light and heavy REEs. Therefore, the(La/Yb)
n (n=NASC-normalized) ratio and the slope of the REE normalized pattern curve can be used to reflect the relative magnitude of the sedimentation rate [
75]. An (La/Yb)
n (n=NASC-normalized) value close to 1 indicates minimal fractionation of REEs in the sediment or low sedimentary differentiation, suggesting a higher shale sedimentation rate [
76,
77]. The (La/Yb)
n (n=NASC-normalized) values of Niutitang Formation shale in the study area range from 0.74 to 1.22, with an average of 0.98 (Appendix Table A2), overall close to 1, indicating a relatively fast sedimentation rate in the Lower Cambrian Niutitang Formation shale of the study area, which promotes the preservation and enrichment of organic matter.
Due to the variable valence states of Ce, Ce anomaly in sediments is considered an effective geochemical indicator of changes in paleoredox conditions [
78]. Typically, Ce
anom is used to reflect redox conditions, with Ce
anom > -0.1 indicating a reducing environment and Ce
anom < -0.1 indicating an oxidizing environment. Ce
anom = Lg ( 3C
en / ( 2La
n + Nd
n ) ). The subscript n indicates NASC-normalized values (Judith Wright et al., 1987; Li Delu et al., 2017). The Ce
anom values of the shale samples range from -0.0569 to 0.0061, with an average of -0.0322, indicating that the deposition of Niutitang Formation shale in the study area was predominantly under strong reducing conditions.
Paleoproductivity is closely related to the enrichment of organic matter. Elements such as Ba and P can be used to assess the level of paleoproductivity, often existing in the form of BaSO4 in sediments and water bodies, and Ba is positively correlated with paleoproductivity [
79,
80]. Ni and Cu, transferred to sediments in the form of organic complexes, represent the presence of organic matter and are thus considered excellent indicators of paleoproductivity. High contents of Ni and Cu in shale typically indicate high primary productivity [
81]. Additionally, Total Organic Carbon (TOC) can reflect the level of paleoproductivity, also showing a positive correlation. High TOC content indicates high paleoproductivity, and low TOC content indicates low paleoproductivity. This study uses the Al-normalized enrichment factors of Ni and Cu to analyze the elements in the sediments. An enrichment factor less than 1 indicates depletion, greater than 1 indicates enrichment, greater than 3 indicates significant enrichment, and greater than 10 indicates moderate to strong enrichment [
82]. The average values of Ni
EF、Cu
EF in Niutitang Formation shale samples are 4.52 and 2.26, respectively (Appendix Table A4), and the paleoproductivity level is positively correlated with Ni
EF and Cu
EF, suggesting a higher level of paleoproductivity in the study area.
6.6. Comparison with Similar Basins
This paper provides an in-depth analysis of the geological characteristics of the Niutitang Formation shale in the study area, which is primarily composed of marine sedimentary mudstone and carbonaceous shale with high organic matter content. The reservoirs were formed in a shallow marine environment at the continental margin, under warm and humid climatic conditions with high paleoproductivity, and in an anoxic and reducing depositional environment. In contrast, the black shale of the Wufeng Formation and Longmaxi Formation in the Changning area of the Sichuan Basin were deposited in an anoxic deep-water environment, while the Lower Cambrian Niutitang Formation shale in the upper Yangtze region was deposited in a shallow to deep-water continental shelf environment, with sediments mainly derived from the continental margin and suspended matter in seawater. The shale reservoirs in the study area are dominated by mineral dissolution pores and have good gas content.
The shale in the Changning area of the Sichuan Basin has a higher total organic carbon content and vitrinite reflectance, but its porosity, permeability, and gas content are relatively low. Compared to North American shale, the shale in this study was deposited under strong reducing conditions with a higher level of paleoproductivity; both are in anoxic environments, but the shale in the study area is more reducing. Additionally, the thermal evolution degree of the shale is higher than that of the American Marcellus and Utica shales, currently at the peak of gas generation. Comprehensive analysis indicates that the reservoir evaluation results for the shale are moderately high, suggesting good potential for hydrocarbon accumulation and further exploration prospects. This is of significant importance for the exploration and development of shale gas in the region.
7. Conclusions
(1) The organic matter content of the shale samples from Niutitang is relatively high, indicating good potential for hydrocarbon generation and storage capacity. The shale lithofacies are predominantly clayey shales, with minor amounts of calcareous silicic mixed shales, silicic rocks, and siliceous shales. Niutitang Formation shales are primarily composed of quartz, feldspar, and clay minerals, exhibiting massive structures and horizontal lamination. They have undergone compaction, developed dissolution fractures and micro-fractures, which are filled with calcite, silica, dolomite, and bitumen. Subsequent to this, they have been affected by tectonic fracturing and re-filling processes, with diagenetic processes dominated by the recrystallization of micritic carbonates.
(2) Niutitang Formation shales are characterized by a predominance of macropores and super-macropores, with well-developed fractures and micro-fractures. Pores and fractures between mineral particles such as quartz, muscovite, and pyrite, as well as within the organic matter, are filled with bitumen and other substances, resulting in reservoirs with low porosity and low permeability characteristics.
(3) The tectonic setting of the shale is active, primarily located at a passive continental margin. The source rocks are sedimentary and granitic in nature. The climate is predominantly warm and humid, with less arid and hot conditions. The shale deposition occurred under strong reducing conditions, with high paleoproductivity and rapid sedimentation rates, which facilitated the preservation and enrichment of organic matter in the study area. The shales formed near a terrestrial source, with SiO2 often present in the form of quartz. In both the chondrite-normalized and North American Shale Composite (NASC)-normalized rare earth element (REE) patterns, light rare earths are slightly enriched relative to heavy rare earths, which is associated with the enrichment of organic matter.
(4) Niutitang Formation shales, like those in the Changning area, have high organic matter content. The shale reservoirs are predominantly marine, but the study area shales were deposited in a continental margin shallow marine environment with a warm and humid climate and high paleoproductivity. The pore types in the reservoir rocks are primarily mineral dissolution pores, which are conducive to gas retention. In contrast, the Changning area shales were deposited in an anoxic deepwater environment, with sediment sources mainly from the continental margin and suspended materials in seawater. These shales have high total organic carbon content and high vitrinite reflectance, but low porosity, permeability, and gas retention.
(5) The depositional environment of the Marcellus and Utica shales in the United States is an anoxic deepwater environment, with well-developed fractures. The study area has a relatively high thermal maturity and is at the peak of gas generation. The reservoir evaluation is moderately high, indicating potential for hydrocarbon accumulation and further exploration prospects.
Author Contributions
Tian Tao: Methodology, Writing, Investigation, Chang Wei and Yang Jiahui: Software, Zhang Pei and Zhang Li: Data Management.
Funding
1. This research is sponsored by the Major Special Project of Changqing Oilfield "Research on the tectonic, sedimentary, mechanism and new exploration of the Mesoproterozoic Changcheng System in the Ordos Basin"(Project Number:ZDZX2021); 2. This research is sponsored by the Fundamental Research Funds for the Central Universities, CHD (Project Number:300102272205, 300102272207); 3. This research is sponsored by "Shaanxi Provincial Innovation Capacity Support Program 2023" (Project Number: 2023KJXX-122); 4. This research is sponsored by "Construction and Application of Multi-scale Digital Geological Models in the Zhenba Shale Gas Exploration Area" (Project Number:SIGC2023-KY-08); 5. This research is sponsored by "Establishment and Application of a 3D Geological Model in the Zhenba Joint Exploration Area" (Project Number:SMDZ-2022ZD-4); 6. This research is sponsored by Shaanxi Coalfield Geological Group Co., Ltd. Major Science and Technology Special Project (Project Number:SMDZ-ZD2024-1-01).
Conflicts of Interest
The authors declare no competing financial interest.
Appendix A
Table A1.
Major Element Concentrations in the Niutitang Formation (wt%).
Table A1.
Major Element Concentrations in the Niutitang Formation (wt%).
| SampleID |
SiO2 |
Al2O3 |
CaO |
TFe2O3 |
K2O |
MgO |
MnO |
Na2O |
P2O5 |
TiO2 |
| SZY1-047 |
56.09 |
15.12 |
4.04 |
5.99 |
3.63 |
3.04 |
0.07 |
1.25 |
0.21 |
0.67 |
| SZY1-050 |
56.12 |
14.47 |
3.47 |
6.70 |
3.41 |
2.79 |
0.06 |
1.38 |
0.20 |
0.67 |
| SZY1-055 |
55.25 |
15.35 |
3.62 |
6.81 |
3.70 |
2.95 |
0.06 |
1.27 |
0.20 |
0.70 |
| SZY1-063 |
55.69 |
15.19 |
3.98 |
5.94 |
3.73 |
3.02 |
0.06 |
1.25 |
0.23 |
0.70 |
| SZY1-067 |
57.28 |
15.30 |
3.39 |
5.50 |
3.68 |
2.73 |
0.05 |
1.43 |
0.24 |
0.70 |
| SZY1-076 |
41.74 |
9.60 |
9.69 |
11.10 |
1.91 |
1.23 |
0.06 |
2.34 |
1.71 |
0.38 |
| SZY1-085 |
37.14 |
6.50 |
15.81 |
5.30 |
1.62 |
6.50 |
0.21 |
0.88 |
0.40 |
0.36 |
| SZY1-089 |
62.17 |
11.41 |
2.35 |
4.53 |
2.88 |
1.45 |
0.03 |
1.74 |
0.20 |
0.68 |
| SZY1-091 |
63.36 |
11.26 |
2.40 |
4.26 |
2.88 |
1.57 |
0.03 |
1.54 |
0.19 |
0.63 |
| SZY1-098 |
60.60 |
13.75 |
1.65 |
4.75 |
3.46 |
1.89 |
0.03 |
1.74 |
0.20 |
0.71 |
| SZY1-102 |
66.09 |
10.96 |
1.84 |
4.29 |
2.79 |
1.36 |
0.03 |
1.79 |
0.21 |
0.68 |
| SZY1-105 |
63.95 |
12.40 |
1.35 |
4.59 |
3.18 |
1.70 |
0.03 |
1.79 |
0.21 |
0.70 |
| SZY1-111 |
61.42 |
11.97 |
1.98 |
6.64 |
3.05 |
1.67 |
0.04 |
1.70 |
0.24 |
0.68 |
| SZY1-116 |
37.37 |
7.71 |
16.44 |
7.07 |
1.64 |
6.48 |
0.29 |
0.26 |
0.15 |
0.41 |
| SZY1-118 |
64.76 |
12.54 |
1.70 |
4.54 |
3.17 |
1.84 |
0.04 |
1.85 |
0.20 |
0.73 |
| SZY1-122 |
63.31 |
12.79 |
2.28 |
5.02 |
3.25 |
2.06 |
0.05 |
1.70 |
0.20 |
0.73 |
| SZY1-124 |
61.64 |
13.72 |
2.44 |
5.10 |
3.59 |
2.42 |
0.05 |
1.44 |
0.19 |
0.73 |
| SZY1-128 |
63.05 |
13.56 |
1.85 |
5.12 |
3.49 |
2.30 |
0.04 |
1.61 |
0.19 |
0.74 |
| SZY1-134 |
65.12 |
14.11 |
0.93 |
4.43 |
3.80 |
1.94 |
0.03 |
1.71 |
0.28 |
0.82 |
| SZY1-138 |
65.22 |
14.10 |
0.76 |
4.76 |
3.81 |
1.92 |
0.03 |
1.66 |
0.20 |
0.78 |
| SZY1-142 |
64.42 |
12.80 |
0.87 |
5.76 |
3.39 |
1.67 |
0.03 |
1.88 |
0.28 |
0.79 |
| SZY1-148 |
60.68 |
12.82 |
2.20 |
5.40 |
3.38 |
2.37 |
0.05 |
2.21 |
0.23 |
0.81 |
| SZY1-155 |
61.88 |
13.77 |
1.53 |
5.25 |
3.74 |
2.00 |
0.04 |
2.21 |
0.24 |
0.88 |
| SZY1-162 |
62.95 |
13.25 |
1.82 |
4.67 |
3.55 |
2.12 |
0.04 |
2.15 |
0.21 |
0.80 |
| SZY1-168 |
54.72 |
11.56 |
5.96 |
5.43 |
3.13 |
3.56 |
0.12 |
1.74 |
0.19 |
0.69 |
| SZY1-174 |
60.83 |
13.47 |
1.93 |
5.08 |
3.87 |
2.06 |
0.04 |
2.09 |
0.22 |
0.83 |
| SZY1-180 |
53.32 |
12.91 |
1.65 |
12.61 |
3.91 |
1.76 |
0.03 |
1.76 |
0.20 |
0.81 |
| SZY1-186 |
59.28 |
14.29 |
2.74 |
4.81 |
4.38 |
2.20 |
0.05 |
1.80 |
0.21 |
0.85 |
| SZY1-192 |
59.26 |
14.49 |
2.40 |
5.20 |
4.51 |
1.87 |
0.04 |
1.75 |
0.21 |
0.81 |
| SZY1-198 |
56.89 |
13.20 |
3.92 |
6.15 |
4.52 |
3.12 |
0.05 |
1.20 |
0.21 |
0.72 |
| Average |
58.39 |
12.81 |
3.57 |
5.76 |
3.37 |
2.45 |
0.058 |
1.64 |
0.268 |
0.706 |
Table A2.
Geochemical Parameters of Shale Samples.
Table A2.
Geochemical Parameters of Shale Samples.
| Samples ID |
Al/Si |
Si/(Si+Al+Fe) |
ICV |
CIA |
Ceanom |
(Fe+Mn)/Ti |
L/H |
(La/Yb)N |
(La/Sm)N |
(Gd/Yb)N |
(La/Yb)n |
(Dy/Sm)N |
Sr/Cu |
| SZY1-047 |
0.31 |
0.68 |
1.19 |
64.78 |
-0.0254 |
10.57 |
7.045 |
6.86 |
3.36 |
1.50 |
0.98 |
0.50 |
3.47 |
| SZY1-050 |
0.29 |
0.68 |
1.23 |
65.58 |
-0.0401 |
11.79 |
7.257 |
7.27 |
3.41 |
1.59 |
1.04 |
0.51 |
2.66 |
| SZY1-055 |
0.31 |
0.67 |
1.20 |
65.96 |
-0.0391 |
11.46 |
6.471 |
6.30 |
3.17 |
1.44 |
0.90 |
0.56 |
4.24 |
| SZY1-063 |
0.31 |
0.68 |
1.18 |
64.96 |
-0.0337 |
10.01 |
6.286 |
6.04 |
3.09 |
1.47 |
0.86 |
0.53 |
4.10 |
| SZY1-067 |
0.30 |
0.69 |
1.09 |
66.52 |
-0.0355 |
9.26 |
6.734 |
6.69 |
3.35 |
1.48 |
0.96 |
0.54 |
4.19 |
| SZY1-085 |
0.20 |
0.71 |
4.51 |
27.69 |
-0.0225 |
17.93 |
5.937 |
6.48 |
2.66 |
2.00 |
0.93 |
0.55 |
13.37 |
| SZY1-089 |
0.21 |
0.76 |
1.14 |
64.41 |
-0.0307 |
7.83 |
6.746 |
6.42 |
3.40 |
1.46 |
0.92 |
0.55 |
3.14 |
| SZY1-091 |
0.20 |
0.77 |
1.13 |
64.54 |
-0.0165 |
7.95 |
7.768 |
7.69 |
3.01 |
1.51 |
1.10 |
0.42 |
5.19 |
| SZY1-098 |
0.26 |
0.73 |
0.99 |
68.98 |
-0.0061 |
7.86 |
7.644 |
7.24 |
3.96 |
1.35 |
1.04 |
0.53 |
3.25 |
| SZY1-102 |
0.19 |
0.78 |
1.10 |
65.71 |
-0.0182 |
7.42 |
6.798 |
6.98 |
3.45 |
1.54 |
1.00 |
0.55 |
3.82 |
| SZY1-105 |
0.22 |
0.75 |
1.02 |
68.81 |
-0.0126 |
7.71 |
7.557 |
7.39 |
3.69 |
1.49 |
1.06 |
0.51 |
3.22 |
| SZY1-111 |
0.22 |
0.72 |
1.25 |
66.87 |
-0.0193 |
11.47 |
6.892 |
6.90 |
3.01 |
1.67 |
0.99 |
0.48 |
2.58 |
| SZY1-116 |
0.23 |
0.66 |
4.16 |
30.18 |
-0.0240 |
21.04 |
5.17 |
5.15 |
2.24 |
1.92 |
0.74 |
0.57 |
63.54 |
| SZY1-118 |
0.22 |
0.76 |
1.05 |
67.44 |
-0.0255 |
7.33 |
6.916 |
6.59 |
3.47 |
1.40 |
0.94 |
0.55 |
4.49 |
| SZY1-122 |
0.23 |
0.74 |
1.13 |
66.09 |
-0.0113 |
8.11 |
6.914 |
7.05 |
3.41 |
1.59 |
1.01 |
0.54 |
4.44 |
| SZY1-124 |
0.25 |
0.73 |
1.10 |
66.74 |
-0.0291 |
8.24 |
7.382 |
7.55 |
3.43 |
1.62 |
1.08 |
0.49 |
4.72 |
| SZY1-128 |
0.24 |
0.73 |
1.07 |
68.22 |
-0.0253 |
8.14 |
7.093 |
7.20 |
3.56 |
1.53 |
1.03 |
0.53 |
4.17 |
| SZY1-134 |
0.25 |
0.74 |
0.90 |
71.93 |
-0.0503 |
6.35 |
6.077 |
6.86 |
2.82 |
1.91 |
0.98 |
0.50 |
2.62 |
| SZY1-138 |
0.24 |
0.74 |
0.93 |
71.71 |
-0.0208 |
7.17 |
8.059 |
7.40 |
3.63 |
1.45 |
1.06 |
0.49 |
2.11 |
| SZY1-142 |
0.22 |
0.74 |
1.05 |
71.08 |
-0.0216 |
8.56 |
6.933 |
7.18 |
3.49 |
1.61 |
1.03 |
0.55 |
2.18 |
| SZY1-148 |
0.24 |
0.73 |
1.22 |
64.61 |
-0.0495 |
7.86 |
6.637 |
6.48 |
3.58 |
1.41 |
0.93 |
0.55 |
3.52 |
| SZY1-155 |
0.25 |
0.73 |
1.08 |
67.33 |
-0.0442 |
7.02 |
6.865 |
7.13 |
3.18 |
1.58 |
1.02 |
0.52 |
3.45 |
| SZY1-162 |
0.24 |
0.74 |
1.09 |
66.02 |
-0.0512 |
6.88 |
6.677 |
6.52 |
3.28 |
1.44 |
0.93 |
0.52 |
3.81 |
| SZY1-168 |
0.24 |
0.72 |
1.73 |
53.13 |
-0.0444 |
9.41 |
5.791 |
5.56 |
2.44 |
1.76 |
0.79 |
0.51 |
6.50 |
| SZY1-174 |
0.25 |
0.73 |
1.13 |
65.30 |
-0.0481 |
7.20 |
7.063 |
7.18 |
3.21 |
1.58 |
1.03 |
0.48 |
3.50 |
| SZY1-180 |
0.27 |
0.61 |
1.69 |
65.99 |
-0.0356 |
18.22 |
8.397 |
8.56 |
3.95 |
1.54 |
1.22 |
0.49 |
2.27 |
| SZY1-186 |
0.27 |
0.72 |
1.13 |
63.48 |
-0.0502 |
6.68 |
6.803 |
6.69 |
3.30 |
1.50 |
0.96 |
0.53 |
4.05 |
| SZY1-192 |
0.28 |
0.71 |
1.10 |
64.54 |
-0.0450 |
7.56 |
7.011 |
6.75 |
3.37 |
1.45 |
0.97 |
0.52 |
3.15 |
| SZY1-198 |
0.26 |
0.70 |
1.44 |
59.62 |
-0.0569 |
10.06 |
6.908 |
7.01 |
3.38 |
1.52 |
1.00 |
0.52 |
8.73 |
| (Note:L/H=ΣLREE/ΣHREE; N:chondrite-normalized; n:NASC-normalized) |
Table A3.
Trace Element Concentrations in Samples.
Table A3.
Trace Element Concentrations in Samples.
| Samples |
Cr |
Sr |
Zr |
Ba |
Sc |
V |
Cu |
Zn |
Ga |
As |
Pb |
Rb |
Cs |
| SZY1-047 |
112 |
215 |
128 |
968 |
17.8 |
348 |
62 |
181 |
21.1 |
14.7 |
19.9 |
128 |
6.58 |
| SZY1-050 |
103 |
203 |
141 |
924 |
16.9 |
237 |
76.3 |
73.9 |
20.8 |
35.4 |
45.9 |
122 |
6.01 |
| SZY1-055 |
111 |
205 |
137 |
1008 |
18.2 |
232 |
48.3 |
72.8 |
21.2 |
24.8 |
38.4 |
128 |
6.76 |
| SZY1-063 |
112 |
221 |
132 |
977 |
17.2 |
490 |
53.9 |
158 |
21.3 |
24.6 |
22.7 |
132 |
6.58 |
| SZY1-067 |
104 |
212 |
134 |
992 |
17.1 |
234 |
50.6 |
59.3 |
21.1 |
24.7 |
27.2 |
126 |
6.62 |
| SZY1-076 |
46.7 |
510 |
101 |
1364 |
11.4 |
133 |
152 |
8000 |
14.1 |
73 |
38.2 |
61.1 |
2.66 |
| SZY1-085 |
40.3 |
381 |
89.8 |
582 |
6.81 |
63.9 |
28.5 |
29.3 |
8.21 |
22.7 |
18.5 |
50.1 |
2.32 |
| SZY1-089 |
77.3 |
148 |
186 |
901 |
11.7 |
123 |
47.1 |
31.3 |
15.5 |
24.8 |
26.1 |
93 |
4.29 |
| SZY1-091 |
76.7 |
221 |
150 |
4651 |
12.4 |
121 |
42.6 |
49 |
15.4 |
20.9 |
16.6 |
98.8 |
4.49 |
| SZY1-098 |
83.4 |
149 |
194 |
1147 |
14.1 |
207 |
45.8 |
34.6 |
18.4 |
19 |
15 |
111 |
5.46 |
| SZY1-102 |
71.5 |
157 |
182 |
897 |
11.3 |
109 |
41.1 |
31.1 |
14.2 |
30 |
18.5 |
89.7 |
3.95 |
| SZY1-105 |
78.4 |
123 |
178 |
954 |
12.2 |
126 |
38.2 |
28.9 |
15.5 |
23.5 |
15.6 |
97.1 |
4.71 |
| SZY1-111 |
80.4 |
160 |
169 |
943 |
12.7 |
130 |
62.1 |
34.6 |
15.1 |
46.7 |
26.7 |
94.3 |
4.47 |
| SZY1-116 |
54.4 |
1023 |
95.8 |
583 |
9.38 |
97.5 |
16.1 |
69.5 |
11.3 |
7.77 |
7.02 |
55.4 |
2.45 |
| SZY1-118 |
84.7 |
168 |
209 |
1037 |
12.7 |
131 |
37.4 |
39.5 |
16.3 |
15.1 |
16.9 |
102 |
5.01 |
| SZY1-122 |
90.9 |
206 |
195 |
953 |
13.8 |
142 |
46.4 |
48.4 |
17.4 |
20.3 |
20.9 |
107 |
5.12 |
| SZY1-124 |
98.4 |
199 |
164 |
1021 |
15.5 |
168 |
42.2 |
53.8 |
18.2 |
19 |
19.3 |
122 |
6 |
| SZY1-128 |
98.1 |
185 |
183 |
1056 |
15.8 |
160 |
44.4 |
51.2 |
19.1 |
20.4 |
20.1 |
122 |
5.87 |
| SZY1-134 |
110 |
122 |
203 |
1187 |
15.7 |
472 |
46.6 |
46.1 |
19 |
24.3 |
17.5 |
120 |
5.99 |
| SZY1-138 |
106 |
112 |
199 |
1165 |
15.9 |
191 |
53 |
40.8 |
20.1 |
22.4 |
24.1 |
122 |
6.07 |
| SZY1-142 |
95.8 |
116 |
237 |
1040 |
13.7 |
152 |
53.2 |
223 |
17.1 |
47.4 |
22.6 |
108 |
4.9 |
| SZY1-148 |
92.6 |
155 |
261 |
1064 |
14.9 |
136 |
44 |
35.3 |
17.4 |
26.5 |
24.6 |
96.7 |
4.2 |
| SZY1-155 |
105 |
161 |
284 |
1105 |
14.8 |
404 |
46.6 |
72.6 |
19.5 |
28.7 |
22.3 |
107 |
4.87 |
| SZY1-162 |
94.2 |
171 |
243 |
1106 |
16.9 |
149 |
44.9 |
47.9 |
18 |
17.5 |
18 |
102 |
4.89 |
| SZY1-168 |
81.9 |
306 |
199 |
946 |
13.1 |
125 |
47.1 |
36.2 |
16.1 |
19.7 |
16.8 |
90.9 |
4.17 |
| SZY1-174 |
96.8 |
166 |
222 |
1394 |
15.4 |
146 |
47.4 |
41.8 |
18.4 |
17.9 |
20.1 |
104 |
5.2 |
| SZY1-180 |
96.3 |
143 |
233 |
1135 |
15.6 |
127 |
63 |
50.1 |
18.4 |
25.5 |
25.9 |
106 |
4.92 |
| SZY1-186 |
101 |
165 |
236 |
1256 |
17 |
174 |
40.7 |
31.3 |
19.4 |
31.5 |
21 |
114 |
5.51 |
| SZY1-192 |
108 |
167 |
210 |
1337 |
17.9 |
327 |
53.1 |
58.9 |
19.6 |
32.6 |
22.4 |
116 |
5.98 |
| SZY1-198 |
96.6 |
219 |
187 |
1179 |
15.7 |
119 |
25.1 |
97.4 |
19.3 |
11.3 |
15.8 |
119 |
6.5 |
| average |
90.25 |
222.97 |
182.75 |
1162.40 |
14.45 |
192.48 |
49.99 |
327.59 |
17.55 |
25.76 |
22.15 |
104.84 |
5.09 |
| UCCa
|
35 |
350 |
190 |
550 |
13.6 |
60 |
25 |
71 |
17 |
1.5 |
20 |
112 |
3.7 |
| Samples ID |
Th |
U |
Co |
Ni |
Nb |
Cd |
Hf |
Ta |
Li |
Be |
In |
Bi |
Mo |
| SZY1-047 |
10.7 |
10.2 |
19.4 |
89.6 |
11.6 |
1.29 |
4.03 |
0.8 |
40.1 |
2.41 |
0.1 |
0.28 |
21.1 |
| SZY1-050 |
10.7 |
17.1 |
22.8 |
99.3 |
11.1 |
0.46 |
4.16 |
0.75 |
39.8 |
2.46 |
0.06 |
0.37 |
41.3 |
| SZY1-055 |
11 |
13 |
20.3 |
77.7 |
11.5 |
0.51 |
4.34 |
0.82 |
39.5 |
2.47 |
0.05 |
0.34 |
24.5 |
| SZY1-063 |
11.2 |
12.6 |
18.9 |
114 |
11.4 |
1.27 |
4.09 |
0.84 |
40.2 |
2.55 |
0.07 |
0.31 |
25.1 |
| SZY1-067 |
10.8 |
18.3 |
18.2 |
84.7 |
11.2 |
0.37 |
4.24 |
0.81 |
38.2 |
2.53 |
0.05 |
0.3 |
31.3 |
| SZY1-076 |
8.68 |
166 |
27 |
221 |
6.58 |
86 |
2.98 |
0.43 |
22.7 |
1.64 |
0.23 |
1.1 |
428 |
| SZY1-085 |
4.98 |
41.1 |
12.9 |
55.2 |
6.01 |
0.49 |
2.65 |
0.45 |
15.4 |
1.34 |
<0.05 |
0.35 |
80.6 |
| SZY1-089 |
9.97 |
30.2 |
15.9 |
46.3 |
11.2 |
0.33 |
5.33 |
0.81 |
23.8 |
2.29 |
<0.05 |
0.24 |
34.3 |
| SZY1-091 |
9.42 |
35.9 |
15 |
45.1 |
10.7 |
0.36 |
4.42 |
0.74 |
25.1 |
2.31 |
0.05 |
0.23 |
44.6 |
| SZY1-098 |
13.5 |
38.6 |
15.6 |
81.2 |
11.9 |
0.22 |
6.02 |
0.88 |
33.2 |
2.91 |
0.06 |
0.29 |
48.3 |
| SZY1-102 |
9.35 |
32.5 |
14.7 |
46.3 |
10.9 |
0.25 |
5.38 |
0.8 |
22.6 |
2.13 |
<0.05 |
0.22 |
48.7 |
| SZY1-105 |
9.62 |
28.9 |
16.2 |
49.3 |
10.9 |
0.23 |
4.99 |
0.73 |
25.1 |
2.27 |
0.05 |
0.29 |
44.4 |
| SZY1-111 |
9.72 |
23.1 |
17.6 |
53 |
10.8 |
0.31 |
5.11 |
0.75 |
25.9 |
2.31 |
0.06 |
0.28 |
40.3 |
| SZY1-116 |
5.96 |
15.6 |
10.2 |
40.9 |
7.17 |
0.36 |
2.88 |
0.51 |
33.3 |
1.39 |
<0.05 |
0.15 |
16.8 |
| SZY1-118 |
10.6 |
24.5 |
15.7 |
45.6 |
12 |
0.24 |
6.25 |
0.88 |
30.1 |
2.11 |
0.05 |
0.26 |
41.7 |
| SZY1-122 |
10.1 |
20.8 |
17.1 |
55.9 |
12.4 |
0.31 |
5.44 |
0.8 |
33 |
2.29 |
0.06 |
0.24 |
32.1 |
| SZY1-124 |
11.2 |
15.1 |
17.9 |
67.5 |
12 |
0.36 |
4.79 |
0.85 |
34.1 |
2.47 |
0.06 |
0.28 |
21.9 |
| SZY1-128 |
10.3 |
21.5 |
18.7 |
76.3 |
12.7 |
0.32 |
5.2 |
0.84 |
35.1 |
2.41 |
0.06 |
0.26 |
31.4 |
| SZY1-134 |
11.5 |
19.4 |
19.7 |
119 |
13 |
0.26 |
5.95 |
0.89 |
34.3 |
2.7 |
0.06 |
0.29 |
39.4 |
| SZY1-138 |
11.5 |
22.9 |
17.5 |
91.4 |
12.9 |
0.34 |
5.62 |
0.88 |
32.8 |
2.67 |
<0.05 |
0.3 |
33 |
| SZY1-142 |
11.3 |
38.8 |
19.7 |
239 |
12.8 |
3.19 |
6.75 |
0.84 |
28 |
2.33 |
0.05 |
0.39 |
64.6 |
| SZY1-148 |
12 |
26.4 |
15.8 |
46 |
12.8 |
0.24 |
7.49 |
0.88 |
24.4 |
2.09 |
<0.05 |
0.23 |
36.1 |
| SZY1-155 |
12.2 |
24.1 |
24.1 |
108 |
13.1 |
0.6 |
7.9 |
0.9 |
28.4 |
2.61 |
0.05 |
0.32 |
35.5 |
| SZY1-162 |
12.1 |
22.4 |
17.4 |
65.2 |
12.5 |
0.28 |
7.08 |
0.89 |
26.8 |
2.4 |
0.05 |
0.22 |
29.5 |
| SZY1-168 |
9.71 |
14 |
15.5 |
46.2 |
10.9 |
0.22 |
5.6 |
0.73 |
24 |
2.12 |
0.06 |
0.18 |
17.2 |
| SZY1-174 |
11.8 |
24.4 |
16.9 |
46.2 |
12.5 |
0.24 |
6.64 |
0.89 |
26 |
2.38 |
0.07 |
0.23 |
36.4 |
| SZY1-180 |
11.7 |
14.3 |
20.7 |
68.3 |
12.4 |
0.32 |
6.4 |
0.84 |
23.3 |
2.37 |
0.06 |
0.23 |
24.7 |
| SZY1-186 |
11.7 |
21.8 |
19.6 |
75.9 |
12.9 |
0.28 |
6.57 |
0.86 |
22.5 |
2.25 |
<0.05 |
0.25 |
25.8 |
| SZY1-192 |
11 |
21.2 |
19.8 |
93.9 |
12.6 |
0.61 |
5.93 |
0.91 |
23.6 |
2.37 |
<0.05 |
0.26 |
19 |
| SZY1-198 |
10.3 |
4.73 |
13 |
36.9 |
12.5 |
0.72 |
5.23 |
0.84 |
37.4 |
2.52 |
0.07 |
0.1 |
0.88 |
| average |
10.49 |
27.31 |
17.79 |
79.50 |
11.43 |
3.37 |
5.32 |
0.79 |
29.62 |
2.30 |
0.07 |
0.29 |
47.28 |
| UCCa
|
10.7 |
2.8 |
10 |
20 |
25 |
0.098 |
5.8 |
2.2 |
20 |
3 |
0.05 |
0.127 |
1.5 |
Table A4.
Trace Element Enrichment Factors (μg/g).
Table A4.
Trace Element Enrichment Factors (μg/g).
| Samples ID |
Cr |
Sr |
Zr |
Ba |
Sc |
V |
Cu |
Zn |
Ga |
As |
Pb |
Rb |
Cs |
|
| SZY1-047 |
3.32 |
0.64 |
0.70 |
1.83 |
1.36 |
6.02 |
2.57 |
2.64 |
1.29 |
10.17 |
1.03 |
1.19 |
1.84 |
|
| SZY1-050 |
3.19 |
0.63 |
0.80 |
1.82 |
1.35 |
4.28 |
3.31 |
1.13 |
1.33 |
25.58 |
2.49 |
1.18 |
1.76 |
|
| SZY1-055 |
3.24 |
0.60 |
0.74 |
1.87 |
1.37 |
3.95 |
1.97 |
1.05 |
1.27 |
16.89 |
1.96 |
1.17 |
1.87 |
|
| SZY1-063 |
3.30 |
0.65 |
0.72 |
1.83 |
1.31 |
8.43 |
2.23 |
2.30 |
1.29 |
16.93 |
1.17 |
1.22 |
1.84 |
|
| SZY1-067 |
3.05 |
0.62 |
0.72 |
1.85 |
1.29 |
4.00 |
2.07 |
0.86 |
1.27 |
16.88 |
1.39 |
1.15 |
1.83 |
|
| SZY1-085 |
2.78 |
2.63 |
1.14 |
2.55 |
1.21 |
2.57 |
2.75 |
1.00 |
1.17 |
36.51 |
2.23 |
1.08 |
1.51 |
|
| SZY1-089 |
3.04 |
0.58 |
1.35 |
2.25 |
1.18 |
2.82 |
2.59 |
0.61 |
1.25 |
22.73 |
1.79 |
1.14 |
1.59 |
|
| SZY1-091 |
3.05 |
0.88 |
1.10 |
11.78 |
1.27 |
2.81 |
2.37 |
0.96 |
1.26 |
19.41 |
1.16 |
1.23 |
1.69 |
|
| SZY1-098 |
2.72 |
0.49 |
1.16 |
2.38 |
1.18 |
3.94 |
2.09 |
0.56 |
1.23 |
14.45 |
0.86 |
1.13 |
1.68 |
|
| SZY1-102 |
2.92 |
0.64 |
1.37 |
2.33 |
1.19 |
2.60 |
2.35 |
0.63 |
1.20 |
28.62 |
1.32 |
1.15 |
1.53 |
|
| SZY1-105 |
2.83 |
0.44 |
1.18 |
2.19 |
1.13 |
2.66 |
1.93 |
0.51 |
1.15 |
19.81 |
0.99 |
1.10 |
1.61 |
|
| SZY1-111 |
3.01 |
0.60 |
1.17 |
2.25 |
1.22 |
2.84 |
3.25 |
0.64 |
1.16 |
40.79 |
1.75 |
1.10 |
1.58 |
|
| SZY1-116 |
3.16 |
5.95 |
1.03 |
2.16 |
1.40 |
3.31 |
1.31 |
1.99 |
1.35 |
10.54 |
0.71 |
1.01 |
1.35 |
|
| SZY1-118 |
3.03 |
0.60 |
1.38 |
2.36 |
1.17 |
2.73 |
1.87 |
0.70 |
1.20 |
12.59 |
1.06 |
1.14 |
1.69 |
|
| SZY1-122 |
3.18 |
0.72 |
1.26 |
2.12 |
1.24 |
2.90 |
2.28 |
0.84 |
1.26 |
16.59 |
1.28 |
1.17 |
1.70 |
|
| SZY1-124 |
3.21 |
0.65 |
0.99 |
2.12 |
1.30 |
3.20 |
1.93 |
0.87 |
1.22 |
14.48 |
1.10 |
1.25 |
1.85 |
|
| SZY1-128 |
3.24 |
0.61 |
1.11 |
2.22 |
1.34 |
3.08 |
2.05 |
0.83 |
1.30 |
15.73 |
1.16 |
1.26 |
1.83 |
|
| SZY1-134 |
3.49 |
0.39 |
1.19 |
2.40 |
1.28 |
8.74 |
2.07 |
0.72 |
1.24 |
18.01 |
0.97 |
1.19 |
1.80 |
|
| SZY1-138 |
3.37 |
0.36 |
1.16 |
2.36 |
1.30 |
3.54 |
2.36 |
0.64 |
1.32 |
16.61 |
1.34 |
1.21 |
1.82 |
|
| SZY1-142 |
3.35 |
0.41 |
1.53 |
2.32 |
1.23 |
3.10 |
2.61 |
3.85 |
1.23 |
38.72 |
1.38 |
1.18 |
1.62 |
|
| SZY1-148 |
3.24 |
0.54 |
1.68 |
2.37 |
1.34 |
2.77 |
2.15 |
0.61 |
1.25 |
21.61 |
1.50 |
1.06 |
1.39 |
|
| SZY1-155 |
3.42 |
0.52 |
1.70 |
2.29 |
1.24 |
7.67 |
2.12 |
1.16 |
1.31 |
21.79 |
1.27 |
1.09 |
1.50 |
|
| SZY1-162 |
3.19 |
0.58 |
1.51 |
2.38 |
1.47 |
2.94 |
2.13 |
0.80 |
1.25 |
13.81 |
1.07 |
1.08 |
1.56 |
|
| SZY1-168 |
3.17 |
1.19 |
1.42 |
2.33 |
1.31 |
2.83 |
2.56 |
0.69 |
1.28 |
17.82 |
1.14 |
1.10 |
1.53 |
|
| SZY1-174 |
3.22 |
0.55 |
1.36 |
2.95 |
1.32 |
2.83 |
2.21 |
0.69 |
1.26 |
13.89 |
1.17 |
1.08 |
1.64 |
|
| SZY1-180 |
3.34 |
0.50 |
1.49 |
2.51 |
1.39 |
2.57 |
3.06 |
0.86 |
1.31 |
20.65 |
1.57 |
1.15 |
1.62 |
|
| SZY1-186 |
3.17 |
0.52 |
1.36 |
2.51 |
1.37 |
3.18 |
1.79 |
0.48 |
1.25 |
23.05 |
1.15 |
1.12 |
1.63 |
|
| SZY1-192 |
3.34 |
0.52 |
1.20 |
2.63 |
1.42 |
5.90 |
2.30 |
0.90 |
1.25 |
23.52 |
1.21 |
1.12 |
1.75 |
|
| SZY1-198 |
3.28 |
0.74 |
1.17 |
2.55 |
1.37 |
2.36 |
1.19 |
1.63 |
1.35 |
8.95 |
0.94 |
1.26 |
2.09 |
|
| average |
3.17 |
0.85 |
1.20 |
2.60 |
1.30 |
3.81 |
2.26 |
1.07 |
1.26 |
19.90 |
1.32 |
1.15 |
1.68 |
|
| Samples ID |
Th |
U |
Co |
Ni |
Nb |
Cd |
Hf |
Ta |
Li |
Be |
Bi |
Mo |
| SZY1-047 |
1.04 |
3.78 |
2.01 |
4.65 |
0.48 |
13.65 |
0.72 |
0.38 |
2.08 |
0.83 |
2.29 |
14.59 |
| SZY1-050 |
1.08 |
6.62 |
2.47 |
5.38 |
0.48 |
5.09 |
0.78 |
0.37 |
2.16 |
0.89 |
3.16 |
29.84 |
| SZY1-055 |
1.05 |
4.74 |
2.07 |
3.97 |
0.47 |
5.32 |
0.76 |
0.38 |
2.02 |
0.84 |
2.74 |
16.69 |
| SZY1-063 |
1.08 |
4.65 |
1.95 |
5.89 |
0.47 |
13.38 |
0.73 |
0.39 |
2.08 |
0.88 |
2.52 |
17.28 |
| SZY1-067 |
1.03 |
6.70 |
1.87 |
4.34 |
0.46 |
3.87 |
0.75 |
0.38 |
1.96 |
0.86 |
2.42 |
21.39 |
| SZY1-085 |
1.12 |
35.42 |
3.11 |
6.66 |
0.58 |
12.06 |
1.10 |
0.49 |
1.86 |
1.08 |
6.65 |
129.65 |
| SZY1-089 |
1.28 |
14.83 |
2.19 |
3.18 |
0.62 |
4.63 |
1.26 |
0.51 |
1.64 |
1.05 |
2.60 |
31.43 |
| SZY1-091 |
1.23 |
17.86 |
2.09 |
3.14 |
0.60 |
5.12 |
1.06 |
0.47 |
1.75 |
1.07 |
2.52 |
41.41 |
| SZY1-098 |
1.44 |
15.72 |
1.78 |
4.63 |
0.54 |
2.56 |
1.18 |
0.46 |
1.89 |
1.11 |
2.60 |
36.73 |
| SZY1-102 |
1.25 |
16.61 |
2.10 |
3.31 |
0.62 |
3.65 |
1.33 |
0.52 |
1.62 |
1.02 |
2.48 |
46.46 |
| SZY1-105 |
1.14 |
13.05 |
2.05 |
3.12 |
0.55 |
2.97 |
1.09 |
0.42 |
1.59 |
0.96 |
2.89 |
37.44 |
| SZY1-111 |
1.19 |
10.81 |
2.31 |
3.47 |
0.57 |
4.14 |
1.15 |
0.45 |
1.70 |
1.01 |
2.89 |
35.20 |
| SZY1-116 |
1.13 |
11.33 |
2.07 |
4.16 |
0.58 |
7.47 |
1.01 |
0.47 |
3.39 |
0.94 |
2.40 |
22.78 |
| SZY1-118 |
1.24 |
10.94 |
1.96 |
2.85 |
0.60 |
3.06 |
1.35 |
0.50 |
1.88 |
0.88 |
2.56 |
34.77 |
| SZY1-122 |
1.16 |
9.11 |
2.10 |
3.43 |
0.61 |
3.88 |
1.15 |
0.45 |
2.02 |
0.94 |
2.32 |
26.24 |
| SZY1-124 |
1.20 |
6.16 |
2.05 |
3.86 |
0.55 |
4.20 |
0.94 |
0.44 |
1.95 |
0.94 |
2.52 |
16.69 |
| SZY1-128 |
1.11 |
8.88 |
2.16 |
4.41 |
0.59 |
3.78 |
1.04 |
0.44 |
2.03 |
0.93 |
2.37 |
24.21 |
| SZY1-134 |
1.19 |
7.70 |
2.19 |
6.61 |
0.58 |
2.95 |
1.14 |
0.45 |
1.91 |
1.00 |
2.54 |
29.20 |
| SZY1-138 |
1.20 |
9.10 |
1.95 |
5.08 |
0.57 |
3.86 |
1.08 |
0.44 |
1.82 |
0.99 |
2.63 |
24.47 |
| SZY1-142 |
1.29 |
16.98 |
2.41 |
14.64 |
0.63 |
39.88 |
1.43 |
0.47 |
1.72 |
0.95 |
3.76 |
52.77 |
| SZY1-148 |
1.37 |
11.53 |
1.93 |
2.81 |
0.63 |
3.00 |
1.58 |
0.49 |
1.49 |
0.85 |
2.22 |
29.44 |
| SZY1-155 |
1.30 |
9.80 |
2.74 |
6.15 |
0.60 |
6.97 |
1.55 |
0.47 |
1.62 |
0.99 |
2.87 |
26.95 |
| SZY1-162 |
1.34 |
9.47 |
2.06 |
3.86 |
0.59 |
3.38 |
1.44 |
0.48 |
1.59 |
0.95 |
2.05 |
23.28 |
| SZY1-168 |
1.23 |
6.78 |
2.10 |
3.13 |
0.59 |
3.05 |
1.31 |
0.45 |
1.63 |
0.96 |
1.92 |
15.56 |
| SZY1-174 |
1.28 |
10.15 |
1.97 |
2.69 |
0.58 |
2.85 |
1.33 |
0.47 |
1.51 |
0.92 |
2.11 |
28.25 |
| SZY1-180 |
1.33 |
6.20 |
2.51 |
4.15 |
0.60 |
3.97 |
1.34 |
0.46 |
1.42 |
0.96 |
2.20 |
20.00 |
| SZY1-186 |
1.20 |
8.54 |
2.15 |
4.17 |
0.57 |
3.14 |
1.24 |
0.43 |
1.23 |
0.82 |
2.16 |
18.88 |
| SZY1-192 |
1.11 |
8.19 |
2.14 |
5.08 |
0.55 |
6.74 |
1.11 |
0.45 |
1.28 |
0.86 |
2.22 |
13.71 |
| SZY1-198 |
1.14 |
2.01 |
1.54 |
2.19 |
0.59 |
8.73 |
1.07 |
0.45 |
2.22 |
1.00 |
0.94 |
0.70 |
| average |
1.20 |
10.47 |
2.14 |
4.52 |
0.57 |
6.46 |
1.14 |
0.45 |
1.83 |
0.95 |
2.60 |
29.86 |
Table A5.
Rare Earth Element Concentrations in Shale Samples (μg/g).
Table A5.
Rare Earth Element Concentrations in Shale Samples (μg/g).
| Samples ID |
La |
Ce |
Pr |
Nd |
Sm |
Eu |
Gd |
Tb |
Dy |
Ho |
Er |
Tm |
Yb |
Lu |
∑LREE |
∑HREE |
∑REE |
| SZY1-047 |
32.9 |
67.3 |
7.98 |
28.9 |
6.32 |
1.24 |
6.04 |
0.82 |
5.08 |
1.01 |
3.34 |
0.49 |
3.25 |
0.5 |
144.64 |
20.53 |
165.17 |
| SZY1-050 |
32.4 |
65.7 |
7.77 |
30.9 |
6.13 |
1.29 |
5.94 |
0.79 |
5.01 |
0.98 |
3.21 |
0.46 |
3.02 |
0.46 |
144.19 |
19.87 |
164.06 |
| SZY1-055 |
29.5 |
59.6 |
7.16 |
27.6 |
6.01 |
1.17 |
5.66 |
0.8 |
5.34 |
1.04 |
3.26 |
0.47 |
3.17 |
0.51 |
131.04 |
20.25 |
151.29 |
| SZY1-063 |
29.5 |
59.6 |
7.09 |
26.5 |
6.16 |
1.21 |
6.01 |
0.82 |
5.19 |
1.05 |
3.35 |
0.48 |
3.31 |
0.48 |
130.06 |
20.69 |
150.75 |
| SZY1-067 |
31.4 |
63.1 |
7.36 |
28.1 |
6.04 |
1.17 |
5.83 |
0.83 |
5.25 |
1.02 |
3.31 |
0.47 |
3.18 |
0.48 |
137.17 |
20.37 |
157.54 |
| SZY1-085 |
20 |
44 |
5.21 |
21.6 |
4.85 |
1.05 |
5.18 |
0.68 |
4.3 |
0.83 |
2.55 |
0.33 |
2.09 |
0.33 |
96.71 |
16.29 |
113 |
| SZY1-089 |
26.8 |
55.5 |
6.19 |
25.5 |
5.08 |
0.94 |
5.1 |
0.7 |
4.44 |
0.92 |
2.95 |
0.43 |
2.83 |
0.42 |
120.01 |
17.79 |
137.8 |
| SZY1-091 |
29.4 |
61 |
6.78 |
25.3 |
6.31 |
0.93 |
4.85 |
0.68 |
4.26 |
0.85 |
2.68 |
0.39 |
2.59 |
0.4 |
129.72 |
16.7 |
146.42 |
| SZY1-098 |
31 |
64.3 |
6.78 |
24.5 |
5.05 |
0.99 |
4.84 |
0.68 |
4.31 |
0.88 |
2.89 |
0.43 |
2.9 |
0.42 |
132.62 |
17.35 |
149.97 |
| SZY1-102 |
26.6 |
54.7 |
6.1 |
22.5 |
4.97 |
0.97 |
4.93 |
0.7 |
4.37 |
0.88 |
2.79 |
0.4 |
2.58 |
0.39 |
115.84 |
17.04 |
132.88 |
| SZY1-105 |
27.6 |
57.1 |
6.18 |
22.8 |
4.82 |
0.98 |
4.68 |
0.64 |
3.91 |
0.81 |
2.49 |
0.36 |
2.53 |
0.39 |
119.48 |
15.81 |
135.29 |
| SZY1-111 |
28.4 |
60 |
6.8 |
26.5 |
6.09 |
1.16 |
5.77 |
0.73 |
4.66 |
0.95 |
2.97 |
0.41 |
2.79 |
0.43 |
128.95 |
18.71 |
147.66 |
| SZY1-116 |
20.3 |
46.1 |
5.73 |
24.2 |
5.85 |
1.47 |
6.35 |
0.88 |
5.32 |
1.03 |
2.98 |
0.42 |
2.67 |
0.4 |
103.65 |
20.05 |
123.7 |
| SZY1-118 |
28.2 |
57.9 |
6.67 |
25.1 |
5.24 |
1.04 |
5.03 |
0.7 |
4.61 |
0.95 |
2.91 |
0.42 |
2.9 |
0.43 |
124.15 |
17.95 |
142.1 |
| SZY1-122 |
30.4 |
63.8 |
6.98 |
26.1 |
5.76 |
1.17 |
5.76 |
0.83 |
4.99 |
0.98 |
3.09 |
0.41 |
2.92 |
0.43 |
134.21 |
19.41 |
153.62 |
| SZY1-124 |
33 |
67 |
7.85 |
29.1 |
6.21 |
1.24 |
5.95 |
0.79 |
4.89 |
0.99 |
3.11 |
0.44 |
2.96 |
0.43 |
144.4 |
19.56 |
163.96 |
| SZY1-128 |
30.4 |
61.5 |
7.01 |
25.7 |
5.51 |
1.1 |
5.42 |
0.76 |
4.7 |
0.94 |
2.95 |
0.42 |
2.86 |
0.45 |
131.22 |
18.5 |
149.72 |
| SZY1-134 |
30.9 |
60.5 |
7.16 |
28.4 |
7.06 |
1.38 |
7.21 |
0.97 |
5.64 |
1.11 |
3.35 |
0.48 |
3.05 |
0.47 |
135.4 |
22.28 |
157.68 |
| SZY1-138 |
33 |
70.2 |
8.36 |
31.8 |
5.86 |
1.08 |
5.43 |
0.72 |
4.61 |
0.92 |
3.03 |
0.45 |
3.02 |
0.47 |
150.3 |
18.65 |
168.95 |
| SZY1-142 |
33.3 |
67.9 |
7.83 |
28.1 |
6.16 |
1.26 |
6.26 |
0.83 |
5.47 |
1.06 |
3.15 |
0.47 |
3.14 |
0.47 |
144.55 |
20.85 |
165.4 |
| SZY1-148 |
31 |
59.9 |
7 |
27.1 |
5.59 |
1.02 |
5.66 |
0.75 |
4.94 |
1.02 |
3.26 |
0.47 |
3.24 |
0.49 |
131.61 |
19.83 |
151.44 |
| SZY1-155 |
32 |
63.2 |
7.87 |
28.9 |
6.5 |
1.24 |
5.95 |
0.82 |
5.4 |
1.02 |
3.17 |
0.47 |
3.04 |
0.48 |
139.71 |
20.35 |
160.06 |
| SZY1-162 |
32.7 |
63.8 |
7.87 |
29.9 |
6.43 |
1.25 |
6.06 |
0.84 |
5.4 |
1.08 |
3.46 |
0.51 |
3.4 |
0.51 |
141.95 |
21.26 |
163.21 |
| SZY1-168 |
29.2 |
62.6 |
8.17 |
33.8 |
7.72 |
1.6 |
7.75 |
1.04 |
6.34 |
1.19 |
3.81 |
0.52 |
3.56 |
0.5 |
143.09 |
24.71 |
167.8 |
| SZY1-174 |
33.4 |
65.4 |
8.13 |
30.2 |
6.71 |
1.31 |
6.17 |
0.84 |
5.15 |
1.02 |
3.28 |
0.47 |
3.15 |
0.47 |
145.15 |
20.55 |
165.7 |
| SZY1-180 |
36.5 |
71.8 |
8.35 |
30.4 |
5.96 |
1.08 |
5.51 |
0.72 |
4.63 |
0.91 |
2.87 |
0.4 |
2.89 |
0.42 |
154.09 |
18.35 |
172.44 |
| SZY1-186 |
33.1 |
65.6 |
8.05 |
31.6 |
6.48 |
1.29 |
6.22 |
0.85 |
5.5 |
1.08 |
3.44 |
0.51 |
3.35 |
0.53 |
146.12 |
21.48 |
167.6 |
| SZY1-192 |
33.5 |
67.2 |
8.32 |
32 |
6.42 |
1.2 |
6.03 |
0.84 |
5.39 |
1.06 |
3.51 |
0.5 |
3.36 |
0.51 |
148.64 |
21.2 |
169.84 |
| SZY1-198 |
29.3 |
55.9 |
6.92 |
26 |
5.59 |
1.05 |
5.31 |
0.75 |
4.63 |
0.91 |
2.81 |
0.4 |
2.83 |
0.42 |
124.76 |
18.06 |
142.82 |
| Chondritea
|
0.31 |
0.81 |
0.12 |
0.6 |
0.2 |
0.07 |
0.26 |
0.05 |
0.32 |
0.07 |
0.21 |
0.03 |
0.21 |
0.03 |
2.11 |
1.18 |
3.29 |
| NASCb
|
32 |
73 |
7.9 |
33 |
5.7 |
1.24 |
5.2 |
0.85 |
5.8 |
1.04 |
3.4 |
0.5 |
3.1 |
0.48 |
152.84 |
20.37 |
173.21 |
| Average |
30.20 |
61.46 |
7.23 |
27.56 |
5.96 |
1.17 |
5.76 |
0.79 |
4.96 |
0.98 |
3.10 |
0.44 |
2.99 |
0.45 |
133.57 |
19.46 |
153.03 |
References
- Bentley R W. Global oil & gas depletion: an overview. Energy policy 2002, 30, 189–205. [CrossRef]
- Chengzao J, Zheng M, Zhang Y. Unconventional hydrocarbon resources in China and the prospect of exploration and development. Petroleum Exploration and Development 2012, 39, 139–146. [CrossRef]
- Zou C, Zhao Z, Pan S, et al. Unveiling the Oldest Industrial Shale Gas Reservoir: Insights for the Enrichment Pattern and Exploration Direction of Lower Cambrian Shale Gas in the Sichuan Basin. Engineering 2024. [CrossRef]
- Li D, Li R, Xue T, et al. Characteristic and geological implications of major elements and rare earth elements of Triassic Chang 7 oil shale in Tongchuan city, Southern Ordos Basin (China). Minerals 2018, 8, 157. [CrossRef]
- Xiao B, Guo D, Zhao Z, et al. Elemental Geochemical Characteristics of Shales from Wufeng–Longmaxi Formations in the Southern Margin of the Qinling Orogenic Belt, China: Implications for Depositional Controls on Organic Matter. ACS omega 2024, 9, 31488–31507. [CrossRef]
- Caineng Z O U, Dazhong D, Yuman W, et al. Shale gas in China: Characteristics, challenges and prospects (II). Petroleum exploration and development 2016, 43, 182–196. [CrossRef]
- Li J, Wang X, Hou L, et al. Geochemical characteristics and resource potential of shale gas in Sichuan Basin, China. Journal of Natural Gas Geoscience 2021, 6, 313–327. [CrossRef]
- He X, Chen G, Wu J, et al. Deep shale gas exploration and development in the southern Sichuan Basin: New progress and challenges. Natural Gas Industry B 2023, 10, 32–43. [CrossRef]
- Yang F, Zhou X, Peng Y, et al. Evolution of Neoproterozoic basins within the Yangtze Craton and its significance for oil and gas exploration in South China: An overview. Precambrian Research 2020, 337, 105563. [CrossRef]
- Chen, Y. L., Chu, X. L., Zhang, X. L., et al. Carbon and sulfur isotopes and trace elements of the Dengying Formation dolomite in the Zhenba area of Southern Shaanxi: Implications for the redox environment of the Ediacaran shallow sea at the end of the Ediacaran Period. Science China Earth Sciences 2015, 45, 963–981. [CrossRef]
- Peng, L. Y. Deep Structural Characteristics and Evolution Mechanism of the Micangshan-Zhenba Area [D]. China University of Geosciences (Beijing), 2013.
- Tian T, Yang P, Yao J, et al. New detrital apatite fission track thermochronological constraints on the Meso-Cenozoic tectono-thermal evolution of the Micangshan-Dabashan tectonic belt, Central China. Frontiers in Earth Science 2021, 9, 754137. [CrossRef]
- Chen, X. L., Zhai, G. Y., Bao, S. J., et al. Geological conditions and gas content characteristics of shale gas in the Niutitang Formation of the Zhenba area, southern Shaanxi: A case study of the Zhenba No.1 well. China Mining Magazine 2018, 27, 101-106.
- Wei, Y., Hu, Z. W., Li, Y., et al. Characteristics of diagenesis of Cambrian Longwangmiao Formation carbonates in the Zhenba area of northeastern Sichuan. Journal of Northeast Petroleum University 2020, 44, 56–68+69.
- Sun, X. Y., Mou, C. L., Ge, X. Y., et al. Geochemical characteristics and sedimentary environment significance of the Upper Ordovician Wufeng Formation in the Guangyuan-Zhenba area, Sichuan and Shaanxi, China. Journal of Sedimentary Geology and Tethyan Geology 2016, 36, 46–54.
- Li H, Li D, He Q, et al. Controlling mechanism of shale palaeoenvironment on its tensile strength: A case study of Banjiuguan Formation in Micangshan Mountain. Fuel 2024, 355, 129505. [CrossRef]
- Tian T, FU DL Z S X. The paleo-redox conditions of the shale in Niutitang Formation and its effects on organic matter enrichment of the Micangshan-Hannan Uplift. Journal of Lanzhou University: Natural Sciences 2020, 56, 37–47.
- Li D, Li R, Zhu Z, et al. Origin of organic matter and paleo-sedimentary environment reconstruction of the Triassic oil shale in Tongchuan City, southern Ordos Basin (China). Fuel 2017, 208, 223–235. [CrossRef]
- Li J, Dong S, Yin A, et al. Mesozoic tectonic evolution of the Daba Shan Thrust Belt in the southern Qinling orogen, central China: Constraints from surface geology and reflection seismology. Tectonics 2015, 34, 1545–1575. [CrossRef]
- Liu S, Yang Y, Deng B, et al. Tectonic evolution of the Sichuan basin, southwest China. Earth-Science Reviews 2021, 213, 103470. [CrossRef]
- Qiu, N., Chang, J., Feng, Q., et al. Geochemical characteristics and sedimentary environment significance of the Upper Ordovician Wufeng Formation in the Guangyuan-Zhenba area, Sichuan and Shaanxi, China. Geoscience Frontiers 2023, 30, 199–212.
- Jisheng Z, Rui G A O, Qiusheng L I, et al. Characteristic of gravity and magnetic anomalies in the Daba Shan and the Sichuan basin, China: implication for architecture of the Daba Shan. Acta Geologica Sinica-English Edition 2013, 87, 1154–1161.
- Li J, Zhang Y, Dong S, et al. Structural and geochronological constraints on the Mesozoic tectonic evolution of the North Dabashan zone, South Qinling, central China. Journal of Asian Earth Sciences 2013, 64, 99–114. [CrossRef]
- Xiao B, Xiong L, Zhao Z, et al. Sedimentary tectonic pattern of Wufeng and Longmaxi Formations in the northern margin of Sichuan Basin, South China. International Geology Review 2022, 64, 2166–2185. [CrossRef]
- Lu F, Tan X, Ma T, et al. The sedimentary facies characteristics and lithofacies palaeogeography during Middle-Late Cambrian, Sichuan Basin and adjacent area. Petroleum 2017, 3, 212–231. [CrossRef]
- Hou, M. C., He, L., Xu, S. L., et al. Lithofacies and depositional environment analysis of the Dengying Formation in the Zhenba area. Journal of Southwest Petroleum University (Science & Technology Edition) 2020, 42, 31–42.
- Xie Q, Xu F, Wang N, et al. Geological conditions and gas-bearing evaluation of the Niutitang Formation shale in the Xixiang–Zhenba area, China. Geologia Croatica 2020, 73, 49–58. [CrossRef]
- Hou, Q. Q. Geological conditions for shale gas accumulation in the Lower Paleozoic black rock series of the Zhenba-Xixiang area, western Daba Mountains [D]. Chang'an University, 2023. [CrossRef]
- Ji, Y. T., Kang, S. W. Reservoir characteristics of black shale in the Wufeng Formation and Longmaxi Formation of the Han 1 well in the Ningqiang area, southern Shaanxi. China Coalbed Methane 2018, 15, 8–12.
- Wang G, Carr T R. Methodology of organic-rich shale lithofacies identification and prediction: A case study from Marcellus Shale in the Appalachian basin. Computers & Geosciences 2012, 49, 151–163. [CrossRef]
- Feng Z Z. A review on the definitions of terms of sedimentary facies. Journal of Palaeogeography 2019, 8, 1–11. [CrossRef]
- Wang, Y. M., Dong, D. Z., Li, J. Z., et al. Reservoir characteristics of shale gas in the Lower Silurian Longmaxi Formation in southern Sichuan. Acta Petrolei Sinica 2012, 33, 551–561.
- Wang, Y. M., Wang, S. F., Dong, D. Z., et al. Lithofacies characterization of the Lower Silurian Longmaxi Formation shale in southern Sichuan. Earth Science Frontiers 2016, 23, 119–133. [CrossRef]
- Yu-Jiang J, Yi-Tao S, Lin Q I. Fine lithofacies of China s marine shale and its logging prediction: A case study of the Lower Silurian Longmaxi marine shale in Weiyuan area, southern Sichuan Basin, China. Earth Science Frontiers 2016, 23, 107.
- Chen S, Han Y, Fu C, et al. Micro and nano-size pores of clay minerals in shale reservoirs: Implication for the accumulation of shale gas. Sedimentary geology 2016, 342, 180–190. [CrossRef]
- Zhang J, Li X, Wei Q, et al. Quantitative characterization of pore-fracture system of organic-rich marine-continental shale reservoirs: A case study of the Upper Permian Longtan Formation, Southern Sichuan Basin, China. Fuel 2017, 200, 272–281. [CrossRef]
- Wei J, Zhang A, Li J, et al. Study on microscale pore structure and bedding fracture characteristics of shale oil reservoir. Energy 2023, 278, 127829. [CrossRef]
- Zhang P, Lu S, Li J, et al. Characterization of shale pore system: a case study of Paleogene Xin'gouzui Formation in the Jianghan basin, China. Marine and Petroleum Geology 2017, 79, 321–334. [CrossRef]
- Yao J, Sun H, Fan D, et al. Numerical simulation of gas transport mechanisms in tight shale gas reservoirs. Petroleum Science 2013, 10, 528–537. [CrossRef]
- Yu H, Zhu Y B, Jin X, et al. Multiscale simulations of shale gas transport in micro/nano-porous shale matrix considering pore structure influence. Journal of Natural Gas Science and Engineering 2019, 64, 28–40. [CrossRef]
- Pore structure of Cambrian shales from the Sichuan Basin in China and implications for gas storage.
- Shan, C. C. Study on the shale gas accumulation conditions of the Lower Cambrian Niutitang Formation in the Micangshan area [D]. Chang'an University, 2020. [CrossRef]
- Zhang J, Li X, Wei Q, et al. Quantitative characterization of pore-fracture system of organic-rich marine-continental shale reservoirs: A case study of the Upper Permian Longtan Formation, Southern Sichuan Basin, China. Fuel 2017, 200, 272–281. [CrossRef]
- He C, Ji L, Wu Y, et al. Characteristics of hydrothermal sedimentation process in the Yanchang Formation, south Ordos Basin, China: Evidence from element geochemistry. Sedimentary Geology 2016, 345, 33–41. [CrossRef]
- Herron M M. Geochemical classification of terrigenous sands and shales from core or log data. Journal of Sedimentary Research 1988, 58, 820–829. [CrossRef]
- Shaw D M, Cramer J J, Higgins M D, et al. Composition of the Canadian Precambrian shield and the continental crust of the Earth. Geological Society, London, Special Publications 1986, 24, 275–282. [CrossRef]
- McLennan S M. Relationships between the trace element composition of sedimentary rocks and upper continental crust. Geochemistry, Geophysics, Geosystems 2001, 2. [CrossRef]
- Fu X, Wang J, Feng X, et al. Mineralogical composition of and trace-element accumulation in lower Toarcian anoxic sediments: a case study from the Bilong Co. oil shale, eastern Tethys. Geological Magazine 2016, 153, 618–634. [CrossRef]
- Huang Z S, Wang X Z, Yang X Y, et al. Constraints of sedimentary environment on organic matter accumulation in shale: A case study of the Wufeng-Longmaxi Formations in the southern Sichuan Basin. Acta Sedimentologica Sinica 2021, 39, 631–644. [CrossRef]
- Nothdurft L D, Webb G E, Kamber B S. Rare earth element geochemistry of Late Devonian reefal carbonates, Canning Basin, Western Australia: confirmation of a seawater REE proxy in ancient limestones. Geochimica et Cosmochimica Acta 2004, 68, 263–283. [CrossRef]
- Cheng, J. X., Deng, M., Yang, G. L., et al. Geochemical characteristics and provenance tectonic background analysis of the Silurian Longmaxi Formation black mudstone in the Mingsheng section, Yanyuan area, Sichuan [J/OL]. Sedimentary Geology and Tethyan Geology, 1-22 [2024-10-18]. [CrossRef]
- Liu J, Yao Y, Elsworth D, et al. Sedimentary characteristics of the Lower Cambrian Niutitang shale in the southeast margin of Sichuan Basin, China. Journal of Natural Gas Science and Engineering 2016, 36, 1140–1150. [CrossRef]
- Zhou L, Wang Z, Gao W, et al. Provenance and tectonic setting of the Lower Cambrian Niutitang formation shales in the Yangtze platform, South China: Implications for depositional setting of shales. Geochemistry 2019, 79, 384–398. [CrossRef]
- Yin, J. T., Yu, Y. X., Jiang, C. F., et al. Elemental geochemical characteristics and relationship with organic matter enrichment of Zhang Jia Tan shale in the Ordos Basin. Journal of China Coal Society 2017, 42, 1544–1556. [CrossRef]
- Liu, S. G., Deng, B., Li, Z. W., et al. Basin-mountain structure and oil-gas distribution: A case study of the Sichuan Basin. Acta Petrologica Sinica 2011, 27, 621–635.
- Roser B P, Korsch R J. Provenance signatures of sandstone-mudstone suites determined using discriminant function analysis of major-element data. Chemical geology 1988, 67, 119–139. [CrossRef]
- Bhatia M R, Crook K A W. Trace element characteristics of graywackes and tectonic setting discrimination of sedimentary basins. Contributions to mineralogy and petrology 1986, 92, 181–193. [CrossRef]
- Bhatia M R. Rare earth element geochemistry of Australian Paleozoic graywackes and mudrocks: provenance and tectonic control. Sedimentary geology 1985, 45, 97–113. [CrossRef]
- Liu, C. L., Xiong, G. Q., Dong, G. M., et al. Geochemical characteristics of mudstones across the Ordovician-Silurian boundary in the northern margin of the Yangtze Block and their provenance and tectonic background. Geological Review 2021, 67, 1263–1279. [CrossRef]
- Floyd P A, Leveridge B E. Tectonic environment of the Devonian Gramscatho basin, south Cornwall: framework mode and geochemical evidence from turbiditic sandstones. Journal of the Geological Society 1987, 144, 531–542. [CrossRef]
- Allegre C J, Minster J F. Quantitative models of trace element behavior in magmatic processes. Earth and Planetary Science Letters 1978, 38, 1–25. [CrossRef]
- Li, B., Sun, G. H., Zhong, H. X., et al. Geochemical characteristics of rare earth elements in surface sediments of the coastal area of Fujian and their implications for provenance. Marine Geology & Quaternary Geology 2017, 33, 47–56. [CrossRef]
- Su, N., Bi, L., Guo, Y. L., et al. Composition and provenance discrimination of rare earth elements in surface sediments from the Mulan Stream estuary and adjacent sea areas. Marine Geology & Quaternary Geology 2018, 38, 150–159. [CrossRef]
- Florian M L E. The underwater environment[M]//Conservation of marine archaeological objects. Butterworth-Heinemann, 1987: 1-20.
- Alexander B W, Bau M, Andersson P, et al. Continentally-derived solutes in shallow Archean seawater: rare earth element and Nd isotope evidence in iron formation from the 2.9 Ga Pongola Supergroup, South Africa. Geochimica et Cosmochimica Acta 2008, 72, 378–394. [CrossRef]
- Madhavaraju J. Geochemistry of late Cretaceous sedimentary rocks of the Cauvery Basin, south India: constraints on paleoweathering, provenance, and end Cretaceous environments[M]//Chemostratigraphy. Elsevier, 2015, 185-214.
- Madhavaraju J, Tom M, Lee Y I L, et al. Provenance and tectonic settings of sands from Puerto Peñasco, Desemboque and Bahia Kino beaches, gulf of California, Sonora, México. Journal of South American Earth Sciences 2016, 71, 262–275. [CrossRef]
- Fan, Y. H., Wang, H., Zhang, S. P. Application of trace element analysis in identifying sedimentary medium environments: A case study of the Late Triassic in the western central part of the Ordos Basin. Geological Review 2015, 61, 632–634.
- Feng L, Chu X, Zhang Q, et al. New evidence of deposition under cold climate for the Xieshuihe Formation of the Nanhua System in northwestern Hunan, China. Chinese Science Bulletin 2004, 49, 1420–1427. [CrossRef]
- Cullers R L, Podkovyrov V N. Geochemistry of the Mesoproterozoic Lakhanda shales in southeastern Yakutia, Russia: implications for mineralogical and provenance control, and recycling. Precambrian Research 2000, 104, 77–93. [CrossRef]
- Liu, H. L., Zou, C. N., Qiu, Z., et al. Depositional environment and organic matter enrichment mechanisms of lacustrine black shales: A case study of the Chang 7 Member in the Ordos Basin. Acta Sedimentologica Sinica 2023, 41, 1810–1829. [CrossRef]
- Chen, Y. J., Li, P., Xu, Y. Q., et al. Geochemical characteristics of sediments in the Longqi hydrothermal area of the Southwest Indian Ocean and their implications. Advances in Marine Science 2024, 42, 532–544.
- Zhang, X. Y., Tao, C. H., Liao, S. L., et al. Geochemical characteristics of surface sediments from the Southwest Indian Ridge and their implications for hydrothermal activity. Acta Sedimentologica Sinica 2020, 38, 727–736. [CrossRef]
- Zhao, C. J., Kang, Z. H., Hou, Y. H., et al. Geochemical characteristics of rare earth elements in Permian mudshales of the Lower Yangtze Region and their geological significance. Earth Science 2020, 45, 4118–4127.
- Yuhang W, Yuanyuan Z, Jiandong H, et al. Application of rare earth elements of the marine carbonate rocks in paleoenvironmental researches. Advances in Earth Science 2018, 33, 922.
- Wang Z, Wang J, Fu X, et al. Organic material accumulation of Carnian mudstones in the North Qiangtang Depression, eastern Tethys: controlled by the paleoclimate, paleoenvironment, and provenance. Marine and Petroleum Geology 2017, 88, 440–457. [CrossRef]
- Xiong, M., Zou, G. J., Zhang, X. Y., et al. Geochemical characteristics of rare earth elements in Silurian sandstones from the Yongshun area, northwest Hunan and their geological significance. Chinese Geological Survey 2023, 10, 67–74. [CrossRef]
- Fan, Q. S., Xia, G. Q., Li, G. J., et al. Methods and research progress in analyzing paleo-ocean redox conditions. Acta Sedimentologica Sinica 2022, 40, 1151–1171. [CrossRef]
- Fu X, Jian W, Chen W, et al. Organic accumulation in lacustrine rift basin: constraints from mineralogical and multiple geochemical proxies. International Journal of Earth Sciences 2015, 104, 495–511. [CrossRef]
- Chen, H., Shen, J. J., Tan, G. C., et al. Depositional paleoenvironment and its control on organic matter enrichment in shale of passive continental margins: A case study of the Lower Silurian Longmaxi Formation in the northern Chongqing region of the Upper Yangtze. Journal of Palaeogeography 2024, 26, 1072–1089.
- Lei, M. Y., Liu, C., Sun, B. L., et al. Geochemical characteristics and formation environment of Upper Paleozoic source rocks in the Shixi block, eastern margin of the Ordos Basin. Geological Review 2024, 70, 499–511. [CrossRef]
- Tribovillard N, Algeo T J, Lyons T, et al. Trace metals as paleoredox and paleoproductivity proxies: an update. Chemical geology 2006, 232, 12–32. [CrossRef]
Figure 1.
Geologic map of the Zhenba area and its surrounding region(A:Tectonic divisions of China, AHO-Alpine-himalayan orogenic belt、CAO-Central Asian Orogenic Belt、CP-Cathysia、NCP-North China Plate、QLO-Qinling Orogenic Belt、SGO-Songpan-Ganzi Orogrnic Belt、TMP-Tarim Plate、YCP-Yangtze Plate,B: Geologic map of the Zhenba area and its surrounding region).
Figure 2.
Lithologic column of the SZY 1 well.
Figure 2.
Lithologic column of the SZY 1 well.
Figure 3.
Shale lithofacies map of Niutitang Formation (Base map (according to Wang Yuman et al., 2016 [
33], note: all data in the figure are from actual measured core samples of the Niutitang Formation shale from SZY1well).
Figure 3.
Shale lithofacies map of Niutitang Formation (Base map (according to Wang Yuman et al., 2016 [
33], note: all data in the figure are from actual measured core samples of the Niutitang Formation shale from SZY1well).
Figure 4.
Mineral Composition Content Chart of Niutitang Formation Shale in the Study Area(note: all data in the figure are from actual measured core samples of the Niutitang Formation shale from SZY1well).
Figure 4.
Mineral Composition Content Chart of Niutitang Formation Shale in the Study Area(note: all data in the figure are from actual measured core samples of the Niutitang Formation shale from SZY1well).
Figure 5.
Relative content map of clay minerals in Niutitang Formation shale of the study area.( note: all data in the figure are from actual measured core samples of the Niutitang Formation shale from SZY1well).
Figure 5.
Relative content map of clay minerals in Niutitang Formation shale of the study area.( note: all data in the figure are from actual measured core samples of the Niutitang Formation shale from SZY1well).
Figure 6.
Mineralogical and Petrographic Characteristics of Niutitang Formation in the Study Area.
Figure 6.
Mineralogical and Petrographic Characteristics of Niutitang Formation in the Study Area.
Figure 7.
Scanning Electron Microscopy Images and Pore Characteristics of Niutitang Formation ((a), (b), (c) represent sample SZY1-76, with bitumen filling and localized development of intergranular pores, intercry stalline pores in clay minerals, and framboidal pyrite intercry stalline spaces filled with bitumen, at a depth of 1964.66 meters; (d), (e), (f) represent sample SZY1-98, with fractures and micro-fractures filled with bitumen, all classified as ultra macropores, and a significant development of micro-fractures, at a depth of 1974.75 meters; (g), (h), (i) represent sample SZY1-124, with dissolution pores visible within calcite, and the development of intergranular and intercry stalline pores, at a depth of 1987.74 meters; (j), (k), (l) represent sample SZY1-138, with development of mineral intergranular pores at fracture sites, and framboidal pyrite with a small number of intercry stalline pores, at a depth of 1994.37 meters; (m), (n), (o) represent sample SZY1-148, with intercry stalline spaces filled with organic matter and pyrite micro-particles, and the development of micropores within organic matter, at a depth of 1999.23 meters; (p), (q), (r) represent sample SZY1-174, with granular pyrite dispersedly distributed, and development of intergranular pores in clay minerals, at a depth of 2012.62 meters)).
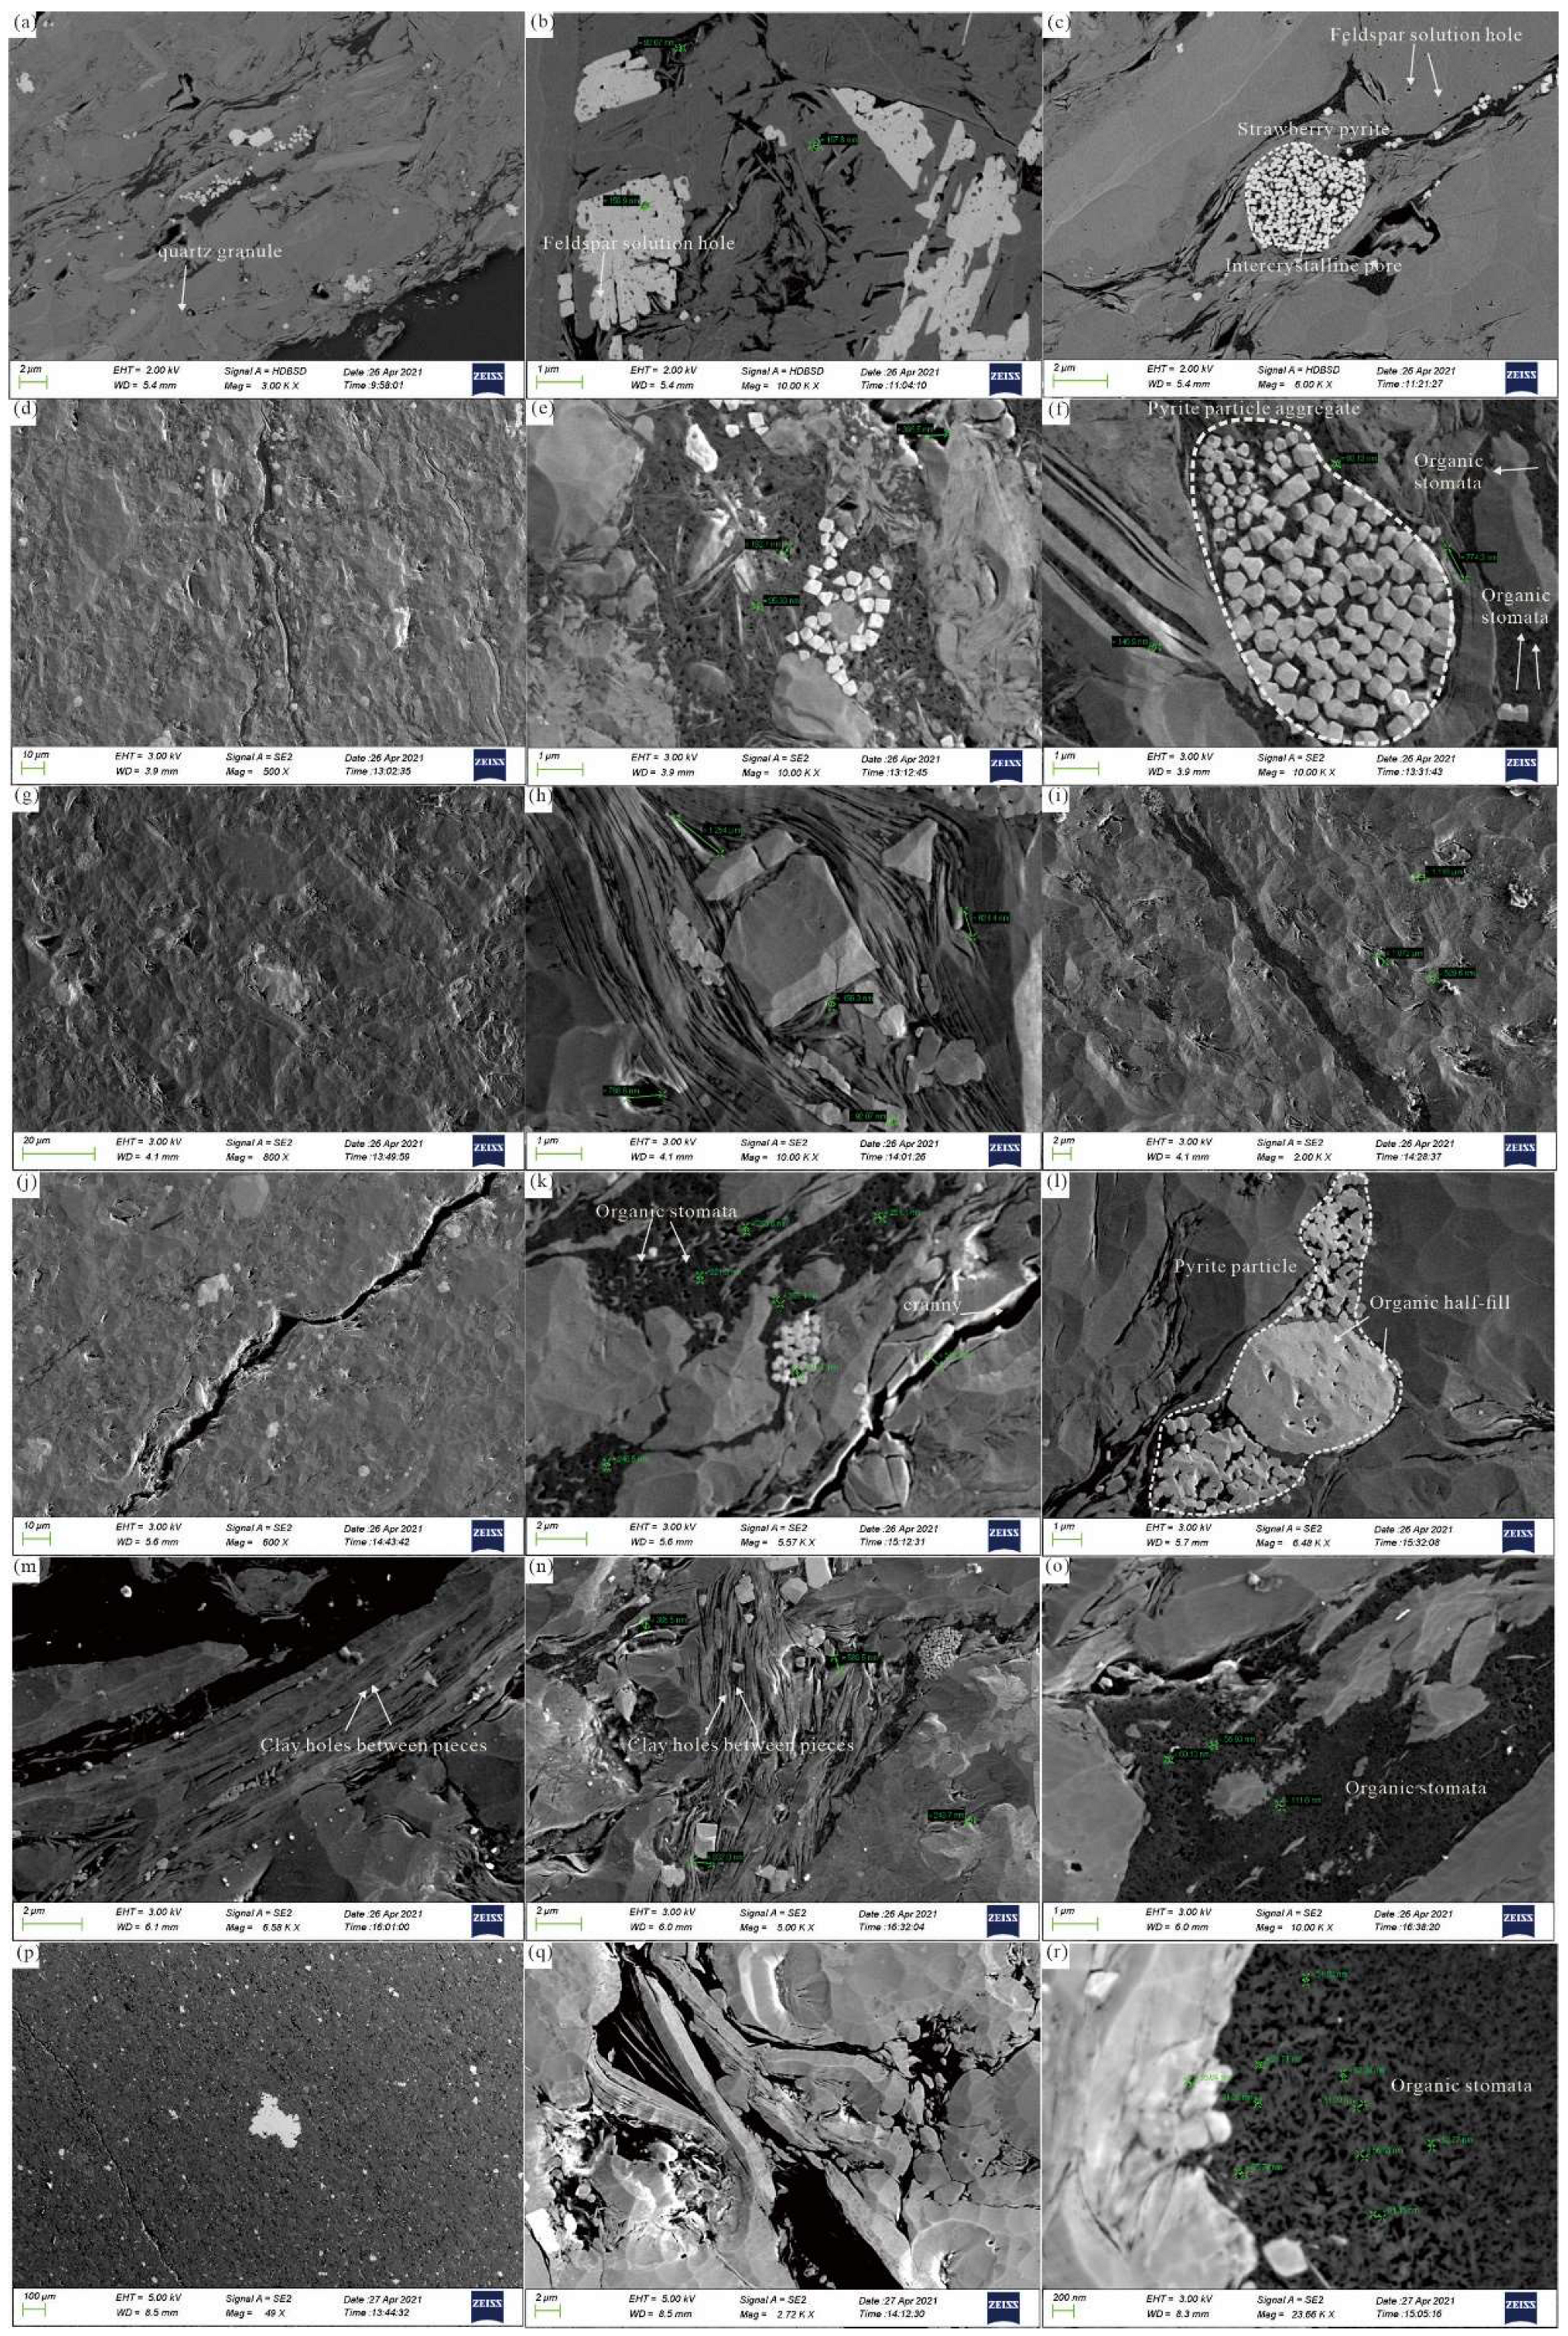
Figure 8.
Box Plot of Reservoir Physical Properties of Niutitang Formation in the Study Area(note: all data in the figure are from actual measured core samples of the Niutitang Formation shale from SZY1well).
Figure 8.
Box Plot of Reservoir Physical Properties of Niutitang Formation in the Study Area(note: all data in the figure are from actual measured core samples of the Niutitang Formation shale from SZY1well).
Figure 9.
Pore-Permeability Relationship Diagram of Shale Reservoirs in Niutitang Formation of the Study Area(note: all data in the figure are from actual measured core samples of the Niutitang Formation shale from SZY1well).
Figure 9.
Pore-Permeability Relationship Diagram of Shale Reservoirs in Niutitang Formation of the Study Area(note: all data in the figure are from actual measured core samples of the Niutitang Formation shale from SZY1well).
Figure 10.
Vertical Variation Plot of Major and Rare Earth Elements in Shale Samples(note: all data in the figure are from actual measured core samples of the Niutitang Formation shale from SZY1well).
Figure 10.
Vertical Variation Plot of Major and Rare Earth Elements in Shale Samples(note: all data in the figure are from actual measured core samples of the Niutitang Formation shale from SZY1well).
Figure 11.
Vertical Variation Plot of Geochemical Parameters in Shale Samples(note: all data in the figure are from actual measured core samples of the Niutitang Formation shale from SZY1well).
Figure 11.
Vertical Variation Plot of Geochemical Parameters in Shale Samples(note: all data in the figure are from actual measured core samples of the Niutitang Formation shale from SZY1well).
Figure 12.
a. Ternary Diagram of Relative Proportions of Major Elements (base map according to Cong He et al., 2016) [
44];
Figure 12b. Geochemical Classification of Core Samples from SZY1 Well (base map can refer to MICHAEL M. HERRON 1988; Cong He 2016) [
44,
45]( note: all data in the figure are from actual measured core samples of the Niutitang Formation shale from SZY1well).
Figure 13.
Relationship between SiO
2, Al
2O
3, K
2O, and TiO
2 Contents in Shale Samples (Note: All samples in the figure are from Niutitang Formation shale, They are the same samples, with different colors used in the figure.
Figure 13.a shows the relationship between Al
2O
3 and SiO
2,
Figure 13.b shows the relationship between K
2O and SiO
2,
Figure 13.c shows the relationship between K
2O and Al
2O
3, and
Figure 13.d shows the relationship between TiO
2 and Al
2O
3.).
Figure 14.
Spider Diagram of Trace Element Enrichment Factors(note: all data in the figure are from actual measured core samples of the Niutitang Formation shale from SZY1well).
Figure 14.
Spider Diagram of Trace Element Enrichment Factors(note: all data in the figure are from actual measured core samples of the Niutitang Formation shale from SZY1well).
Figure 15.
a. North American Shale Composite (NASC)-normalized REE pattern. b. Chondrite-normalized rare earth element (REE) pattern .( note: all data in the figure are from actual measured core samples of the Niutitang Formation shale from SZY1well).
Figure 15.
a. North American Shale Composite (NASC)-normalized REE pattern. b. Chondrite-normalized rare earth element (REE) pattern .( note: all data in the figure are from actual measured core samples of the Niutitang Formation shale from SZY1well).
Figure 16.
Tectonic Setting Discriminant Diagrams for Shale Samples from Niutitang Formation in the Zhenba Area(a) A plot of Sc/Cr versus La/Y, with the base map according to Roser B P et al. (1988) [
56]; (b) A plot of K
2O/Na
2O versus SiO
2/Al
2O
3, with the base map according to Bhatia M R et al. (1986) [
57]; ACM. Active Continental Margin; PM. Passive Continental Margin; CIA. Continental Island Arc; OIA. Oceanic Island Arc (note: all data in the figure are from actual measured core samples of the Niutitang Formation shale from SZY1well).
Figure 17.
Provenance Rock Attribute Discriminant Diagram for Shale from Niutitang Formation in Zhenba Area (a. Base map according to Floyd P A et al. (1987) [
60] b. Base map according to Allègre C J et al. (1978) [
61]) (note: all data in the figure are from actual measured core samples of the Niutitang Formation shale from SZY1well).
Figure 18.
Provenance Discriminant Diagram for Shale from Niutitang Formation in Zhenba Area (a. Base map according to Cronan D S et al. (1980) [
64] b. Base map according to Alexander B W et al. (2008) [
65])( note: all data in the figure are from actual measured core samples of the Niutitang Formation shale from SZY1well).
Figure 19.
Chemical Weathering Ternary Diagram(note: all data in the figure are from actual measured core samples of the Niutitang Formation shale from SZY1well).
Figure 19.
Chemical Weathering Ternary Diagram(note: all data in the figure are from actual measured core samples of the Niutitang Formation shale from SZY1well).
|
Disclaimer/Publisher’s Note: The statements, opinions and data contained in all publications are solely those of the individual author(s) and contributor(s) and not of MDPI and/or the editor(s). MDPI and/or the editor(s) disclaim responsibility for any injury to people or property resulting from any ideas, methods, instructions or products referred to in the content. |
© 2024 by the authors. Licensee MDPI, Basel, Switzerland. This article is an open access article distributed under the terms and conditions of the Creative Commons Attribution (CC BY) license (http://creativecommons.org/licenses/by/4.0/).
