1. Introduction
Genetic studies of patients and their families, along with the occurrence of similar symptoms in twins, suggest a genetic risk for neurodevelopmental disorders, such as autism and schizophrenia [
1,
2]. Girard et al. examined
de novo mutations in eight schizophrenic probands, finding mutations in fifteen genes, including
SBNO1[
3]. Other studies have suggested a link between schizophrenia and
SBNO1 [
4,
5]. Head circumference measurement, together with conventional anthropometry, is essential for infants for assessing neurodevelopment in infants [
6]. A genome -wide association study (GWAS) involving 10768 participants was conducted to identify gene loci associated with deviations in head circumference during infancy, resulting in the identification of two loci (12q15 and 12q24) that significantly accumulated single nucleotide polymorphisms (SNP). Interestingly
SBNO1 is locates in 12q24 [
7].
SBNO1 has also been reported to be among genes associated to intellectual abnormalities [
8]. Studies in zebrafish have showed that
SBNO1 deficiency leads to brain abnormalities [
9]. These findings suggested the essential role of
SBNO1 in normal brain development, indicating that mutations in
SBNO1 may serve as a pathogenetic factor in neurodevelopmental disorders.
Sbno1 is one of the vertebrate homologues of the Drosophila gene
strawberry notch (
sbno). The phenotype of
sbno mutants in flies exhibits notched wings and disorganized eyes, referred to as the
strawberry phenotype [
10]. These and other abnormalities in
sbno mutants overlap with those observed in Notch signaling-related mutants, suggesting that the sbno protein is a component of the Notch signaling pathway. Nevertheless,
sbno mutant of Drosophila did not disrupt the lateral inhibition event in neuronal differentiation, leading to the conclusion that
sbno may play a role in the specification between lateral inhibition and inductive Notch signaling pathways [
11]. Subsequently, Tsuda et al. [
12] demonstrated that sbno biochemically binds to Su(H) transcription factor, which regulates the expression of
delta gene, encoding for a ligand of Notch. Su(H) is the homolog of vertebrate Rbpj, and we have found that sbno1 binds to Rbpj through yeast two-hybrid screening [
13].
We previously examined the expression of Sbno1 protein in the neocortex during mouse embryonic development, whereas developmental abnormalities in Sbno1 knockout (KO) mice became apparent one week after birth [
14]. In this report, we investigated the postnatal expression of Sbno1 protein in C57BL/6 mouse brain. For this purpose, we developed a new polyclonal antibody against Sbno1 protein. Notably, all neurons express Sbno1; However, its expression was prominent in brain structures associated with motor function, such as layer V of the cerebral cortex, motor nuclei in the brainstem, and sporadically distributed neurons in the reticular formation. These observations suggest that Sbno1 functions in all neurons, while playing a unique role in specific neuronal populations.
2. Materials and Methods
2.1. Antigen Preparation
cDNA sequence coding for the amino acid sequence of the N-terminus of human SBNO1 (amino acid 13-130) was incorporated into the pET-21b (+) DNA vector (Merck) through. The vector was subsequently incorporated into competent
E. coli BL21(DE3) cells. Transformed competent cells were cultured in 5L lysogeny broth (LB) medium supplemented with Ampicillin at 37°C under shaking conditions until the optical density at 600 nm (OD
600) reached 0.6. The cells were then treated with isopropyl-β-D-1-thiogalactopyranoside at a final concentration of 0.1 mM and incubated at 37°C for 24 hours. Following centrifugation, the cell pellets were resuspended in 100 mL washing buffer (50 mM Na-phosphate buffer, pH 8.0, containing 0.5 M guanidine HCl). After centrifugation and removal of the supernatant, the pellets were dissolved by sonication in extraction buffer at the concentration of 0.1 g/mL (50 mM Na-phosphate buffer, pH 8.0, containing 2.2 M guanidine hydrochloride). Imidazole was supplemented to the post-centrifugation supernatant at a final concentration of 20 mM and subsequently applied to a pre-equilibrated column filled with HIS-Select Nickel resin (Sigma-Aldrich). Wash buffer was applied to the column until the absorbance at OD
280 of the buffer wash through the column fell below 0.1. Then, protein was eluted using elution buffer (extraction buffer complemented with 200 mM imidazole). The sample was dialyzed in 100x volume of refolding buffer (20 mM Na-phosphate buffer (pH 8.0), 0.3 M NaCl, 2 mM DTT) (
Figure S1 lane 1). HRV 3C protease was added to the sample to remove the His tag, which was sequentially passed through Ni resin and glutathione sepharose resin, and the fraction passing through was collected as the final antigen. The obtained recombinant human Sbno1 fragment was run on acrylamide gel electrophoresis and stained by Coomassie Brilliant Blue for quality control (
Figure S1 lane 2).
2.2. Generation of Polyclonal Antibody
An 8-week-old rabbit (Slc: NZW) was immunized via subcutaneous injection with the recombinant human Sbno1 fragment conjugated to Keyhole Limpet Hemocyanin (KLH) (Thermo Fisher Scientific). 50mg KLH conjugated to the antigen was dissolved in 150 μl of Complete Freund’s Adjuvant (Sigma-Aldrich # F5881). The antigen was injected into multiple sites on the rabbit’s back skin with a 2-week interval between each boost injection. Following 12 injections, the rabbit was deeply anesthetized using sodium pentobarbital, and the whole blood was collected from the rabbit’s heart into a serum-separating vacutainer (Nipro Inc.). The rabbit was euthanized by intracardiac injection of a lethal dose of sodium pentobarbital. After centrifugation of the blood containing vacutainer, the isolated serum was diluted with an equal volume of glycerol and stored in the freezer until use.
2.3. Animals
C57BL/6 mice were maintained on a 12:12-h light and dark cycle in a temperature-controlled breeding room (21oC) and were naturally mated to obtain pups. The day pups were born was designated as postnatal day 0 (P0). The pups were anesthetized with isoflurane inhalation solution (Pfizer, 219KAT) using NARCOBIT-E anesthesia device (Natsume Seisakusho Co., Ltd). For Immunohistochemistry the pups were transcardially perfused with 4% paraformaldehyde (PFA) prepared in 1X PBS and brains were dissected at the P0, P3, P5, P10, and P20 and post-fixed overnight in 4% PFA at 4oC. Brains were washed three times for 10 min each with PBS, then dehydrated with 80% ethanol and kept until used. For Western blot analysis the brains of C57BL/6 mouse at P10 and P20 were freshly dissected into the cerebral cortex, brainstem, basal ganglia, and cerebellum, then directly processed for western blotting. The cerebellum was not collected from P0 and P5 mouse brains due to its small size.
2.4. Western Blot
The freshly dissected tissues were extracted in RIPA buffer (50 mM Tris-HCl Buffer pH 7.6, 150 mM NaCl, 1% Nonidet P40 Substitute, 0.5% Sodium Deoxycholate, 0.1% sodium dodecyl sulfate (SDS)). Total protein lysates were prepared by homogenization in solution using a plastic pestle and cleared by centrifugation at 16000 g at 4oC for 10 min. Protein concentration was determined using nanodrop (Thermo Fisher; ND-ONE-W). An equal amount of total protein was loaded in 8% and 12% SDS/PAGE gel and transferred to PVDF membranes (PALL BSP0161; FUJIFILM). The membranes were immersed in blocking buffer (4% skim milk, 1x Tris-buffered saline, 0.1% Tween 20 (TBST)) for 10 min, then incubated with primary antibodies diluted in the blocking buffer overnight at 4oC. After washing with TBST, the membranes were incubated at room temperature for 1h with donkey anti-rabbit polyclonal antibody (1:5000) diluted in blocking buffer. Membranes were washed three times with TBST and scanned using a chemiluminescence imaging system (FUSION SOLO S; Vilber Inc). Primary antibodies used for western blot are the rabbit anti-Sbno1generated in this study (1:1,000) and rabbit anti-β-actin (Cell Signaling Technology, 4967S, 1:1000). Western blot signals of Sbno1 expression were measured using ImageJ and normalized to β-actin expression for comparison.
2.5. Brain Section Preparation and Immunostaining
The fixed brains were embedded in paraffin utilizing an automatic embedding system (Tissue-Tek VIP5; SAKURA Inc.) and were sectioned using a microtome (Leica SM 2010 R) at a thickness of 7µm. Paraffin sections were deparaffinized with xylene and hydrated with a dilution series of ethanol. Sections were autoclaved with Tris-EDTA (pH 9.0) for antigen retrieval. Subsequently, rinsed with PBS three times for 10 min each and incubated in blocking buffer (1% BSA, 3% TritonX-100, 1% PSA in PBS) for 1 hour. The antibodies were diluted with blocking buffer. The sections were incubated with the primary antibody overnight at 4oC. After washing with PBS three times for 10 min each, the sections were incubated for 1h at room temperature with fluorescent secondary antibody (see below). After washing with PBS, the sections were mounted using a DAKO fluorescence mounting medium (Agilent, S3023) and coverslipped.
The primary antibodies used in this study are anti-Sbno1 antibody (1:1000) and rat anti-Ctip2 (abcam ab18465; 1:1000) or mouse anti-CPNase (Merck MAB326; 1:200) or Goat anti-IBA (abcam ab5076; 1:1000) or mouse anti-GFAP (abcam ab4674; 1:1000) or mouse anti-CD133 (abcam ab264545; 1:500) antibodies. After washing, sections were incubated with DAPI (Thermo Fisher Scientific, D1306), anti-rabbit IgG Alexa Flour 488 (1:1000) and anti-rat IgG secondary Alexa Fluor antibody (Thermo Fisher Scientific A-21434) or anti-mouse IgG secondary antibody Alexa Fluor 555 (Thermo Fisher Scientific, A-31570; 1:1000) or anti-mouse IgG secondary antibody Alexa Fluor 555 (ThermoFisher Scientific A-21432; 1:1000).
2.6. Photographing
All fluorescent images were taken with a Leica DMi8 confocal microscope. Bright field images were captured with All-In-One microscope (BZ-X710; Keyence). Images were acquired from anatomically matched coronal sections along the rostral-caudal axis. Brain anatomy was identified using the Allen Brain Atlas (
https://atlas.brain-map.org/) and the mouse brain in stereotaxic coordinates [
15]. The intensity of Sbno1 immunofluorescent signal was measured in various brain regions and their neuronal populations using imageJ.
4. Discussion
Sbno1 is a DExD/H box helicase belonging to superfamily 2, most DExD/H box helicases are known to function as RNA helicases in the cytoplasm [
18,
19]. In the present study, we observed nuclear localization of Sbno1 in neurons, consistent with our previous findings that Sbno1 interacts with Rbpj, a DNA-binding transcription factor [
13]. This suggests that DExD/H box helicases may function both in the cytosol and/or cell nucleus, recognizing both DNA and RNA, likely depending on the combination of functional motifs within the amino acid sequence of the protein. The Sbno1 immunoreactivity in the neuronal nucleus aligns with the fact that Sbno1 protein contains two nuclear localization signals. However, Sbno1 immunoreactivity were observed not only overlapping with DAPI staining but also weakly detected in other cellular structures, such as neuronal fiber (
Figure 6).
Genetic studies in
Drosophila identified Strawberry notch protein as a component of the Notch signaling pathway. Despite the involvement of Notch signaling pathway in regulating myelination during postnatal brain development [
20,
21,
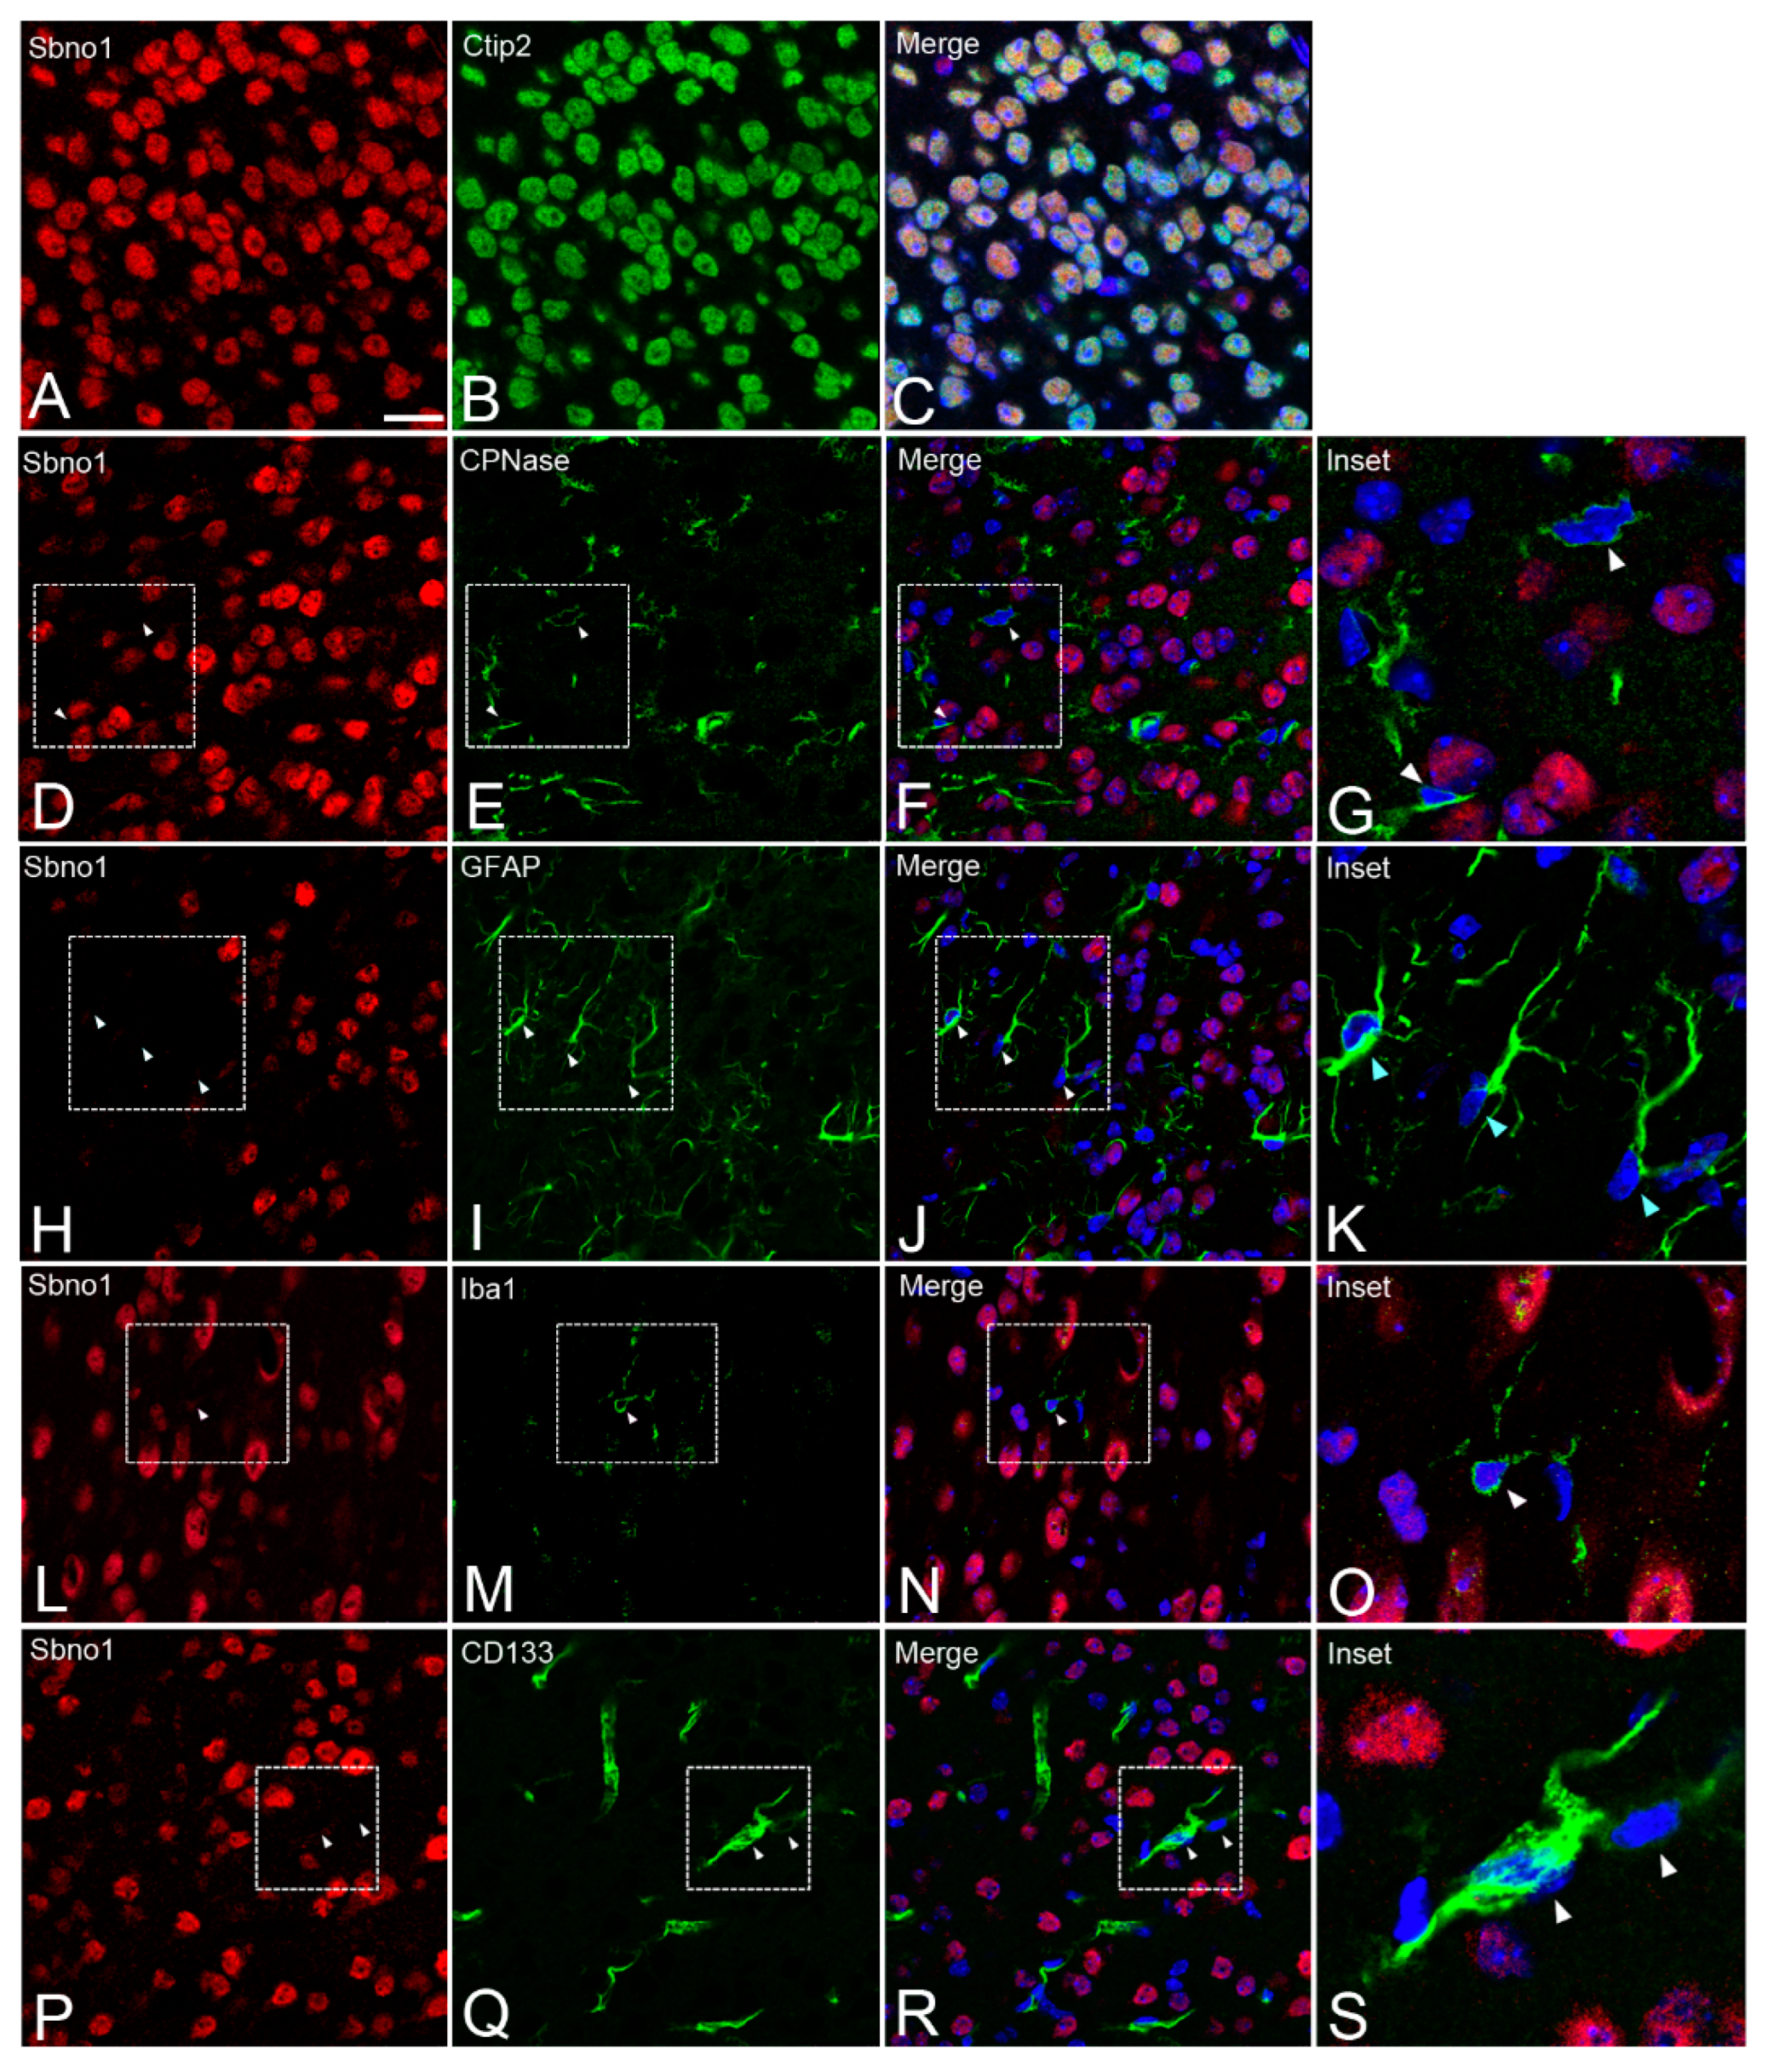
22], it is unlikely that Sbno1 is involved in myelination, as it is specifically expressed in neurons and not in oligodendrocytes (
Figure 2). Knockout (KO) of
Sbno1 in cortical neurons reduced both axonal growth and dendritic arborization [
14]. Notch signaling has been shown to regulate positively dendritic branching while negatively regulating dendritic growth of the primary cultured cortical neurons [
23]. In neurons of
p53 KO mouse, Notch signaling is hyperactivated resulting in reduced neurite growth, further suggesting its role on neuronal plasticity [
24]. This is consistent with earlier observations that upregulation of Notch activity either inhibited extension or caused retraction of neurites in primary cultures of the cortical neurons [
25]. While studies in
Sbno1 KO mice align with Notch function in dendritic branching, these studies diverge in conclusion regarding dendritic and axonal elongation.
On the other hand, histological studies in
Sbno1 KO [
14] and
Rbpj KO [
26] model mice highlight distinct cytoarchitectural abnormalities.
Rbpj KO mice exhibit highly disorganized laminar structure in the cerebral cortex [
26], whereas cortical lamination remains intact in
Sbno1 KO mice [
14]. Thus, radial migration of differentiating neurons in the embryonic cortex involves Sbno1-independent Notch signaling pathway. Additionally,
Rbpj KO mice survive until adulthood [
26], whereas
Sbno1 KO mice die around three weeks after birth (unpublished). This suggests that Sbno1 may have unrevealed roles beyond its involvement in the Notch signaling pathway in postnatal neuronal development.
We also observed prominent Sbno1 expression in the olfactory bulb and the piriform cortex, which are regions involved in the odor integrate encoding/processing system. The piriform cortex receives primary afferent monosynaptic input from the olfactory bulbs’ projection neurons, including mitral and tufted cells. Given the direct connection between olfactory bulb and piriform cortex, Sbno1 may contribute to the development of the olfactory neuronal system pathway and sensory processing. This conclusion along with multiple studies linking
SBNO1 to schizophrenia [
3,
5,
9] may explain why schizophrenic patients have olfactory dysfunction [
27].
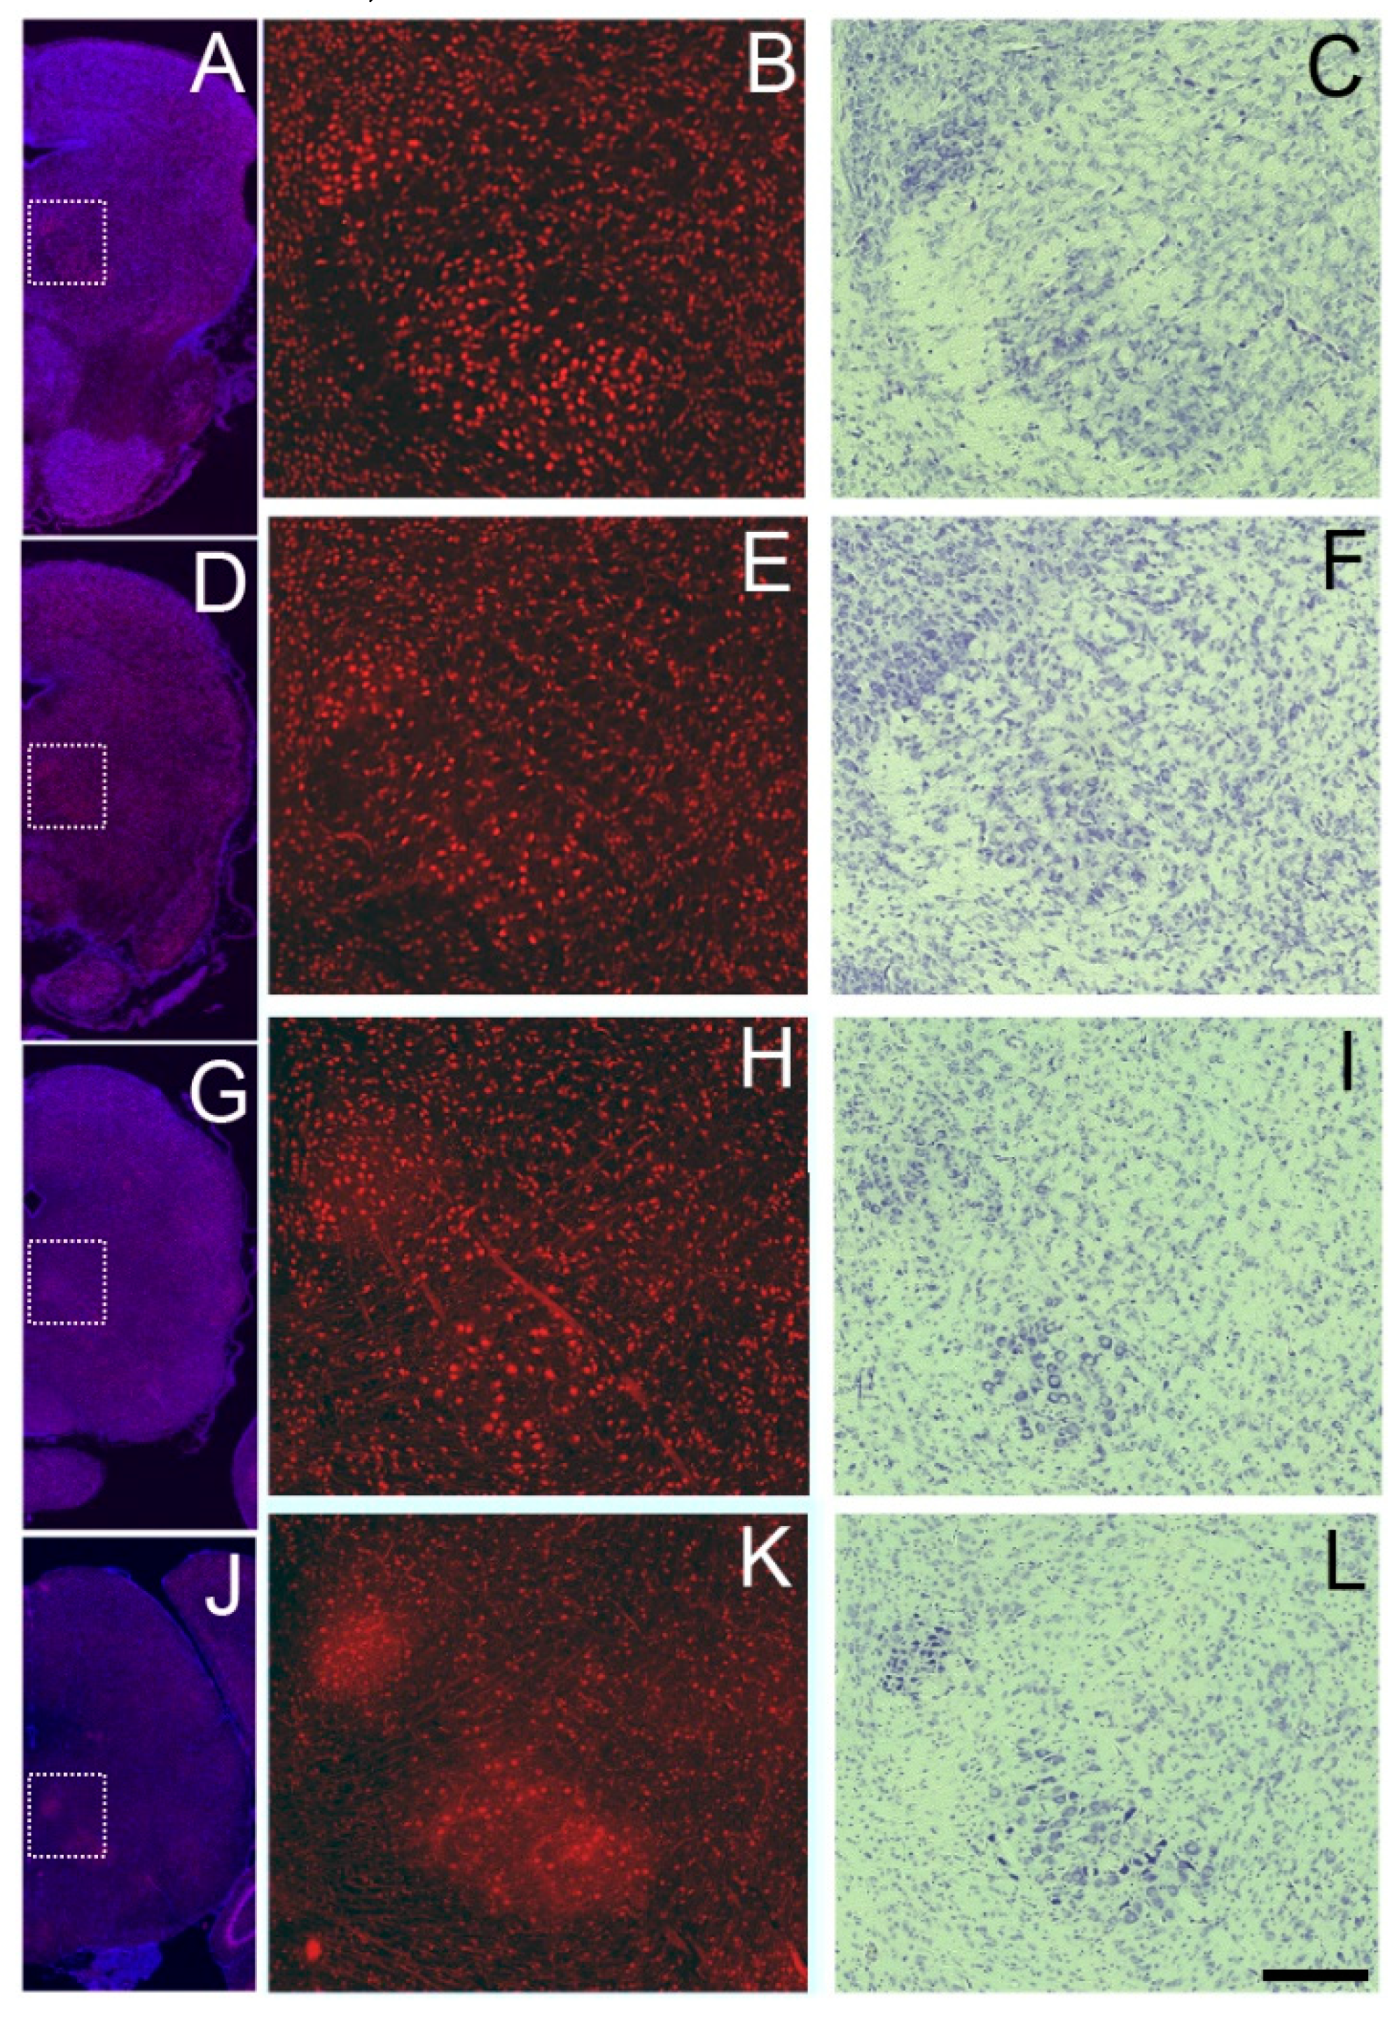
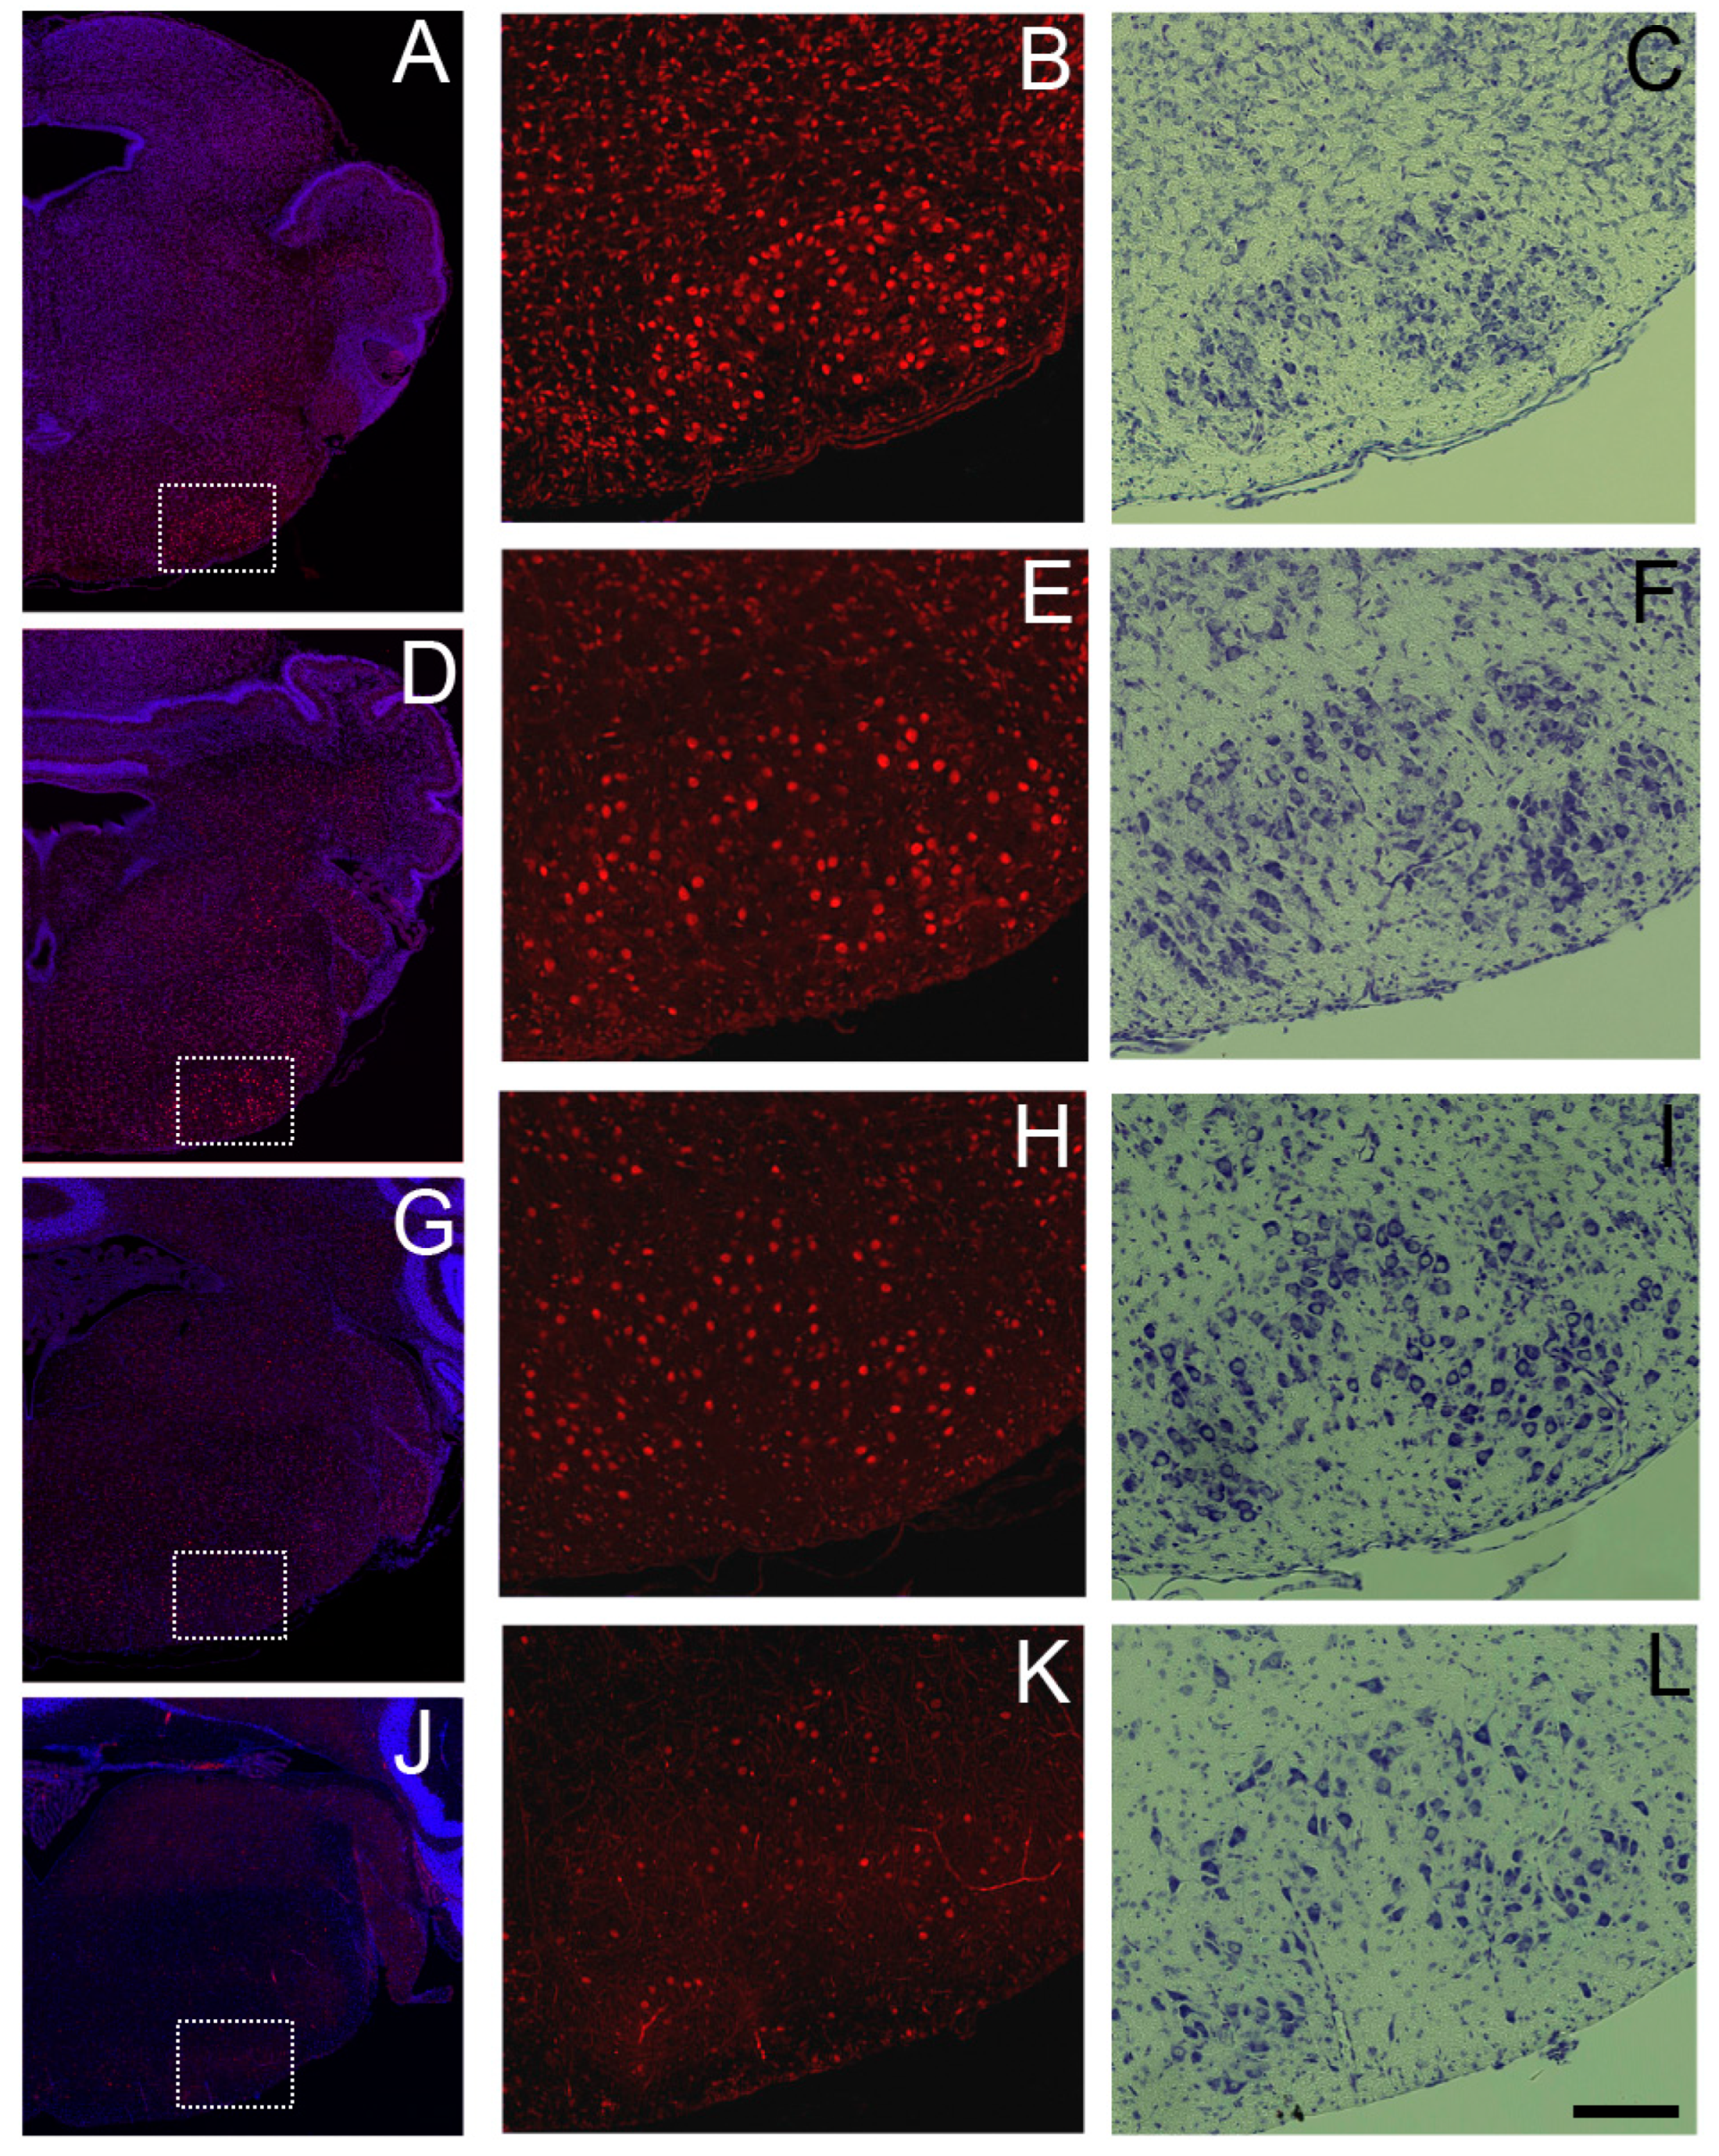
In the brainstem, we found only a few neurons in several neuronal nuclei with prominent Sbno1 immunoreactivity. Although these neurons are generally large, examination of Nissl-stained adjacent sections revealed that not all large neurons exhibit strong Sbno1 immunoreactivity, indicating that neuronal size is not a sufficient phenotype to identify Sbno1 expressing neurons. Indeed, a few large neurons in the sensory nuclei also showed a strong Sbno1 immunoreactivity (data not shown). The oculomotor, facial, trigeminal motor, hypoglossal nuclei, and the ventral horn of the spinal cord (not shown) are motor related regions, and all contain large neurons that exhibit strong Sbno1 immunoreactivity. Comparison of Nissl-stained adjacent sections suggested that these are motor neurons. Interestingly, the layer V neurons in the cerebral cortex, which contribute to the pyramidal tract projecting to the motor neurons in the spinal cord, also displayed a strong Sbno1 immunoreactivity. Neurons with strong Sbno1 immunoreactivity were further observed in the magnocellular part of the red nucleus (
Figure 6), and sporadically in the reticular formation. Since all these neuronal populations contain neurons projecting to the spinal motor neurons, Sbno1 may play a role in the differentiation and/or function of somatic motor pathways.
Our observation indicate that Sbno1 is expressed in all postnatal brain neurons, though expression level varies depending on neuronal population. Given that we previously showed that Sbno1 is involved in neurite growth [
14], the expression level of Sbno1 may relate to neuronal morphogenesis, such as dendritic arborization, axonal growth, and synaptogenesis. The heterogeneous expression of Sbno1 suggests that Sbno1 expression could be regulated by neuronal activity, alike immediate early genes, such as
c-Fos [
28]. Recently, a study found that the immediate early gene NPAS4 is involved in repairing DNA damage from neuronal activity [
29]. As a helicase, Sbno1 could play a role in maintaining genomic stability, similar to other helicases [
30,
31]. Neurons, with their highly metabolic demand and oxygen consumption leading high oxygen species producing, are prone to DNA damage and subsequent dynamic changes of gene expression [
32]. Pan-neuronal expression of Sbno1 may thus be involved in genome stability. Since our results of
in situ hybridization did not show heterogeneous staining in brain section [
33], Sbno1 expression is likely regulated post-transcriptionally.
In summary, our observations suggest that Sbno1 expression in neurons is developmentally regulated after birth. Histological observations of each brain region at different developmental stages are consistent to quantitative comparison of Sbno1 expression levels by western blot. Although Sbno1 is expressed in all neurons, the temporal and spatial pattern of changes in intensity of Sbno1 immunoreactivity varies in different regions, including the olfactory bulb, cerebral cortex, cerebellum, motor nuclei in the brainstem, and unidentified sporadically distributed neurons. Therefore, Sbno1 likely has functions that are common to all neurons as well as specific roles in certain cell types and/or cellular activity at distinct postnatal stages.
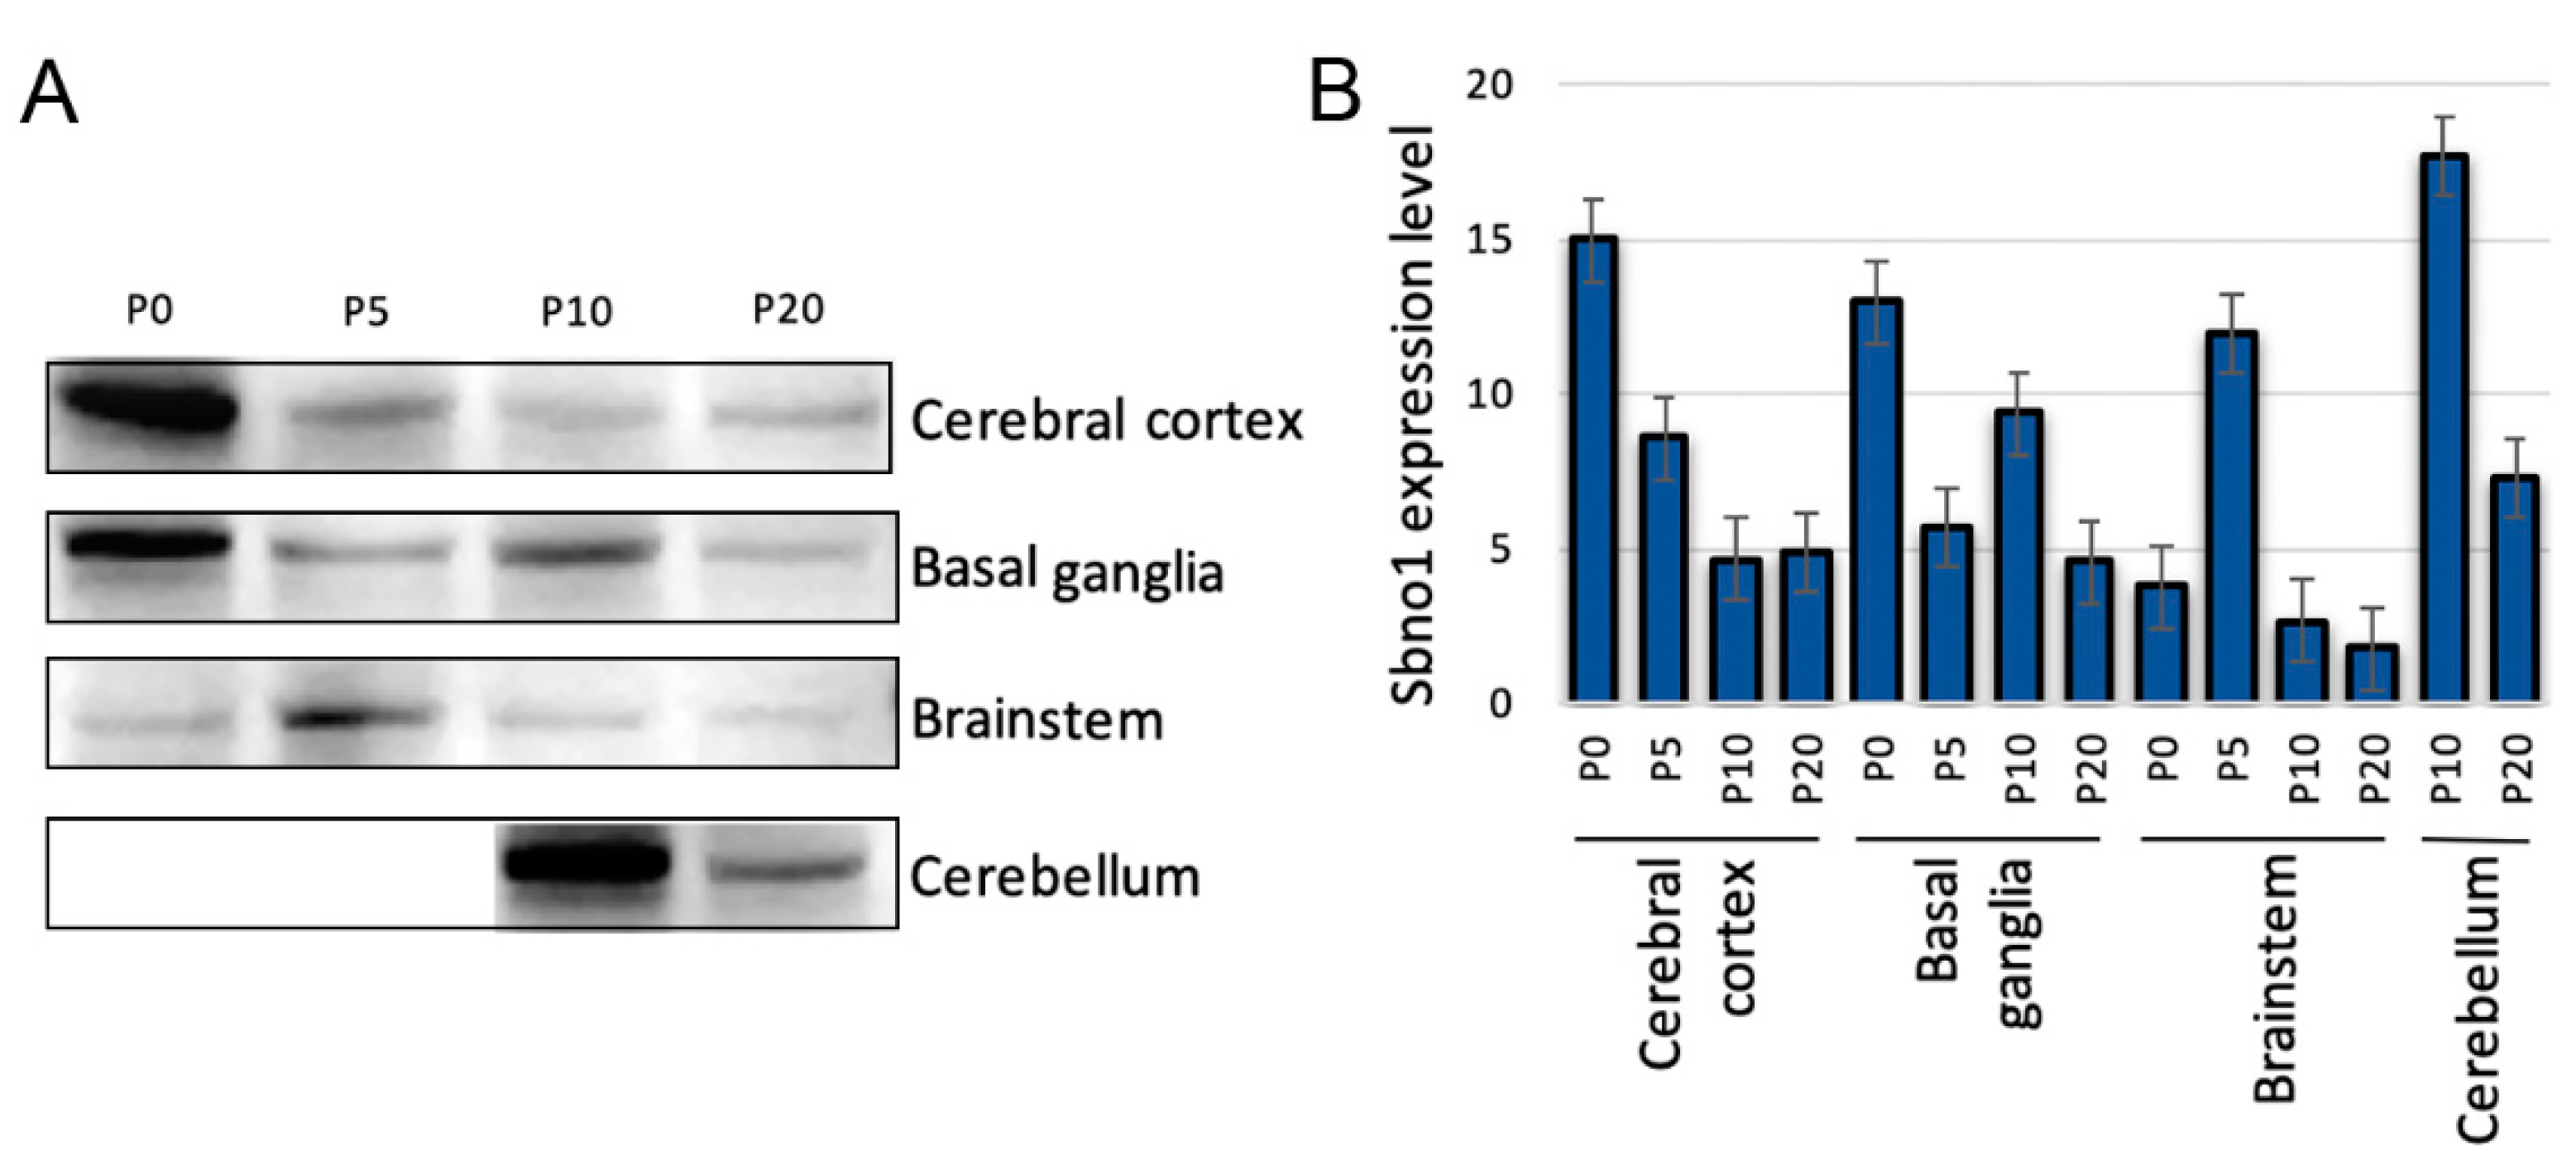
Figure 1.
The expression levels of Sbno1 vary quantitatively across four major brain regions during postnatal stages (P0, P5, P10, and P20). (A) Western blot shows developmentally regulated Sbno1 expression in the cerebral cortex, basal ganglia, brainstem, and cerebellum. The cerebellum could not be dissected at P0 and P5, so Sbno1 protein levels were examined at P10 and P20. Equal amounts of total protein were loaded for each sample. The major bands at predicted molecular size are shown. (B) The graph shows a quantitative comparison of Western blot signal intensities expressed as arbitrary units.
Figure 2.
Simultaneous detection of Sbno1 (red) and various cell type markers (green) in the cerebral cortex. All sections were counterstained with DAPI (blue). (A-C) Simultaneous detection of Sbno1 (red) and the cortical excitatory neuron marker Ctip2 (green). (D-G) Simultaneous detection of Sbno1 (red) and the oligodendrocyte marker CNPase (green). (H-K) Simultaneous detection of Sbno1 (red) and the astrocyte marker GFAP (green). (L-O) Simultaneous detection of Sbno1 (red) and the microglia marker Iba-1 (green). (P-S) Simultaneous detection of Sbno1 (red) and the vascular endothelial cell marker CD133 (green). G, K, O, and S are enlarged images indicated by rectangles in F, J, N, and R, respectively. Scale bar in A indicates 20µm.
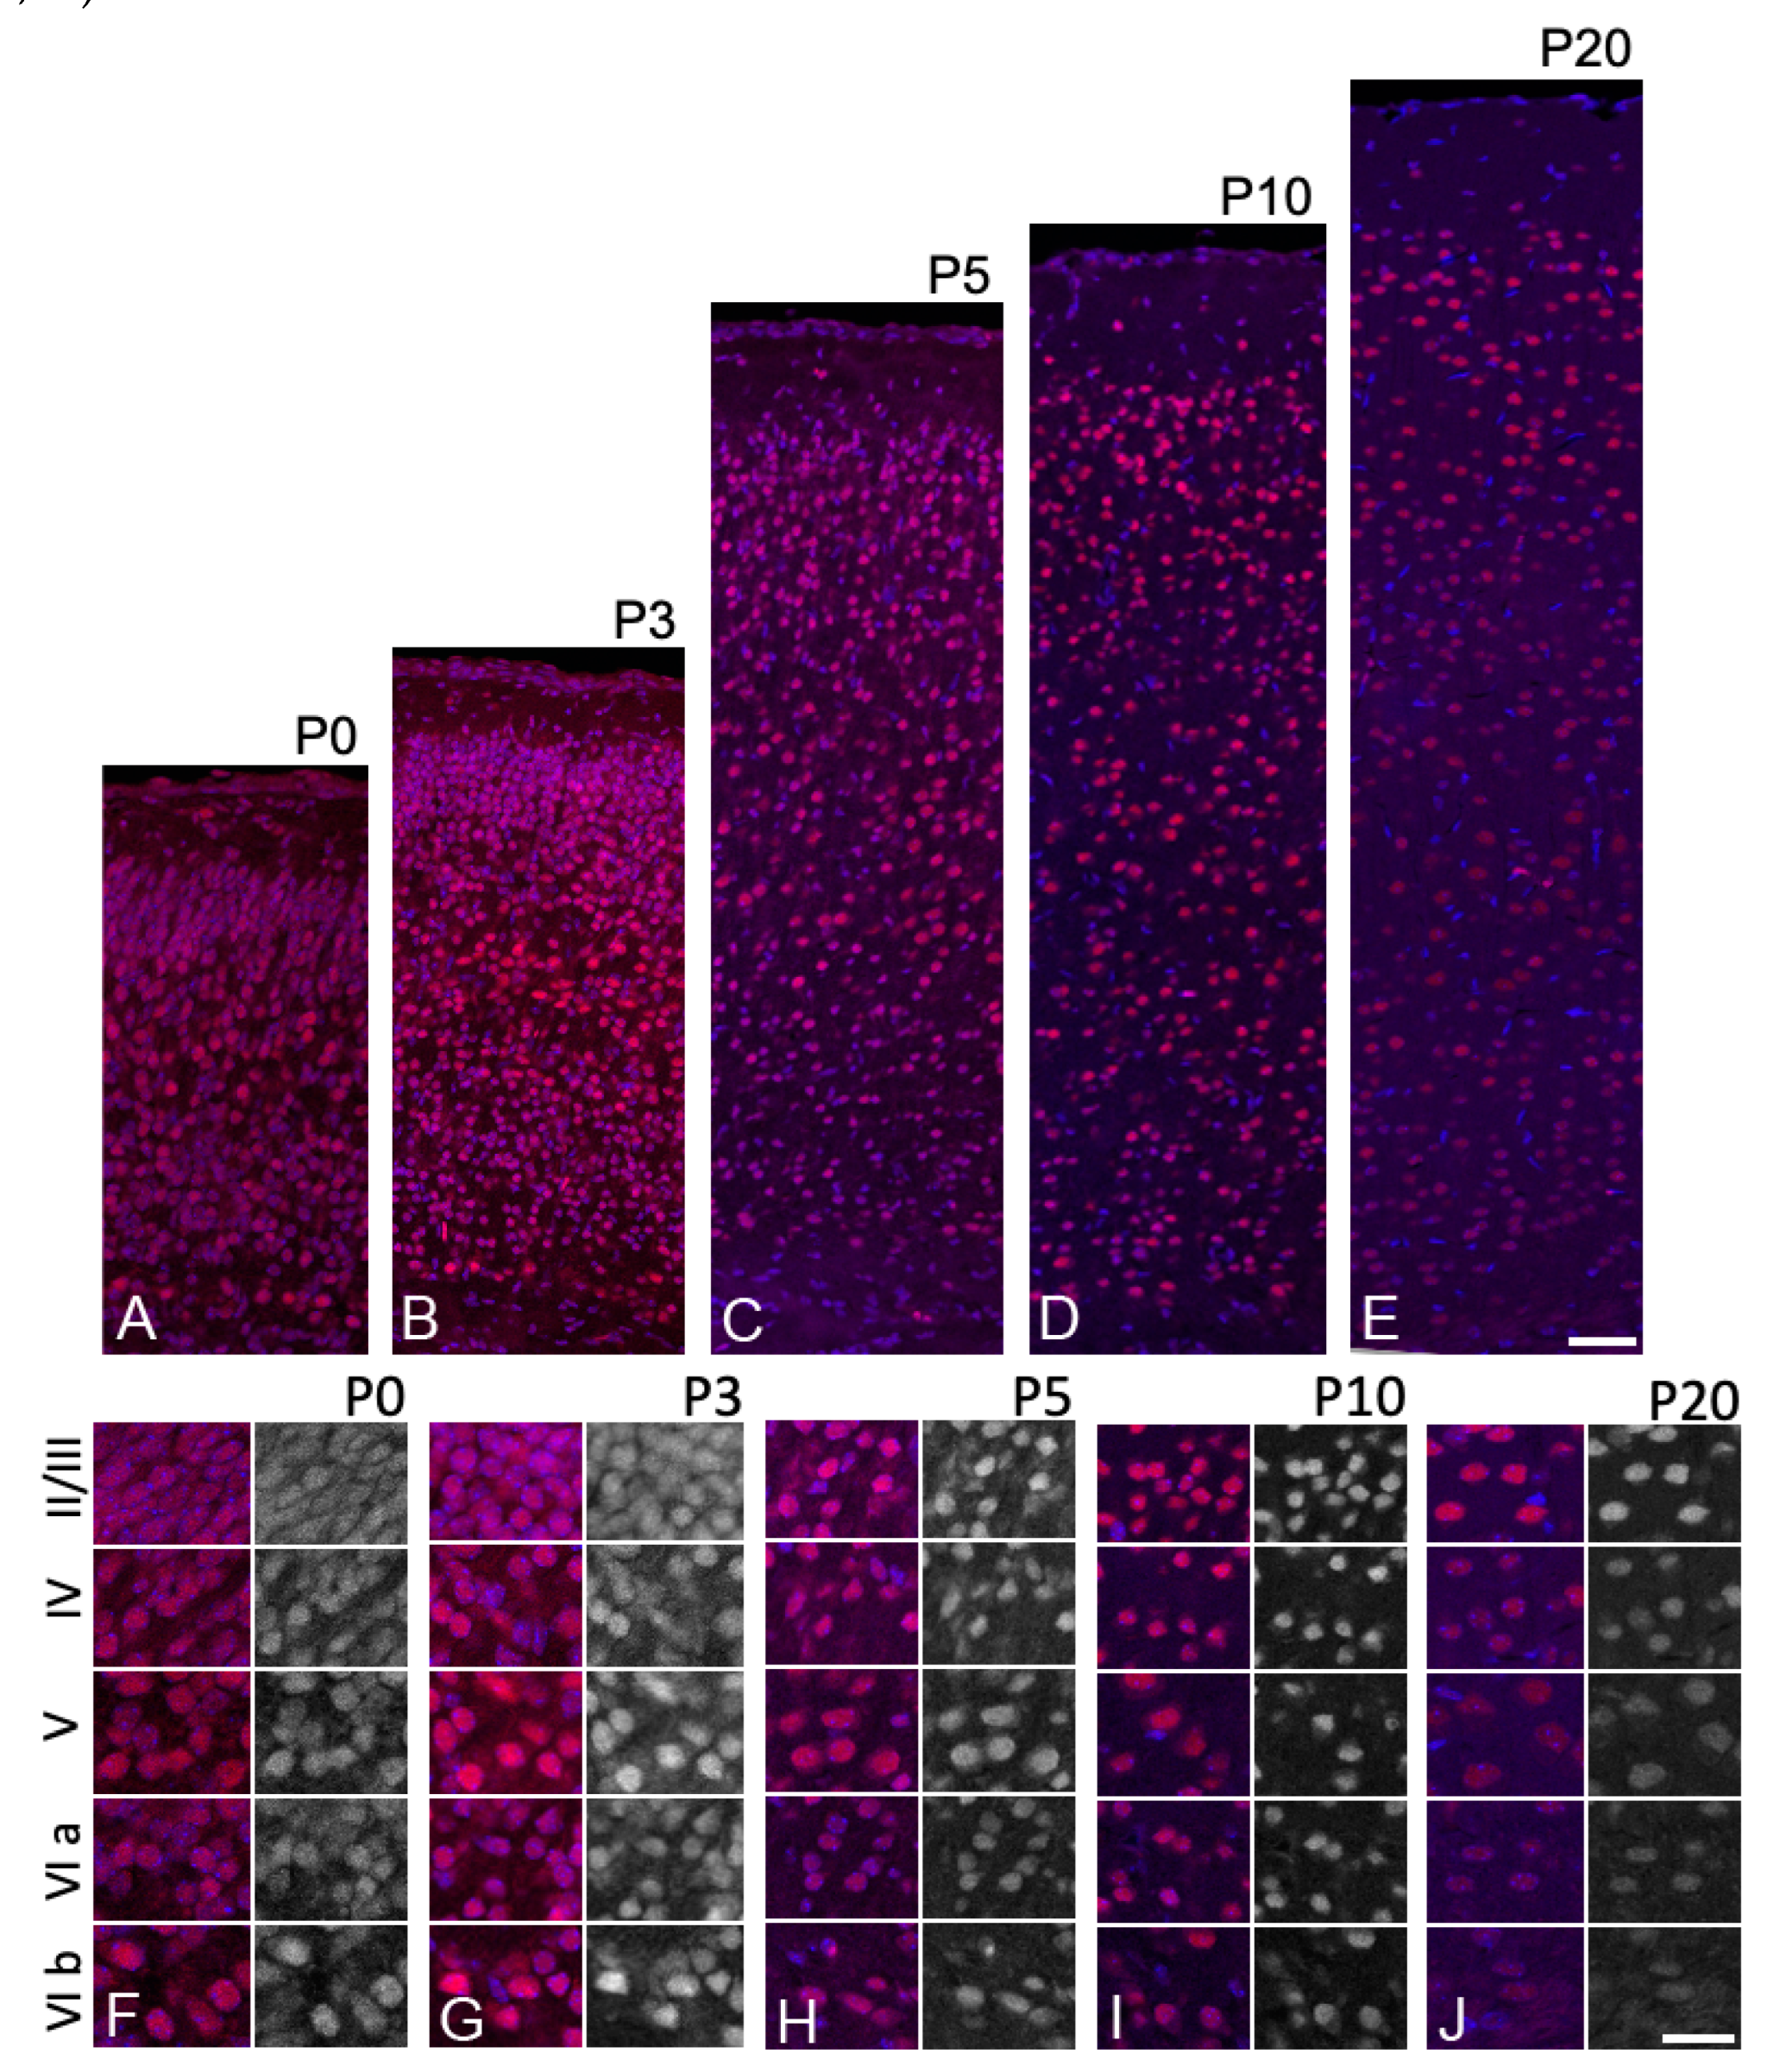
Figure 3.
The changes in the expression level of Sbno1 expression during postnatal development are different in each cortical layer. Expression of Sbno1 (red) was detected in brain sections at P0, P3, P5, P10, and P20, as indicated. The sections were counterstained by DAPI (blue). (A-E) lower magnification images of the cerebral cortices vertically from the ventricular side (bottom) to the pial surface (top). (F-J) Higher magnification images of cortical layers (II/III, IV, V, VIa, VIb). The left columns of the panels show merged image and the right columns show black-white images of Sbno1 expression. Observations were made in the primary somatosensory area. Scale bars in E and J indicate 50µm and 20µm, respectively.
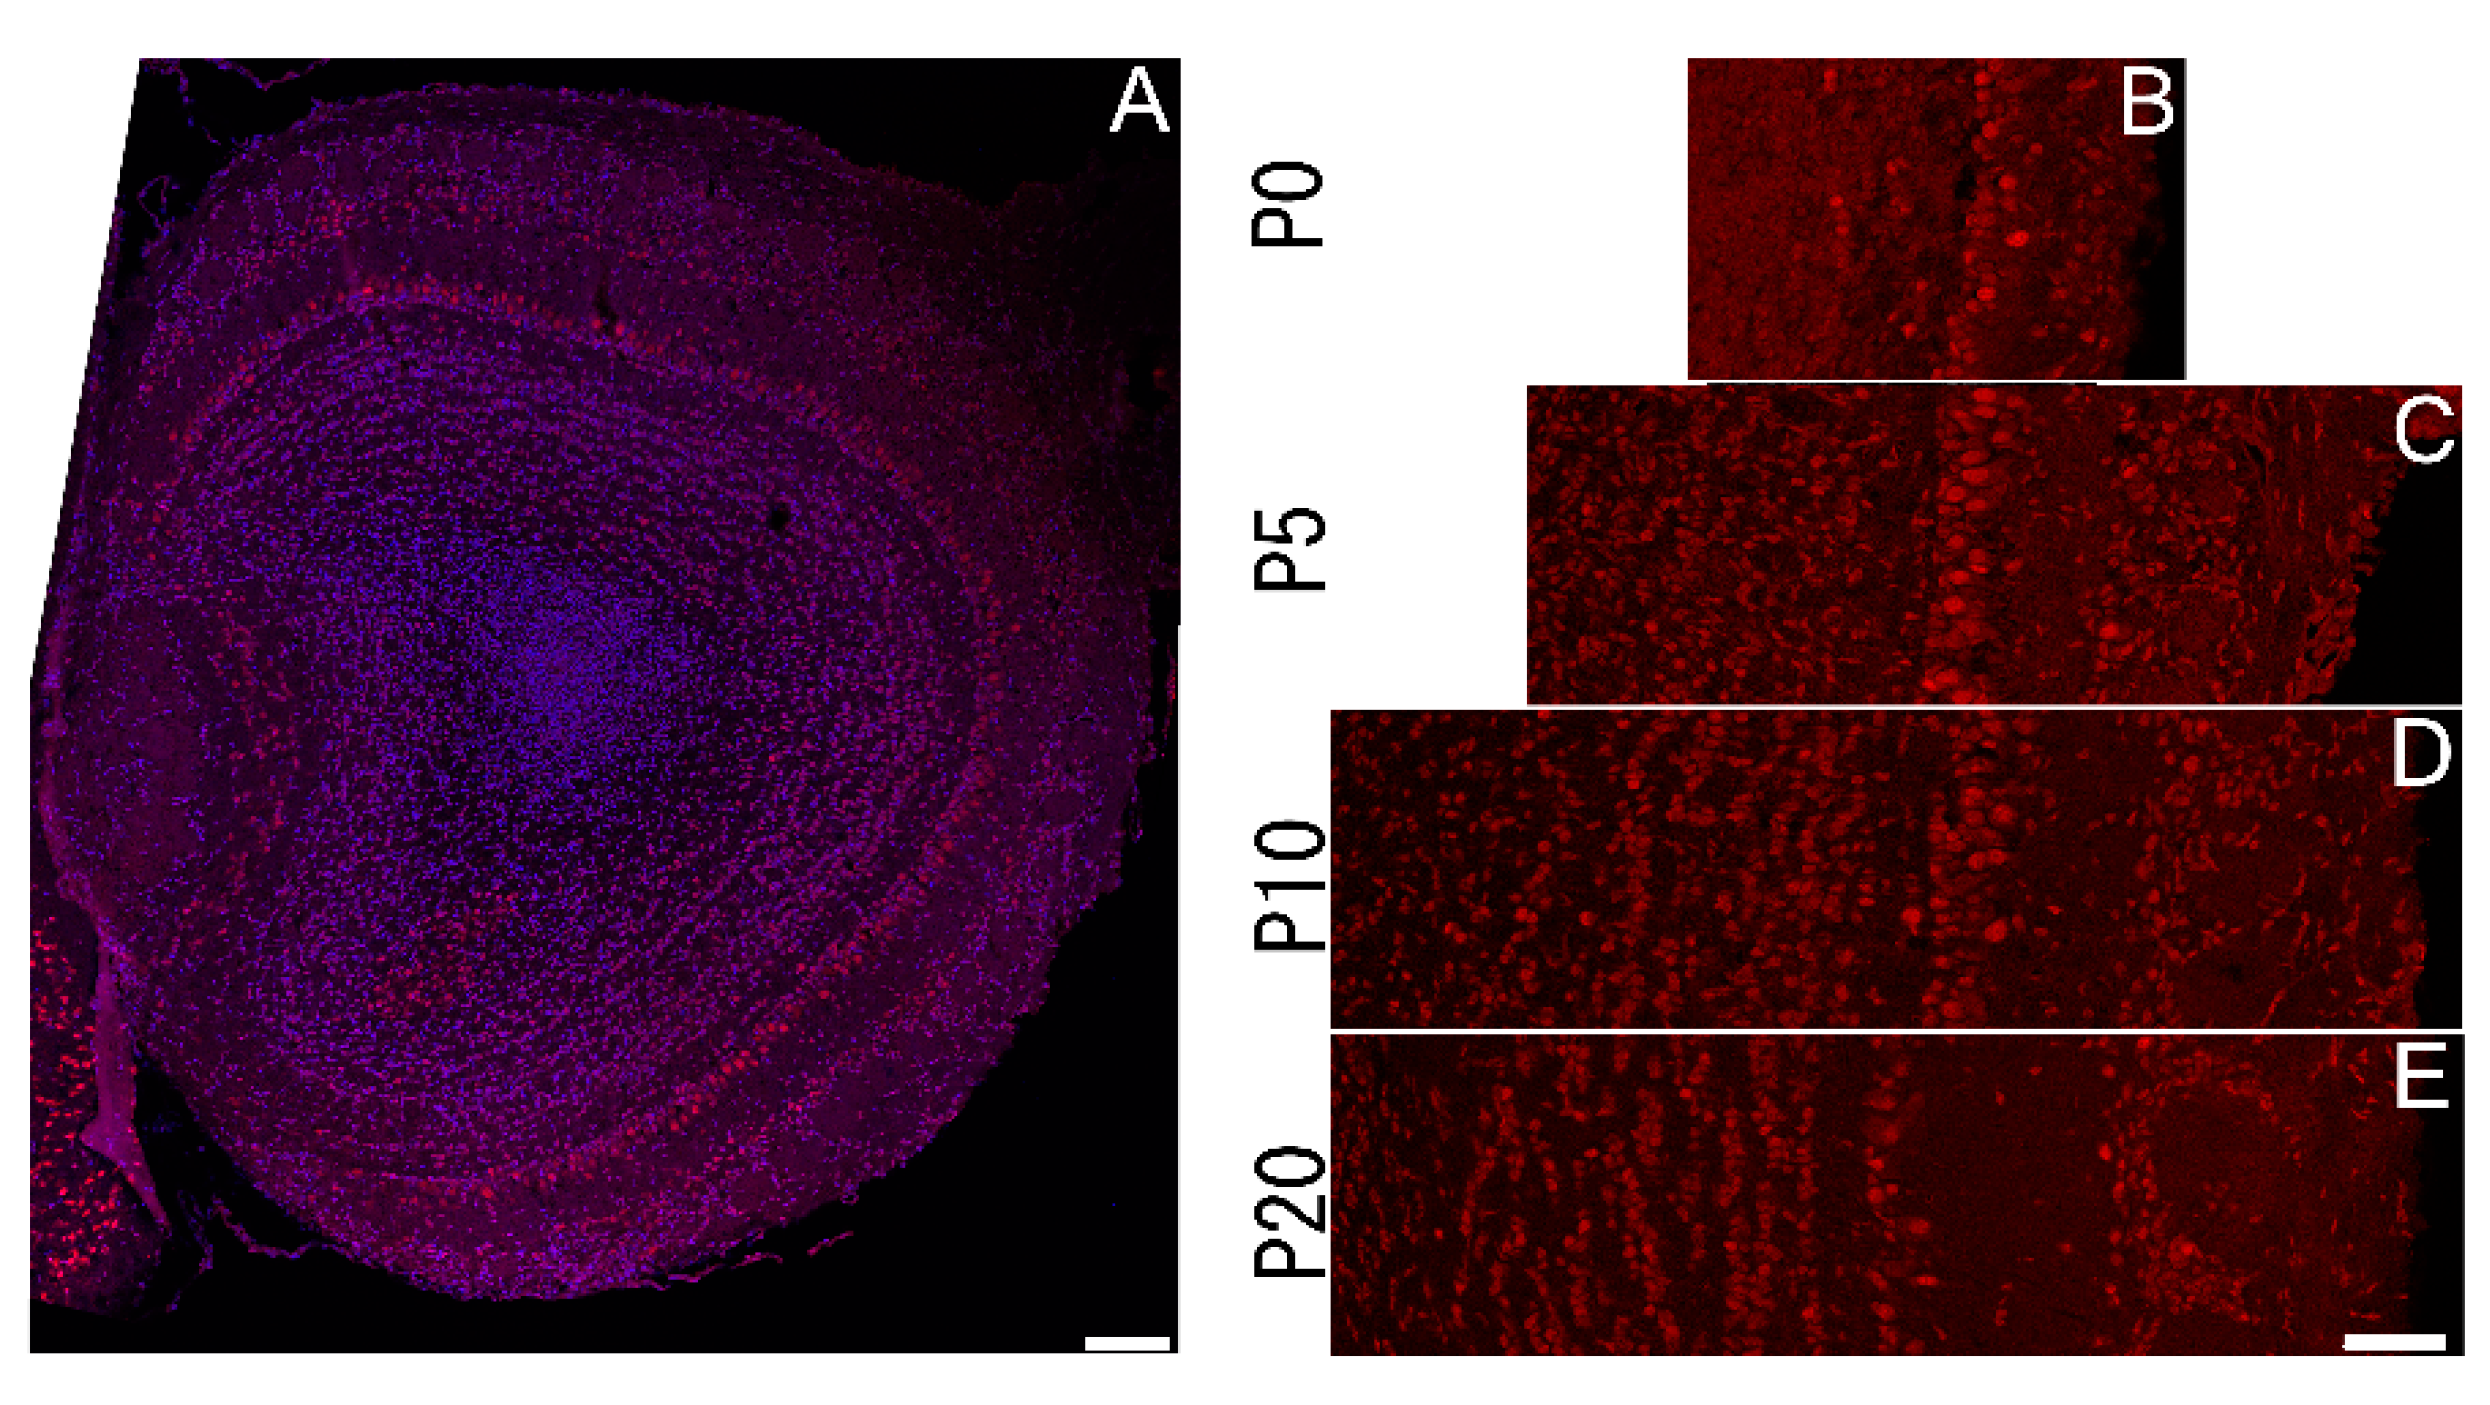
Figure 4.
Expression of Sbno1 in the olfactory bulb in the postnatal brains. (A) A whole section of the olfactory bulb indicating Sbno1 expression (red) and nuclei (blue). (B-E) Expression of Sbno1 in the laminar structure of the olfactory bulb through indicated postnatal developmental stages. Scale bars in A and E indicate 100 µm and 50µm, respectively.
Figure 5.
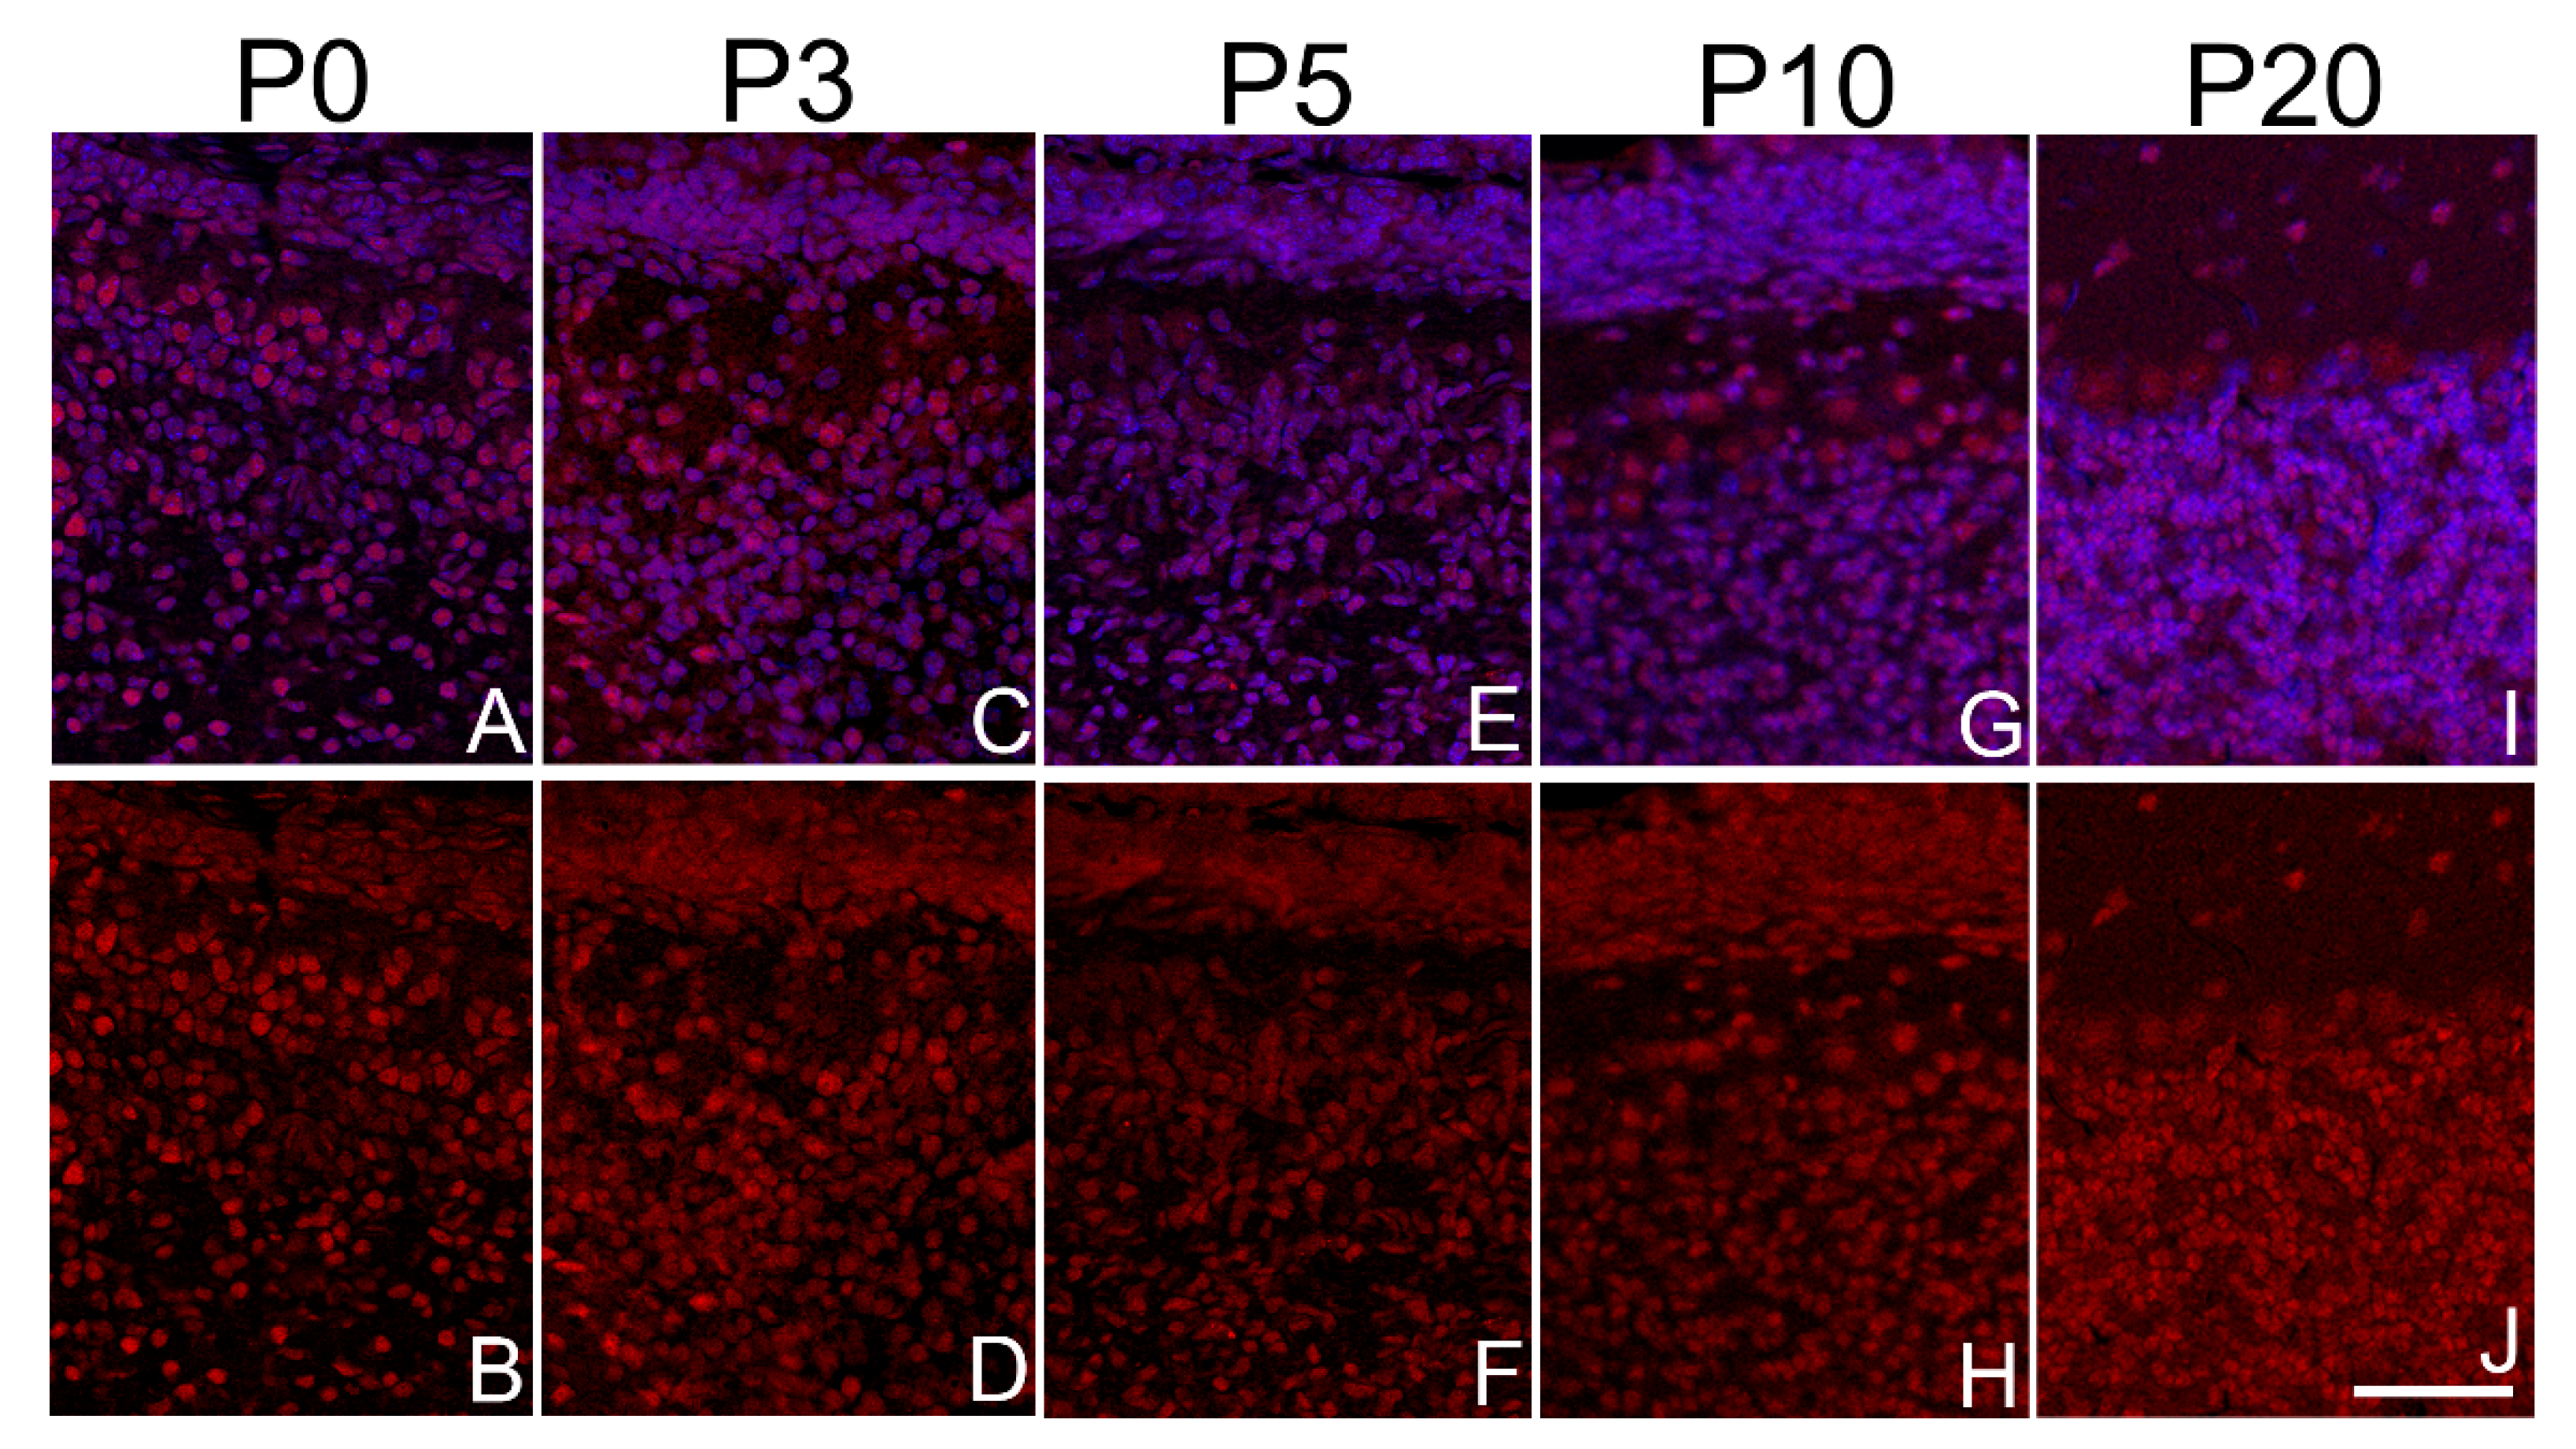
Sbno1 immunoreactivity in the postnatal cerebellar cortex. Sbno1 immunoreactivity is heterogeneous, cells in the external granular layer show a weak Sbno1 immunoreactivity, while a significant fraction of cells in the internal granular layer displays a strong Sbno1 immunoreactivity. (A, C, E, G, I) Merged images of Sbno1 immunofluorescence (red) and DAPI staining (blue). (B, D, F, H, J). Images of Sbno1 immunofluorescence only (red). A scale bar in J indicates 100µm.
Figure 6.
Prominent expression of Sbno1 in the oculomotor nucleus and red nucleus at P0 (A,B), P5 (D,E), P10 (G, H), and P20 (J,K). (A, D, G, J) Merged images of Sbno1 expression (red) and DAPI (blue) in the coronal section at the superior colliculus level at a low magnification. (B, E, H, K) Images of immunoreactivity indicating Sbno1 expression at a higher magnification of the region indicated by rectangles in C, F, I, and L, respectively. C,F,I, and L are bright field images showing Nissl staining of the adjacent sections of B, E, H, and K, respectively. A scale bar in L indicates 100µm.
Figure 7.
Prominent Sbno1immunoreactivity in the facial nucleus at P0 (A,B), P5 (D,E), P10 (G, H), and P20 (J,K). (A, D, G, J) Merged images of Sbno1 immunofluorescence (red) and DAPI (blue) in the coronal section at the upper medulla level, displayed at a low magnification (B, E, H, K). Higher magnification images of SBNO1 immunoreactivity in the region outlined by rectangles in A, D, G, and F, respectively. (C, F, I and L) Bright field images of Nissl staining in adjacent sections corresponding to the sections shown in B, E, H, and K, respectively. A scale bar in L indicates 100µm.
Table 1.
Summary of Sbno1 protein expression during postnatal period.
Table 1.
Summary of Sbno1 protein expression during postnatal period.
| Region |
Stage |
| P0 |
P3 |
P5 |
P10 |
P20 |
| Olfactory bulb |
|
|
|
|
|
| Granule cell layer |
+ |
+ |
+ |
+ |
+ |
| Internal plexiform layer |
+ |
+ |
+ |
+ |
+ |
| Mitral cell layer |
+++ |
+++ |
+++ |
+++ |
+++ |
| External plexiform layer
|
+ |
+ |
+ |
+ |
+ |
| Glomerular layer |
+ |
+ |
++ |
++ |
++ |
| Cerebral cortex |
|
|
|
|
|
| Layer I |
± |
± |
± |
± |
± |
| Layer II/III |
++ |
++ |
++ |
+++ |
+++ |
| Layer IV |
++ |
++ |
++ |
++ |
+ |
| Layer V |
+++ |
+++ |
++ |
++ |
+ |
|
Layer VI a
|
++ |
++ |
++ |
++ |
+ |
|
Layer VI b
|
+++ |
+++ |
+ |
+ |
+ |
| Hippocampus |
|
|
|
|
|
|
Dentate gyrus
|
|
|
|
|
|
|
Molecular layer
|
± |
± |
± |
± |
± |
|
Granule cell layer
|
+ |
+ |
+ |
+ |
++ |
|
Hilus
|
++ |
++ |
++ |
++ |
+ |
|
CA3
|
|
|
|
|
|
|
S. oriens
|
± |
± |
± |
± |
± |
|
S. pyramidale
|
+++ |
+++ |
+++ |
+++ |
+++ |
|
S. radiatum
|
± |
± |
± |
± |
± |
|
CA1
|
|
|
|
|
|
|
S. oriens
|
± |
± |
± |
± |
± |
|
S. pyramidale
|
++ |
++ |
++ |
++ |
++ |
|
S. radiatum
|
± |
± |
± |
± |
± |
| Piriform cortex |
|
|
|
|
|
|
Layer I
|
+ |
+ |
+ |
+ |
+ |
|
Layer II
|
++ |
++ |
++ |
++ |
++ |
|
Layer III
|
+++ |
+++ |
+++ |
+++ |
+++ |
| Basal ganglia |
++ |
+ |
+ |
+ |
+ |
| Thalamic nuclei |
+ |
+ |
+ |
+ |
+ |
| Superior colliculus |
+ |
+ |
+ |
+ |
+ |
| Red nucleus |
++++ |
++++ |
++++ |
++++ |
++++ |
| Inferior colliculus |
+ |
+ |
+ |
+ |
+ |
| Cerebellum |
|
|
|
|
|
|
External granular layer
|
+ |
+ |
+ |
+ |
|
|
Molecular layer
|
|
|
|
|
++ |
|
Purkinje cell layer
|
+ |
+ |
+ |
++ |
++ |
|
Internal granular layer
|
+ |
++ |
++ |
+++ |
+++ |
| Deep cerebellar nucleus |
|
|
|
++ |
++ |
| Pontine nucleus |
+ |
+ |
+ |
+ |
+ |
| Inferior olivery nucleus |
++ |
++ |
++ |
++ |
++ |
| Dorsal cochlear nucleus |
+ |
+ |
+ |
+ |
+ |
| Vestibular nucleus |
+ |
+ |
+ |
+ |
+ |
| Motor nuclei of brainstem |
|
|
|
|
|
|
Oculomotor nucleus
|
++++ |
++++ |
++++ |
++++ |
++++ |
|
Facial nucleus
|
+++ |
++++ |
++++ |
+++ |
+ |
|
Trigeminal motor nucleus
|
++++ |
++++ |
++++ |
++++ |
++ |
|
Hypoglossal nucleus
|
+++ |
++++ |
++++ |
++++ |
++++ |
