Submitted:
06 November 2024
Posted:
07 November 2024
You are already at the latest version
Abstract
Keywords:
1. Introduction
2. Materials and Methods
2.1. Preparing Au NPs and Au-Nanoprobes
2.2. Evaluating the Amount of DNA Duplexes Bound on Each Au-Nanoprobe
2.3. Determining the Fluorescence Response of Au-Nanoprobes to Target DNA
2.4. Determining the Fluorescence Response of Au-Nanoprobes to Intracellular MicroRNA-21 and hTERT mRNA
2.5. Analyzing the Intracellular hTERT mRNA and microRNA-21 Level
2.6. Analyzing the Intracellular hTERT Activity
2.7. Determining the Pro-Apoptosis Effect and In Vitro Cytotoxicities of Au-Nanoprobes
2.8. In Vivo and Ex Vivo Fluorescence Imaging
2.9. In Vivo Anti-Tumor Study
2.10. Statistical Analysis
3. Results and Discussion
3.1. Design Mechanism of Au-Nanoprobes
3.2. Characterization of AuNPs and Au-Nanoprobes
3.3. Evaluation of the Amount of DNA Duplexes Bound on Each Au-Nanoprobe
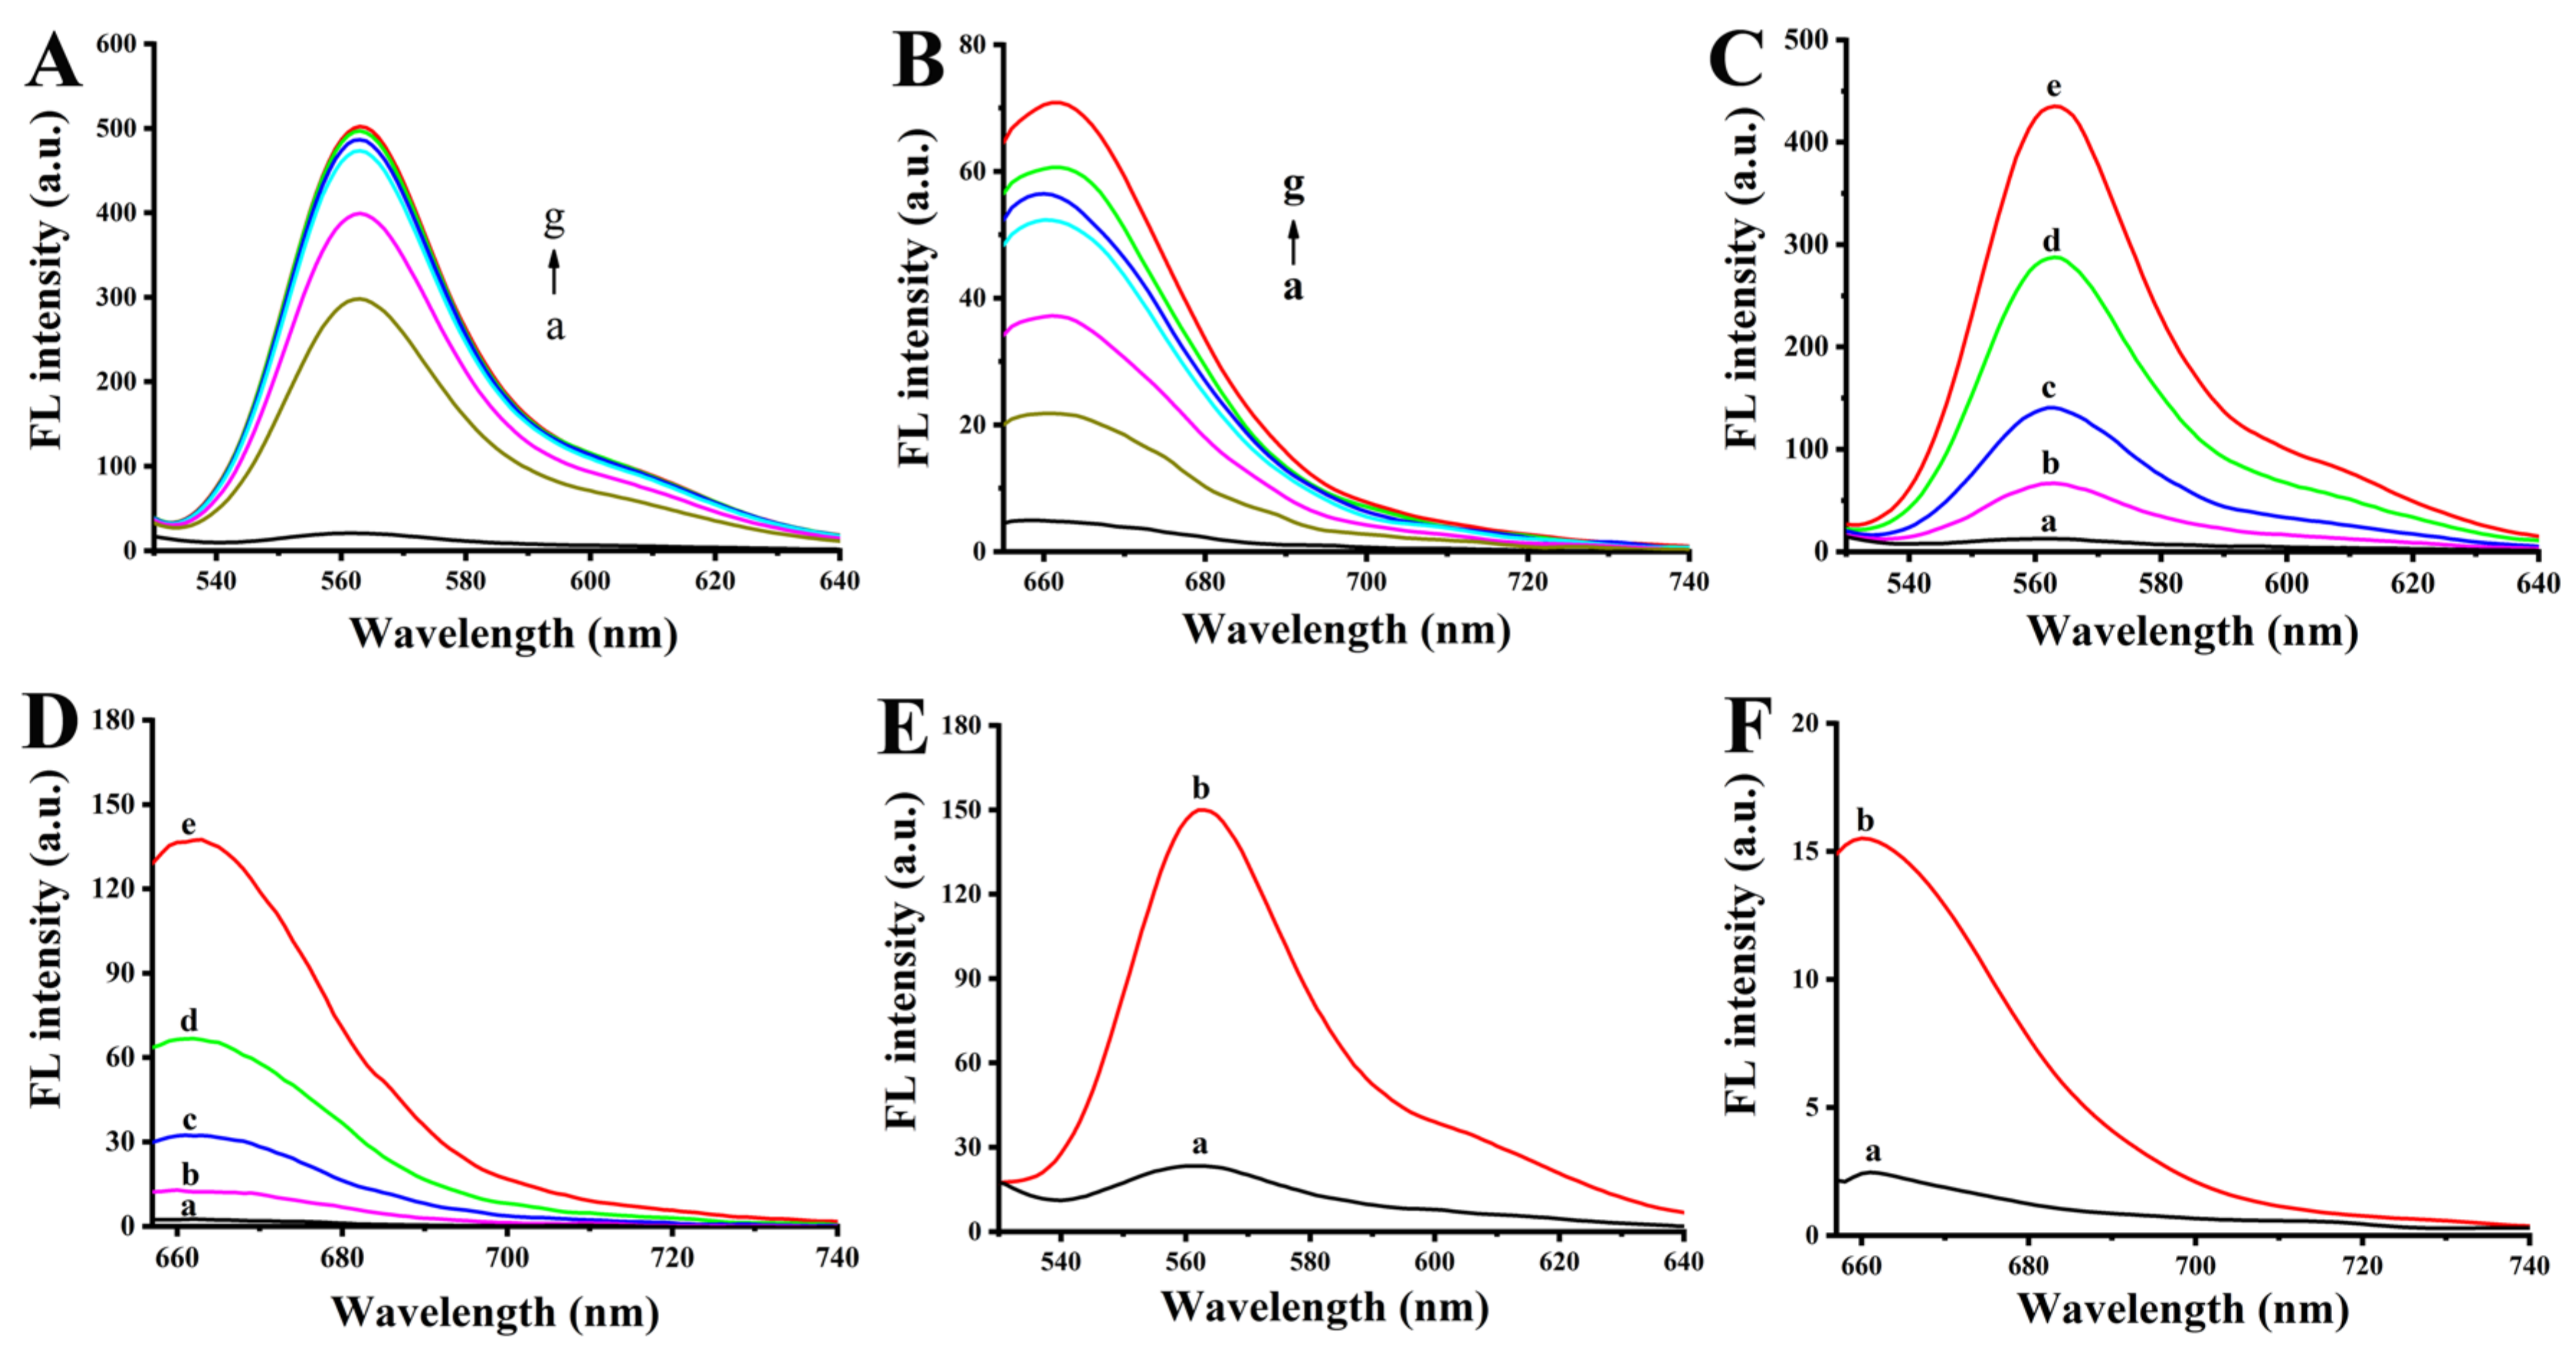
3.4. In Vitro Response of Au-Nanoprobes to hTERT mRNA and microrna-21-Related Target DNA
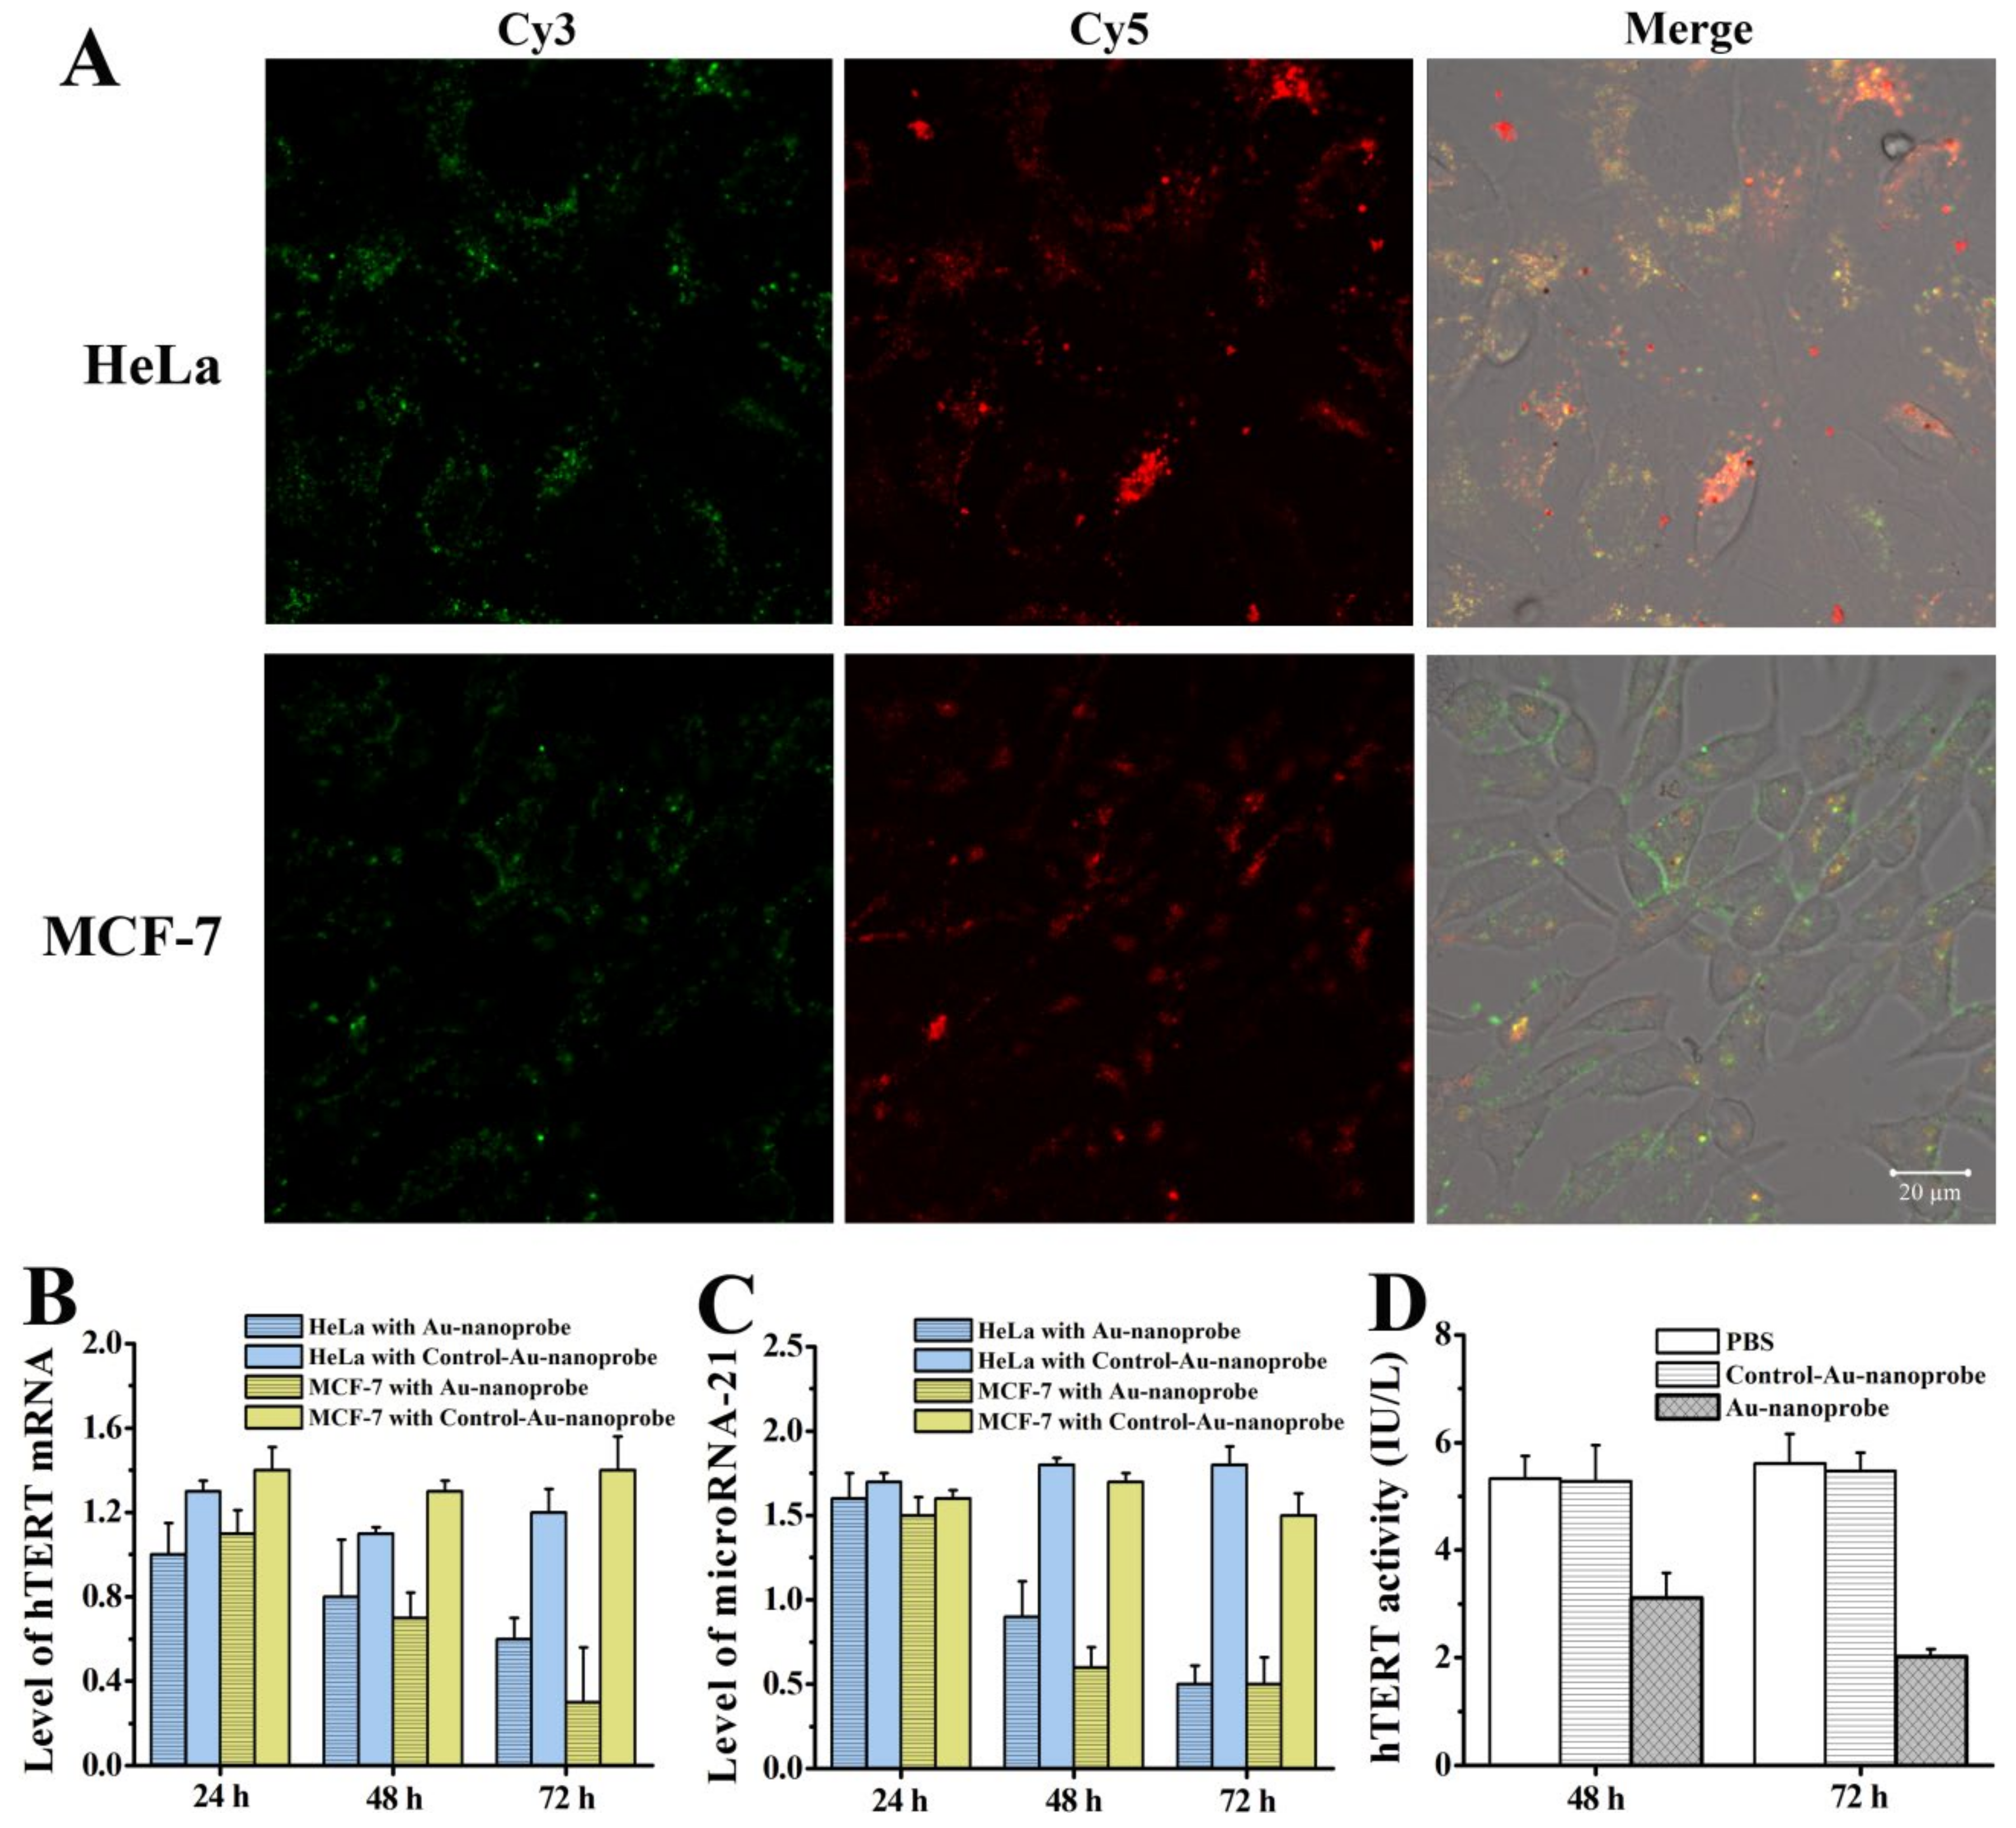
3.5. In situ Fluorescence Imaging of Intracellular hTERT mRNA and microRNA-21 by Using Au-Nanoprobes
3.6. Analysis of the Expression Level of hTERT mRNA and microRNA-21 as Well as hTERT Activity in Cancer Cells Treated with Au-Nanoprobes
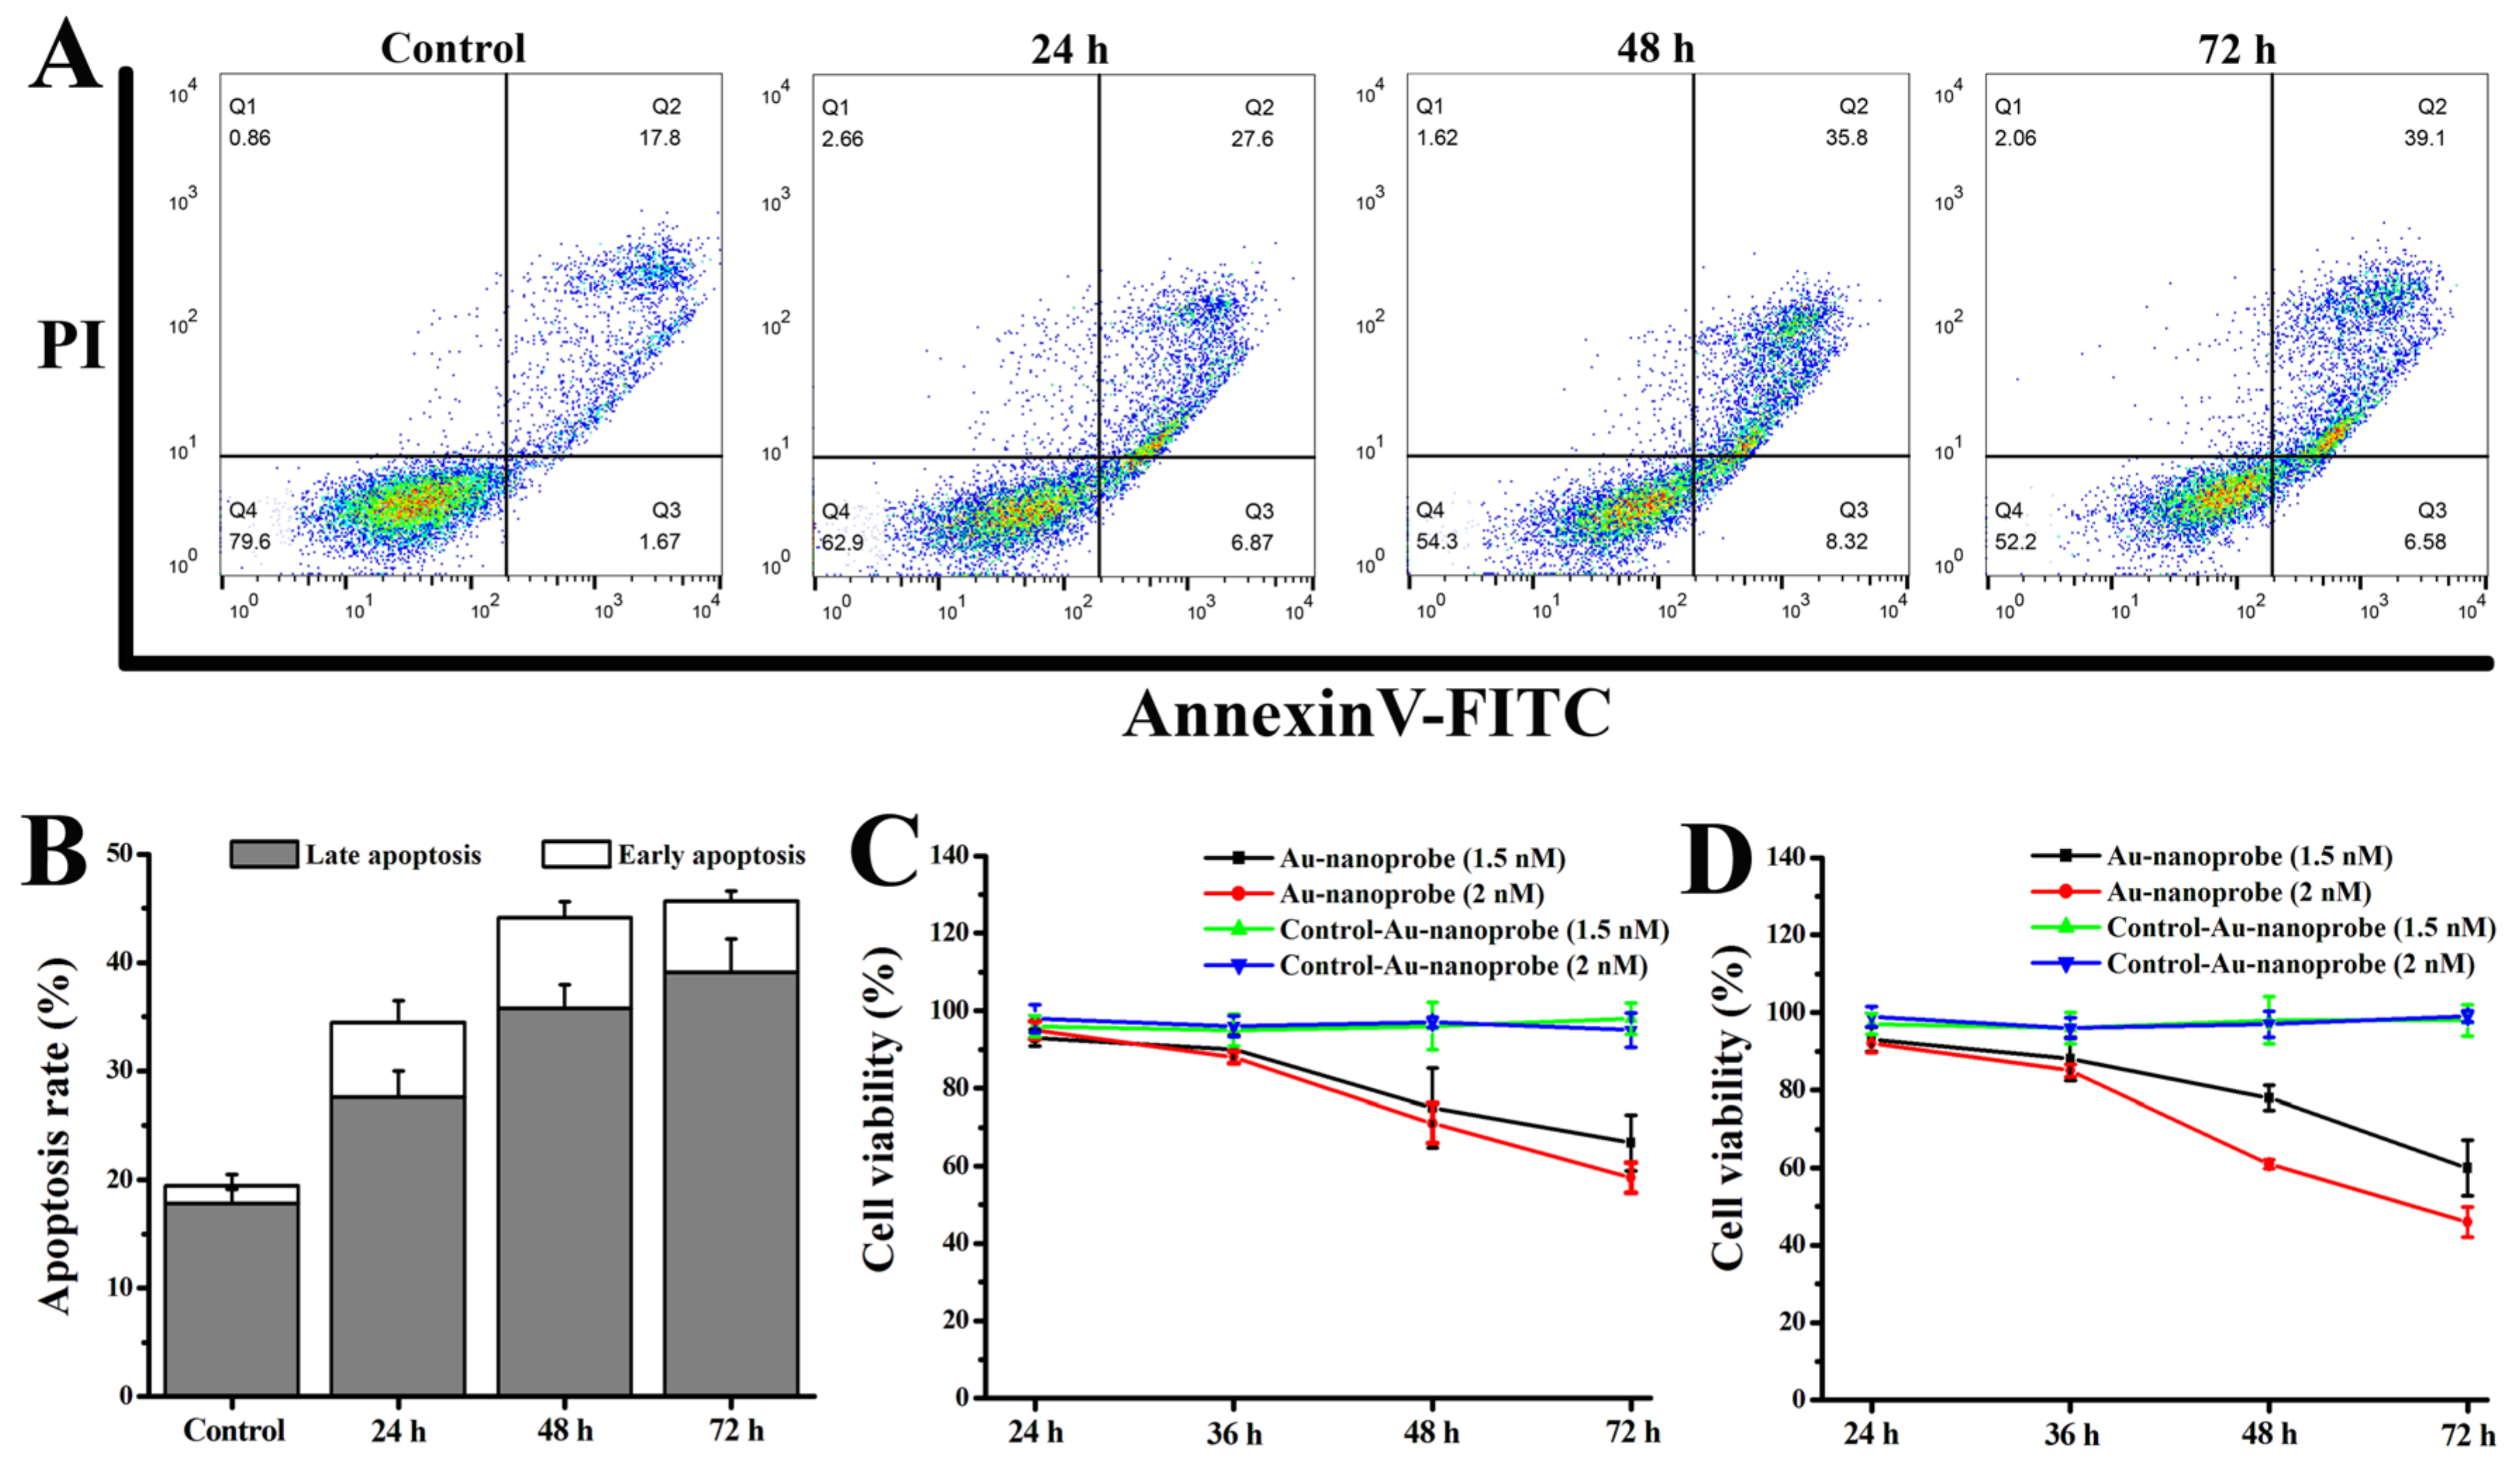
3.7. Studies of the Pro-Apoptosis Effect and In Vitro Cytotoxicity of Au-Nanoprobes
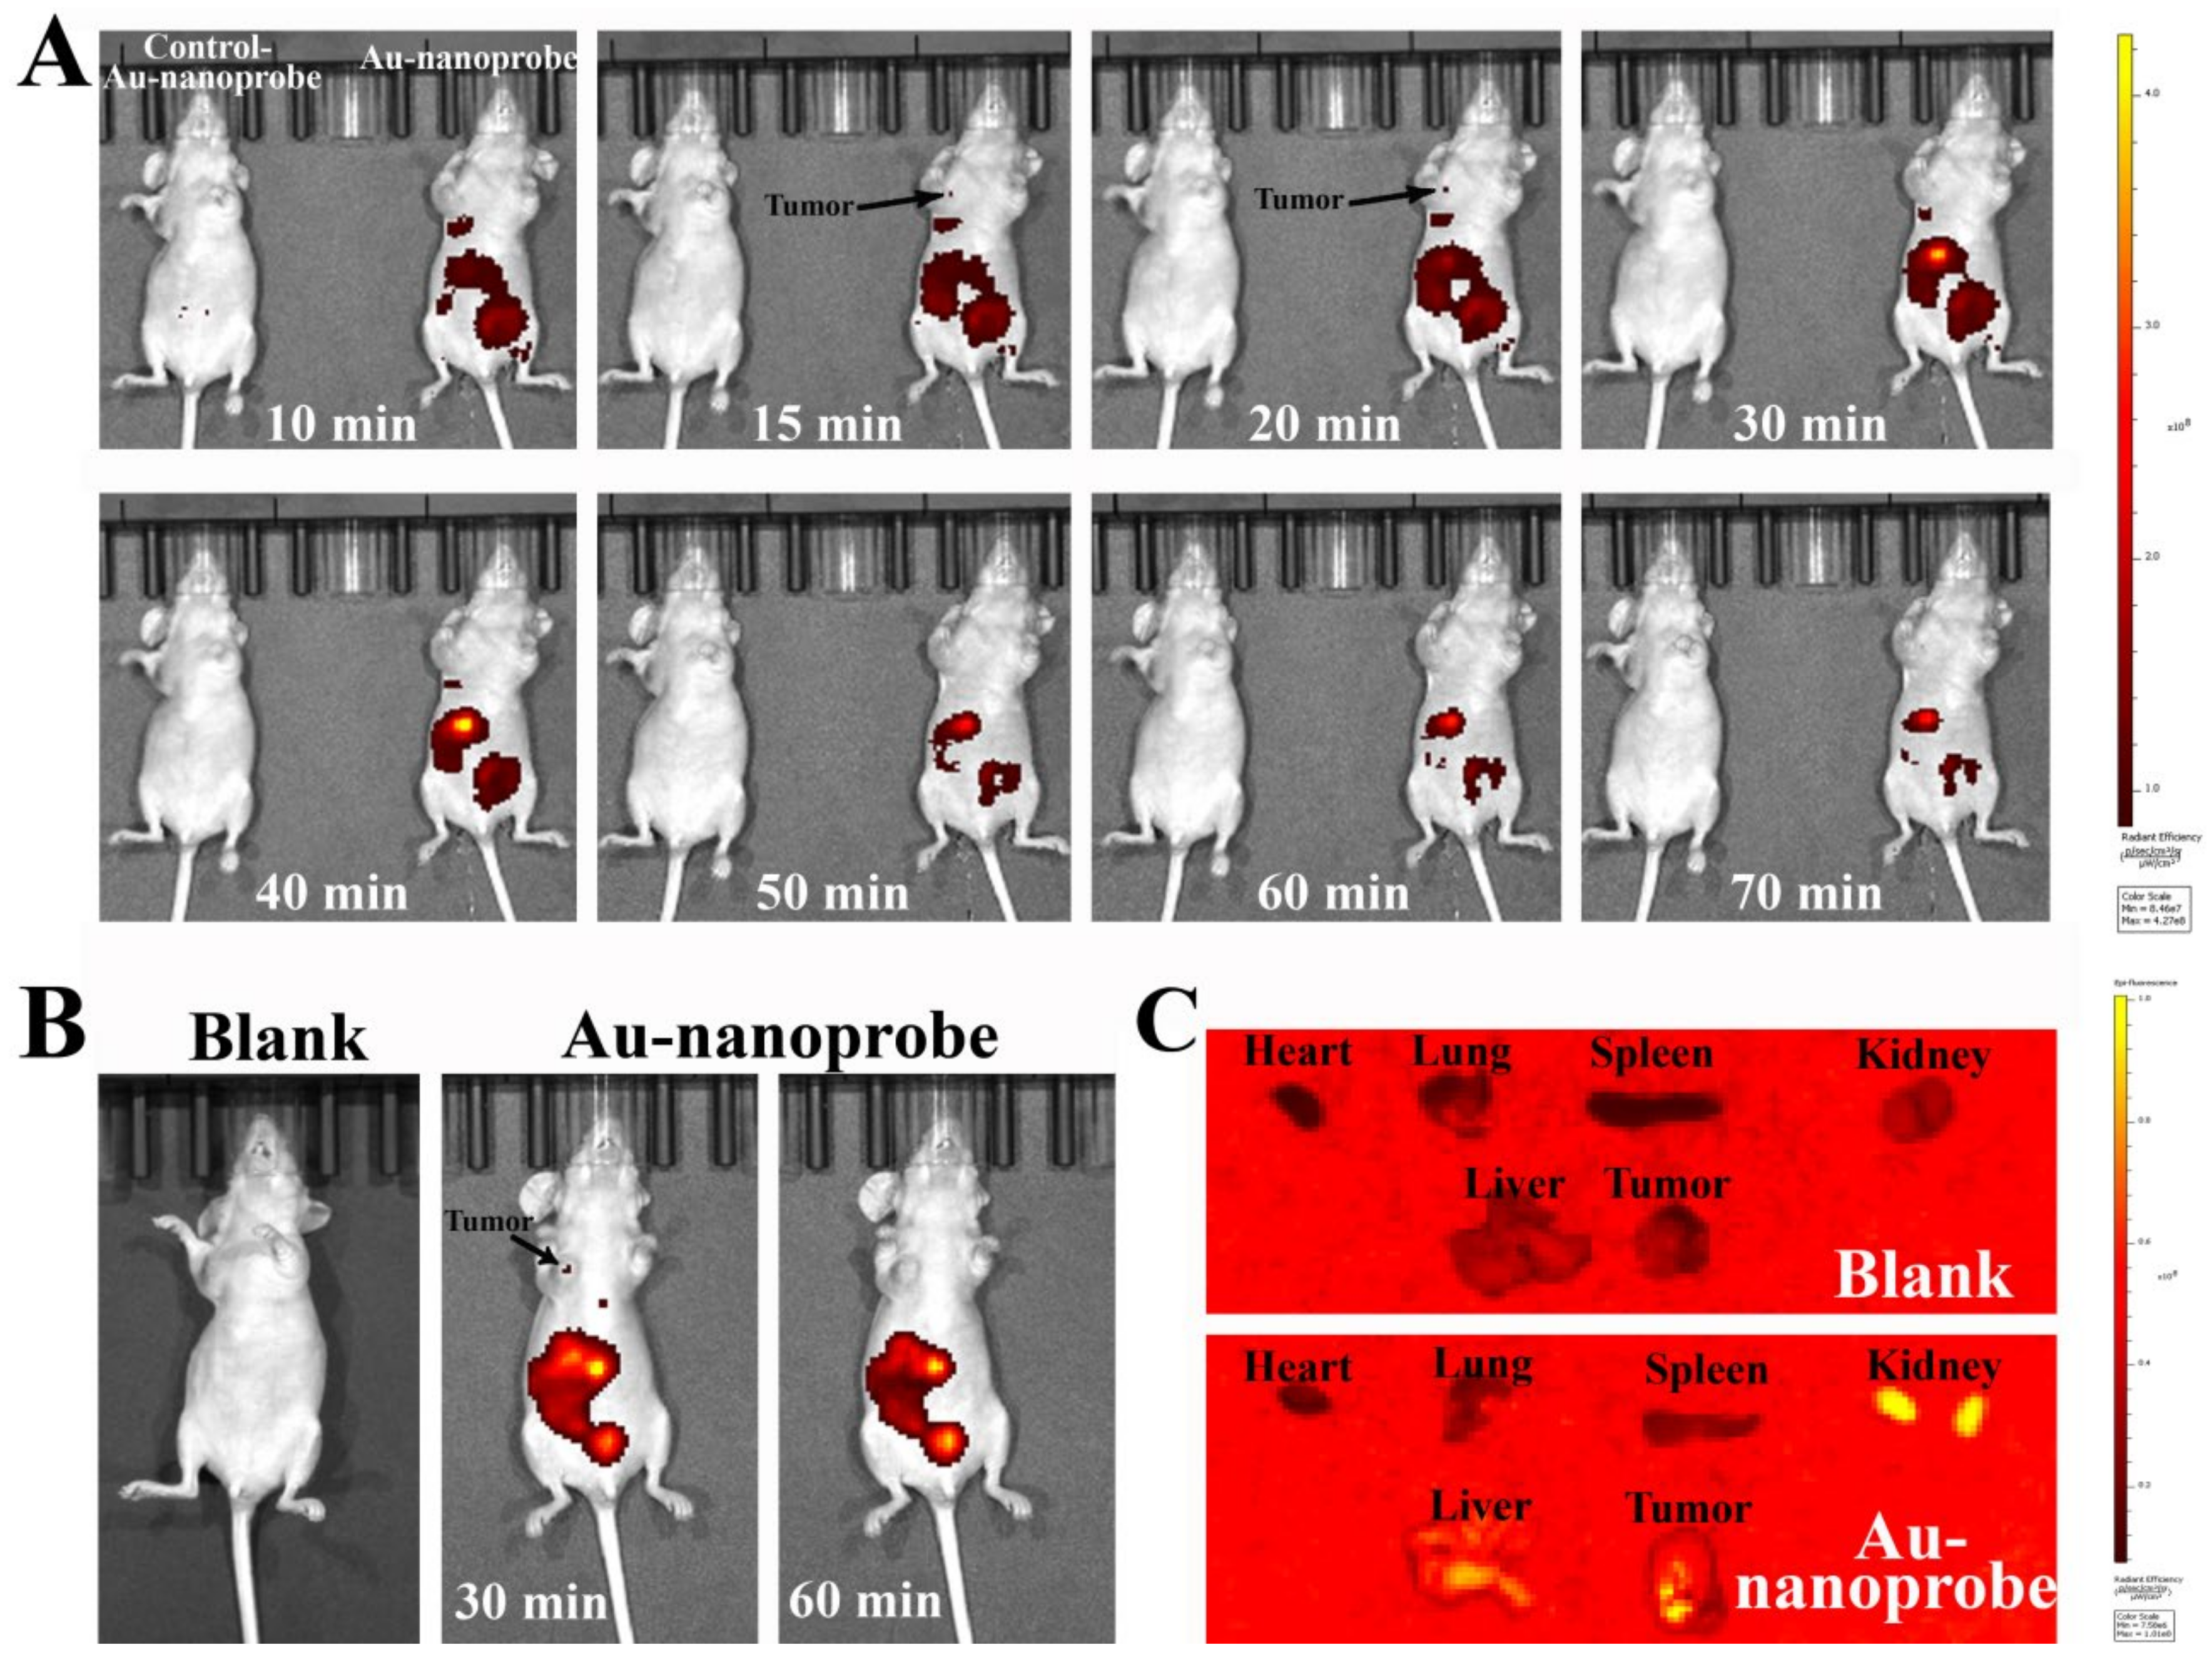
3.8. In Vivo and Ex Vivo Imaging of Au-Nanoprobes
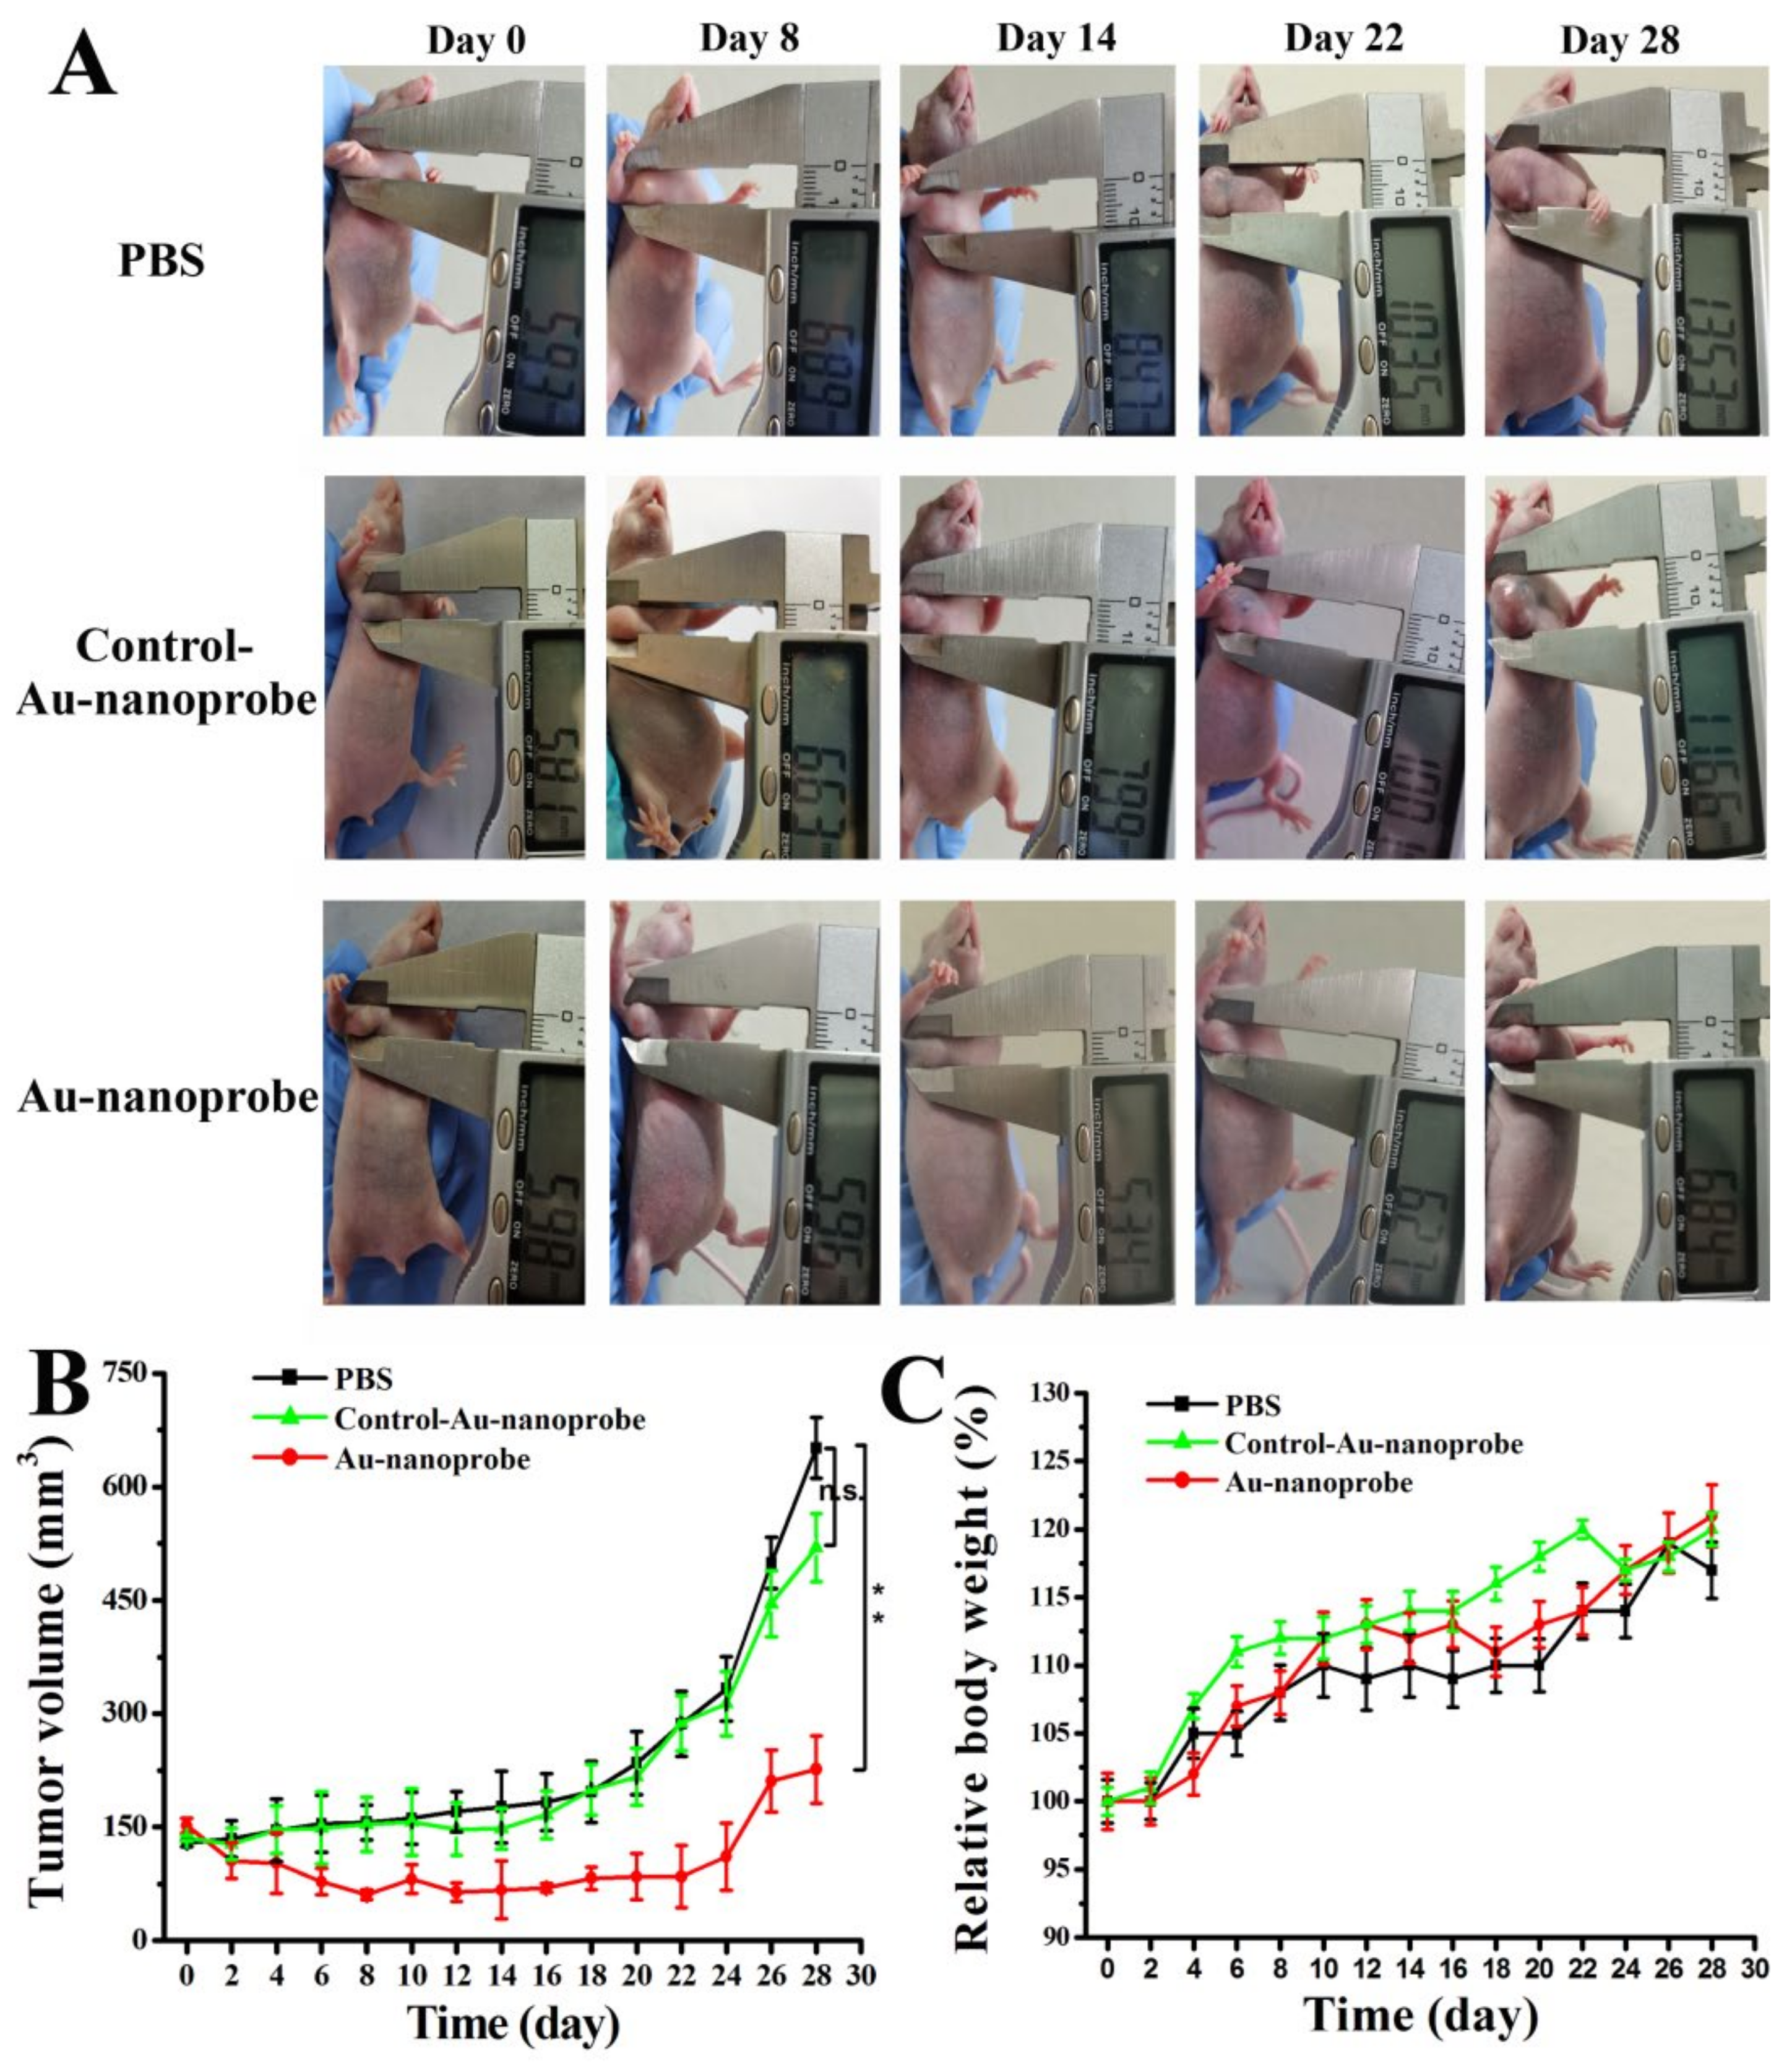
3.9. In Vivo Targeted Anti-Tumor Therapy
4. Conclusions
Supplementary Materials
Author Contributions
Funding
Data Availability Statement
Conflicts of Interest
References
- Berei, J.; Eckburg, A.; Miliavski, E.; Anderson, A.D.; Miller, R.J.; Dein, J.; Giuffre, A.M.; Tang, D.; Deb, S.; Racherla, K.S.; et al. Potential telomere-related pharmacological targets. Curr. Top. Med. Chem. 2020, 20, 458–484. [Google Scholar] [CrossRef]
- Hrdličková, R.; Nehyba, J.; Bargmann, W.; Bose, H.R. Multiple tumor suppressor microRNAs regulate telomerase and TCF7, an important transcriptional regulator of the Wnt pathway. PLoS ONE 2014, 9, e86990–87001. [Google Scholar] [CrossRef] [PubMed]
- Nguyen, T.H.D.; Tam, J.; Wu, R.A.; Greber, B.J.; Toso, D.; Nogales, E.; Collins, K. Cryo-EM structure of substrate-bound human telomerase holoenzyme. Nature 2018, 557, 190–195. [Google Scholar] [CrossRef] [PubMed]
- Long, W.; Zeng, Y.X.; Zheng, B.X.; Li, Y.B.; Wang, Y.K.; Chan, K.H.; She, M.T.; Lu, Y.J.; Cao, C.; Wong, W.L. Targeting hTERT Promoter G-Quadruplex DNA Structures with Small-Molecule Ligand to Downregulate hTERT Expression for Triple-Negative Breast Cancer Therapy. J. Med. Chem. 2024, 67, 13363–13382. [Google Scholar] [CrossRef] [PubMed]
- Eckburg, A.; Dein, J.; Berei, J.; Schrank, Z.; Puri, N. Oligonucleotides and microRNAs targeting telomerase subunits in cancer therapy. Cancers (Basel) 2020, 12, 2337–2343. [Google Scholar] [CrossRef]
- Salloum, R.; Hummel, T.R.; Kumar, S.S.; Dorris, K.; Li, S.; Lin, T.; Daryani, V.M.; Stewart, C.F.; Miles, L.; Poussaint, T.Y.; et al. A molecμLar biology and phase II study of imetelstat (GRN163L) in children with recurrent or refractory central nervous system malignancies: a pediatric brain tumor consortium study. J. Neuro-Oncol. 2016, 129, 443–451. [Google Scholar] [CrossRef]
- Ohira, T.; Naohiro, S.; Nakayama, Y.; Osaki, M.; Okada, F.; Oshimura, M.; Kugoh, H. MiR-19b regulates hTERT mRNA expression through targeting PITX1 mRNA in melanoma cells. Sci. Rep. 2015, 5, 8201–8210. [Google Scholar] [CrossRef]
- Song, G.; Wang, R.; Guo, J.; Liu, X.; Wang, F.; Qi, Y.; Wan, H.; Liu, M.; Li, X.; Tang, H. miR-346 and miR-138 competitively regulate hTERT in GRSF1- and AGO2-dependent manners, respectively. Sci. Rep. 2015, 5, 15793–15808. [Google Scholar] [CrossRef]
- Melnik, B.C. MiR-21: an environmental driver of malignant melanoma? J. Transl. Med. 2015, 13, 202–218. [Google Scholar] [CrossRef]
- Yang, Y.; Yang, J.J.; Tao, H.; Jin, W.S. MicroRNA-21 controls hTERT via PTEN in human colorectal cancer cell proliferation. J. Physiol. Biochem. 2015, 71, 59–68. [Google Scholar] [CrossRef]
- Wang, Y.Y.; Sun, G.; Luo, H.; Wang, X.F.; Lan, F.M.; Yue, X.; Fu, L.S.; Pu, P.Y.; Kang, C.S.; Liu, N.; et al. MiR-21 Modulates hTERT Through a STAT3-Dependent Manner on Glioblastoma Cell Growth. CNS Neurosci. Ther. 2012, 18, 722–728. [Google Scholar] [CrossRef] [PubMed]
- Schrank, Z.; Khan, N.; Osude, C.; Singh, S.; Miller, R.J.; Merrick, C.; Mabel, A.; Kuckovic, A.; Puri, N. Oligonucleotides Targeting Telomeres and Telomerase in Cancer. Molecules 2018, 23, 2267. [Google Scholar] [CrossRef] [PubMed]
- Nel, A.; Ruoslahti, E.; Meng, H. New insights into “Permeability” as in the enhanced permeability and retention effect of cancer nanotherapeutics. ACS Nano 2017, 11, 9567–9569. [Google Scholar] [CrossRef] [PubMed]
- Byrne, J.D.; Betancourt, T.; Brannon-Peppas, L. Active targeting schemes for nanoparticle systems in cancer therapeutics. Adv. Drug Deliv. Rev. 2008, 60, 1615–1626. [Google Scholar] [CrossRef]
- Llevot, A.; Astruc, D. Applications of vectorized gold nanoparticles to the diagnosis and therapy of cancer. Chem. Soc. Rev. 2012, 41, 242–57. [Google Scholar] [CrossRef]
- Kyriazi, M.E.; Giust, D.; El-Sagheer, A.H.; Lackie, P.M.; Muskens, O.L.; Brown, T.; Kanaras, A.G. Multiplexed mRNA Sensing and Combinatorial-Targeted Drug Delivery Using DNA-Gold Nanoparticle Dimers. ACS Nano 2018, 12, 3333–3340. [Google Scholar] [CrossRef]
- Setyawati, M.I.; Wang, Q.; Ni, N.; Tee, J.K.; Ariga, K.; Ke, P.C.; Ho, H.K.; Wang, Y.; Leong, D.T. Engineering tumoral vascular leakiness with gold nanoparticles. Nature Comm. 2023, 14, 4269. [Google Scholar] [CrossRef]
- Sun, H.; Hong, M.; Yang, Q.; Li, C.; Zhang, G.; Yue, Q.; Ma, Y.; Li, X.; Li, C.Z. Visualizing the down-regulation of hTERT mRNA expression using gold-nanoflare probes and verifying the correlation with cancer cell apoptosis. Analyst 2019, 144, 2994–3004. [Google Scholar] [CrossRef]
- Hong, M.; Sun, H.; Yang, Q.; Cheng, S.; Yu, S.; Fan, S.; Li, C.; Cui, C.; Tan, W. A microRNA-21-responsive doxorubicin-releasing sticky-flare for synergistic anticancer with silencing of microRNA and chemotherapy. Sci. China Chem. 2021, 64, 1009–1019. [Google Scholar] [CrossRef]
- Mehrnia, S.S.; Hashemi, B.; Mowla, S.J.; Nikkhah, M.; Arbabi, A. Radiosensitization of breast cancer cells using AS1411 aptamer-conjugated gold nanoparticles. Radiat. Oncol. 2021, 6, 33–45. [Google Scholar] [CrossRef]
- Prigodich, A.E.; Seferos, D.S.; Massich, M.D.; Giljohann, D.A.; Lane, B.C.; Mirkin, C.A. Nano-flares for mRNA Regulation and Detection. ACS Nano 2009, 3, 2147–2152. [Google Scholar] [CrossRef] [PubMed]
- Demers, L.M.; Mirkin, C.A.; Mucic, R.C.; Reynolds, R.A.; Leitsinger, R.L.; Viswanadham, G. A fluorescence-based method for determining the surface coverage and hybridization efficiency of thiol-capped oligonucleotides bound to gold thin films and nanoparticles. Anal. Chem. 2000, 72, 5535–5541. [Google Scholar] [CrossRef] [PubMed]
- Kraemer, K.; Fuessel, S.; Schmidt, U.; Kotzsch, M.; Schwenzer, B.; Wirth, M.P.; Meye, A. Antisense-mediated hTERT Inhibition Specifically Reduces the Growth of Human Bladder Cancer Cells. Clin. Cancer Res. 2003, 9, 3794–3800. [Google Scholar] [PubMed]
- Ryoo, S.R.; Lee, J.; Yeo, J.; Na, H.K.; Kim, Y.K.; Jang, H.; Lee, J.H.; Han, S.W.; Lee, Y.; Ki, V.N.; et al. Quantitative and Multiplexed MicroRNA Sensing in Living Cells Based on Peptide Nucleic Acid and Nano Graphene Oxide (PANGO). ACS Nano 2013, 7, 5882–5891. [Google Scholar] [CrossRef]
- Carvalho, J.; Mergny, J.L.; Salgado, G.F.; Queiroz, J.A.; Cruz, C. G-quadruplex, friend or foe: the role of the g-quartet in anticancer strategies. Trends Mol. Med. 2020, 26, 848–861. [Google Scholar] [CrossRef]
- Hosseini, N.F.; Amini, R.; Ramezani, M.; Saidijam, M.; Hashemi, S.M.; Najafi, R. AS1411 aptamer-functionalized exosomes in the targeted delivery of doxorubicin in fighting colorectal cancer. Biomed. Pharmacother. 2022, 155, 113690. [Google Scholar] [CrossRef]
- Hong, M.; Sun, H.; Xu, L.; Yue, Q.; Shen, G.; Li, M.; Tang, B.; Li, C.Z. In situ monitoring of cytoplasmic precursor and mature microRNA using gold nanoparticle and graphene oxide composite probes. Anal. Chim. Acta 2018, 1021, 129–139. [Google Scholar] [CrossRef]
- Zhu, H.Y.; Li, C.; Bai, W.D.; Su, L.L.; Liu, J.Q.; Li, Y.; Shi, J.H.; Cai, W.X.; Bai, X.Z.; Jia, Y.H.; et al. MicroRNA-21 Regulates hTERT via PTEN in Hypertrophic Scar Fibroblasts. PLoS ONE 2014, 9, e97114. [Google Scholar] [CrossRef]
- Ravichandran, G.; Rengan, A.K. Aptamer-Mediated Nanotheranostics for Cancer Treatment: A Review. ACS Appl. Nano Mat. 2020, 3, 9542–9559. [Google Scholar] [CrossRef]
- Berger, C.M.; Gaume, X.; Bouvet, P. The roles of nucleolin subcellular localization in cancer. Biochimie 2015, 113, 78–85. [Google Scholar] [CrossRef]
- Carvalho, L.S.; Gonçalves, N.; Fonseca, N.A.; Moreira, J.N. Cancer stem cells and nucleolin as drivers of carcinogenesis. Pharmaceuticals 2021, 14, 60. [Google Scholar] [CrossRef] [PubMed]
- Hosseini, N.F.; Amini, R.; Ramezani, M.; Saidijam, M.; Hashemi, S.M.; Najaf, R. AS1411 aptamer-functionalized exosomes in the targeted delivery of doxorubicin in fighting colorectal cancer. Biomed. Pharmacother. 2022, 155, 113690. [Google Scholar] [CrossRef] [PubMed]
- Latorre, A.; Posch, C.; Garcimartín, Y.; Celli, A.; Sanlorenzo, M.; Vujic, I.; Ma, J.; Zekhtser, M.; Rappersberger, K.; Ortiz-Urda, S.; et al. DNA and aptamer stabilized gold nanoparticles for targeted delivery of anticancer therapeutics. Nanoscale 2014, 6, 7436–7442. [Google Scholar] [CrossRef] [PubMed]
- Gao, Q.; Zhang, J.; Gao, J.; Zhang, Z.; Zhu, H.; Wang, D. Gold Nanoparticles in Cancer Theranostics. Front. Bioeng. Biotech. 2021, 9, 647905. [Google Scholar] [CrossRef]
- Wang, Q.; Liang, Q.; Dou, J.; Zhou, H.; Zeng, C.; Pan, H.; Shen, Y.; Li, Q.; Liu, Y.; Leong, D.T.; et al. Breaking through the basement membrane barrier to improve nanotherapeutic delivery to tumours. Nature Nanotech. 2024, 19, 95–105. [Google Scholar] [CrossRef]
- Chen, X.Y.; Yung, L.Y.L.; Tan, P.H.; Bay, B.H. Harnessing the Immunogenic Potential of Gold Nanoparticle-Based Platforms as a Therapeutic Strategy in Breast Cancer Immunotherapy: A Mini Review. Front. Immun. 2022, 13, 865554. [Google Scholar] [CrossRef]

Disclaimer/Publisher’s Note: The statements, opinions and data contained in all publications are solely those of the individual author(s) and contributor(s) and not of MDPI and/or the editor(s). MDPI and/or the editor(s) disclaim responsibility for any injury to people or property resulting from any ideas, methods, instructions or products referred to in the content. |
© 2024 by the authors. Licensee MDPI, Basel, Switzerland. This article is an open access article distributed under the terms and conditions of the Creative Commons Attribution (CC BY) license (http://creativecommons.org/licenses/by/4.0/).


