
Submitted:
06 November 2024
Posted:
07 November 2024
You are already at the latest version
Abstract
This study examines the relationship between safety climate and safety performance in large-scale construction sites in Ethiopia. A cross-sectional survey was conducted among 1,203workers from 22 large-scale construction sites. The Nordic Safety Climate Questionnaire was administered using interviews. A model was hypothesized to determine the interrelations between safety climate and performance; examined and validated using confirmatory factor analysis. The results show that the mean score of the seven safety climate dimensions was low: 2.70, ranging from 2.33 to 3.08. Similarly, the mean score of the safety performance construct was 2.95 for safety participation and 3.58 for safety compliance. The model predicts a strong positive correlation between safety climate and the safety performance constructs with 29.2% of the variance in safety involvement and 28.6% of the variance in safety compliance. The suggested association between self-reported injuries and safety climate was not confirmed. Nonetheless, a Pearson correlation analysis demonstrates a statistically significant negative correlation with safety climate. In conclusion, a low score for all the safety climate dimensions shows safety in the construction sector needs improvement. Safety climate positively influences employees’ safety behavior (safety compliance and safety participation) and minimizes occupational injuries.
Keywords:
Construction industry
; Nordic Safety Climate Questionnaire
; safety climate
; safety performance
1. Introduction
The construction industry in Ethiopia has been undergoing rapid progress in the last decade, in 2018 alone, there was 16% estimated growth, accounting for 12.5% of the Gross Domestic Product [1]. It is the largest employer sector, creating massive job opportunities for millions of non-skilled, partially skilled, and skilled labor forces [1]. The demand for infrastructure is steadily increasing.
The government of Ethiopia has attracted local and international contractors through significant investments in social housing projects [2]. However, many construction companies rely heavily on an intensive labor force, often working under challenging working conditions [2]. The construction industry in Ethiopia is generally not strong and lacks a comprehensive occupational health and safety program [3]. In many cases, health and safety risks are given low priority. Additionally, inadequate information on safety gaps within the industry makes it difficult to fully understand the scope of the problem and secure the necessary attention from policymakers [3].
Traditionally, people perceive that most accidents and injuries result from employees’ unsafe actions. This perception is derived from an outdated theory: accident proneness theory. This theory ascribes accidents and injuries to individual traits and heredity [4]. However, concentrating only on an individual is no longer advised or adequate for workplace safety. Modern occupational health and safety theories have developed, considering organizational and management aspects that explain how the system functions [5].
These days, there is a growing understanding that industry-level systemic issues are the primary causes of accidents in construction [6]. Numerous parties involved in construction projects influence decisions that could affect the safety practices of construction workers. The use of safety climate and safety performance concept is now getting global attention as a proactive approach [7]. Safety climate is defined as employees' shared perceptions of safety in their work environment [8,9]. An effective organizational safety management system can achieve good safety performance in construction projects [10].
1.1. Safety Climate
Measuring safety at work through the concept of safety climate has become popular in the safety literature [11]. Safety climate reflects safety priority in an individual’s perceptions and the sum of employees’ shared perceptions of the policies, procedures, and practices relating to safety in their work environment and comparing it with other goals [12]. Researchers consider it as a robust leading indicator of safety outcomes [9,13,14]. The use of this concept in the current literature was highly recognized after the landmark study of Dov Zohar [15]. It clearly shows the nature of an organization’s policies and the attitudes of its employees regarding safety issues. The employees’ perception of the manager’s attitudes toward safety is the most critical factor in the safety climate [15]. Using safety climate tools, a company can proactively assess how well dangers are identified and addressed in the workplace [5]. Several safety climate dimensions are explored in the current literature [8,15,16].
1.2. Safety Performance
Traditionally, safety performance has been evaluated using accident and injury data; however, these methods are inadequate since they do not identify dangerous behaviors. Safety performance metrics have recently incorporated a comprehensive framework that encompasses safety behavior and safety outcome elements [17].
Safety behaviors are the real actions of individuals that can be observed at the worksite [18]. It can be characterized by safety participation and safety compliance [12,19]. It has been extensively used in recent safety literature [20,21,22]. Safety participation is a voluntary action that primarily enhances workplace safety rather than personal safety. It is a kind of behavior beyond the employee’s formal role [23]. Safety compliance, on the other hand, refers to the fundamental and required procedures that employees must follow to guarantee the bare minimum of workplace safety. Safety compliance includes wearing personal protective equipment and complying with safety rules and procedures [24]. In general, participation in safety is voluntary, but compliance with safety is required [17].
There is little evidence of Ethiopia's construction industry's safety performance in relation to health and safety management practices [3]. Existing evidence adopts a reactive methodology, measuring work-related accidents based on their immediate causes [25,26]. Therefore, exploring the existing health and safety management practices using the concept of safety climate and safety performance framework is imperative to effectively manage the weakness of the system and its implications [7]. The main aim of this study is to examine the relationship between the dimensions of safety climate and safety performance in large-scale construction sites in Ethiopia.
1.3. Research Hypothesis
The safety literature has long recognized the link between safety performance and safety climate. The more the safety climate, the higher the safety performance (safety participation and safety compliance) [21,23,24]. When safety perceptions are more favorable, employees are less likely to take risks and lower chance of injury [21,23]. However, this is not so certain in low-income settings and this study tried to see such a relation in the construction industry in Ethiopia.
Hypothesis-1 (H01): Safety climate has a significant positive relationship with safety participation (Safety performance, dimension 1) in the construction industry in Ethiopia
Hypothesis-2 (H02): Safety climate has a significant positive relationship with safety compliance (Safety performance, dimension 2) in the construction industry in Ethiopia Hypothesis-3 (H03): Safety climate has a significant negative relationship with self-reported accidents/injuries (Safety performance, dimension 3) in the construction industry in Ethiopia.
The hypotheses are illustrated in Figure 1.
2. Materials and Methods
2.1. Questionnaire Design
Although various options for safety climate questionnaires are available in the literature, in this study we considered the Nordic Safety Climate Questionnaire (NOSACQ-50). The validity of the NOSACQ-50 questionnaire has been well-tested by numerous researchers in different countries and contexts [8,27,28,29]. It has been translated into more than 25 languages, including Amharic [30]. More importantly, the NOSACQ-50 safety climate questionnaire was developed primarily for the construction industry. Therefore, the NOSACQ-50 questionnaire was considered an appropriate instrument to measure the occupational safety climate of the large-scale building construction sector in Ethiopia. It is suitable for assessing the safety climate status and evaluating the effect of safety climate interventions [8].
In the questionnaire, there are 7 safety climate dimensions, comprising a total of 50 items. Of them, 22 items evaluate safety at the management level, and 28 items evaluate at the worker’s level. Dimension_1: Management safety priority, and commitment (9 items) indicates the perception of workers on the commitments of their managers toward safety to reward and promote safety at work. Dimension_2: Management safety empowerment (7 items) which measures employees' perceptions of management empowerment and support for their involvement in safety decision-making. Dimension_3: Management safety justice (6 items), demonstrates the fairness with which workers feel their management handles employees involved in accidents. Dimension_4: Workers’ safety commitment (6 items), assesses how employees react to workplace safety by showing a commitment to safety, actively promoting safety, and being aware of one another's safety. Dimension_5: Workers’ safety priority and risk non-acceptance (7 items), is used to evaluate the extent to which employees put safety before productivity objectives and avoid dangerous situations. Dimension_6: Workers' safety communication, learning, and trust in co-workers’ safety competence (7 items), which measures how workers trust each other and communicate safety matters. Dimension_7: Workers’ trust in the efficacy of safety systems (7 items), which evaluates how workers assess their safety systems.
According to the NOSACQ-50 guidelines for evaluating subjects’ agreement, each item had a four-point scale ranging from 1 (strongly disagree), 2 (disagree), 3 (agree) to 4 (strongly agree). Reversed scaling is also indicated as follows: 4 (strongly disagree), 3 (disagree), 2 (agree), and 1 (strongly agree). The mean score of each dimension is interpreted as follows: if the mean score is greater than 3.3, it is at a good level and the companies should maintain and continue. If the score falls between 3 and 3.3, it is a reasonably acceptable level, requiring just a little improvement. A score ranging from 2.7 to 2.99 suggests a need for improvement. Finally, If the average score is less than 2.7, indicates a low level and needs significant improvement [31].
The safety performance items adopted from the previous studies include safety compliance (SP_Dimension 1), safety participation (SP_Dimension 2), and occupational injuries (OI) [27,32]. In this study, twelve items were considered to measure safety performance. Of those, five items were used to measure the respondents’ level of participation in safety activities. Three of them were taken from Neal and Griffen [24] which include “I put in extra effort to improve the safety of the workplace”, “I promote the safety program within the organization”, and “I voluntarily carry out tasks or activities that help to improve workplace safety”. Also, two items were taken from De Armond et al. [17] which include “I speak up and encourage others to get involved in safety issues” and” I attend non-mandatory safety-orientated training”.
On the other hand, four items were used to measure the level of safety compliance. Three items were taken from Neal and Griffen [24] which were “I use all the necessary safety equipment to do my job”, “I use the correct safety procedures for carrying out my job”, and “I ensure the highest levels of safety when I carry out my job”. One item taken from De Armond et al. [17] stated, “I appropriately report injuries, accidents, or illnesses”. A five-point Likert scale was adopted to measure the response to each item from 1 to 5, in terms of strongly disagree, disagree, neutral, agree, and strongly agree, respectively.
Three questions were considered to measure the self-reported injuries of the respondents in the last 12 months, which includes the number of injuries without absence from work, the number of injuries less than three days absence from work, and the number of injuries requiring more than three days absence from work (20, 21, 26) with a 5-point ordinal scale (0 = Never; 1 = 1 time; 2 = 2–3 times; 3 = 4–5 times; 4 = Over 5 times).
2.2. Study Design and Population
A cross-sectional design was employed in 22 randomly selected large-scale construction sites operated in 5 cities in Ethiopia. Two-stage sampling approach was employed. First, construction sites were selected, and 2nd individual participants were selected. Based on the total number of construction sites in the region, representative sites were taken proportionally from each region. Of those 121 construction sites, 22 were selected (12 from Addis Ababa city, 5 from Oromia Regional State, 3 from Amhara Regional State, and 2 from Sidama Regional State). Based on the workers’ list with respective departments obtained from the companies (sampling frame), study participants were chosen using a proportional-to-the-size approach. In total 1,203 individual workers, including site managers, safety engineers, supervisors, and all other front-line construction workers.
2.3. Data Collection
Survey data were collected through the administration of structured questionnaires on a face-to-face interview by a data collector visiting the workplace. A questionnaire template was loaded onto each data collector's smartphone with an Open Data Kit (ODK) and a total of 20 experienced data collectors were involved in the data collection process. Each interview session took on average 15 to 20 minutes. The interview process was carried out in a private setting, no personal identification was recorded and the information they provided was kept confidential.
2.4. Data Analysis
The statistical data from the survey was examined using SPSS version 23 software. The data were screened for missing information, outliers, and coding problems. Since ODK software was used to obtain the data, none of them could be recognized. The data normality was checked using the Shapiro-Wilk normality test. The absolute kurtosis and skewness values were less than 62, indicating normality. Descriptive analysis was done to calculate the mean and standard deviation and compare the value with the NOSACQ-50 grand database. The grand database is the data archive collected globally using the NOSACQ-50 safety climate tool in different occupational settings. For comparison purposes, we grouped study participants into two management groups (site managers, safety engineers, and supervisors), and all the front-line skilled and non-skilled workers were categorized as work groups. The final analysis was done using SPSS Amos version 23 software, a preferred tool for model specification and prediction. It was performed in three steps by using Explanatory Factor Analysis (EFA), Confirmatory Factor Analysis (CFA), and Structural Equation (SEM) techniques [33,34].
Explanatory Factor Analysis (EFA) was used to identify the factor structure of safety climate dimensions. Before EFA, both the Kaiser-Mayer-Olkin (KMO) measure of sampling adequacy and Barlett’s test of sphericity were conducted to evaluate the appropriateness of using the EFA method. The maximum likelihood technique with Promax rotation was employed to verify that the observed variables met the reliability and validity requirements. The maximum likelihood technique is suggested when fitting a CFA is of interest to the researcher. Promax rotation was used because the data sample was sufficiently large (N = 1,203).
Then, using a set of observable variables to assess covariance, CFA was used to construct and figure one or more theoretical models of dimension. Each theoretical model suggests a set of latent variables.
Finally, to evaluate the hypothesized relationships between the latent and observed variables, structural equation modeling (SEM) was employed. It is a multivariate technique that allows the estimation of multiple equations at the same time. SEM is a statistical modeling method that can also control independent and dependent variables, explaining all the proposed relationships.
The SEM model was tested in two stages verifying the measurement and the structural model. The internal validity and reliability of the model were assessed using the average variance extracted (AVE) and construct reliability (CR). A value over 0.50 of AVE and a value over 0.70 of CR suggest good validity and reliability, respectively [35]. Because of the model's complexity, internal validity and reliability were accessed first within every construct, and then in an aggregated measurement model. For model evaluation, several frequently used fit indices were adopted in the current study, including the ratio of model chi-square to the degrees of freedom (_2/df), root mean square
of approximation (RMSEA), goodness-of-fit (GFI), adjusted goodness-of-fit (AGFI), Tucker–Lewis’s index (TLI) and comparative fit index (CFI). A _2/df value less than 5 indicates an acceptable model fit to the data. RMESA values of less than 0.05 indicate a good fit, whereas values ranging from 0.05 to 0.08 are acceptable. GFI, AGFI, TLF, and CFI range from 0 to 1. Values over 0.80 are acceptable model fit to the data.
3. Results
3.1. Socio-Demographic and Personal Characteristics of Participants
From a total of 1,250 participants approached during the data collection, we got a response from 1,203 participants giving a response rate of 96.2%. As shown in Table 1, of the total, 1,203 respondents, work groups represented more than three-fourths (80.7%), and the rest (19.3%) were management groups. More than half, 56%, were in the age range of 25 to 34 years. The majority, 88%, of the participants were males. A third 32% of the participants had an educational status of below secondary education. The majority 91%, of the participants, didn’t take any formal safety training in the last year.
3.2. Descriptive Results of Safety Climate and Safety Performance
The mean, standard deviation, and reliability of the safety climate and safety performance factors were calculated (Table 2). The mean and standard deviation for all safety climates dimensions was 2.70 (+ .332). The lowest mean (2.33) and highest standard deviation (.578) were among the management safety empowerment dimensions. Among safety performance dimensions the mean score of safety compliance (3.58) was higher than safety participation (2.95). However, the standard deviation was higher (.970) in safety participation than in safety compliance (.697). The mean value of the occupational injuries was 0.45.
The Pearson correlation illustrated in Table 2 showed that the correlations among safety climate factors were statistically significant. Except for one dimension “workers’ trust in the efficacy of safety systems” (SC Dimension 7), all the safety climate dimensions were positively correlated with safety behavior (safety participation than safety compliance) and negatively correlated with occupational injuries.
The values of Cronbach’s coefficient alpha for all the seven SC factors (Dim_1, Dim_2, Dim_3, Dim_4, Dim_5, Dim_6, and Dim_7) and three safety performance factors (SP_1, SP_2, and OI) were above the threshold of (0.7).
The mean and standard deviation of the safety climate scores varied among work groups and management groups (Table 3). A slightly larger value was reported among the management group compared with the work group. The mean value of safety climate items among both groups was below the grand database. In comparison to the NOSACQ-50 interpretation guidelines, Management safety priority and commitment (2.54), workers’ safety priority and risk non-acceptance (2.52), and management safety empowerment (2.33) were below the recommended minimum cut-off point.
3.3. Data Preparation for CFA
A KMO range of 0.60 and above is required to fit a high-quality measurement model [34].
The KMO value of (.947) in this study suggests an excellent degree of sampling adequacy. Similarly, according to Bartlett's test of sphericity, the minimum criterion for significant values for each of the constructs (p< 0.05) is acceptable. In the current study, Bartlett's test of sphericity was significant (p< 0.000), indicating that the data were appropriate for factor analysis (Table 4).
During EFA those items with low commonalities (less than 0.40) should be omitted from further analysis. Therefore, the following variables were removed from the model: SCI_29, SPI_30, SPI_31, SPI_34, SPI_36, SPI_37, SPI_38, SPI_44, SPI_45, SPI_50, SPI_6, SPI_9, OI_1, OI_2, and OI_3. Furthermore, CFA allows factor loadings of 0.5 and higher. Accordingly, the following items SCI_10, SCI_11, SCI_14, SCI_39, SCI_40, SCI_18, SCI_21, SCI_32, SPI_33, and SCI_35 were eliminated due to lower values. Hence, the CFA model considered 30 safety climate indicators (SCI) out of 50 and 6 safety performance indicators (SPI) out of 9. Since none of the three indicators measuring the accident/injury rate met the minimal requirements, they were omitted from the model.
Finally, an acceptable level of cumulative variance of (70.3%) was obtained by fitting the model using the eight-factor structure that was created above the eigenvalue of one. The SC factors' EFA results were tabulated (Table S1). The indicator variables achieved the intended commonalities and factor loadings were considered for the next analysis stage (Figure S1).
3.4. Model Evaluation Using CFA
The measurement quality and appropriateness of the suggested structural model were evaluated using CFA. Initially, a total of eight latent constructs (dimensions) and 37 indicators among the 1,203 verified samples were included in the analysis. However, due to a model validation issue, one safety climate dimension (Dim7) was removed from the final model as its value of Average Explained Variance (AEV) was below the recommended value of (0.5). Hence in the final model, a total of 33 items in five safety climate (SC) dimensions and 7 items from the safety performance (SP) dimension were fitted using CFA.
Standard linear SEM was fitted using a maximum likelihood estimator since it is believed that the latent endogenous variables, latent exogenous variables, observed endogenous variables, and observed exogenous variables are all jointly distributed normally with a mean and variance matrix. Figure 2 shows the structural and measurement models. Almost all of the pathways between the first-order latent variables and the corresponding observed variables were significant, according to a thorough examination of the measurement models, as they reached the desired values of standardized path coefficients (>0.5). Additionally, it was found that the two indicators of SP (SP1 and SP2) were strongly influenced by each of the five first-order latent variables of SC (Dim1, Dim2, Dim3, Dim4, and Dim6). Dim4_1 and Dim4_2 were combined and renamed as Dim4 in the CFA model. In the EFA model, it was considered separately. Since they were originally classified under the same dimension. The parameter estimates and model fitness were unaffected by the merging process.
3.5. Model Fitness Indices
The final model was fitted after correlating 11 error variables with higher values of modification indices e2–e3, e4–e5, e5-e8, e6-e9, e11-e12, e18-e19, e20-e23, e21–e22 e31-e32, e32-e34 and e45-e46. Figure 3 illustrates these connections by plotting them among the observed variables' residuals. The structural and measurement model achieves the desirable model fit of RMSEA = 0.059, GFI = 0.877, AGFI = 0.857, CFI = 0.925, NFI .909, and TLI 0.918 as illustrated in Table 6. In this scenario, the observed moments are the covariances between all pairings, and the all-model fitness indices indicate how well the model fits the data.
3.6. Validity and Reliability of the Measurement Model
As illustrated in Table 7, the reliability and validity of the final CFA models were assessed with recommended techniques. The reliability of the measurement model in CFA is checked using the value of composite reliability (CR) the value above the recommended (0.7) assures the presence of reliability. In this study, the minimum CR value of (0.729) shows the presence of good reliability.
Convergent validity measures how close each indicator is to explaining the latent construct. In this regard, the value of CR should be above (0.7) and the average variance extracted (AVE) value should be greater than (0.5). In addition, all the CR values should be greater than the value of AVE. As indicated in Table 7 all the values of CR and AVE were greater than the recommended limit and all the values of CR were greater than AVE which showed the model had a good convergent validity.
Discriminant validity shows how each latent construct differs and is assessed in two ways. The Average Shared Variance (ASV) should be less than the Maximum Shared Variance (MSV) and MSV should be less than AVE showing the presence of discriminant validity. On the other hand, if the square root value of AVE is the maximum in the respective column (greater than the correlation between the construct and any other construct) according to the Fronell-Larcker Criterion the presence of discriminant validity can be assured. Hence, both criteria were fulfilled so the measurement model achieved discriminant validity (Table 7).
The non-existence of multi-collinearity was verified as the maximum correlation between the exogenous constructs (0.716) was less than the recommended value of (0.85).
3.7. Hypothesis Testing
We fitted the structural model using the maximum likelihood estimation method and covariance matrix to assess the proposed relationships. The developed structural model of SC and SP accounts for age, education, and experience (Table 8).
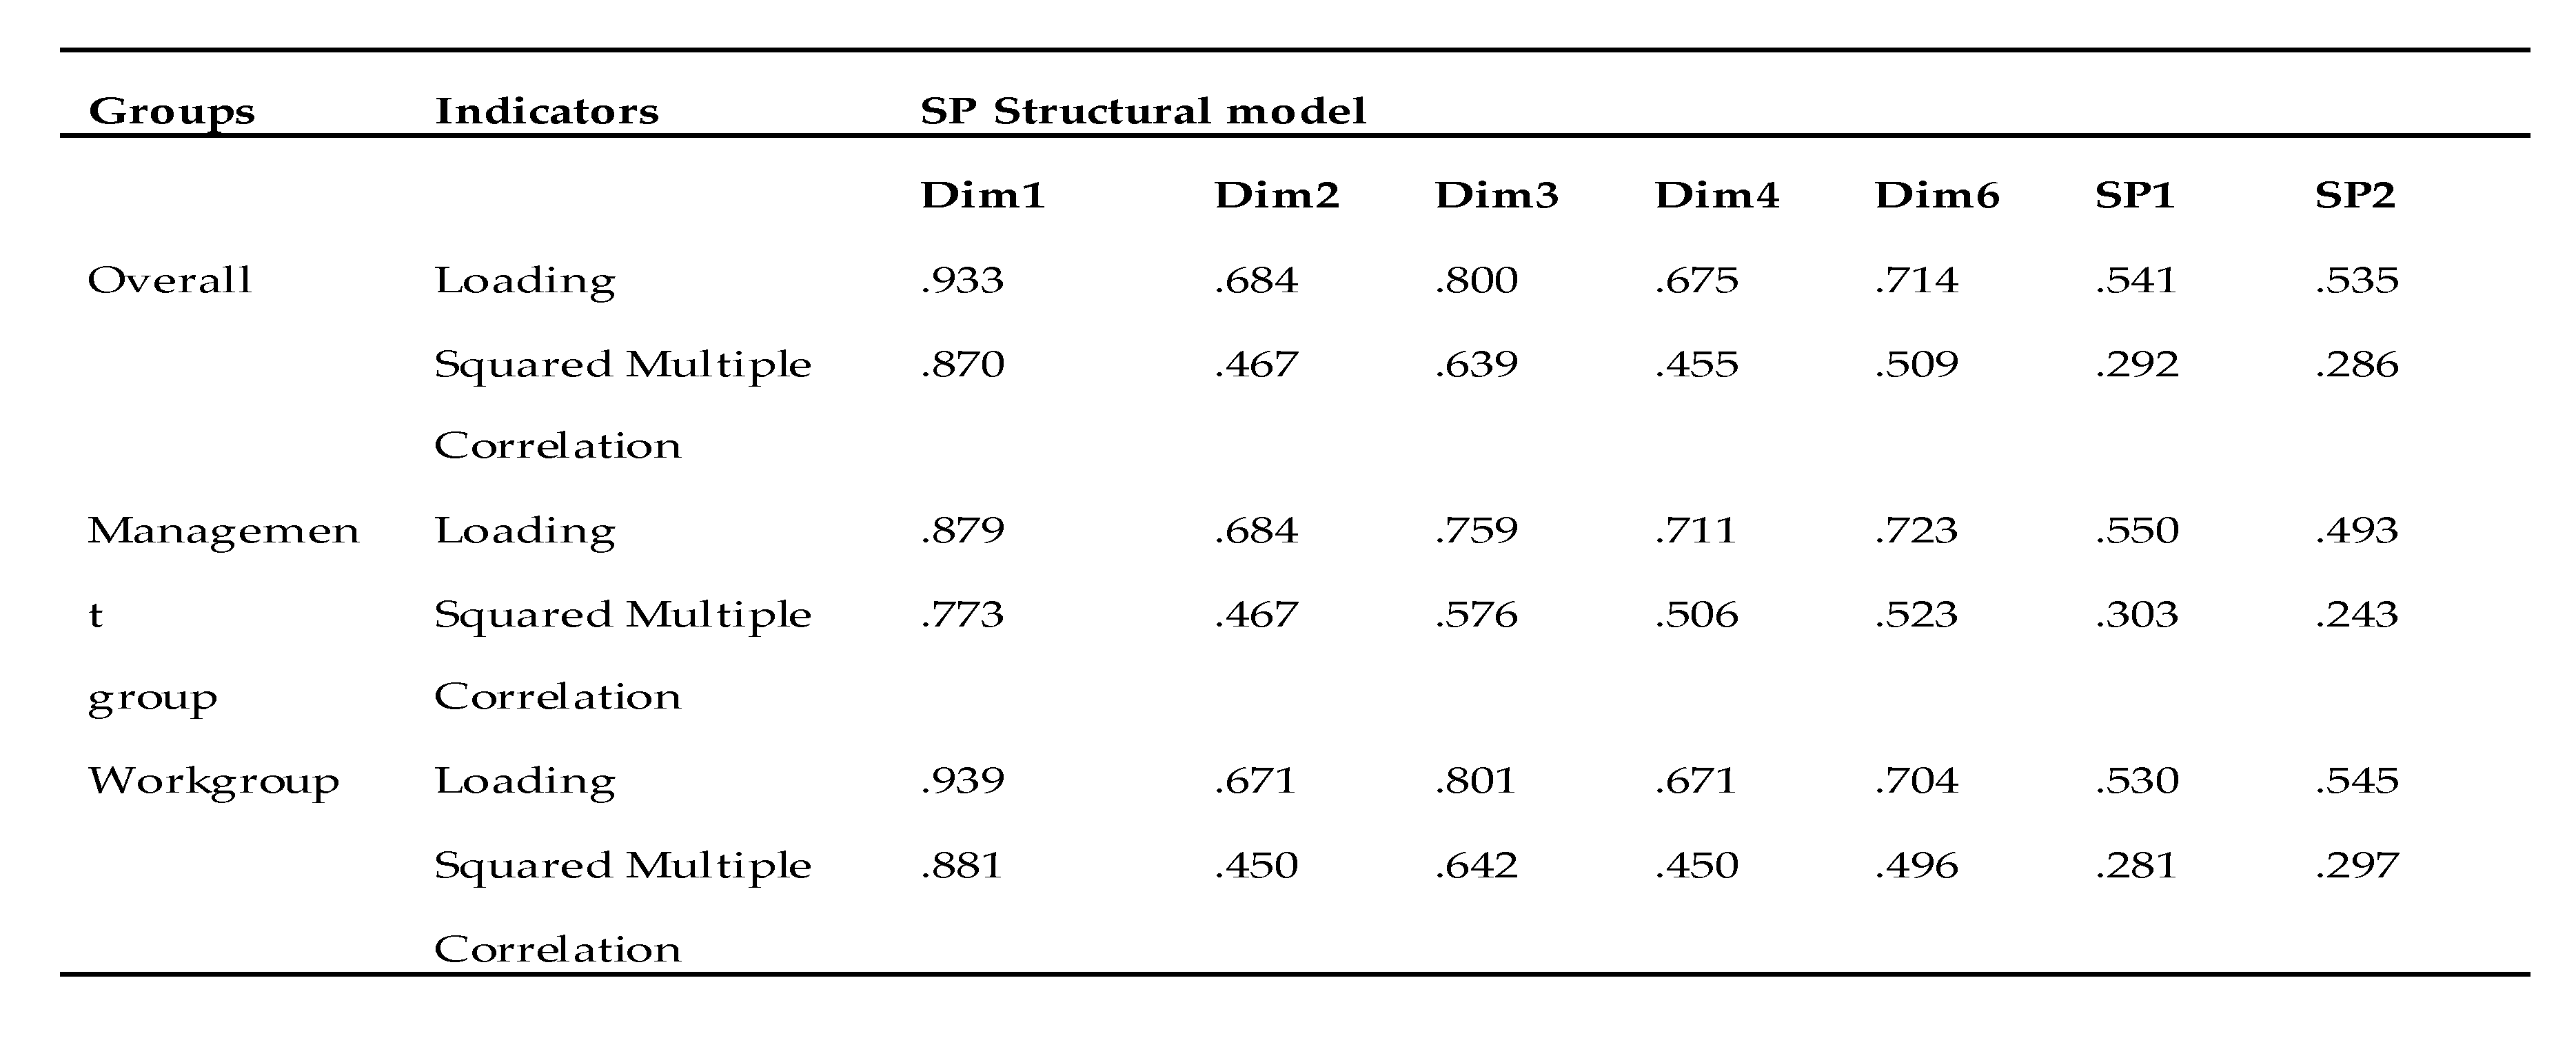
The two hypothesized relationships (H1 and H2) were validated by the proposed model (Figure 1). The model depicts a significant positive correlation between SC and safety participation (H1). As illustrated in Table 8 a standardized path coefficient of (0.541) indicates that safety compliance increases by 0.541 standard deviations for every standard deviation increase in SC. Similarly, a Bentler-Raykov squared multiple correlation coefficient (0.292) showed that 29.2% of the variance in safety involvement was explained. A significant positive correlation was also seen in the relationship between SC and safety compliance (H2), with squared multiple correlations of (0.286) and standardized path coefficients of (0.535) indicating that 28.6% of the variation was explained.
There was a slight difference between the management group (Figure 3) and the work groups (Figure 4). Among managers, safety involvement was explained more than safety compliance. On the other hand, safety compliance was more explained among the workers than among managers. However, there were no differences in safety climate perceptions among men and women and within different age groups.
In this model, the relationship between SC and the number of self-reported accidents/injuries (H3) could not be tested as it could not be retained in the hypothesized model.
4. Discussion
The results show the mean score of the seven safety climate dimensions was low 2.70, ranging from 2.33 to 3.08. Similarly, the mean score of the safety performance construct was 2.95 for safety participation and 3.58 for safety compliance. In the final SEM model, 26 (52%) items out of 50 and five safety climate dimensions out of the seven NOSACQ-50 safety climate dimensions were maintained. The model predicts a strong positive correlation of safety climate with the safety performance constructs with 29.2% of the variance in safety involvement and 28.6% of the variance in safety compliance. The proposed relationship between self-reported accidents/injuries and SC was not established as the variable could not be used in the model analysis. Nonetheless, the Pearson correlation shows a statistically significant negative correlation between self-reported injury and SC. There were no differences in safety climate perceptions among men and women and different age groups and educational statuses.
According to the NOSACQ-50 interpretation guideline [31], a safety climate dimension with a score below 2.70 indicates a low level with a great need for improvement. In this regard, management safety priority and commitment (2.54), workers’ safety priority and risk non-acceptance (2.52), and management safety empowerment (2.33) were below the cut-off point. This indicates the need for high-level commitment and effort to improve safety climate conditions in the construction sector in Ethiopia. Lack of management commitment towards safety and employees not participating in the decision-making process might demotivate them and increase the risk of getting occupational injuries [25].
The mean score for each safety climate dimension in the current study was generally low compared to the grand database and a study in the Saudi Arabian construction industry [36]. However, the patterns of the mean scores among various safety climate dimensions were consistent with the grad database. Among work groups, workers' trust in the effectiveness of safety procedures (Dim7) shows the maximum score (3.24) in the grand database and (3.06) in the current study. It was also consistent with a study in the construction industry the highest score was 3.24 and it was in (Dim. 7) [29]. The same trend was reported among the management group with a maximum score of (3.36) in the grand database and (3.17) in the current study and it was in the same construct (Dim7). Similarly, the minimum values of the two reports were also consistent. Among the work groups, management safety justice (Dim3) was the lowest score in both reports (2.98) in the grand database and (2.28) in the current study. This consistency in the patterns of the mean score among different safety climate dimensions demonstrates that the NOSACQ-50 safety climate questionnaire is a useful instrument for evaluating safety climate conditions in various settings.
In the existing safety literature, it has been well established that safety climate positively affects safety participation and safety compliance [20,27,37]. The findings of the current study demonstrate this fact. The structural model showed a statistically significant positive relationship between safety climate and safety participation (.541) and safety climate and safety compliance (.535) with a total variance of 29.2% and 28.6% respectively. Therefore, the research hypothesis was strongly supported by the data.
The magnitude of the relationship between safety climate and safety performance (safety compliance and safety participation) has been debatable in the current safety literature. Some studies argued that safety climate was correlated more with safety participation than safety compliance [21,23]. A possible explanation includes workers regularly following the safety laws and regulations because they are required to do so, and the safety climate had little influence on this kind of compulsory behavior. Conversely, other researchers argued that safety climate correlated more with safety compliance than safety participation [37]. The current study found that safety participation and safety compliance were almost equally correlated with the safety climate. Therefore, these differences in the weight assigned to various SP indicators support the necessity of examining safety behavior in cross-cultural and cross-regional contexts.
In the current study, some safety climate dimensions had a greater impact on the safety performance indicators, as shown by the path coefficients (Figure 2) and percentage variances (Table 8). Management safety commitment and priority (Dim1) and management safety justice (Dim3) had more effects on SP than other dimensions. Even though the lower mean score (2.54) for Dim 1, the effect on SC (0.933) was higher than others, explaining 87% of the variation in SC. This illustrates how the SP substantially enhanced with only a little effort on the commitments of the top management. A similar study provides substantial evidence for this fact [37].
In the current study, the hypothesized relationship between safety climate and self-reported injury rate cannot be validated. Due to the fact that none of the three components of injury categories in the explanatory factor analysis (EFA) meet the minimal requirements for factor loading (0.5) and communalities (0.4). Hence, we intend to fit another model in our upcoming paper to investigate the statistical association between safety climate and self-reported occupational injuries.
The Strengths and Limitations of This Study
To our knowledge, this is the first study of its kind in the construction industry in Ethiopia to investigate the relationship between safety climate and safety performance. The study includes 5 large cities with a geographically diverse population. We used a large sample of managers and workgroups. The final model achieved the desired goodness of fit indices, the acceptable degree of composite reliability, and convergent and discriminate validities. The application of the NOSACQ-50 safety climate questionnaire minimized the social desirability bias as it assessed group-level common practices [38]. The tool was also validated in a different context [8].
However, the current study has some limitations. The study used cross-sectional data, hence unable to demonstrate how the safety climate changed over time. This may have been accomplished using a longitudinal approach. The use of a face-to-face interview approach, as personal contact may influence the participants’ response. However, interviews were necessary, as many construction workers do not have good writing skills. The reported accidents and injuries were lower than expected, which might be linked to different biases. Possibly due to recall bias, the employees might not have remembered the events. It might also be due to fear, as the workers might have worried about the consequences of reporting negative information about their workplace. However, we did our best to minimize this bias by interviewing the employees in a private setting and keeping the confidentiality of the data.
5. Conclusions
The current study explores the underlying relationship between safety climate and safety performance. The mean score of the safety climate dimension was generally low compared with data from other countries. The low score for all the safety climate dimensions shows safety in the construction sector is overlooked and needs substantial effort. The model predicts a strong positive correlation between safety climate and safety performance constructs. The finding showed management safety priority and commitment explain the variance of safety climate and safety performance to a higher extent. Therefore, special emphasis should be given to improving management safety priority and commitment.
Applications of the safety climate model assist construction industry decision-makers, designers, government agencies, and building contractors to improve safety performance. Particularly targeting improvements for low-scoring safety climate dimensions can translate into safety performance improvements.
This study contributes to the existing safety literature to show the construction safety situations in the low-income context. It can also indicate that the NOSACQ-50 safety climate questionnaire can be a valid tool applied in different contexts.
For future research, we would recommend a study in the small-scale construction setting as safety issues might be even worse here than in the large-scale construction industry since they lack safety officers and other budget-related constraints. Conducting a longitudinal study would be a worthy design of future research in this sector to see the time patterns of the safety climate and safety performance relationship.
Supplementary Materials
The following supporting information can be downloaded at the website of this paper posted on Preprints.org, Table S1: Explanatory Factor Analysis of SC and SP; Figure S1: Measurement Model of SC and SP.
Author Contributions
Conceptualization, TA; methodology, TA, WD, BEM; validation, TA, WD, BEM; formal analysis, TA.; investigation, TA writing—original draft preparation, TA; writing—review and editing, TAB, WD, BEM; supervision, WD, BEM; project administration, WD, BEM.; funding acquisition, WD, BEM. All authors have read and agreed to the published version of the manuscript.
Funding
This research was funded by the Norwegian Program for Capacity Building in Higher Education and Research for Development (NORHED-II Safeworkers Project) (grant number: 69181).
Institutional Review Board Statement
This study was conducted according to the guidelines of the Declaration of Helsinki and approved by the Institutional Review Board of the College of Health Science, Addis Ababa University, with protocol number 099/22/SH. Permission for this study also was obtained from the construction companies.
Informed Consent Statement
The purpose of the study was communicated to all participants, and they were informed of their right to withdraw at any time. Every participant gave their informed consent, and we ensured that their information was kept private and confidential.
Data Availability Statement
The authors are willing to provide the raw data used in this study upon request.
Acknowledgments
We highly appreciate the management teams and workers of the large-scale construction industries for their permission to conduct this study and willingness to participate in the interview.
Conflicts of Interest
The authors declare that they have no competing interests.
References
- Mandefro, H. and M. Nkhonjera, Africa Housing Finance Yearbook (AHFY). 2020.
- Partnership Ready Ethiopia: Construction. Global Business Network Program (GBN),.2020.
- Mengistu, D.G. and G. Mahesh, Challenges in developing the Ethiopian construction industry. African Journal of Science, Technology, Innovation and Development, 2019.
- FROGGATT, P. and J. A. SMILEY, THE CONCEPT OF ACCIDENT PRONENESS: A REVIEW. Brit. J. industr. Med. 1964, 21. [Google Scholar]
- Reason, J. , Human error: models and management. BMJ 2000, 320, 768–770. [Google Scholar] [CrossRef] [PubMed]
- Osei-Asibey, D. , et al. , An Examination of Causes of Accidents and Hazards in the Ghanaian Construction Industry. Open Journal of Safety Science and Technology 2021, 11, 66–88. [Google Scholar]
- Schwatka, N.V., S. Hecker, and L. M. Goldenhar, Defining and Measuring Safety Climate: A Review of the Construction Industry Literature. Ann. Occup. Hyg. 2016, 60, 537–550. [Google Scholar]
- Kines, P. , et al., Nordic Safety Climate Questionnaire (NOSACQ-50): A new tool for diagnosing occupational safety climate. International Journal of Industrial Ergonomics 2011, 41, 634–646. [Google Scholar] [CrossRef]
- Kvalheim, S.A., S. Antonsen, and S. Haugen, Safety climate as an indicator for major accident risk: can we use safety climate as an indicator on the plant level?. International Journal of disaster Risk Reduction 2016, 18, 23–31. [Google Scholar]
- Khan, K.M.I., K. Suguna, and P. N. Raghunath, A study on safety management in construction projects. International Journal of Engineering Science and Innovative Technology 2015, 4, 119–128. [Google Scholar]
- Han, B., S. Son, and S. Kim, Measuring Safety Climate in the Construction Industry: A Systematic Literature Review. Sustainability 2021, 13, 10603. [Google Scholar] [CrossRef]
- Griffin, M.A. and A. Neal, Perceptions of safety at work: A framework for linking safety climate to safety performance, knowledge, and motivation. Journal of Occupational Health Psychology 2000, 5, 347–358. [Google Scholar] [CrossRef]
- Chen, Y., B. McCabe, and D. Hyatt, Impact of individual resilience and safety climate on safety performance and psychological stress of construction workers: A case study of the Ontario construction industry. Journal of Safety Research 2017, 61, 167–176. [Google Scholar] [CrossRef]
- Ajslev, J.Z.N. , et al., Is perception of safety climate a relevant predictor for occupational accidents? A prospective cohort study among blue-collar workers. Scandinavian journal of work environment & health 2018, 44, 370–376. [Google Scholar]
- Zohar, D. , Safety climate in industrial organizations: theoretical and applied implications. Journal of Applied Psychology 1980, 65, 96–102. [Google Scholar] [CrossRef] [PubMed]
- Wu, C. , et al., Core Dimensions of the Construction Safety Climate for a Standardized Safety-Climate Measurement. Journal of Construction Engineering and Management 2015, 141. [Google Scholar] [CrossRef]
- DeArmond, S. , et al., Individual safety performance in the construction industry: Development and validation of two short scales. Accident Analysis and prevention 2011, 43, 948–954. [Google Scholar] [CrossRef] [PubMed]
- Borman, W.C. and S.J. Motowidlo, Expanding the criterion domain to include elements of contextual performance. In N. Schmitt, W. C. Borman, & Associates (Eds.), Personnel selection in organizations (pp. 71-98). San Francisco: Jossey-Bass. 1993.
- Neal, A., M. A. Griffin, and P.M. Hart, The impact of organizational climate on safety climate and individual behavior. Safety Science 2000, 34, 99–109. [Google Scholar] [CrossRef]
- Hon, C.K., A. P. Chan, and M.C. Yam, Relationships between safety climate and safety performance of building repair, maintenance, minor alteration, and addition (RMAA) works. Safety Science 2014, 65, 10–19. [Google Scholar] [CrossRef]
- Christian, M.S. , et al. , Workplace safety: A meta-analysis of the roles of person and situation factors. Journal of Applied Psychology 2009, 94, 1103–1127. [Google Scholar]
- Hertanto, A. , et al., Relationship between Safety Climate and Safety Behavior in Company X in Indonesia. Safety Science 2023, 9. [Google Scholar]
- Clarke, S. , The relationship between safety climate and safety performance: a meta-analytic review. J Occup Health Psychol 2006, 11, 315–327. [Google Scholar] [CrossRef]
- Neal, A. and M.A. Griffin, A study of the lagged relationships among safety climate, safety motivation, safety behavior, and accidents at the individual and group levels. Journal of Applied 2006, 91, 946–953. [Google Scholar]
- Yosef, T., E. Sineshaw, and N. Shifera, Occupational injuries and contributing factors among industry park construction workers in Northwest Ethiopia. Front. Public Health 2023, 10. [Google Scholar] [CrossRef] [PubMed]
- Berhanu, F., M. Gebrehiwot, and Z. Gizaw, Workplace injury and associated factors among construction workers in Gondar town, Northwest Ethiopia. BMC Musculoskeletal Disorders 2019, 20. [Google Scholar] [CrossRef] [PubMed]
- Nadhim, E.A. , et al., Investigating the Relationships between Safety Climate and Safety Performance Indicators in Retrofitting Works. Construction Economics and Building 2018, 18, 110–129. [Google Scholar] [CrossRef]
- Yousefi, Y. , et al., Validity Assessment of the Persian Version of the Nordic Safety Climate Questionnaire (NOSACQ-50): A Case Study in a Steel Company. Safety and Health at Work 2016, 7, 326e330. [Google Scholar] [CrossRef] [PubMed]
- Marin, L.S. , et al., Perceptions of safety climate across construction personnel: Associations with injury rates. Safety Science 2019, 118, 487–496. [Google Scholar] [CrossRef]
- Kines, P. , NOSACQ-50 - Safety Climate Questionnaire [online] NRCWE: National Research Centre for the Working Environment 2017.
- NFA, How to use NOSACQ-50. Interpreting the Nordic Occupational Safety Climate Questionnaire NOSACQ50 results (2017, February 27). Nationale Forskningscenter for Arbejdsmiljø (NFA) (National Research Centre for the Working Environment). 2017.
- Mohamed, S. , Safety climate in construction site environments. J. Constr. Eng. Manag. 2002, 128, 375–384. [Google Scholar] [CrossRef]
- Blunch, N.J. , Introduction to Structural Equation Modelling Using SPSS and AMOS. 2008.
- Thakkar, J.J. , Structural Equation Modelling Application for Research and Practice (with AMOS and R). 2020.
- Hair, J.F.J. , et al., Multivariate Data Analysis. 2010, 7th ed.; Pearson Prentice Hall: Upper Saddle River, NJ, USA.
- Alamoudi, M. , The Integration of NOSACQ-50 with Importance-Performance Analysis Technique to Evaluate and Analyze Safety Climate Dimensions in the Construction Sector in Saudi Arabia. Buildings, 2022, 12. [Google Scholar] [CrossRef]
- Zahoor, H. , et al., Modeling the Relationship between Safety Climate and Safety Performance in a Developing Construction Industry: A Cross-Cultural Validation Study. Int. J. Environ. Res. Public Health 2017, 14, 351. [Google Scholar] [CrossRef]
- Lappalainen, J. , Measuring Safety Climate in Shipping Companies. Journal of Maritime Research 2017, XIV, 19–26. [Google Scholar]
Figure 1.
Conceptual and hypothesized model relating to safety climate and safety performance. SC=Safety climate, SP= Safety performance, OI= Occupational injury, H= Hypothesis, (+) = positive relation, (-) negative relation.
Figure 1.
Conceptual and hypothesized model relating to safety climate and safety performance. SC=Safety climate, SP= Safety performance, OI= Occupational injury, H= Hypothesis, (+) = positive relation, (-) negative relation.
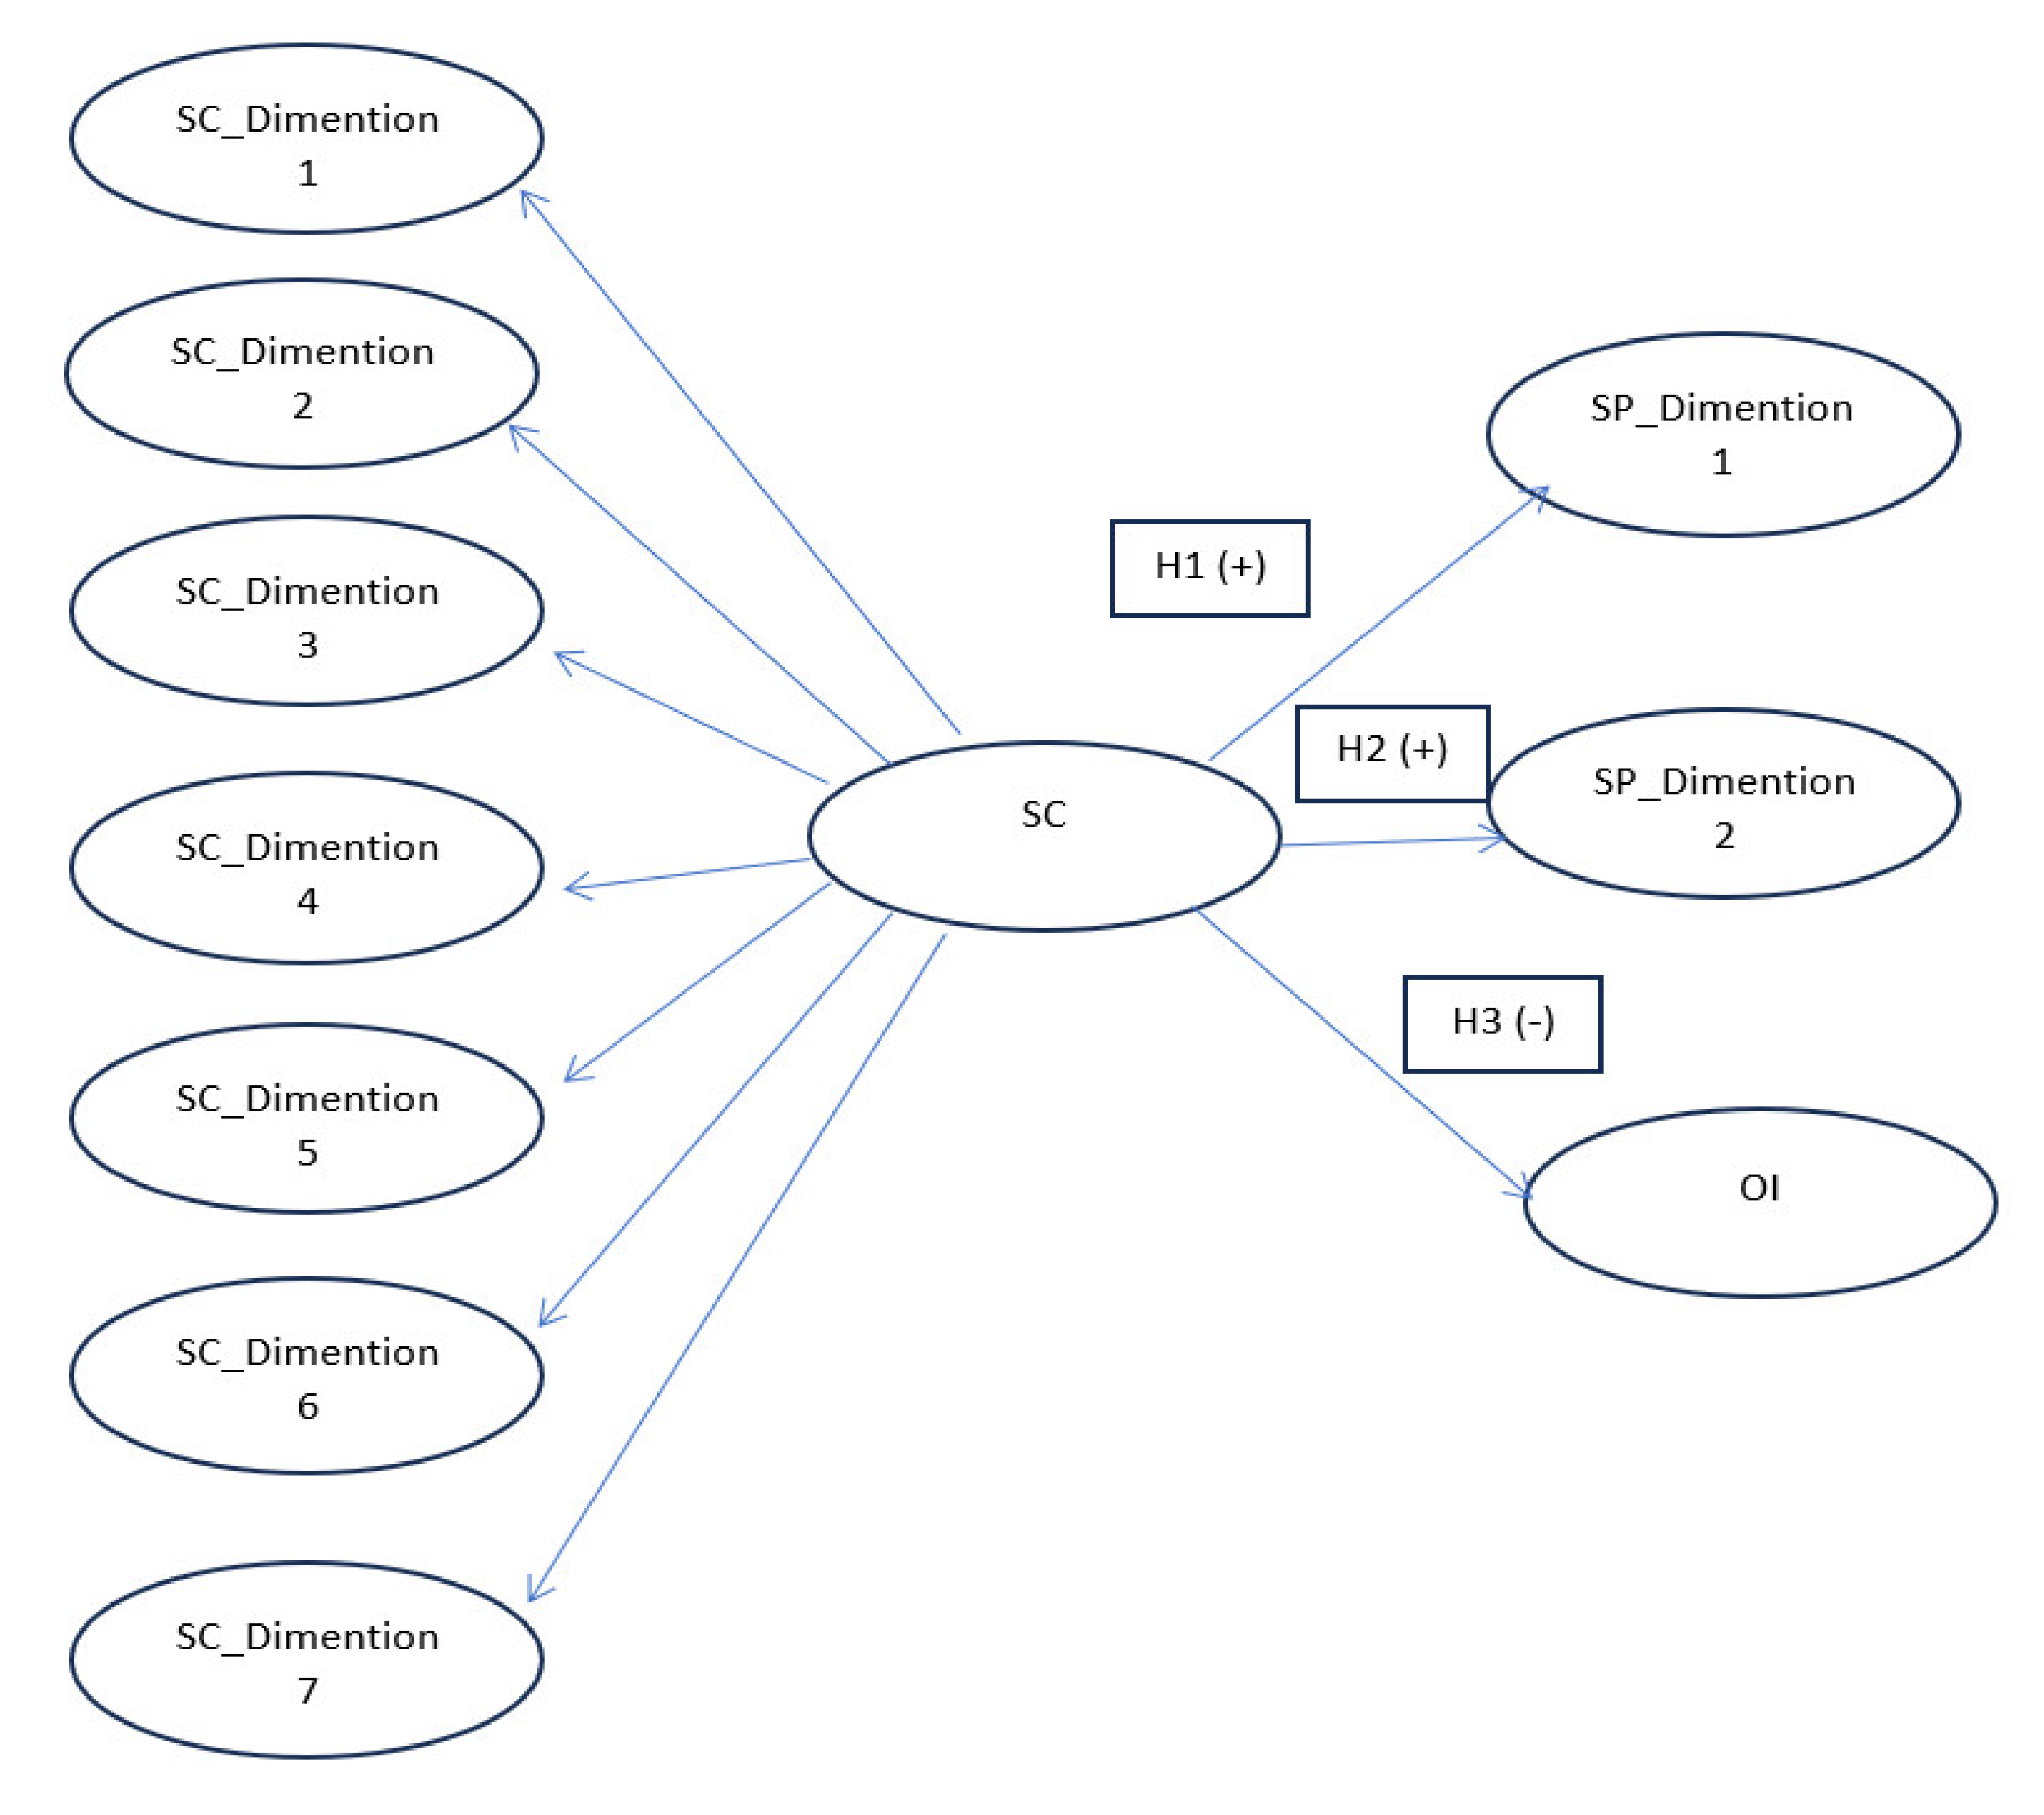
Figure 2.
Structural equation model of SC and SP (same as earlier, tell the inspiration).
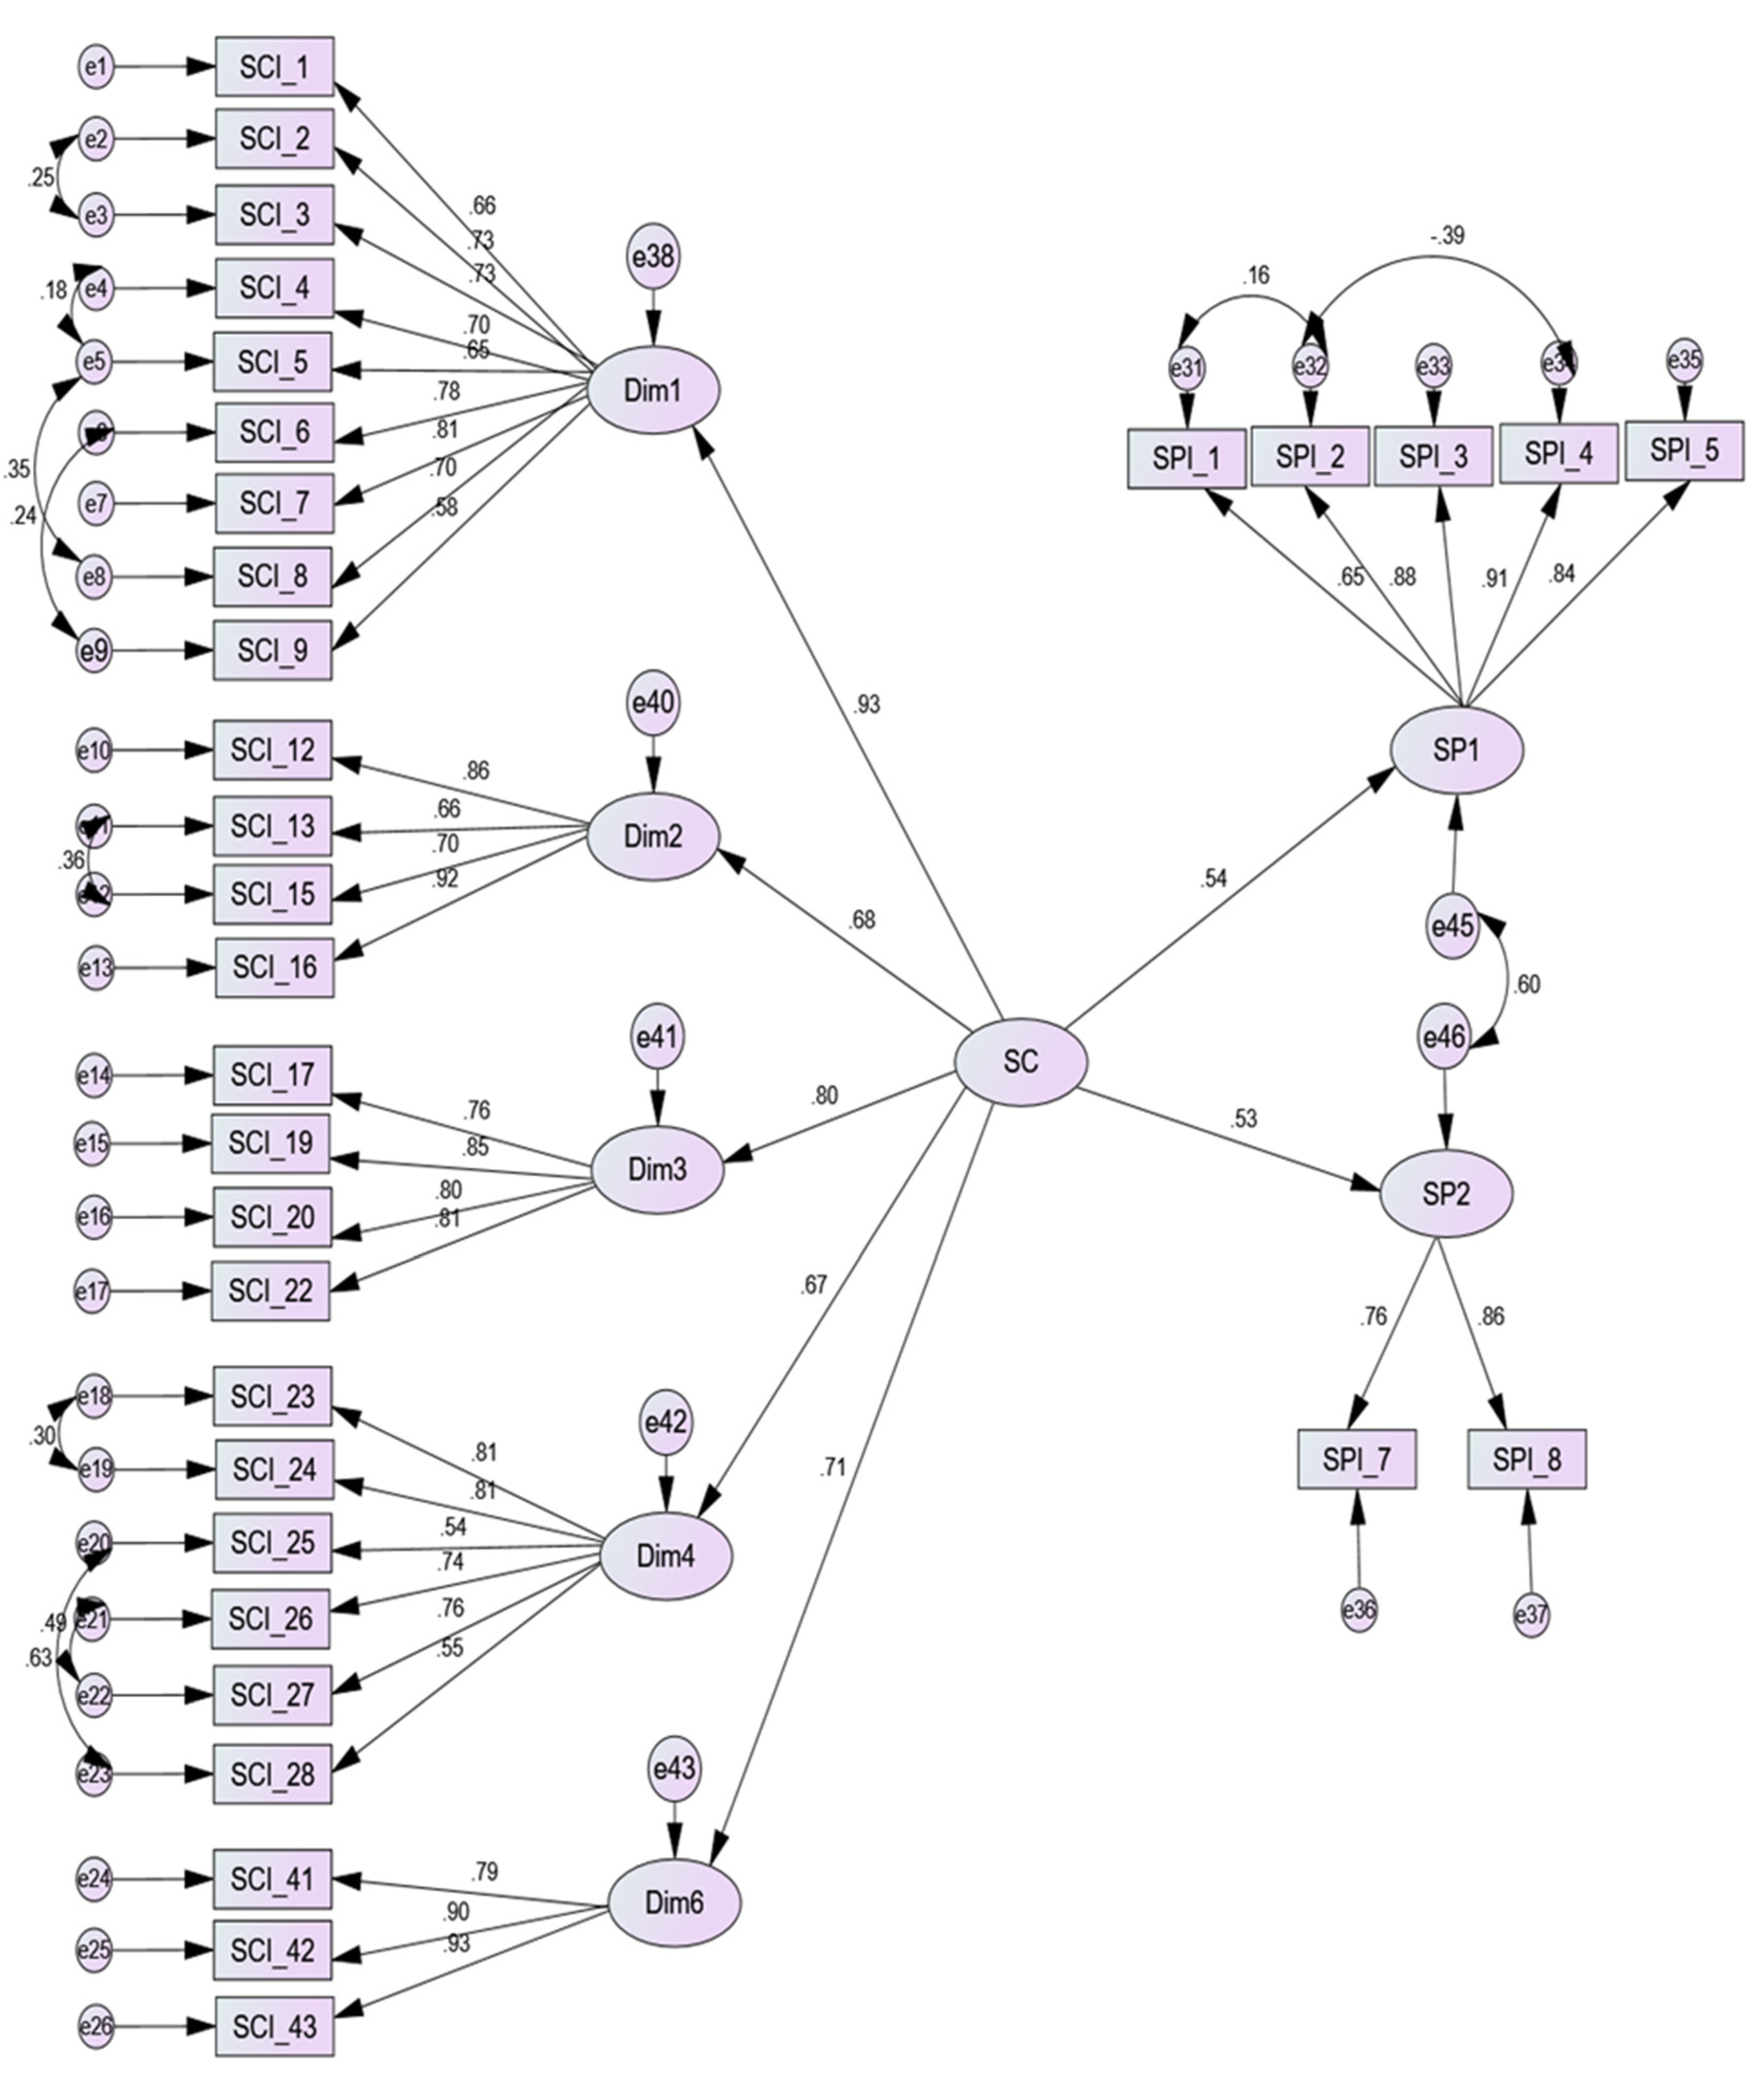
Figure 3.
Structural equation model of SC and SP among management groups.
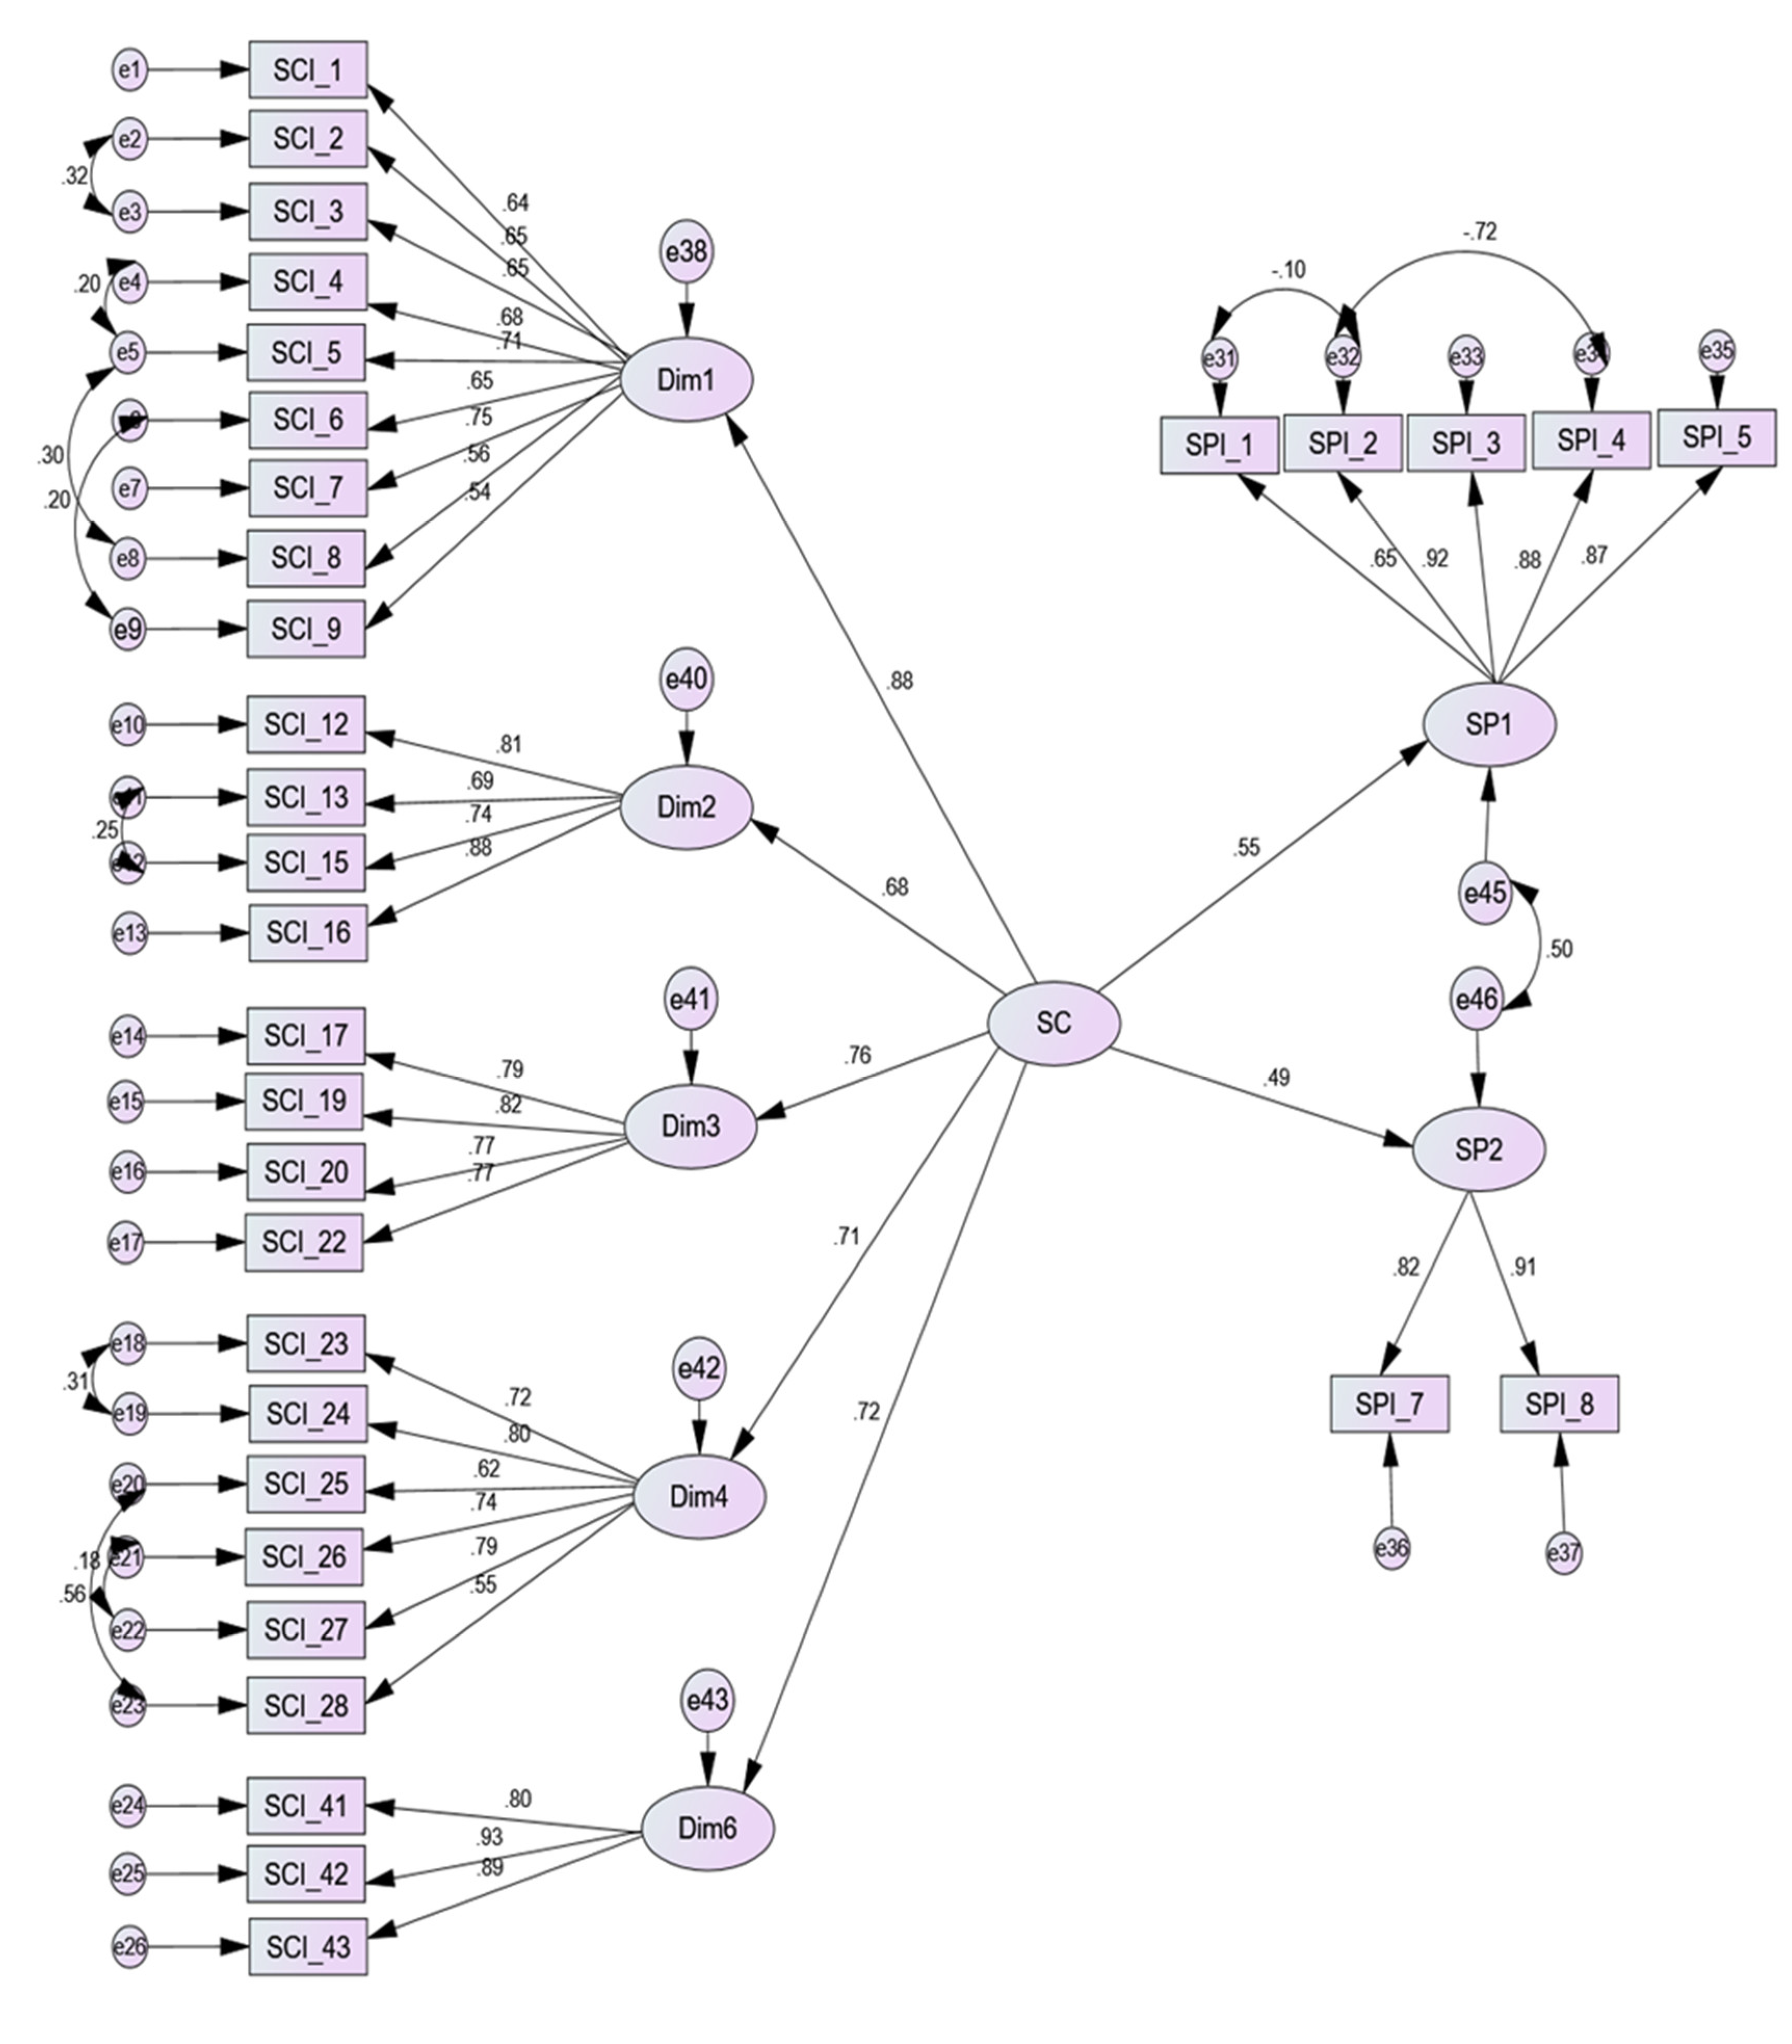
Figure 4.
Structural equation model of SC and SP among work groups.
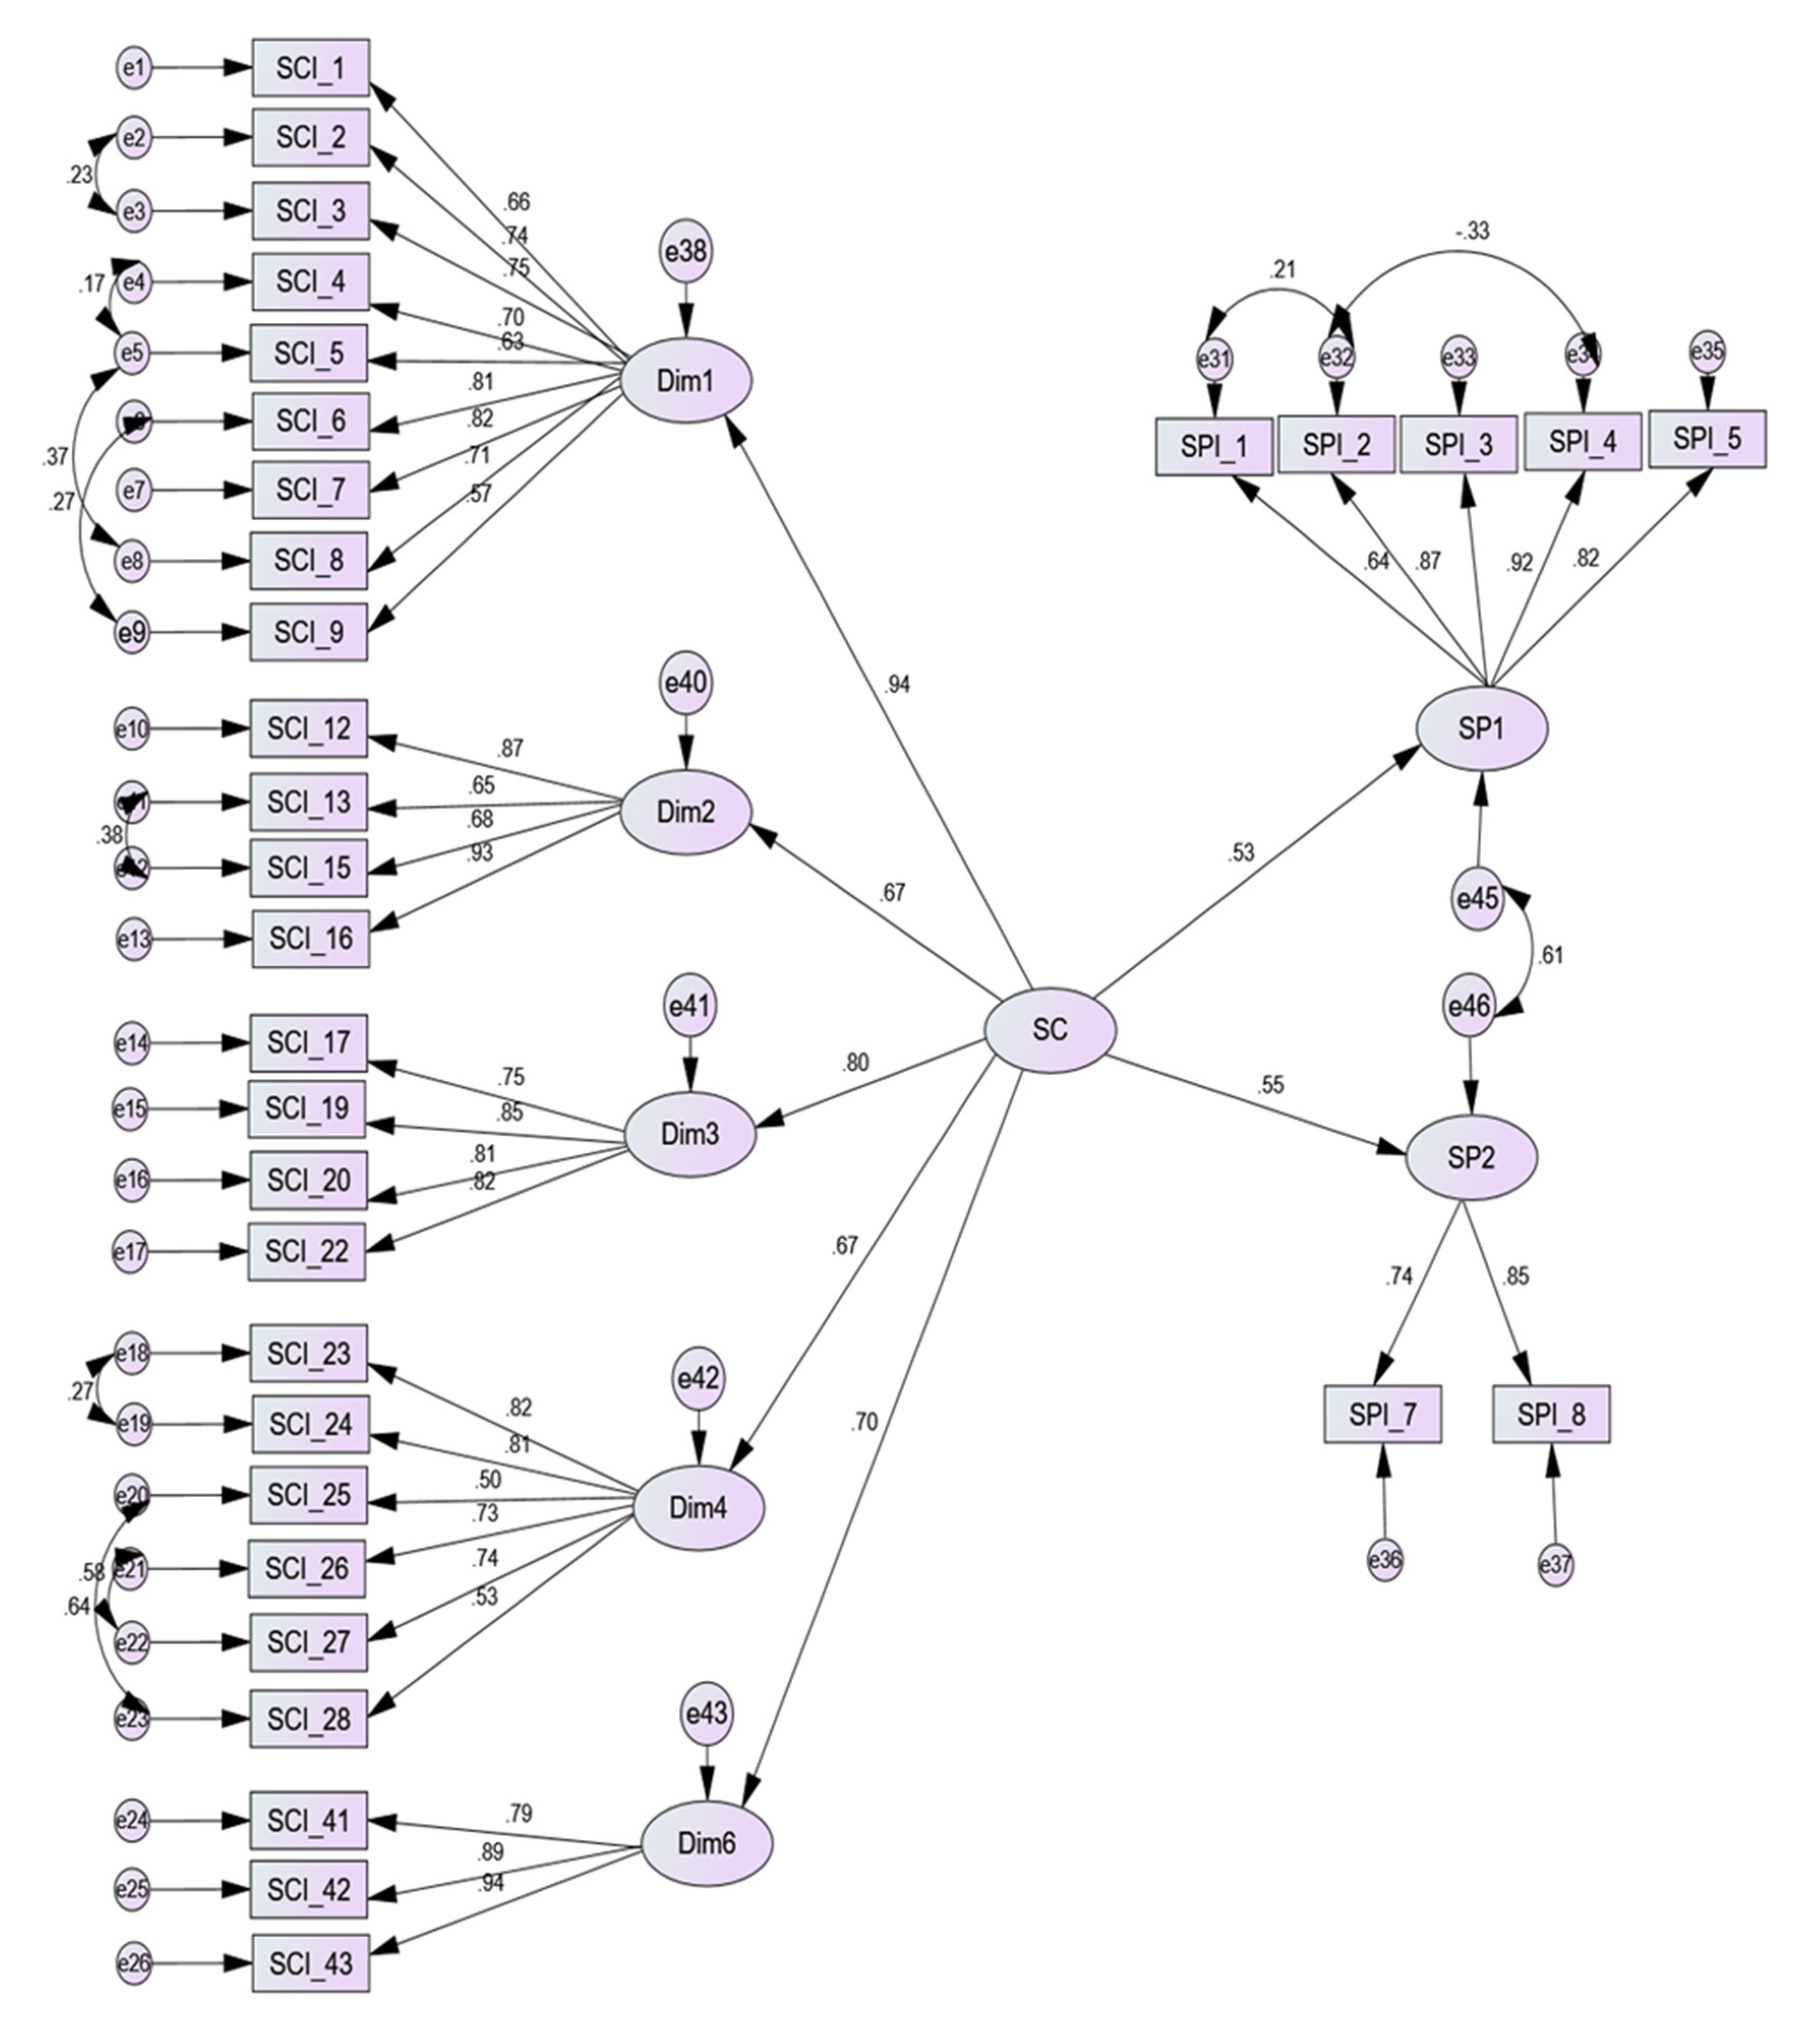

Table 1.
Socio-demographic characteristics of large-scale construction industry workers.
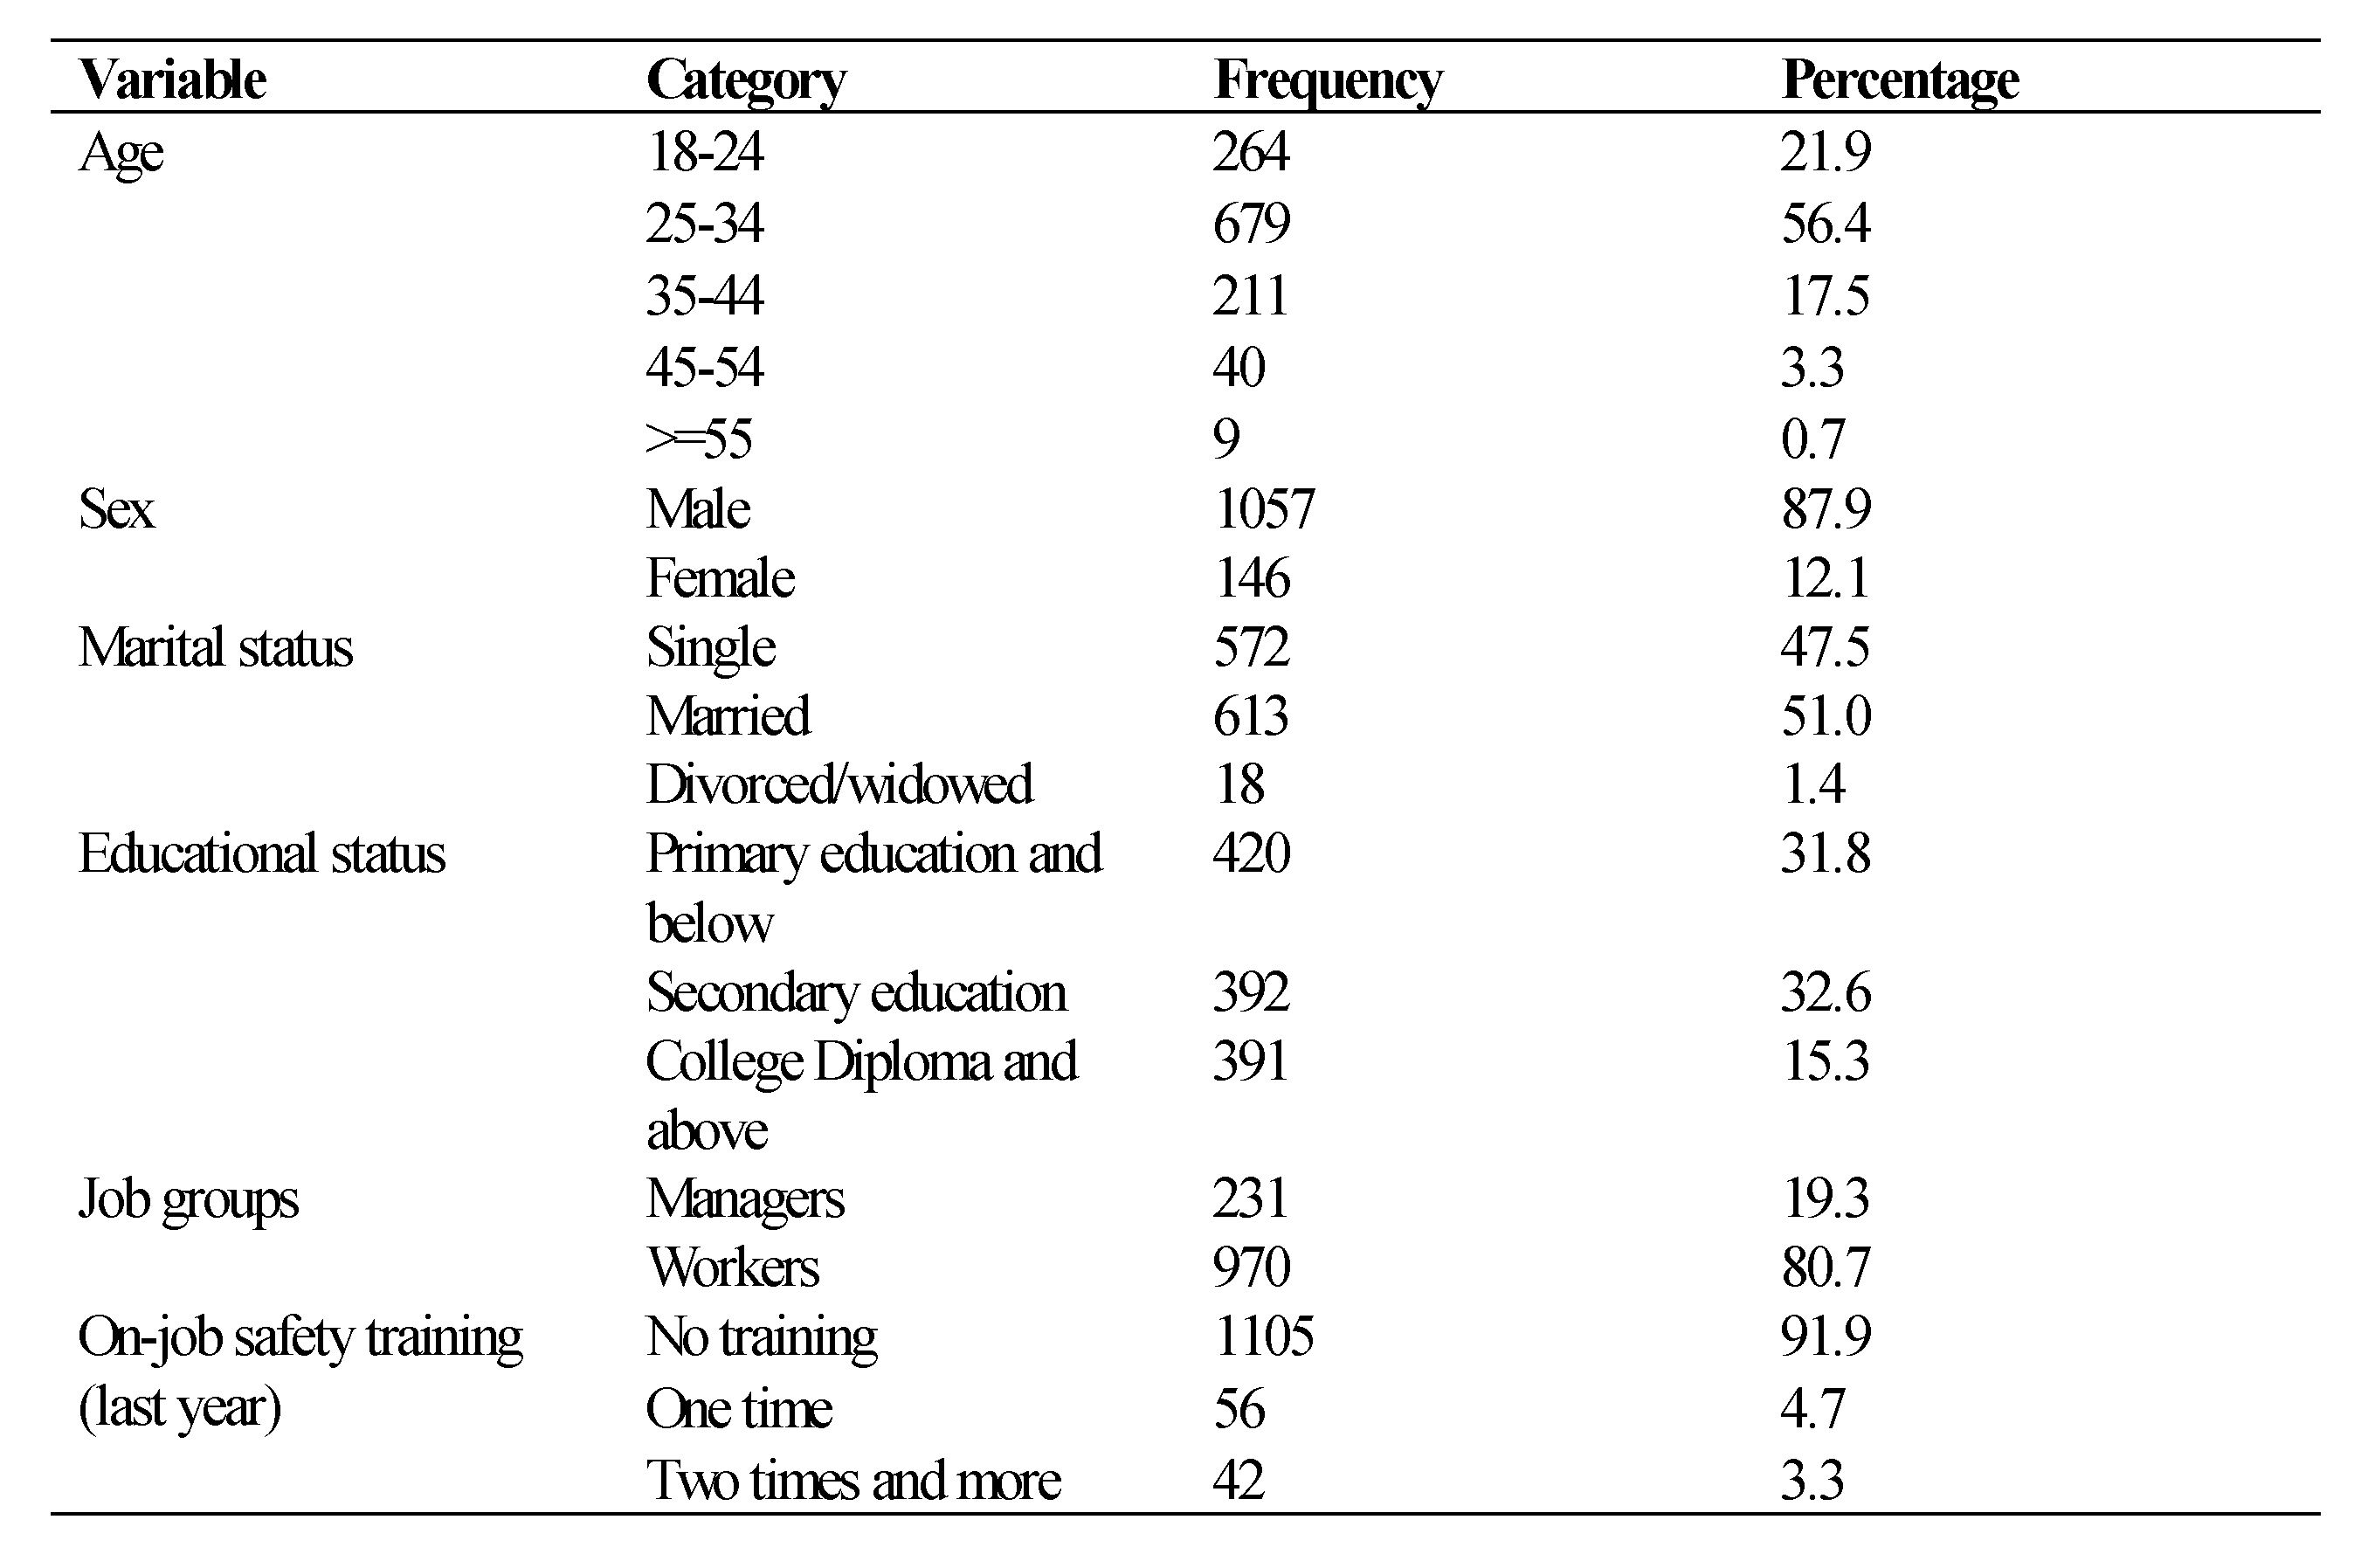
Table 2.
Mean, Standard deviation, and Correlation of the safety climate and safety performance dimensions.
Table 2.
Mean, Standard deviation, and Correlation of the safety climate and safety performance dimensions.
| Dimensions | Mean | SD | Correlations | |||||||||
|---|---|---|---|---|---|---|---|---|---|---|---|---|
| Dim_1 | Dim_2 | Dim_3 | Dim_4 | Dim_5 | Dim_6 | Dim_7 | SP_1 | SP_2 | OI | |||
| Dim_1 | 2.54 | .565 | 1 | |||||||||
| Dim_2 | 2.33 | .578 | .770** | 1 | ||||||||
| Dim_3 | 2.71 | .552 | .726** | .644** | 1 | |||||||
| Dim_4 | 3.01 | .444 | .386** | .262** | .334** | 1 | ||||||
| Dim_5 | 2.52 | .449 | .552** | .477** | .543** | .396** | 1 | |||||
| Dim_6 | 2.71 | .353 | .583** | .553** | .518** | .519** | .407** | 1 | ||||
| Dim_7 | 3.08 | .350 | -.015 | -.045 | .044 | .155** | -.049 | .034 | 1 | |||
| SP_1 | 2.95 | .970 | .468** | .444** | .382** | .241** | .377** | .415** | -.124** | 1 | ||
| SP_2 | 3.43 | .715 | .518** | .471** | .424** | .364** | .372** | .498** | -.067* | .684** | 1 | |
| OI | .45 | .708 | -.221** | -.172** | -.230** | -.116** | -.202** | -.159** | .139** | -.229** | -.278** | 1 |
** Correlation is significant at the 0.01 level (2-tailed). *Correlation is significant at the 0.05 level (2-tailed). Dim_1 to Dim_7 are safety climate dimensions; SP_1, SP_2 and OI are Safety performance dimensions.
Table 3.
Comparison of NOSACQ-50 dimensions in this study and the grand database based on the role of workers.
Table 3.
Comparison of NOSACQ-50 dimensions in this study and the grand database based on the role of workers.
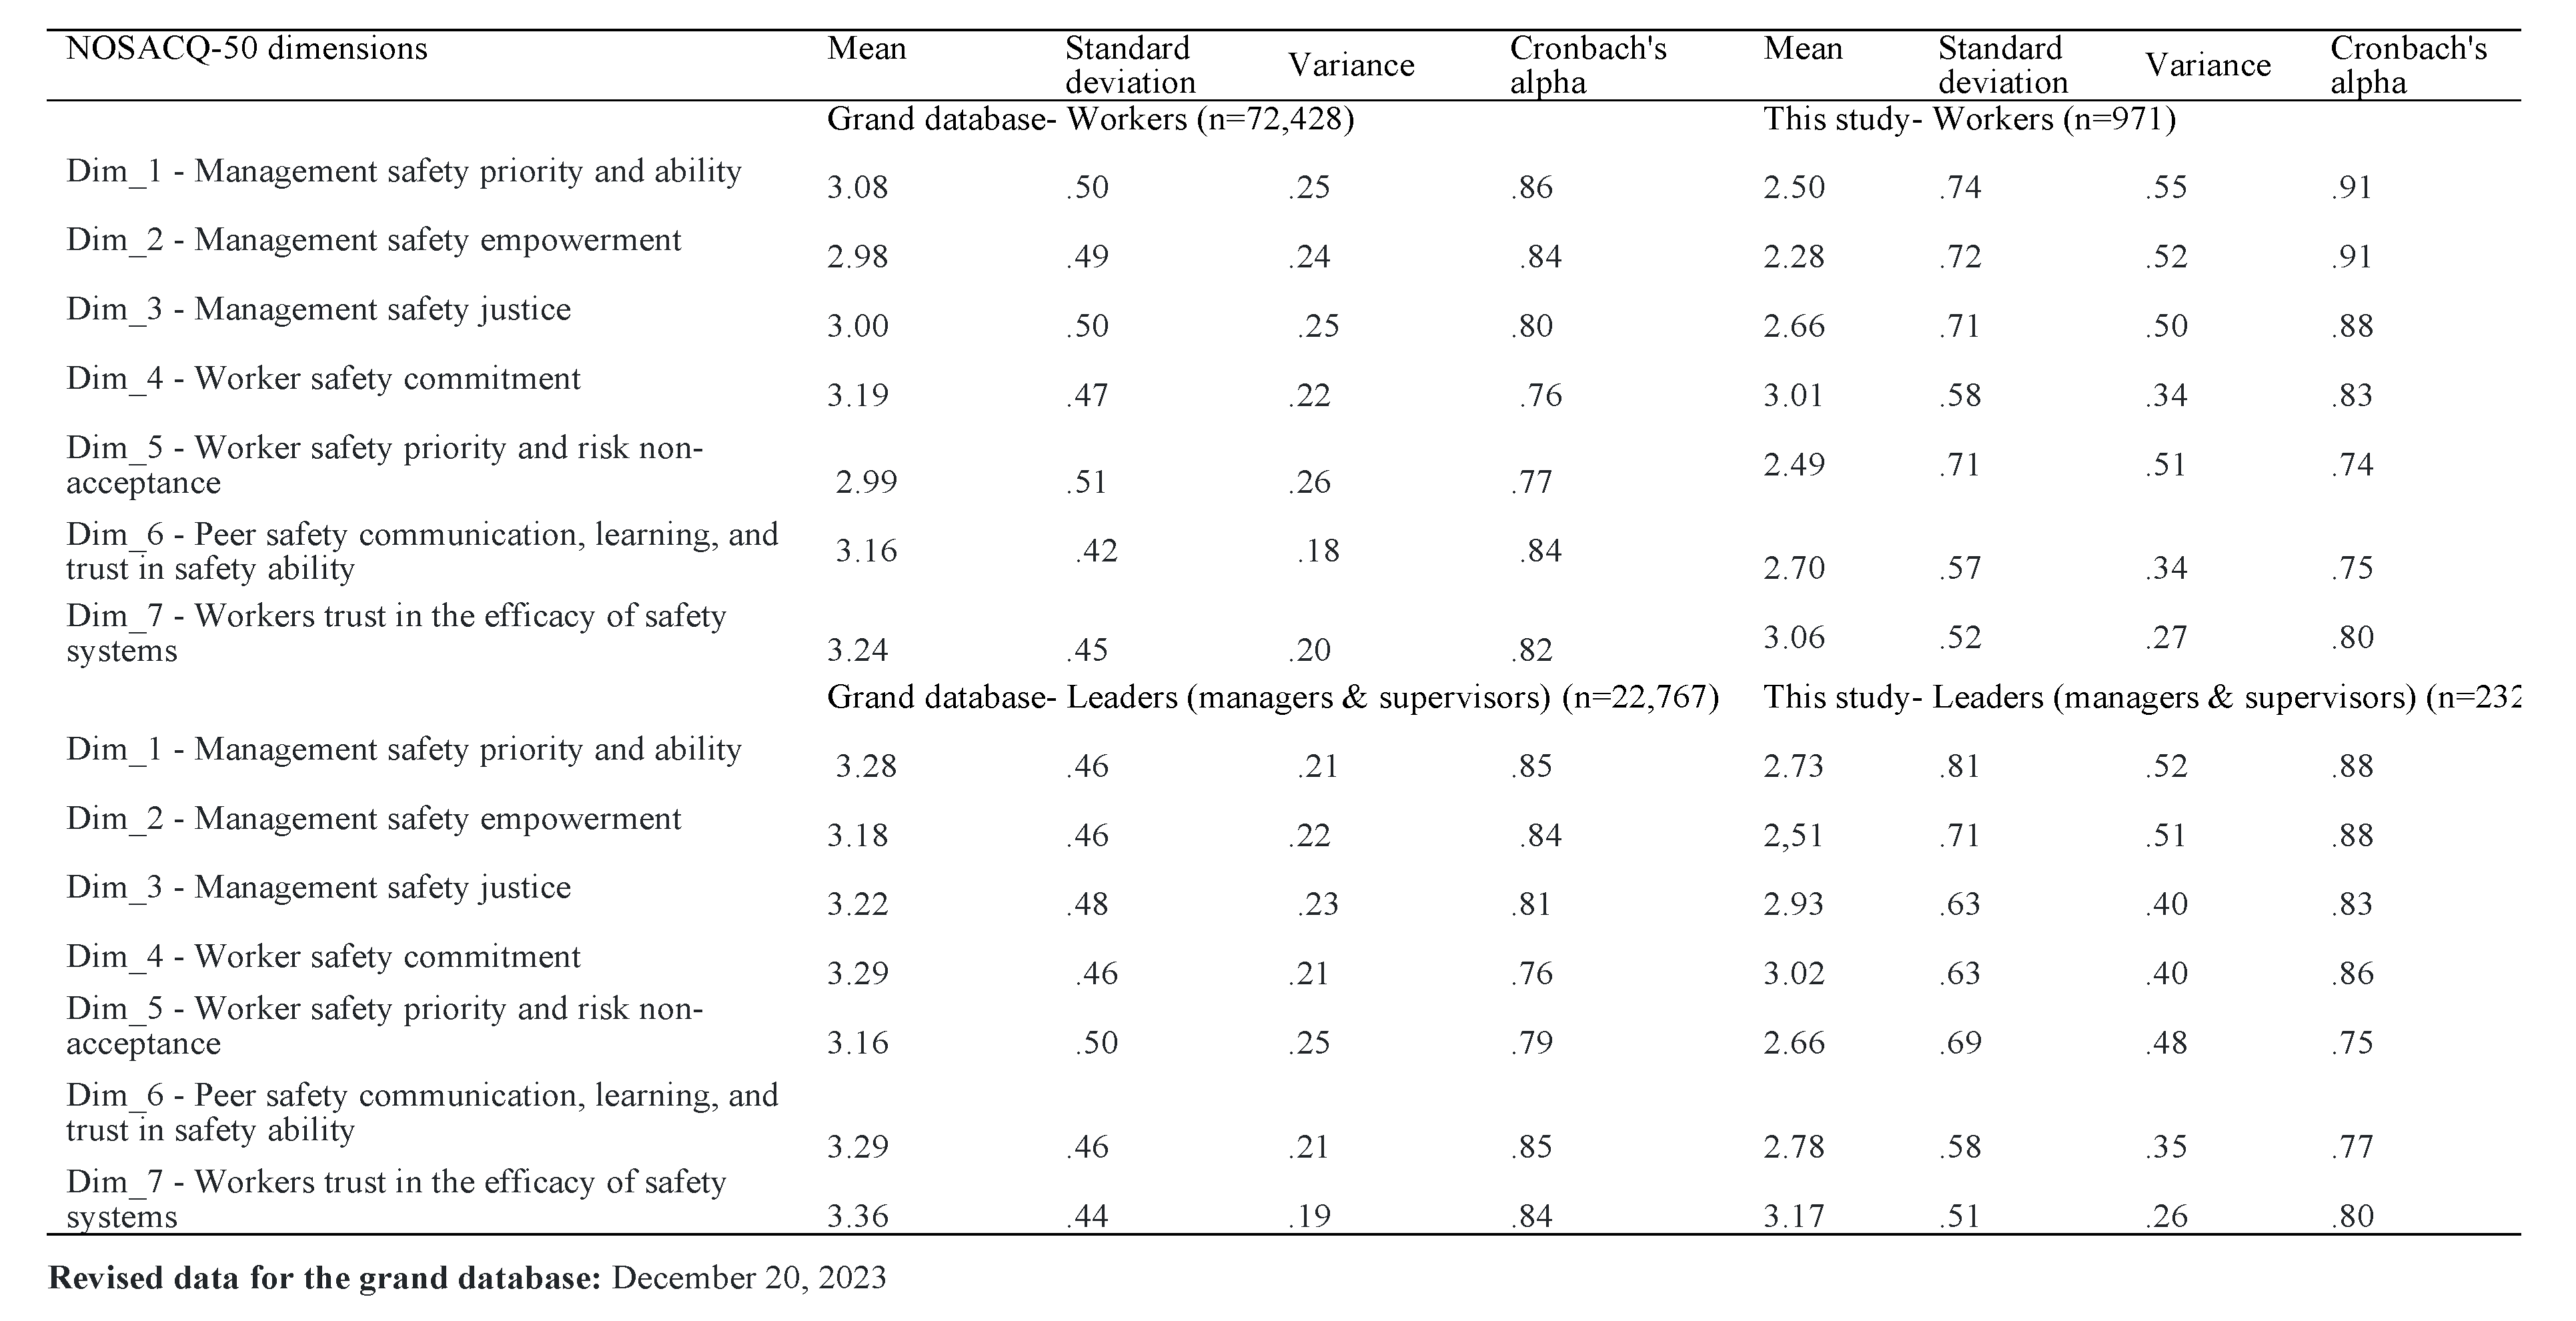
Table 4.
Results of Kaiser-Meyer-Olkin (KMO) and Bartlett Test for Safety Climate and Safety Behavior Dimensions.
Table 4.
Results of Kaiser-Meyer-Olkin (KMO) and Bartlett Test for Safety Climate and Safety Behavior Dimensions.
| Dimension | Safety Climate | Safety Behavior | Both | |
|---|---|---|---|---|
| Kaiser–Meyer–Olkin (measure of sampling adequacy) | .943 | .895 | .947 | |
| Bartlett’s Sphericity Test | Chi-squared Distribution Approximation | 34750.121 | 6717.851 | 43156.239 |
| Degree of Freedom | 1225 | 36 | 1711 | |
| Significance | p = 0.000 | p = 0.000 | p = 0.000 | |
Table 5.
Confirmatory factor analysis of SC and SP measurement model.
| Factors and Items | Standardized factor loadings | Standard error | z-value | p-value | |
|---|---|---|---|---|---|
| Dim 1 | SCI_1 | .662 | |||
| SCI_2 | .728 | .042 | 28.338 | *** | |
| SCI_3 | .732 | .043 | 28.537 | *** | |
| SCI_4 | .702 | .051 | 26.994 | *** | |
| SCI_5 | .654 | .047 | 24.511 | *** | |
| SCI_6 | .782 | .040 | 31.440 | *** | |
| SCI_7 | .807 | .039 | 32.953 | *** | |
| SCI_8 | .700 | .043 | 26.888 | *** | |
| SCI_9 | .579 | .043 | 21.042 | *** | |
| Dim2 | |||||
| SCI_12 | .863 | ||||
| SCI_13 | .664 | .031 | 26.083 | *** | |
| SCI_15 | .699 | .029 | 28.140 | *** | |
| SCI_16 | .920 | .025 | 42.155 | *** | |
| Dim3 | |||||
| SCI_17 | .762 | ||||
| SCI_19 | .846 | .031 | 34.991 | *** | |
| SCI_20 | .805 | .033 | 32.455 | *** | |
| SCI_22 | .815 | .031 | 33.055 | *** | |
| Dim4 | |||||
| SCI_23 | .805 | ||||
| SCI_24 | .810 | .025 | 36.385 | *** | |
| SCI_25 | .538 | .035 | 18.070 | *** | |
| SCI_26 | .744 | .025 | 24.887 | *** | |
| SCI_27 | .765 | .026 | 25.680 | *** | |
| SCI_28 | .547 | .033 | 18.405 | *** | |
| Dim6 | |||||
| SCI_41 | .793 | ||||
| SCI_42 | .897 | .026 | 39.661 | *** | |
| SCI_43 | .926 | .026 | 41.458 | *** | |
| SP1 | |||||
| SPI_1 | .662 | ||||
| SPI_5 | .835 | .044 | 29.127 | *** | |
| SPI_4 | .912 | .043 | 31.813 | *** | |
| SPI_3 | .890 | .044 | 31.115 | *** | |
| SPI_2 | .881 | .041 | 32.601 | *** | |
| SP2 | |||||
| SPI_7 | .761 | ||||
| SPI_8 | .862 | .041 | 27.417 | *** | |
Table 6.
Goodness-of-fit statistics in confirmatory factor analysis.
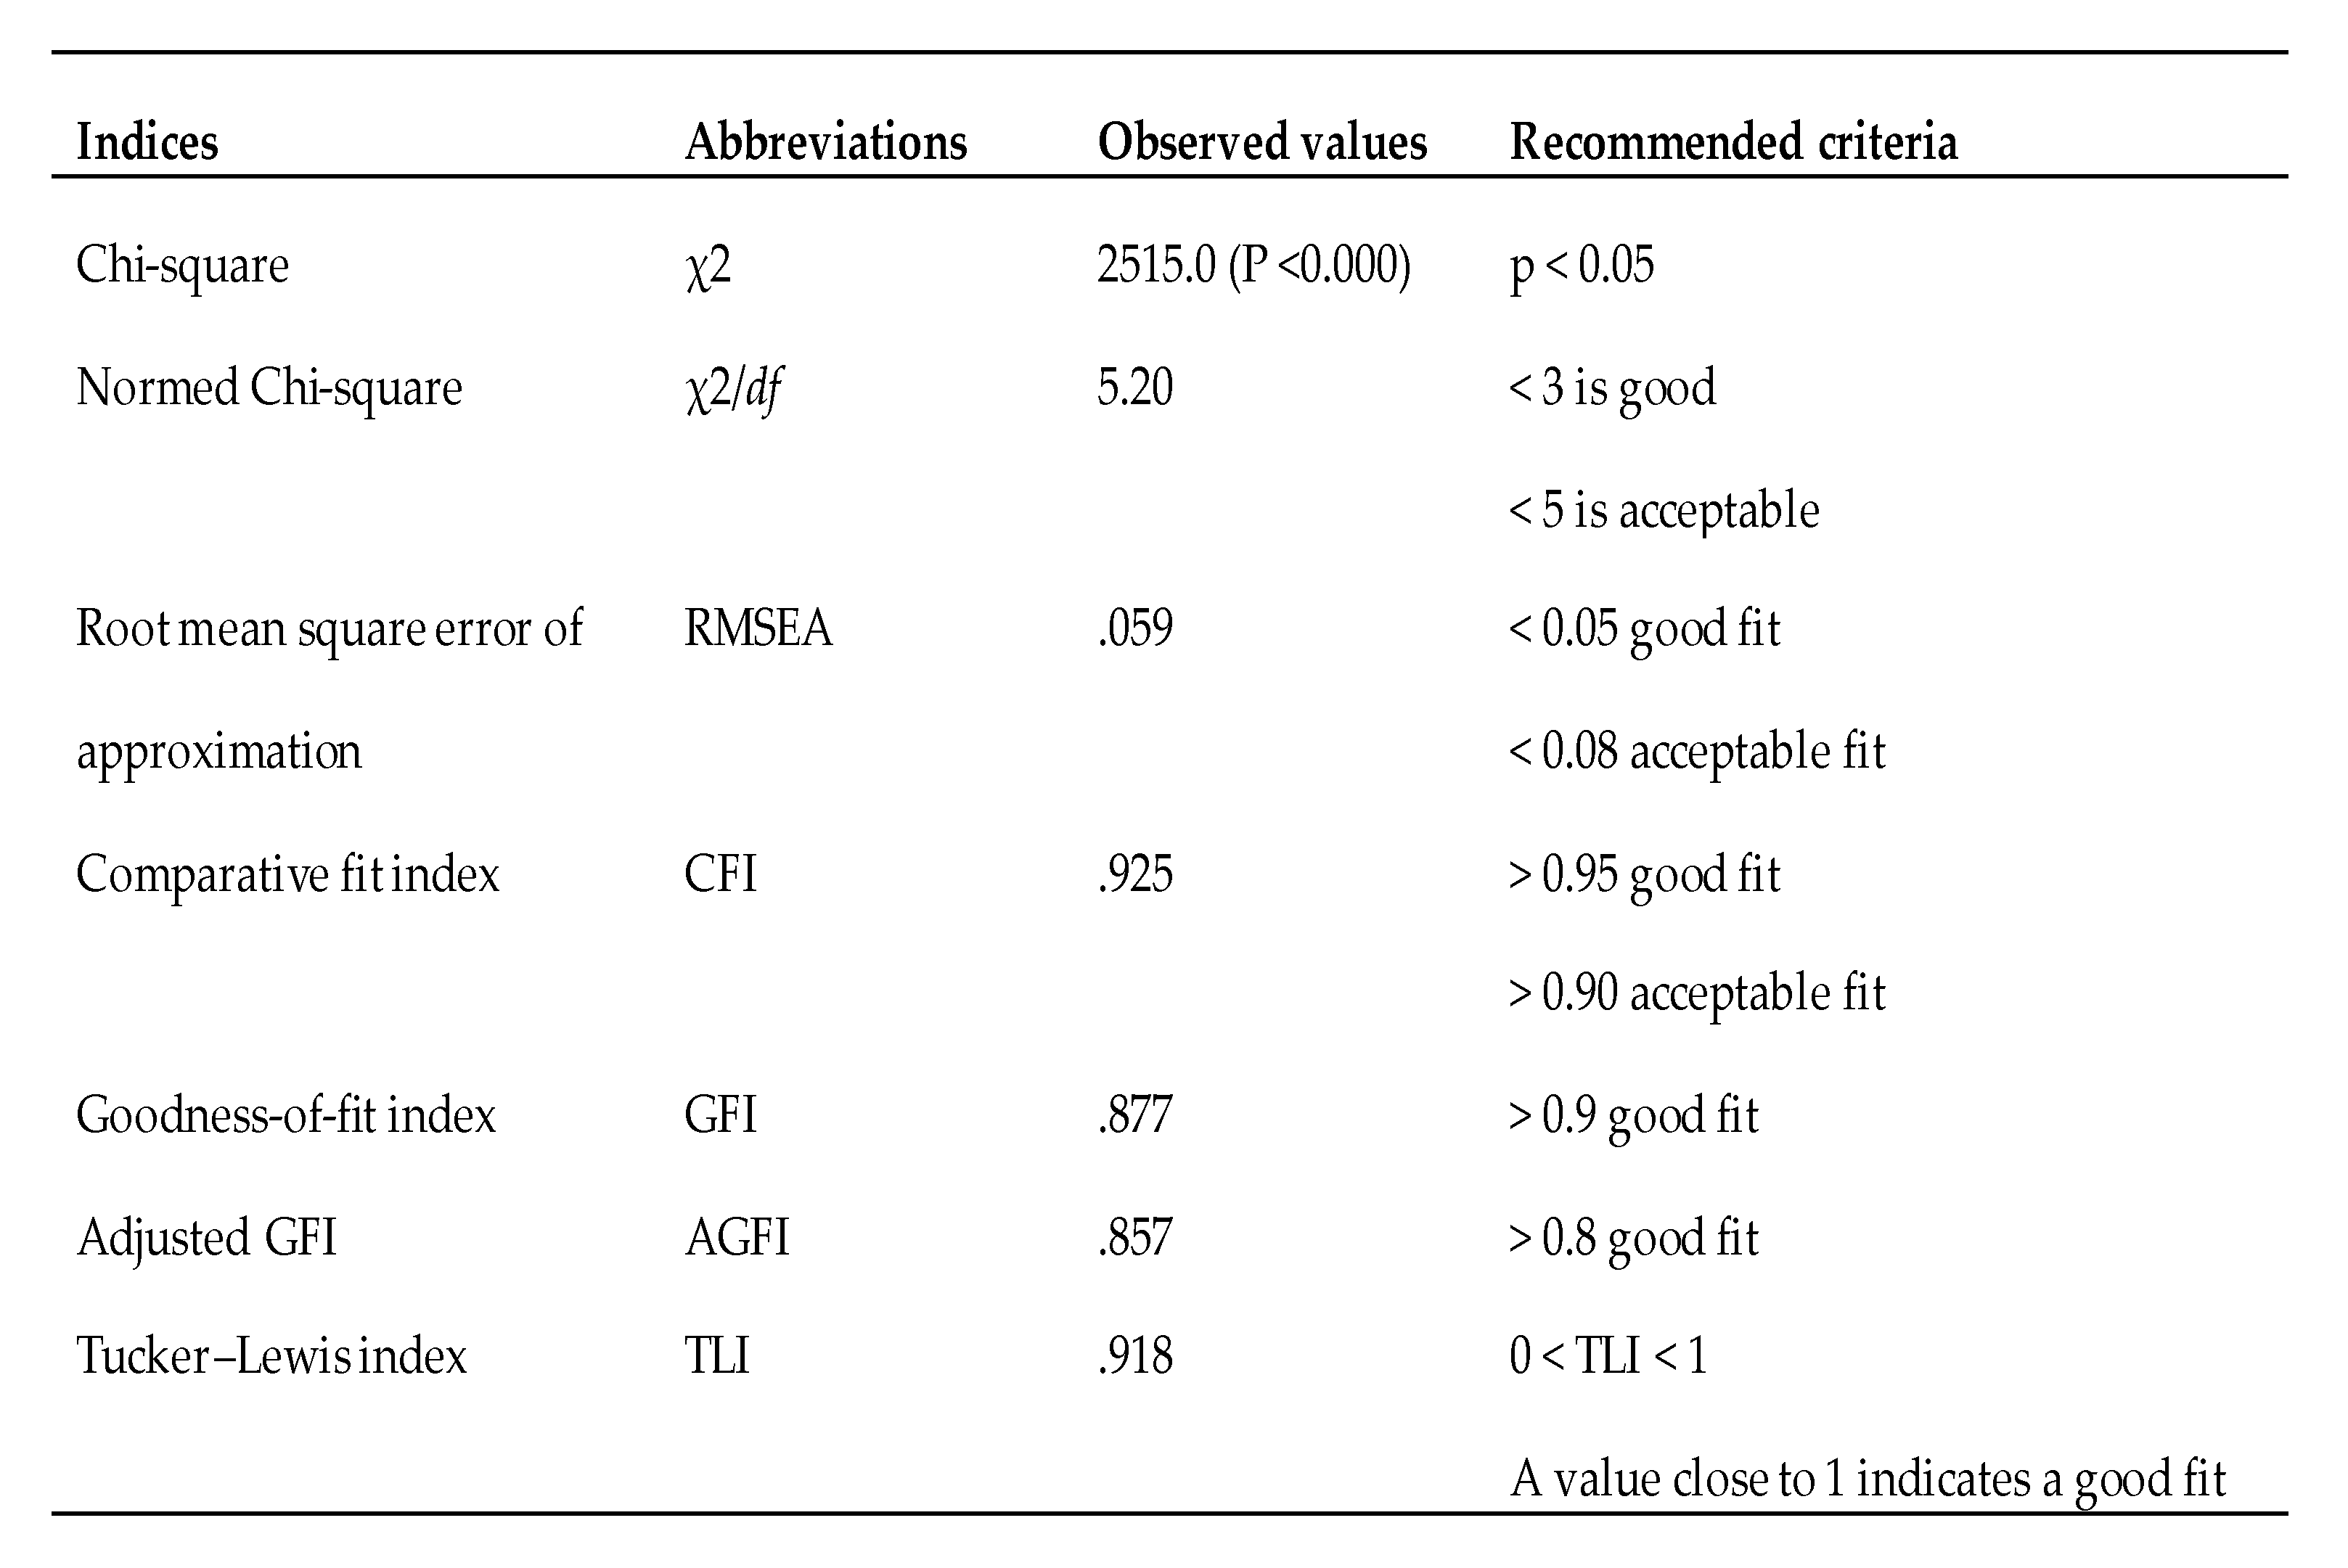
Table 7.
Validity and reliability of the CFA.
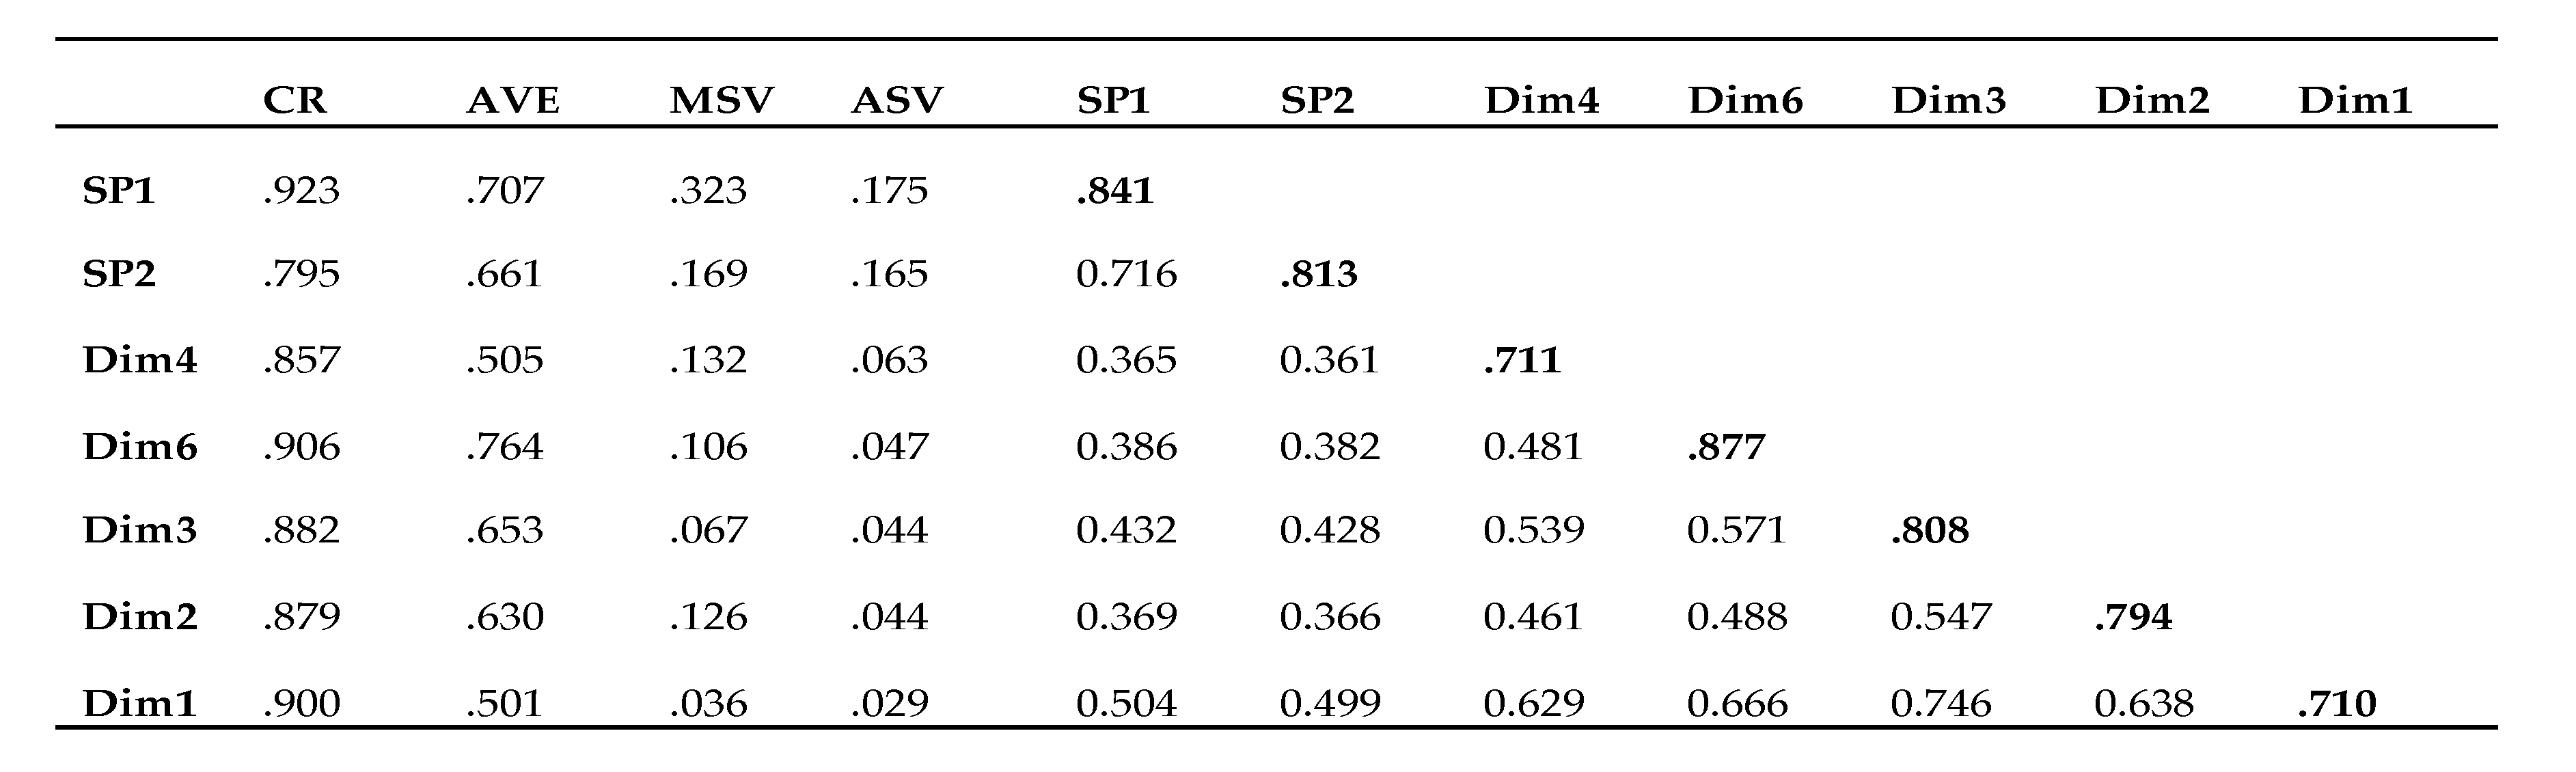
CR: Composite Reliability, AVE: Average Variance Extracted, MSV: Maximum Shared Variances, ASV: Average Shared Variances.
Table 8.
Confirmatory factor analysis of SC and SP structural model and explained variance. Bentler–Raykov Squared Multiple Correlation Coefficient.
Table 8.
Confirmatory factor analysis of SC and SP structural model and explained variance. Bentler–Raykov Squared Multiple Correlation Coefficient.
Disclaimer/Publisher’s Note: The statements, opinions and data contained in all publications are solely those of the individual author(s) and contributor(s) and not of MDPI and/or the editor(s). MDPI and/or the editor(s) disclaim responsibility for any injury to people or property resulting from any ideas, methods, instructions or products referred to in the content. |
© 2024 by the authors. Licensee MDPI, Basel, Switzerland. This article is an open access article distributed under the terms and conditions of the Creative Commons Attribution (CC BY) license (http://creativecommons.org/licenses/by/4.0/).
Copyright: This open access article is published under a Creative Commons CC BY 4.0 license, which permit the free download, distribution, and reuse, provided that the author and preprint are cited in any reuse.


