
Submitted:
07 November 2024
Posted:
07 November 2024
You are already at the latest version
Abstract
This study proposes indicators based on urban, demographic, and hydrological parameters to assess the effectiveness of low-impact development (LID) techniques, such as rooftop rainwater harvesting, aimed at reducing water scarcity in a residential area vulnerable to water shortages in a semi-arid city in the Global South. In the study area, the necessary water demand is identified according to land use requirements established by national and local regulations, and an urban configuration pinpoints spaces suitable for rainwater harvesting for self-consumption. Additionally, hydrological design conditions are defined to evaluate the potential volumes of recoverable water. Accordingly, indicators of infiltrated water, availabel water for consumption, runoff water, and sufficient water are established, enabling the proposal of strategies to mitigate water scarcity and enhance water management.
Keywords:
green and blue infrastructure
; water scarcity
; water management
; urban indicators
; flooding mitigation
1. Introduction
Water management in urban areas, particularly in semi-arid climates, faces significant challenges due to the rapid growth of cities and the impacts of climate change. These areas, characterized by a combination of water scarcity and vulnerability to extreme events such as flooding, urgently require a reassessment of their water management strategies [1,2]. The Global South, consisting of developing countries, is a region where similar conditions are widely shared [3]. Within this region, particularly in Latin America, these problems are exacerbated by accelerated urbanization, social and economic inequality, and inadequate water infrastructure that contribute to both water shortages and flood risks [4,5].
In this context, the challenges and opportunities for rapidly growing cities in the Global South lie in adopting innovative and sustainable solutions to address water management issues. The lack of adequate planning and uncontrolled urban development have increased water demand, exerting significant pressure on local resources and deteriorating the quantity and quality of available water [6]. Global organizations such as UNESCO and UN-Habitat have proposed various strategies for integrating urban plans that adapt to climate change [7], implementing resilient water management policies to minimize impervious areas that promote water retention and aquifer recharge, rainwater harvesting, and raising public awareness about efficient water use [8]. These conditions present an opportunity to integrate approaches that combine traditional gray infrastructure with low-impact development (LID) techniques, which have proven effective in enhancing urban resilience to water scarcity and flooding [9,10].
LID strategies, such as rain gardens, permeable pavements, and green rooftops, have been applied in maximizing water infiltration and reducing surface runoff, thereby minimizing flood risks in densely populated urban areas. These interventions have improved the soil’s absorption capacity and filtered water quality, benefiting local ecosystems and reducing the load on traditional drainage systems [11,12]. The multifunctionality of LID has proven effective in various cases. In Mexico City, Philadelphia, and Buenos Aires, the implementation of rain gardens, permeable pavements, and green rooftops has enhanced water infiltration, reduced surface runoff, and facilitated aquifer recharge [9,13,14,15]. Seoul and Sydney have also adopted these techniques to reduce flooding and manage stormwater sustainably, decreasing the demand for traditional potable water sources and improving urban water resilience [12,16]. In Santiago, Chile, the combination of green rooftops and permeable pavements in residential areas has improved stormwater management and reduced the urban heat island effect, demonstrating the multifunctional benefits of these techniques [17].
Rainwater harvesting is one of the most effective LID strategies when directly addressing population benefits. It mitigates flooding by reducing surface water flow and has become a significant alternative for water management in areas facing water scarcity. It has been integrated into cities such as Berlin and Sydney to reduce runoff and decrease dependency on potable water sources [12,16]. During the 2018 water crisis in Cape Town, rainwater harvesting systems ensured a primary water supply [18], while in Mumbai and Los Angeles, this practice helps address both scarcity and flooding and recharge local aquifers [9,10]. In Quito, Ecuador, a pilot program demonstrated its effectiveness for domestic and agricultural uses. In Mexico, cities such as Mexico City, Monterrey, and Guadalajara are implementing these solutions to enhance water resilience, alleviating pressure on conventional water sources and optimizing infiltration and capture [13,15,19,20]. These examples underscore the need for indicators that enable a more efficient selection of sustainable alternatives, optimizing benefits across different urban contexts.
Using urban indicators has been essential in measuring the effectiveness of these sustainable solutions. Indicators such as rainwater storage capacity, water use efficiency, and surface runoff reduction have allowed cities to evaluate and adjust their water management strategies more precisely [21,22]. However, significant gaps remain in integrating indicators that consider demographic factors, such as equitable access to water, local hydrological conditions, urban layout, and the feasibility of adapting gray infrastructure through LID [16,18]. Consequently, this research proposes the need to develop a set of urban indicators that address the technical aspects of water management and integrate demographic and hydrological factors that influence cities’ capacity to adapt and mitigate water scarcity and flooding. The working hypothesis is that incorporating new urban indicators that consider demographic factors, urban layout, and local hydrological conditions can significantly improve water planning and management by adapting existing infrastructure through LID. In this study, only the feasibility of harvesting rainwater from rooftops was considered to promote self-consumption and partially mitigate water scarcity. It is assumed that the harvested rainwater does not require treatment for domestic use.
The work is organized as follows. Section 2 presents the features of the study area, Section 3 describes the process to obtain measurement parameters and propose indicators that evaluate current water management, considering urban, demographic, and hydrological characteristics. Section 4 applies the proposed indicators to assess and compare water management through the adaptation of rooftop rainwater harvesting in the study area. Section 5 analyses the sufficient water indicator by rooftop surface depending on the water consumption needs to propose specific solutions to mitigate water scarcity. Section 6 presents the conclusions of the study and recommendations for rapidly growing urban zones in the Global South. Last, Appendix A depicts the terms used in the manuscript.
2. Features of the Study Area
2.1. Study Area Description
The study area is a residential zone located in Mineral de la Reforma, Hidalgo, Mexico, at coordinates 20° 02’ 46.60" North latitude and 98° 42’ 45.04" West longitude, with an average elevation of 2,371 meters above sea level (Figure 1). This city is characterized by a temperate semi-arid climate, heavy rainfall between May and October, and dry conditions prevailing during winter. Annual rainfall ranges from 162 to 710 mm, with over of this rainfall lost to evaporation [23]. The average temperature is 15°C, with maximum temperatures recorded in April and May (24.6°C and 24.1°C, respectively).
2.2. Definition of Land Use and Selection of Design Criteria
The residential area covers a surface of and is subdivided into the following land uses: rooftops of residential buildings, commercial establishments, and services (, equivalent to of the total area), green spaces (, ), roads and sidewalks (, ), and bare soil areas (, ) (Figure 1). Among these areas, rooftops were selected as an alternative to intercept rainfall and propose strategies to mitigate water scarcity in the population, primarily because a water treatment system is not required for domestic use [15]. There are different types of dwellings, distinguished by the number of users, rooftop area, and the water supply needed to meet daily consumption. Additionally, there are various commercial and service areas, those representing higher water demand (i.e., larger number of users, larger rooftop area required, among others) were selected as models.
2.3. Hydrological Information
To determine the amount of rainwater that can be harvested by interception on the rooftops of buildings in the study area (residential, service, and commercial zones), daily rainfall records from the local meteorological station (Station ID 13022) were obtained. The records from 2000 to 2022 were considered, with data extracted from the CLICOM database [23]. Given the high rainfall variability in the area, it is recommended to consider a probability of occurrence more significant than [24]. This study selected a probability of . Figure 2 shows that average rainfall during the rainy months ranges from to mm (May to October, respectively), with August being the wettest month.
For this study, the rainfall data for August was selected to determine the harvestable volumes from rooftops. To quantify this harvestable volume (Vrh), Equation 1 was used [25]:
Where:
- = Rainwater harvesting volume ()
- = Monthly available rainfall ( occurrence probability, in m)
- = Rooftop area ()
- = Runoff coefficient (,26]
Based on Equation (1), factors affecting the harvestable rainwater volume were considered to establish an adjustment factor (Vrha). Some criteria include the variety of materials that constitute rooftop surfaces (in this analysis, concrete was considered, Rc = 0.85); the different roof slopes (a minimum slope of was selected); when slopes are minimal, there can be higher water absorption and increased evaporation; thus a water loss was considered [26]; additionally, the separation of the first rain was taken into account to ensure good water quality for storage (, equivalent to of R75) [25]. Based on these criteria, the adjusted equation used to determine the is as follows (Equation 2):
3. Definition of Indicators
This work proposes the definition and application of indicators that consider urban, demographic, and hydrological aspects to identify the application of low-impact development (LID) for rainwater harvesting on rooftops to improve efficient water management in an urbanized area. In the previous section, we first considered the diagnosis of the study area’s water scarcity problem, taking into account the normative information, the data of the constructed project, and those of the hydrological analysis.
3.1. Parameters for the Construction of Indicators
Based on the diagnosis carried out, the most relevant parameters identified for creating the indicators are the following: absorbed water, received water, rooftop water, unused water, needed water, and available water. These parameters consider the demographic, urban, and hydrological factors relevant to the study.
Absorbed water (): It is the vector representing the volume of water retained in the subsoil in . It considers the absorption of green areas and permeable areas. It is the result of soil type () in by annual rainfall () in by the coefficient of absorption per soil type (). For , where k is the number of different soil types (Equation 3).
Received water (): It is the volume of received water in corresponding to annual rainfall () per surface area of the study () in (Equation 4).
Rooftop water (): It is a vector that corresponds to the volume of water in accumulated by the different types of rooftops. It is defined by the result of the total area vector of each type of rooftop surfaces () (dwelling, commercial, and services areas) in by annual rainfall (); affected by the runoff coefficient corresponding to for concrete. For , where n is the number of different types of building rooftops (Equation 5).
Unused water (): It is the vector of the volume of water lost in sidewalks, roads, and common areas in . It is obtained by the different soil types by the annual rainfall (), affected by the runoff coefficient per surface type (), for (Equation 6).
Needed water (): The vector is specified by the needed water consumption per land use () in multiplied (element by element) by the number of users per land use (), where and m is the number of different land uses. The specific water consumption varies depending on the land use, such as domestic, commercial, or services (Equation 7).
Available water (): It is the water volume resulting from rooftop water () and the real water supply by land use () in (Equation 8).
The real water supply () is the result of the water supplied by land use () in by the number of users (), considering the effect of a leakage loss factor () (Equation 9).
3.2. Indicators Construction
The nest indicators are intended to evaluate, in a general perspective, the current management of rainwater. They represent the volumes of water that can be used for consumption and for water scarcity mitigation and the volume of water that is currently wasted through runoff or absorbed by the different soil types. Previous parameters are applied to define the following four indicators:
- Infiltrated water (), defined by the proportion of water directly used by nature due to its infiltration into the subsoil.
- Available water for consumption (), represented by the proportion of water that can be used for human consumption.
- Runoff water (), described by the proportion of water wasted since it does not infiltrate the subsoil due to the study area conditions, nor is it captured for human consumption.
- Sufficient water (), depicted by the proportion of needed water to meet the area’s demand.
The definition of the indicators is presented below:
Infiltrated water (): It is the ratio of the sum of absorbed water () to received water (). Its value ranges from 0 to 1, being the closest to 1 beneficial for nature but not for immediate human consumption (Equation 10).
Available water for consumption (): It is the resulting ratio of the sum of rooftop water () to received water () from annual rainfall. The value ranges from 0 to 1, where a value close to 1 indicates more available water on rooftops (Equation 11).
Runoff water (ROW): It is the ratio of the sum of unused water () to the received water () by annual rainfall. The value ranges between 0 and 1, which is better when closer to 0 because less water is wasted by runoff (Equation 12).
Sufficient water (SW): It is the resulting ratio of available water (), consisting of the actual supply based on land uses plus the water captured on rooftops, to the sum of needed water (). The value ranges from 0 to 1. A value close to 1 means that the available water is close to the amount needed (Equation 13).
3.3. Low-Impact Development for Rainwater Harvesting
Many urban areas in the Global South are characterized by high population densities where dwellings and roads consume most of the available space, leaving minimal green areas.
Low-impact developments (LID) for water management focus on sustainable and efficient methods that minimize water consumption and reduce dependence on conventional sources of supply. These LID range from simple techniques to more advanced systems designed to conserve and distribute water responsibly. This study will analyze the application of rooftop rainwater harvesting (RWH).
RWH, a technique that allows collecting and using rainfall from building rooftops, plays a crucial role in reducing domestic water scarcity. It also facilitates resource conservation and minimizes pressure in the drainage system, thereby preventing potential flooding. Figure 3 describes the implementation of the LID for rooftop rainwater harvesting.
4. Application of Indicators in the Study Area
Three groups of variables were considered for the application of the indicators, encompassing demographic, hydrological, and urban aspects. Table 1 presents the demographic data included in the analysis of the study area, accounting for three types of land use: residential, commercial, and services (Table 1).
Based on the analysis of the area’s physical environment, relevant hydrological information was determined, specifically the absorption and runoff coefficients for the different soil types (Table 2).
Regarding urban aspects, spaces were categorized according to land use. Residential, commercial, and service uses were identified and classified based on the number of users, specific water consumption needs, and the actual water supply they receive. Table 3 shows the classification and surface of land use in the study area.
Table 4 presents the total rooftop area by building type, the number of dwelling units for each type, and the average rooftop area allocated to each unit according to building type.
The local operating authority specifies the required water volume for domestic use, while the volume for commercial and service use is established by [26]. The supply volume for domestic and commercial use is rationed every third day, whereas the service volume is provided daily. Table 5 indicates the water volume required per person based on land use and the actual volume of water supplied.
4.1. Application of Parameters
This section calculates the parameters designed to assess the area’s current water management situation. Table 6 presents the volume of absorbed water () for the different land use types in the study area (Equation 3).
Table 7 presents the rooftop water () of buildings corresponding to the different land use types, which could be utilized for self-consumption according to Equation 5.
Table 8 presents the volume of unused water () from runoff across different surface types, ultimately directed to the drainage system, by Equation 6.
Table 9 describes the total volumes of needed water () [26] by land use and the total volumes of real water supply () by the local operating authority, following Equations 7 and 8.
As observed in Table 9, considering the study area as a whole, only of the total needed water is supplied to meet the established regulatory standards [26]. This indicates the extent of water scarcity the area’s residents face and underscores the urgent need for solutions to mitigate this situation, particularly by leveraging the region’s rainfall periods.
4.2. Application of Indicators
This section presents the indicator calculations based on the defined parameters to determine four dimensions regarding the current state of water utilization in the study area. Table 10 shows the values obtained for each dimension, applying Equations 10–13.
The indicator shows that, under the rainfall conditions assessed in the study area, 23% of the rainfall volume infiltrates the subsurface through green cover and bare soil surfaces. This percentage is considering the total received water . The indicator refers to the percentage of water that can be utilized for population consumption through rooftop capture in buildings, based on different land uses, estimated at 17% of total rainfall. Regarding the indicator, it is observed that 51% of the precipitated water currently flows over various surfaces and, being unused, is directed toward the urban drainage system. Lastly, the indicator suggests that the water volume and the available supply would suffice to meet the needs of the entire population, reaching an estimated 153% of the water requirement in the event of intense rainfall.
5. Analyzing the Sufficient Water Indicator by Building Type
The sufficient water indicator generally suggests a 53% daily water surplus relative to the volume required for domestic, commercial, and service consumption in the study area. Implementing rainwater harvesting techniques could achieve this surplus, thereby mitigating the current issue of water scarcity. However, due to buildings’ structural and functional diversity, this result cannot be uniformly extrapolated to all land use types. To formulate appropriate rainwater harvesting solutions for each type of building, the sufficient water indicator will be applied specifically to each case.
Table 11 illustrates this indicator’s behavior by considering the available water supply, regulatory requirements, and the volume of water potentially recoverable through rainwater harvesting. The results indicate that under a scenario of intense rainfall (23 mm) over a 24-hour period in the study area, the harvested water would exceed the water requirements for most land use types.
Observing the results in Table 11, individualized solutions can be proposed for each building type, optimizing rainwater harvesting. Table 11 indicates a 100% increase in water availability for buildings other than multifamily units. Low-impact development (LID) measures can be implemented individually in these buildings, providing each family between 1.1 to 2.6 days of the desirable water service. Considering that these families currently use only one-third of the required daily consumption, this water availability extends to 3.33 to 7.8 days, significantly enhancing water access.
The situation is more complex for multifamily buildings, as rainwater harvesting does not fully meet one day of each family’s desired water requirement. In this case, a communal water tank per multifamily building could be proposed to support common uses such as green space irrigation or cleaning shared areas. Nevertheless, rainwater harvesting in this type of building still doubles water access for each family, considering current consumption.
The scenario differs considerably for rooftops of service and commercial areas, where up to nearly 5 and 9 days’ worth of water demand can be harvested, respectively. When current supply levels are considered, this can increase to over 20 days for commercial areas. Given this context, a feasible approach would be for each commercial and service building to have its own rainwater harvesting technique or to redirect part of the harvested water to shared storage tanks supplying multifamily buildings, thereby partially alleviating water scarcity for this specific population.
The international literature provides a broad overview of the multifunctionality of Low Impact Development (LID) technologies in urban environments, particularly in temperate and humid climates [11,27,28]. However, these studies tend to generalize the capacity of LID technologies for water management in urban areas without thoroughly addressing the specific parameters required to meet consumption demands that vary according to the population’s diverse activities, especially in areas that experience intense but short-duration rainfall.
The use of indicators, on the other hand, has facilitated the evaluation of efficiency in water use and security [9], sustainability in water management [29], and the social and environmental impacts of water collection and distribution systems [30]. For instance, implementing an ecological scarcity indicator in China has helped mitigate water shortages in of its provinces, improving conditions in regions with semi-arid and temperate climates [31]. In contrast to these approaches, the indicators proposed in this research allow for the adaptation of LID technologies according to building types, thus maximizing resource use based on the population’s specific needs. In a similar water scarcity context, a recent study in Mexico City assessed the social impact of rainwater harvesting systems in promoting water autonomy; however, it did not consider technical and urban elements that would help discern the potential for harvesting at different scales [15].
In contrast, this research identifies building types with the highest potential for directly managing rainwater for self-consumption while also providing alternatives for collective management of excess volumes in buildings with low demand but high storage potential.
6. Conclusions
This study developed a set of urban indicators that accurately assess the potential of Low-Impact Development (LID) techniques, specifically rainwater harvesting, to address water scarcity challenges in urban areas with semi-arid climates. The primary scientific contribution of this research lies in creating indicators based on demographic, hydrological, and urban factors, enabling a comprehensive analysis of water management. These indicators absorbed water, water available for self-consumption, runoff water, and sufficient water—address critical dimensions to identify opportunities for mitigating water scarcity.
The indicators were developed to provide a differentiated and adaptive perspective for each land use type within the study area, thereby optimizing LID implementation, particularly in urban areas vulnerable to water shortages. This methodology not only facilitates the identification of priority areas for rainwater harvesting but also offers a rigorous quantification of the potential volumes of available, underutilized, or required water to meet necessary demand. Additionally, the applied indicators reveal that, under intense rainfall, implementing rainwater harvesting systems can meet up to 153% of demand in some cases, highlighting its feasibility for enhancing water resilience.
This approach is especially relevant for other studies addressing similar issues in the Global South’s rapidly growing, water-scarce cities. The adaptability of these developed indicators to various urban contexts allows for a more effective application of LID, increasing the sustainability of water resources and improving responses to intense rainfall events. Furthermore, the results may serve as a reference for studies aiming to integrate green technologies into water resource management, promoting water self-sufficiency and reducing pressure on traditional supply infrastructures.
Appendix A Glossary of terms

Table A1.
Terms used in the definition of parameters and indicators.
| Type | Term | Meaning | Units |
|---|---|---|---|
| Parameter | absorbed water | ||
| soil type | |||
| annual rainfall | |||
| absorption per soil type | % | ||
| k | number of soil types | ||
| received water | |||
| surface area | |||
| rooftop water | |||
| rooftop surface | |||
| runoff coefficient | % | ||
| n | number of rooftop types | ||
| unused water | |||
| needed water | |||
| consumption water per land use | |||
| users per land use | |||
| m | number of land uses | ||
| available water | |||
| real water supply | |||
| water supply per land use | |||
| leakage loss factor | % | ||
| Indicator | infiltrated water | % | |
| available water for consumption | % | ||
| runoff water | % | ||
| sufficient water | % |
References
- Romero-Duque, L.P.; Trilleras, J.M.; Castellarini, F.; Quijas, S. Ecosystem services in urban ecological infrastructure of Latin America and the Caribbean: How do they contribute to urban planning? Science of the Total Environment 2020, 728, 138780. [Google Scholar] [CrossRef] [PubMed]
- Karimi, M.; Tabiee, M.; Karami, S.; Karimi, V.; Karamidehkordi, E. Climate change and water scarcity impacts on sustainability in semi-arid areas: Lessons from the South of Iran. Groundwater for Sustainable Development 2024, 24, 101075. [Google Scholar] [CrossRef]
- Noori, A.R.; Singh, S. Rainfall Assessment and Water Harvesting Potential in an Urban area for artificial groundwater recharge with land use and land cover approach. Water Resources Management 2023, 37, 5215–5234. [Google Scholar] [CrossRef]
- Escorcia Hernández, J.R.; Moghadam, S.T.; Lombardi, P. Urban sustainability in social housing environments: A spatial impact assessment in Bogotá, Colombia. Cities 2024, 154, 105392. [Google Scholar] [CrossRef]
- Huerta-Vergara, A.; Escolero, O. The role of citizen participation in advancing sustainable water solutions: The Mexico City case study. Sustainable Cities and Society 2024, 101, 105104. [Google Scholar] [CrossRef]
- Soto-Montes-de Oca, G.; Bark, R.; González-Arellano, S. Incorporating the insurance value of peri-urban ecosystem services into natural hazard policies and insurance products: Insights from Mexico. Ecological Economics 2020, 169, 106510. [Google Scholar] [CrossRef]
- UNESCO. Informe de las Naciones Unidas sobre el desarrollo de los recursos hídricos en el mundo 2018: Soluciones basadas en la naturaleza para la gestión del agua; 2018. Recuperado de https://unesdoc.unesco.org/ark:/48223/pf0000259255.
- Zahmatkesh, Z.; Burian, S.J.; Karamouz, M.; Tavakol-Davani, H.; Goharian, E. Low-impact development practices to mitigate climate change effects on urban stormwater runoff: Case study of New York City. Journal of Irrigation and Drainage Engineering 2015, 141, 04014043. [Google Scholar] [CrossRef]
- Berger, L.; Henry, A.D.; Pivo, G. Orienteering the landscape of urban water sustainability indicators. Environmental and sustainability indicators 2023, 17, 100207. [Google Scholar] [CrossRef]
- Namavar, M.; Moghaddam, M.R.A.; Shafiei, M. Developing an indicator-based assessment framework for assessing the sustainability of urban water management. Sustainable Production and Consumption 2023, 40, 1–12. [Google Scholar] [CrossRef]
- Bonneau, J.; Fletcher, T.D.; Costelloe, J.F.; Burns, M.J. Stormwater infiltration and the ‘urban karst’–A review. Journal of hydrology 2017, 552, 141–150. [Google Scholar] [CrossRef]
- Wild, T.; Baptista, M.; Wilker, J.; Kanai, J.M.; Giusti, M.; Henderson, H.; Rotbart, D.; Espinel, J.D.A.; Hernández-Garcia, J.; Thomasz, O.; others. Valuation of urban nature-based solutions in Latin American and European cities. Urban Forestry & Urban Greening 2024, 91, 128162. [Google Scholar]
- García-Sánchez, M.; Güereca, L.P. Environmental and social life cycle assessment of urban water systems: The case of Mexico City. Science of The Total Environment 2019, 693, 133464. [Google Scholar] [CrossRef]
- Barranquero, R.S.; Guerrero, M.; Noriega, R.B.; de Galarreta, A.R.; Mezzina, A.; Paz, L.E.; San Juan, R.F.; Varni, M.; Cortelezzi, A. Environmental assessment of water management and urban growth: A case study in an Argentina Pampean plain’s basin. Applied Geography 2023, 160, 103095. [Google Scholar] [CrossRef]
- Castelán-Cabañas, R.; Padilla-Rivera, A.; Muñoz-Villarreal, C.; Güereca-Hernández, L.P. Advancing urban water autonomy: A Social Life Cycle Assessment of rainwater harvesting systems in Mexico City. Cleaner Environmental Systems 2024, 13, 100193. [Google Scholar] [CrossRef]
- Robbiati, F.O.; Natalia, C.; Gustavo, B.; Gustavo, O.; Jim, C.Y.; Mario, S.; Emmanuel, H.; Rubio, E.; Leonardo, G.; Lelia, I. Vegetated roofs as a nature-based solution to mitigate climate change in a semiarid city. Nature-Based Solutions 2023, 3, 100069. [Google Scholar] [CrossRef]
- Cacciuttolo, C.; Garrido, F.; Painenao, D.; Sotil, A. Evaluation of the Use of Permeable Interlocking Concrete Pavement in Chile: Urban Infrastructure Solution for Adaptation and Mitigation against Climate Change. Water 2023, 15, 4219. [Google Scholar] [CrossRef]
- Morán-Valencia, M.; Flegl, M.; Güemes-Castorena, D. A state-level analysis of the water system management efficiency in Mexico: Two-stage DEA approach. Water Resources and Industry 2023, 29, 100200. [Google Scholar] [CrossRef]
- Medina-Rivas, C.M.; Rodríguez-Tapia, L.; Morales-Novelo, J.A.; Revollo-Fernández, D.A. Spatial inequality of domestic water consumption in Mexico city. Water Resources and Economics 2022, 40, 100210. [Google Scholar] [CrossRef]
- Garcia, C.; López-Jiménez, P.A.; Pérez-Sánchez, M.; Sanchis, R. Methodology for assessing progress in sustainable development goals indicators in urban water systems. How far are we from the 2030 targets? Sustainable Cities and Society 2024, 105616. [Google Scholar] [CrossRef]
- Biswas, R.R.; Rahman, A. Development and application of regional urban water security indicators. Utilities Policy 2023, 84, 101637. [Google Scholar] [CrossRef]
- Zhu, R.; Jiang, Y.; Wang, B.; Zhang, Y. Changes in human settlement environments and their drivers in valley cities located in arid and semi-arid regions: A case study of Lanzhou in Western China. Research in Cold and Arid Regions 2024. [Google Scholar] [CrossRef]
- Comisión Nacional del Agua (CONAGUA). Información Estadística Climatológica, 2024; Accessed: 2024-11-01.
- Schneider, S. Family farming in Latin America and the Caribbean. Deep Roots. 1ed. Roma, 2014; 26–29. [Google Scholar]
- Secretaría del Medio Ambiente de la Ciudad de México. Manual para cosechar la lluvia, 2020. Recuperado de https://www.sedema.cdmx.gob.mx/storage/app/media/DGCPCA/ManualCosecharLaLluvia.pdf.
- Comisión Nacional del Agua (CONAGUA). Manual de Agua Potable, Alcantarillado y Saneamiento. Datos Básicos para Proyectos de Agua Potable y Alcantarillado, Libro 4; 2018. Accessed: 2024-11-01.
- Guo, R.; Ding, Y.; Shang, L.; Wang, D.; Cao, X.; Wang, S.; Bonatz, N.; Wang, L. Sustainability-oriented urban renewal and low-impact development applications in China: Case study of Yangpu District, Shanghai. Journal of Sustainable Water in the Built Environment 2018, 4, 05017006. [Google Scholar] [CrossRef]
- Charoenkit, S.; Piyathamrongchai, K. A review of urban green spaces multifunctionality assessment: A way forward for a standardized assessment and comparability. Ecological Indicators 2019, 107, 105592. [Google Scholar] [CrossRef]
- Chelleri, L.; Schuetze, T.; Salvati, L. Integrating resilience with urban sustainability in neglected neighborhoods: Challenges and opportunities of transitioning to decentralized water management in Mexico City. Habitat International 2015, 48, 122–130. [Google Scholar] [CrossRef]
- Singh, K. Managing Water for Sustainable Development: An Economist’s Perspective. IIM Kozhikode Society & Management Review 2016, 5, 1–4. [Google Scholar]
- Liu, K.; Cao, W.; Zhao, D.; Liu, S.; Liu, J. Assessment of ecological water scarcity in China. Environmental Research Letters 2022, 17, 104056. [Google Scholar] [CrossRef]
Figure 1.
Location of the study area and its primary land uses.
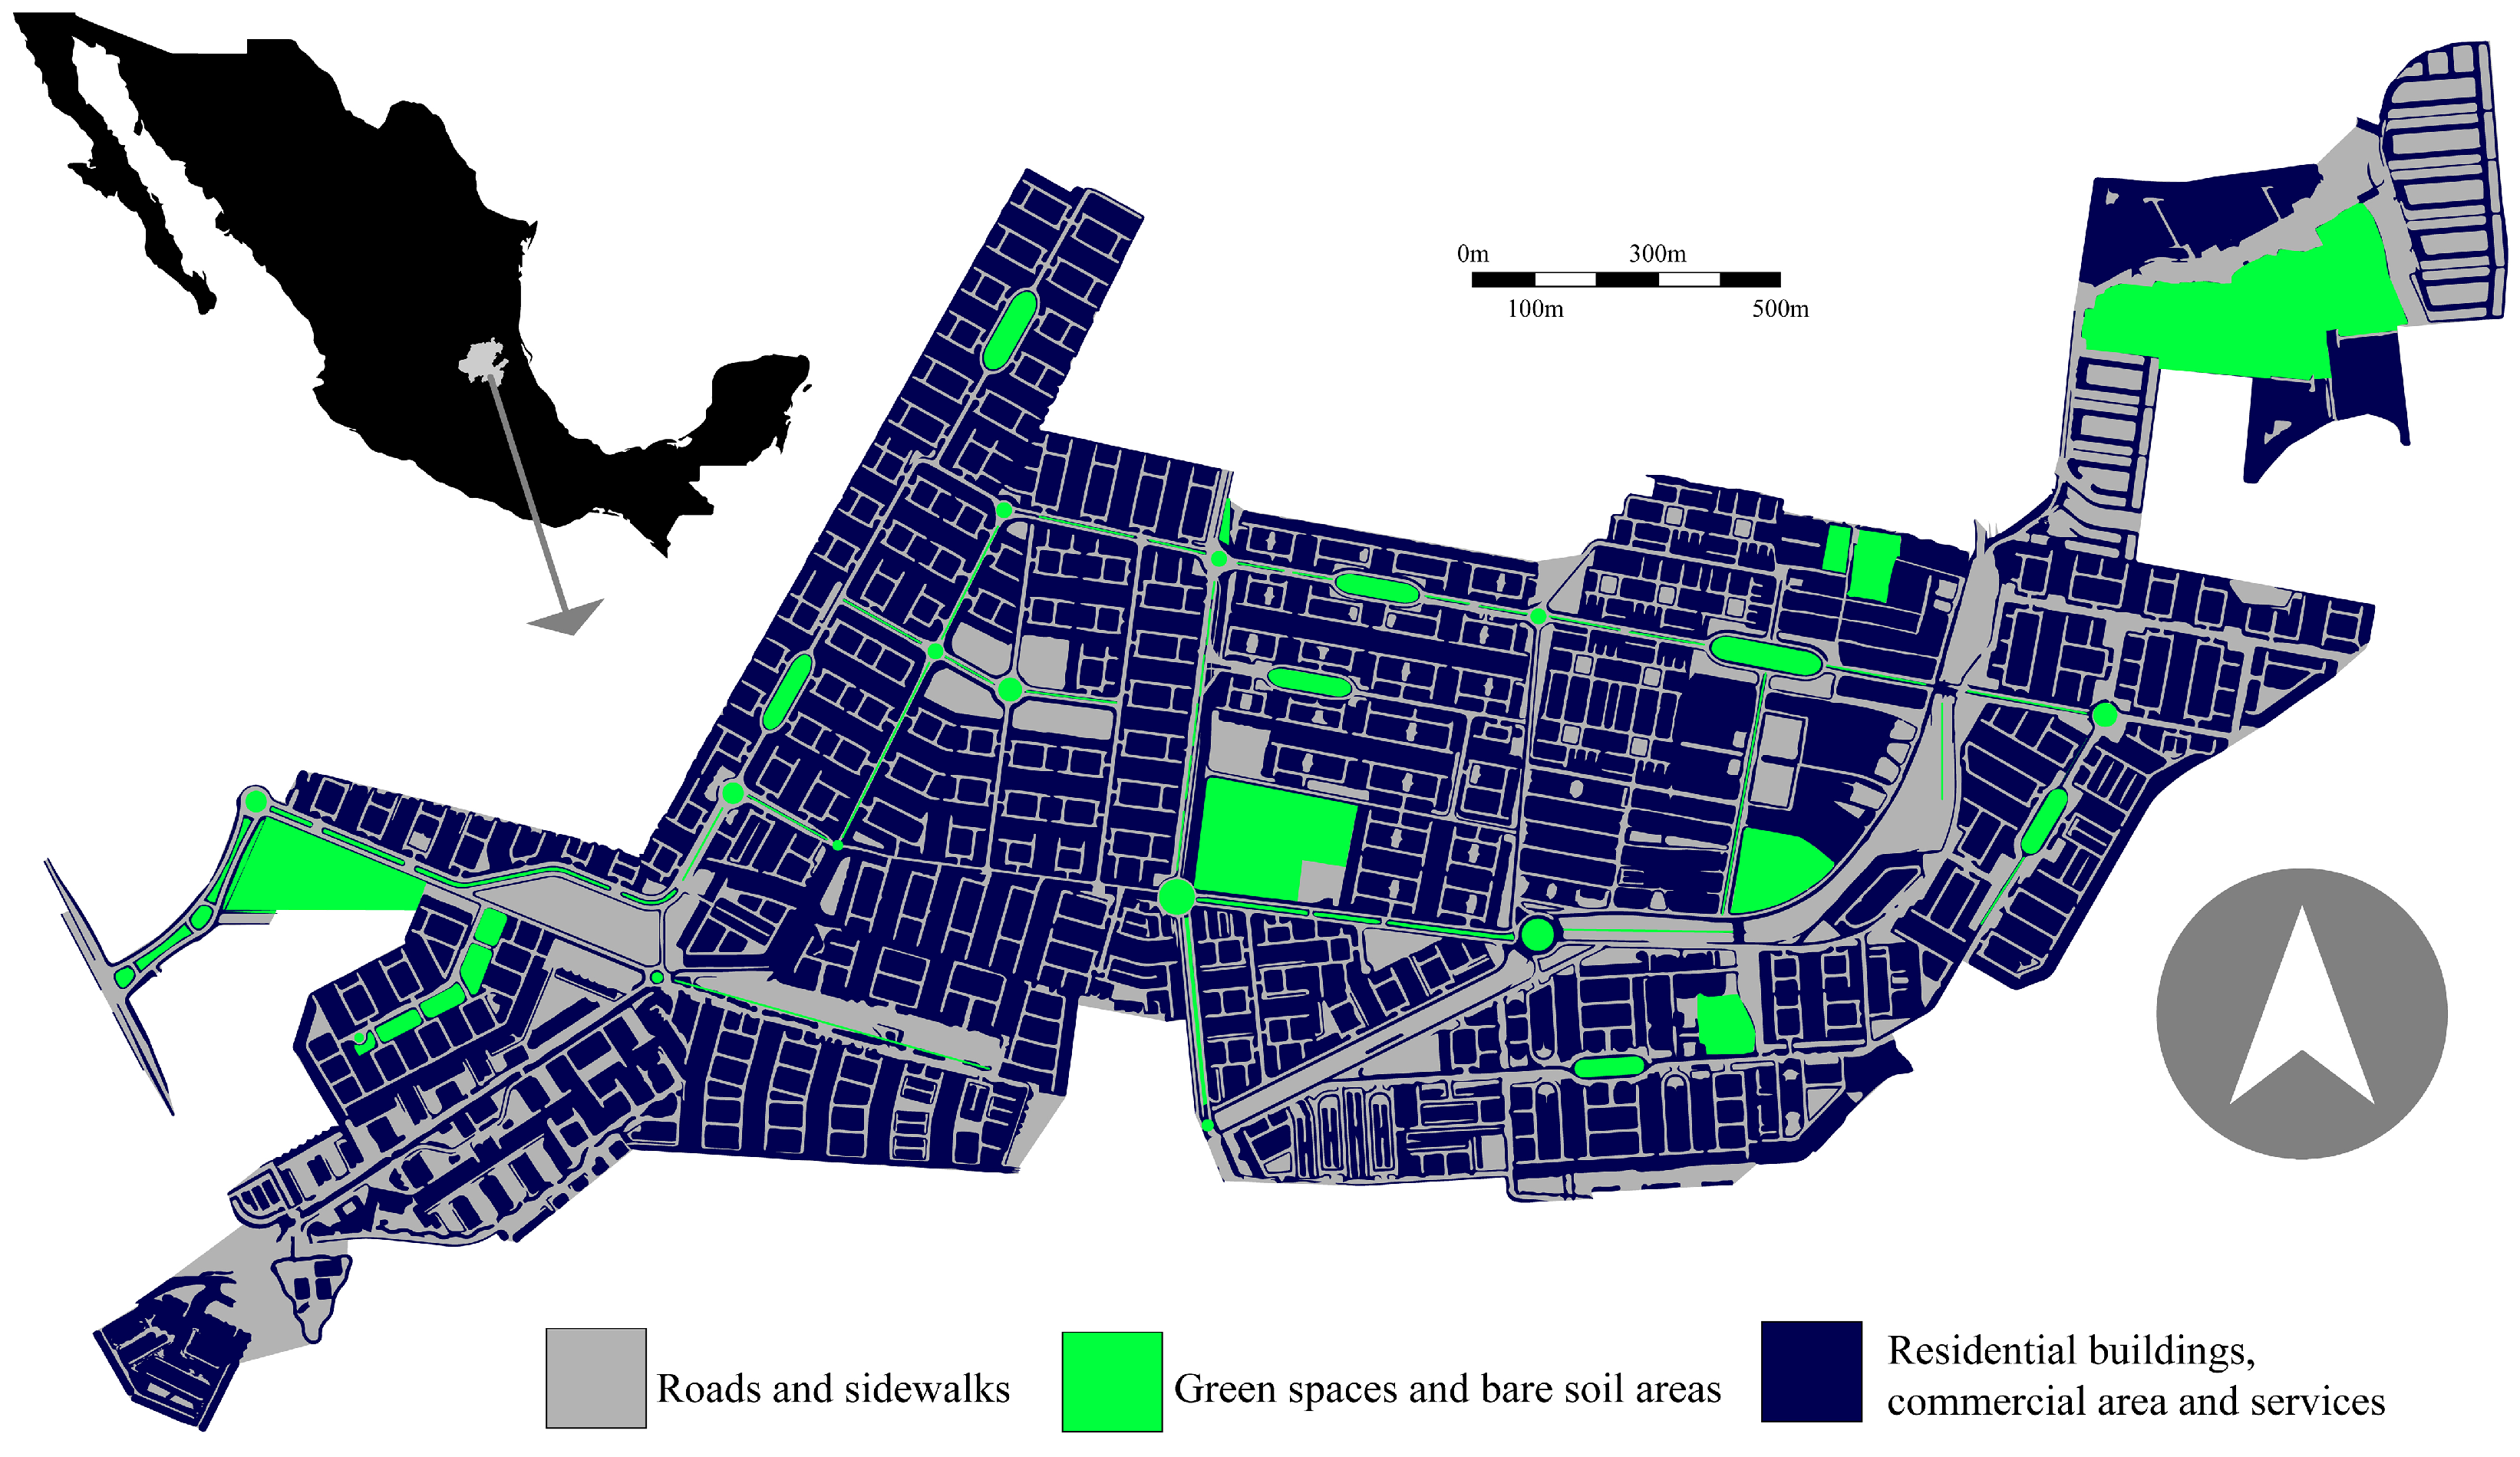
Figure 2.
Monthly rainfall distribution with a probability of occurrence.
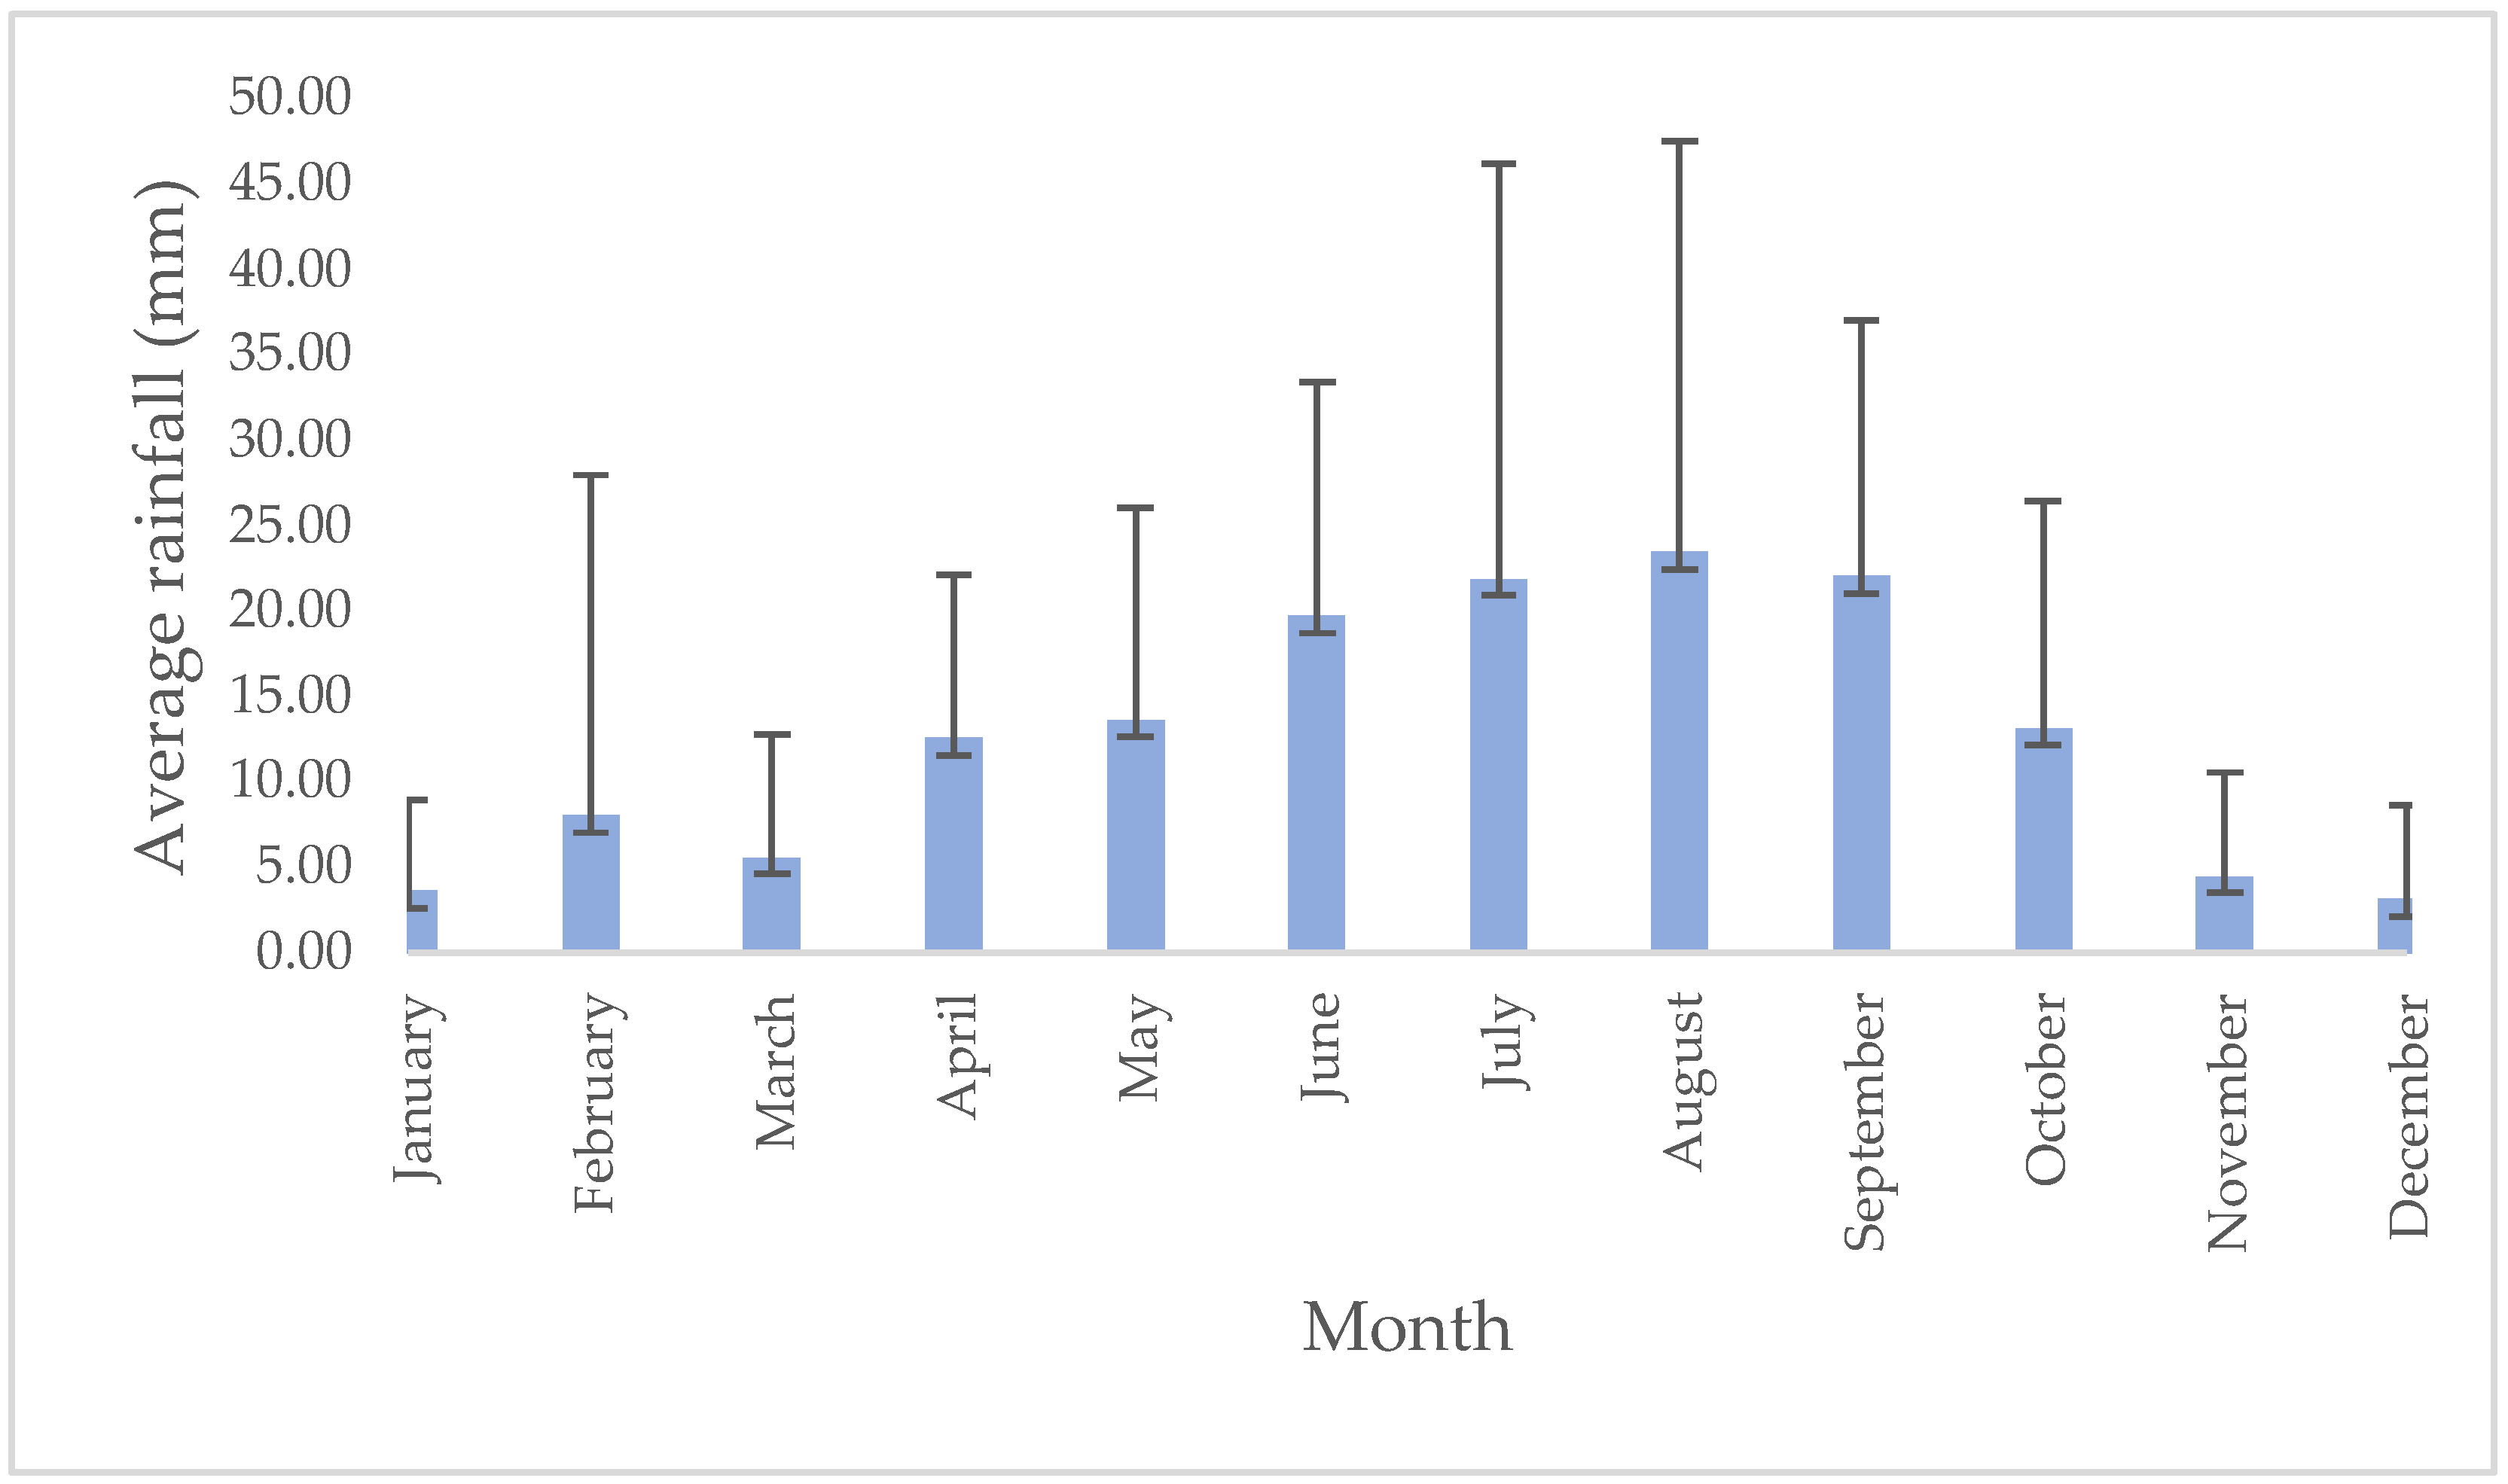
Figure 3.
LID for rooftop rainwater harvesting.
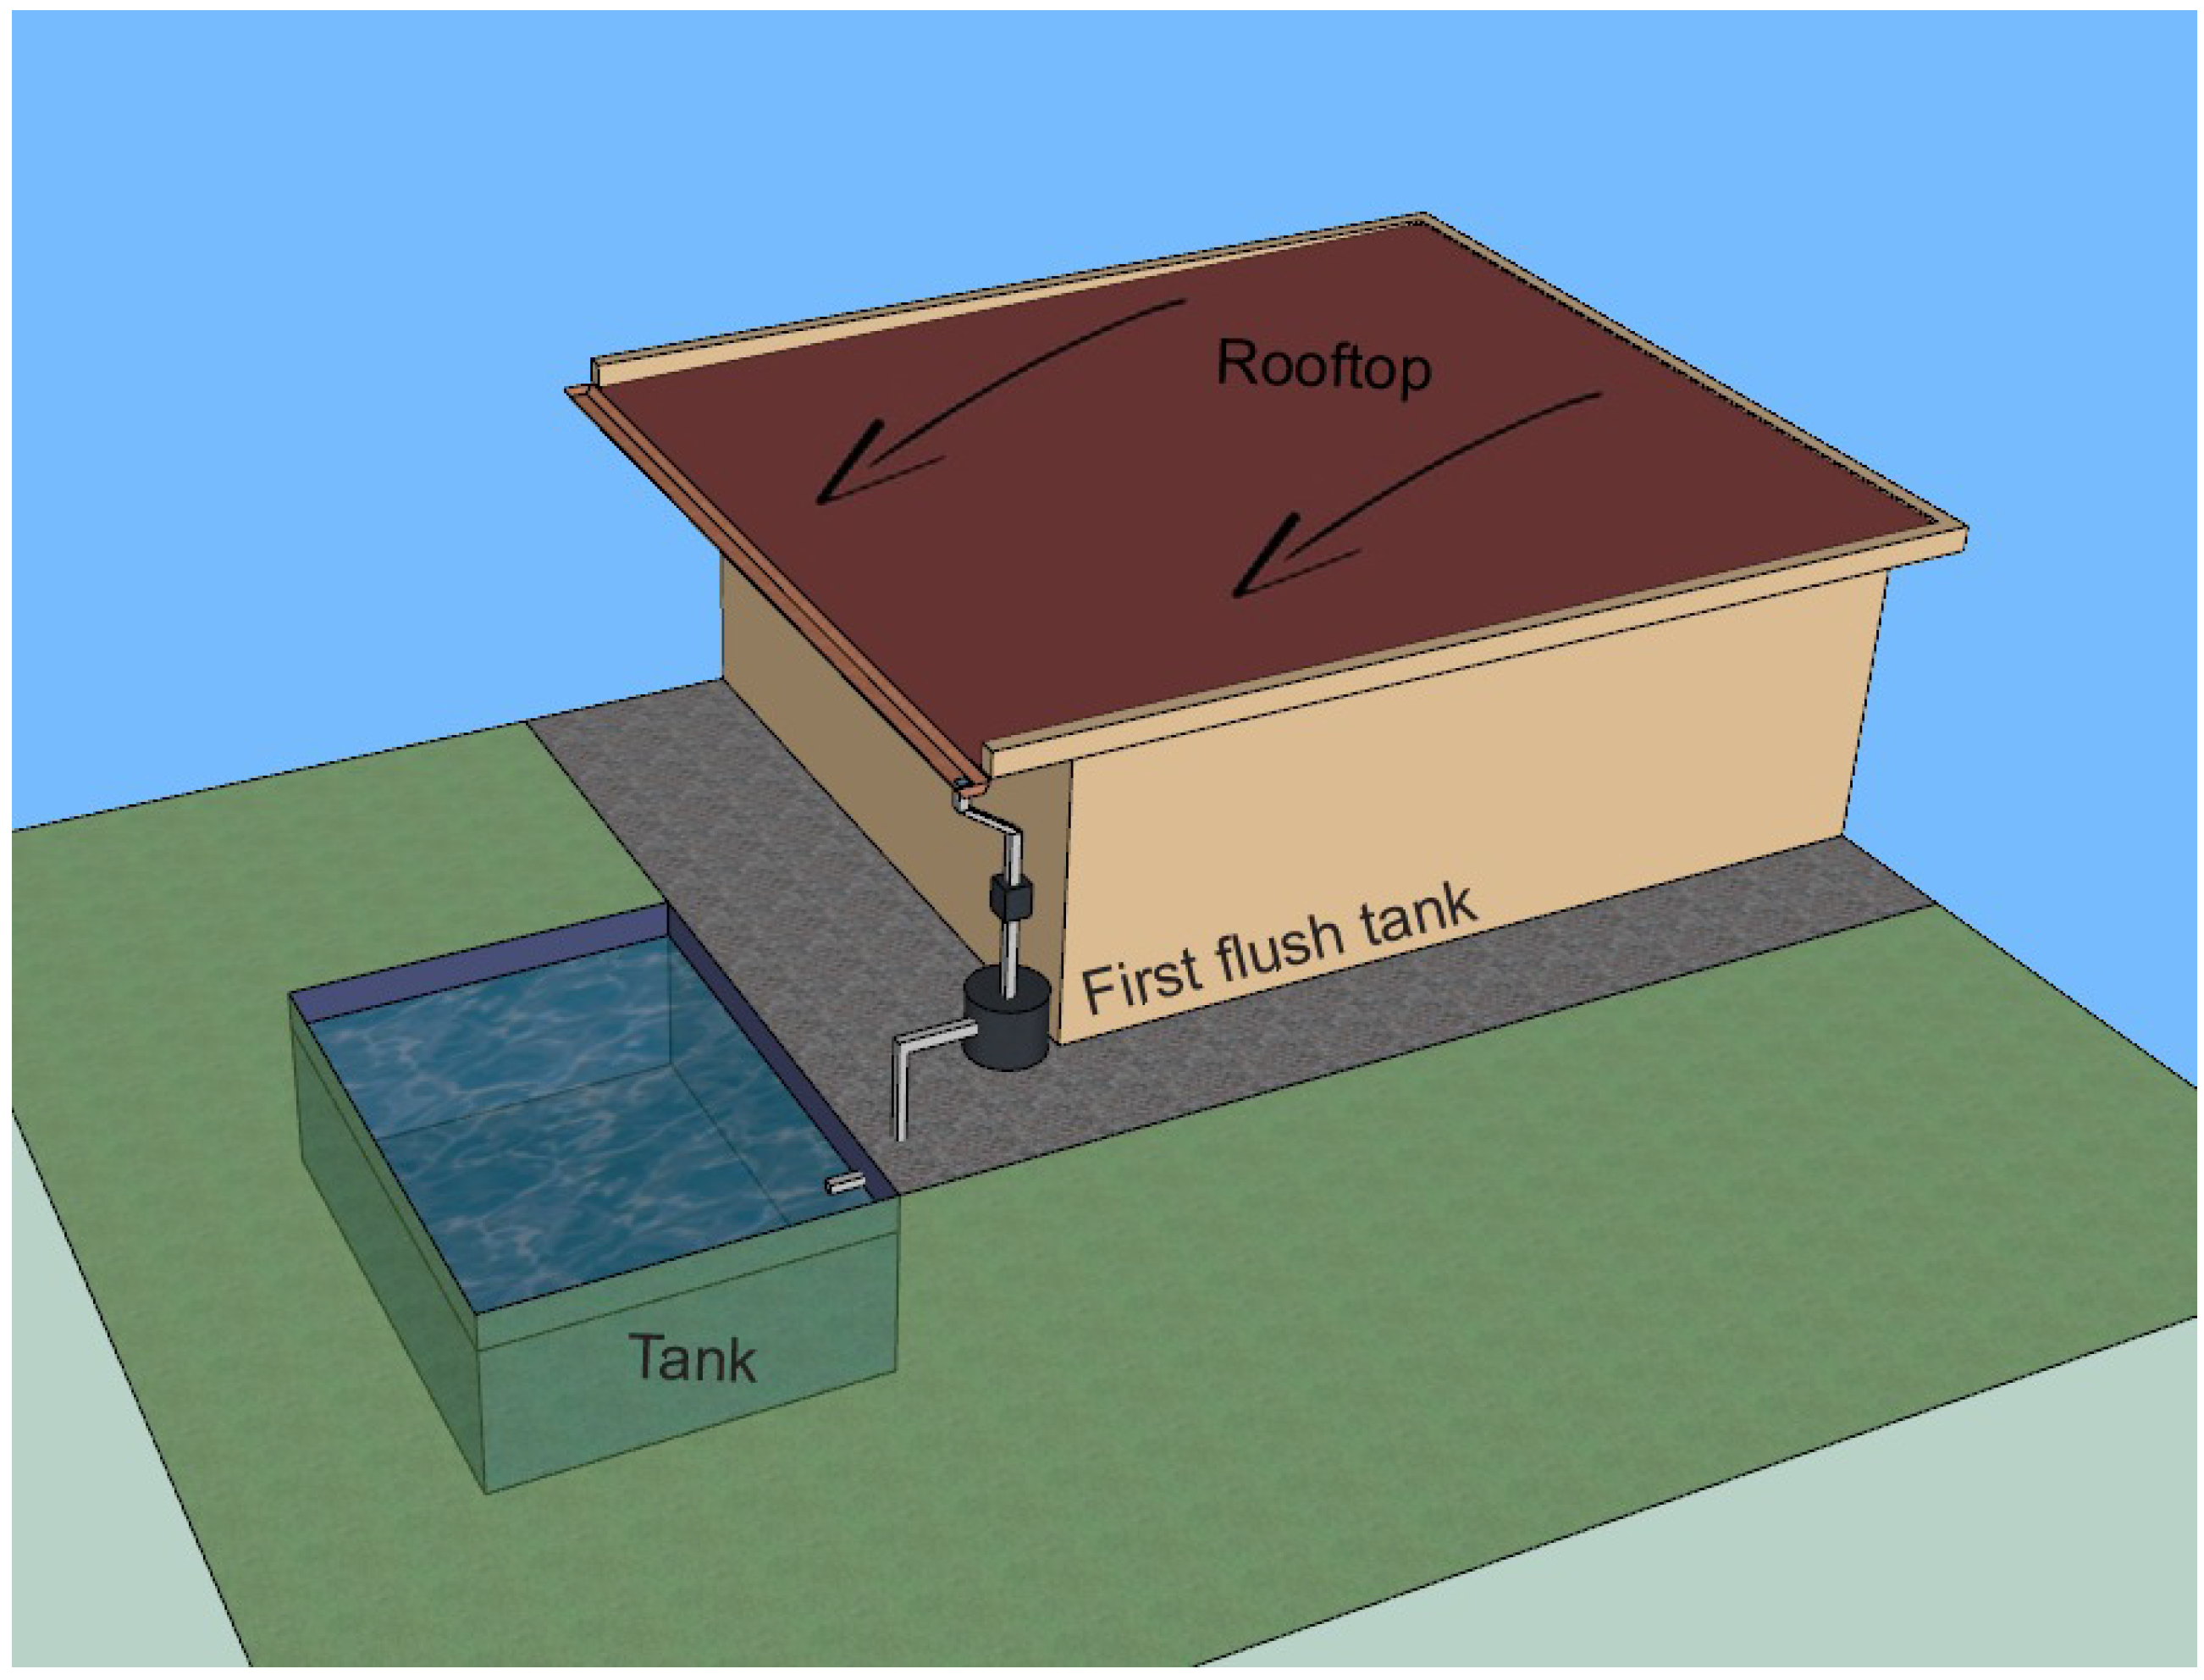
Table 1.
Demographic data of the study zone.
| Description | Quantity |
|---|---|
| Number of dwellings | 18,993 |
| Average persons per dwelling | 3.6 |
| Population by dwellings | 68,374.8 |
| Number of commercial areas | 1,081.2 |
| Average number of people per commercial area | 4 |
| Population by commercial area | 4,325.1 |
| Number of services | 41 |
| Average persons by services | 268 |
| Population by services areas | 29,274 |
Table 2.
Absorption and runoff coefficients by soil type [26].
Table 2.
Absorption and runoff coefficients by soil type [26].
| Soil type | Absorption coefficient | Runoff coefficient |
|---|---|---|
| Green areas | 0.87 | 0.13 |
| Bare soil | 0.57 | 0.43 |
| Sidewalks and roads | 0.05 | 0.95 |
| Rooftops | 0.235 | 0.765 |
Table 3.
Land use classification and its areas.
| Soil type | Area () |
|---|---|
| Green areas | 261,800.2 |
| Roads and sidewalks | 1,229,891.4 |
| Bare areas (wastelands and parks) | 816,285.6 |
| Rooftops | 694,645.1 |
| Total area under study | 3,002,622.3 |
Table 4.
Dwellings by buildings’ type and their areas.
| Rooftop type | Total area () | Number of dwellings | Average rooftop area per dwelling () |
|---|---|---|---|
| Single family | 335,355.7 | 8,098 | 41.4 |
| Duplex | 91,974.5 | 1,581 | 58.2 |
| Triplex | 1,078.8 | 33 | 32.7 |
| Quadruplex | 86,659.8 | 4,036 | 21.5 |
| Multifamily building 15 | 5,861.5 | 585 | 10 |
| Multifamily building 20 | 29,522.8 | 3,220 | 9.2 |
| Multifamily building 30 | 15,783.1 | 1,440 | 10.9 |
| Commercial | 81,095.2 | 1,081 | 75 |
| Services | 47,313.8 | 41 | 1,154 |
Table 5.
Volume of water required per person ().
| Land use | Population | Water required () | Water supplied () |
|---|---|---|---|
| Domestic | 68,375 | 0.125 | 0.042 |
| Commercial | 4,324 | 0.04 | 0.017 |
| Services | 29,274 | 0.02 | 0.02 |
Table 6.
Volume of absorbed water in .
| Soil type | |
|---|---|
| Green areas | 5,352.5 |
| Bare soil | 10,934.1 |
Table 7.
Volume of received water in rooftops ().
| Rooftop type | |
|---|---|
| Single family | 6,028.8 |
| Duplex | 1,653.4 |
| Triplex | 19.3 |
| Quadruplex | 1,557.9 |
| Multifamily building 15 | 105.3 |
| Multifamily building 20 | 530.7 |
| Multifamily building 30 | 283.7 |
| Commercial | 1,457.8 |
| Services | 850.5 |
| Total | 12487.9 |
Table 8.
Volume of unused water () by type of land use in .
| Soil type | |
|---|---|
| Green areas | 799.7 |
| Bare soil | 8,248.5 |
| Sidewalks and roads | 27,457.3 |
| Total | 36,505.6 |
Table 9.
Volume of needed water and real water supply per land use.
| Land use | Needed water () in () | Real water supply () in () |
|---|---|---|
| Domestic | 8,546.8 | 1,435.8 |
| Commercial | 172.9 | 36.7 |
| Services | 585.4 | 292.7 |
| Total | 9,305.3 | 1,765.3 |
Table 10.
Application of the indicators in the study zone.
| Indicator | Value |
|---|---|
| Infiltrated water (IW) | 0.23 |
| Available water for consumption (AWC) | 0.17 |
| Runoff water (ROW) | 0.51 |
| Sufficient water (SW) | 1.53 |
Table 11.
SW indicator behavior for rooftop type.
| Rooftop type | nw () | rws () | SW with only | rw () | vw () | SW | |
|---|---|---|---|---|---|---|---|
| Single family | 3644.1 | 1224.4 | 0.33 | 6028.8 | 7253.2 | 1.9 | |
| Duplex | 711.4 | 239.1 | 0.33 | 1653.4 | 1892.5 | 2.6 | |
| Triplex | 14.8 | 4.9 | 0.33 | 19.3 | 24.3 | 1.6 | |
| Quadruplex | 1816.2 | 610.2 | 0.33 | 1557.9 | 2168.1 | 1.1 | |
| Multifamily building 15 | 263.2 | 88.4 | 0.33 | 105.3 | 193.8 | 0.73 | |
| Multifamily building 20 | 1449 | 486.8 | 0.33 | 530.7 | 1017.6 | 0.7 | |
| Multifamily building 30 | 648 | 217.7 | 0.33 | 283.7 | 501.4 | 0.7 | |
| Commercial | 172.9 | 73.5 | 0.42 | 1457.8 | 1531.3 | 8.8 | |
| Services | 219.7 | 219.7 | 1.00 | 850.5 | 1070.3 | 4.8 | |
Disclaimer/Publisher’s Note: The statements, opinions and data contained in all publications are solely those of the individual author(s) and contributor(s) and not of MDPI and/or the editor(s). MDPI and/or the editor(s) disclaim responsibility for any injury to people or property resulting from any ideas, methods, instructions or products referred to in the content. |
© 2024 by the authors. Licensee MDPI, Basel, Switzerland. This article is an open access article distributed under the terms and conditions of the Creative Commons Attribution (CC BY) license (http://creativecommons.org/licenses/by/4.0/).
Copyright: This open access article is published under a Creative Commons CC BY 4.0 license, which permit the free download, distribution, and reuse, provided that the author and preprint are cited in any reuse.


