
Submitted:
07 November 2024
Posted:
08 November 2024
You are already at the latest version
Preprints on COVID-19 and SARS-CoV-2
Abstract
Background: RT-qPCR is the gold standard for diagnosing COVID-19, the testing process requires RNA extraction, which can be time-consuming, costly and infectious. This study aimed to compare the diagnostic performance of an extraction-free heating and dilution method (EFHD) with conventional extraction-based (EB) methods for detecting SARS-CoV-2. Method: A total of 300 specimens, (190 positive, 110 negative) were collected retrospectively from the National Virology Reference Laboratory repository of Ethiopian Public Health Institute (EPHI). The specimens were diluted in 1:2 with RNase-free water and heated at 72°C for 15 minutes. 10µL of the heated sample/ elutes were mixed with 20µL of the master mix and runned using an ABI 7500 Fast instrument (ThermoFisher Scientific). Performance characteristics were analyzed using R-Studio and STATA v17. Result: The EFHD revealed a sensitivity of 92% and a specificity of 100%. The accuracy of the new method was 85.8% (163/190). The new method reported 15 false negatives and 12 invalid results. The EFHD method exhibited strong agreement with the standard method, (with an agreement of 95%, and a kappa coefficient of 0.89). It performed well with high viral load samples (Ct < 20), but exhibited reduced sensitivity for lower viral loads (Ct > 35). The study confirmed a significant correlation (R² = 0.99, p = 0.001) between EFHD and extraction-based SARS CoV-2 detection methods. Conclusion: EFHD demonstrated good performance characteristics. Its tendency to produce false negatives in low viral load cases suggests room for improvement. This method could be the choice of testing in resource-limited areas specially for outbreak management and control.
Keywords:
SARS-CoV-2
; extraction free
; heating
; dilution
; diagnostic performances
1. Background
Coronaviruses belong to the Coronaviridae family. They are RNA viruses with an enveloped structure and a positive single-stranded genome. This genome contains over 29,891 nucleotides, which encode for 9,890 amino acids. It also contains numerous open-reading frames (ORFs) that code for both structural (SP) and non-structural (NSP) proteins. These proteins play crucial roles in the viral life cycle and pathogenic processes [1]. The structural proteins consist of S (spike protein), E (envelope protein), M (membrane protein), and N (nucleocapsid protein). Furthermore, there are sixteen non-structural proteins (nsp1–16) that assist in viral metabolism and interaction with the host immune system [2]. The SARS-CoV-2 gene's role in diagnostic tool development is multifaceted, encompassing rapid assay development, enhanced detection sensitivity, variant identification, and informing public health responses [3,4]. Its significance underscores the critical intersection of genetics, diagnostics, and public health in managing infectious disease threats effectively [4].
In cases of epidemics like COVID-19, it is crucial to detect the pathogen early in order to effectively manage and control potential pandemics [5]. It is believed that as many as 40% of individuals with SARS-CoV-2 infection may not show any symptoms (asymptomatic) or show symptoms at a later stage (pre-symptomatic), yet still have the potential to spread the virus to others [6]. Therefore, a dependable laboratory diagnosis is a key tool in promoting, preventing, and controlling infectious [7].
The diagnostic methods for COVID-19 can be divided into two main categories: immunological and molecular tests. Immunological tests involve serological tests that detect antibodies in blood or viral antigens in respiratory secretions. These tests can be performed using point-of-care platforms. Serological tests are particularly important in diagnosing patients with mild to moderate disease when molecular diagnostics are not available [8]. On the other hand, molecular tests detect SARS-CoV-2 RNA, in various specimens primarily in nasopharyngeal samples. These tests typically require proper laboratory infrastructure. Unlike serological tests, most molecular tests require specialized laboratories with advanced equipment and highly trained staff, which limits their use [9]. In addition to the aforementioned tests, other laboratory parameters have been utilized to assist in monitoring patients with COVID-19 [10,11,12].
SARS-CoV-2 can be detected in various specimens, including swabs (nasopharyngeal, oropharyngeal, and anal), saliva, and sputum. The virus can also be found in other bodily fluids like blood, urine, and faeces [13]. This technique is the most widely used with a sensitivity that reaches 98 % [14]. Nasopharyngeal is considered the standard method to collect SARS-CoV-2 samples safely and conveniently as there is no direct contact between the health practitioner and the specimen [15].
The "gold standard" assay for diagnosing both symptomatic and asymptomatic cases is real-time reverse transcription-quantitative polymerase chain reaction (RT-qPCR) [16]. The first protocol, recommended by the World Health Organization (WHO), was published (2020) by the Charité Institute at Berlin University in Germany [4]. This protocol utilizes TaqMan technology and specific primers and probes to detect the RNA-dependent RNA polymerase (RdRp), envelope protein (E), and nucleocapsid protein (N) genes. Additionally, the WHO has reported several in-house methods which are currently being validated in partner laboratories [4] listed in Table 1.
Typically, three steps need to be completed before conducting quantitative PCR. These steps involve 1) purifying total RNA from the sample, 2) eluting and potentially concentrating the material, and 3) synthesizing complementary DNA (cDNA) from the template RNA [17]. However, it is important to note that RNA extraction can be a labour-intensive, infectious, costly, and time-consuming process that requires manual handling, which may introduce experimental errors [17,18].
To begin, the viral RNA is isolated from the collected specimen using commercially available RNA extraction kits. This step is crucial to ensure accurate results by proper sample handling and preventing contamination. Next, complementary DNA (cDNA) is synthesized using a master mix that contains the reverse transcriptase enzyme. The mixture is incubated in a thermal cycler to initiate the reaction. After that, the cDNA, primers, distilled water, and either a DNA probe or SYBR green are pipetted into a 96-well plate. The plate is then placed in the RT-qPCR instrument, and the appropriate thermal cycles are set. To confirm the absence of contaminants and avoid false-positive results when diagnosing COVID-19 patients, a negative control should be used. Additionally, a positive control should be included to ensure an accurate interpretation of the results [19].
The amplification process involves three basic steps: denaturation, annealing, and extension. During denaturation, the temperature increases to separate the double-stranded DNA (dsDNA). During annealing, the temperature drops to allow the primers to bind to the targeted sequences. During extension, the temperature rises, enabling DNA polymerase to add nucleotides to the newly formed DNA strand. This process is repeated approximately 40 times, resulting in new copies of DNA after each cycle. A fluorescent signal is produced each time the probes are released or SYBR green binds to the newly formed dsDNA. Therefore, the fluorescent signal intensity increases with the number of DNA copies after each cycle. The Ct values, or cycle threshold, indicate the number of cycles required for the fluorescent signal intensity to exceed a predefined threshold. Samples with a higher viral load will have a lower Ct value, while higher Ct values indicate smaller amounts of RNA copies in a given sample [19,20].
Since its emergence, reverse transcription-quantitative polymerase chain reaction (RT-qPCR) has been the first approved standard technique for detecting SARS-CoV-2. RT-qPCR is a molecular diagnostic technique that detects the presence of nucleic acids by targeting and amplifying specific genes. This process creates millions of copies from a small number of nucleic acids, allowing for real-time monitoring [19,21,22]. In this technique, primers play a crucial role as they bind to the targeted gene in the DNA strand. Well-designed primers with high specificity are essential to avoid non-specific amplification and the formation of unwanted structures, such as primer dimers, which could lead to false-positive results. Detection of the targeted gene is indicated by DNA probes or fluorescent dyes, such as SYBR green. SYBR green is an intercalating dye that binds to all double-stranded DNA (dsDNA) and produces a fluorescent signal. Probes, on the other hand, consist of a fluorescent reporter that binds to the 5′-end, and a quencher dye that binds to the 3′-end of a specific target in the DNA. When the enzyme DNA polymerase cleaves the probe, the released reporter emits a fluorescent signal, which is detected by the instrument [19].
Results of different RT-PCR protocols have shown variation in their performance depending on the primers and probes [23]. False-negative results can occur mainly because of inadequate extraction of nucleic acid; poor sample quality; low viral load; sample collection time; incorrect sample storage, transportation, and handling; and PCR inhibition [24,25]. Extraction of RNA is a specialized, time-consuming, and labour-intensive process that often creates a bottleneck in workflow. The development of new diagnostic platforms that could improve molecular methods in terms of speed, sensitivity, and accessibility in the diagnosis of COVID-19 is highly needed. However, with the global shortage of extaction kits, many countries have begun to carry out in-house RT-PCR to overcome this shortage [23].
It is, therefore, important to identify a method for pandemic testing, that does not require advanced resources and extended time. A test that delivers a result within 2-3 hours would be a preventive approach as the patients could receive the necessary support and care immediately [26]. Globally, various direct approaches that avoid RNA extraction have been suggested, including heat-processed methods [27,28]. However our method is novel that doesn’t use chelating agents, proteinaseK and other additional chemicals. We use heat and dilution and reduces the cost of the RNA extraction. This was the rationale to initiate this study project. The objective of this study was to compare the diagnostic performance of extraction-free heating and extraction-based methods for SARS-CoV-2 detection.
2. Materials and Methods
2.1. Study Population and Sample Size Calculation
SARS-CoV-2 tested individuals during the fifth wave of the pandemic (June to August, 2020) are considered as the source population. The study involved random selection and retrieval of stored nasopharyngeal specimens. Sample size were calculated using double population propotion formula and obtained a total of 300 (190 positive and 110 Negative) samples. therefore, a total of 300 samples were retrospectively obtained from the National Virology Reference Laboratory, Ethiopian Public Health Institute, in Addis Ababa, Ethiopia which serves as the first national COVID-19 testing laboratory. These specimens were re-tested using the extraction-free dilution and heating (EFHD) technique and comparision were made against extraction based detection method. The clinical samples were handled and processed in a Biosafety Laboratory-2 (BSL-2) at the virology laboratory.
2.2. Method Validation
We intentionally choose a specimen with a Ct-value of 19 and an Internal control (IC) (with VIC dye) having Ct value of 19. This specimen was diluted 1:2 and 1:4 with RNAse-free water. The diluted specimens were then heated at temperatures of 62°C and 72°C for 10, 15, 20, and 30 minutes, as well as at 96°C for 5, 10, 15, and 20 minutes using Eppendorf thermomixer. Considering these heated and diluted specimens as an RNA eluate, we added 10µL of the eluate to 20µL of master mix and performed RT-qPCR using the ABI 7500 (Thermo-Fisher Inc.) using DAAN detection kits (Daan Gene Co., Ltd). The target genes for DAAN detection kits for SARS-CoV-2 primarily focused on the N gene and the ORF1ab gene. These genes are crucial for the detection and identification of the SARS-CoV-2 virus through PCR-based assays. The results showed that at a temperature of 72°C, the N/ORF1a/b Ct values were 24 at 15 min. and 26 at 30 min, , and the VIC (IC) values were 26 at 15 min and 27 at 30 min, respectively. Compared to the conventional extraction-based methods, a difference of five cycle thresholds (Ct-values) was observed. Therefore, a promising and comparable cycle threshold was obtained in the 1:2 diluted specimens exposed to 72°C for 15 minutes.. Following these experimental results, the following study was conducted.
2.3. Selection of Stored Specimens
A total of 300 nasopharyngeal specimens were retrospectively obtained from the repository of the national virology reference laboratory at the Ethiopian Public Health Institute. These specimens were initially collected for clinical diagnosis of COVID-19 using Viral Transport Media (VTM). We randomly choose 190 SARS-CoV-2 positive and 110 negative specimens from the repository of the national reference laboratory, using the unique numbers assigned to each specimen in the laboratory register.
2.4. Extraction Based Protocol (Reference Method)
Extraction was performed manually using the QIAamp Viral RNA Kit (QIAGEN)[29] following the standard protocol. Samples were lysed under highly denaturing conditions to inactivate RNases and to ensure the isolation of intact viral RNA. Buffering conditions were then adjusted to bind RNA to the membrane of the QIAamp plates. Contaminants were efficiently removed using 2 wash buffers and a final wash with ethanol. High-quality RNA was eluted in a special RNase-free buffer, ready for direct use or safe storage. The purified RNA was free of proteins, nucleases, and other contaminants or inhibitors. The special QIAamp membrane guarantees the extremely high recovery of pure, intact RNA without the use of phenol/chloroform extraction or alcohol precipitation.
2.5. PCR Reagent Preparation (Master Mix Preparation)
The PCR reaction solutions A and B (NC/ORF1ab/N) were thawed at room temperature and thoroughly mixed. The solution was then centrifuged at 8,000 rpm for a few seconds. N, which represents the total number of specimens to be tested along with the number of NC (ORF1ab/N) negative controls and positive controls, were added to the PCR reaction tubes. After ensuring thorough mixing of the components, the tubes were briefly centrifuged to ensure all the liquid settled at the bottom of the tube. Finally, 20 µL of the amplification system was aliquoted into each PCR tube. 5 μL of the negative control material, RNA from the specimens to be tested, and positive control material were added to the PCR reaction tubes. After securely covering the tubes, they were transferred to the amplification detection area following centrifugation at 8,000 rpm for brief period of time. Lastly, the reaction tubes were placed in the instrument's sample sink.
2.6. Extraction-Free (EFHD) Protocols (Index Method)
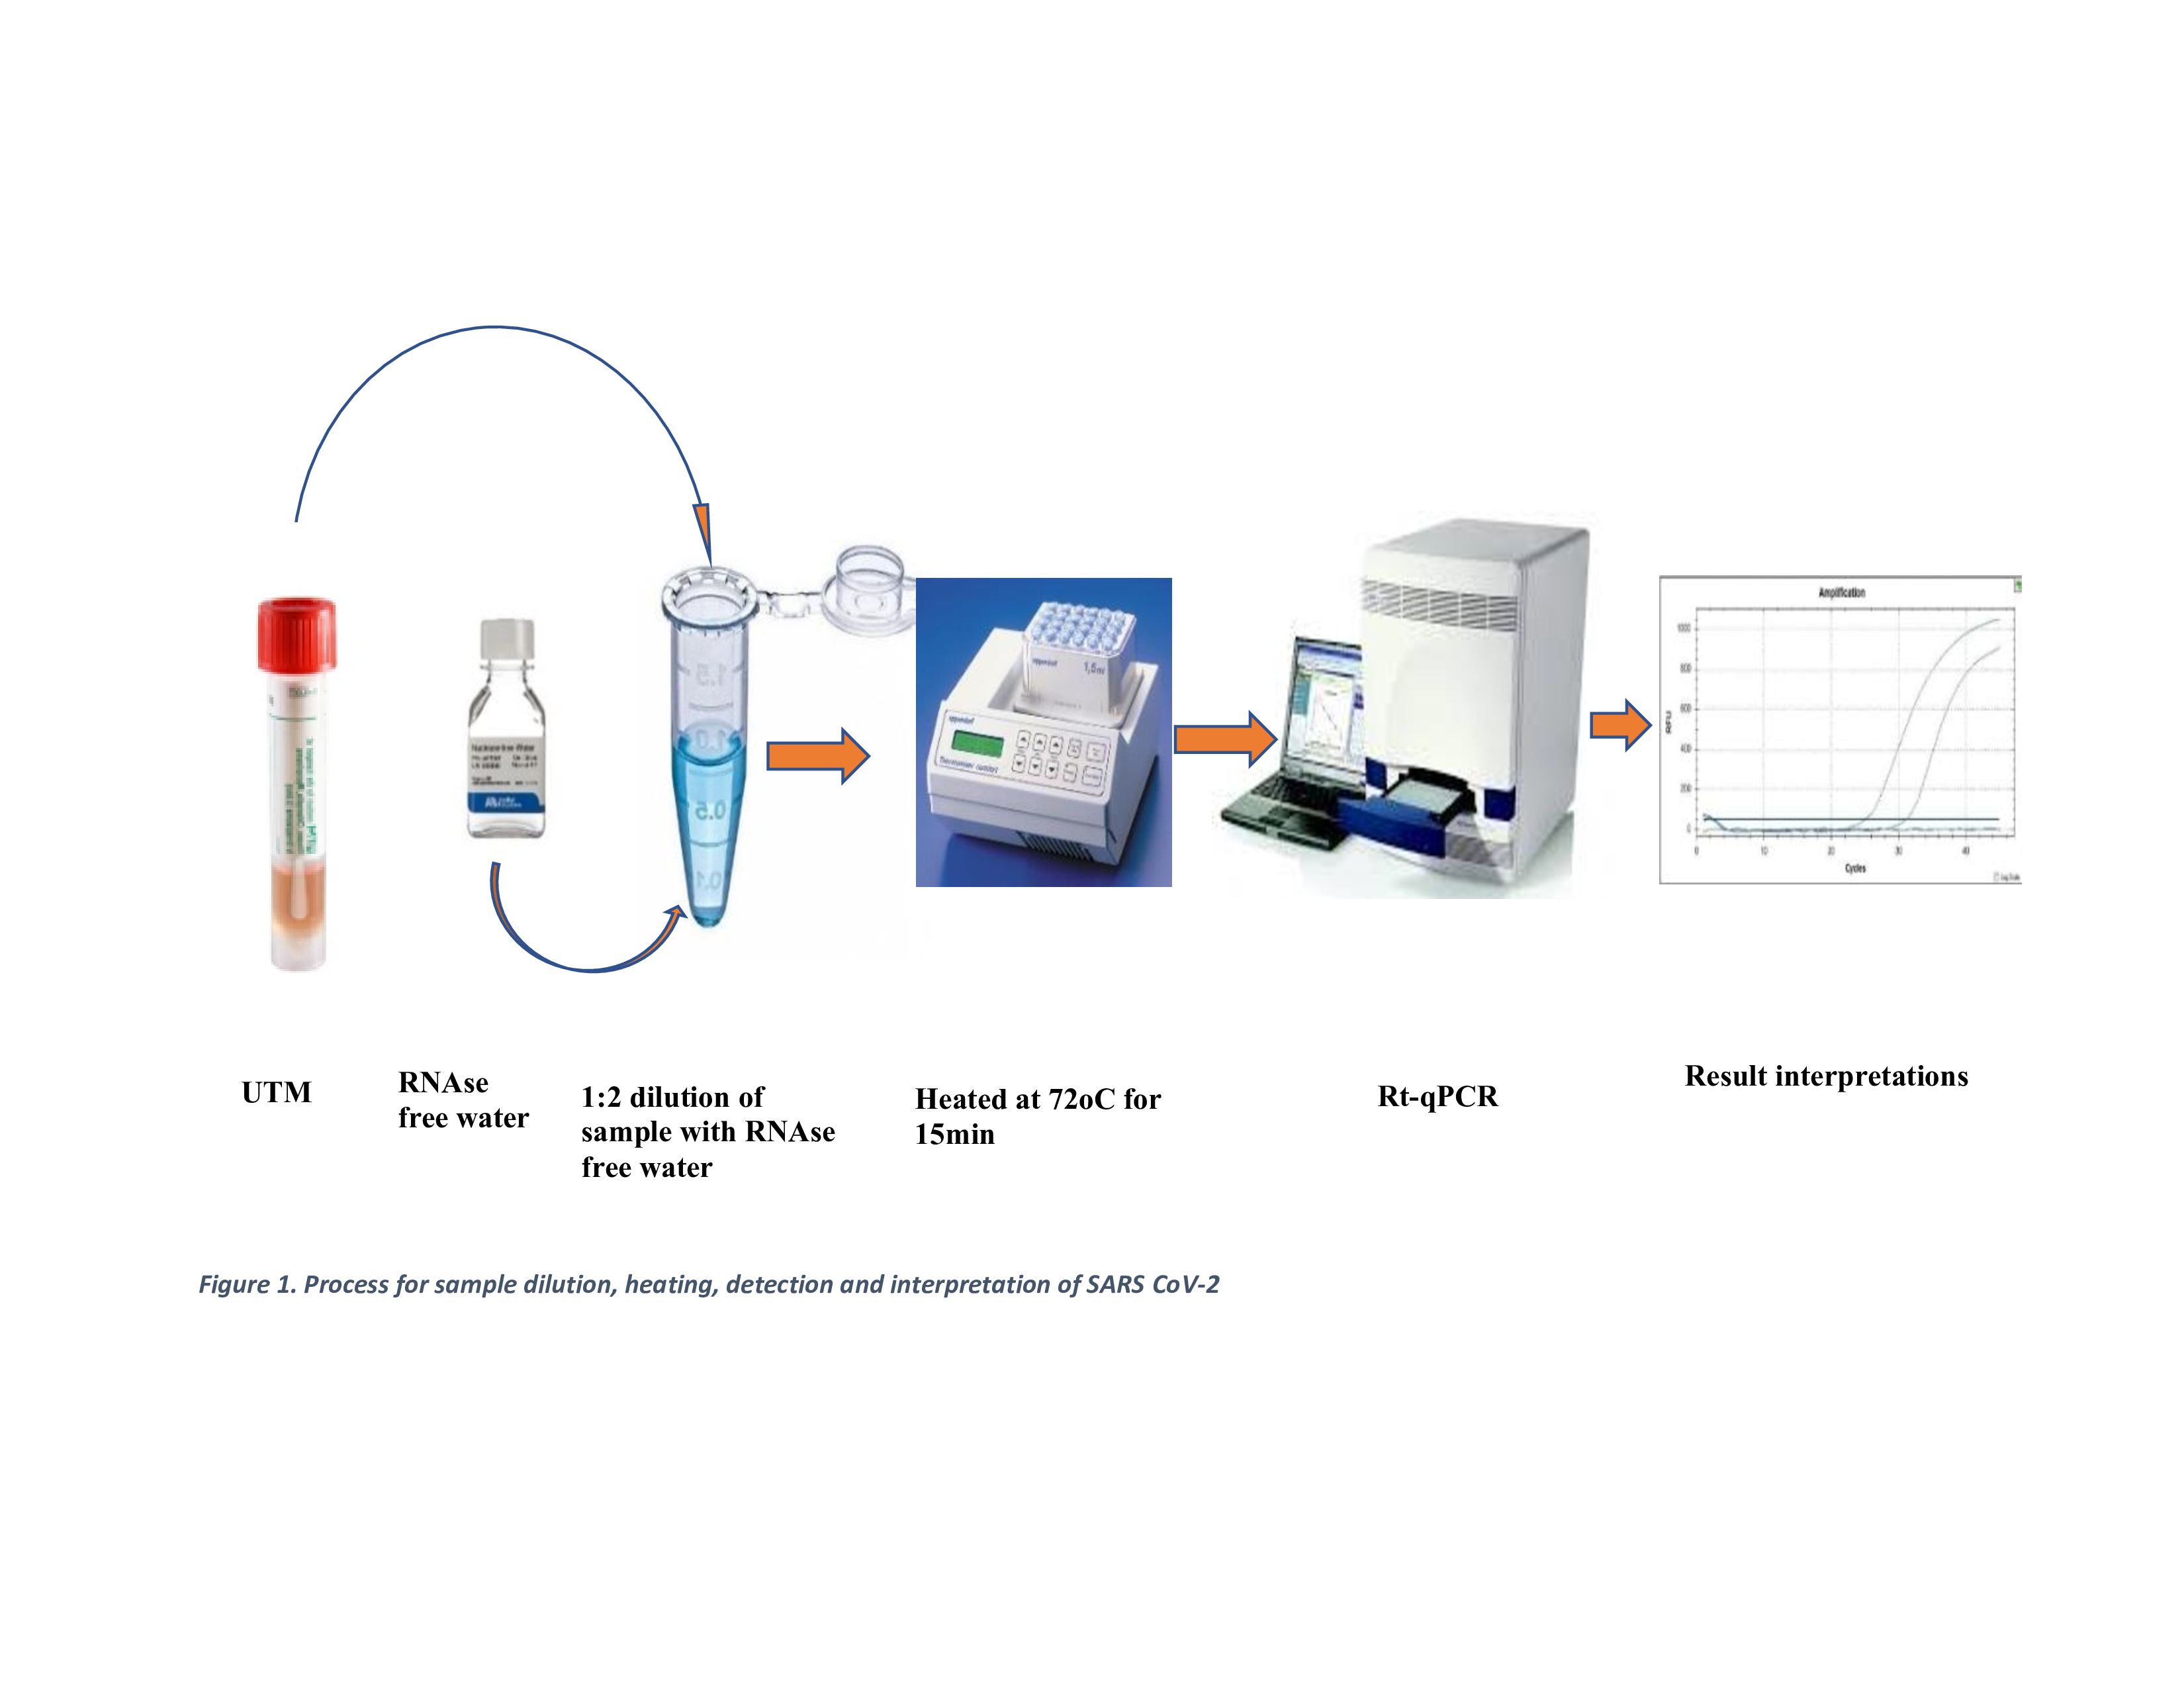
100 µL of each sample was transferred to a heat-resistant 1.5 mL microcentrifuge tube and heated at 72°C for 15 minutes using an Eppendorf Thermomixer. The eluates were then stored at -20°C for up to 4 hours while waiting for other clinical samples to be processed in batches. Afterwards, 10 µL of the eluate was mixed with 20 µL of the master mix, following a similar procedure to the extraction-based eluted samples. Worksheets were prepared with other clinical samples, and detection was conducted using the Applied Biosystems ABI7500 machine, following the laboratory protocol as shown in Figure 1.
2.7. SARS-CoV-2 Detection (RT-qPCR)
The detection (RT-qPCR) was carried out using the ABI 7500 Fast instrument (Thermo Fisher Scientific), along with the DAan kits (Daan Gene Co., Ltd). The protocol consisted of a single cycle of reverse transcription at 50°C for 15 minutes, followed by a single cycle of polymerase activation at 95°C for 2 minutes. This was followed by 40 amplification cycles, each consisting of 15 seconds at 95°C and 60 seconds at 60°C. The purpose of this assay was to detect the presence of the SARS-CoV-2 virus using primers and probes that correspond to the N/ORF1a/b gene. For comparison, the standard extraction-based (EB) technique was used as a reference method, alongside the Extraction-free heated (EFHD) method. The laboratory protocol was used to interpret the results. A Ct value greater than 40, along with the absence of an amplification curve in both the FAM and VIC channels, indicated the absence of SARS-CoV-2 RNA in the sample. On the other hand, a clear amplification curve in both the FAM and VIC channels, with a Ct value of 40 or less, indicated a positive result for SARS-CoV-2 RNA. If the Ct value was 40 or less and an amplification curve was detected in only one channel (either FAM or VIC), while the other channel showed no amplification curve, the results were re-tested. The repeated result was considered the final result.
At each step of both methods, strict quality control measures were taken. In addition to positive and negative control provided in the kit for the extraction method, we used extraction control were also used. All measuring devices in the laboratory were within calibration date, including the thermal cycler.
2.8. Ethics Statement
This study was reviewed and approved by the Institutional Review Board (IRB) of Aklilu Lemma Institute of Pathobiology (ALIPB), Addis Ababa University (AAU) in Ethiopia, with protocol number ALIPB IRB/52/2013/21. Permission letter was obtained from EPHI with reference number of WG12/19 on April 21, 2021. The studies were conducted in accordance with the local legislation and institutional requirements.
2.9. Statistical Analysis
The data were summarized as mean ± Standard Error of the Mean (SEM) and R² (coefficient of determination). The D'Agostino & Pearson test with a 95% confidence interval was used to test for normality. Confidence intervals (CI) for sensitivity, specificity, positive/negative predictive values, and accuracy were calculated using R-studio v.3.6.0. The Wilcoxon signed-rank test was used to compare the two groups. The correlation between the Ct-values of the two techniques was determined using the two-tailed Pearson's correlation coefficient using STATA v17(stata Corp LP, college Station, TX, USA). A p-value of less than 0.05 indicated statistical significance. The Ct values were grouped based on viral load (Ct <20, 20-35, and >35), and performance characteristics in each group were compared.
3. Results
The EFHD method successfully detected 85.8% (163/190) of the positive samples and 100% (110/110) of the negative samples. However, there were 15 false negative results, most of which had an average Ct value of greater than 36 by the ectraction based detection method. Additionally, the EFHD method reported twelve invalid results where the contro line was not amplified. To compare the two methods, excluded the invalid results, we used 178 positive and 110 negative results reported by the extraction based detection method, as shown in Table 2.
The extraction based method resulted in a mean Ct-value of 24.1 (95% CI: 23.3-24.8) with a standard error of the mean (SEM) of 0.4. This method covers a range of Ct-value from 16 to 34.1. on the other hand, the extraction free (EFHD) method had an average Ct-value of 27.7 (95% CI: 26.8-28.7) with a SEM of 0.5. this method also covered a range of Ct-value from 18-38.9. the true prevalence among study participants was 62% (178/288), (95% CI: 56%-67%). The apparent prevalence, which represents the proportion of tru positive out of the the total tested, was 57% (163/288) (95% CI: 51%-62%)
3.1. Diagnostic Performance of Extraction-Free Method
The EFDH method showed an overall sensitivity and specificity of 92% (95 CI: 86%-95%) and 100% (95% CI: 97%-100%) respectively. The positive predictive value was 100% (95% CI: 97%-100%), wile the negative predictive value was 88% (95% CI: 81%-93%). The negative likelihood ratio (NLR), which measures the ability of a test to rule out a disease, was founf to be 0.08 (95% CI: 0.05-0.14). The study also revealed an overall agreement (accuracy) of 95% (95% CI: 92%-97%) for the new method, with a kappa value of 0.89 (p-value < 0.001) (Table 3).
The correlation between the two methods is represented as Y = -0.12+1.16x; R2=0.99, p=0.001, showing a very strong and significant linear relationship between extraction-based and extraction free detection methods. For every unit increase in the Ct-value by the extraction based detection methods, the Ct-value by extraction free detection method increases by approximately 1.16 unit (Figure 2). The wilcoxone signed-rank test results (z = 11.08, p-value=0.0001) indicated a statistically significance difference between the Ct values obtained from the extraction based and EFHD detection methods. It appears that the extraction based method generally produces lower Ct-values compared to the extraction free (EFHD) method across all observations.
3.2. Comparison of Performance Characteristics in Terms of Ct-Value
Regarding the samples with a Ct-value less than 20 (38 samples), both techniques correctly identified 100% sampls as true positives. Out of the 124 results with a Ct value ranging from 20 to 35, 121 (98%) were true positives. For the remaining 119 test results with a Ct value higher than 35, the new method resulted with nine false negatives. These findings demonstrated that a higher level of sensitivity in the Ct<20 group, as both techniques accurately identified all samples as positive. In the Ct value 20-35 group, both techniques mostly detected positive samples, but the extraction free method had 2% false negativity (3 samples). Lastly, the new technique showed low sensitivity in the Ct value greater than 35 group. Therefore, these results suggested that the EFHD method is more reliable for detecting SARS-CoV-2 with a higher viral load (Table 4).
4. Discussion
In this study we tested the EFHD method in comparision with the standard extraction based SARS-CoV-2 detection method. It was found that the EFHD method has showed high sensitivity, specificity, positive and negative predictive values specially when the viral load of SARS-CoV-2 are higher. In addition, the new method has better agreement and correlation with the reference method. However, the mean cycle threshold values for the new method were skightly higher but generally comparable to the gold standard method. The findings suggested that the EFHD method is particularly reliable for detecting SARS-CoV-2 in case with a higher varal load. Despite some limitations in samples with low viral loads or higher Ct values, the new method demonstrated overall high accuracy and closely aligned with the results of the extraction based method, indicating a strong performance and reliability.
In this study, the performance of the new diagnostic methods showed comparable diagnostic capability with the standard method. It had good sensitivity and specificity. This finding align with a study conducted in India, which reported an over all sensitivity of 79% (95% CI: 71%-86%) and specificity of 99% (95% CI: 98%-100% [30]. Another study on extraction-free, multiplexed amplification of SARS-CoV-2 demonstrated a sensitivity of 86% and specificity of 100% [31]. Similarly, a study conducted at the Karolinska University Hospital in Stockholm, Sweden in 2020, using a heating technique at 95°C for 5 minutes, reported a sensitivity of 96.0% and specificity of 99.8% [17]. In contrast, a study conducted in India and Italy reported lower overall sensitivity, specifically 78.9% (95% CI 71–86%) and 57.3% (95% CI 47.3–66.8%), respectively. However, both studies reported comparable specificity, specifically 99.9% (95% CI 98–99.6%) and 100% (95% CI 94.4%–100%) [32].
This study also found that a heightened positive and negative predictive value. Which indicated excellent specificity in identifying true positives, thus enhancing the reliability of the method for confirming the presence of the diseases. However, the findings also highlighted the need for improvement in reducing false negative. This will enhance the method utility in ruling out the diseases. Similar findings were reported in a study conducted in the United Arab Emirates (UAE) in 2021. It showed a positive predictive value of 92% and a negative predictive of 91% [33]. The finding also similar with study done in India in 2021, with a PPV and NPV of 92% amd 97% respectively [30].
In this study, the overall agreement between extraction-based and EFHD methods was found to be 95%, with a kappa value of 0.89 (p value=0.000). This indicates a high level of reliability in detecting SARS-CoV-2 infections. Similar findings were reported in a study conducted in India, where the agreement was 96.8% (k = 0.83, S.E. = 0.03) [30]. Additionally, a study conducted in Sweden showed an accuracy of 98.8% (95% confidence interval, CI95: 97.5–99.5%) [17], while a study in the UAE reported an overall agreement (kappa coefficient) of 0.797 (p < 0:001) [33]. However, different findings were reported from a study conducted at the clinical laboratory of the Institute Pasteur of M'sila, Algeria, where the overall agreement between extracted and heat-inactivated (65oC for 30 min) samples was only 45%, with a 95% confidence interval of 37 to 52% [34]. In this study, a near-perfect correlation (R2 = 0.99, p=0.001) was found between extraction-based and extraction-free heating (EFHD) methods, supporting the consistency and reliability of the EFHD method in detecting SARS-CoV-2. These findings are further supported by a study conducted in Singapore (2020), which showed a correlation coefficient (R2) of 0.9986 for the detection of SARS CoV-2 without extraction. Similar results were reported from the Karolinska University Hospital in Stockholm, Sweden, with a correlation coefficient of 0.987 [17].
The consistent findings from various studies utilizing extraction-free method for SARS-CoV-2 detection can be attributed to the method's simplicity, the inherent properties of the SARS-CoV-2 virus, and its validation against established standards. These factors contribute to the method's robustness and reliability in detecting SARS-CoV-2, making it a valuable tool in the fight against the COVID-19 pandemic [35]. Despite the challenges, the overall high performance of the technique supports its continued use in surveillance and outbreak control efforts. However, the potential for false negatives emphasizes the importance of comprehensive testing strategies, including targeted testing of high-risk populations and asymptomatic individuals [36]. This method's advantages in terms of speed and simplicity, combined with its high sensitivity and specificity, make it a compelling alternative for SARS-CoV-2 detection, especially in resource-limited settings or during rapid response scenarios [37].
These findings highlight the strengths and limitations of the extraction-based method in detecting SARS-CoV-2 across different viral load statuses. Notably, the method exhibits high sensitivity and specificity in lower Ct values (< 35). However, its performance decreases in the detection of low viral loads, as evidenced by an increased rate of false negatives. A study conducted in Austria to evaluate extraction-free RT-qPCR methods for SARS-CoV-2 diagnostics showed an 8.2% false negative rate for the EFHD method in samples with a Ct value >30 [38]. Another finding from Algeria on the detection of SARS-CoV-2 using heat inactivation at 65oC at 30 min correctly identified 100% of clinical samples with a high viral load (Ct value < 30) [34]. Accurate detection of SARS-CoV-2, even at high viral loads, is crucial for early case identification, contact tracing, and isolation measures.
5. Conclusion
The findings suggested that the EFHD may serve as a more reliable option for detecting SARS-CoV-2 in samples with low Ct values. It offer a potential advantage in setting where resources are limited or rapid turnaround time are required. Despite the promising results, the study highlights areas for improvement. The number of invalid and false negative results obtained in the EFHD method necessitates further investigation into the causes of these failures and a new strategy to migate them.
Author Contributions
GH: Conceptualization, Data curation, Formal analysis, Investigation, Methodology, writing original draft, Writing review & editing. MB: Conceptualization, Data curation, Formal analysis, Writing review & editing. GM: Formal analysis, Methodology, Writing review & editing. AT, NY, AG, AA, AK: Investigation, Methodology, Writing review & editing. SA: Analysis, Writing review & editing. ML: Conceptualization, Data curation, Formal analysis, Investigation, Methodology, writing original draft, Writing review & editing.
Funding
This study received no external funding.
Institutional Review Board Statatement
The study was conducted according to the guidelines of the Declaration of Helsinki. Ethical review and approval were obtained from the Institutional Review Board (IRB) of the Aklilu Lemma Institute of Pathobiology at Addis Ababa University, under protocol number ALIPB IRB/52/2013/21. Permission letter was obtained from the Ethiopian Public Health Institute to use leftover samples from repositories.
Data Availability Statement
All relevant data are available from the corresponding author upon request.
Acknowledgments
The authors are grateful to the Ethiopian Public Health Institute and the Addis Ababa University for their support, coordination and providing the testing laboratories. The authors would like to express their special thanks to all who participated in data collection and the laboratory activities.
Conflicts of Interest
The authors declare no competing interests.
References
- Wu, A.; Peng, Y.; Huang, B.; Ding, X.; Wang, X.; Niu, P.; et al. Genome Composition and Divergence of the Novel Coronavirus (2019-nCoV) Originating in China. Cell Host Microbe. 2020, 27, 325–328. [Google Scholar] [CrossRef] [PubMed]
- Huang, Y.; Yang, C.; Xu, X.F.; Xu, W.; Liu, S.W. Structural and functional properties of SARS-CoV-2 spike protein: Potential antivirus drug development for COVID-19. Acta Pharmacol Sin. 2020, 41, 1141–1149. [Google Scholar] [CrossRef] [PubMed]
- Harvey, W.T.; Carabelli, A.M.; Jackson, B.; Gupta, R.K.; Thomson, E.C.; Harrison, E.M.; et al. SARS-CoV-2 variants, spike mutations and immune escape. Nat Rev Microbiol. 2021, 19, 409–424. [Google Scholar] [CrossRef] [PubMed]
- Corman, V.M.; Landt, O.; Kaiser, M.; Molenkamp, R.; Meijer, A.; Chu, D.K.; et al. Detection of 2019 novel coronavirus (2019-nCoV) by real-time RT-PCR. Euro Surveill. 2020, 25, 2000045. [Google Scholar] [CrossRef] [PubMed]
- Quantitatively assessing early detection strategies for mitigating COVID-19 and future pandemics | Nature Communications [Internet]. [cited 2024 May 2]. Available from: https://www.nature.com/articles/s41467-023-44199-7.
- Transmission risk of asymptomatic SARS-CoV-2 infection: A systematic review and meta-analysis - PMC [Internet]. [cited 2024 Jul 18]. Available from: https://www.ncbi.nlm.nih.gov/pmc/articles/PMC9757919/.
- Joynt, G.M.; Wu, W.K. Understanding COVID-19: What does viral RNA load really mean? Lancet Infect Dis. 2020, 20, 635–636. [Google Scholar] [CrossRef]
- Sethuraman, N.; Jeremiah, S.S.; Ryo, A. Interpreting Diagnostic Tests for SARS-CoV-2. JAMA. 2020, 323, 2249–2251. [Google Scholar] [CrossRef]
- Loeffelholz, M.J.; Tang, Y.W. Laboratory diagnosis of emerging human coronavirus infections - the state of the art. Emerg Microbes Infect. 2020, 9, 747–756. [Google Scholar] [CrossRef]
- Cheng, V.C.C.; Lau, S.K.P.; Woo, P.C.Y.; Yuen, K.Y. Severe acute respiratory syndrome coronavirus as an agent of emerging and reemerging infection. Clin Microbiol Rev. 2007, 20, 660–694. [Google Scholar] [CrossRef]
- Ferrari, D.; Motta, A.; Strollo, M.; Banfi, G.; Locatelli, M. Routine blood tests as a potential diagnostic tool for COVID-19. Clin Chem Lab Med. 2020, 58, 1095–1099. [Google Scholar] [CrossRef]
- Clinical, laboratory and imaging features of COVID-19: A systematic review and meta-analysis - ScienceDirect [Internet]. [cited 2024 Jul 2]. Available from: https://www.sciencedirect.com/science/article/pii/S1477893920300910.
- Body Localization of ACE-2: On the Trail of the Keyhole of SARS-CoV-2 - PMC [Internet]. [cited 2024 Jul 20]. Available from: https://www.ncbi.nlm.nih.gov/pmc/articles/PMC7744810/.
- SARS-CoV-2: Structure, Biology, and Structure-Based Therapeutics Development - PMC [Internet]. [cited 2024 Jul 20]. Available from: https://www.ncbi.nlm.nih.gov/pmc/articles/PMC7723891/.
- How to Obtain a Nasopharyngeal Swab Specimen - PubMed [Internet]. [cited 2024 Jul 20]. Available from: https://pubmed.ncbi.nlm.nih.gov/32302471/.
- Böger, B.; Fachi, M.M.; Vilhena, R.O.; Cobre, A.F.; Tonin, F.S.; Pontarolo, R. Systematic review with meta-analysis of the accuracy of diagnostic tests for COVID-19. American Journal of Infection Control. 2021, 49, 21–29. [Google Scholar] [CrossRef]
- Smyrlaki, I.; Ekman, M.; Lentini, A.; Rufino De Sousa, N.; Papanicolaou, N.; Vondracek, M.; et al. Massive and rapid COVID-19 testing is feasible by extraction-free SARS-CoV-2 RT-PCR. Nat Commun. 2020, 11, 4812. [Google Scholar] [CrossRef] [PubMed]
- Bruce, E.A.; Huang, M.L.; Perchetti, G.A.; Tighe, S.; Laaguiby, P.; Hoffman, J.J.; et al. Direct RT-qPCR detection of SARS-CoV-2 RNA from patient nasopharyngeal swabs without an RNA extraction step. Lieberman RL, editor. PLoS Biol. 2020, 18, e3000896. [Google Scholar] [CrossRef] [PubMed]
- Alhamid, G.; Tombuloglu, H.; Rabaan, A.A.; Al-Suhaimi, E. SARS-CoV-2 detection methods: A comprehensive review. Saudi Journal of Biological Sciences 2022, 29. Available online: https://www.ncbi.nlm.nih.gov/pmc/articles/PMC9512523/ (accessed on 20 July 2024). [CrossRef] [PubMed]
- RT-qPCR Testing of SARS-CoV-2: A Primer - PMC [Internet]. [cited 2024 Jul 20]. Available from: https://www.ncbi.nlm.nih.gov/pmc/articles/PMC7215906/.
- Aoki, M.N.; Coelho B de, O.; Góes, L.G.B.; Minoprio, P.; Durigon, E.L.; Morello, L.G.; et al. Colorimetric RT-LAMP SARS-CoV-2 diagnostic sensitivity relies on color interpretation and viral load. Scientific Reports 2021, 11. Available online: https://www.ncbi.nlm.nih.gov/pmc/articles/PMC8079700/ (accessed on 20 July 2024). [CrossRef] [PubMed]
- Tombuloglu, H.; Sabit, H.; Al-Suhaimi, E.; Al Jindan, R.; Alkharsah, K.R. Development of multiplex real-time RT-PCR assay for the detection of SARS-CoV-2. PLoS ONE. 2021, 16, e0250942. [Google Scholar] [CrossRef]
- SciELO - Brazil - Laboratory diagnosis for Covid-19: A mini-review Laboratory diagnosis for Covid-19: A mini-review [Internet]. [cited 2024 Jul 5]. Available from: https://www.scielo.br/j/rsbmt/a/P66HT68grCDFzSyshYgRqLf/.
- Lv, D.F.; Ying, Q.M.; Weng, Y.S.; Shen, C.B.; Chu, J.G.; Kong, J.P.; et al. Dynamic change process of target genes by RT-PCR testing of SARS-Cov-2 during the course of a Coronavirus Disease 2019 patient. Clin Chim Acta. 2020, 506, 172–175. [Google Scholar] [CrossRef]
- Tahmasebi, S.; Khosh, E.; Esmaeilzadeh, A. The outlook for diagnostic purposes of the 2019-novel coronavirus disease. J Cell Physiol. 2020, 235, 9211–9229. [Google Scholar] [CrossRef]
- Zhao, Y.; Cui, C.; Zhang, K.; Liu, J.; Xu, J.; Nisenbaum, E.; et al. COVID19: A Systematic Approach to Early Identification and Healthcare Worker Protection. Front Public Health. 2020, 8, 205. [Google Scholar] [CrossRef]
- Fomsgaard, A.S.; Rosenstierne, M.W. An alternative workflow for molecular detection of SARS-CoV-2 – escape from the NA extraction kit-shortage, Copenhagen, Denmark, March 2020. Eurosurveillance. 2020, 25, 2000398. [Google Scholar] [CrossRef]
- Villota, S.D.; Nipaz, V.E.; Carrazco-Montalvo, A.; Hernandez, S.; Waggoner, J.J.; Ponce, P.; et al. Alternative RNA extraction-free techniques for the real-time RT-PCR detection of SARS-CoV-2 in nasopharyngeal swab and sputum samples. Journal of Virological Methods. 2021, 298, 114302. [Google Scholar] [CrossRef]
- QIAGEN QIAamp® Viral RNA Mini Handbook, July 2020. - Google Search [Internet]. [cited 2023 Aug 21]. Available from: https://www.google.com/search?q=QIAGEN+QIAamp%C2%AE+Viral+RNA+Mini+Handbook%2C+July+2020.&rlz=1C1GCEU_enET1014ET1014&oq=QIAGEN+QIAamp%C2%AE+Viral+RNA+Mini+Handbook%2C+July+2020.&aqs=chrome..69i57.1026j0j4&sourceid=chrome&ie=UTF-8. 20 July.
- Jayaprakasam, M.; Aggarwal, S.; Mane, A.; Saxena, V.; Rao, A.; Bandopadhyay, B.; et al. RNA-extraction-free diagnostic method to detect SARS-CoV-2: An assessment from two states. India. Epidemiol Infect. 2021, 149, e245. [Google Scholar] [CrossRef]
- Download Citations | ACS Publications [Internet]. [cited 2024 May 2]. Available from: https://pubs.acs.org/action/showCitFormats?doi=10.1021/acs.analchem.0c03918&ref=pdf.
- Morecchiato, F.; Coppi, M.; Baccani, I.; Maggini, N.; Ciccone, N.; Antonelli, A.; et al. Evaluation of extraction-free RT-PCR methods for faster and cheaper detection of SARS-CoV-2 using two commercial systems. International Journal of Infectious Diseases. 2021, 112, 264–268. [Google Scholar] [CrossRef] [PubMed]
- Mahmoud, S.A.; Ganesan, S.; Ibrahim, E.; Thakre, B.; Teddy, J.G.; Raheja, P.; et al. Evaluation of RNA Extraction-Free Method for Detection of SARS-CoV-2 in Salivary Samples for Mass Screening for COVID-19. Gao SJ, editor. BioMed Research International. 2021, 2021, 1–6. [Google Scholar] [CrossRef] [PubMed]
- Mokhtar, K.M. Improved COVID-19 testing by extraction free SARS-Cov-2 RT-PCR [Internet]. 2020 [cited 2024 May 2]. Available from: http://medrxiv.org/lookup/doi/10.1101/2020.08.10.20171512.
- Evaluation of extraction-free RT-qPCR methods for SARS-CoV-2 diagnostics - PubMed [Internet]. [cited 2024 Jun 24]. Available from: https://pubmed.ncbi.nlm.nih.gov/34302551/.
- Diagnostic Laboratory Tests for COVID-19 in US: Methodology and Performance - PMC [Internet]. [cited 2024 Jul 5]. Available from: https://www.ncbi.nlm.nih.gov/pmc/articles/PMC7386512/.
- Hasan, M.R.; Mirza, F.; Al-Hail, H.; Sundararaju, S.; Xaba, T.; Iqbal, M.; et al. Detection of SARS-CoV-2 RNA by direct RT-qPCR on nasopharyngeal specimens without extraction of viral RNA. Darlix JLE, editor. PLoS ONE. 2020, 15, e0236564. [Google Scholar]
- (PDF) Evaluation of extraction-free RT-qPCR methods for SARS-CoV-2 diagnostics [Internet]. [cited 2024 Jul 5]. Available from: https://www.researchgate.net/publication/353436476_Evaluation_of_extraction-free_RT-qPCR_methods_for_SARS-CoV-2_diagnostics.
Figure 1.
Process for sample dilution, heating, detection and interpretation of SARS CoV-2.
Figure 2.
Correlation between extraction-free heating and extraction-based SARS CoV-2 detection methods, Ethiopia.
Figure 2.
Correlation between extraction-free heating and extraction-based SARS CoV-2 detection methods, Ethiopia.
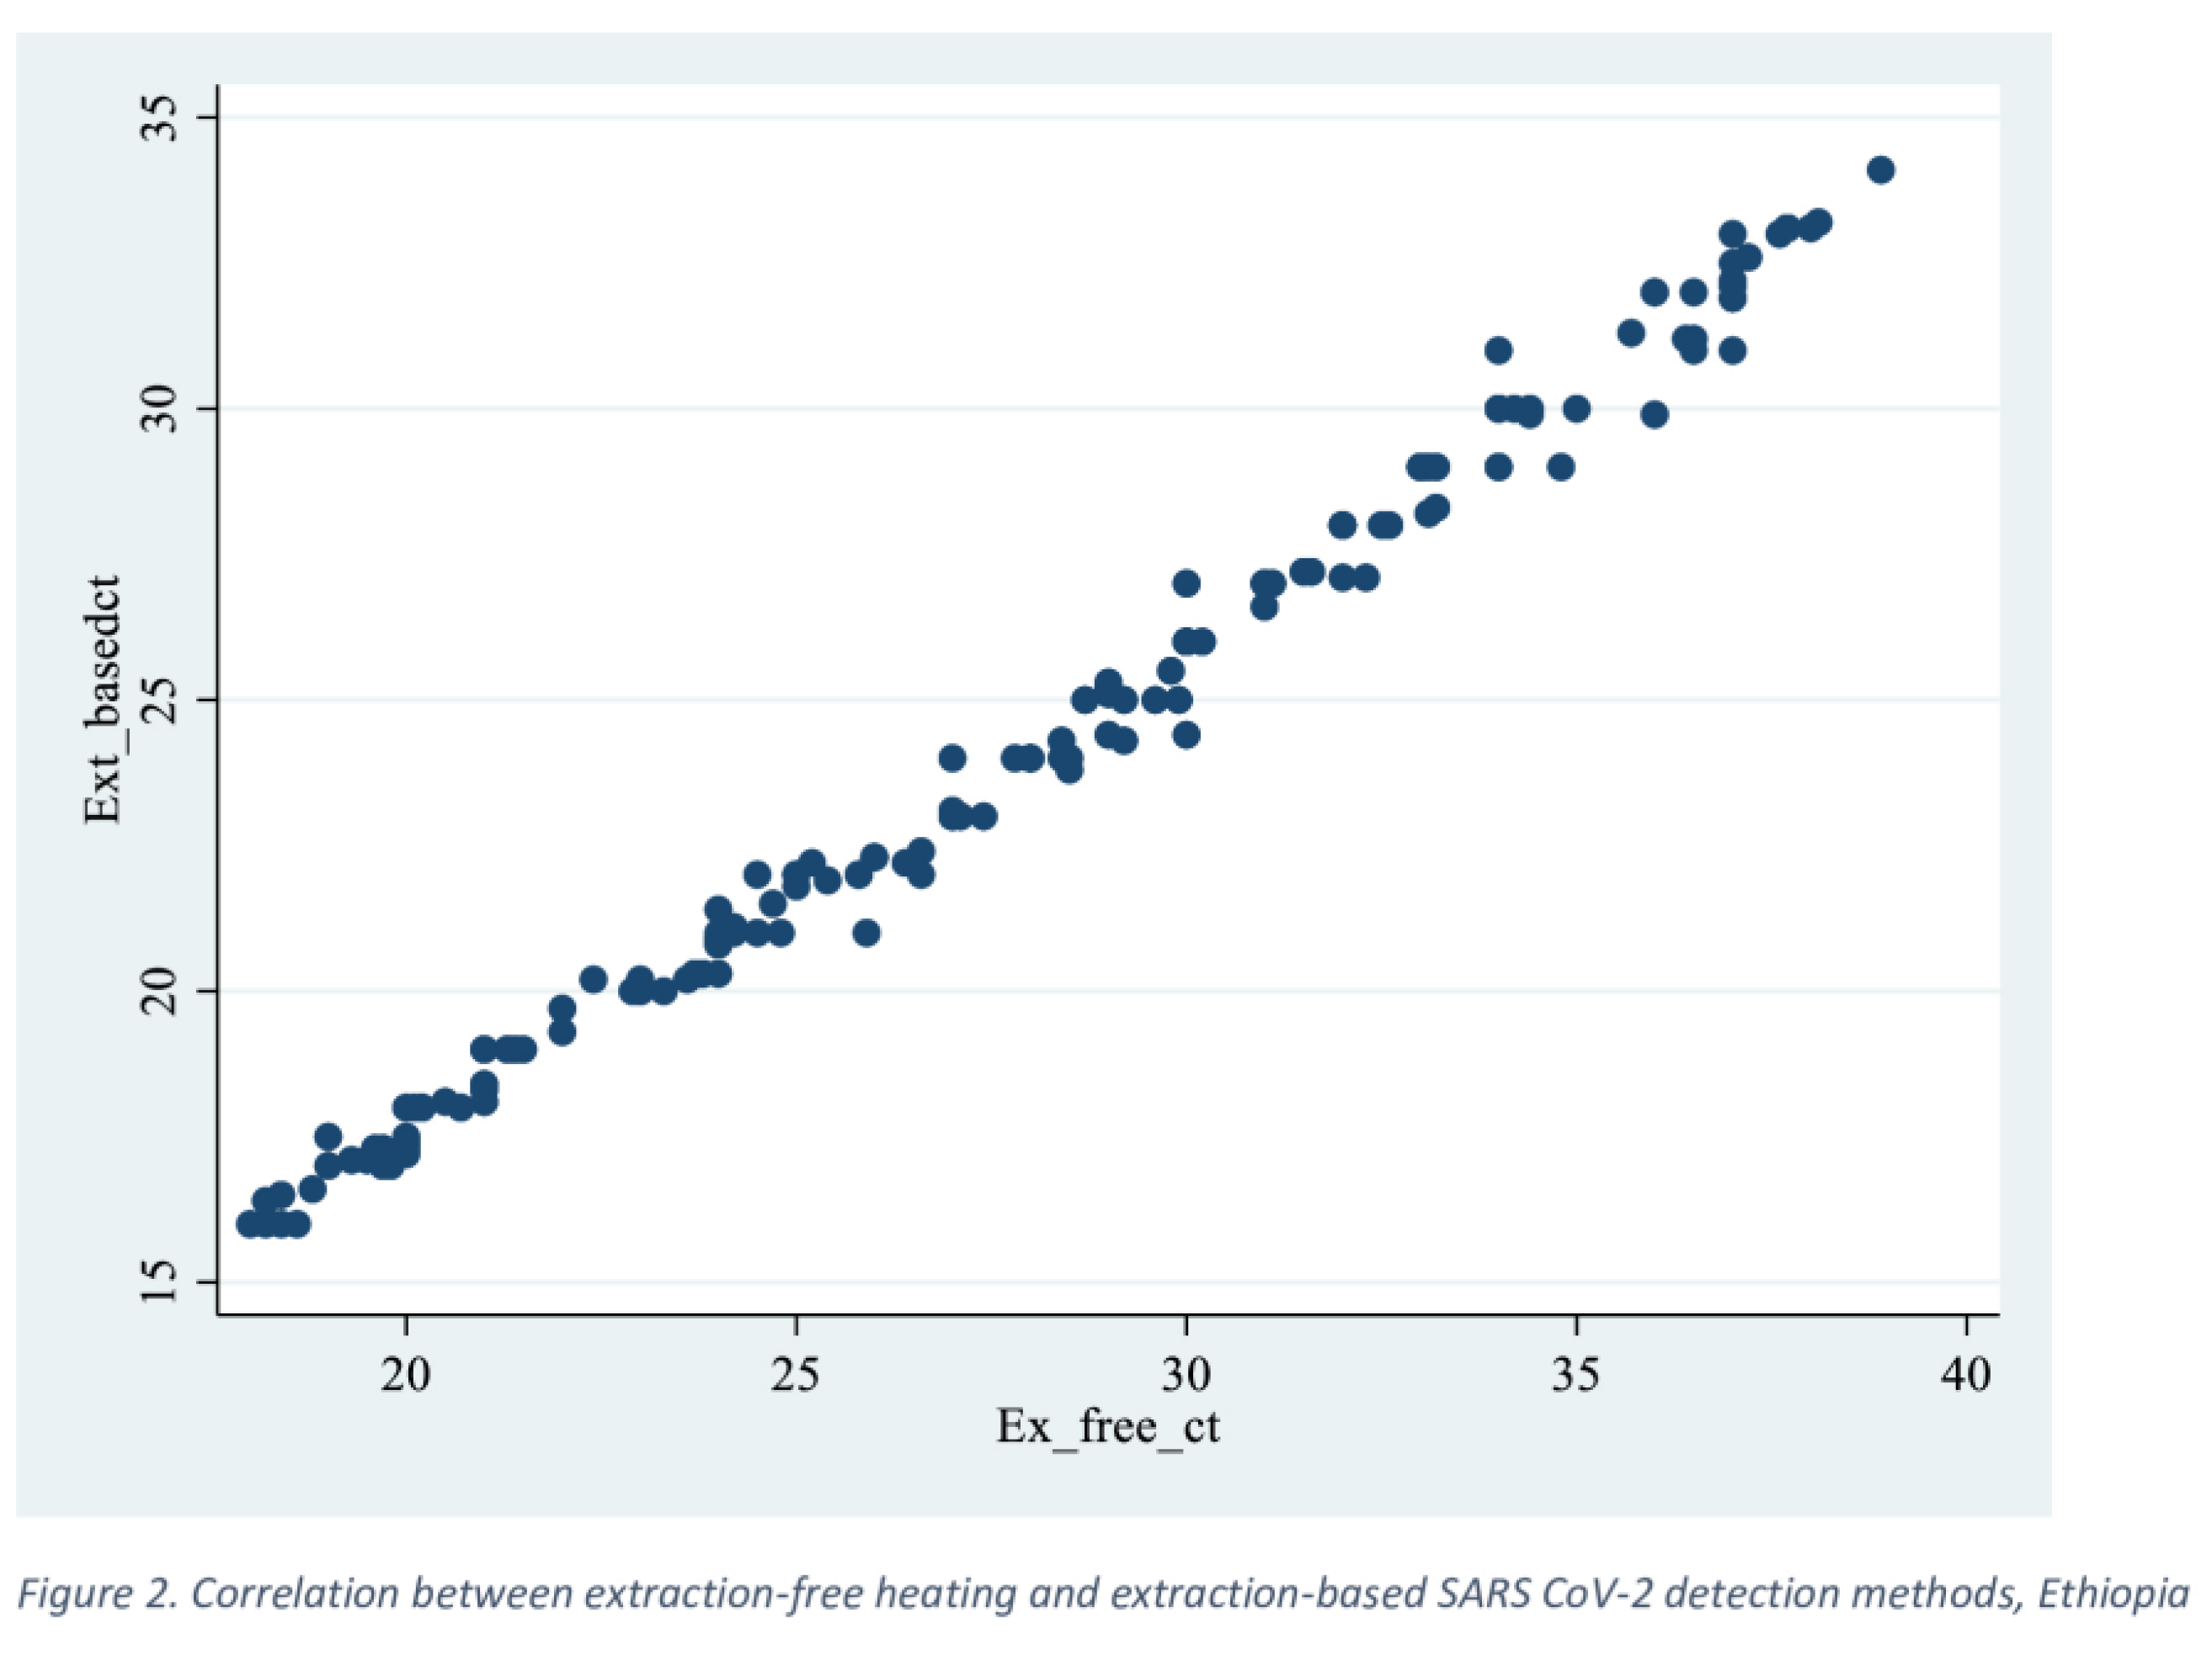

Table 1.
List of RT-PCR protocols indicated by the WHO.
| Institute | Gene Targets |
|---|---|
| China CDC, China | ORF 1ab and N |
| Institute Pasteur, France | Two targets in RdRP |
| US CDC, USA | Three targets in the N gene |
| National Institute of Infectious Disease, Japan | Pancrorona and multiple targets, Spike protein |
| Charité, Germany | RdRP, E, N |
| HKU, Hong Kong SAR | ORF 1b-nsp14, N |
| National Institute of Health, Thailand | N |
Table 2.
Two by two table for comparing extraction-based standard method and Extraction free diluted and heated (EFh+) methods.
Table 2.
Two by two table for comparing extraction-based standard method and Extraction free diluted and heated (EFh+) methods.
| Detection Based Method | |||
| Detection free Method (EFh+) | Positive | Negative | Total |
| Positive | 163 | 0 | 163 |
| Negative | 15 | 110 | 125 |
| Total | 178 | 110 | 288 |
Pearson chi square (P chi) < 0.001.
Table 3.
Performance characteristics of extraction-based and extraction-free heated SARS CoV-2 detection method, Ethiopia.
Table 3.
Performance characteristics of extraction-based and extraction-free heated SARS CoV-2 detection method, Ethiopia.
| Statistic | Value | 95% CI |
|---|---|---|
| Apparent prevalence | 57% | 51% to 62% |
| True Prevalence | 62% | 56% to 67% |
| Sensitivity | 92% | 86% to 95% |
| Specificity | 100% | 85% to 100% |
| Negative Likelihood Ratio | 0.08 | 0.05 to 0.14 |
| Positive Predictive Value | 100% | 98% to 100% |
| Negative Predictive Value | 88% | 81% to 93% |
| Accuracy/Agreement/ | 95% | 92% to 97% |
Table 4.
Performance of extraction-free and extraction-based methods across different Ct value ranges.
Table 4.
Performance of extraction-free and extraction-based methods across different Ct value ranges.
| Extraction free | Extraction based | |||
| Positive | Negative | Total | ||
| Ct <20) | Positive | 38 | 0 | 38 |
| Negative | 0 | 0 | 0 | |
| Total | 38 | 0 | 38 | |
| Ct = 20-35 | Positive | 121 | 0 | 121 |
| Negative | 3 | 0 | 3 | |
| Total | 124 | 0 | 124 | |
| Ct > 35 | Positive | 0 | 0 | 0 |
| Negative | 9 | 110 | 119 | |
| Total | 9 | 110 | 119 | |
Disclaimer/Publisher’s Note: The statements, opinions and data contained in all publications are solely those of the individual author(s) and contributor(s) and not of MDPI and/or the editor(s). MDPI and/or the editor(s) disclaim responsibility for any injury to people or property resulting from any ideas, methods, instructions or products referred to in the content. |
© 2024 by the authors. Licensee MDPI, Basel, Switzerland. This article is an open access article distributed under the terms and conditions of the Creative Commons Attribution (CC BY) license (http://creativecommons.org/licenses/by/4.0/).
Copyright: This open access article is published under a Creative Commons CC BY 4.0 license, which permit the free download, distribution, and reuse, provided that the author and preprint are cited in any reuse.


