Submitted:
08 November 2024
Posted:
08 November 2024
You are already at the latest version
Abstract
The purpose of this study was to determine antibiofilm effect of combined sonication treatment with organic acid on polystyrene surface and to develop a predictive model for Escherichia coli biofilm inactivation. Polystyrene plates containing E. coli biofilm were exposed to sonication with different inactivation solutions (PBS, lactic acid and acetic acid) at different temperatures (20, 40 and 50oC) and times (2 and 5 minutes). The effects of temperature, time and inactivation solution on E. coli biofilm removal were found to be statistically significant (p<0.05). With the use of organic acids, increasing treatment time and temperature, viable cell counts and optical density of E. coli biofilms significantly decreased by 0.43-6.21 log CFU/mL and by 0.13-0.72 (OD600), respectively (p<0.05). The highest E. coli biofilm inactivation was achieved by the combination treatment of organic acid and thermosonication at 50oC for 5 minutes. A significantly positive correlation was found between test methods based on viable cell count and optical density measurement. According to multiple linear regression analysis, R2 values of prediction models for biofilm inactivation in terms of viable cell count and OD were 0.84 and 0.80, respectively. Predictive model developed by using viable cell count data were suggested for food industry and processors due to more accuracy.
Keywords:
1. Introduction
2. Materials and Methods
2.1. Bacterial Strain, Culture Preparation and Organic Acids
2.2. Biofilm Formation
2.3. Crystal Violet Assays of Biofilms and Optical Density
2.4. Count of Viable Cells in Biofilm of E. Coli
2.5. Single and Combined Sonication Treatment against E. coli Biofilm
2.6. Statistical Analysis and Predictive Modelling
3. Results and Discussion
3.1. E. coli Biofilm Formation on Microplates
3.2. Effect of Single Sonication and Combined Sonication Treatment against E. coli Biofilms
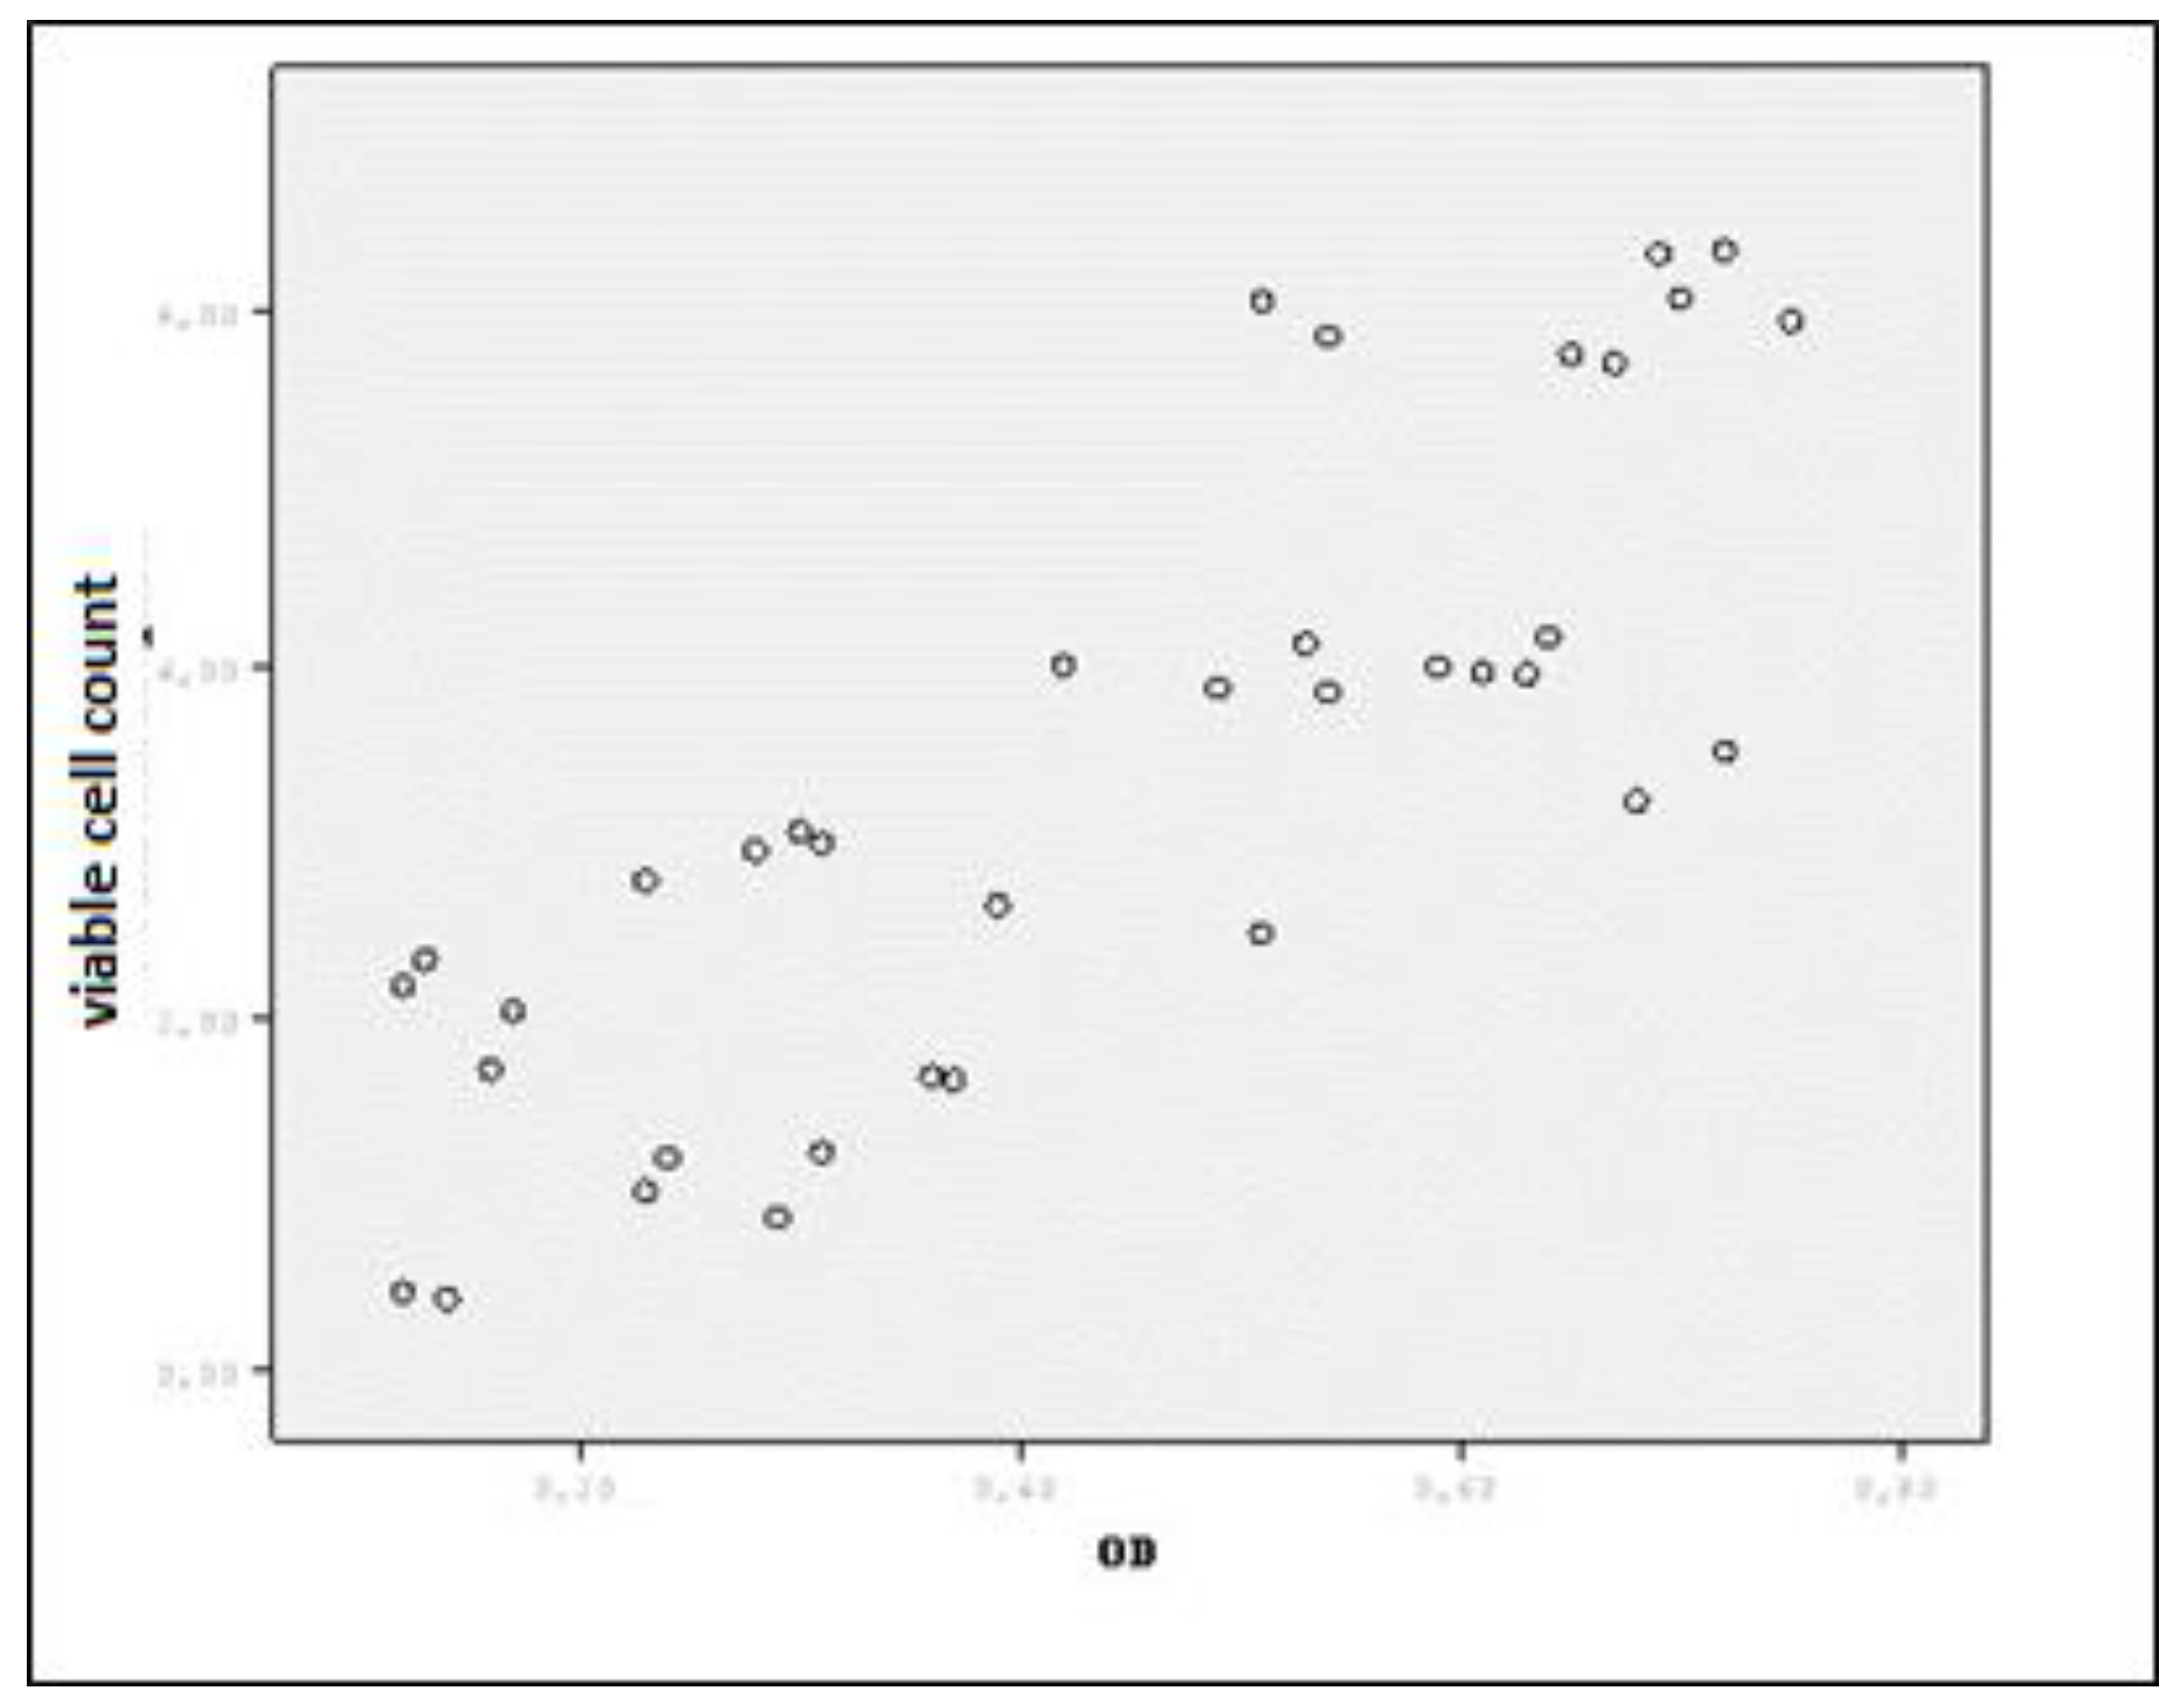
3.3. Relationship Between Biofilm Inactivation Tests
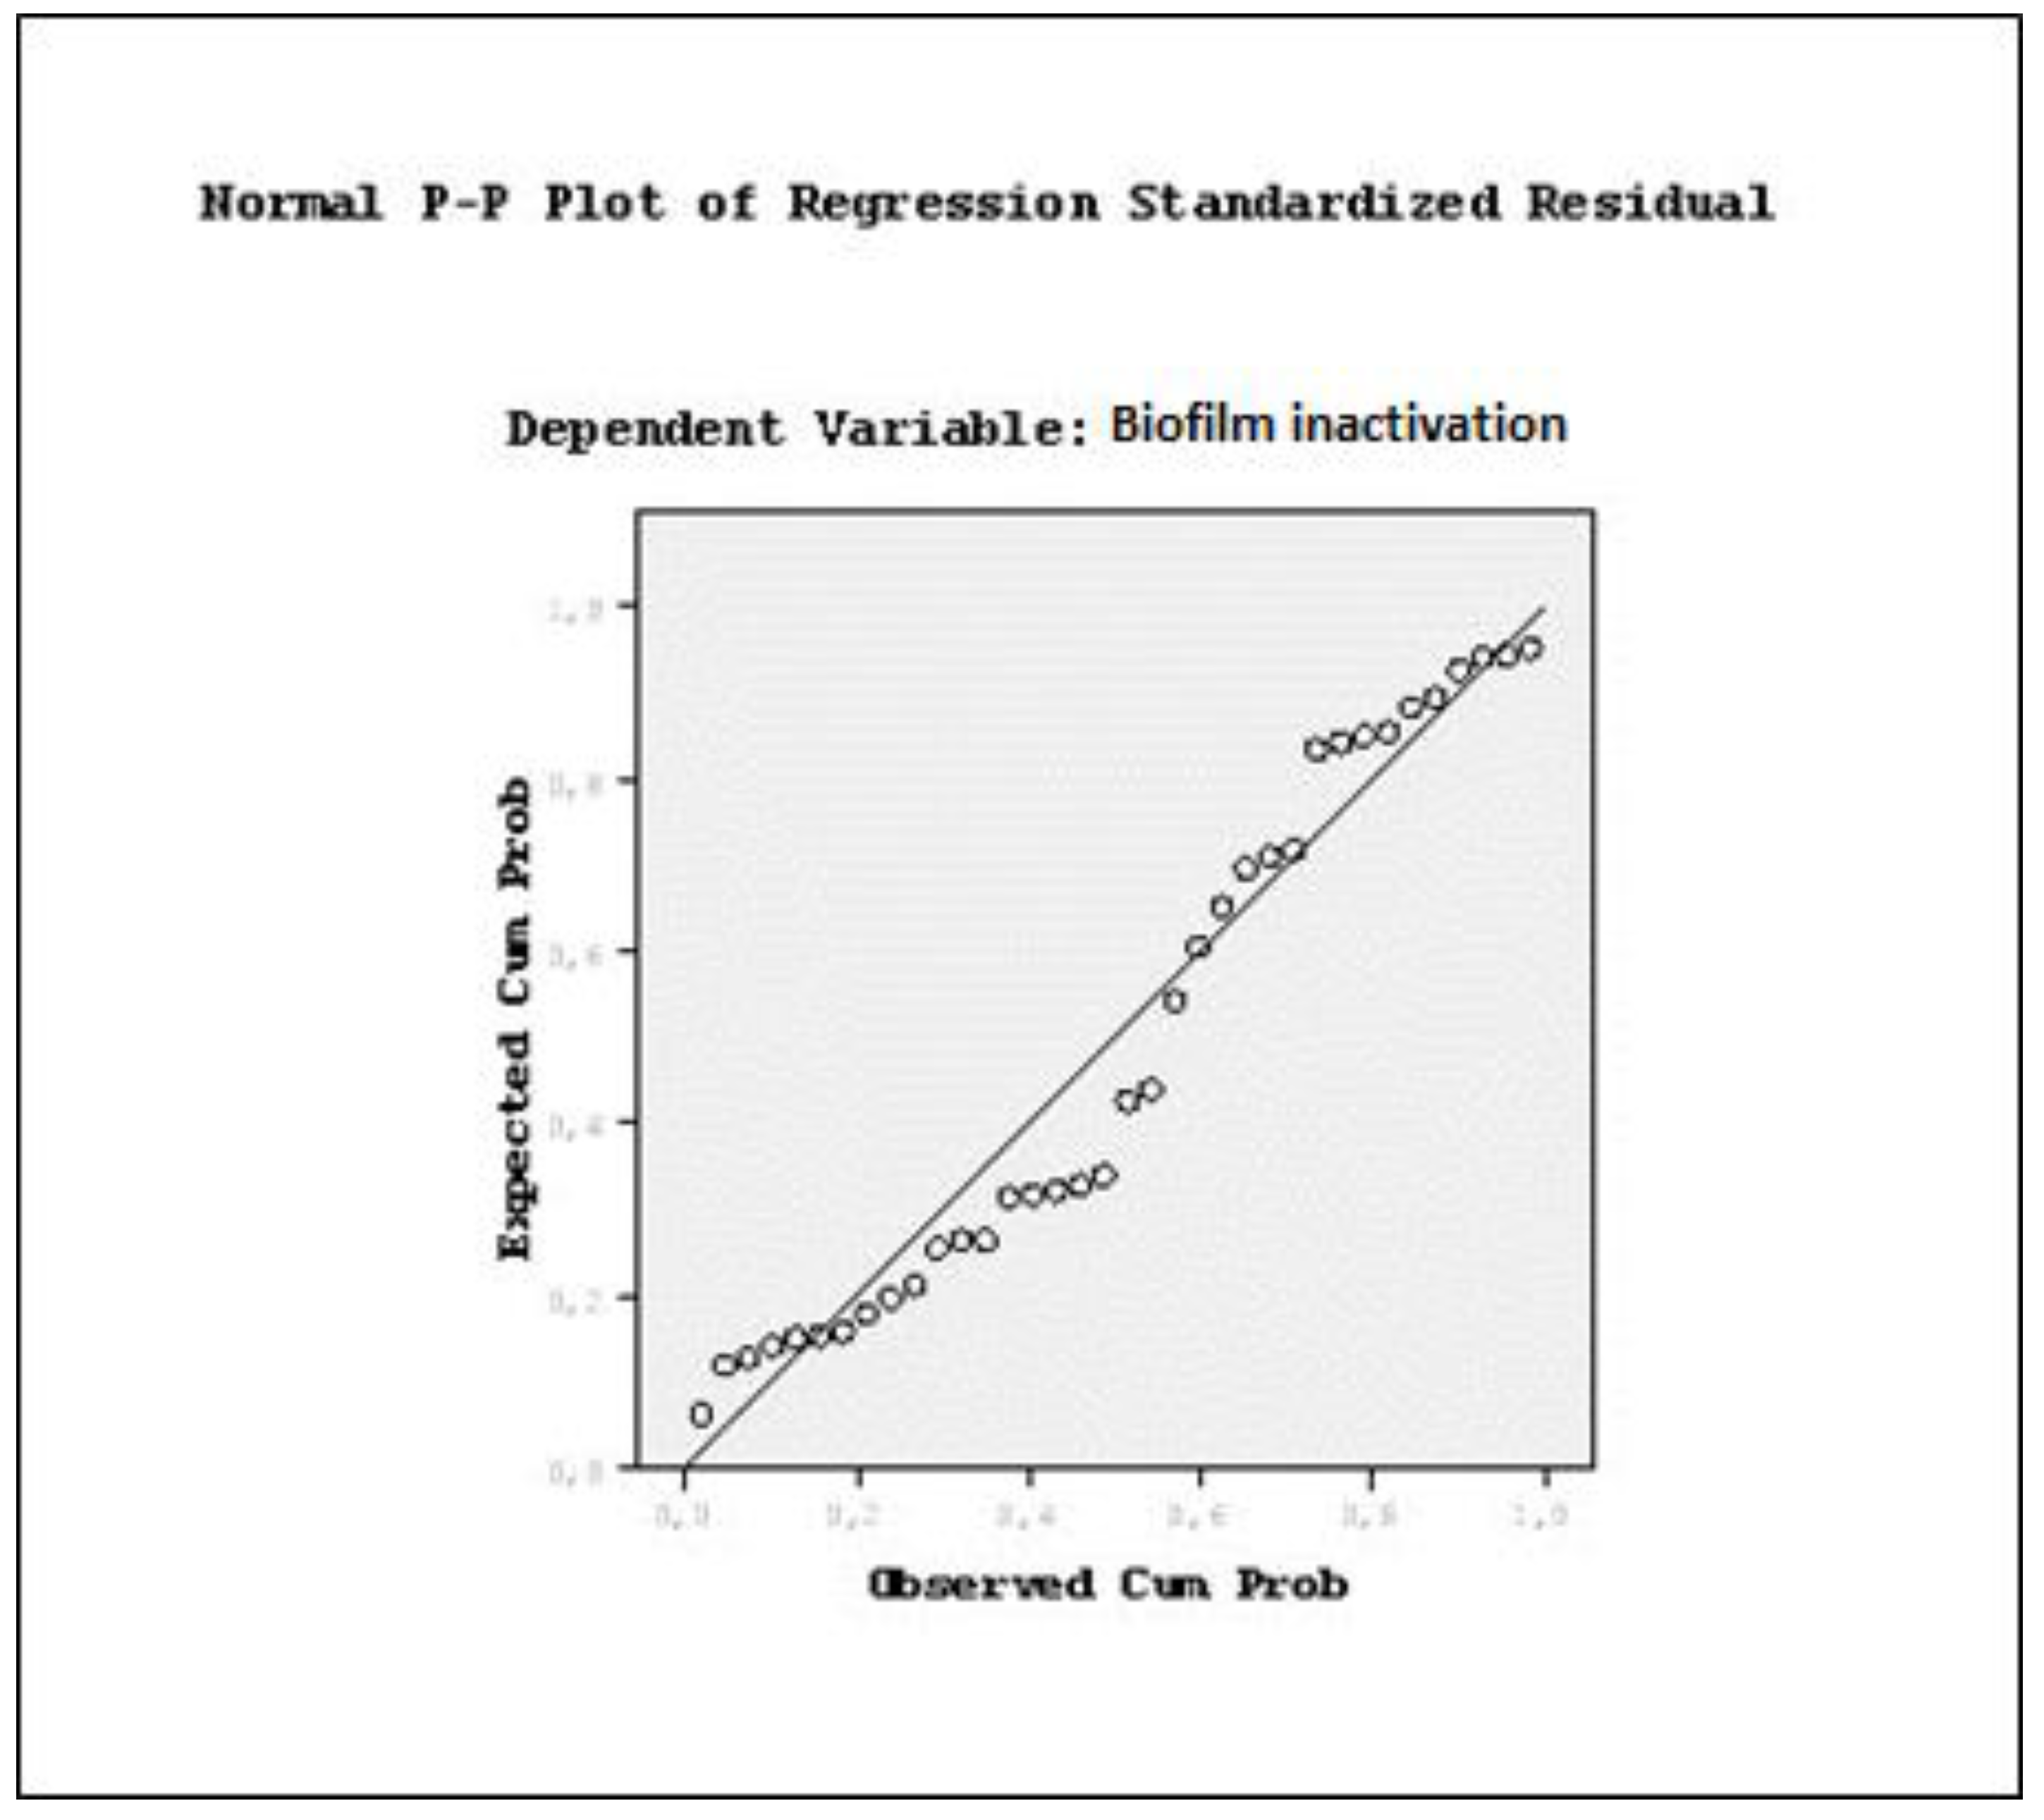
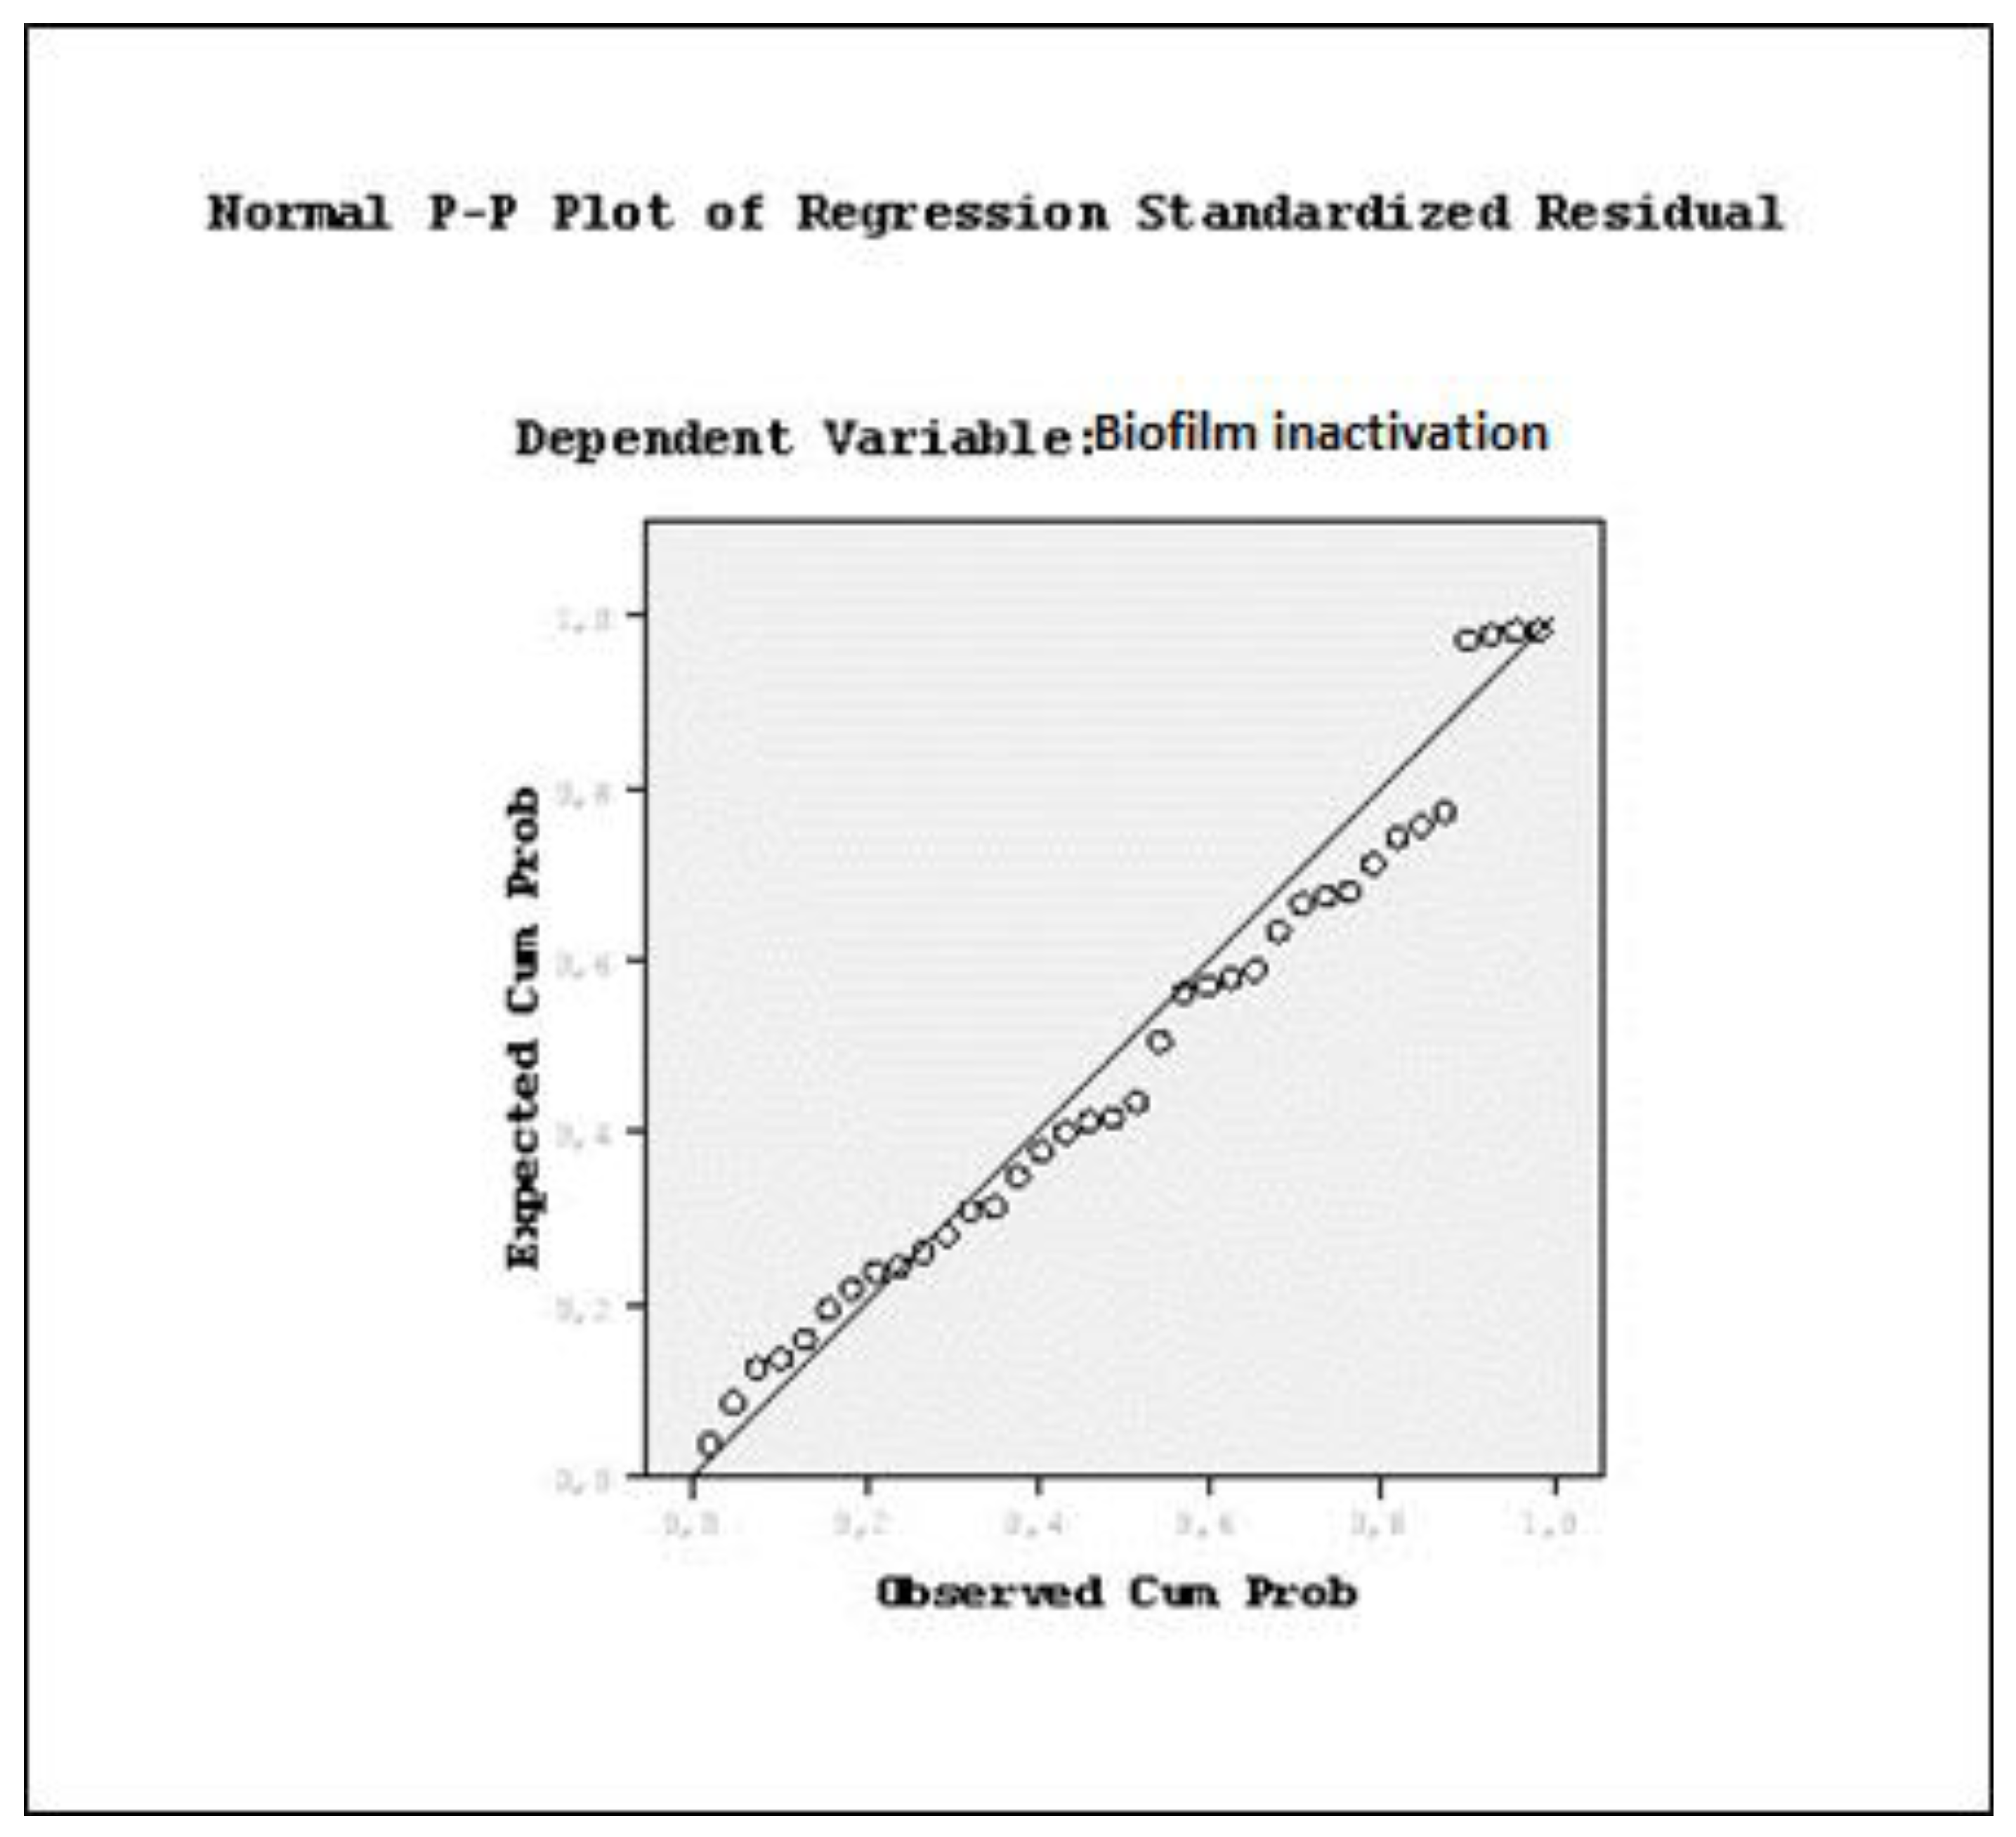
3.4. Modelling E. coli Biofilm Elimination with Regression Analysis
4. Conclusions
References
- Moreno, M.I.; Lomelía, M.L.; Novoa, M.G.A. Kinetics of biofilm formation by pathogenic and spoilage microorganisms under conditions that mimic the poultry, meat, and egg processing industries. Int. J. Food Microbiol. 2019, 303, 32–41. [Google Scholar] [CrossRef] [PubMed]
- Bang, J.; Hong, A.; Kim, H.; Beuchat, L.R.; Rhee, M.S.; Kim, Y.; Ryu, J.H. Inactivation of Escherichia coli O157:H7 in biofilm on food-contact surfaces by sequential treatments of aqueous chlorine dioxide and drying. Int. J. Food Microbiol. 2014, 191, 129–134. [Google Scholar] [CrossRef] [PubMed]
- Liu, X; Yao, H.; Zhao, X.; Ge, C. Biofilm formation and control of foodborne pathogenic bacteria. Molecules 2023, 28, 2432. [CrossRef] [PubMed]
- Zhao, L.; Poh, C.N.; Wu, J.; Zhao, X.; He, Y.; Yang, H. Effects of electrolysed water combined with ultrasound on inactivation kinetics and metabolite profiles of Escherichia coli biofilms on food contact surface. Innov. Food Sci. Emerg. 2022, 76, 1–13. [Google Scholar] [CrossRef]
- Srey, S.; Park, S.Y.; Jahid, I.K.; Ha, S.D. Reduction effect of the selected chemical and physical treatments to reduce L. monocytogenes biofilms formed on lettuce and cabbage. Food Res. Int. 2014, 62, 484–489. [Google Scholar] [CrossRef]
- Sharma, S.; Jaiswal, S.; Duffy, B.; Jaiswal, A.K. Advances in emerging technologies for the decontamination of the food contact surfaces. Food Res. Int. 2022, 151, 110865–1. [Google Scholar] [CrossRef]
- Yu, T.; Ma, M.; Sun, Y.; Xu, X.; Qiu, S.; Yin, J.; Chen, L. The effect of sublethal concentrations of benzalkonium chloride on the LuxS/AI-2 quorum sensing system, biofilm formation and motility of Escherichia coli. Int. J. Food Microbiol. 2021, 353, 109313. [Google Scholar] [CrossRef]
- Unal Turhan, E.; Polat, S.; Erginkaya, Z.; Konuray, G. Investigation of synergistic antibacterial effect of organic acids and ultrasound against pathogen biofilms on lettuce. Food Bioscience 2022, 47, 1–8. [Google Scholar] [CrossRef]
- Lee, H.; Zhou, B.; Feng, H.; Martin, S.E. Effect of pH on inactivation of Escherichia coli K12 by sonication, manosonication, thermosonication, and manothermosonication. J. Food Sci. 2009, 74, 191–198. [Google Scholar] [CrossRef]
- Jose, J.F.B.S.; Andrade, N.J.; Ramos, A.M.; Vanetti, M.C.D.; Stringheta, P.C.; Chaves, J.B.P. Decontamination by ultrasound application in fresh fruits and vegetables. Food Control 2014, 45, 36–50. [Google Scholar] [CrossRef]
- Rani, M.; Sood, M.; Bandral, J.D.; Bhat, A.; Gupta, I. Thermosonication technology and its application in food industry. Int. J. Chem. Stud. 2020, 8, 922–928. [Google Scholar] [CrossRef]
- Abdulstar, A.R.; Altemimi, A.B.; Al-Hilphy, A.R. Exploring the power of thermosonication: A comprehensive review of its applications and impact in the food industry. Foods 2023, 12, 1–22. [Google Scholar] [CrossRef] [PubMed]
- Urango, A.C.M.; Strieder, M.M.; Silva, E.K.; Meireles, M.A.A. Impact of thermosonication processing on food quality and safety: A review. Food Bioprocess Technol. 2022, 15, 1700–1728. [Google Scholar] [CrossRef]
- Esua, O.J.; Sun, D.W.; Ajani, C.K.; Cheng, J.H.; Keener, K.M. Modelling of inactivation kinetics of Escherichia coli and Listeria monocytogenes on grass carp treated by combining ultrasound with plasma functionalized buffer. Ultrason. Sonochem. 2022, 88, 106086. [Google Scholar] [CrossRef]
- Carvalho, D.; Chitolina, G.Z.; Wilsmann, D.E.; Lucca, V.; Emery, B.D.; Borges, K.A.; Furian, T.Q.; Santos, L.R.; Moraes; H.L.S.; Nascimento, V.P. Development of predictive modeling for removal of multispecies biofilms of Salmonella enteritidis, Escherichia coli, and Campylobacter jejuni from poultry slaughterhouse surfaces. Foods 2024, 13, 1703.
- Avila, C.R.; Hascoet, A.S.; Guerrero-Navarro, A.E.; Rodríguez-Jerez, J.J. Establishment of incubation conditions to optimize the in vitro formation of mature Listeria monocytogenes biofilms on food-contact surfaces. Food Control 2018, 92, 240–248. [Google Scholar] [CrossRef]
- Melcon, C.R.; Peláez, F.R.; Fernández, C.G.; Calleja, C.A.; Capita, R. Susceptibility of Listeria monocytogenes planktonic cultures and biofilms to sodium hypochlorite and benzalkonium chloride. Food Microbiol. 2019, 82, 533–540. [Google Scholar] [CrossRef]
- Amrutha, B.; Sundar, K.; Shetty, P.H. Effect of organic acids on biofilm formation and quorum signaling of pathogens from fresh fruits and vegetables. Microb. Pathog. 2017, 111, 156–162. [Google Scholar] [CrossRef]
- Bang, H.J.; Park, S.Y.; Kim, S.E.; Rahaman, M.M.F.; Ha, S.D. Synergistic effects of combined ultrasound and peroxy acetic acid treatments against Cronobacter sakazakii biofilms on fresh cucumber. LWT-Food Sci. Technol. 2017, 84, 91–98. [Google Scholar] [CrossRef]
- Kim, S.Y.; Kang, D.H.; Kim, J.K.; Ha, Y.G.; Hwang, J.Y.; Kim, T.; Lee, S.H. Antimicrobial activity of plant extracts against Salmonella Typhimurium, Escherichia coli O157:H7, and Listeria monocytogenes on fresh lettuce. J. Food Sci. 2011, 76, 1–7. [Google Scholar] [CrossRef]
- Erol, H. SPSS Paket Programı ile İstatistiksel Veri Analizi, ISBN:978-605-397-060-6, Publisher: Nobel Kitabevi, Ankara, Türkiye, 2010, 548p.
- Kavuncuoğlu, H.; Kavuncuoglu, E.; Karatas, S.M.; Benli, B.; Sagdic, O.; Yalcin, H. Prediction of the antimicrobial activity of walnut (Juglans regia L.) Kernel aqueous extracts using artificial neural network and multiple linear regression. J. Microbiol. Methods 2018, 148, 78. [Google Scholar] [CrossRef] [PubMed]
- Mustapha, A.T.; Zhoua, C.; Amanor-Atiemoh, R.; Owusu-Fordjour, M.; Wahia, H. , Fakayode, O.A.; Ma, H. Kinetic modeling of inactivation of natural microbiota and Escherichia coli on cherry tomato treated with fixed multi-frequency sonication. Ultrason. Sonochem. 2020, 64, 10503. [Google Scholar]
- Vidacs, A.; Kerekes, E.; Rajko, R.; Petkovits, T.; Alharbi, N.S.; Khaled, J.M.; Vagvölgyi, C.; Krisch, J. Optimization of essential oil-based natural disinfectants against Listeria monocytogenes and Escherichia coli biofilms formed on polypropylene surfaces. J. Mol. Liq. 2018, 255, 257–262. [Google Scholar] [CrossRef]
- Park, Y.J.; Chen, J. Control of the biofilms formed by curli- and cellulose- expressing shiga toxin–producing Escherichia coli using treatments with organic acids and commercial sanitizers. J. Food Prot. 2015, 78, 990–995. [Google Scholar] [CrossRef]
- Wang, H.; Wang, X.; Yu, L.; Gao, F.; Jiang, Y.; Xu, X. Resistance of biofilm formation and formed-biofilm of Escherichia coli O157:H7 exposed to acid stress. LWT-Food Sci. Technol. 2020, 118, 1–6. [Google Scholar] [CrossRef]
- Trang, P.N.; Ngoc, T.T.A.; Masuda, Y.; Hohjoh, K.; Miyamoto, T. Antimicrobial resistance and biofilm formation of Escherichia coli in a Vietnamese Pangasius fish processing facility. Heliyon 2023, 9, 1–8. [Google Scholar] [CrossRef]
- Akbaş, M.Y.; Çağ, S. Use of organic acids for prevention and removal of bacillus subtilis biofilms on food contact surfaces. Food Sci. Technol. Int. 2016, 22, 587–597. [Google Scholar] [CrossRef]
- Nesse, L.L.; Sekse, C.; Berg, K.; Johannesen, K.C.S.; Solheim, H.; Vestby, L.K.; Urdahl, A.M. Potentially pathogenic Escherichia coli can form a biofilm under conditions relevant to the food production chain. Appl. Environ. Microbiol. 2014, 80, 2042–2049. [Google Scholar] [CrossRef]
- Kwak, T.Y.; Kim, N.H.; Rhee, M.S. Response surface methodology-based optimization of decontamination conditions for Escherichia coli O157:H7 and Salmonella Typhimurium on fresh-cut celery using thermoultrasound and calcium propionate. Int. J. Food Microbiol. 2011, 150, 128–135. [Google Scholar] [CrossRef]
- Zhao, X.; Zhen, Z.; Wang, X.; Guo, N. Synergy of a combination of nisin and citric acid against Staphylococcus aureus and Listeria monocytogenes. Food Addit. Contam. Part A 2017, 34, 2058–2068. [Google Scholar] [CrossRef]
- Fan, K.; Wu, J.; Chen, L. Ultrasound and its combined application in the improvement of microbial and physicochemical quality of fruits and vegetables: A review. Ultrason. Sonochem. 2021, 80, 1–6. [Google Scholar] [CrossRef] [PubMed]
- Shao, L.; Dong, Y.; Chen, X.; Xu, X.; Wang, H. Modeling the elimination of mature biofilms formed by Staphylococcus aureus and Salmonella spp. Using combined ultrasound and disinfectants. Ultrason. Sonochem. 2020, 69 105269, 1–7. [Google Scholar] [CrossRef]
- Ahmet Görgüç, A.; Gençdağ, E.; Okuroglu, F.; Yılmaz, F.M.; Bıyık, H.H.; Oztürk Kose, S.; Ersus, S. Single and combined decontamination effects of power-ultrasound, peroxyacetic acid and sodium chloride sanitizing treatments on Escherichia coli, Bacillus cereus and Penicillium expansum inoculated dried figs. LWT-Food Sci. Technol. 2021, 140, 110844. [Google Scholar] [CrossRef]
- Freitas, L.L.; Prudêncio, C.V.; Peña, W.E.L.; Vanetti, M.C.D. Modeling of Shigella flexneri inactivation by combination of ultrasound, pH and nisin. LWT-Food Sci. Technol. 2019, 109, 40–46. [Google Scholar] [CrossRef]
- Yuk, H.G.; Yoo, M.Y.; Yoon, J.W.; Moon, K.D.; Marshall, D.L.; Oh, D.H. Effect of combined ozone and organic acid treatment for control of Escherichia coli O157:H7 and Listeria monocytogenes on lettuce. J. Food Sci. 2006, 71, 83–87. [Google Scholar] [CrossRef]
- Stopforth, J.D.; Samelis, J.; Sofos, J.N.; Kendal, P.A.; Smith, G.C. Influence of organic acid concentration on survival of Listeria monocytogenes and Escherichia coli O157:H7 in beef carcass wash water and on model equipment surfaces. Food Microbiol. 2003, 20, 651–660. [Google Scholar] [CrossRef]
- Ji, Q.Y.; Wang, W.; Yan, H.; Qu, H.; Liu, Y.; Qian, Y.; Gu, R. The effect of different organic acids and their combination on the cell barrier and biofilm of Escherichia coli. Foods 2023, 12, 1–14. [Google Scholar] [CrossRef]
- Fındık, S.; Gündüz, G.; Gündüz; E. Direct sonication of acetic acid in aqueous solutions. Ultrason. Sonochem. 2006, 13, 203–207. [Google Scholar] [CrossRef]
- Lee, H.; Zhou, B.; Liang, W.; Feng, H.; Martin, S.E. Inactivation of Escherichia coli cells with sonication, manosonication, thermosonication, and manothermosonication: Microbial responses and kinetics modelling. J. Food Eng. 2009, 93, 354–364. [Google Scholar] [CrossRef]
- Turhan, E.U.; Polat, S. The removal of foodborne pathogen biofilms with the treatment of ultrasound and/or organic acid, The Black Sea Journal of Sciences 2022, 12, 905–915.
- Costello, K.M.; Velliou, E.; Gutierrez-Merino, J.; Smet, C.; El Kadri, H.; Van Impe, J. F.; Bussemaker, M. The effect of ultrasound treatment in combination with nisin on the inactivation of Listeria innocua and Escherichia coli. Ultrason. Sonochem. 2021, 79, 105776. [Google Scholar] [CrossRef]
- Braiek, O.B.; Smaoui, S. Chemistry, safety, and challenges of the use of organic acids and their derivative salts in meat preservation. J. Food Qual. 2021, Volume 2021, Article ID 6653190,1-20.
- Salleh-Mack, S.Z.; Roberts; J.S. Ultrasound pasteurization: The effects of temperature, soluble solids, organic acids and pH on the inactivation of Escherichia coli ATCC 25922. Ultrason. Sonochem. 2007, 14, 323–329.
- Lee, H.; Kim, H.; Cadwallader, K.R.; Feng, H.; Martin, S.E. Sonication in combination with heat and low pressure as an alternative pasteurization treatment – Effect on Escherichia coli K12 inactivation and quality of apple cider. Ultrason. Sonochem. 2013, 20, 1131–1138. [Google Scholar] [CrossRef] [PubMed]
- Yu, H.; Liu, Y.; Li, L.; Guo, Y.H.; Xie, Y.F.; Cheng, Y.L.; Yao, W.R. Ultrasound involved emerging strategies for controlling foodborne microbial biofilms. Trends Food Sci. Technol. 2020, 96, 91–101. [Google Scholar] [CrossRef]
- Koda, S.; Miyamoto, M.; Toma, M.; Matsuoka, T.; Maebayashi, M. Inactivation of Escherichia coli and Streptococcus mutans by ultrasound at 500 kHz. Ultrason. Sonochem. 2009, 16, 655–659. [Google Scholar] [CrossRef] [PubMed]
- Loske, A.M.; Tello, E.M.; Vargas, S.; Rodriguez, R. Escherichia coli viability determination using dynamic light scattering: a comparison with standard methods, Arch Microbiol 2014, 1-7.
- Park, S.Y.; Kim, C.G. A comparative study of three different viability tests for chemically or thermally inactivated Escherichia coli. Environ. Eng. Res. 2018, 23, 282–287. [Google Scholar] [CrossRef]
- Macia, M.D.; Rojo-Molinero, E.; Oliver, A. Antimicrobial susceptibility testing in biofilm-growing bacteria. Clin. Microbiol. Infect. 2014, 20, 981–990. [Google Scholar] [CrossRef]
- Sheen, S.; Huang, C.Y.; Ramos, R.; Chien, S.Y.; Scullen, O.J.; Sommers, C. Lethality prediction for Escherichia coli O157:H7 and uropathogenic E. coli in ground chicken treated with high pressure processing and trans-cinnamaldehyde. J. Food Sci. 2018, 1-10.
- Parish, M.E.; Beuchat, L.R.; Suslow, T.V.; Harris, L.J.; Garret, E.H.; Farber, J.N.; Busta, F.F. Methods to reduce/eliminate pathogens from fresh and fresh-cut produce. Compr. Rev. Food Sci. Food Saf. 2003, 2, 161–173. [Google Scholar] [CrossRef]
- Ding, T.; Wang, J.; Forghani, F.; Ha, S.D.; Chung, M.S.; Bahk, G.J.; Hwang, I.G.; Abdallah, E.; Oh, D.H. Development of Predictive Models for the Growth of Escherichia coli O157:H7 on Cabbage in Korea. J. Food Sci. 2012, 77, 257–263. [Google Scholar] [CrossRef]

| OD | Viable cell counts (log CFU/mL) | Biofilm formation | |
|---|---|---|---|
| Biofilm | 1.02 ±0.03 | 8.56 ±0.08 | + |
| Negative control | 0.14±0.00 | 0.00±0.00 | - |
| Sonication conditions | Control (PBS) | Lactic acid (2%) | Acetic acid (2%) |
|---|---|---|---|
| 20oC – 2 min. | 0.43±0.03eB | 2.18±0.20eA | 1.95±0.34dA |
| 40oC – 2 min. | 1.12±0.13dB | 2.88±0.15dA | 3.01±0.08cA |
| 50oC – 2 min. | 1.66±0.01cB | 4.06±0.14cA | 3.99±0.20bA |
| 20oC – 5 min. | 1.05±0.26dB | 3.98±0.02cA | 3.94±0.09bA |
| 40oC – 5 min. | 2.56±0.11bB | 5.74±0.04bA | 5.96±0.15aA |
| 50oC – 5 min. | 3.37±0.19aB | 6.21±0.19aA | 6.14±0.26aA |
| Sonication conditions | Control (PBS) | Lactic acid (2%) | Acetic acid (2%) |
|---|---|---|---|
| 20oC – 2 min. | 0.13±0.02eA | 0.15±0.03dA | 0.14±0.03eA |
| 40oC – 2 min. | 0.23±0.00dA | 0.27±0.06cA | 0.29±0.01dA |
| 50oC – 2 min. | 0.37±0.01cbC | 0.63±0.01bA | 0.54±0.01bB |
| 20oC – 5 min. | 0.30±0.01cdC | 0.60±0.01bA | 0.45±0.05cB |
| 40oC – 5 min. | 0.45±0.09bB | 0.66±0.02abA | 0.52±0.02bcAB |
| 50oC – 5 min. | 0.70±0.03aA | 0.71±0.01aA | 0.72±0.04aA |
Disclaimer/Publisher’s Note: The statements, opinions and data contained in all publications are solely those of the individual author(s) and contributor(s) and not of MDPI and/or the editor(s). MDPI and/or the editor(s) disclaim responsibility for any injury to people or property resulting from any ideas, methods, instructions or products referred to in the content. |
© 2024 by the authors. Licensee MDPI, Basel, Switzerland. This article is an open access article distributed under the terms and conditions of the Creative Commons Attribution (CC BY) license (http://creativecommons.org/licenses/by/4.0/).


