
Submitted:
11 November 2024
Posted:
13 November 2024
You are already at the latest version
Abstract
This paper presents an innovative waste heat-powered, long-range wireless, and battery-less industrial Internet of Things (IIoT) device. It is designed to measure and predict steam leaks in steam pipelines, and particularly in steam traps. This self-powered device will aid energy-intensive industries (chemical, petrochemical, oil refineries, pharma, etc.) in becoming more environmentally friendly and profitable as they transition towards the Industry 4.0 paradigm. Moreover, thanks to continuous power provided by thermoelectric generators, the device operates without batteries, enabling the use of long-range wireless protocols such as LoRaWAN, thus minimizing internal wireless infrastructure, and incorporating edge computing to reduce the overall cloud computing. The adoption of this device in such industries would permit important energy savings and manual audits related steam leak inspections. These capabilities are challenging to achieve in battery-powered IoT devices due to battery life limitations and wiring costs in wired sensors.
Keywords:
steamtrap
; batteryles
; TEG
; LoRaWAN
1. Introduction
The Internet of Things (IoT) is designed to connect physical objects to cloud computing infrastructure, enabling communication anytime and anywhere. In the industrial sector, this is referred to as the Industrial Internet of Things (IIoT), which plays a key role in the Industry 4.0 revolution. IIoT facilitates real-time monitoring of machinery, leading to significant energy savings, reduced maintenance costs, fewer breakdowns, and decreased downtime. Consequently, the number of IoT devices deployed globally is expected to rise from the current 46 billion to 125 billion in the coming years [1]. However, despite the rapid increase in the number of these devices, the primary challenge for the future remains the energy supply for these systems [2].
Currently, most IIoT devices rely on lithium-based batteries, which present several environmental concerns, including the carbon footprint associated with their production, charging, and potential risks, particularly in hazardous environments where they may pose a fire or explosion hazard.
Regarding the environmental impact, Dirk Notz et al. [3] demonstrated a direct correlation between carbon emissions and Arctic ice melt. This study showed that Arctic ice has decreased by 50% over the past 40 years. At the UN Climate Conference in New York, new data further exacerbated these predictions. According to Professor Dirk Notz from the Max-Planck-Institute for Meteorology in Hamburg, Germany, every ton of CO₂ released into the atmosphere contributes to the melting of 3 square meters of Arctic ice [4]. This impact is illustrated in Figure 1, showing the Arctic ice melt per citizen according to data from The Guardian [5].
Energy-intensive industries, particularly those reliant on steam in their processes (such as oil and gas, chemical, petrochemical, pharmaceutical, and textile sectors), are among the largest contributors to greenhouse gas emissions. Over the past several years, these industries have increasingly acknowledged the impact of their emissions on climate change and have started improving their productivity, efficiency, and profitability through Industry 4.0 innovations. The deployment of IIoT technologies offers these industries the opportunity to further enhance their efficiency and become more environmentally sustainable. This includes sectors with explosive atmospheres (ATEX), such as oil and gas, chemical and petrochemical industries, which face unique challenges in implementing large-scale IoT sensing systems [6]. However, several difficulties remain in deploying IIoT devices in industrial environments, including:
- Energy requirements: Wired sensors require significant investment in infrastructure, with costs ranging between 70-100€ per meter of installation.
- Battery-powered wireless sensors: These devices involve high maintenance costs due to frequent battery replacement, averaging 300€ every 24 months.
- Short-range wireless protocols: To extend the battery life of IIoT devices, short-range protocols such as Bluetooth and WirelessHART are typically used. These protocols offer limited coverage, necessitating a substantial investment in wireless infrastructure, including routers and repeaters.
- Communications: Wired sensors also require significant investment in communication infrastructure, including cables, optical fibre channels and switches.
- ATEX/EX environments: Wireless IIoT devices in these environments often use lithium batteries, with risk of explosion and thus cannot typically be deployed in oil &gas or petrochemical facilities.
In these industries, with high energy demands, particularly those that use steam extensively in their processes, one of the major inefficiencies relates to steam generation, transportation, and usage. For example, in a large oil refinery steam circuits can span hundreds of kilometres, as steam is integral to various processes, including heating, cleaning, and power generation. Some refineries have up to 1,000 kilometres or more of piping dedicated to steam, chemicals, hydrocarbons, and water transportation. Steam traps are critical for the correct operation of these processes, where a mid-sized refinery containing between 10,000 and 20,000 steam traps.
The primary objective of this paper is to introduce a novel pre-commercial IIoT technology designed to detect steam leaks in steam traps. This device is powered by thermoelectric generators (TEG), is maintenance-free, utilizes long-range wireless communication via LoRaWAN, and features edge computing for data preprocessing.
This paper is structured as follows: the next section introduces steamtraps and its associated failures due to steam leaks, quantifying the economic impact of their failure. Section 3 discusses current detection methods, while Section 4 introduces the technological approach used in this project to detect steam leaks through temperature delta (ΔT) detection and ultrasound sensors. Section 5 presents the results of a device installation in a pharmaceutical facility, and Section 6 concludes the paper with key findings.
2. Steam Traps Study
2.1. Steam Proceses
As introduced in the previous section, steam in longly used in major manufacturing industries such as oil&gas, chemical, petrochemical thanks to its following benefits:
- It is an efficient heat and energy source: Steam transfers large amounts of heat efficiently, ideal for heating reactors and distillation columns.
- Mechanical energy generation: Steam powers turbines, generating electricity to run pumps and compressors in these industries.
- Separation and refining processes: Steam is crucial for distillation and thermal cracking, helping separate and break down hydrocarbons into valuable products.
- Cleaning and treatment: High-temperature steam cleans and purifies equipment.
- Enhanced safety: Steam is safer for heating than direct combustion methods, reducing fire and explosion risks.
- Steam injection: In oil extraction, steam helps reduce the viscosity of heavy oil.
In summary, steam plays a critical role in transferring energy, driving machinery, enabling refining processes, and ensuring safety in these sectors.
Major elements involved in steam circuits are:
- Steam boiler. It is the element that converts clean water into steam thanks to several heating elements (electric resistors, fuel, gas,etc).
- Steam pipelines. Their mission is the transportation of the steam in all production processes.
- Pumps. They are used for pumping water condensed to the boiler.
-
Steam traps. In a steam pipeline, they are typically installed every 30 to 50 meters depending on factors like pipe size and operating conditions. Additionally, steam traps are placed at critical points such as:
- ◦
- Low points in the piping: To prevent condensate buildup.
- ◦
- Changes in elevation: Where condensate can accumulate.
- ◦
- Before processing equipment: Like heat exchangers or control valves.
- ◦
- End of steam pipelines: To purge condensate before it re-enters the system.
There are three main types of steam traps based on their operating principles:
- Mechanical Steam Traps. Use a float that rises with condensate levels to open the valve and discharge water. It closes when the condensate is removed.
- Thermodynamic Steam Traps. Work based on the speed difference between steam and condensate. Condensate flows slowly, keeping the valve open, while steam's higher speed closes the valve.
- Thermostatic Steam Traps. React to temperature changes, opening the valve when cooler condensate is present and closing when hot steam arrives.
2.2. Steam Traps Operation
In order to have an efficient and secure steam process, steam traps need to be installed for:
- Condensate removal: Steam traps prevent water hammer by continuously or intermittently draining condensate.
- Improve energy efficiency: By removing condensate, traps allow dry, superheated steam to flow freely, improving heat transfer and reducing energy consumption.
- System protection: Steam traps protect pipes and equipment from corrosion and other operational issues.
- Process optimization: They help maintain a stable steam flow, which is critical for equipment operation and minimizing process interruptions.
Related to this, water hammers are a dangerous phenomenon caused by the sudden stopping or redirection of steam or condensate flow, generating high-pressure waves that can damage pipes and equipment. This issue is especially severe in steam systems due to the high pressures and temperatures involved. The main problems associated with water hammers in steam circuits include:
- Damage to pipes and equipment: Water hammer can cause extreme vibrations, cracks, deformations, or even ruptures in pipes and valves, severely damaging critical components such as heat exchangers and pumps.
- Safety risks: Physical damage to pipes can lead to leaks of high-pressure steam, which poses significant risks to workers and nearby facilities due to the potential for burns or explosions.
- Process interruptions: Water hammer can disrupt the continuous steam flow required for industrial processes, leading to equipment shutdowns, reduced production efficiency, or even complete plant shutdowns, resulting in considerable economic losses.
- Increased maintenance costs: Frequent repairs due to water hammers can increase maintenance costs, including labour and replacement parts.
When a steam trap leaks, the annual losses in energy and costs can be substantial, depending on the amount of steam lost, pressure levels, and operating duration.
2.3. Steam Traps Failures
The probability of steam trap failure in a steam circuit depends on several factors, such as the trap type, operating conditions, maintenance quality, and the environment. General industry data suggests the following [7]:
Failure rates:
- Annual failure rates range between 5% and 25%, depending on maintenance and operation.
- Well-maintained systems have failure rates below 10%.
- Poorly maintained systems can reach failure rates over 25%.
Common causes of failure:
- Sediment or calcium accumulation.
- Internal leaks or insufficient discharge.
- Mechanical wear and corrosion.
- Extreme operating conditions (e.g., incorrect pressure or temperature).
Steam trap types and failure rates:
- Thermodynamic traps: robust but can fail without regular maintenance (~10-15% failure rate).
- Float traps: prone to sediment buildup and mechanical failures (~15-20% failure rate).
- Thermostatic traps: sensitive to debris and temperature control issues (~15-25% failure rate).
2.2. Leaking Cost Stimation
One of the major energy ineficiencies in manufacturing industries that uses steam in their processes is the steam leaks in boilers, pipelines and mainly in steam traps [8].
When a steam trap is leaking, the annual losses can be significant in terms of energy and costs [8]. Depending on the amount of steam lost, the pressure, and the operating duration, the losses can be substantial. Below is an estimation of potential losses:
Estimation of Steam Losses:
A steam trap leaking 0.5 kg of steam per minute can result in:
-
Steam Loss:
- Per hour: 0.5 kg/min × 60 min = 30 kg of steam/hour.
- Per day: 30 kg/h × 24 hours = 720 kg of steam/day.
- Per year: 720 kg/day × 365 days = 262,800 kg of steam/year.
- Energy Costs: The cost of producing steam generally ranges between 3 and 10€ per ton of steam (1,000 kg), depending on fuel type and boiler efficiency. Assuming an average cost of 5€ per ton, 262.8 tons × 5€/ton = 1,314€ per year for each leaking steam trap. Therefore, in a mid-sized oil refinery with 10,000 steam traps with poor maintenance process, assuming an annual failing estimation of 25% the overall energy loss achieves 3,3M€ yearly.
This unwished problem implies additional repercussions [9]:
- Higher pressure or larger traps: Steam losses increase in systems with higher pressure or in larger steam traps, which can double or triple the economic impact.
- Cumulative effect: In industrial plants with dozens or hundreds of steam traps, the losses can accumulate quickly, resulting in tens of thousands of euros annually if the traps are not inspected and maintained properly.
- Increased fuel consumption: Boilers must compensate for the lost steam, which increases fuel consumption and leads to higher greenhouse gas emissions, such as CO₂.
- Reduced efficiency: Steam loss reduces the overall efficiency of the steam system and can affect industrial processes that rely on specific steam pressures and temperatures.
But this energy and cost loss, depends significantly on the steam pressure and the orifice of the steam trap, as shown in Figure 3 according with Napiers equation.
3. Present Technology Scenario
3.1. Detection of Steam Losses in Steam Traps
Once evaluated the cricity of steam leaks, is important to determine when a steam trap is leaking steam. There are several mechanisms for performing the detection, from manual to automated processes. They are classified from non-intrusive (not interfering the steam process) to intrusive (requires installing sensors inside the steam trap):
Non-intrusive:
- Visual Inspection with human audits. Observing steam discharge is a direct method to detect malfunction. Continuous venting of live steam, rather than intermittent discharge of condensate, is indicative of a failed steam trap.
- Temperature Profiling: Infrared thermography or surface temperature sensors can be used to measure inlet and outlet temperatures. An outlet temperature close to that of the inlet may suggest that live steam is escaping, indicating a potential leak.
- Ultrasonic Leak Detection: Ultrasonic detection devices can identify the high-frequency sound characteristic of steam escaping through a malfunctioning trap. Properly functioning traps exhibit a lower frequency sound pattern corresponding to condensate discharge, while steam leakage produces a distinct, high-pitched noise.
Intrusive:
- Flow and Pressure Monitoring: Installation of flow meters or differential pressure gauges at the discharge line provides a quantitative method for detecting abnormalities. Continuous or excessive flow can point to steam leakage.
3.2. Actual Sensing Devices
In order to perform automatic steam leaks detection, there are several commercial technologies offering different sensors and wired/wireless technologies. We summarize in the following options:
- Wireless using conventional WIFI, Bluetooth or WirelessHart. These devices detect inlet and outlet temperatures for monitoring. They are powered by lithium batteries with an overall expected lifetime of 2 years. Due to the high battery consumption, it implies, data is only sent once per day. We can include in this ecosystem Emerson Rosemount acoustic transmitter (only ultrasounds) [10] or Loctite Pulse (only temperatures) [11].
- Wired using conventional RS485 data Communications bus. This device monitors inlet and outlet temperature and also pressure. They need an overall power consumption of 100mW and data is sent in real-time with a costly 4-wired infrastructure as used by Purgasa Bitherm [12].
In contrast, this paper presents a new approach joing the benefits of both technologies (wireless and wired). In particular, the solution presented is:
- Autonomous It is powered by the heat of the steam trap or steam pipeline using thermoelectric devices.
- The installation is plug & play and not intrusive.
- Maintenance-free. There are no lithium battery or equivalent to replace.
- Data can be sent every 5 minutes (limited by the LoRaWAN spread factor).
- Combines 3 sensors: inlet and outlet temperature, as well as ultrasound detection.
4. Steam Leaks Detection
In this section it is introduced the actual heat-powered device for detecting steam leaks combining (Figure 4):
- High efficent thermoelectric (TEG) generator with DC/DC up converter, and edge-computing batteryless device with LoRaWAN wireless protocol chipset.
- (ΔT) temperature detection as well as ultrasound monitoring.
- LoRaWAN gateway to connect to a Cloud computing or SCADA.
In detail, the stand-alone heat-powered IIOT device composed by:
- Edge-computing IIoT, using LoRaWAN with 3 sensor interface (section 4.2).
- TEG Thermoelectric device with the housing and radiator, which converts heat into electricitity (section 4.1).
4.1. TEG Generator Design
4.1.1. Thermal Model
This device has the mission of generating all power required for the IIoT and all three sensors.
The overall thermoelectrical converter performance depends on the TEG cell efficiency in the conversion of thermal into electricity. The working principle of the Peltier cell involves the physical effects named Seebeck, Peltier, Thomson and Joule.
- The Seebeck effect is responsible for the electricity generation in the cell. It takes place whenever two semiconductor materials A and B are jointed together at their ends by a conductive material and there is a temperature difference between the two joints. This leads to the conversion of heat into electricity. The Seebeck coefficients account for the electromotive force generation (Equation 1).
- The Peltier effect is the cooling or heating effect that occurs when an electric current passes through a junction of two materials, as opposed to the Seebeck effect. The heat flux absorbed or rejected by this effect Q̇Peltier is given by Equation 2.
- The Joule effect accounts for the heating up of a material when current passes through a conductor material. The heat flux Q̇Joule that is produced by this effect is represented by Equation 3, where R0 is the internal electrical resistance that accounts for this effect.
- The Thomson effect takes place when current passes through a single material that is subject to a temperature gradient along its length. This can lead to both absorption as generation of heat depending on the value of the Thomson coefficients. The heat flux (Equation 4) is dependent on the Thomson parameter σ.
The conversion efficiency of a Peltier cell is given as a function of the parameter Z (units 1/K), or the parameter ZT (no units), where T represents the average temperature in the cell. The Z factor relates the energy supplied by the cell to the load in respect to the heat transfer that the cell has. Equations 5 and 6 gives the maximum efficiency in terms of the figure of merit ZT used in thermoelectric devices. ZT depends on the temperature T, and the thermoelement parameters α (Seebeck coefficient), σ (electrical conductivity) and k (thermal conductivity). The term hc = 1-TH/TC is the Carnot Efficiency. In [13] these equations are applied to model.
Thanks to this model, it is possible to design the most efficient heat harvester and and radiator to achieve the maximum ΔT. In detail, the aluminum pipeline (figure 6 left) adapter transfers the heat harvested to the steam pipeline to the TEG hot surface (THot). Thanks to the thermal resistance of the Peltier Cell and the radiator coupled in the cold surface (TCold) it is possible to achieve the corresponding ΔT required for the energy production. This “heat exchanger” (figure 6 right) extracts all the heat that passes through the Peltier cell and dissipates it through its cooling elements.
In Figure 7, a thermal simulation is presented, considering the proposed designs for the thermoelectric module. The simulation accounts for a heat source of 150°C, a temperature commonly encountered in steam pipelines and steam traps. As demonstrated, the maximum temperature reaching the edge computing device is 65°C under the worst-case scenario. Additionally, the hot plate (Figure 6, left) reaches a temperature of 130°C, while the cold plate (Figure 6, right) maintains 70°C, resulting in a successful temperature gradient (ΔT) of 50°C.
4.1.2. Electronic Design
The power electronics circuit is responsible for converting the energy harvested by each thermoelectric generator module (TGM) into a usable DC output voltage of 3.3V, which powers the IIoT device. Figure 8 illustrates the power electronics system, which optimizes the operation of the TGMs, ensuring they operate at their maximum efficiency to maximize the harvested thermal energy. Energy is stored in a 5F supercapacitor able to deliver enough energy up to 5 complete acquisition/communications processes.
In Figure 9 it is shown the main all-in-one main circuit board. In the left if is shown where the board is located to isolate the electronics from the heat source. In the centre of the figure it is identified all sub-circuits and on the right the final circuit board. In detail:
- Power management module.
- LoRaWAN Radio interface.
- Temperature and ultrosoulds microphone connector.
- Temperature sensor interface to control the hot surface of the module.
- Main processor.
- Programmer interface.
- Log interface for debugging.
4.2. IIoT Module
4.2.1. Wireless Protocol Comparison
In this subsection we present the technology approach for the wireless IIoT device.
One of the most important things to consider in the wireless sensor networks is the wireless protocol selected. This selection will determine, mainly:
- Node energy consumption.
- Maximum range and the maximum number of nodes connected to the same gateway/repeater.
- Data rate and latency.
- Network costs (licensed or unlicensed bands) and infrastructure costs.
- Node data security encryption.
According with 3GPP & GSMA, Kais et al. [14], the LoRaWAN protocol is one of the most expected to be adopted in the different Low-Power Wide-Area Network (LPWAN) (Table 1) due to the robustness, range and easy to scale.
For our project purposes it has been selected the LoRaWAN chipset from the microchip manufacturer RN2483 [15].
4.2.2. Hardware Implementation
As previously mentioned, this battery-less LoRaWAN sensing device consists of a DC/DC power converter submodule and a processing submodule. Figure 10 shows that on the left side is the main processor (Infineon Cypress SoC), responsible for data acquisition, processing, and formatting. On the right side, the LoRaWAN chipset can be identified.
Finally, on Figure 11, it is shown the main circuit board including both sub-modules (power converter and processing / communicating).
4.2.3. Firmware Process
To perform all the processes, we have defined a state machine.
On Figure 12 it is shown the complete algorithm that departs from detecting enough energy store from the supercapacitor, acquiring the both temperatures (inlet and outlet) as well as the sound acquisition from the ultrasound microphone. With this information we will be able to detect if the steam trap is leaking condensed water or steam.
5. Main Implementation and Results
This section presents the initial results of the implementation. The first tests were conducted entirely in AEInnova’s laboratory, a spin-off of the Microelectronics Department at the Autonomous University of Barcelona, where the authors of this paper are principal founders. Subsequently, the device will be tested under real-world conditions at a pharmaceutical facility located in Barcelona. The Spanish company Hipra, a COVID-19 vaccine manufacturing facility, granted access to perform the first real-world tests on a mechanical (ball float) steam trap.
5.1. Thermoelectric Module Characterization
Initial tests were conducted to characterize the thermoelectric module, located at the lower part of the device. To achieve this, a test bench was developed, consisting of a 2-inch pipeline heated by a 150W resistor and a support structure for the pipeline (Figure 13, left). The test bench includes a PID controller and a precise PT100 temperature sensor to ensure accurate temperature control of the pipeline surface.
Subsequently, a preliminary version of the all-in-one IIoT system was tested for thermoelectric characterization. The housing for the electronics PCB was fabricated using additive manufacturing (PLA). In the right image of the figure, the device is appropriately positioned on the test bench for measurement. For the measurements, the temperature was increased in increments of 10°C, with a 20-minute stabilization period for the thermoelectric generator (TEG) surface temperature at each step.
The initial test (Figure 14) demonstrates excellent linearity of the open-circuit voltage with respect to the temperature of the hot surface on the test bench. The test was conducted over a range of pipeline surface temperatures from 50°C to 170°C, across five ambient temperatures (from 15°C to 40°C). A maximum voltage of 3.687V was recorded when the pipeline surface reached 170°C and the ambient temperature was 15°C.
In addition, a series of performance tests were carried out to determine the maximum power output of the device. The thermoelectric generator (TEG) produced a peak power output of 1.034W under the same conditions (170°C surface temperature and 15°C ambient temperature), which is sufficient to ensure the real-time operation of the IIoT device. Results are shown in Figure 15.
5.2. Device Characterization in an Uncontrolled Environment
In this section, the device was characterized in an uncontrolled environment. The system was installed on a boy steam trap, also known as a mechanical steam trap (figure 16a). To monitor the steam and condensate temperatures, two PT100 temperature probes were placed at the inlet and outlet of the steam trap. Additionally, an ultrasonic microphone with a 50 kHz bandwidth was installed on the steam trap, and data acquisitions were performed at a sampling rate of 100 ksps.
To protect the microphone membrane from the heat generated by the steam trap, a capsule was developed to maintain a 30 cm separation between the microphone and the trap. To transmit the sound between the steam trap and the microphone, an aluminum waveguide was designed, effectively reducing the temperature by nearly half. Also, it is possible to show the LoRaWAN Wirnet Kerling gateway (b).
Same results were obtained in a second set of test monitoring a thermodynamic steam trap (Figure 16c). In the figure 16 it is detailed:
- The heat-powered all-in-one IIoT.
- The ultrasound microphone.
- The Inlet and outlet PT100.
5.3. Data Analysis
The primary results focus on the discharge process of a steam trap. By utilizing the measured inlet and outlet temperatures (as shown in Figure 17), along with ultrasound measurements, it is possible to differentiate between the normal operational state of the steam trap and potential failures, such as valve leakage (open) or valve blockage (closed).
5.3.1. Use of Temperature to Know the State of the Steam Trap
Normal Operating State:
During normal operation, the steam trap continuously discharges condensate produced within the system, which is mixed with flash steam. As a result, a steady flow of condensate with a small amount of steam passes through the steam trap. This leads to a temperature difference between the inlet and outlet of the steam trap, where the inlet temperature is expected to be higher than the outlet temperature.
Operational Failure: Valve Open (Leakage):
In the event of a leak, the conditions on both sides of the steam trap become equal, resulting in the inlet and outlet temperatures converging. Specifically, the inlet temperature remains constant, while the outlet temperature rises to match the inlet.
Operational Failure: Valve Closed (Blockage):
If the steam trap experiences a blockage that halts condensate discharge, the temperature at the inlet will decrease as the pipe becomes fully flooded with condensate. The outlet temperature will further decrease due to the absence of steam flow.
5.3.2. Use of Ultrasounds to Know the State of the Steam Trap
Relying solely on temperature measurements for analyzing steam trap leakage can lead to errors, as condensate at elevated temperatures may convert to flash steam upon entering a lower-pressure system. In such cases, the temperature of the condensate matches that of the flash steam, making it difficult to distinguish between normal discharge and leakage based on temperature alone. Ultrasound measurements provide a more reliable method for differentiating between these conditions.
Figure 18 illustrates some of the frequency domain samples, highlighting the signal delta caused by steam passing through the trap around 37 kHz.
While many applications monitor sound frequencies around 25 kHz, this range is often contaminated by industrial noise, as shown in Figure 19. To minimize interference, we focus on frequencies between 30 kHz and 40 kHz.
Our device includes a tuning band-pass filter within the 30 kHz to 40 kHz range.
6. Conclusions
This paper presented a novel Internet of Things (IoT) device tailored for Industry 4.0 applications. The key innovation of this device is its battery-less and heat-powered design, addressing the challenges associated with using lithium batteries in high-temperature and explosive industrial environments. As such, this sensor is a promising candidate for effective process monitoring in these demanding conditions.
We demonstrated the device’s advantages over existing technologies, including autonomy, maintenance-free operation, edge computing capabilities, high data transmission rates, and minimal intrusiveness.
In the context of detecting steam leaks in steam traps, a major challenge lies in selecting the appropriate leak detection method. Relying solely on temperature measurements has been shown to be insufficient in some scenarios, particularly as temperature data may not always be available in on-site operations. Therefore, additional parameters, such as ultrasonic measurements, are essential for improving system accuracy. Ultrasound technology allows for the differentiation between liquid and steam, as steam generates a high-frequency hissing sound, whereas liquid does not. Additionally, it enables easy detection of blocked valves due to the absence of high-frequency sound signals. Unfortunately, both steam traps monitored during the two-day test period were newly installed, and no issues were detected during the testing window provided by the facility. However, the device successfully demonstrated, consistent with findings in the literature, its ability to monitor both temperature and ultrasound signals for this specific application.
Author Contributions
Conceptualization, R.A., J.O. and C.F.; Methodology, R.A., J.O. and C.F.; Software, R.A.; Validation, R.A. Formal analysis, R.A.; Investigation, R.A.; Data curation, R.A., J.O. and C.F;Writing—review & editing, R.A., J.O. and C.F.; Visualization, R.A.; Project administration, R.A..; Funding acquisition, R.A. All authors have read and agreed to the published version of the manuscript.
Funding
This work was supported by: Catalan government of Spain: Linea d’ajuts: NUCLIS DE RECERCA INDUSTRIAL I DESENVOLUPAMENT EXPERIMENTAL, Projectes Economia Circular. Project name: “INDUEYE: Revalorització del calor residual per a l’eliminació debateries de Liti en sensorització. Spanish National Research Agency (AEI): PID2020-116890RB-I00 (AEI/FEDER, EU) under project WISE. The European Commission: H2020 FET Proactive Harvestore Project under grant 824072. H2020 EIC Pilot Project InduEye 2.0 under grant 946845;
Acknowledgments
Alternative Energy Innovations SL technical staff. HIPRA for facilitating the pharma plant for the steam leak detection test.
Conflicts of Interest
Authors Raúl Aragonés is employed by the company Alternative Energy Innovations, S.L.—AEInnova. Carles Ferrer and Joan Oliver declare that the research was conducted in the absence of any commercial or financial relationships that could be construed as a potential conflict of interest.
References
- N. Galov, «How Many IoT Devices Are There in 2020? [All You Need To Know],» Techjury, 2 June 2022.
- T. Pirson y D. Bol, «Assessing the embodied carbon footprint of IoT edge devices with a bottom-up life-cycle approach,» Elsevier, 2021.
- Dirk Notz et al., “Observed Arctic sea-ice loss directly follows anthropogenic CO2 emission”, Science Journal, November 2016. http://science.sciencemag.org/content/354/6313/747.
- Max Planck Society. "How each one of us contribute to Arctic sea ice melt." ScienceDaily. ScienceDaily, 4 November 2016 www.sciencedaily.com/releases/2016/11/161104145708.htm.
- The guardian. Available online https://www.theguardian.com/environment/2016/nov/03/your-carbon-footprint-destroys-30-square-metres-of-arctic-sea-ice-a-year. (accessed on 5 January 2024).
- R. Aragonés, R. N. Alegret, J. Oliver and C. Ferrer, "Autonomous Battery-Less Vibration IIoT Powered by Waste Heat for Chemical Plants Using NB-IoT," in IEEE Sensors Journal, vol. 22, no. 15, pp. 15448-15456, 1 Aug.1, 2022. [CrossRef]
- Spirax Sarco: "Steam Traps and Their Failures." Available at: Spirax Sarco Technical Resources. Accessed September 2023.
- ANSI/ASME: "Steam Systems Best Practices for Energy Efficiency." Published by the American Society of Mechanical Engineers (ASME), 2021.
- Armstrong International: "The Importance of Steam Trap Testing." Available online at: Armstrong International Website. (accessed on 6 January 2024).
- Emerson Rosemount acoustic transmitter website. Available online https://www.emerson.com/en-us/catalog/rosemount-sku-708-wireless-acoustic-transmitter#:~:text=Featuring%20ultrasonic%20acoustic%20event%20detection%20that%20mounts%20externally,%20the. (accessed on 9 January 2024).
- Loctite Pulse steam traps website. Available online https://www.henkel-adhesives.com/uk/en/industries/industrial-maintenance-repair/mro-loctite-pulse/steam-trap.html#:~:text=LOCTITE%C2%AEPulse%20Smart%20Steam%20Trap%20is%20a%20predictive%20maintenance%20solution%20that. (accessed on 9 January 2024).
- Purgasa Bitherm website. Available online https://bitherm.com/purgador-monitorizado. (accessed on 8 January 2024).
- Aragonés, R.; Oliver, J.; Malet, R.; Oliver-Parera, M.; Ferrer, C. Model and Implementation of a Novel Heat-Powered Battery-Less IIoT Architecture for Predictive Industrial Maintenance. Information 2024, 15, 330. [Google Scholar] [CrossRef]
- Kais Mekki, Eddy Bajic, Frederic Chaxel, Fernand Meyer, “A comparative study of LPWAN technologies for large-scale IoT deployment”, ICT Express 2019, el Sevier.
- Microchip Website. Available online: https://www.microchip.com/en-us/product/rn2483 (accessed on 8 Feburary 2024).
Figure 1.
Artic ice melting according citizenship.
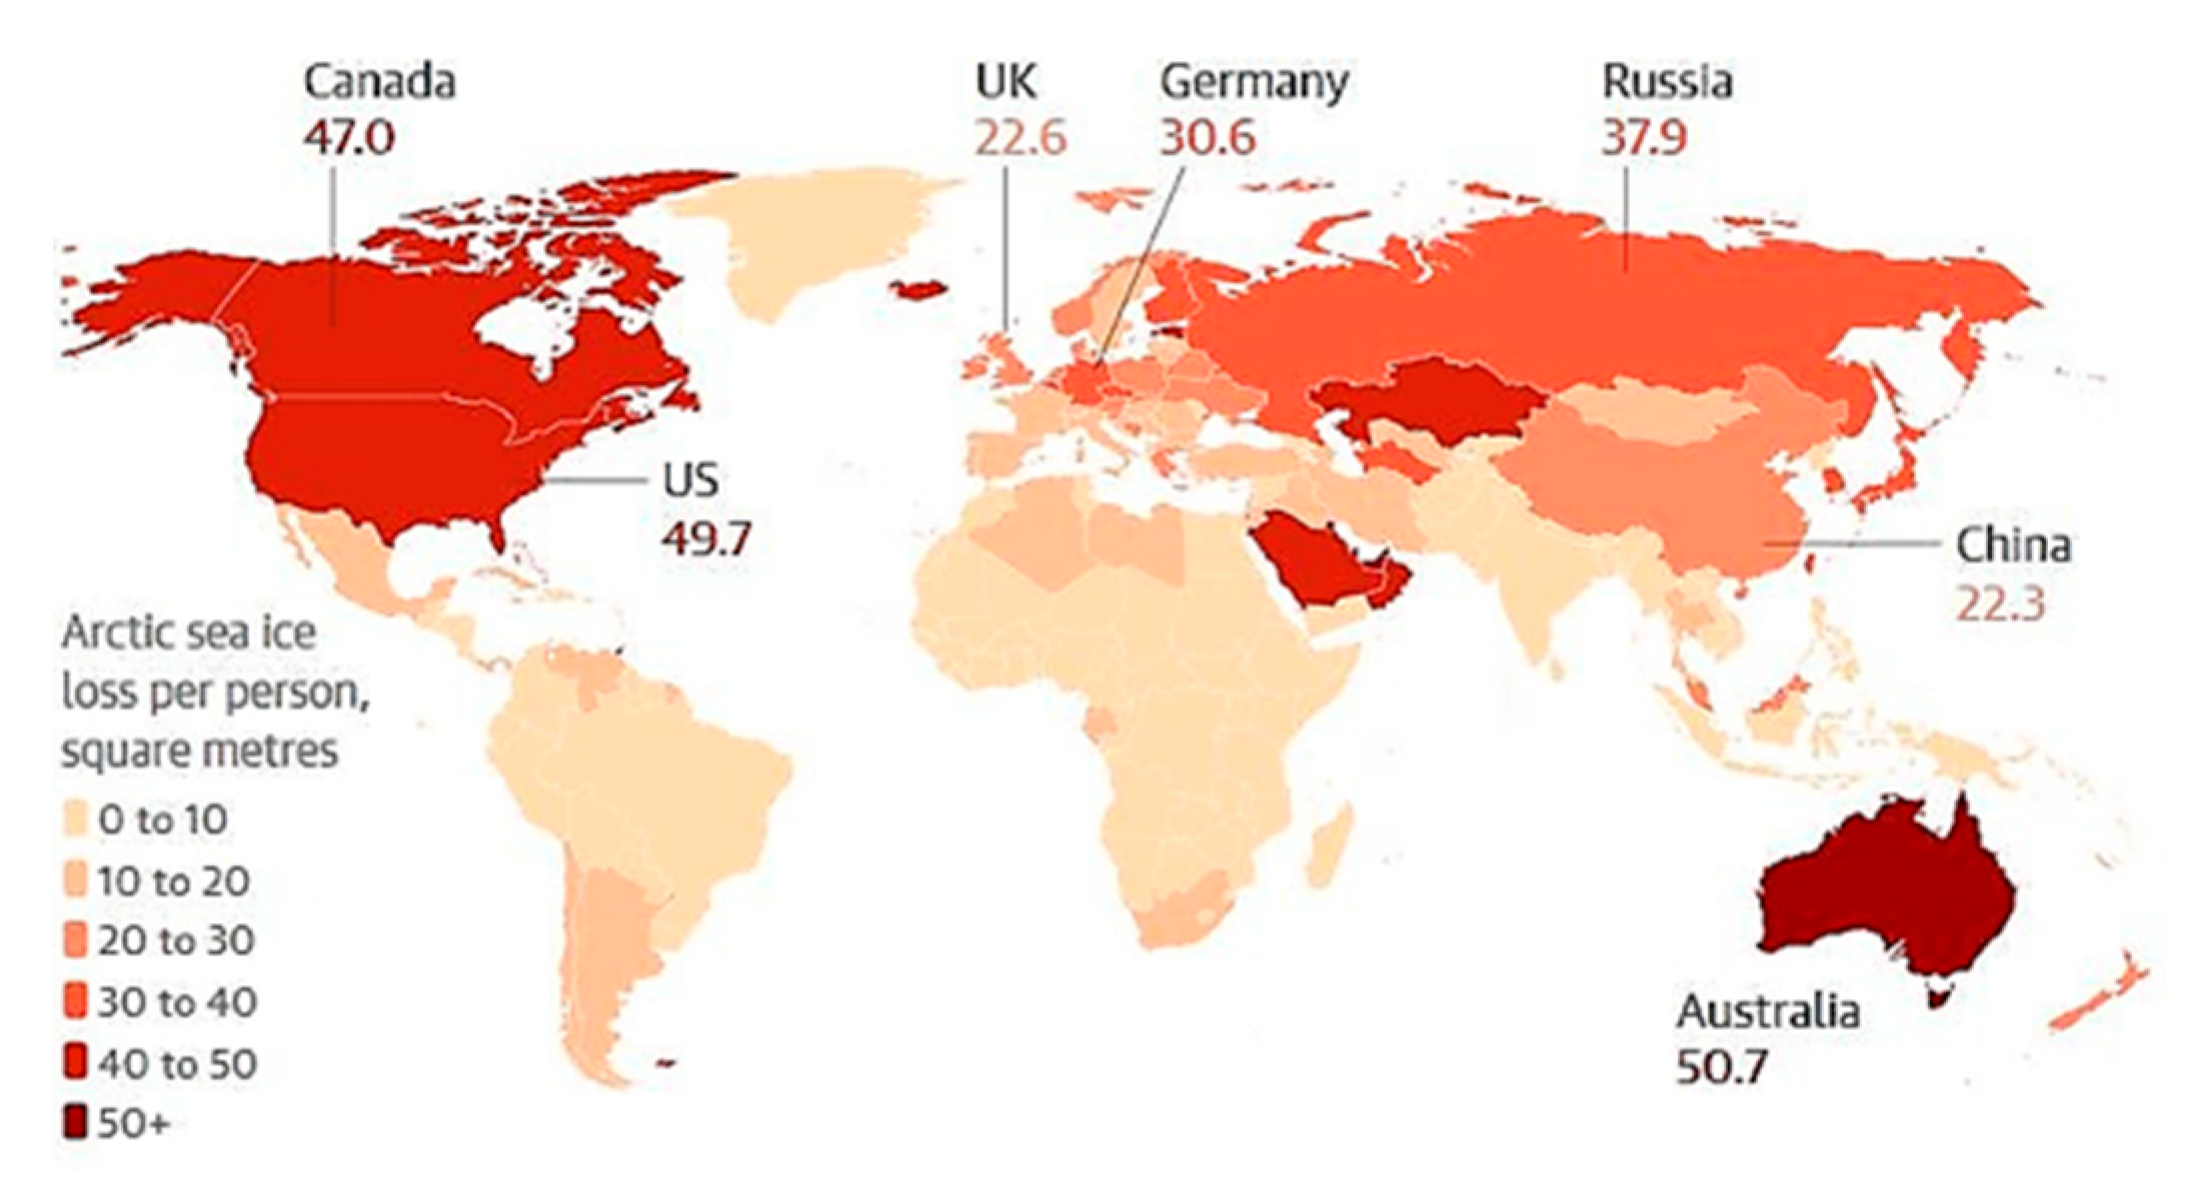
Figure 2.
Steam circuit composed by the boiler, steam pipeline and steamtrap.
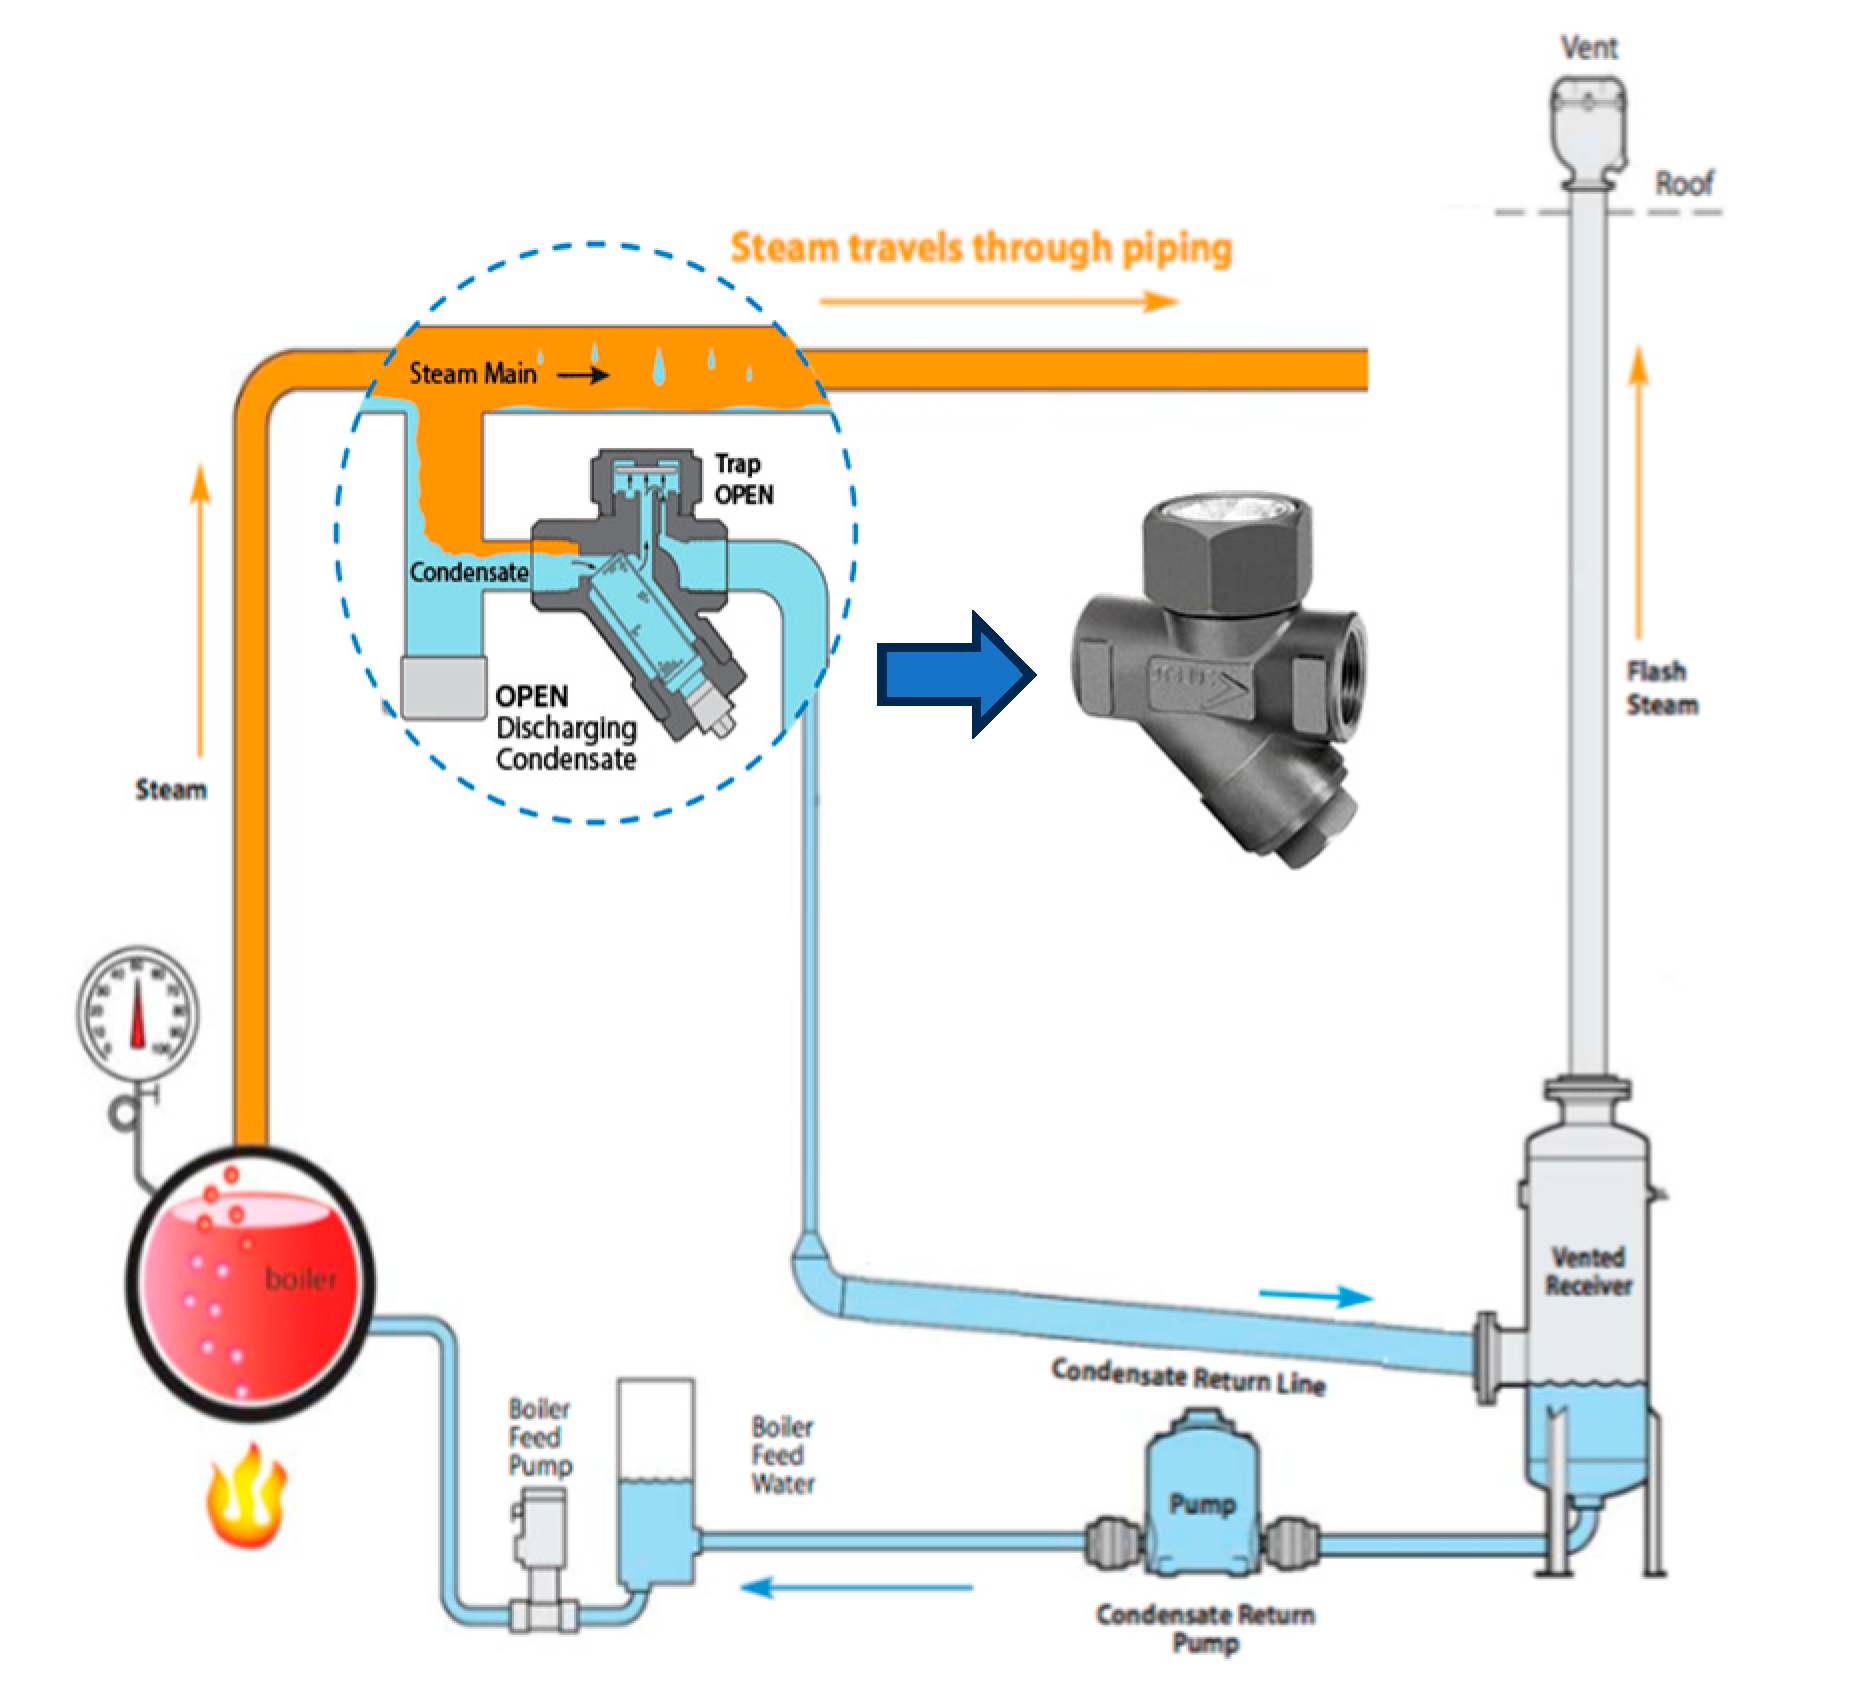
Figure 3.
Napiers equation representing Steam loss in Kg per hour.
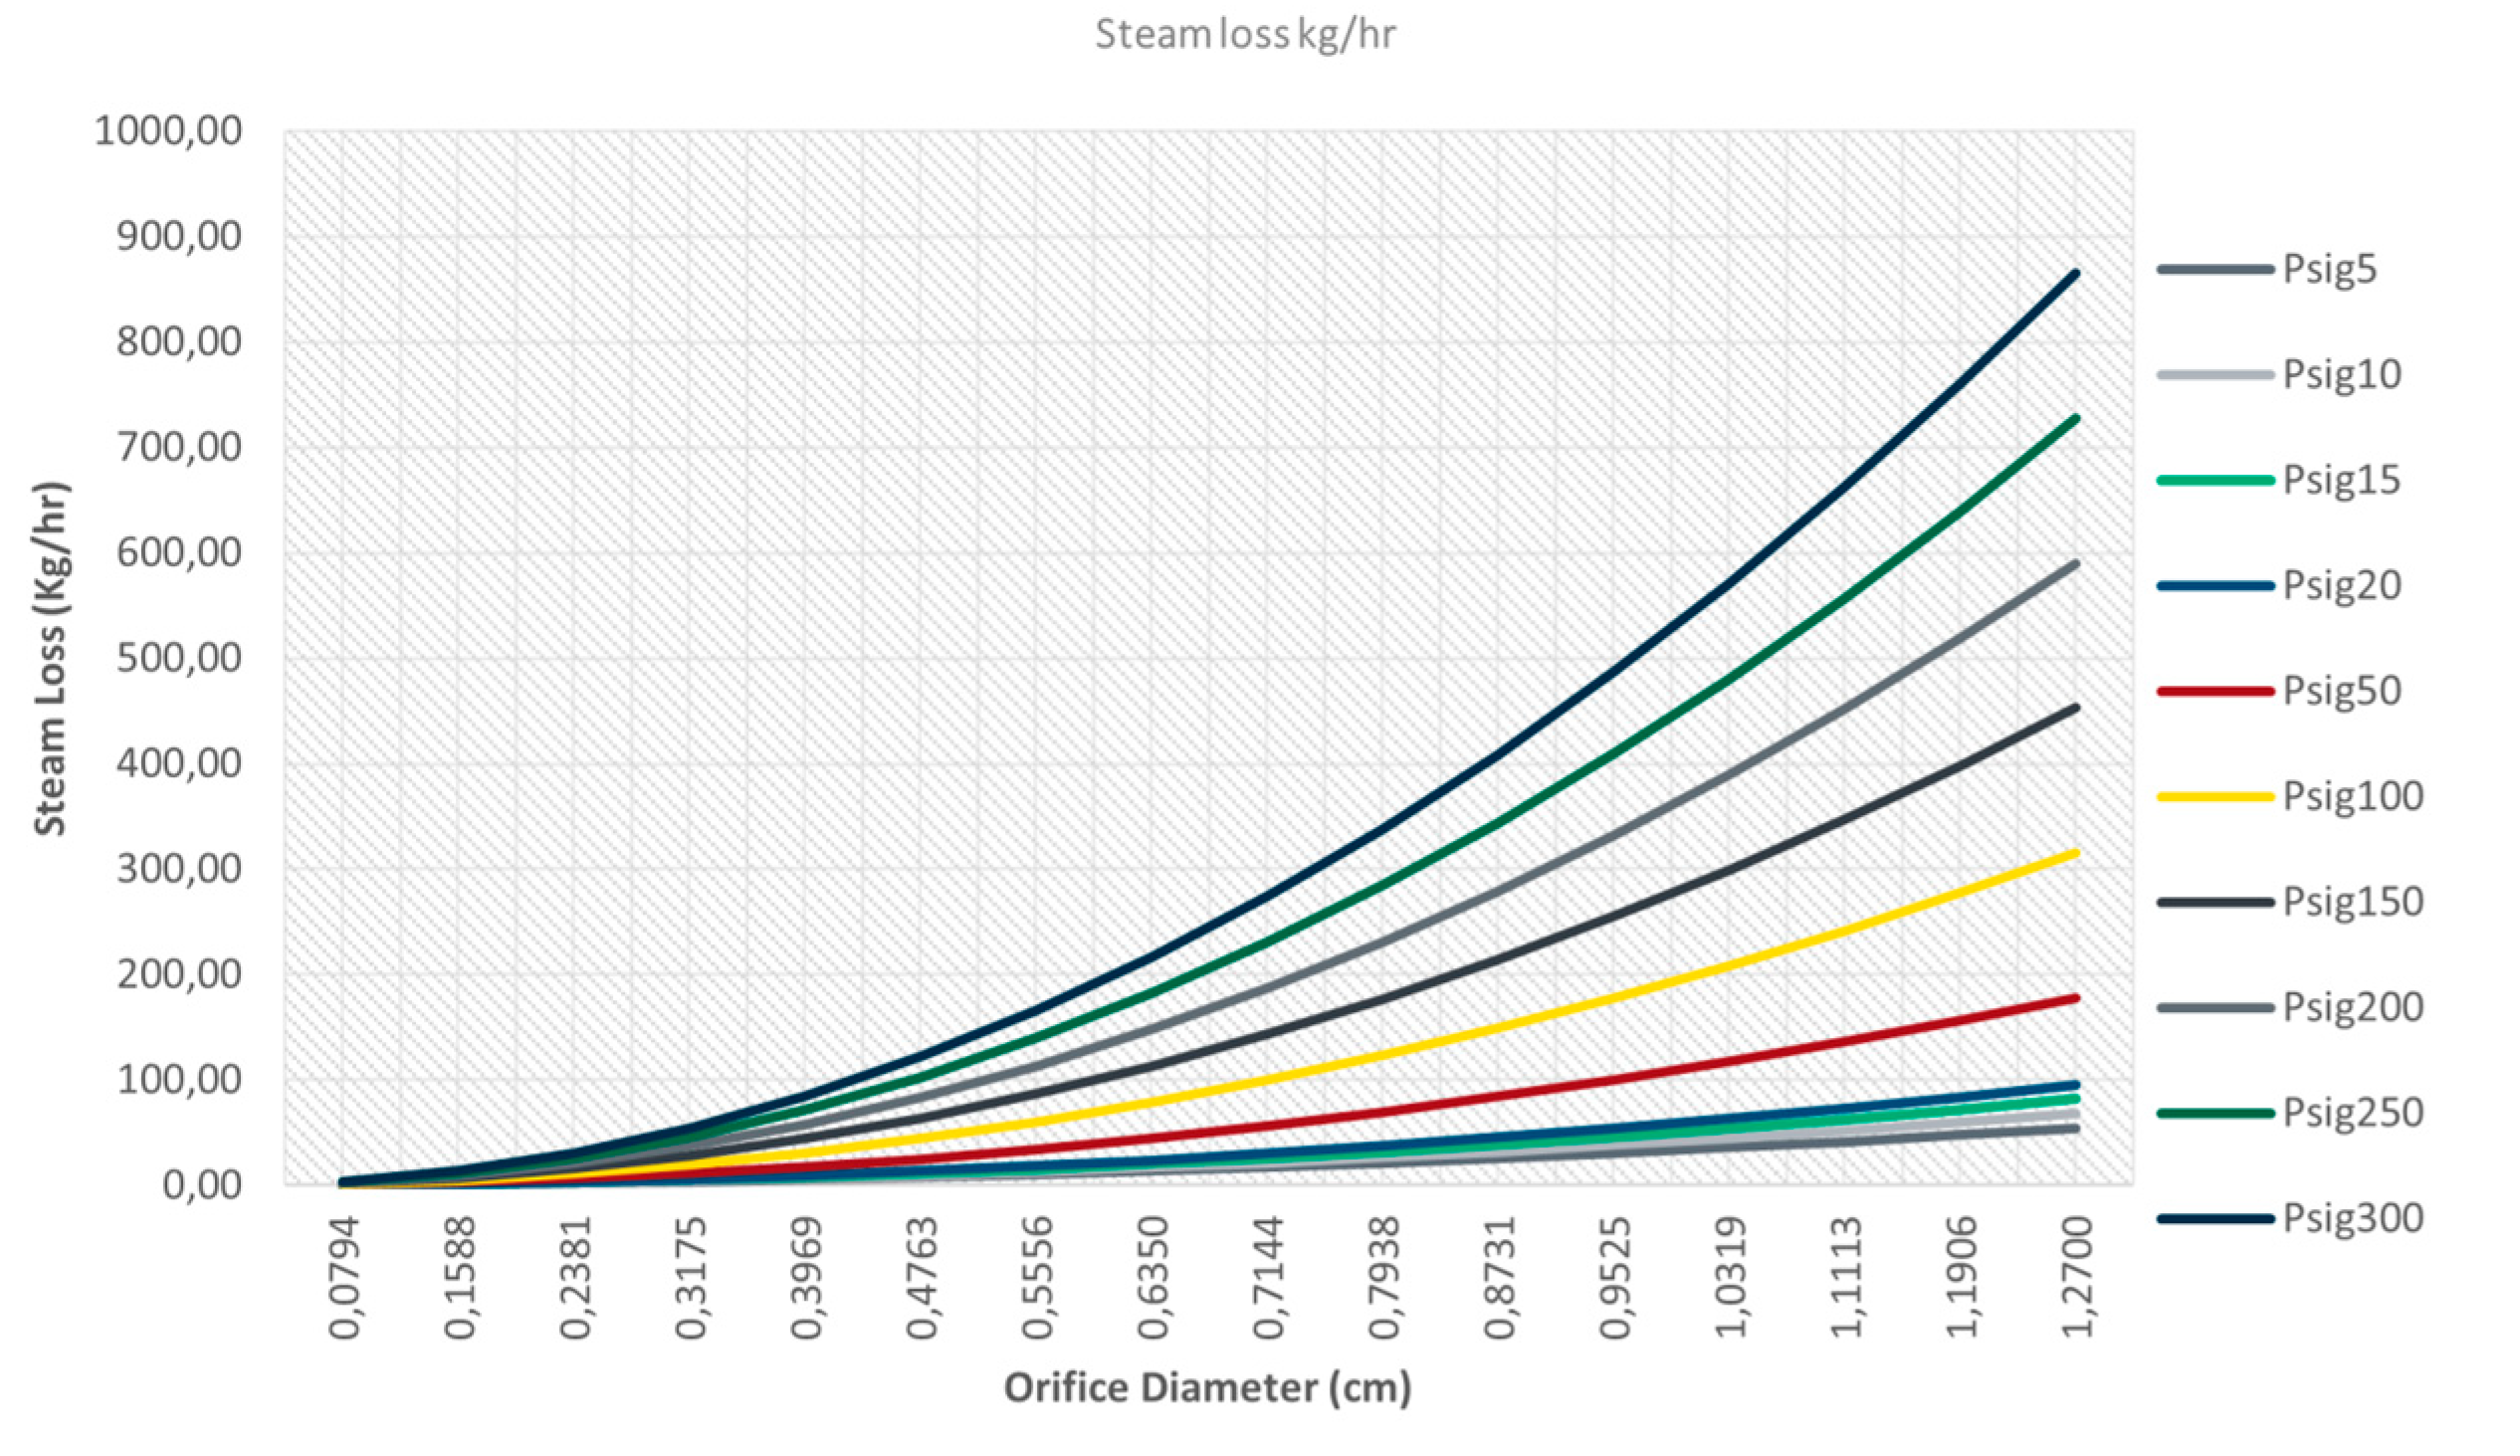
Figure 4.
Proposed scenario from the heat-powered IoT device to cloud platform.

Figure 5.
The heat powered IIoT device composed by three modules, rendered (a) and real (b).
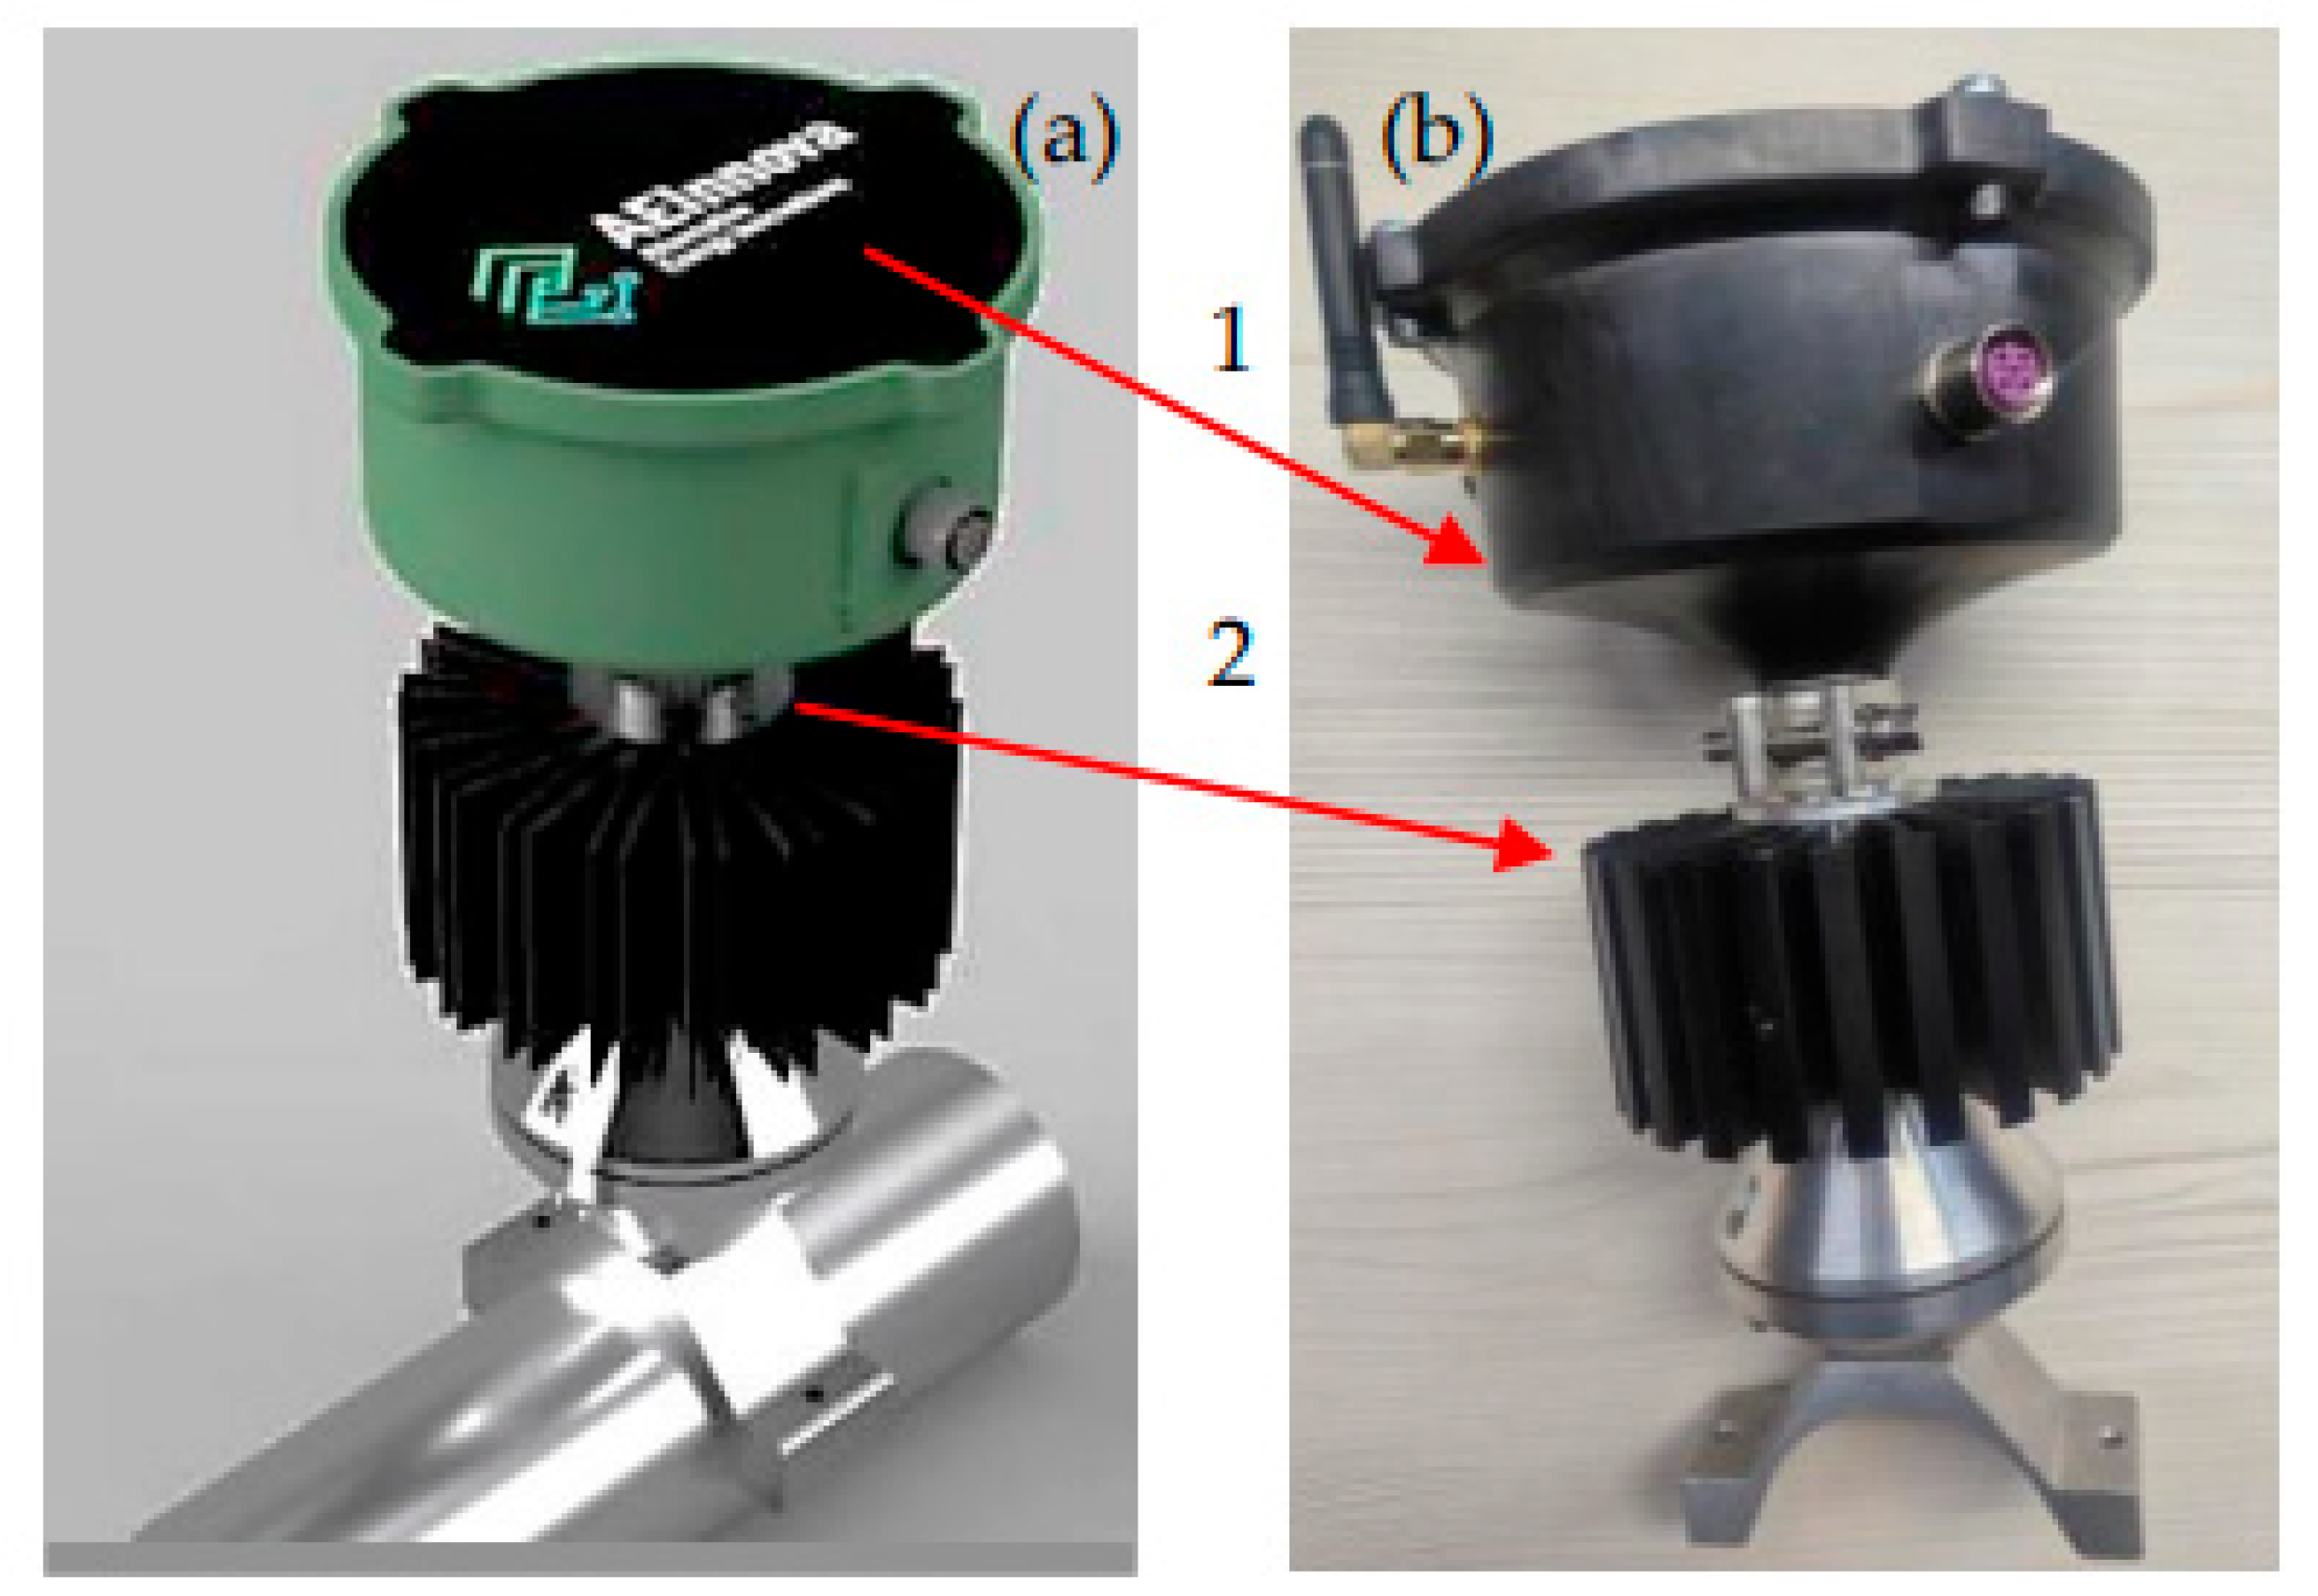
Figure 6.
Thermoelectric Peltier housing for pipeline (a) and radiator (b) to build the ΔT.
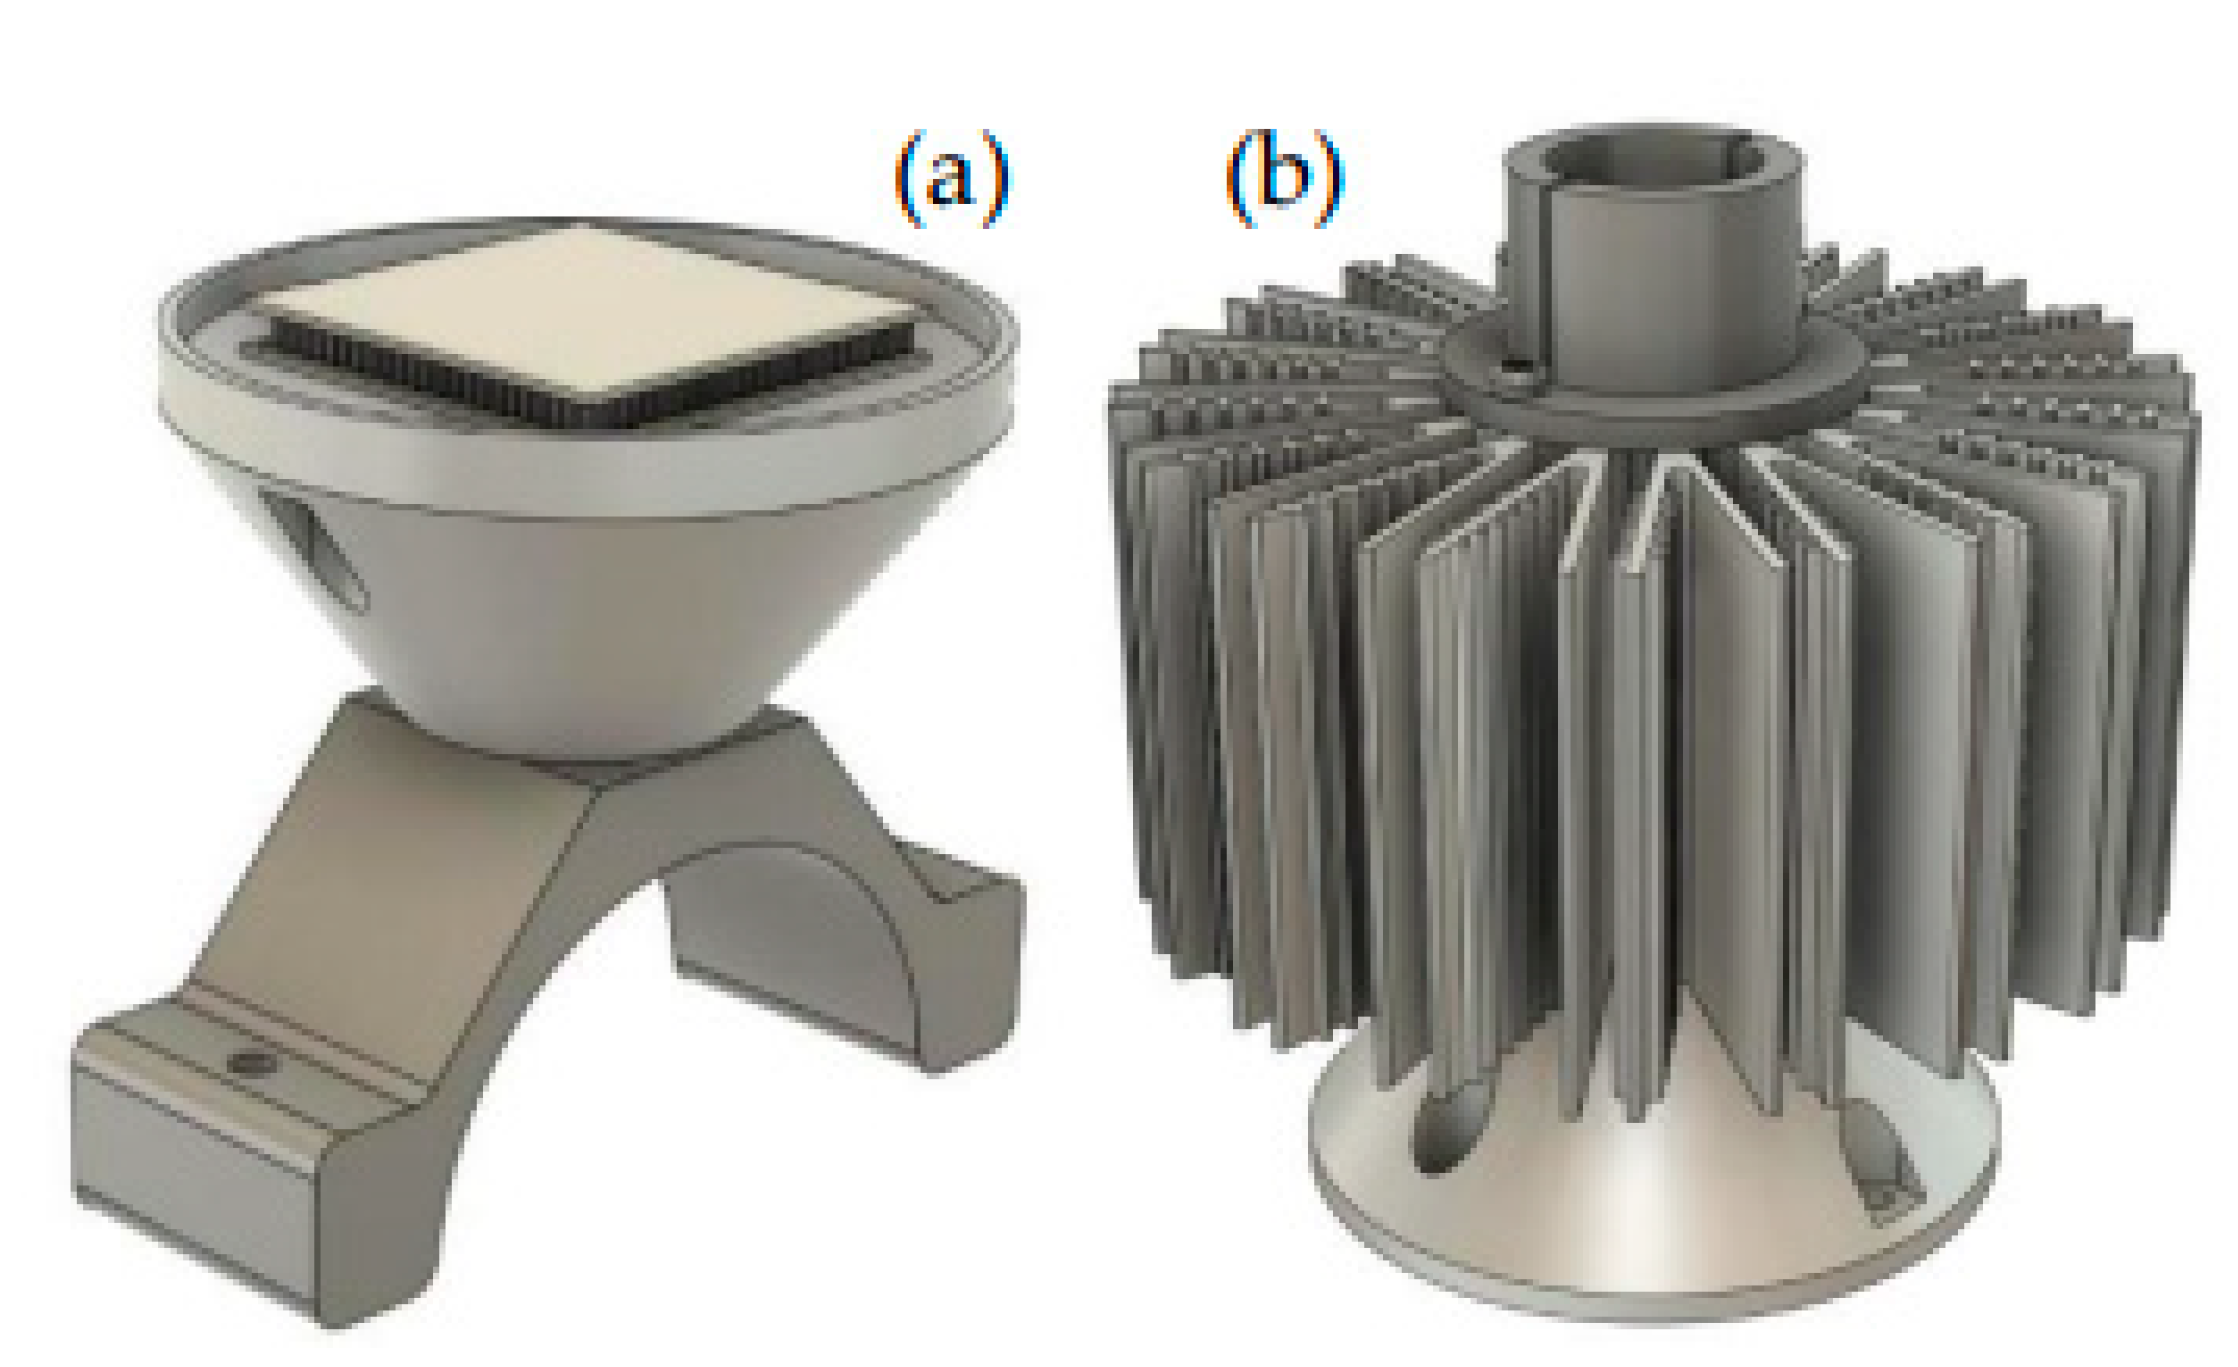
Figure 7.
Heat propagation considering 150ºC of heat in the pipeline.
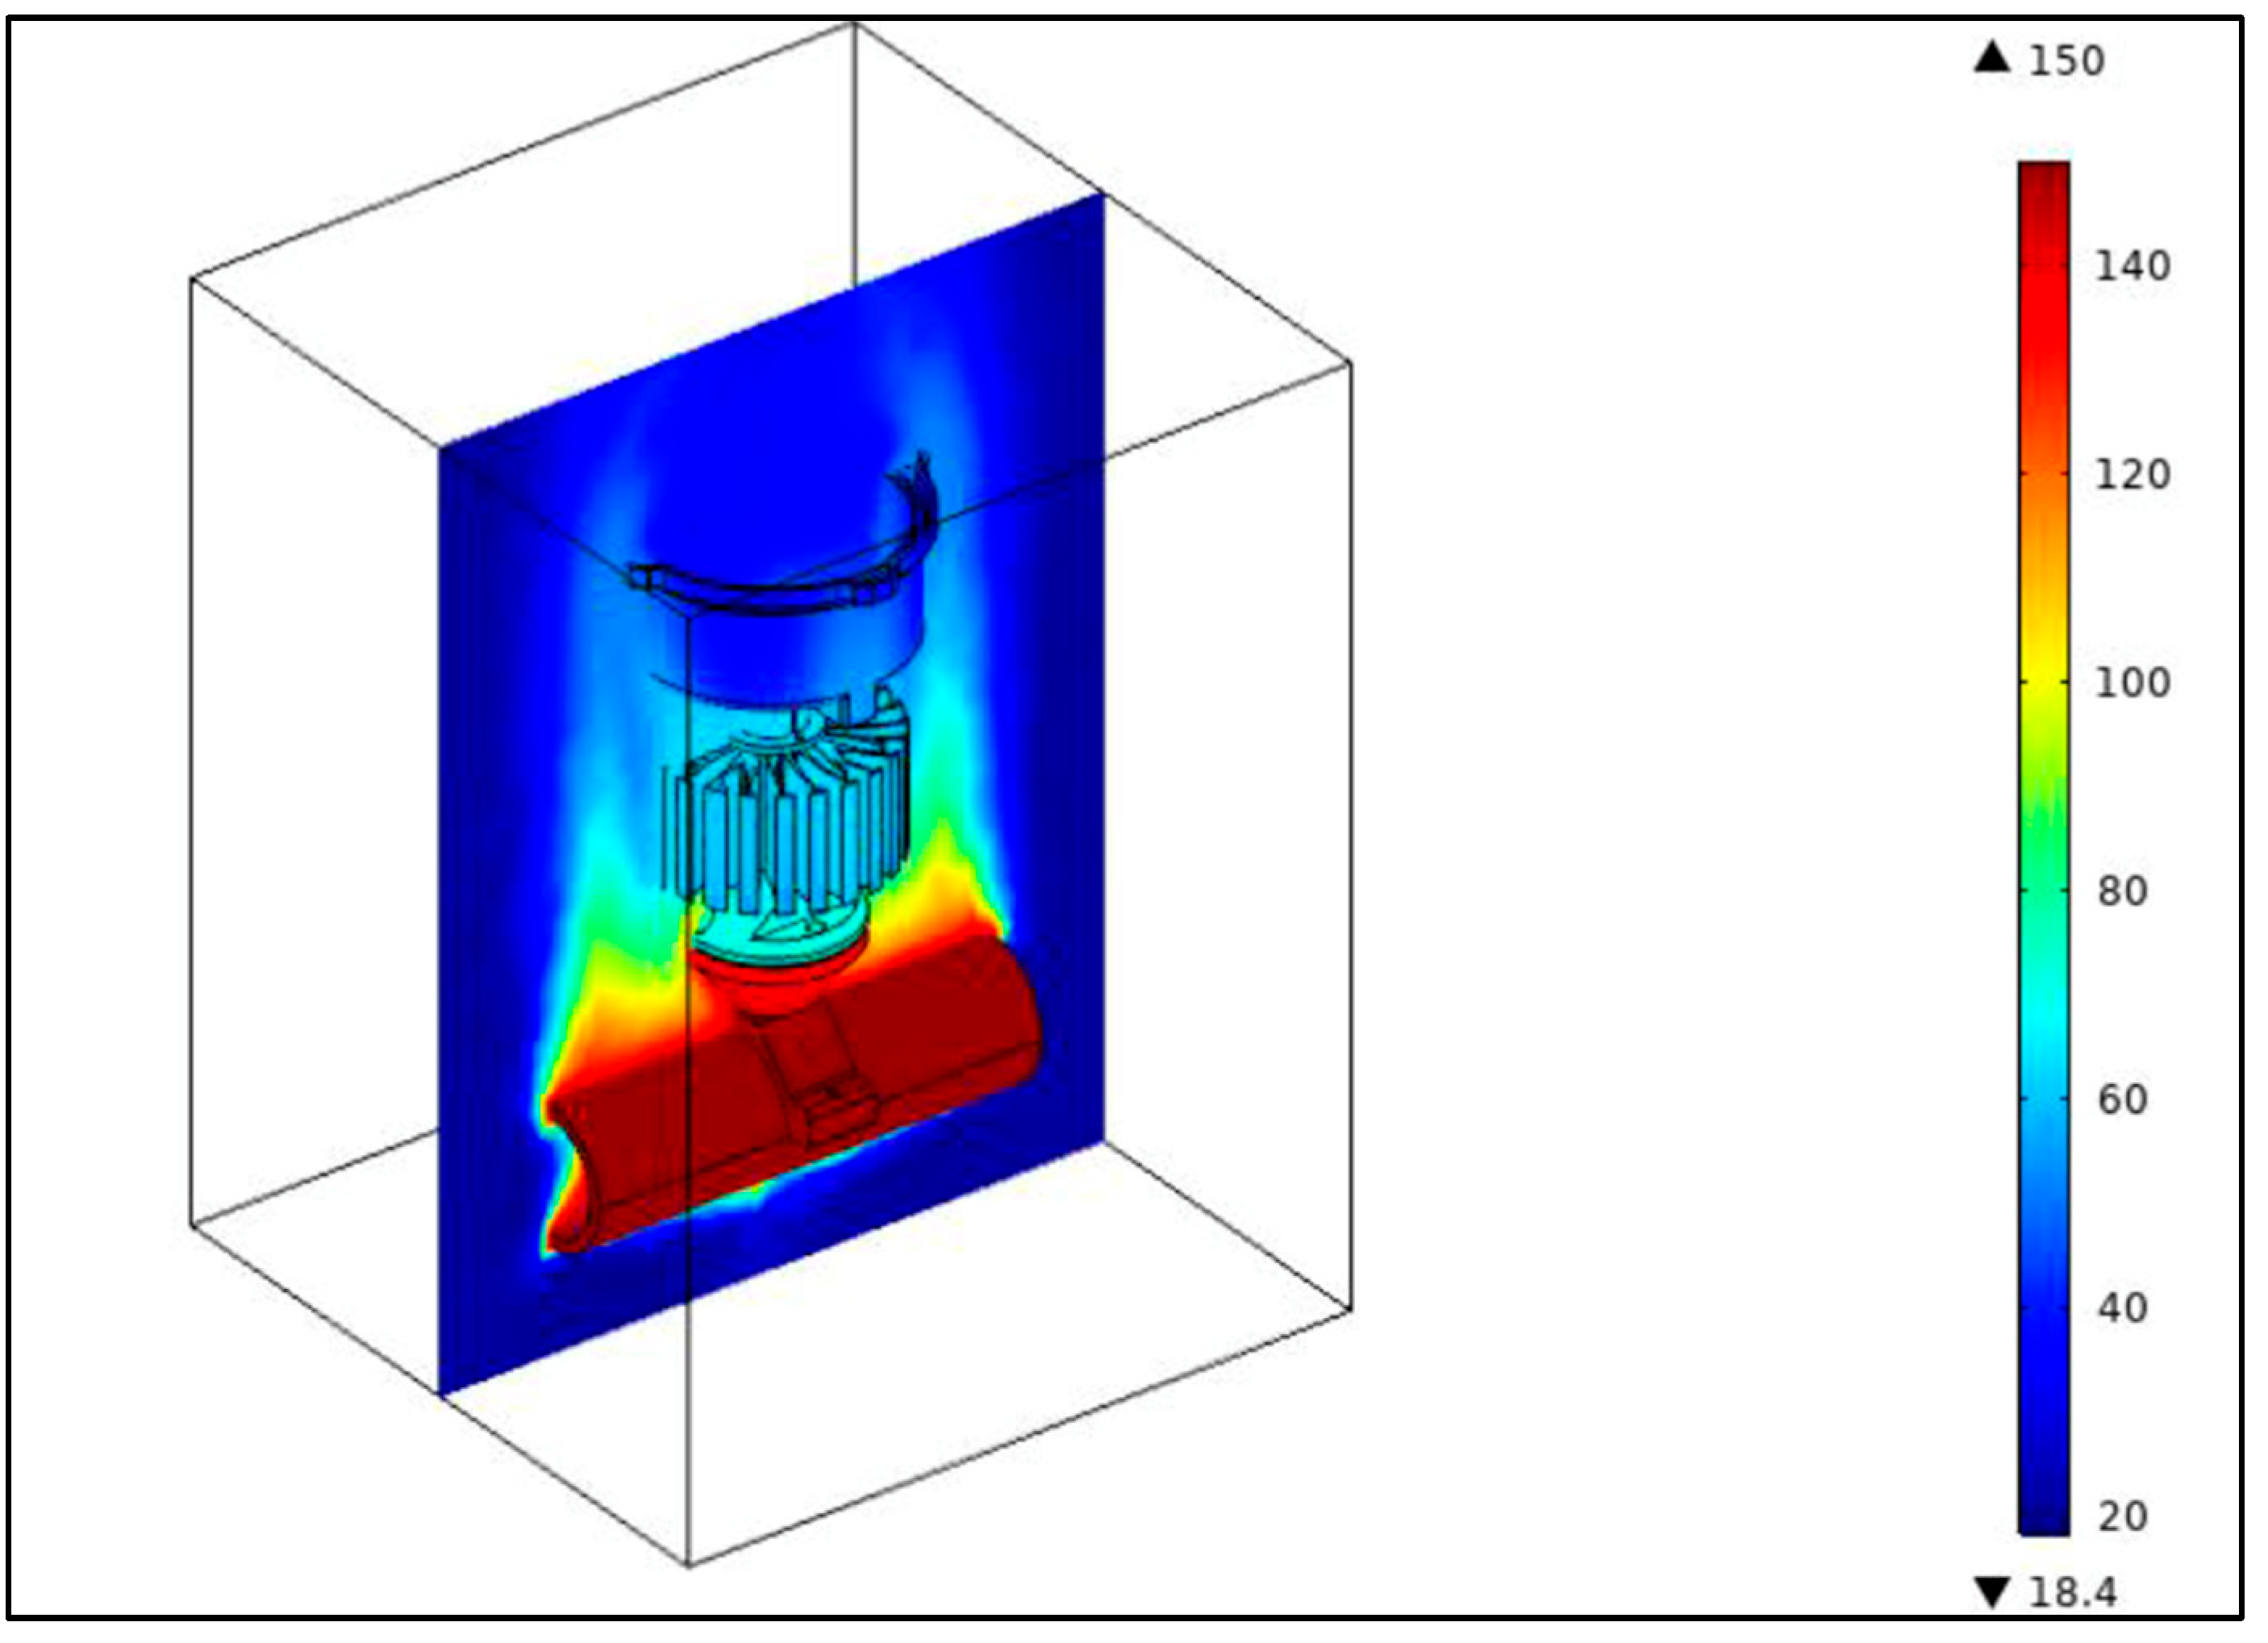
Figure 8.
DC/DC up converter to stabilize the output voltage at 3.3v.
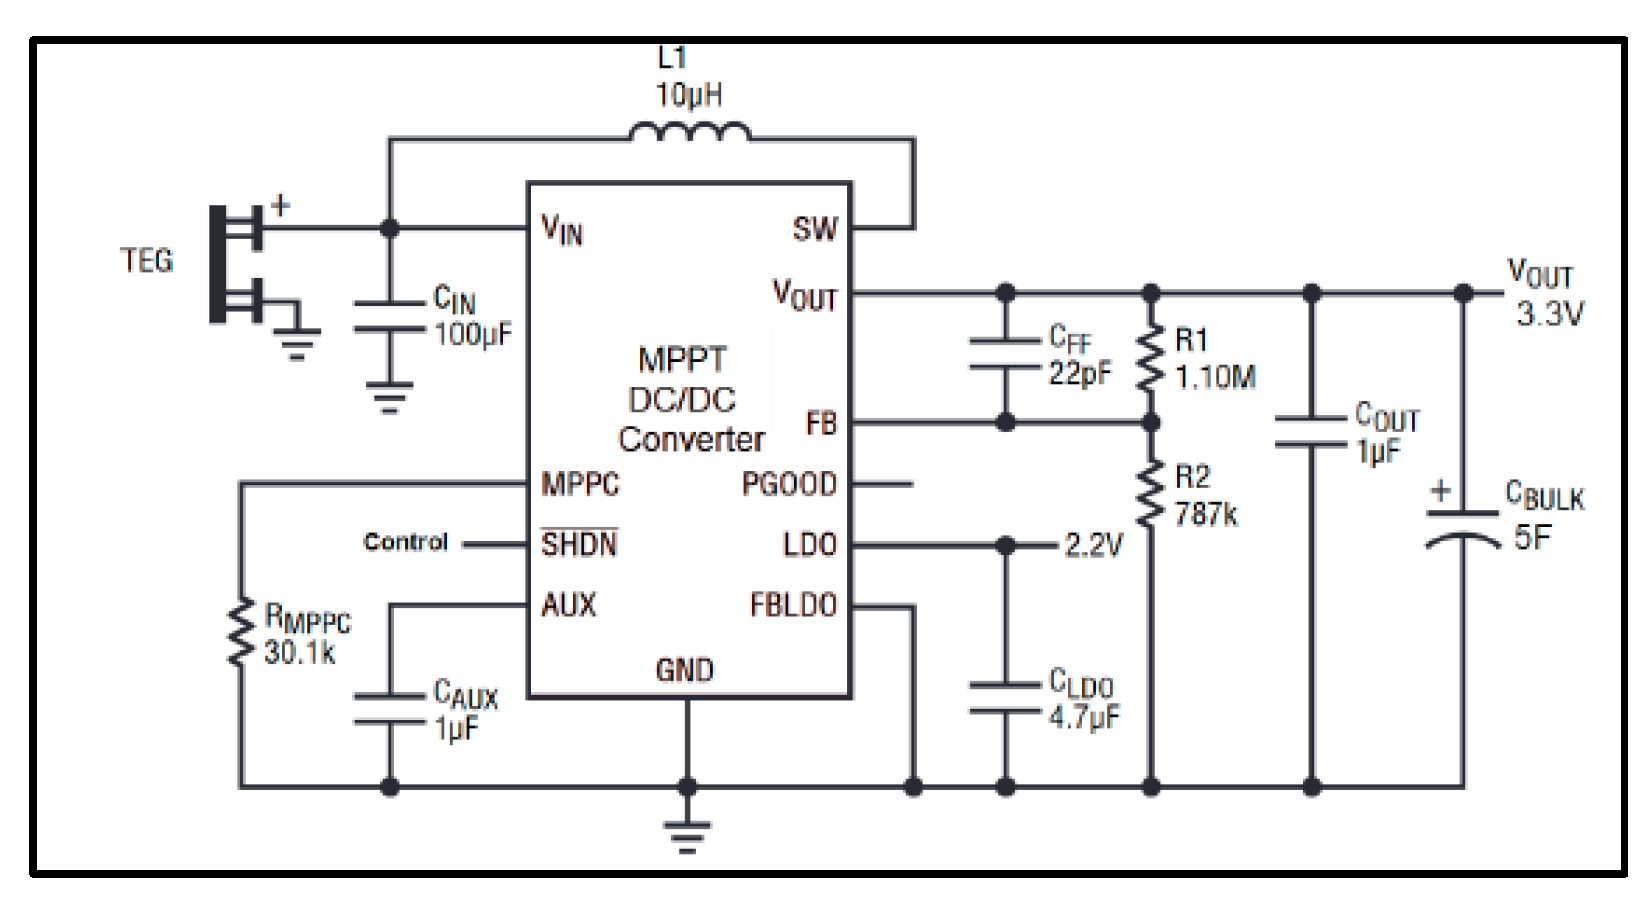
Figure 9.
(a) Main board location. (b) Main board diagram.
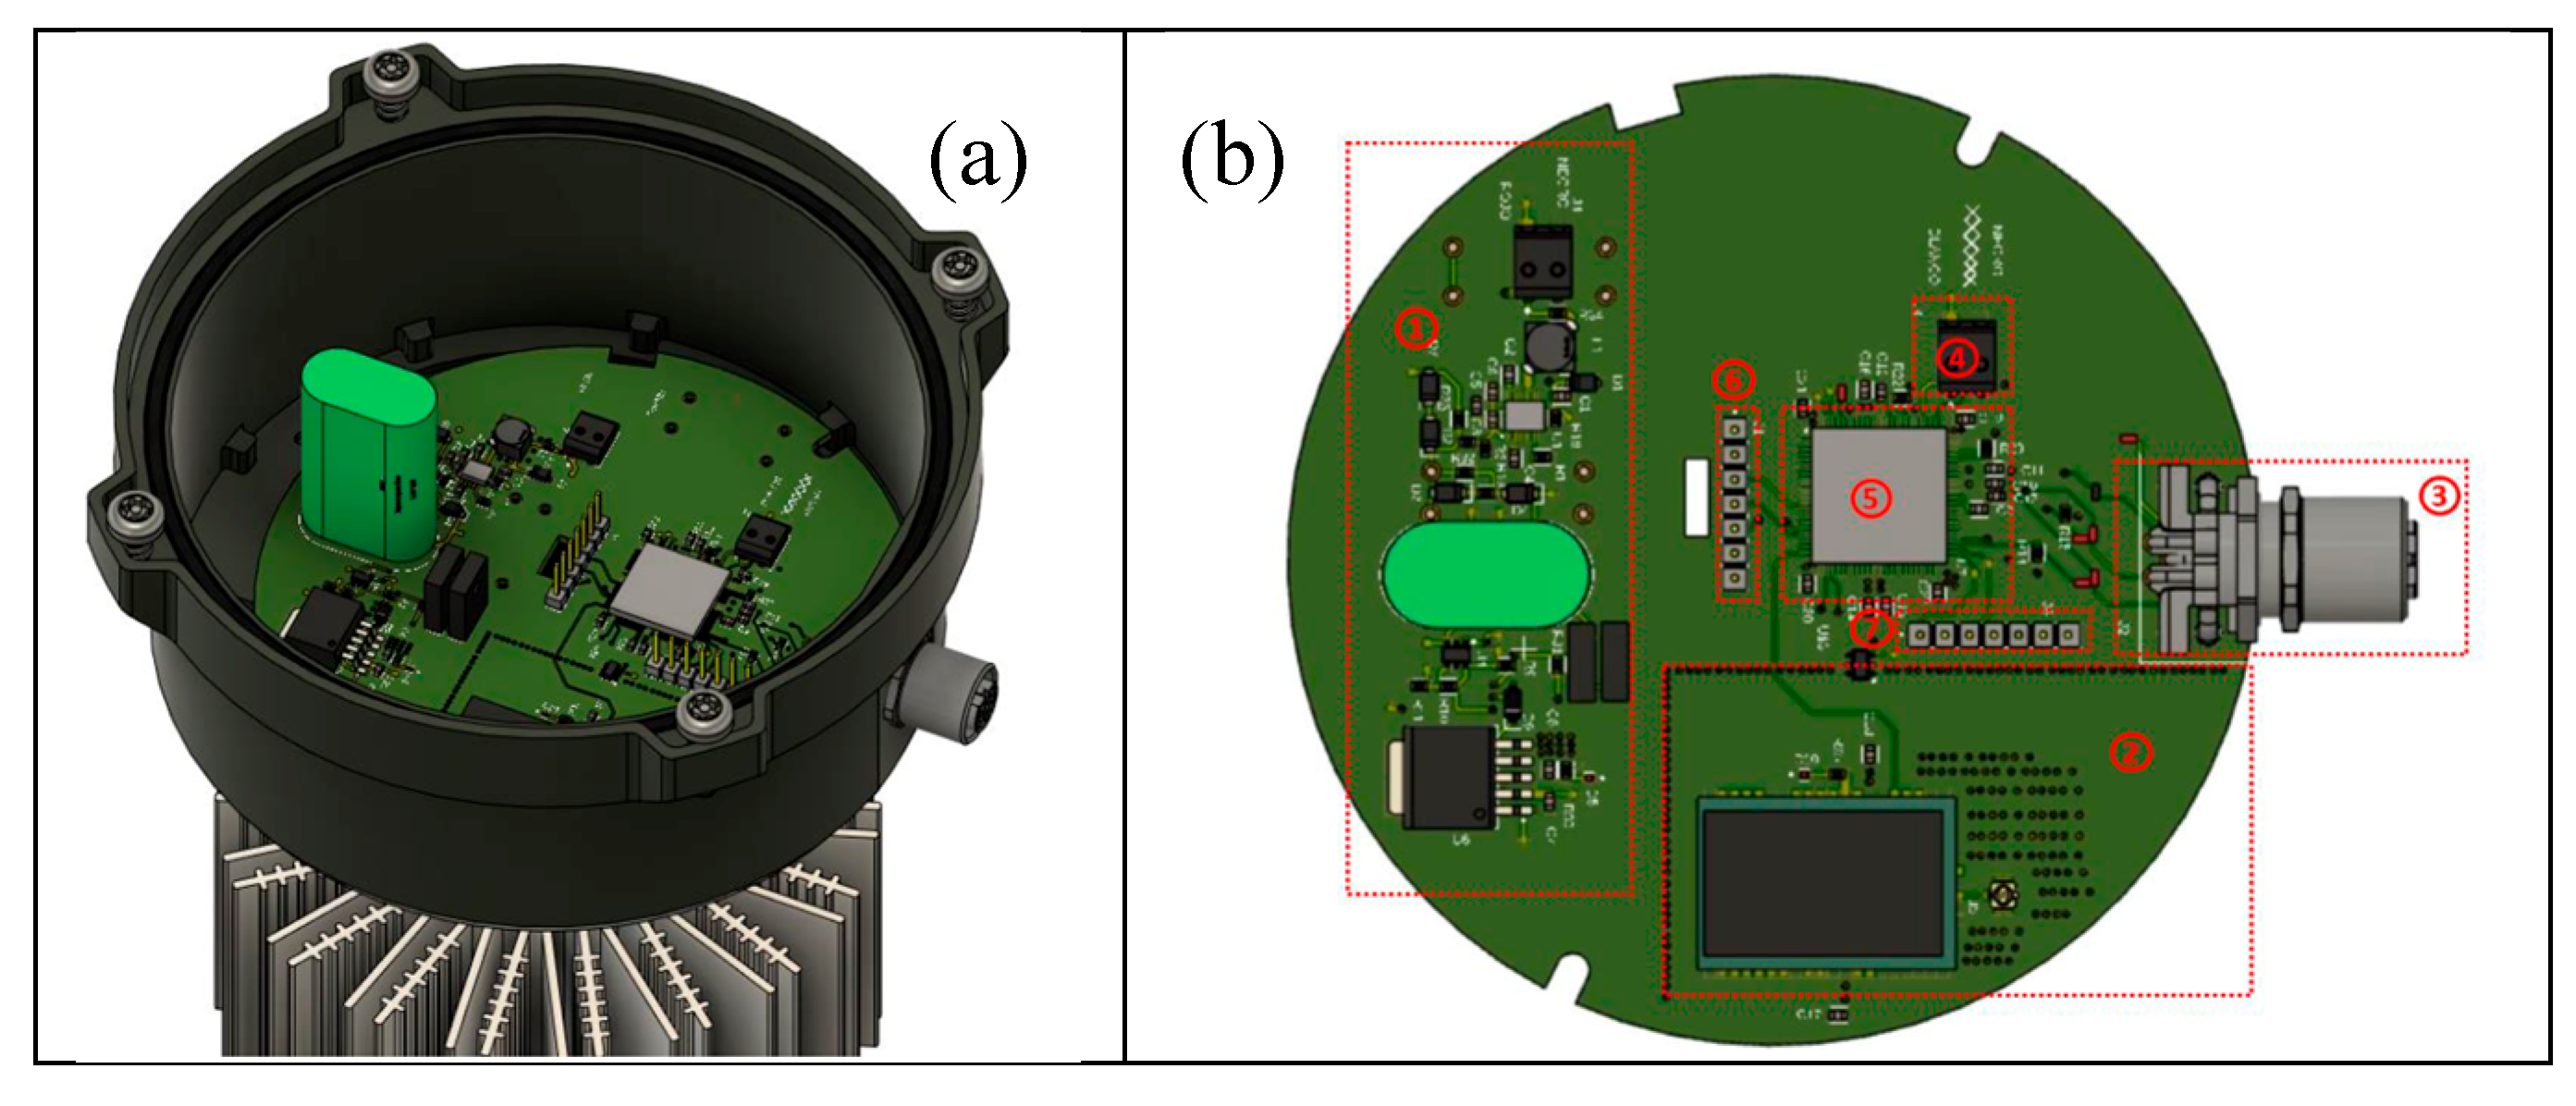
Figure 10.
Main board location with components for data processing and communication.
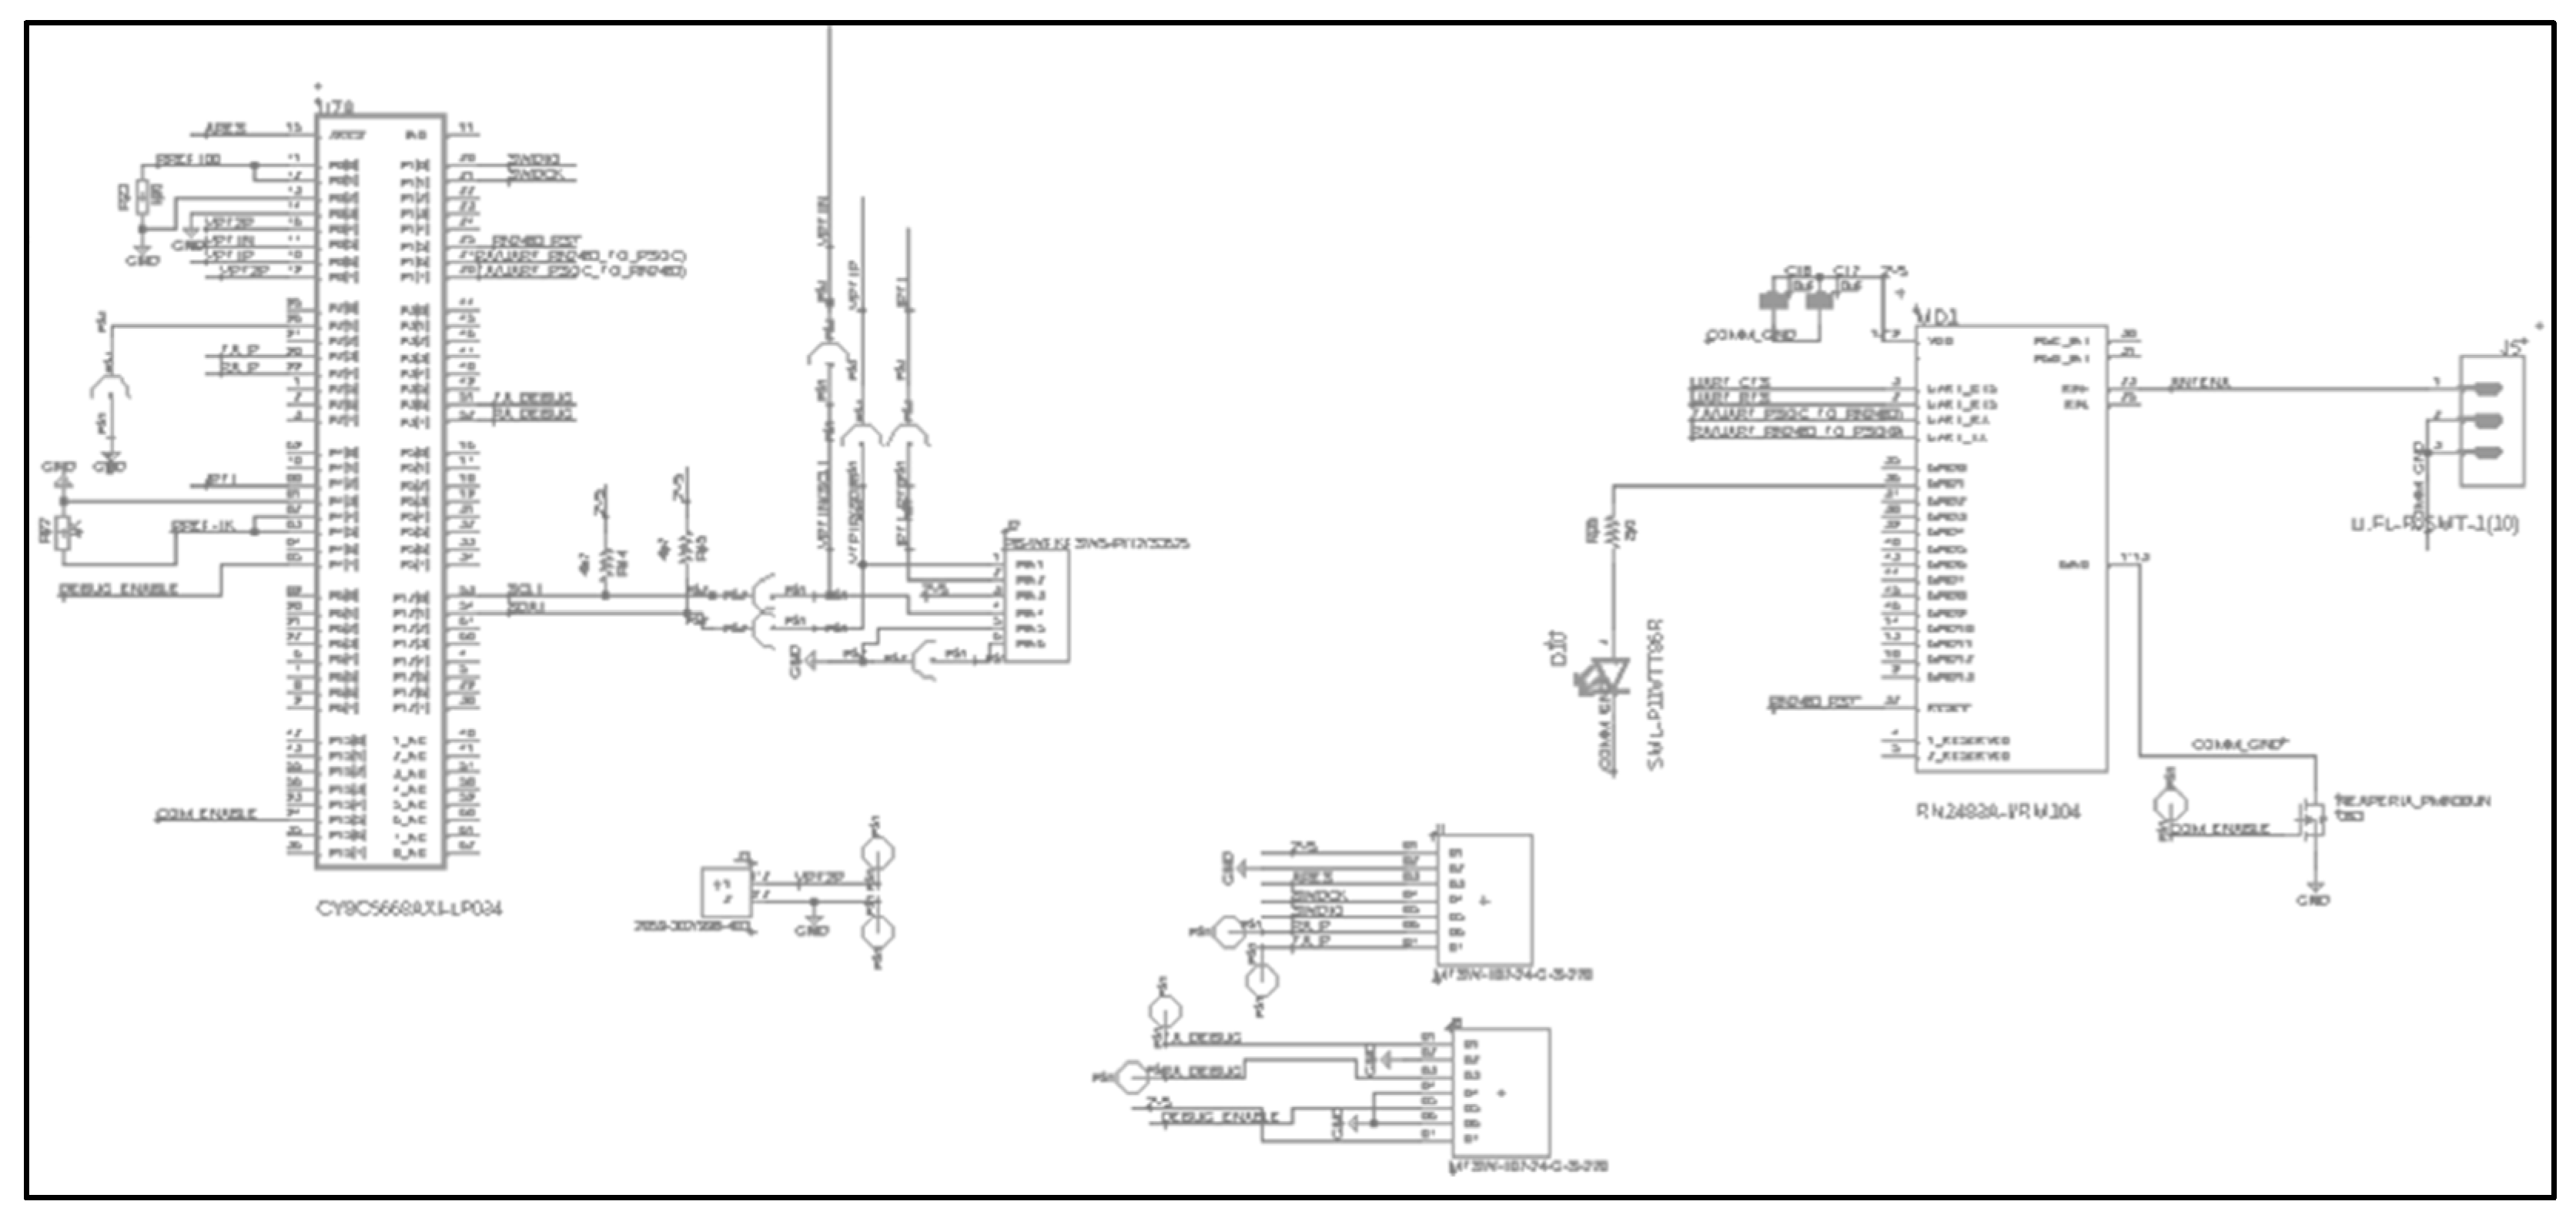
Figure 11.
Main board solded with all components ready for testing.
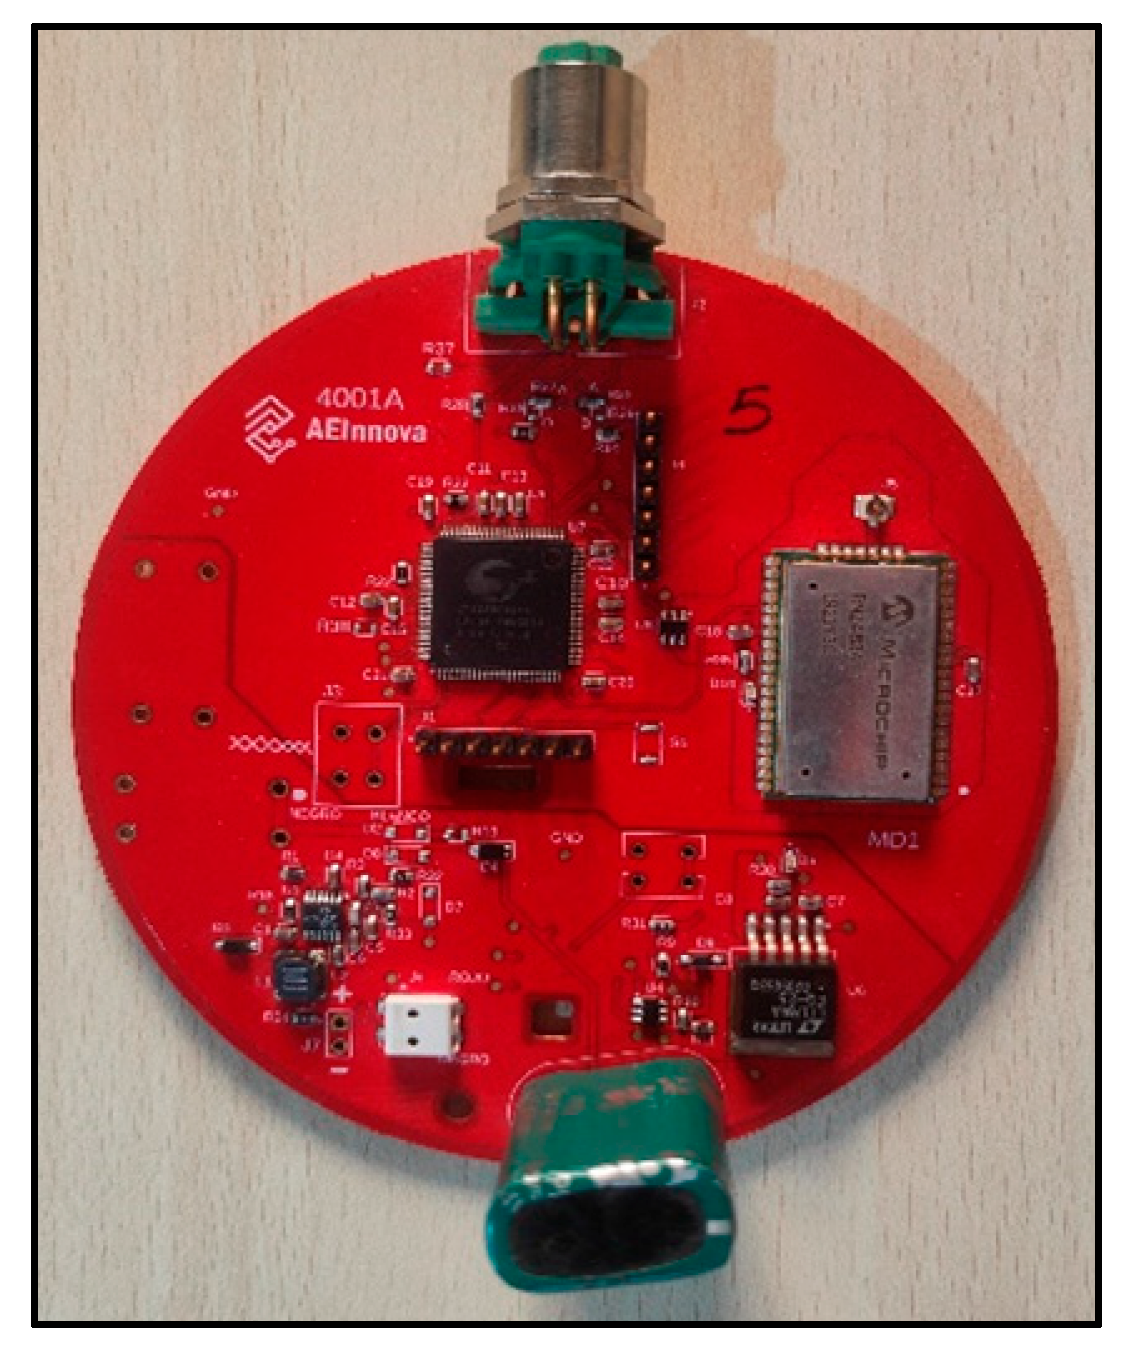
Figure 12.
Main algorithm.
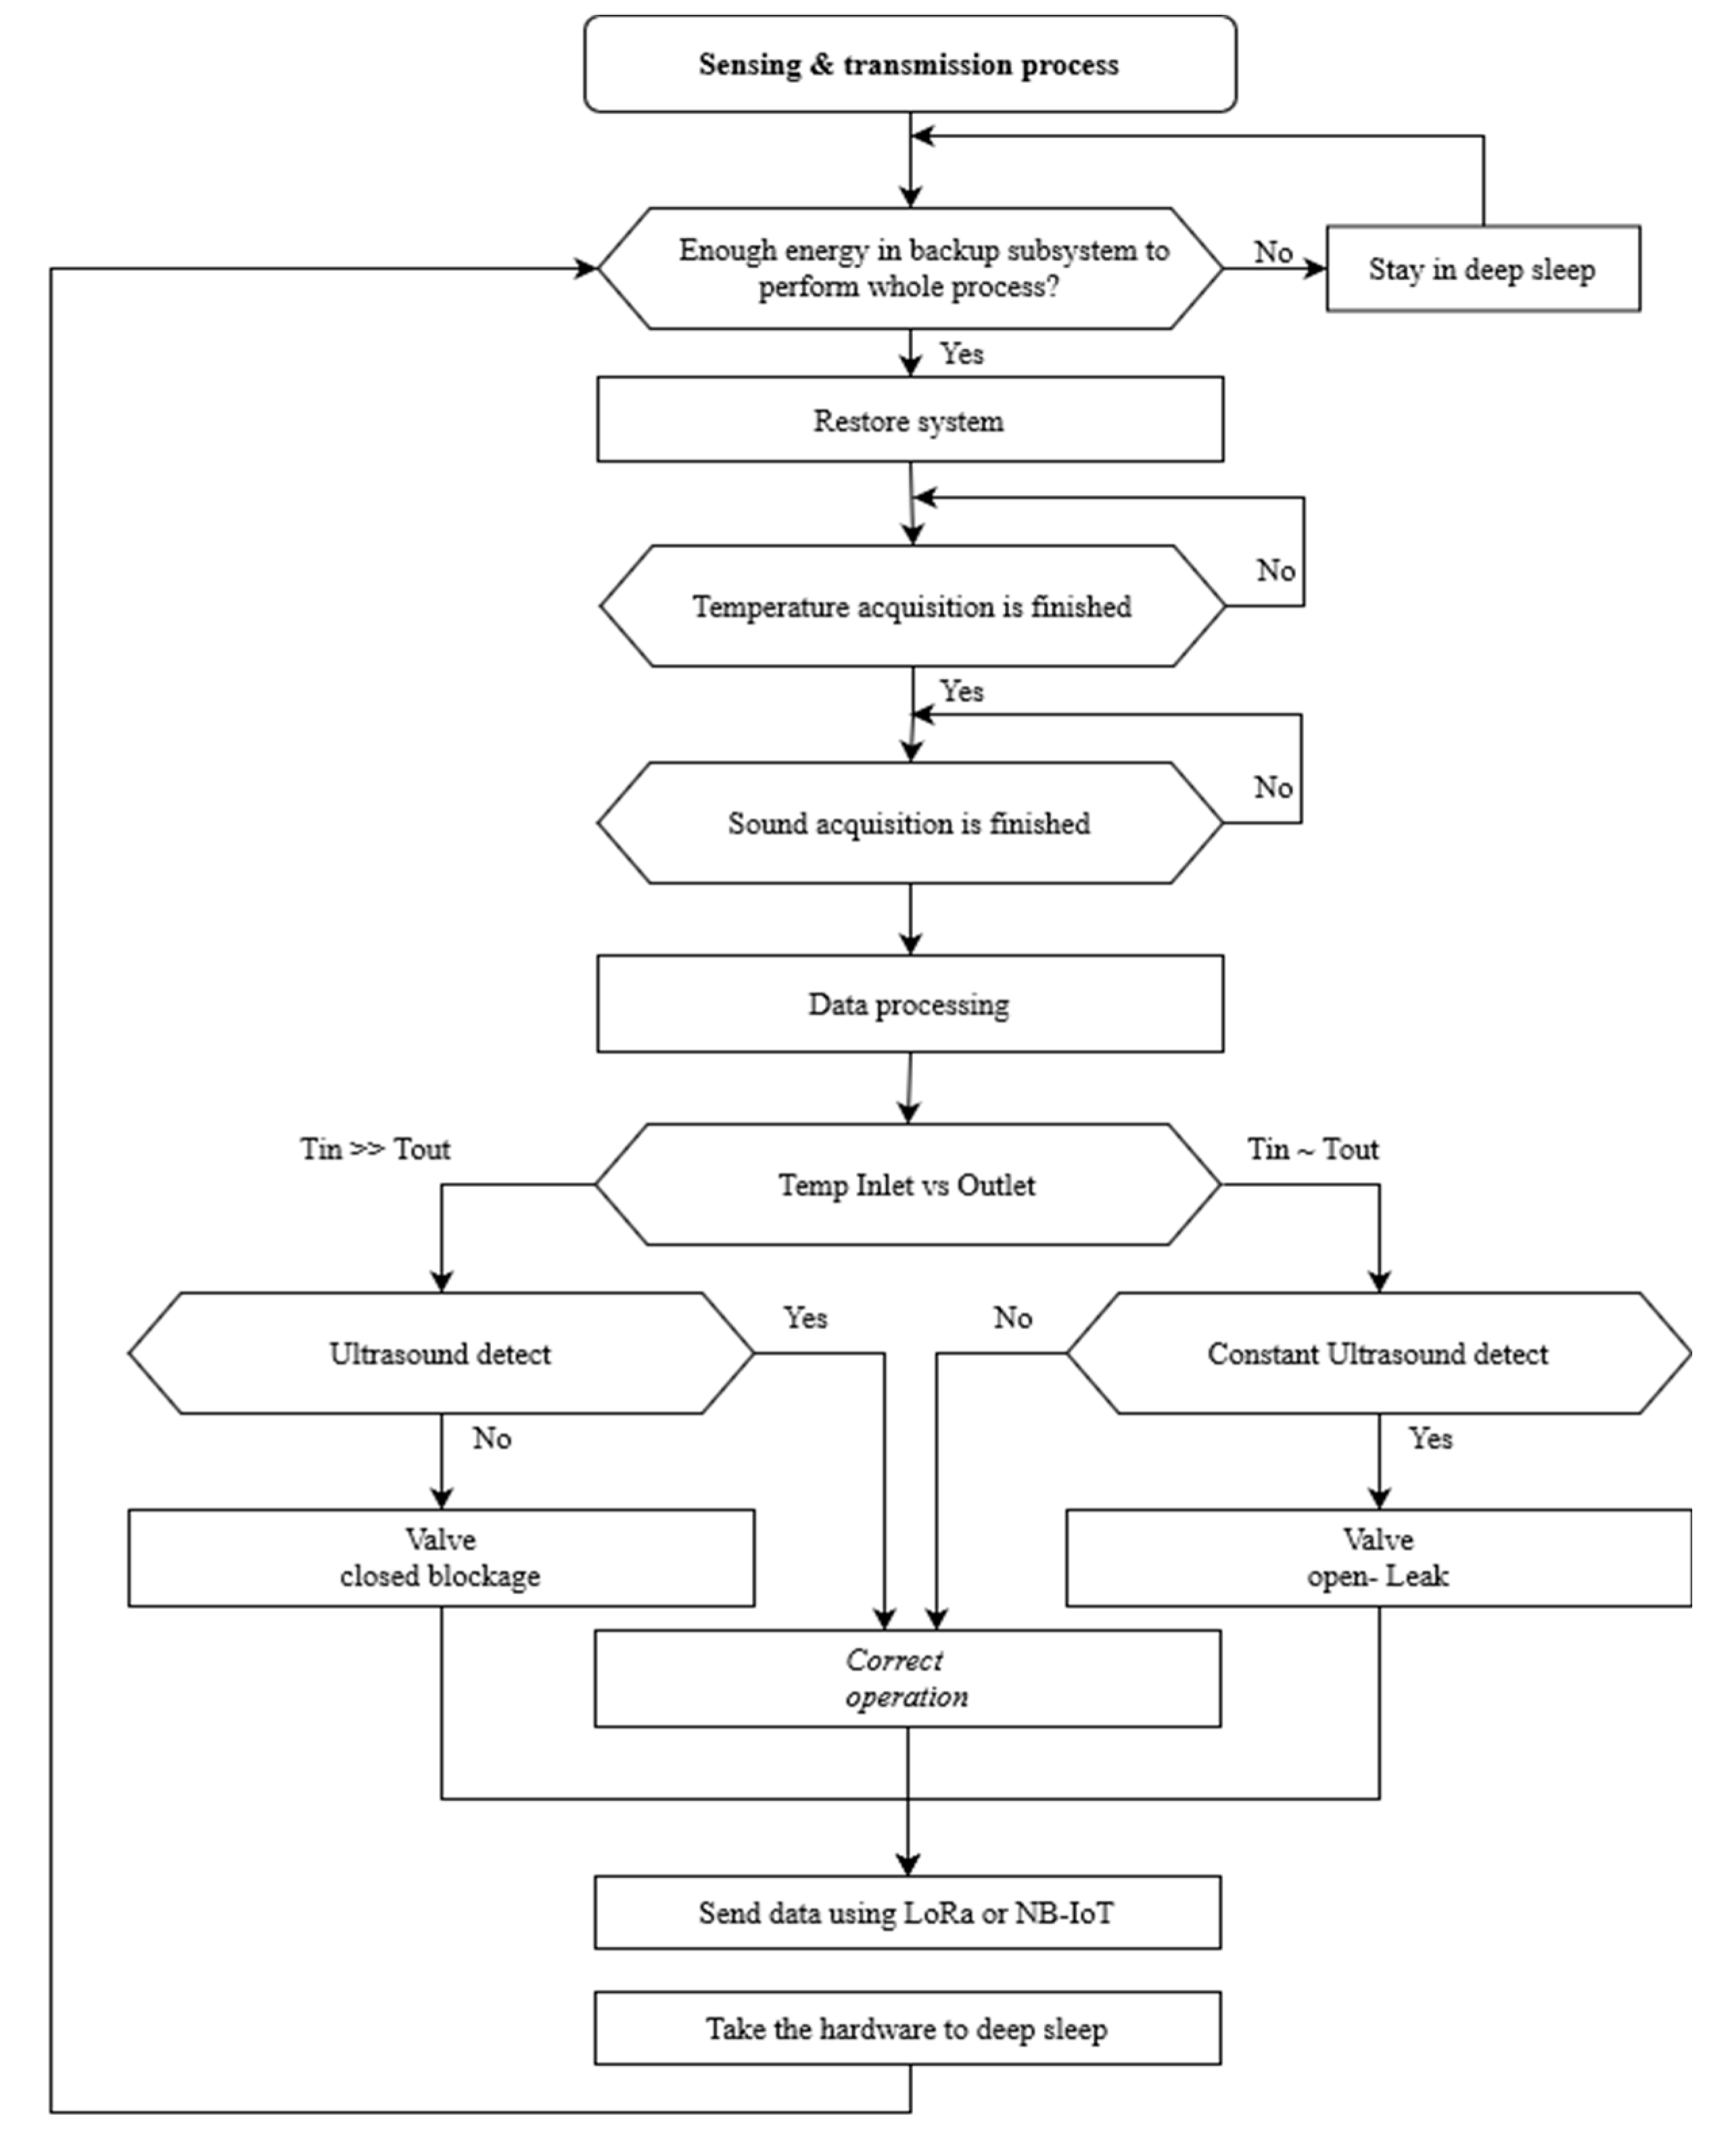
Figure 13.
(a) the testbech. (b) device under test.
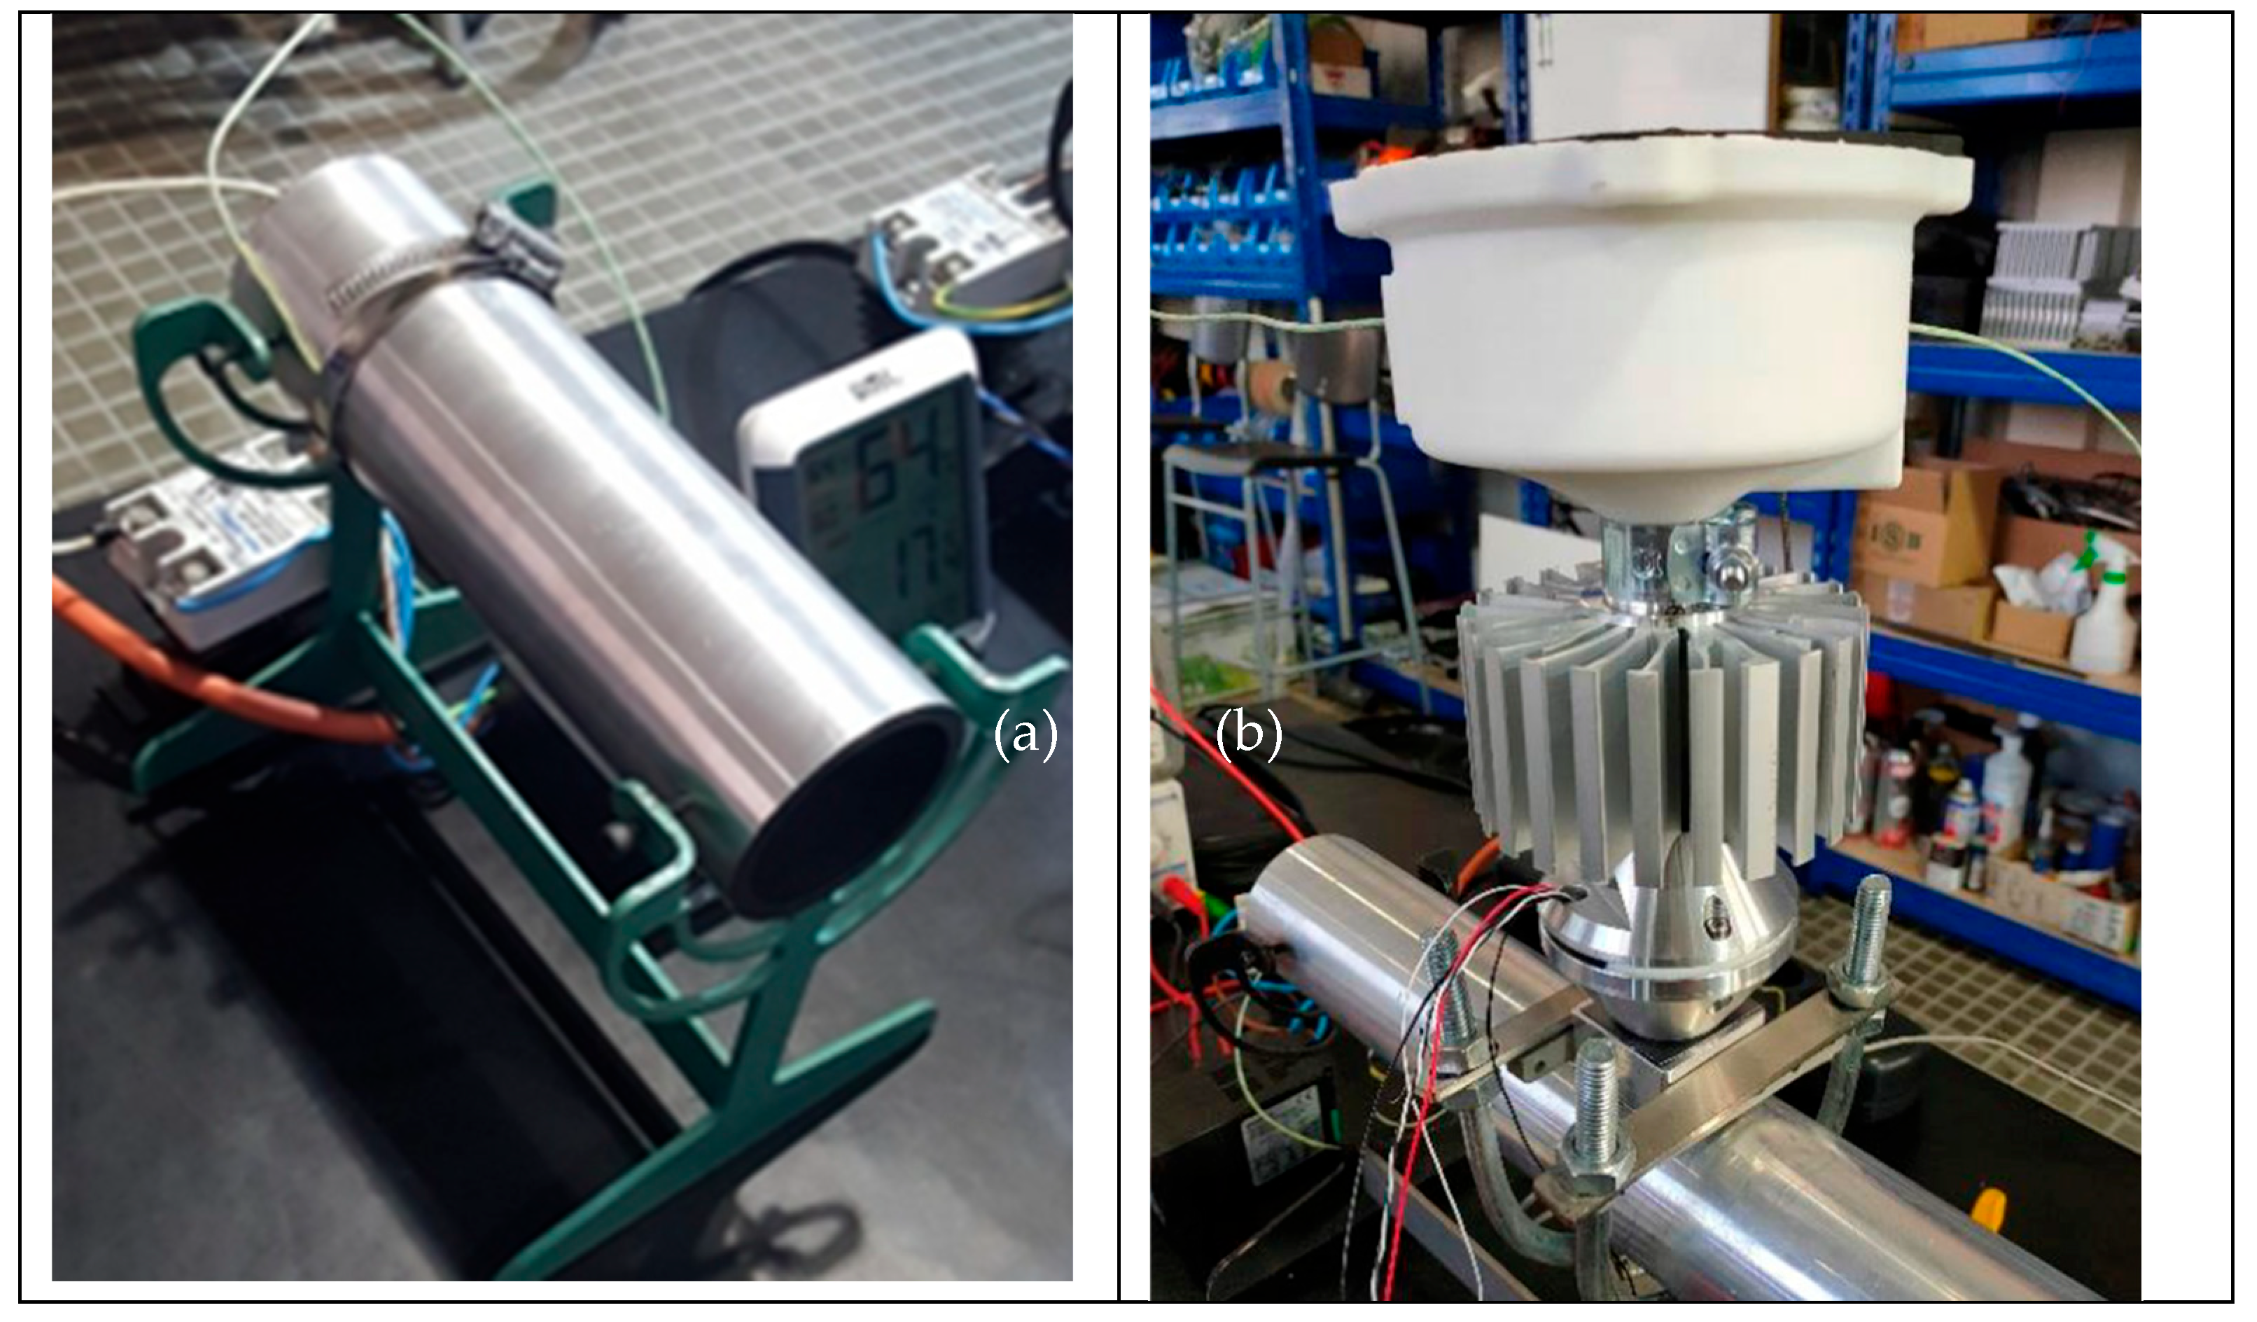
Figure 14.
Open voltage characteristics with a set of hot and cold surface temperatures.
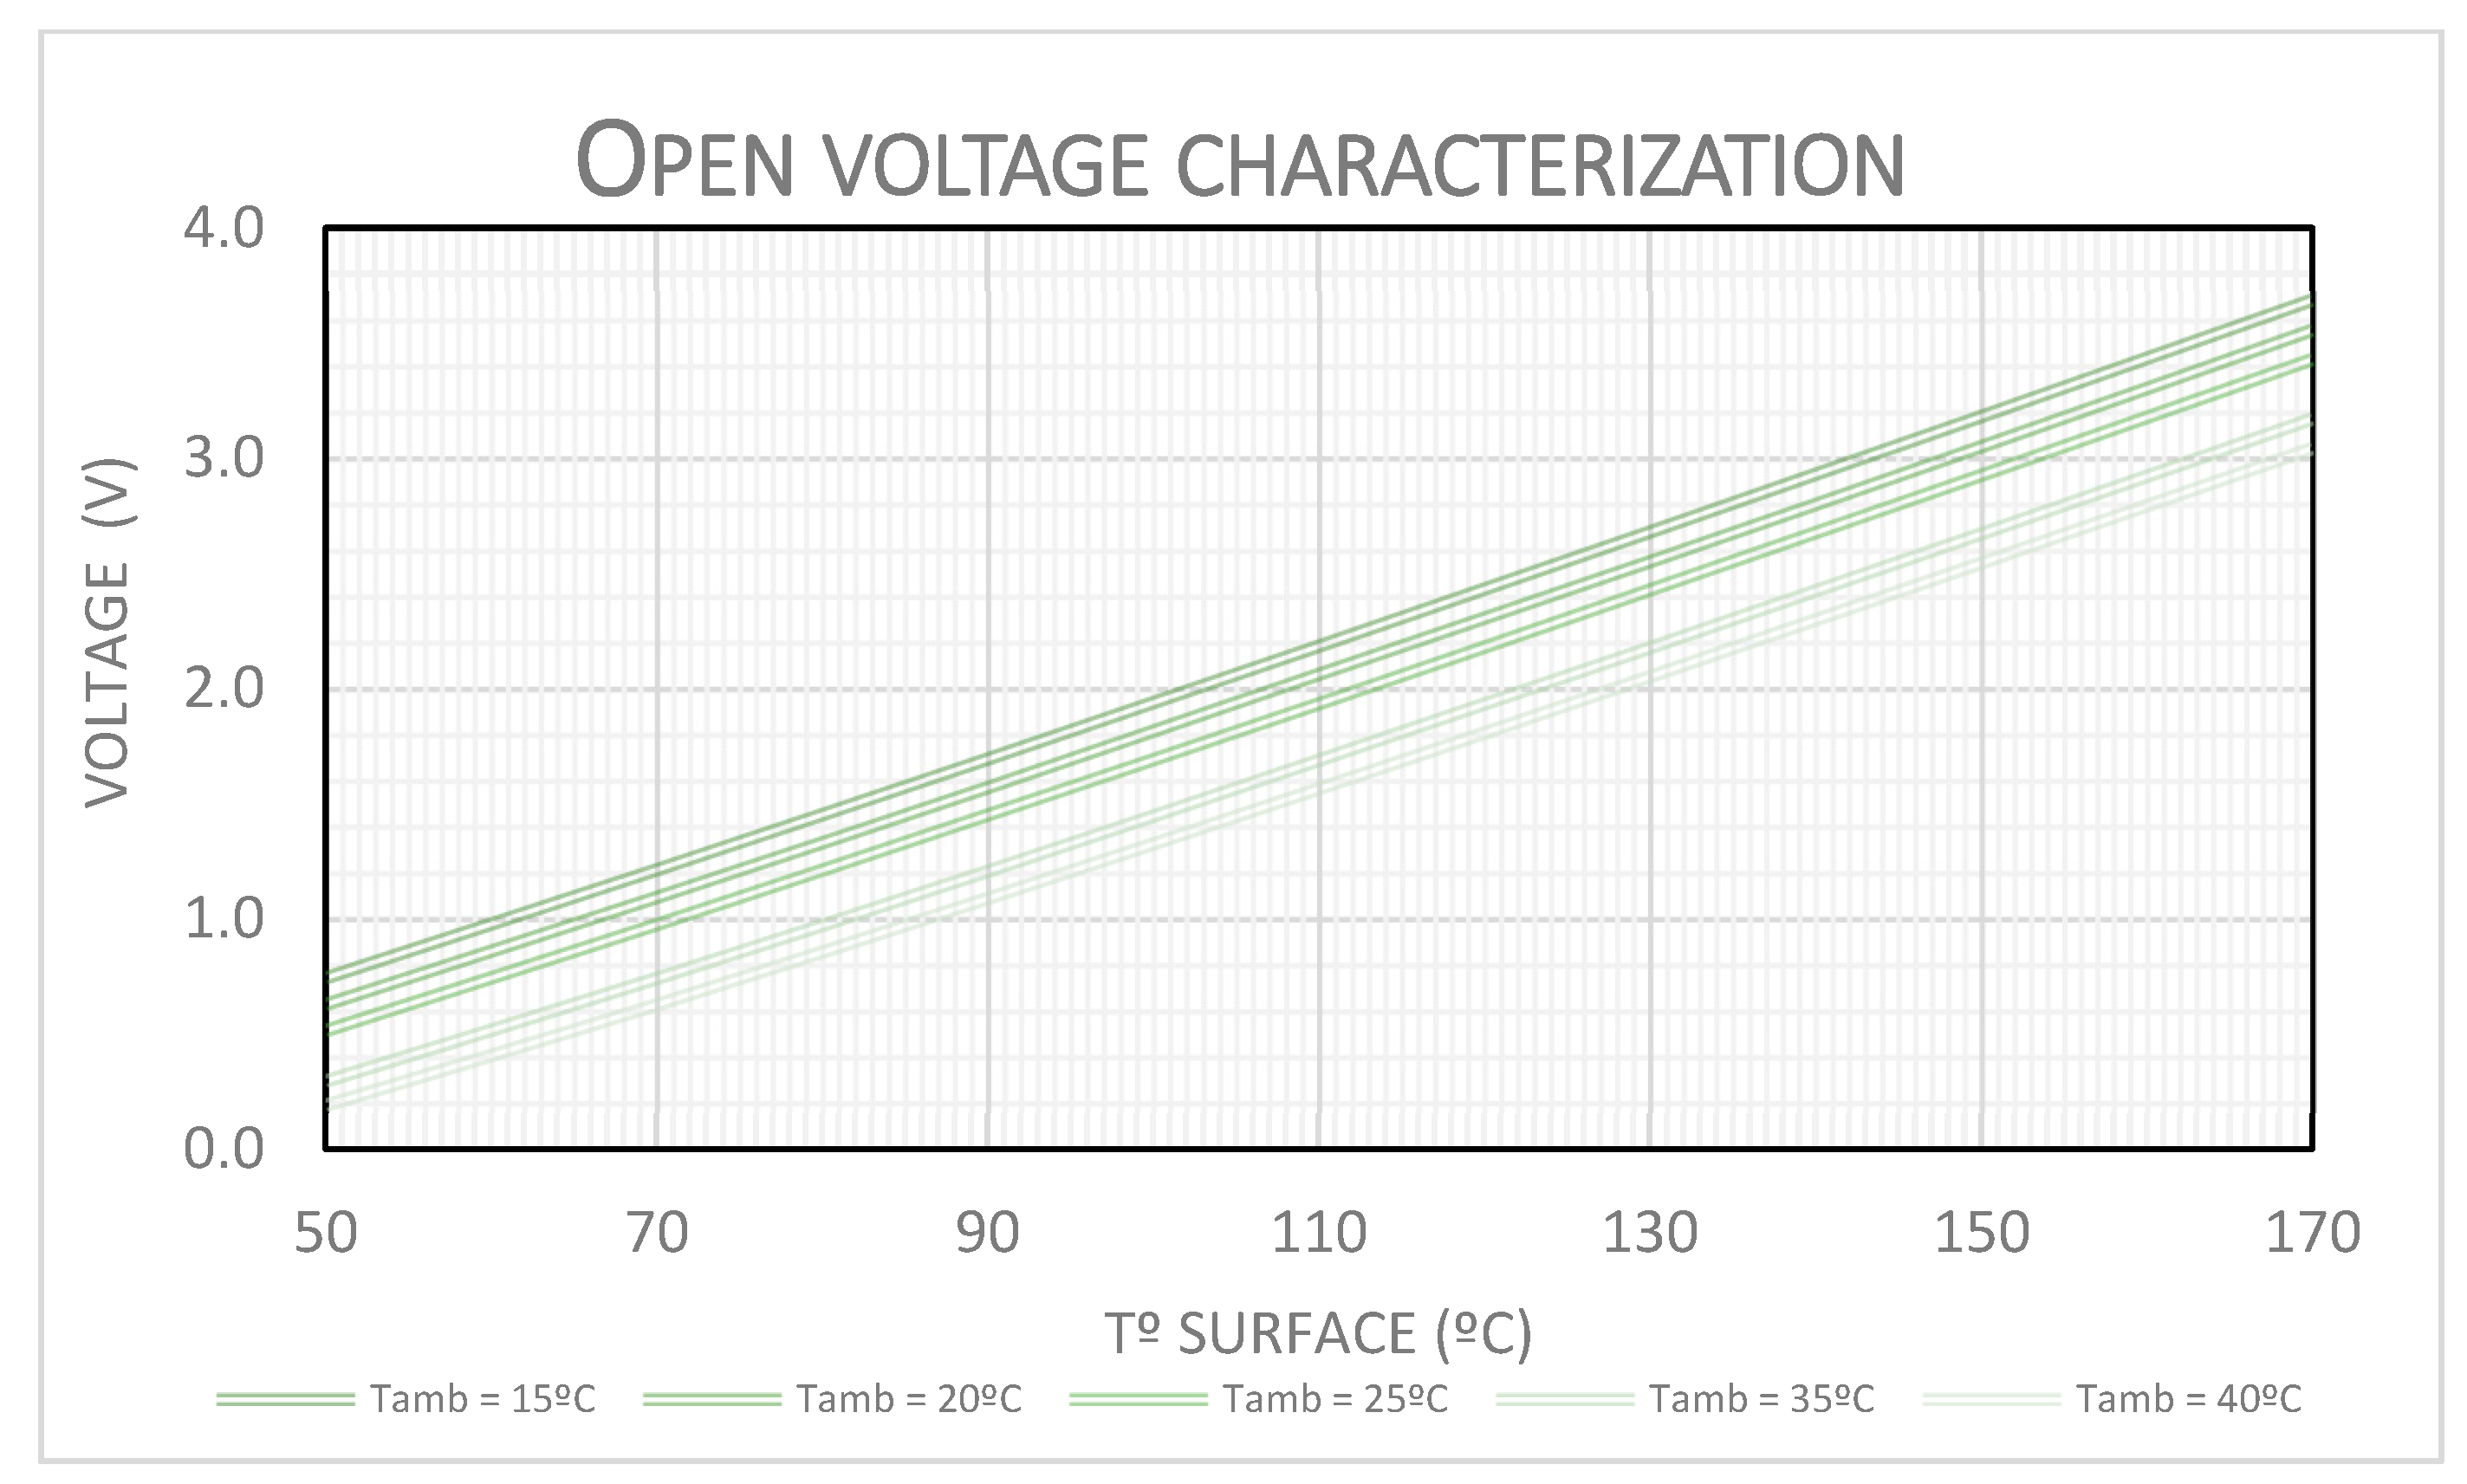
Figure 15.
Power generation characteristics with a set of hot and cold surface temperatures.
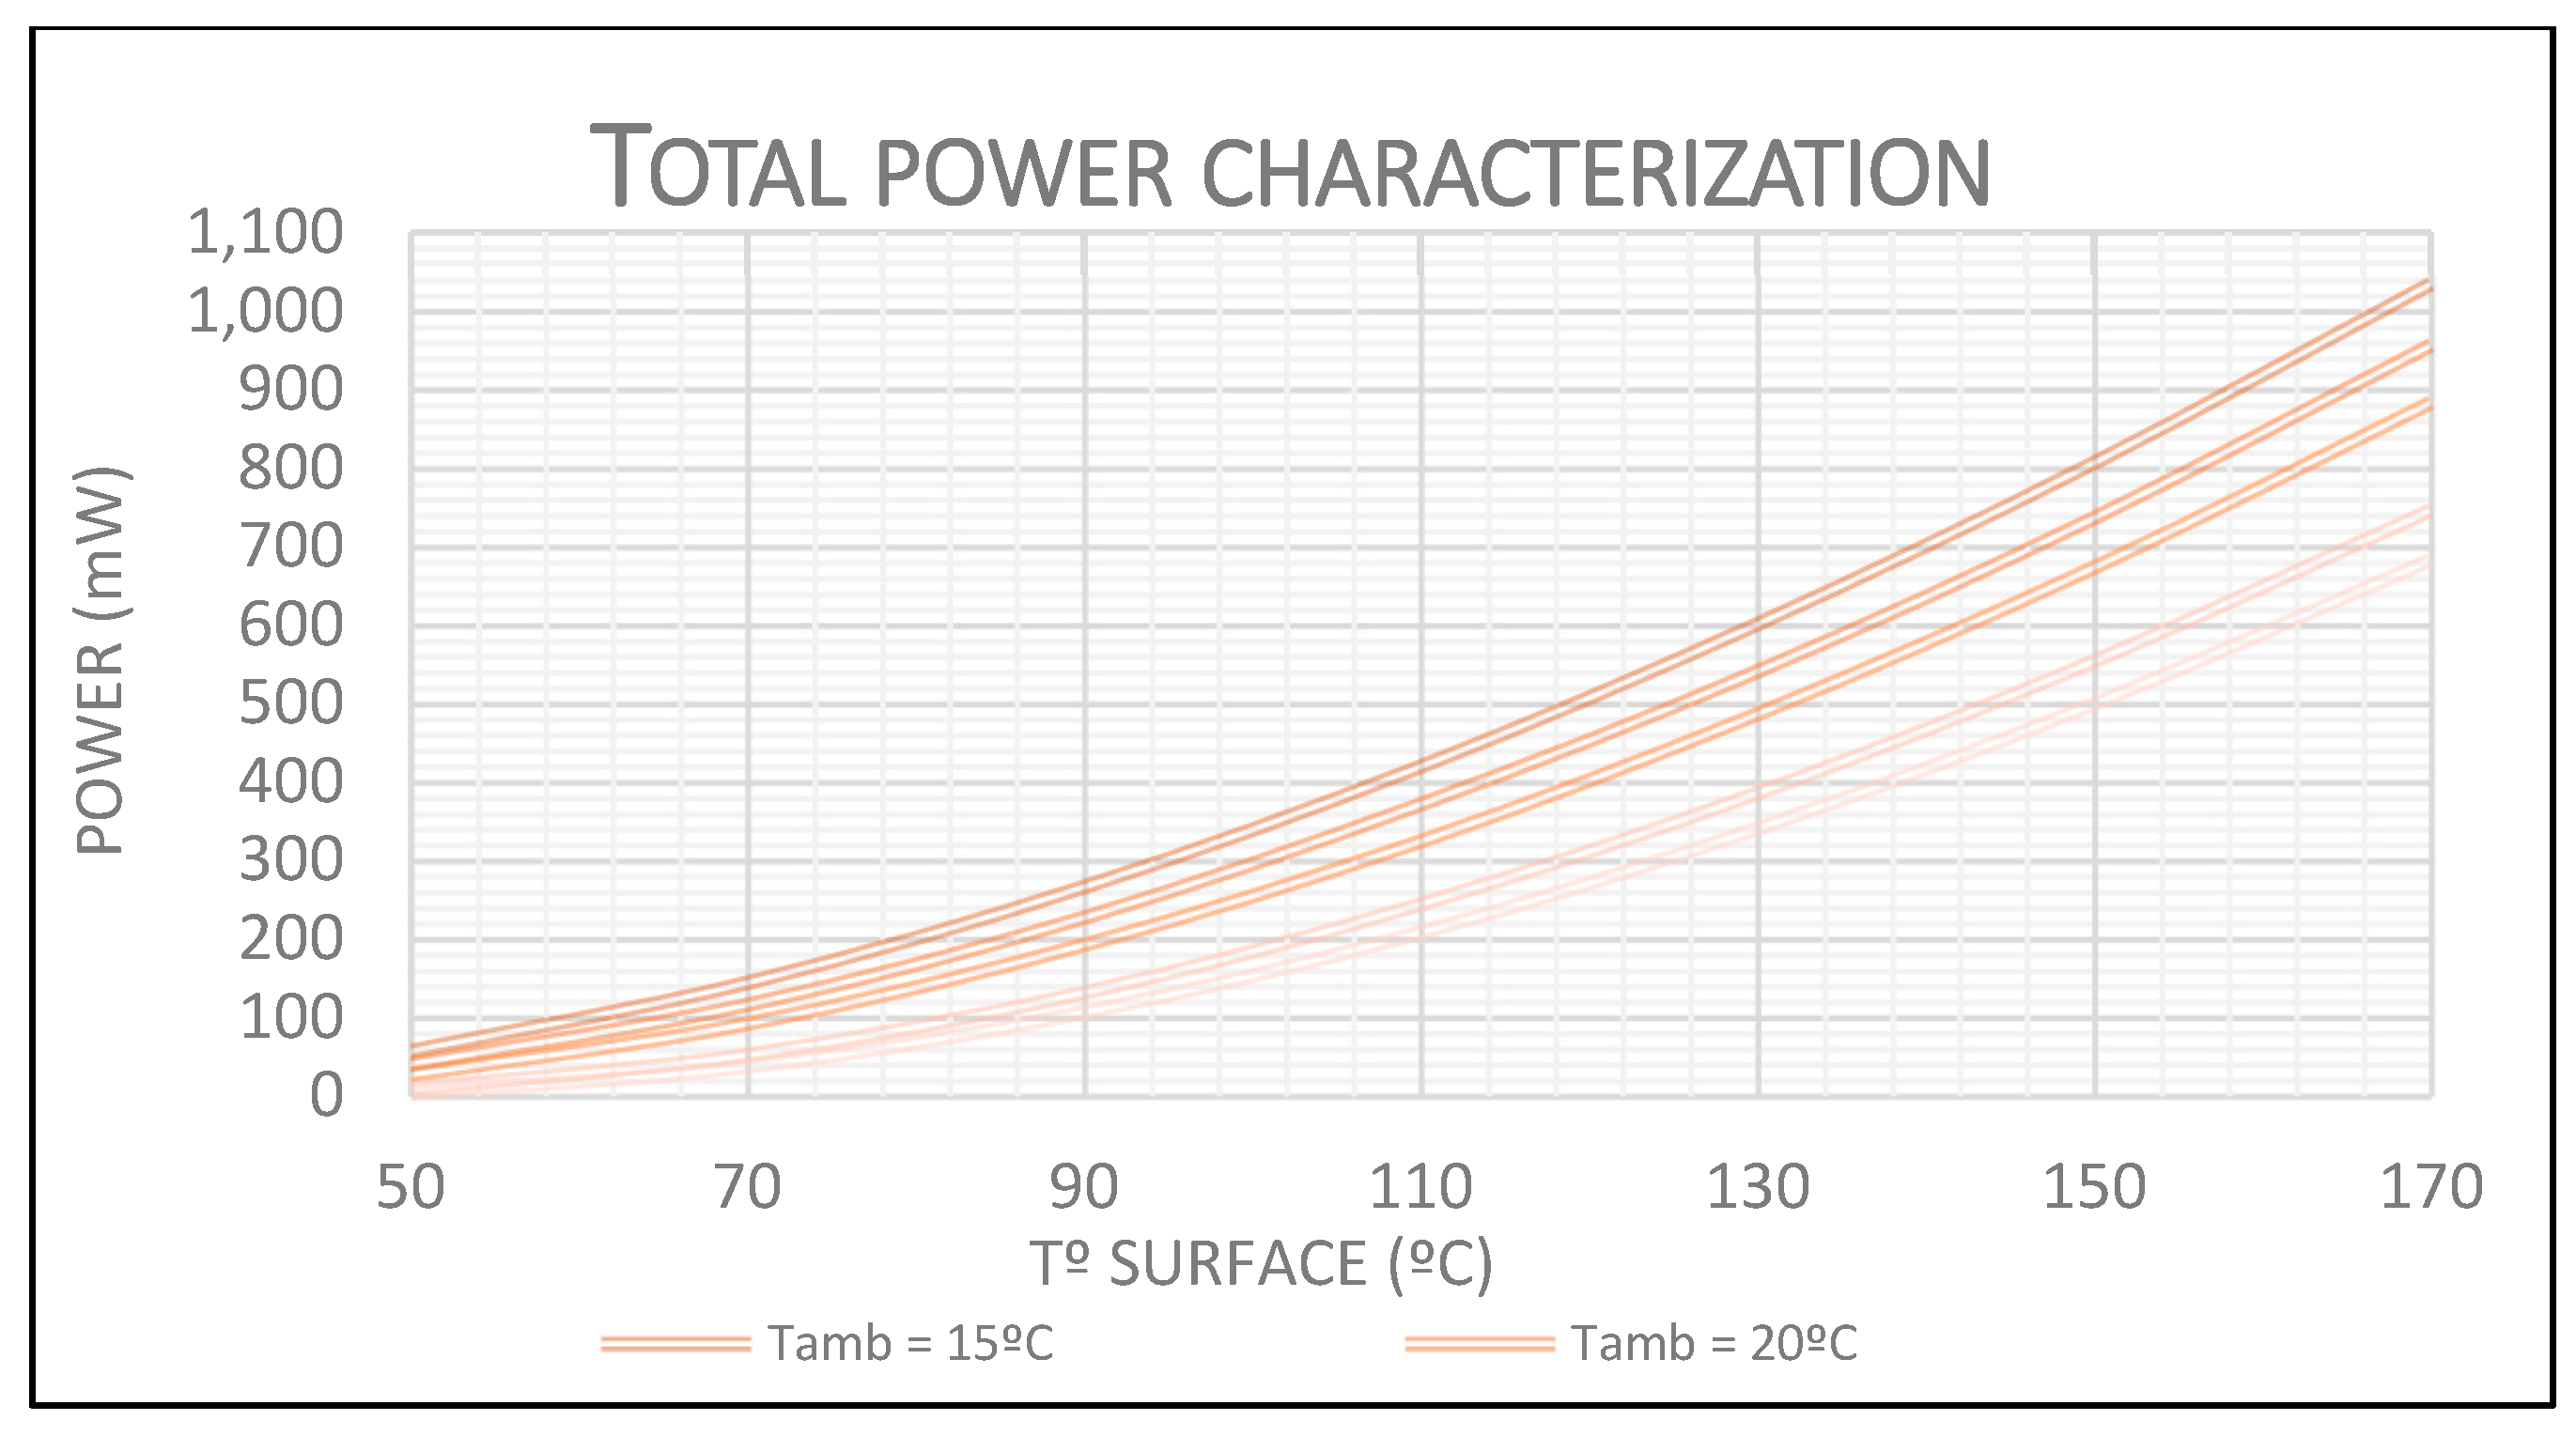
Figure 16.
(a) Test over boy steam trap. (b) the gateway. (c) test over thermodynamic.
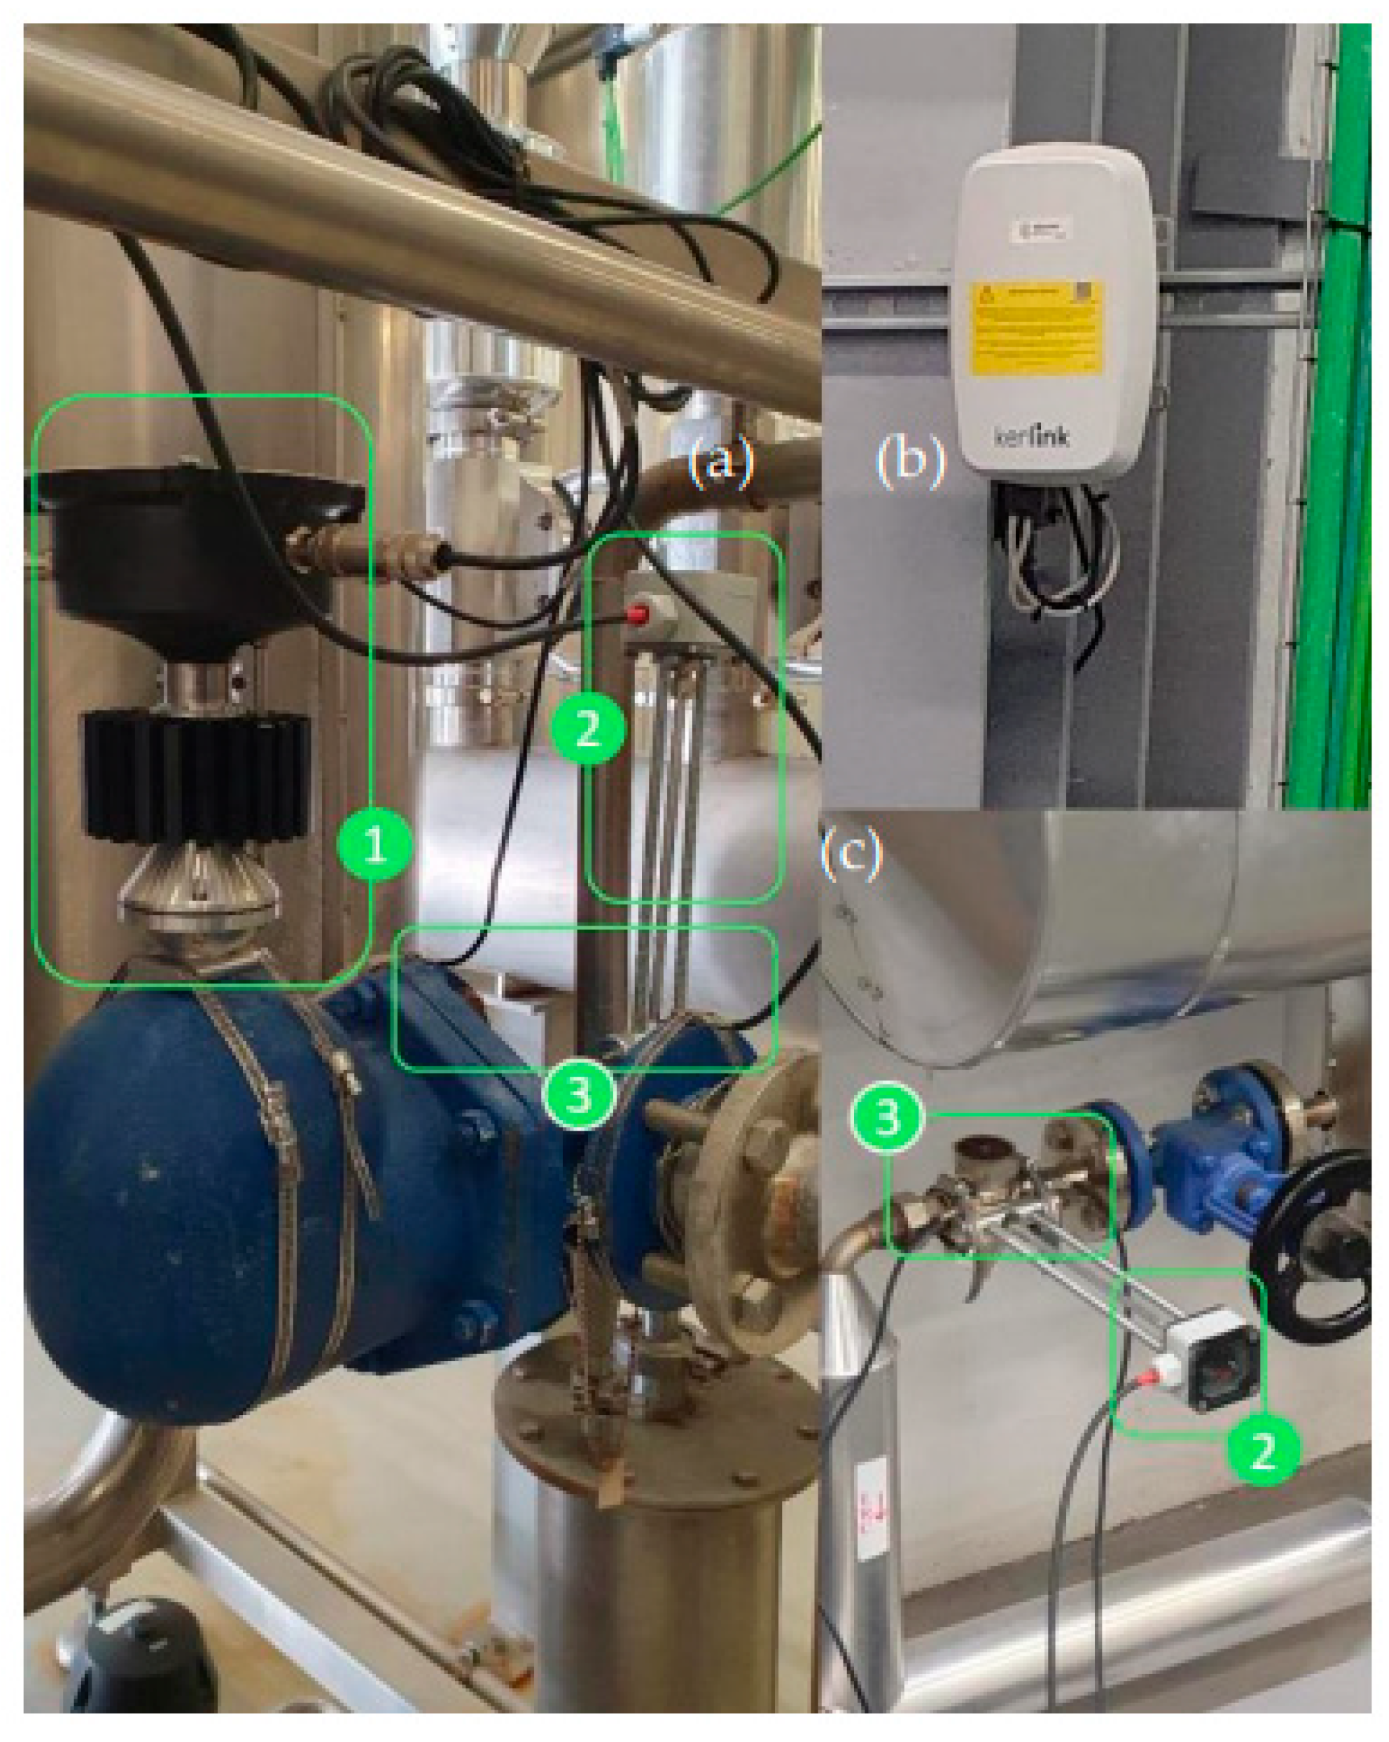
Figure 17.
Steam leaks detection using delta Temperatures between inlet and outlet.
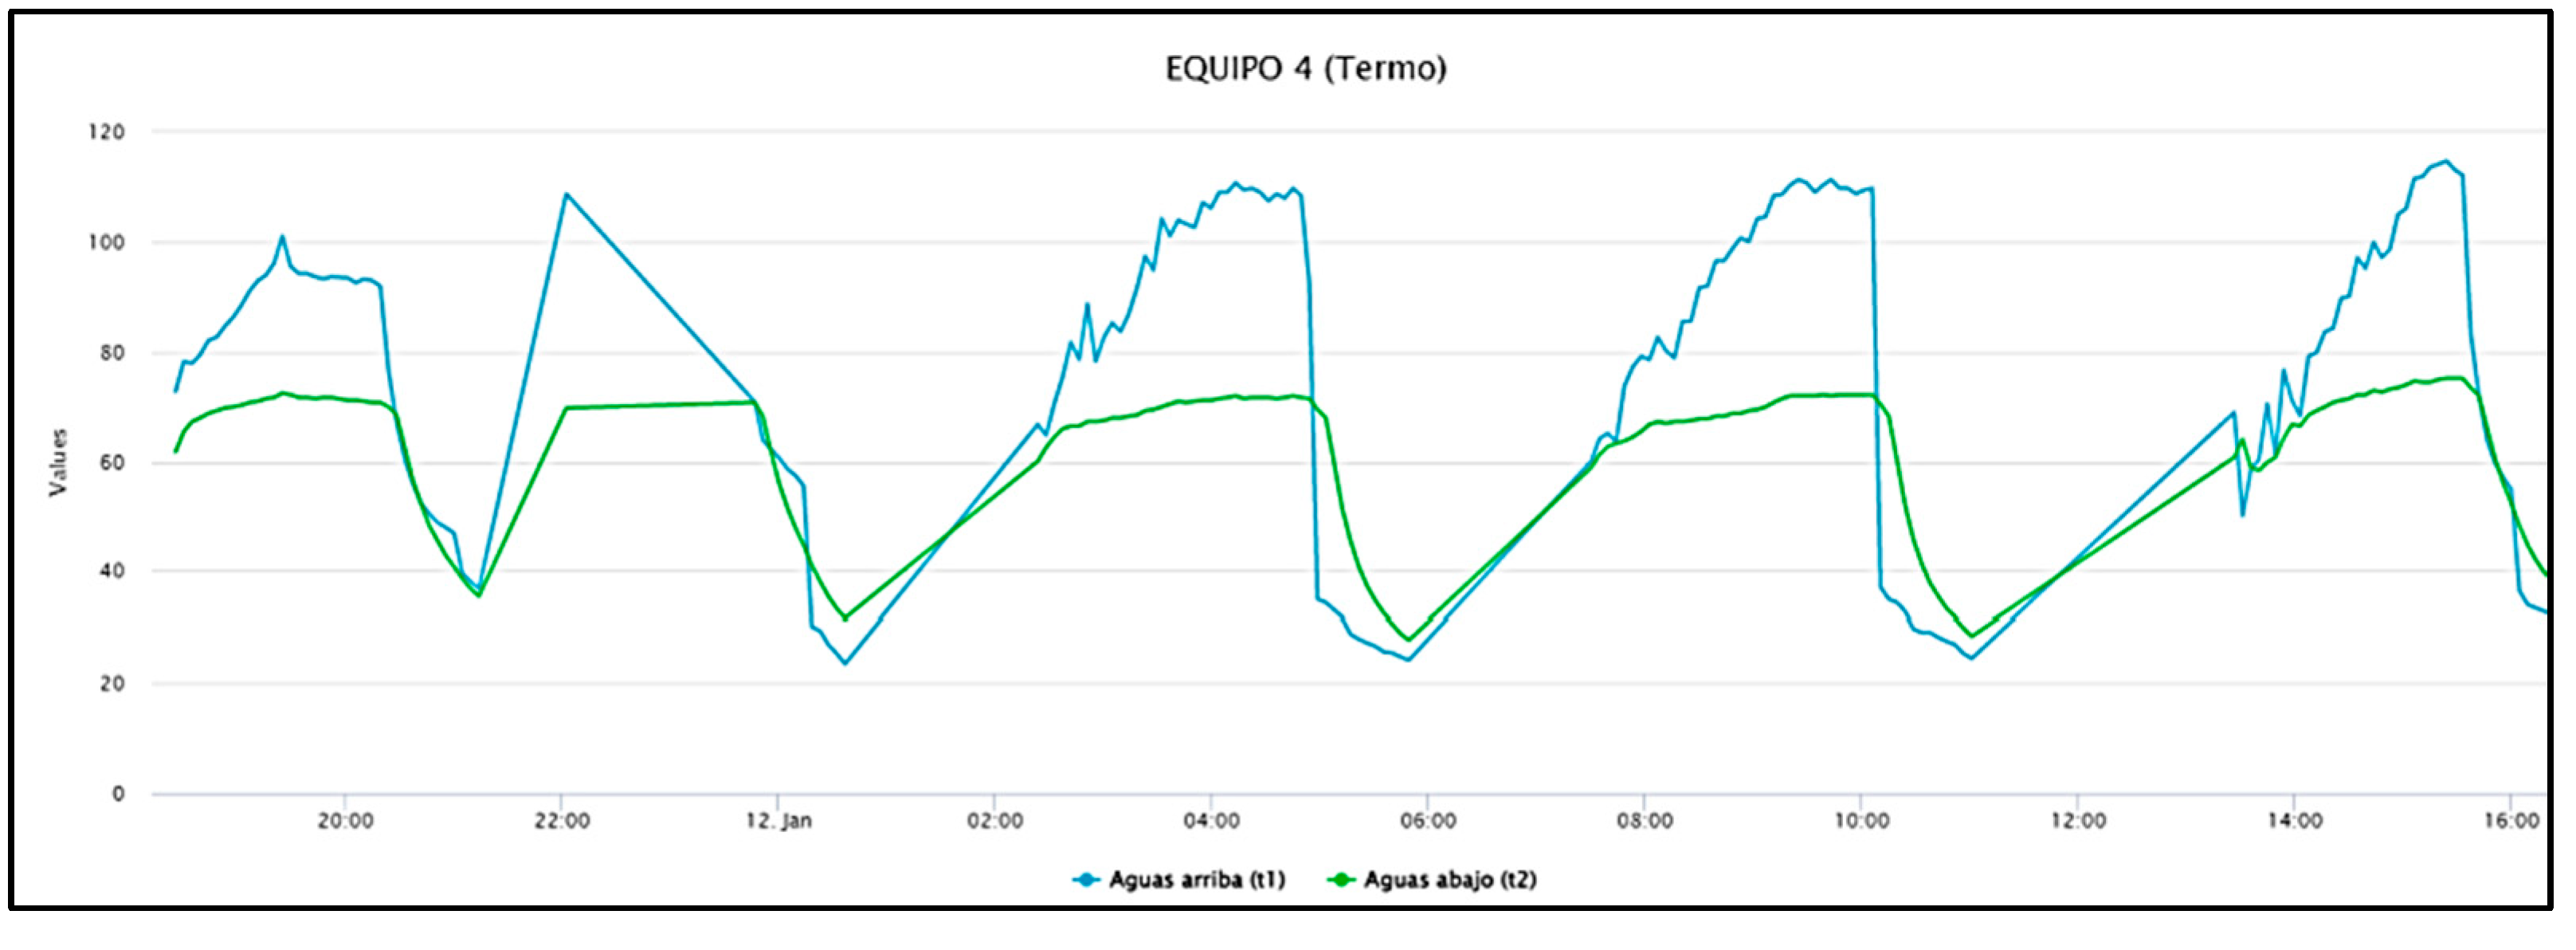
Figure 18.
Steam leaks frequencies between 30kHz to 40kHz.
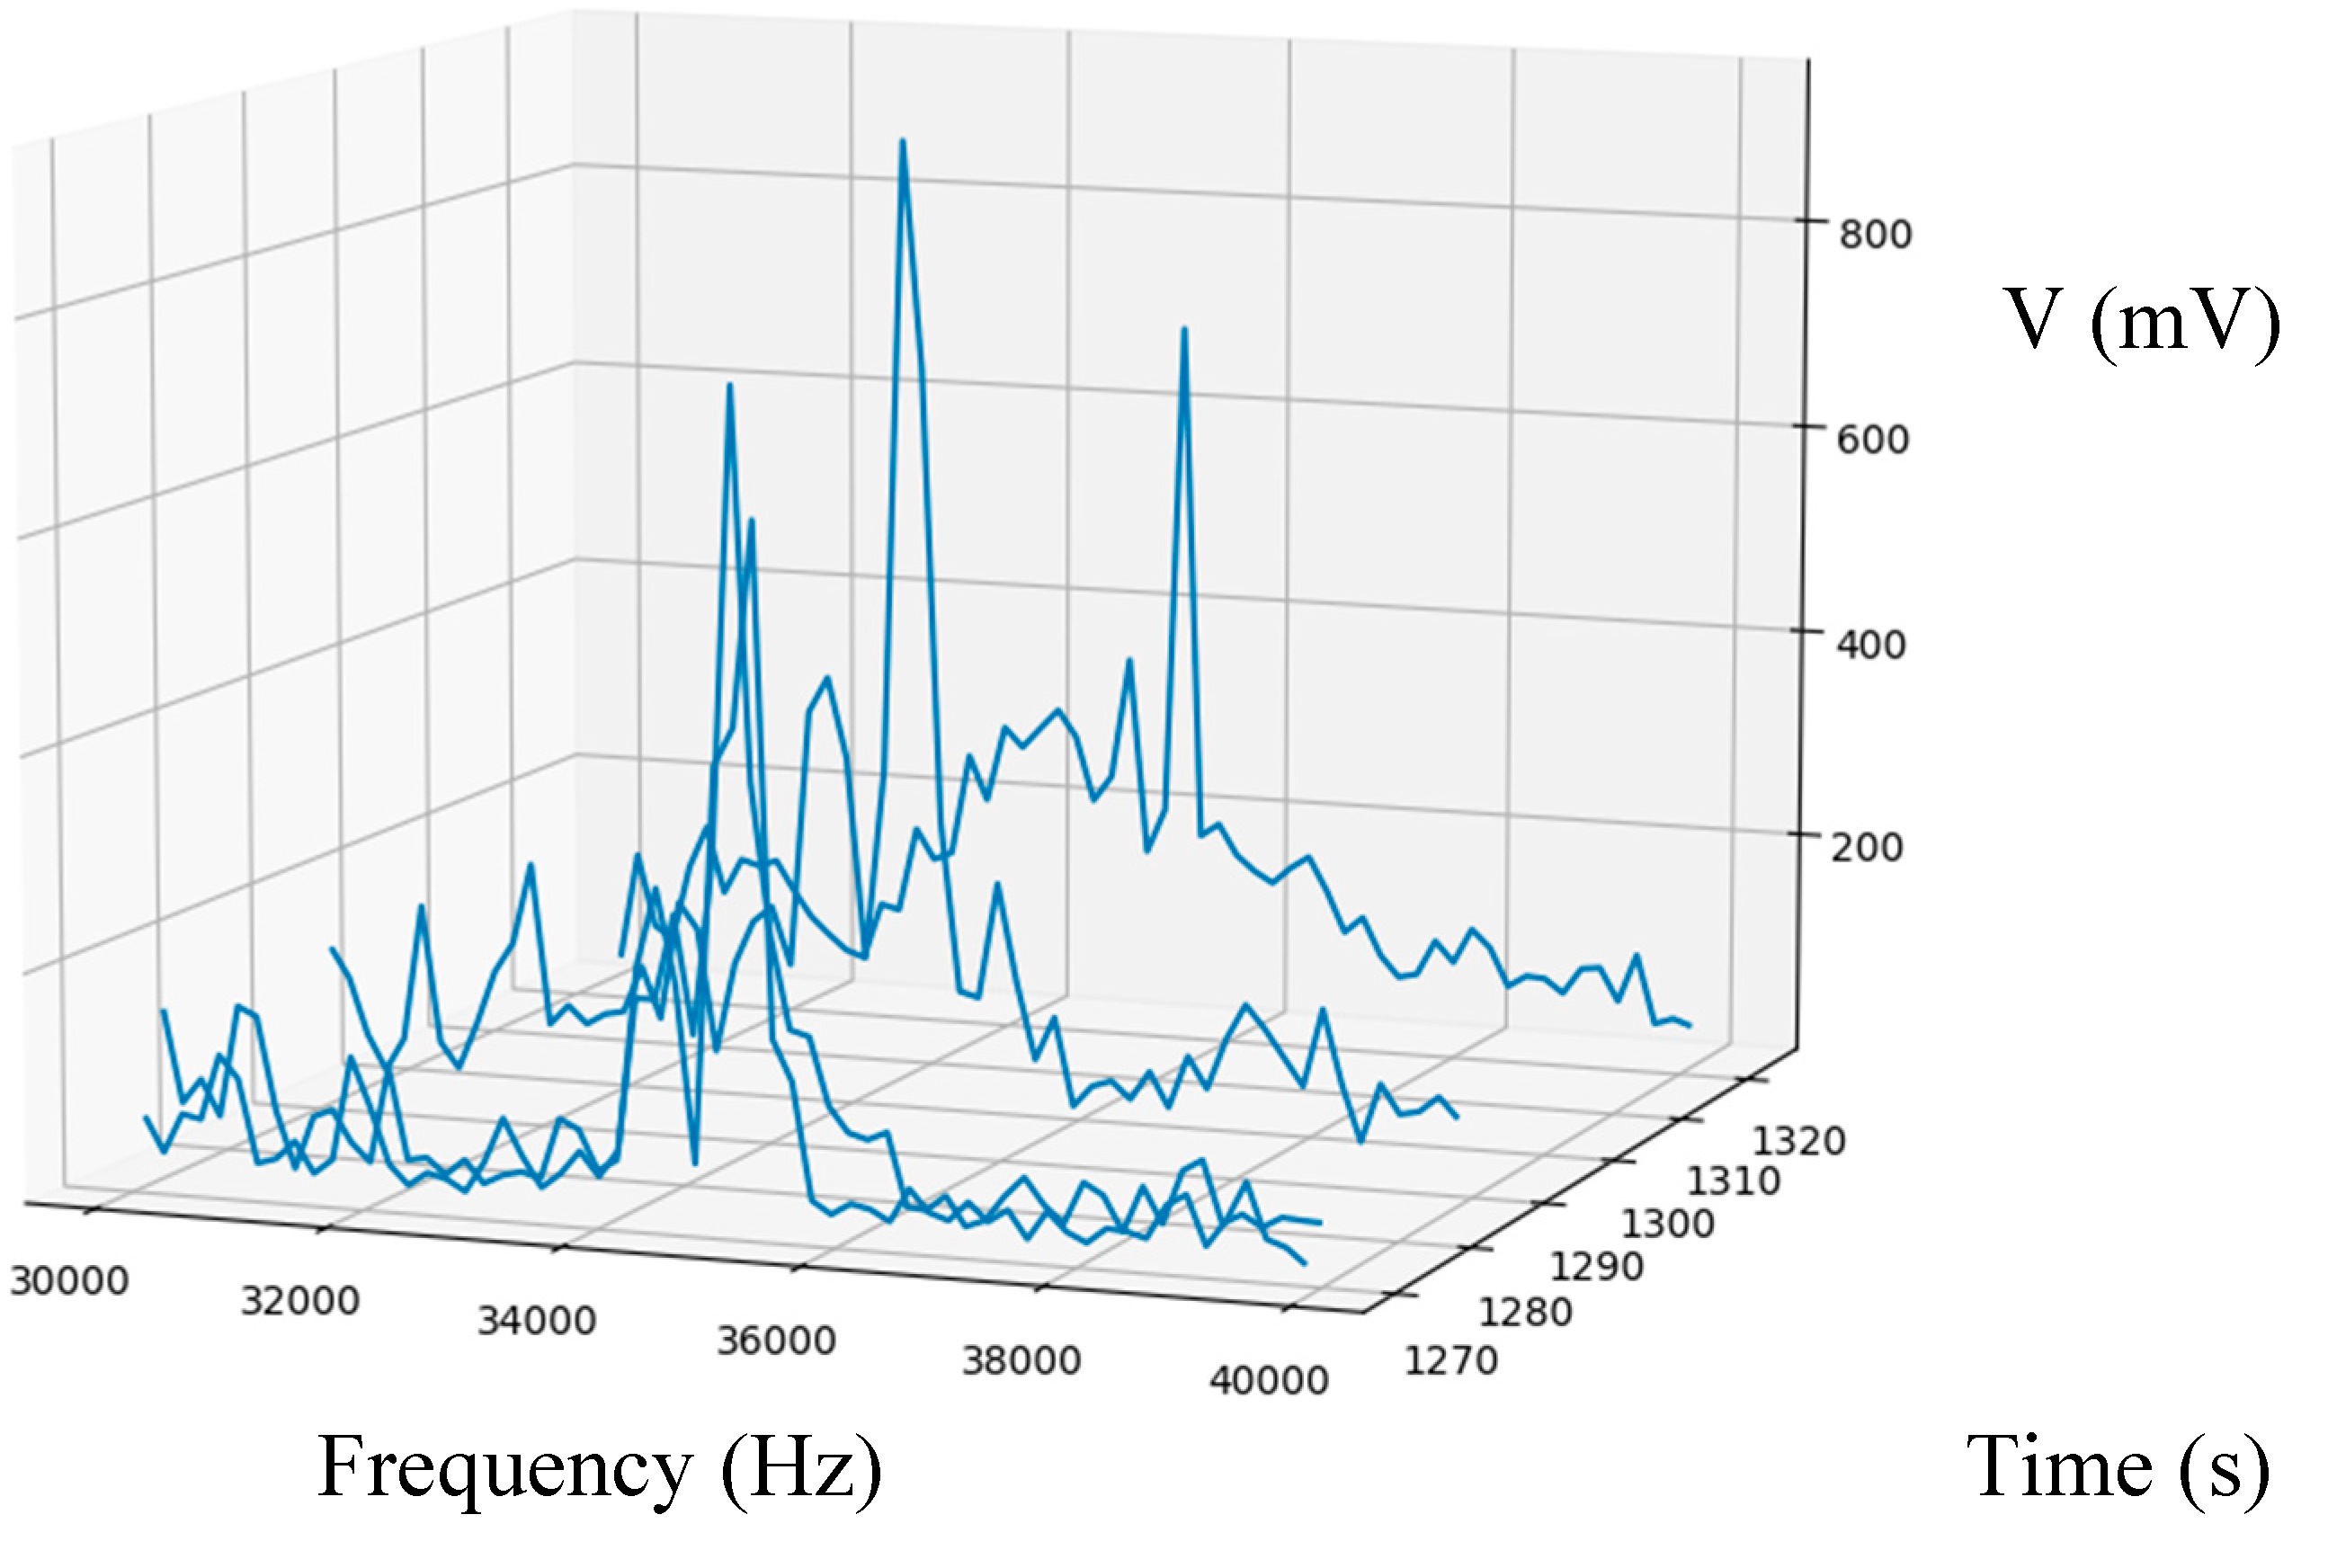
Figure 19.
Steam leaks Steam leaks frequencies between 10kHz to 40kHz.
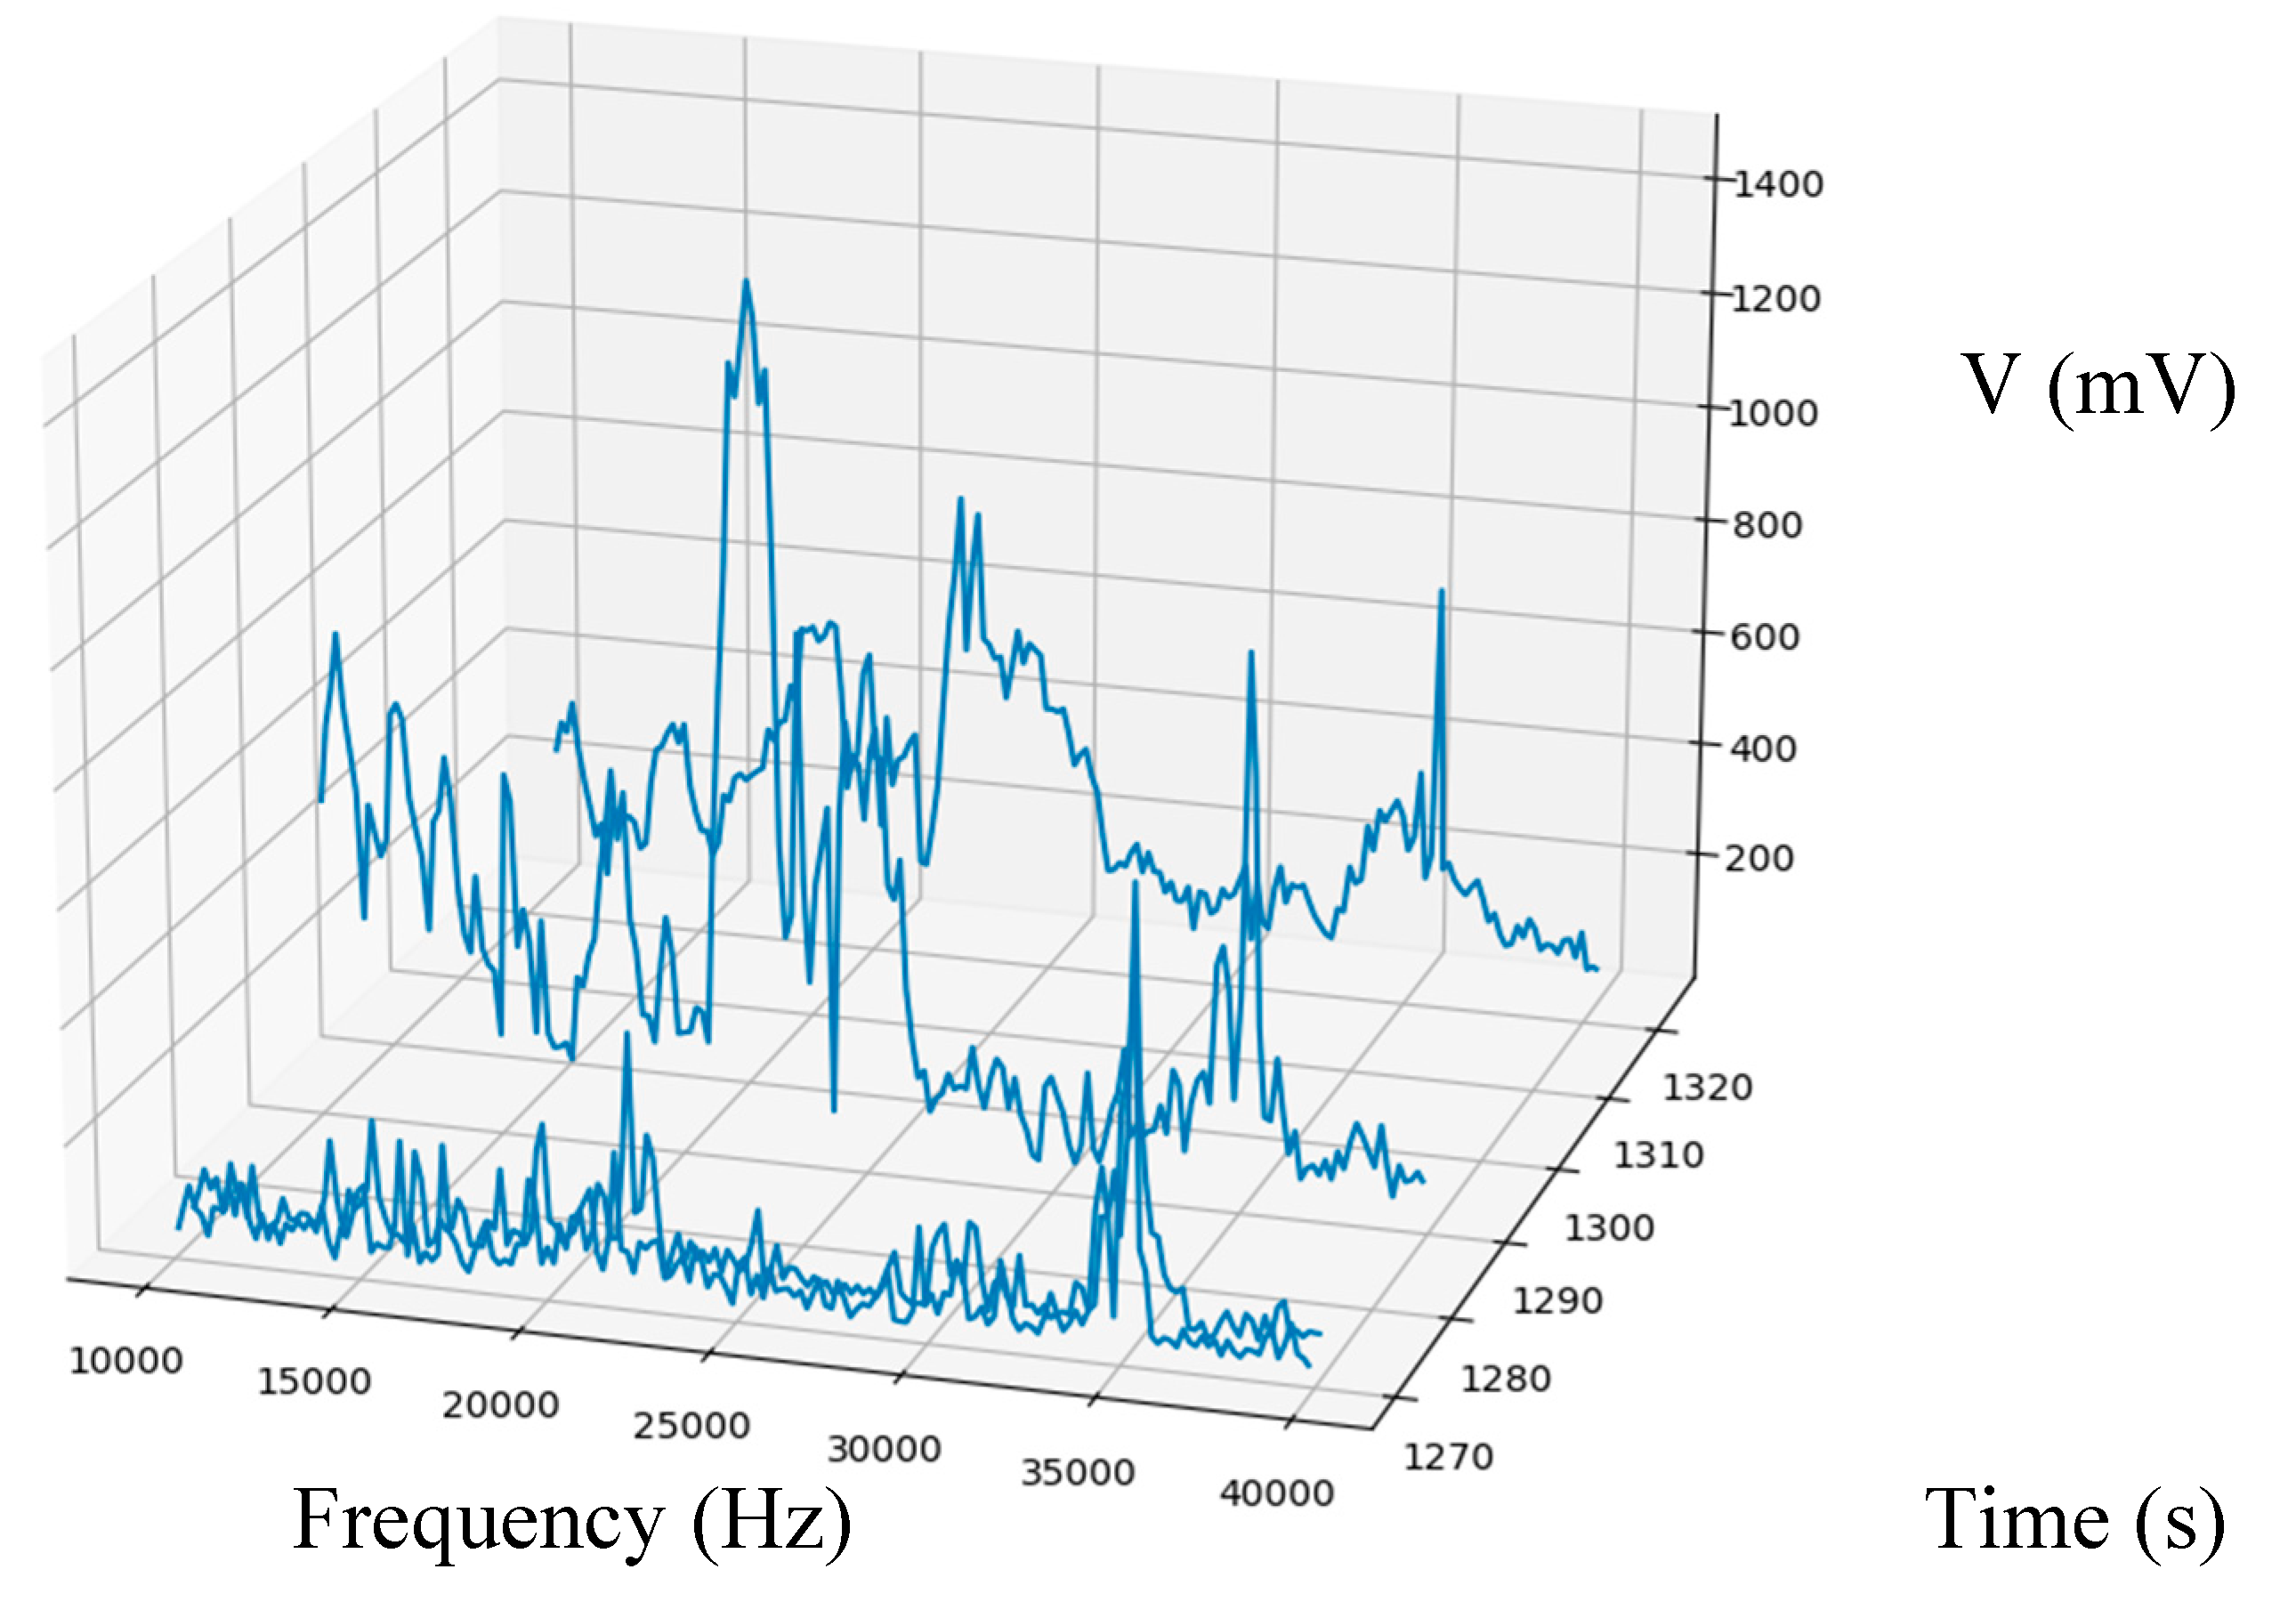

Table 1.
LPWAN comparison.
| LPWAN techno | Full Stack Deployment | Spectrum | Freq. | Max data rate | range (km) |
|---|---|---|---|---|---|
| SigFox | No | Unlic. | Regional sub-GHz bands 868 / 902 MHz |
100 bps | 3 ~ 17 |
| LoRaWAN | Yes | Unlic. | Regional sub- GHz bands 433 / 780 / 868 /915 MHz |
50 kbps | 2 ~ 14 |
| LTE-M. | No | Lic. | LTE In-bands only1.08 / 1.4 GHz | 1 Mbps | ~ 11 |
| NB-IoT | No | Lic. | LTE In-band, 900 MHz | 256kbps | ~ 22 |
Disclaimer/Publisher’s Note: The statements, opinions and data contained in all publications are solely those of the individual author(s) and contributor(s) and not of MDPI and/or the editor(s). MDPI and/or the editor(s) disclaim responsibility for any injury to people or property resulting from any ideas, methods, instructions or products referred to in the content. |
© 2024 by the authors. Licensee MDPI, Basel, Switzerland. This article is an open access article distributed under the terms and conditions of the Creative Commons Attribution (CC BY) license (http://creativecommons.org/licenses/by/4.0/).
Copyright: This open access article is published under a Creative Commons CC BY 4.0 license, which permit the free download, distribution, and reuse, provided that the author and preprint are cited in any reuse.


