
Submitted:
13 November 2024
Posted:
13 November 2024
You are already at the latest version
Abstract
Quantitative transcriptomics offers a new way to obtain a detailed picture of freshly isolated cells. By direct isolation, the cells are unaffected by in vitro culture and the isolation at cold temperatures maintains the cells relatively unaltered in phenotype by avoiding activation through receptor crosslinking or plastic adherence. Simultaneous analysis of several cell types provides the opportunity to obtain detailed pictures of transcriptomic differences between them. We here present such an analysis focusing on four human blood cell populations and compare those to isolated human skin mast cells. Pure CD19+ peripheral blood B cells, CD14+ monocytes, and CD4+ and CD8+ T cells were obtained by fluorescence activated cell sorting and KIT+ human connective tissue mast cells (MCs) were purified by MACS sorting from healthy skin. Detailed information concerning expression levels of the different granule proteases, proteases inhibitors, Fc-receptors, other receptors, transcription factors, cell signaling components, cytoskeletal proteins and many other protein families relevant to the functions of these cells were obtained and comprehensively discussed. The MC granule proteases were found exclusively in the MC samples, and the T cell granzymes in the T cells, of which several were present in both CD4+ and CD8+ T cells. High levels of CD4 were also observed in MCs and monocytes. We found a large variation between the different cell populations in the expression of Fc receptors was observed across cell populations as well as for lipid mediators, proteoglycan synthesis enzymes, cytokines, cytokine receptors and transcription factors. This detailed quantitative comparative analysis of more than 780 proteins of importance for the function of these populations can now serve as a good reference material for research into how these entities shape the role of these cells in immunity and tissue homeostasis.
Keywords:
mast cells
; B lymphocytes
; T lymphocytes
; monocytes
; transcriptome
; granule proteases
1. Introduction
The human body contains more than 200 different cell types with different functions and phenotypes. The function and phenotype of these cells are in turn determined by the genes they express. One way to obtain a detailed map of the phenotype of a cell is to study their transcriptome. This information gives a detailed description of genes that are active and also a good estimate of the levels of these proteins in the cells. Most previous studies have been presented in the form of heat maps where almost all quantitative information is being lost, or by single cell analysis where the result is great for tracing lineage commitment. However, due to low levels of RNA in the individual cells these measurements have low resolution concerning relative expression levels. In order to better reflect the actual expression levels, which are important for the evaluation of the biological significance of the expression of these genes, we here present a detailed description of the actual expression levels of a large panel of differentially expressed genes among five human immune cell populations. We focus on the transcriptionally highly active cell populations of the human blood, such as CD19+ B cells, CD14+ monocytes and both CD4+ and CD8+ T cells, and compared those to tissue resident human skin mast cells (MCs). Skin MCs are of the connective tissue type of MCs originating from an early wave of progenitor cells from the yolk sac [1,2]. Terminally differentiated immune blood cells such as neutrophils, eosinophils and basophils were not included in our analysis, since many of their specific genes have already been turned off and an analysis of their transcriptome does thereby not give an accurate picture of their phenotype.
The RNA from the five purified cell fractions were analyzed by the Ampliseq methodology to obtain quantitative information concerning the expression levels from essentially all of the approximately 21000 human genes. Two individual samples from each cell type originating from two different donors were included in the study. The data is presented as actual reads and not as heat maps to give an accurate picture of transcript levels and difference between genes in expression levels. More than 780 transcripts differentially expressed were identified among these immune cell populations, and grouped by molecules of similar characteristics, such as granule proteases, Fc-receptors, cytokines, cytokine receptors, transcription factors and signaling molecules, with the aim to highlight the differences in expression between the different cell types and the consequences it may have on their biology.
Our quantitative gene expression map may be used together with the human protein atlas (https://www.proteinatlas.org) as a tool for a deeper analysis of the complex phenotypes of these immune cells and how this affects their biological function during normal tissue homeostasis and under inflammatory conditions.
2. Results and Discussion
2.1. Purification of Human CD19+ B-Cells, CD14+Monocytes, CD4+ and CD8+ T Cells and Skin MCs
Human PBMCs from buffy coats were used to FACS-purify transcriptionally active CD19+ B cells, CD14+ monocytes, and CD4+ and CD8+ T-cells. Cell purity was then determined by post purity FACS check, and ranged from 87 to almost 95% (Figure 1).
Samples of human foreskin and breast collected after surgery were digested with dispase and collagenase to obtain single cell suspensions. MCs were purified by magnetic cell sorting using a non-activating anti c-kit antibody, which resulted in approximately 98% pure MCs. The total RNA from the isolated cells were used for Ampliseq transcriptome analysis.
Two samples for each of the purified cell populations were analyzed. For MCs, the expression of selected genes after 3 weeks of in vitro culture has been added, by adopting previously published data and data found in a Supplementary file S1 [6]. The entire 15 sample Excel file including all 20803 listed genes is available as a Supplementary file S1. This file includes the 4 samples of cultured human skin MCs analyzed in a previous comparative analysis of similarities and differences in the phenotype between freshly isolated and cultured human skin MCs [6].
To facilitate interpretation of the data, genes with reads between 1-9 are marked in light grey, genes with reads between 10 and 99 in light blue, and genes with reads >100 in red.
2.2. The Major Granule Proteases Are Mainly Expressed in MCs and T-Cells
The different granule proteases are of particular interest for several of these five studied cell populations as they are highly expressed and also restricted to a particular cell type. For example, several of the granule proteases are MC-specific and can account for as much as 35% of the total protein content of the MC [7]. All the classical MC granule proteases including cathepsin G (CTSG), the beta tryptase (TPSB2), the MC specific carboxypeptidase A3 (CPA3) and the MC chymase (CMA1) were almost exclusively expressed by the MCs, and all of them at very high levels. Only a very low level of one of them, the chymase CMA1, was detected in one of the two monocyte samples (Table 1). The number of reads of CTSG, was 9445 and 6194 in MCs, 7096 and 6177 were detected for the tryptase, TPSB2, 4403 and 3086 for CPA3 and 1713 and 1359 for chymase, CMA1 (Table 1). Two additional tryptases, the delta tryptase TPSD1 and the gamma tryptase TPSG1, and one additional carboxypeptidase, CPM, were also expressed exclusively in MCs, but at much lower levels, with 418 and 67 reads, 86 and 49 reads and 140 and 81 reads, respectively (Table 1). Two of the proteases expressed by MC have previously been detected also in basophils, a cell type not included in this analysis due to that they similar to neutrophils and eosinophils are terminally differentiated when they leave the bone marrow. Both tryptase (TPSB2) and carboxypeptidase A3 (CPA3) have been detected by immunohistochemistry in human basophils [8,9]. Mouse basophils express two other basophil specific proteases, mMCP-8 and mMCP-11 and also the CPA3 [10,11,12,13]. A number of different functions have been described for these very abundant MC granule proteases including generation of a blood pressure regulating peptide, angiotensin II, from angiotensin I, activation of matrix metalloproteases, selective cleavage of TH2-promoting cytokines, cleavage and inactivation of various venoms and also cleavage of anti-coagulant proteins from leach, ticks and mosquitos [9,14,15,16,17,18].
The results from the analysis of the T-cell and NK-cell expressed granzymes was also clarifying. All five of the human granzymes were expressed exclusively in T-cells (Table 1). Interestingly, three of the five human granzymes, granzyme A (GZMA), K (GZMK) and M (GZMM) were expressed in both CD4+ and CD8+ T-cells, whereas granzymes B (GZMB) and H (GZMH) were only detected in the CD8+ T-cells (Table 1). Granzyme A, K and M transcript levels were approximately 50-80% lower in the CD4+ T-cells compared to the CD8+ cells (Table 1). A similar situation was seen for two additional granule proteins of T-cells, perforin (PRF1) and granulysin (GNLY). Both of these were only expressed in T cells and the levels in CD4+ T cells are here even lower compared to the CD8+ cells, differing by a factor of 4-15 in expression levels (Table 1). The expression levels of the granzymes in T-cells were much lower than the granule proteases in MCs. The expression levels range between 70 and 280 reads in the CD8+ T-cells compared to 1359 to 9445 reads for the MC proteases in MCs, which was a 10-30 fold difference in expression levels (Table 1). It is important to notice that we looked at T cells in the circulation, which most likely almost exclusively were resting T-cells and only very few activated cells. The levels of these granzymes and of two other granule stored proteins, perforin and granulysin, does probably increase after activation of these cells, similar to what we have seen for human monocytes after activation with LPS [19]. During our analysis of the human monocytes we could see that some of the inflammatory cytokines and chemokines increased from almost zero to becoming the dominating transcripts after only a few hours in contact with the LPS [19]. For example, IL-6 increased from 0.1 to 7500 reads, which corresponds to an increase of 75 000 times after 4 hours of incubation in the presence of LPS [19]. However, to what level these granzymes increase upon activation of T cells needs to be analyzed in more detailed by obtaining quantitative data for both transcriptional activation and protein accumulation in activated cells. Also of interest are the levels these granzymes are expressed in different NK-cell populations, which are not included in this study. There are numerous conflicting reports in the literature which need to be sorted out before we have the correct view of their expression of the granzymes in various NK cell populations (work in progress).
Concerning the function of these granzymes, granzyme B is the granzyme where the function is most clearly defined. It has been shown to be a key component together with the pore forming perforin in the induction of apoptosis in virus infected cells. Granzyme A was also considered to be an apoptosis inducing granzyme several years ago. However, more recent data has questioned this and also its potential cytokine inducing effect why we still are left without a good explanation as to the biological function of both granzymes A and K [20].
A number of labs have reported the expression of granzymes also in MCs, primarily granzyme B. However, we cannot detect any expression in these human skin MCs. However, we did detect granzyme B in one of the cultured skin MCs, with 11 reads, that we analyzed in a previous study indicating that granzyme expression is not a naturally occurring in tissue MCs, at least at a level detectable in this analysis [6]. This indicates that granzyme expression is not naturally occurring in tissue MCs, at least not at a level detectable in our present analysis. Low levels of granzyme B has also been detected in freshly isolated peritoneal MCs from mouse, although at more than 200-fold lower level than the classical MC granule proteases, indicating that granzymes play a rather minor role in MC biology [21].
No expression of any of the neutrophil granule proteases except cathepsin G, which is highly expressed in MCs, was seen in any of the five studied cell populations (Table 1). Proteinase 3 (PRTN3), N-elastase (ELANE) and neutrophil serine protease 4, NSP-4 (PRSS57) were all negative in these five cell populations (Table 1).
Low levels, in the range of 13 to 40 reads was seen in four of these cell fractions, for cathepsin C (CTSC) and only very low level, with 5 and 6 reads, in the fifth, the B-cells. Cathepsin C is the protease that removes the N-terminal activation peptide of the granule proteases and thereby being the activating protease indicating that low levels are sufficient for proper processing of these very abundant granule proteases in both T cells and MCs before granule storage of these proteases in their active form (Table 1).
2.3. Transcript Levels for the Lysosomal Proteases, the Matrix Proteases and a Few Other Proteases
When we analyzed the lysosomal proteases we observed that many of them were expressed by the majority of these cells. This was expected since all cells need lysosomes for degrading damaged proteins and other macromolecules. However, there were marked differences in their expression levels. Cathepsin D (CTSD) was very highly expressed in both monocytes and MCs, with 1792 and 1517 reads in monocytes and 2356 and 1723 reads in MCs and much lower, in the range of 55 to 511 reads, in the other cell populations (Table 2). Cathepsin B and L1, CTSB and CTSL1, were higher in MCs than in the other cells, within the range of 45 to 315 reads, whereas cathepsins S, CTSS, was much higher in monocytes, with 538 and 1011 reads (Table 2). Cathepsin W, CTSW, was basically only expressed by T cells as previously shown and also much higher in CD8+ than in CD4+ T cells, with 627 and 1151 reads in CD8+ cells and 104 and 105 reads in CD4+ cells (Table 2) [22]. This protease seems to be associated with the cell membrane or the endoplasmic reticulum, but the actual target and function has not yet been identified [22]. The serine carboxypeptidase 1 (SCPEP1) was primarily found in monocytes, with 206 and 303 reads, but low levels were also found in other cells (Table 2). This is an extracellular protease predicted to be involved in negative regulation of blood pressure [23]. A number of proteases belonging to the family of disintegrins and metalloprotease family (ADAM) was also identified in this screening (Table 2). As can be seen from the table ADAM15 was primarily expressed by monocytes, with 169 and 207 reads, ADAM19 and 28 higher in B cells, with between 37 and 195 reads, and ADAMTS7 primarily in MCs with 58 and 80 reads (Table 2).
PSMB10 is a protease component of the proteasome and involved in MHC class I presentation [24]. This gene was highly active in monocytes, with 796 and 1314 reads, less so in B cells, T cells and MCs but present in all five cell types (Table 2). NAPSB is a Napsin B aspartic protease pseudogene, is here expressed only in B cells and monocytes and at relatively high levels, between 103 and 459 reads [25]. PRSS12 also named neurotrypsin, a protease expressed by motor neurons was found to be expressed at low levels by the MCs only, with 38 and 59 reads (Table 2). MMP7 one of the matrix metalloproteases was expressed primarily in B cells and monocytes, but at relatively low levels, with between 21 and 79 reads (Table 2).
The urokinase plasmin activator (PLAU) was only expressed by MCs, with 38 and 102 reads, and its receptor (PLAUR) was highly expressed by both monocytes and MCs with between 415 and 1371 reads (Table 2). Dipeptidyl peptidase-4 (DPP4) is a cell surface protease expressed by most cell types and thought to be involved in inflammation [26]. This protease was primarily found in CD4+ and CD8+ T cells, with between 71 and 129 reads, and at lower levels in MCs but not in monocytes and B cells (Table 2).
Caspase 3 (CASP3) one of the key components in apoptosis induction was expressed in all cells but at very low levels and markedly higher in the MCs, with 74 and 88 reads (Table 2). The levels in the cultured MCs were much lower similar to the other cell types (with 3-10 reads) ([6] and Supplementary file S1). The CAPN10, gene encodes a member of a well conserved family of calcium dependent cysteine proteases, the calpain-10. It was here expressed at low level in all five cell populations with a range of 5 to 47 reads. The gene BACE2, encoding the beta-secretase 2, also known as memapsin-1, an aspartyl protease, was here expressed in MCs only, with 49 and 103 reads and at very low levels in B cells with 10 and 12 reads [27].
2.4. Transcript Levels for a Panel of Protease Inhibitors
There was a relatively good correlation between the expression profile of stored protease and the expression levels of their inhibitors. For example, cystatin 3 (CST3), which is a potent inhibitor of lysosomal proteases was highly expressed by monocytes, with 4677 and 6287 reads, and also by MCs, and at very low levels in B and T cells (Table 3). Cystatin 7 (CST7) in contrast was only expressed in T cells and MCs and at much lower levels, with reads in the range of 23 to 290 (Table 3).
Tissue metalloprotease inhibitor 1 (TIMP1) was broadly expressed and with reads in the range of 105 to 407 except for B cells (Table 3). TIMP2 was broadly expressed at low levels, and high primarily in monocytes with 491 and 488 reads, and TIMP3 only in MCs but there at a very high level with 1270 and 995 reads (Table 3).
Serpin B1, SERPINB1, was broadly expressed at low levels but higher in MCs, with 156 and 333 reads. Serpins H1 and E1 and LXN were expressed only in MCs, with between 27 and 352 reads (Table 3). The inter-alpha-trypsin inhibitor heavy chain H4, ITIH4, was detected only at low levels primarily in monocytes, with 48 and 78 reads, and the Kunitz type protease inhibitor 1, SPINT1, was also detected primarily in monocytes, with 75 and 100 reads, (Table 3). Interestingly, four of these inhibitors were here almost exclusively expressed by MCs, including TIMP3, SERPINH1, SERPINE1 and LXN, with the most extreme being TIMP3 (Table 3). MCs store massive amounts of active proteases both granule and lysosomal proteases and may therefore also have high levels of protease inhibitors to protect from potential granule leakage of these proteases into the cytoplasm.
2.5. Transcript Levels for Eosinophil, Neutrophil and Macrophage Related Proteins
To analyze how specific gene expression was for “lineage specific” protein marker genes are, we analyzed the major granule proteins of neutrophils and eosinophils. None of the five cell types expressed the eosinophil cationic protein (ECP), (named RNASE3), eosinophil peroxidase (EPX) nor the Charcot Leyden crystal protein (CLC) (Table 4). In contrast, a protein closely related to ECP, the EDN (named RNASE2) was expressed at very low levels in the monocytes, with 14 and 19 reads (Table 4). Another related RNase (RNASE6) showed low level of expression in B cells and monocytes (Table 4).
Low levels of one of the neutrophil proteins was found in the monocytes, the myeloperoxidase (MPO), with 13 and 9 reads, but not of the iron binding protein lactoferrin (LTF), in any of the five cell types (Table 3). However, we found relatively high levels of two neutrophil cytosolic factors, of NCF1 in both B cells and monocytes and of NCF2 in monocytes (Table 4). These proteins are components of the reactive oxidant generating system of neutrophils. NCF1 and NCF2 are components of the multi-protein enzymatic complex known as the NADPH oxidase and mutations in them causes chronic granulomatosis disease with defects in the defense against bacterial infections [28,29].
Very high levels of the antibacterial protein lysozyme, LYZ, was seen in monocytes. Lysozyme is an enzyme that cleaves a bond between two sugar units in bacterial cell wall, the peptidoglycan. Lysozyme was actually the most highly expressed protein in monocytes with 18602 and 23009 reads (Table 4). Very low levels of this protein were found in all the other cell types (Table 4). The low levels in these cell populations may even originate from a few contaminating monocytes. MPEG1, is an antibacterial protein forming pores in bacterial cells enabling access to periplasmic space. This protein was expressed only by B-cells and monocytes but at relatively low levels, with between 25 to 50 reads (Table 4) [30]. COCH is the gene for cochlin, a protein present in the inner ear but seems also to contribute to innate immunity after cleavage by aggrecanases [31]. It is expressed only in B cells among these five cell populations but at a low level, with 59 and 63 reads (Table 4). MNDA, the myeloid cell nuclear differentiation antigen, has been detected in the nuclei of cells in the granulocyte-monocyte lineage [32]. This gene was expressed primarily in monocytes, with 152 and 26 reads but also at lower levels in B cells (Table 4).
2.6. Transcript Levels for a Panel of Cell Surface Receptors Used as Markers of Immune Cell Populations
The expression levels of cluster of differentiation proteins (the CDs) are highly informative concerning function and regulation of the five cell types as they have been identified on the basis of being lineage specific (Table 5).
CD2 acts as a costimulatory molecule on T-cells and NK-cells. Here it was only detected in T-cells, and at relatively low level between 26 and 128 reads. A CD2 related molecule SLAMF6 was detected only in B- and T-cells at a low level with between 18 to 47 reads (Table 5). CD5, CD6 and CD7 were also expressed essentially only in T-cells, and similar expression levels in both CD4+ and CD8+ T-cells (Table 5). However, all three of them were not entirely T-cell specific as very low levels of CD5 and CD6 were also seen in B-cells. Very low levels of CD7 was instead observed in monocytes and MCs, within the range of 4 to 29 reads (Table 5). CD5 was present in 20-30 times lower levels in B cells compared to the T cells (Table 5). CD5 is expressed on B1-B cells in mice and these cells normally reside in the peritoneum, which indicates that the majority of circulating B cells belong to the B2 type. However, the expression of CD5 on human B1 cells is less restrictive and can therefore not be used as a specific marker for B1 cells in humans [33]. CD6, which has been found to be important for the continued activation of T cells, was almost T cell specific with only 10 and 6 reads in B cells compared to 468, 371, 261 and 407 in the T cell samples (Table 5).
All the four CD3 components, CD3D, CD3E, CD3G and CD247 (CD3Z), which are key components of the T cell receptor complex, were found only in T-cells as expected (Table 5). The expression levels of these components were almost identical between CD4+ and CD8+ T-cells, except for CD3E, which showed much higher levels (Table 5). CD3E forms heterodimers with both CD3G and CD3D and should thereby be present at double concentration to these other two CD3 members making the higher expression of CD3E logical. CD8A and CD8B were also as expected only expressed by CD8+ T-cells, with between 332 and 1439 reads (Table 5).
CD4 was as expected highly expressed by CD4+ T-cells, with 501 and 526 reads, but also high in both monocytes and MCs. Interestingly, both monocytes and MCs had an expression level of this marker as high as almost 50% of the levels in the CD4+ T-cells (Table 5). Notably, the expression of CD4 was not downregulated upon culturing of the MCs but instead possibly even slightly increased ([6] and Supplementary file S1).
Concerning the T-cell regulatory components including CD28, CTLA4 and PD1 we found that all three of them were T-cell specific (Table 5). The expression of CD28 was approximately two times higher in CD4+ compared to CD8+ T-cells, with 158 and 198 reads in CD4+ T-cells and 66 and 94 reads in CD8+ T-cells (Table 5). The difference in expression of CTLA4 was even bigger, 5-10 times lower in CD8+ than in CD4+ T-cells, and the absolute levels of CTLA4 was much lower than for CD28, between 19 and 23 reads, which is expected as it is a negative regulator of T cell activation and is upregulated after T-cell activation (Table 5). When it comes to the B7:1 and B7:2 molecules, the ligands of CD28 and CLTA4, which are crucial for T cell activation, we found that B7:1 (CD80) was expressed primarily on B-cells, with 14 and 21 reads and very low levels on MCs with 3 and 9 reads (Table 5). In contrast B7:2 (CD86) was expressed in B cells and monocytes (Table 5). The expression levels were relatively low for both B7:1 and B7:2, in the range of 15-30 reads (Table 5). A third member of this family B7-H3 (CD276) was only found in MCs and this expression was maintained after culturing for 3 weeks, with 17 and 32 reads directly after purification and 34, 41, 32 and 44 after 3 weeks in culture (Table 5) ([6] and Supplementary file S1). This molecule may, similarly to PDL1, act as negative regulator of adaptive immunity, a checkpoint inhibitor [34]. A CD28 related molecule that is present on activated T-cells and thought to be involved, primarily in Th2 T-cell activation, ICOS, was essentially only expressed by T cells and then higher in CD4+ T-cells than CD8+ T-cells (Table 5). Very variable levels were found in the CD8+ T-cells with one individual having 28 reads and the other only 3 whereas in the CD4+ T-cells there were 51 and 50 reads in the two individuals (Table 5). The binding partner to ICOS, the ICOSLG was found to be highly expressed by B-cells, with 372 and 533 reads, slightly lower in monocytes and at low levels in both T-cells and MCs (Table 5). The regulator of T-cell activation, PD1, was expressed only by T-cells and at very low levels (Table 5). Interestingly, the binding partner, PDL1, was essentially only expressed by MCs except for very low levels in both CD4+ and CD8+ T-cells (Table 5). PDL1 levels dropped after culturing the MCs, almost 10-fold from 106 and 158 reads to 15, 10, 17 and 17 reads in four individual cultures ([6] and Supplementary file S1).
Except for very low levels in MCs no expression of PDL2 (PDCD1LG2) was observed in the five cell populations (Table 5). CD27 is another molecule that may act as an immune checkpoint receptor by binding to CD70. CD27 may also act in maintenance of T-cell memory and to regulate B-cell activation and immunoglobulin synthesis [35,36]. It was found to be expressed by B cells, with 45 and 35 reads, and at a higher level by T-cells, with between 106 and 541 reads, but not by monocytes and MCs (Table 5).
When it comes to the CD40-CD40L pair of receptors so important for B-T-cell interaction we found expression of CD40 essentially only in the B-cells with 120 and 164 reads. CD40L was instead only detected in the T-cells (Table 5). The levels of the CD40L was 3-4 times higher in CD4+ compared to CD8+ T-cells with 68 and 84 reads in CD4+ T-cells, which make sense as it is primarily the CD4+ T-cells that are considered to interact with B-cells (Table 5).
A number of other CD molecules are preferentially expressed in the non-T cell populations. One of them CD9, a member of the tetraspanin 4 family, is very highly expressed in MCs, with 931 and 1078 reads. Cross linking of CD9 on MCs has been shown to trigger granule release and in the absence of CD4 act as an IL-16 receptor [37,38]. In the other cells the expression of CD9 was 100-1000-fold lower (Table 5). This suggests that the expression level of CD9 is much higher on MCs compared to the other immune cells and this in spite of the published work on the role of CD9 in the activation of several other hematopoietic cell types [39]. The expression of CD9 by these human MCs is among the highest of all tetraspanin members on human MCs, which indicate a major difference between mouse and human MCs as deduced from the mouse data presented by the ImmGen consortium [40].
CD14 was expressed almost exclusively by monocytes, with 1304 and 1388 reads in the two individuals (Table 5). A very low level was also seen in MCs, with 22 and 26 reads. This expression was also stable after in vitro culture, with 9, 36, 21 and 27 reads in the four cultures ([6] and Supplementary file S1). However, as can be seen from the expression levels of TLR4 and also CD19, with 11 and 16 reads on B cells later in Table 5 even very low level of expression can be of major biological significance. Low transcript levels have previously also been observed for TLRs with two different sequence methods, RNA seq and Ampliseg, but also much higher levels have been presented in other studies indicating that the question of the expression levels of TLRs and other pattern recognition receptors is still not fully resolved [41,42].
CD36 was also almost monocyte specific, with 117 and 138 reads and only very low levels in MCs. CD36 acts as a scavenger receptor of importance for phagocytosis in monocytes and macrophages but also for the expansion of hematopoietic stem cells during infection [43,44].
Then we looked at a number of classical B-cell markers including CD19, CD20 and CD21. Most of them were only expressed by B-cells. CD19 the surface marker we use for B cell isolation was as expected expressed only in B-cells, but at a very low level, with 11 and 16 reads (Table 5). However, the expression level was clearly sufficient for antibody mediated isolation of these cells. CD20 (MS4A1) was also only expressed by B-cells, but at a much higher level, with 214 and 359 reads (Table 5). Knock out of CD20 in mice results in decreased humoral immunity in both T-cell dependent and independent responses [45]. CD21, the complement receptor 2 (CR2) was primarily expressed on B-cells with 40 and 40 reads in the two individuals (Table 5). In contrast, very low levels of CR2 were seen in both CD4+ and CD8+ T-cells, and no reads were found in monocytes and MCs (Table 5). CD22, also named Siglec-2, a member of a sialic acid binding family of proteins was expressed primarily by B-cells but also by MCs and actually relatively highly upregulated in MCs when put in culture. We found 737 and 655 reads for B-cells and 146 and 110 reads for freshly isolated MCs, which then increased 4-5 fold after 3 weeks of in vitro culture ([6] and Supplementary file S1). CD22 functions as an inhibitory receptor for B cell receptor signaling and is also involved in B cell trafficking in Peyer´s patches in mice [46].
CD53 is a member of the transmembrane 4 superfamily though to be involved in enhancing signaling by CD2 in T- and NK-cells. However, we only detected expression of CD53 in B-cells, and also at relatively low level, with 18 and 36 reads (Table 5). The marker of immature hematopoietic cells, CD34, was not detected at significant levels in any of the five cell populations (Table 5).
The majority of another set of B-cell related genes were exclusively, or almost exclusively expressed by B-cells. CD72 is a regulatory B-cell receptor interacting with CD5 that seems to function as a negative regulator of B-cell activation [47]. The expression level of this receptor was low with 42 and 53 reads and almost absent in the other cell types (Table 5). CD79A and CD79B are the two signaling components of the membrane bound immunoglobulin, the Igα/Igβ heterodimer. Interestingly, we observe a very large difference in expression levels of these two components. CD79A showed 3902 and 4312 reads in the B cells and CD79B at a level of only 10% of the levels of CD79A (Table 5). Low levels of these coreceptors were found in all the other cell types with a maximum of 33 reads in the CD8+ T-cells for CD79A (Table 5). The question is here if these two signaling components of the B cell receptor also have a function in T cells?
In these mature B cells, we did not detect any transcripts for one of the pre-B cell surrogate light chains, the variable region VPREB1, also named CD179a (Table 5). The corresponding constant domain (lambda 5) encoded by the IGLL1 was not detected in the Ampliseq library, so we cannot say anything about its expression levels, although we expect also this gene to be silent. These two molecules form the surrogate light chain on pre-B cells before the rearrangement of the immunoglobulin light chains, kappa or lambda. Instead of these pre-B cell receptor light chain transcripts we found relatively high levels, with 207 and 686 reads for the lambda like light chain 5, a transcript encoding a lambda constant domain and a joining region connected to a N terminal region not related to a classical variable region, IGLL5 (NCBI). This gene encodes a protein with still unknown function. We also detected transcripts for the VPREB3 gene, which encodes a protein that is not part of the pre-B cell receptor but seems to have a function in the transport of the IgM heavy chain [48]. This gene was still active in these mature B cells with expression levels of 135 and 162 reads (Table 5). The gene encoding the immunoglobulin J-chain of pentameric IgM and dimeric IgA (IGJ) was expressed exclusively in B-cells, with 206 and 270 reads (Table 4). The MZB1 gene is encoding a marginal zone and B1-B cell specific transcript and the 51 and 66 reads found for this gene in the CD19 positive cells indicate indicating the presence of a small number of B1-B cells among these peripheral B-cells [49]. FACS analyses using CD20, CD27 and CD43 positivity as B1 selective markers have indicated highly variable amounts of B1 cells in human peripheral blood from approximately 1 to 15% of the circulating B-cells [50].
Several of the five cell types expressed the following CD molecules: CD63, CD68, CD69, CD81, CD82, CD83, CD96, CD97, whereas and a few CD molecules including CD163, CD180, CD200 and CD248 were expressed at low levels in only one of the five populations. CD63 is a member of the transmembrane 4 superfamily together with CD9, CD37, CD53, CD81, CD82 and CD151 [38,51]. CD63 is associated with intracellular vesicles and is used as a marker in the basophil activation test (BAT) [52]. CD63 was found to be expressed in all five cell types but at much higher levels in monocytes and MCs (Table 5). It is also upregulated in MCs upon in vitro culture, from 265 and 305 reads in freshly isolated cells to 1274, 1264, 1255 and 1992 reads in the four cultures ([6] and Supplementary file S1). CD68, has been used as a marker for macrophage and monocyte populations and we found high levels of transcripts for this heavily glycosylated protein on monocytes, but also in MCs (Table 5). CD69 is a C-type lectin and an activation marker for several hematopoietic cells [53,54]. It was highly expressed in four out of the five cell populations in this analysis, i.e. in B cells, CD4+ and CD8+ T cells and MCs but not in monocytes (Table 5). It seems remarkable with an activation marker that shows such high level also in non-activated cells. CD81 and CD82 are members of the transmembrane 4 superfamily. CD81 was found to be highly expressed in all cells except monocytes where the levels were considerably lower (Table 5). CD81 may have a role in T cell activation by associating with CD4 and CD8 to provide costimulatory signals with CD3, but as shown here CD81 was more highly expressed by MCs and also highly expressed by B-cells which suggests additional functions also in these cells [55]. CD82 was also expressed by all five cell populations but much lower in monocytes and T-cells. The exact function of this molecule is not known. CD83 seems to have diverse function on several hematopoietic cells but was in our analysis primarily expressed by B-cells and MCs, with very high levels in MCs, with 1555 and 969 reads. CD96 is a member of the immunoglobulin superfamily that appear to have a role in adhesive interaction by activated T and NK cells [56]. Relatively high levels, with between 58 and 251 reads, were observed in T-cells. CD97 belongs to the adhesion G protein-coupled receptor (GPCR) family and binds to the complement control protein decay accelerating factor (DAF) also named CD55. This cell surface protein has been found to have a critical role in host defense by regulating granulocyte homeostasis, but other functions have also been described [57]. CD97 was here expressed by all five cell types, but higher in T-cells and MCs. CD163 was only expressed by monocytes in our study and then at relatively low levels, with 37 and 48 reads. CD163 is a high affinity scavenger receptor for hemoglobin-haptoglobin complexes and also a sensor for both gram-positive and gram-negative bacteria on monocytes/ macrophages [58,59]. CD180 was primarily expressed by B-cells in this study, with 40 and 44 reads (Table 5). CD180 is a leucin rich repeat (LRR) containing surface protein that interacts with MD-1, which act together with Toll like receptor 4 (TLR-4) in the sensing of bacterial lipopolysaccharides (LPS) from gram negative bacteria [60,61]. MD-1 also named LY86 was expressed by B cells and monocytes only with between 62 and 143 reads. CD200 was in this analysis B-cell specific, but at low level with 44 and 63 reads. CD200 may have an immunosuppressive function, which still seems poorly defined [62]. It is claimed to be expressed on other immune cells, which we did not see in this analysis except for very low levels by CD4+ T-cells and MCs (Table 5) [62]. CD248 showed an interesting pattern as we almost only find transcripts for this protein in CD8+ T-cells except for very low levels in the other cells (Table 5). CD248 belongs to novel family of C-type lectins of yet unknown function [63].
As the last set of genes in this section we have members of the CD300 family. Members of this family appear to have either inhibiting or activating functions on various immune cells. All of them were expressed in monocytes, and several almost exclusively in monocytes, including CD300E, CD300LB and CD300LF (Table 5). CD300A has been shown to down regulate cytolytic activity of NK-cells and to inhibit MC degranulation [64,65]. In contrast to the above listed members CD300A was more broadly expressed and found in monocytes, T-cells and MCs but not B-cells (Table 5). CD300C, which is a paralog of CD300A with a less defined role in immunity, was here only expressed in monocytes and MCs (Table 5). Both CD300E and CD300LB seem to act as activating receptors on myeloid cells, whereas CD300LF has the opposite role being an inhibitory receptor [66].
Most of the CD markers presented in this table adhere to the existing view of their expression profile and role in immunity, but we can now add quantitative values and also clarify several inconsistencies concerning their expression in freshly isolated normal non-activated cells.
2.7. Transcript Levels for the Major Histocompatibility Related Genes (MHC)
Members of the MHC Class I and II genes and related genes are involved in antigen presentation. We found that the different Class II genes are primarily expressed by B-cells and monocytes at very high expression levels with between 956 and 3761 reads for the DR and DP genes in monocytes, and between 2055 and 6459 reads for B-cells. This indicates a 2-5 times higher expression level in B-cells compared to the monocytes and an almost 100-fold higher level in B-cells compared to T-cells and MCs (Table 6). Of the DQ genes only low levels of DQA1 were detected in B-cells, with a high variation (4 and 458 reads) between the two individuals. No transcripts for the two other DQ genes, the DQA2 and DQB2, were detected in the five cell types. Of the proteins needed for transcriptional activation of the class II genes and for antigen presentation ( CIITA, HLA-DMA, HLA-DOA, HLA-DOB and CD74). The transcriptional coactivator CIITA levels matched the expression levels for the class II genes with a 2-3 fold higher level of CIITA in B-cells compared to the monocytes, and almost 100-fold higher in B-cells compared to the levels in T-cells and MCs. HLA-DMA plays a role in peptide loading of class II molecules and was here expressed at almost equal levels in B-cells and monocytes and approximately 20 times lower levels in T-cells and MCs. HLA-DOA and DOB form a heterodimer and have been found to participate in antigen loading on class II genes primarily in B cells, and we found them here also expressed almost exclusively in B-cells, except low levels of DOA also in CD8+ T-cells. CD74 was the invariant chain that blocks peptide binding to class II molecules before entering the endosomal compartment for antigen loading. We can here see that CD74 is expressed at approximately 5-6 times higher levels in B-cells compared to monocytes and 10 times higher than in T-cells and MCs.
Of the MHC Class I related CD1 molecules, only CD1D was expressed at significant levels in these cells. The expression was much higher in monocytes than in B cells, with 441 and 466 reads in monocytes and 15 and 40 reads in B-cells. No expression of any of the four chains was observed in T-cells or MCs (Table 6). Only very low levels of CD1A and CD1C, between 1 and 7 reads, were observed in B-cells and monocytes, and no expression of CD1B was found in any of the five cell types.
In contrast to the CD1 molecules the classical class I genes were expressed at very high levels in all five cell types. For example, the expression of β2-microglobulin (B2M), the binding partner to the alpha chain of class I genes, varied between 2218 and 11150 reads in these five cell types, with the highest level found in the T-cells (Table 6). Of the MHC Class I alpha chain genes, a high level of expression of HLA-A was detected in all five cell types. However, 2-15 times lower levels of the class I A, B and C genes were observed in the MCs compared to the four blood cell populations, and there was also a major variation in expression levels between individuals for the three class I genes (Table 6). One individual almost totally lacked expression of HLA-B and C, which may have major implications for defense against viral infections (Table 6). However, the two individuals that were the origin of the four blood cell populations were ordinary anonymous blood donors, indicating that they had no major health issues. This may indicate that a highly limited class I repertoire is consistent with a normal life. The levels of HLA-B in one person were 100-200 times lower than in the second donor and for the HLA-C the difference was even bigger, with one donor having between 514 and 9613 reads whereas the other have between 2 and 17 reads. However, we could see is that the HLA-A transcript level was considerably higher in the individual that almost lacked HLA-B and C, possibly as a compensatory mechanism (Table 6).
The invariant class I molecule HLA-E is in contrast highly expressed in all five cell populations. HLA-E is a non-classical MHC class I molecule with limited polymorphism of importance for inhibiting NK-cell lysis by binding to the inhibitory receptor CD94/NKG2C [67].
2.8. Transcript Levels for Fc-Receptors
Receptors with specificity to the constant domains of the various immunoglobulins, the Fc-receptors, differ markedly between different immune cell populations. Most of them act as receptors for uptake, phagocytosis, of immune complexes, or as for the high affinity IgE- receptor in activation and degranulation of a cell. In our data, two of the three subunits of the high affinity IgE receptor FcεRI, the alpha and beta chains (FCERIA and MS4A2), were almost exclusively expressed by MCs, with 214 and 127 reads for the alpha chain FCERIA and 817 and 441 reads for the beta chain, the MS4A2 (Table 7). A very low level of the alpha chain was also seen in the monocytes with 8 and 5 reads, or almost 20 times lower than in MCs, but no expression of the beta chain, which is in line with previous findings that monocytes and dendritic cells can express a variant of the high affinity IgE receptor consisting only of the alpha and gamma chains lacking the beta chain (Table 7) [68]. The IgE receptor gamma chain, FCERIG, is also a signaling component of two of the IgG-Fc receptors, the high affinity FCGR1 and the low affinity receptor FCGR3 [69]. The gamma chain was expressed at high levels in monocytes and MCs with between 741 and 910 reads and at low level in T-cells with between 7 and 57 reads, but not in B-cells (Table 7). In contrast, the low affinity IgE receptor, FCER2, also named CD23, which is a C-type lectin was found almost exclusively in B-cells with 598 and 643 reads, and at 100-fold lower level in monocytes (Table 7).
When it comes to the different receptors for IgG we saw that many of them were expressed by monocytes, including the high affinity IgG receptor, FCGRIA, the three variants of the intermediate to low affinity receptor, FCGR2A, FCGR2B and FCGR2C, and one of the other low to medium affinity receptors FCGR3A, at very low levels (Table 7). The high affinity IgG receptor FCGR1A was here actually only found in the monocytes and at relatively low level, with 13 and 15 reads. The activating gamma 2 receptor FCGR2A was here expressed by both monocytes, with 61 and 66 reads, and MCs with 142 and 199 reads. This is the only IgG receptor we detected in MCs in contrast to the literature where other receptors have been detected. The reason for this discrepancy may be due to that different model systems used or on the states of activation as we have seen that the transcript levels for these receptors can change quite markedly upon in vitro culture or by analysis of cell lines. For example, three weeks in culture of freshly isolated human skin MCs resulted in a 5-fold increase in FCERIA and a 90% reduction in FCGR2A levels [6]. The inhibitory receptor FCGR2B was expressed in both B-cells and monocytes and for the monocytes we saw that the expression levels for both this receptor and the related activating receptor FCGR2C differed markedly between individuals. We saw an approximately 5 times difference in expression levels for both of these receptors between the two individuals in this study, 38 reads for both in one individual and 188 and 190 reads for the second individual. Interestingly no difference in expression levels for these two receptors were seen in the B cells indicating difference in regulation of these two receptors between these cell types.
In contrast to the other receptors FCGR3A was here almost exclusively expressed by CD8+ T-cells, with 58 and 65 reads. Only low levels with 6 and 8 reads were observed for monocytes and extremely low levels in CD4 positive cells with 1 and 1 read (Table 7). The closely related gene FCGR3B was not detected in any of the five cell types. This receptor seems mainly to be expressed by neutrophils and to be one of the most abundant Fc receptors on neutrophils [70].
The large subunit of the FCRn, the neonatal IgG receptor, is encoded by the FCGRT gene. This receptor is closely related to MHC class I alpha chains, and was here expressed by all five cell types. However, monocytes showed approximately 10 times higher level than the other four cell types, with 135 and 235 reads in monocytes. FCRn is involved in recycling of IgG and albumin by endothelial cells [71].
FAIM3 encodes the IgM specific receptor that has been found to be primarily expressed by B- and T-cells, which fits very nicely with the data here [72,73]. Both B- and T-cells expressed relatively high levels of this receptor, within a range of 199 to 468 reads (Table 7).
During the analysis of the total human genome a number of genes related in structure to the classical IgG and IgE receptors were identified, the Fc receptor like molecules. Six such genes were identified, where the majority of them were expressed almost exclusively in B-cells including FCRLA, FCRL1, FCRL2, and FCRL5 (Table 7). One of them FCRL3 was expressed in both B-cells and CD8+ T-cells, with between 16 and 66 reads and at very low levels in CD4+ T-cells. The remaining receptor number 6, FCRL6, was found to be expressed exclusively by CD8+ T-cells with 72 and 126 reads. FCRL6 has previously been shown to be expressed by CD8+ T-cells and NK-cells and to be involved in inhibiting or controlling activation of these cells by binding to MHC Class II DR [74]. Transcripts for one of the FCRL genes was almost totally absent in all five cell types, the FCRLB. The FCRL receptors are most likely ancestors of the classical IgG and IgE receptors and are found earlier in evolution before the appearance of the classical IgG and IgE receptors [69]. Relatively little is still known about their function but some results indicate the role of FCRL1 as coactivating receptor for B-cells and that FCRL3 and 4 binds IgA and FCRL5 to IgG [75]. All of the classical Fc receptors and the Fc receptor like receptors are in the human genome encoded from a single locus on chromosome 1 indicating that they have appeared by successive gene duplications of one or a few ancestral genes [69].
The MILR1 gene encodes a receptor that has been shown to act as a negative regulator of MC activation was here expressed at relatively low levels in B-cells, monocytes and MCs in the range of 30-60 reads (Table 7) [76]. CD200R1 is an inhibitory receptor with two immunoglobulin domains that has been shown to be expressed primarily by myeloid cells and to be involved in downregulating the expression of inflammatory cytokines, and also to be able to inhibit MC degranulation [62,77]. This gene was here expressed almost exclusively by the MCs but at very low level, with 24 and 6 reads (Table 7). These two latter genes are no classical Fc receptors but included in this list as they have interesting immune regulatory functions.
Another class of receptors, the MRGPRX family of receptors, has received a lot of attention due to the fact that one of its members has activating functions on MCs similar to the high affinity IgE receptor. MRGPRX2 was the only one of the four family members that was expressed in any of these five cell types and was found in MCs with 253 and 365 reads. MRGPRX2 is an activating receptor which has been shown to be expressed almost exclusively on one type of MCs, the connective tissue type [78]. MRGPRX2 is also not an Fc receptor but a receptor for substance P and other positively charged low molecular weight compounds but was included in this table due to its MC activating properties similar to the high affinity IgE receptor [78].
2.9. Transcript Levels for Leukocyte Immunoglobulin-like Receptors (LILRs) and Killer Cell Lectin-like Receptors (KLRs)
Leukocyte immunoglobulin-like receptors, LILRs, is a family of immunoreceptors that according to the literature primarily are expressed by myeloid antigen presenting cells such as monocytes and dendritic cells, but also by granulocytes, NK-cells, T-and B-lymphocytes, hematopoietic stem cells and also by non-immune cells, such as endothelial cells and neurons [79]. They are distantly related in structure to the Fc receptors, and are not encoded on chromosome 1 where the classical Fc receptors are found but on chromosome 19 [69]. The A family members of the LILRs contain short cytoplasmic domains and may primarily be activating receptors whereas all of the B family members are inhibitory [79]. The inhibitory LILRs constitute a safe-guard system that mitigates the inflammatory response, allowing a prompt return to immune homeostasis [80]. The majority of the LILRs listed here were almost exclusively expressed by monocytes (Table 8). One of them LILB3 reached as high as 500 reads in one of the samples. Only one of the eight members we have listed here were expressed also by another cell population and that’s LILRB1, which also was expressed by B cells, but at relatively low level with 34 and 37 reads. A few additional LILRs were also expressed at very low levels in MCs, generally in the range of a few reads (Table 8). LILRA1 is an activating receptor that interacts with MHC class I molecules [79]. LILRA2 has been found to sense microbially cleaved immunoglobulins to activate myeloid cells [81]. Both LILRA3, and LILRA6 may act as receptors for MHC class I molecules similar to LILRB1, LILRB2, LILRB3 and LILRB4 but in contrast to the previous ones act in an inhibitory fashion on various immune cells [79]. LILRA1 and LILRA2 were both only detected at low levels in monocytes. Both LILRA3, and LILR6 were here also expressed at relatively low levels in monocyte with 78 and 34 reads and 141 and 128 reads, respectively. The osteoclast associated receptor (OSCAR) was also a member of the leukocyte receptor complex together with the LILRs and is thought to be involved in regulation of both innate and adaptive immunity [82]. Among these five cell types OSCAR is expressed exclusively by the monocytes, with 327 and 284 reads (Table 8).
In contrast to the LILRs, the killer lectin-like receptors belong to the C-type lectin family and they were not expressed by monocytes. The KLRB1, KLRC3, KLRC4, KLRG1 and KLRK1 were instead all expressed by T-cells (Table 8). Among these five cell populations, three of them were here expressed in T cells only, the KLRB1, KLRC3 and KLRC4, and two of them only in CD8+ T cells the KLRC3 and KLRC4, but then at relatively low levels (Table 8). One of them, the KLRG1, was expressed both in T-cells and MCs, and one the KLRG1, in CD8+ T-cells and B-cells (Table 8). NKG2D, which is encoded by the KLRK1 gene, recognizes induced self-proteins, which appear on stressed, malignant, transformed and infected cells [83]. This receptor was in this study found to be highly expressed by CD8+ T-cells with 641 and 424 reads and at low levels on B-cells (Table 8). KLRB1 binds terminal Gal-alpha (1,3) epitopes and N-acetyl-lactose amine epitopes and inhibits NK cell activation [84]. This lectin is relatively highly expressed by both CD4+ and CD8+ T-cells with 504, 245, 420 and 183 reads (Table 8). KLRC3 is a receptor on NK cells and some CD8+ T-cells for the recognition of HLA-E [85]. In this analysis it was found only in the CD8+ T cell sample and at relatively low levels (Table 8). KLRC4 was also found to be expressed only in the CD8+ T-cells with 71 and 23 reads (Table 8). KLRG1 plays an inhibitory role on NK- and CD8+ T-cells by binding non-MHC ligands including conserved sites on cadherins and may mediate missing self [86]. It was in this study expressed by both CD4+ and CD8+T-cells and by MCs (Table 8). In this category we also have two additional membrane proteins NKG7 and NCR3. NKG7 is a small membrane protein essential for the degranulation of NK cells and CD8+ T-cells and also important for activation of CD4+ T-cells [87]. NKG7 was very highly expressed by the CD8+ T-cells with 1423 and 1129 reads and at much lower levels in CD4+ T-cells and even lower in monocytes (Table 8). Natural cytotoxicity triggering receptor 3 (NCR3) interacts with a broad range of ligands without an obvious structural similarity, including viral, parasitic and tumor proteins, and may aid NK cell lysis of target cells and cytokine secretion by interaction with the T-cell receptor zeta chain [88,89]. It was expressed at low levels in both CD4+ and CD8+ T-cells and B-cells but not in monocytes or MCs (Table 8).
2.10. Transcript Levels for Complement Components and Receptors
The majority of complement and coagulation components are produced by the hepatocytes of the liver. However, recently we have shown that also human monocytes and mouse macrophages are major producers of several of these components [19,41]. C1Q, consists of three chains A, B and C, were expressed in relatively large amounts by mouse peritoneal macrophages [41]. However, they were not expressed at significant levels in these five cell populations in this study, except for C1QA, which was detected at very low levels in monocytes, the, with 20 and 15 reads (Table 9). Transcripts of the C2 component were produced in very low amounts by both monocytes and MCs with 5 and 8 and 13 and 12 reads, respectively (Table 9). The expression of the C2 component in MCs is in line with what we observed in mouse MCs, although the levels of this component were higher in the murine counterparts [21]. In contrast, to C1Q and C2 three other complement components, transcripts for factor P or properdin, CFP, complement factor D, CFD and ficolin 1, FCN1, were produced in very high amounts by the human monocytes (Table 9). CFP was also produced in lower amounts by T-cells and CFD by MCs (Table 9). CFD is one of the activating serine proteases of the complement cascade. Not any of the other complement components were produced in any significant levels except very low levels of the C3 component by MCs, with 8 and 7 reads, and very low levels of factor H, CFH, by T-cells, with 4 to 9 reads (Table 9).
C3AR1 is the receptor for one of the complement components, the small C3a fragment. This C3 fragment, which is chemotactic and activating on MC was expressed almost exclusively but at low level by the MCs, with 6 and 31 reads, and at very low level by T-cells, with 1 to 4 reads (Table 9). Low levels of the protein C receptor (PROCR) were observed in MCs (Table 9). The two complement receptors CR1 (CD35) and CR2 (CD21), were both primarily expressed by B-cells and at relatively low levels. However, both were also expressed at very low levels in T-cells (Table 9). This is in line with the important role of these receptors primarily in B-cell biology, where in human B-cells they act as negative regulators of both proliferation and antibody production [90].
2.11. Transcript Levels for Toll-like Receptors (TLRs) and Other Pattern Recognition Receptors
Pattern recognition receptors are essential for recognition of non-self and to initiate protective inflammatory responses. They originate from a number of different gene families. Probably the most well-known is the toll-like receptors, the TLRs, which is a small family of leucin rich repeat containing proteins consisting in the human genome of 10 members TLR1-TLR10. Interestingly, despite their essential function in immunity they were expressed at very low levels in both mouse and human immune cells, with no more than 32 reads detected for any of these ten members and in any of the five cell types in the present analysis (Table 10) [21,41]. Low levels were also seen for other pattern recognition receptors such as the NOD, RIG, and MDA5. Still the maximum level detected was 43 reads, indicating that these low levels of transcription are still sufficient for effective sensing of non-self structures such as LPS, peptidoglycans, double stranded RNA and non-methylated DNA. These receptors were expressed in a cell-specific pattern in the five cell types suggesting that a certain cell type only responds to some of these non-self structures. We found that B-cells expressed TLR1, 6, 7, 9 and very low levels of TLR10, monocytes expressed TLR1, 2, 4, 5, 8 and 9, T cells expressed TLR1 and 5, and MCs expressed only TLR4 and very low levels of TLR2 (Table 10). NOD1 was more broadly expressed but at low levels. NOD2 was almost only expressed by monocytes and at slightly higher levels with 29 and 43 reads (Table 10). NLRC3, is a short NOD like receptor, also named NOD3, involved in maintaining T cell activation and preventing T cell anergy [91]. It was here expressed almost exclusively in the lymphocytes and at low levels, between 19 and 45 reads in these three cell types. DDX58, also named RIG-1, is a pattern recognition protein that recognizes short double stranded RNA, a characteristic feature of different virus infections [92]. It is here expressed in all five cell types with between 10 and 39 reads except for monocytes where the expression was lower with 5 and 5 reads. IFIH1 also named MDA5, is in contrast to RIG-1 binding larger doubled stranded RNA with a length of 2000 nucleotides or more, but also able to detect the lack of 2´-O-methylation in RNA [93,94]. MDA5 was here expressed at very low levels with between 1 and 18 reads and particularly low in monocytes with only 1 and 2 reads. As mentioned previously we have recently shown that LPS which is detected by TLR4 in monocytes is inducing a rapid and extremely potent response in freshly isolated human monocytes with a 75 000 times induction of IL-6 within 4 hours of incubation, and inducing IL-8 to become the most highly expressed protein [19]. CD14 acts as a coreceptor for LPS recognition by interacting with TLR4 and we here found a remarkable difference in expression levels between these two components of the LPS recognition machinery as the level of TLR4 on monocytes was 6 and 6 reads and 1304 and 1388 reads for CD14 (Table 5).
FAS-associated death domain protein is encoded by the FADD gene. This protein is an adaptor protein for the FAS receptor and the procaspases 8 and 10 to form the death inducing signaling complex during apoptosis [95]. FADD is also required for an efficient antiviral response. Upon viral infection, FADD is needed to increase the levels of interferon regulatory factor, IRF7, a molecule which is needed for the production of IFN-alpha [96]. FADD was here expressed in all five cell types but higher in T cells with between 23 and 26 reads. Protein kinase R is encoded by the EIF2AK2 gene. This is a kinase activated by double stranded RNA and induced during cellular stress and by viral infections [97]. It was here expressed by all five cell types at higher levels than the other proteins involved in sensing infection, with between 27 and 121 reads. Mitochondrial antiviral-signaling protein MAVS, is the gene for one of the proteins in these lists that show relatively similar expression levels in all five cell types with between 11 and 35 reads. It is a protein essential for antiviral innate immunity located in the outer membrane of mitochondria, peroxisomes and mitochondrial-associated ER membranes [98]. MYD88, acts as an essential signaling adaptor protein to the TLRs [99]. It was expressed in all five cell types with between 25 and 100 reads. The protein encoded by the PLD4 gene is a single-stranded acid exonuclease that regulate endosomal nucleic acid sensing, most likely to control TLR9 responses [100]. It was expressed essentially only in B-cells and monocytes, with 83 and 178 reads in B cells and 21 and 23 reads in monocytes. C-type lectin domain family 7-member A or Dectin-1 is encoded by the CLEC7A gene. CLEC7A is a C-type lectin and pattern recognition receptor that recognizes β-glucans and carbohydrates found in fungal cell walls, some bacteria and plants, and has been shown to be expressed by myeloid dendritic cells, monocytes, macrophages and B cells [101]. In our study, CLEC7A was expressed exclusively by monocytes at a relatively low level of expression with 30 and 41 reads, but not by B-cells.
The formyl peptide receptor FPR1, recognizing bacterial N-terminal peptides, FMLP, formyl-methionine-leucine-phenylalanine, is involved in sensing the presence of bacteria, and was detected only in monocytes, with 48 and 23 reads (Table 10). Interestingly, all of these sensors of non-self were expressed at very low or relatively low levels indicating that these low levels are sufficient for the strong response seen upon their engagement.
2.12. Transcript Levels for Histamine, Leukotriene and Prostaglandin Synthesis Enzymes
Transcript levels for the enzymes involved in histamine, leukotriene and prostaglandin production and degradation were generally higher in MCs compared to the other four cell types (Table 11). MCs are known as initiators of inflammation and to be potent producers of both histamine and the arachidonic acid metabolites, primarily leukotriene C4 and prostaglandin D2 so the high level of these enzymes primarily in MCs was expected. However, the high selectivity of these enzymes to MCs is still remarkable, and shows the major role of MCs as inflammation initiators.
The HDC gene encodes the enzyme histidine decarboxylase, an enzyme that removes the carboxyl acid group from the amino acid histidine and thereby generates the highly vasoactive histamine [102]. HDC was expressed exclusively by the MCs and at high levels with 853 and 796 reads (Table 11). Two monoamine oxidase genes MAOA and MAOB are genes encoding enzymes involved in degradation of dopamine and serotonin and related amines [103]. Both of them were also exclusively expressed by MCs but at very low levels: MAOA was detected with 9 and 10 reads and MAOB with 105 and 200 reads. Their potential functions the MC lineage have recently been discussed [104].
Arachidonate 5-lipoxygenase, ALOX5, is involved in the early enzymatic steps in the generation of various leukotrienes by adding a hydroperoxyl residue (HO2) to arachidonic acid to form 5-HpETE, and in a second step ALOX5 can convert 5-HpETE to LTA4 [105]. ALOX5 was expressed at relatively high levels in B-cells, and monocytes (250 to 310 reads) and at an even higher levels in MCs with up to 1423 reads (Table 11). In contrast, the coactosin-like protein COTL1 or CLP was more broadly expressed and found at relatively high levels in all five cell types, within the range of 250 to 1132 reads. The protein produced from this gene acts as a stabilizing scaffold for ALOX5, hindering its inactivation and thereby promoting its metabolic activity [106]. ALOX5-activating protein or ALOX5AP or FLAP is an integral protein of the nuclear membrane necessary for the activation of ALOX5 [107]. It was expressed in all five cell types within the range of 130 to 312 reads in T-cells and MCs and at lower levels in B-cells and monocytes. In contrast, leukotriene C4 synthase, LTC4S, was almost exclusively expressed by MCs with 129 and 60 reads, and at very low levels in the other four cell types not exceeding 4 reads. A similar situation was seen for HPGD and HPGDS, two enzymes involved in prostaglandin synthesis and inactivation. Both were highly expressed in MCs, with 1296 and 1021 reads for HPGD and 705 and 484 reads for HPGDS, and absent or almost absent in the other cell types. Only low levels of HPGD was seen in T-cells within the range of 8 to 10 reads. HPGD or 15-hydroxy prostaglandin dehydrogenase is an enzyme that catalyzes the first step in the inactivation of prostaglandins [108]. HPGDS, is instead the enzyme that performs the conversion of PGH2 to PGD2 and thereby has a major role in the formation of PGD2 in MCs [109]. Prostaglandin-endoperoxide synthase 1 or PTGS1, also known as cyclooxygenase 1 (COX-1) was here expressed in MCs with 378 and 357 reads, which was almost 10 times higher than what was detected in B-cells and monocytes, while T cells were negative altogether. PTGS1 and PTGS2 (cyclooxygenase 2, COX-2) both catalyze the formation of prostaglandin H2 from arachidonic acid and thereby the first step in the synthesis of different prostaglandins [110]. However, in contrast to PTGS1, PTGS2 is inducible and often upregulated during inflammation. We found that PTGS2 was expressed almost exclusively by MCs and at slightly higher levels than PTGS1, with 523 and 392 reads, and only at very low levels in monocytes with 2 and 4 reads. Phospholipase A2, PLA2G2A, is a membrane associated enzyme involved in releasing arachidonic acid from membrane phospholipids and the first step in the formation of both leukotrienes and prostaglandins [111]. This isoform is a member of one of several structurally unrelated families of PLA2 enzymes that here was expressed exclusively by MCs at relatively high levels with 272 and 579 reads. Thromboxane A synthase 1, TBXAS1, is an endoplasmic reticulum membrane protein that catalyzes the conversion of thromboxane H2 to thromboxane A2 a potent vasoconstrictor and inducer of platelet aggregation [112]. This enzyme was here expressed in all five cell types, very low in the lymphocytes, within a range of 1 to 13 reads, higher in MCs, with 18 and 26 reads and most highly expressed in monocytes with 297 and 323 reads. Lysophosphatidylcholine acyltransferase 2, LPCAT2, is an enzyme responsible for the generation of the lipid mediator platelet activating factor (PAF). This enzyme plays a key role in macrophage inflammatory gene expression in response to stimulation with bacterial ligands [113]. It was here expressed by monocytes and MCs with 27 and 39 reads for monocytes and 95 and 202 reads for MCs. The ENPP2 gene is encoding autotaxin an enzyme that is involved in the formation of lysophosphatidic acid (LPA), another lipid mediator [114]. This gene was expressed primarily by MCs, with 86 and 107 reads and lower in T-cells with 4 to 18 reads. The MBOAT7 gene is encoding the enzyme lysophospholipid acyltransferase 7 an enzyme that is part of the phospholipid remodeling pathway known as the Land cycle [115]. This enzyme showed 10-fold higher expression level in monocytes and MCs compared to the lymphocytes, within the range of 263 and 332 reads.
Finally, we looked at the expression of annexin A1, ANXA1, also known as lipocortin I, a Ca2+-dependent phospholipid-binding protein with phospholipase A2 inhibitory activity [116]. ANXA1, was here expressed at high level in all cell types except the B-cells and at very high levels in MCs with 3919 and 5423 reads.
Similar to the observations made for proteases and their inhibitors we found here that the controlling proteins are expressed at much higher levels in the cell types also producing the mediators they inhibit.
2.13. Transcript Levels for Proteoglycan Synthesis and Other Carbohydrate Related Proteins
A similar situation as for the histamine and arachidonic acid enzymes was seen for the carbohydrate processing enzymes where MCs also here were overrepresented, although not to the same extent.
Serglycin, SRGN, is the core protein for heparin and chondroitin sulfate synthesis, which is essential for the granule storage of proteases and histamine in MCs [117]. It was expressed in all five cell types, within the range of 690 to 1350 reads in monocytes and T-cells and at very high levels in MCs, with 5850 and 7939 reads (Table 12). We found a much lower level in B-cells with 45 and 78 reads. Heparan sulfate glucosamine 3-O-sulfotransferase 1, HS3ST1, is a member of the heparan sulfate biosynthetic enzyme family that here was expressed almost exclusively in MCs with 19 and 46 reads. Another member of this family is heparan sulfate (HS) 6-O-sulfotransferase 1, HS6ST1, which catalyzes the transfer of sulfate from 3-prime-phosphoadenonine 5-prime-phosphosulphate to position 6 of the N-sulfoglucosamine residue of heparan sulfate [118]. This gene was expressed at relatively high levels in MCs with 108 and 293 reads, low levels in monocytes and B-cells and at very low levels in T-cells. HSPG2 encodes another core protein known as perlecan or basement membrane-specific heparan sulfate proteoglycan core protein (HSPG) or heparan sulfate proteoglycan 2 (HSPG2) [119]. It was here expressed almost exclusively in MCs with 127 and 198 reads. The N-acetylgalactosaminyltransferase 6 gene, GALNT6, encodes an enzyme that initiates mucin-type O-linked glycosylation in the Golgi apparatus [120]. It is most highly expressed in MCs with 59 and 68 reads lower in monocytes and at very low levels in B- and T-lymphocytes. Heparan sulfate N-deacetylase/N-sulfotransferase 1 and 2, NDST1 and NDST2 are two heparan sulfate modifying enzymes [121,122]. NDST1 showed the highest expression in MCs with 54 and 65 reads, lower in monocytes and very low in B-cells and was almost totally absent in T-cells (Table 12). NDST2 showed higher expression with 799 and 183 reads in MCs, 148 and 103 reads in monocytes, 113 and 99 reads in B-cells and between 79 and 109 reads in T cells. N-acetylglucosamine-6-sulfatase. GNS, is a lysosomal enzyme found in all cells that is involved in the catabolism of heparin, heparan sulfate, and keratan sulfate [123]. It was here expressed in all five cell types with levels between 9 and 32 reads in all cells except MCs where the level is considerably higher with 135 and 270 reads. A similar picture was seen for the next enzyme in this list the B4GALT5, with between 8 and 13 reads in all cells except MCs where the levels are much higher with 129 and 255 reads. B4GALT5, is one out of seven different beta-1,4-galactosyltransferase genes with yet unknown function. GBE1, the gene for the 1,4-alpha-glucan branching enzyme 1 also showed a similar pattern with low expression in lymphocytes and monocytes and higher in MCs with 139 and 151 reads. Highest levels of this enzyme have been found in liver and muscle and mutations in this gene is associated with glycogen storage disease [124]. The syndecan 3 gene, SDC3, is encoding the core protein for a membrane heparan sulfate proteoglycan [125]. This gene is almost exclusively expressed by MCs among these five cell types with 74 and 84 reads. Exostosin like 3 gene, EXTL3, is a glycosyltransferase involved in heparan sulfate (HS) biosynthesis. Mutations in this gene has been found to cause skeletal dysplasia, immune deficiency and developmental delay [126]. It was here also almost exclusively expressed by MCs with 25 and 65 reads and by 5 reads or lower in the other four cell types. EXT1, showed also a similar pattern of expression. The protein encoded by this gene is one out of two endoplasmic reticulum-resident type II transmembrane glycotransferases, the other being EXT2. They are involved in the chain elongation step of heparan sulfate biosynthesis [127]. The gene for glycosyltransferase 1 domain-containing protein 1, GLT1D1, was instead almost exclusively expressed by monocytes with 75 and 103 reads. N-acylglucosamine 2-epimerase is encoded by the RENBP gene. This protein, which catalyzes the interconversion of N-acetylglucosamine to N-acetylmannosamine, was here expressed primarily by monocytes and MCs with between 63 and 99 reads [128]. VCAN, or versican, is a large extracellular matrix proteoglycan that here was expressed exclusively in the monocytes and at relatively high expression level with 140 and 774 reads.
Galectin-2 is a soluble beta-galactoside binding lectin encoded by the LGALS2 gene, that has been found to have an apoptosis inducing effect on activated T cells [129]. It was here expressed exclusively by monocytes a with 88 and 136 reads (Table 12). Galectin 3 is a cytosolic beta-galactoside binding lectin, encoded from the LGALS3 gene, that is involved in membrane repair and autophagic removal of damaged organelles [130]. It was here expressed by monocytes and T cells at medium to low level, and at very high levels in MCs with 679 and 885 reads.
Collectively, these carbohydrate related enzymes show a high expression in MCs compared to most other cell types even if they are also expressed by most other cells.
2.14. Transcript Levels for Other Enzymes
In this section, we have listed a number of enzymes not directly involved in histamine, arachidonic acid metabolism or carbohydrate processing, whose expression, however, showed an interesting profile across the five cell types (Table 13). We start with the CYBB gene, which is encodes the NADPH oxidase 2 (Nox2), also known as cytochrome (b558) subunit beta, a superoxide generating enzyme. It was here expressed at very high levels in monocytes with 725 and 1465 reads at lower levels in B-cells with 134 and 90 reads and was almost absent from T-cells and MCs (Table 13). Arginase type II (ARG2) is an enzyme that catalyzes the hydrolysis of arginine to ornithine and urea. It was here expressed exclusively by MCs, with 47 and 68 reads. It may have role in the regulation of the synthesis of nitric oxide (NO) [131]. PADI2 and PADI4 are two members of the peptidyl arginine deiminase family of enzymes. They convert arginine residues in proteins into citrullines in the presence of calcium ions [132]. PADI2 was expressed in monocytes and MCs at relatively low levels within 47 to 63 reads and PADI4 was here exclusively expressed by monocytes with 98 and 100 reads. Both Nox2 (CYBB) and PADI4 are involved in generation of netosis in neutrophils, to form nets to trap bacteria during infections [133]. We found that both of these enzymes also were present in monocytes. The EPHX2 gene encodes an epoxide hydrolase which converts epoxides to dioles, and was only expressed by T-cells at relatively low levels with between 13 and 50 reads. The heme oxygenase 1 gene, HMOX1, encodes an essential enzyme in the catabolism of heme and plays a key role in iron homeostasis [134]. It was expressed at high levels by monocytes, with 414 and 466 reads and at much lower levels by MCs. The ALAS1 gene encodes an enzyme, the delta-aminolevulinate synthase 1, of importance for the first rate-limiting step in the synthesis of heme [135]. This gene was expressed in all cells although at very different expression levels: very low in monocytes, B- and T-lymphocytes and higher in MCs with 90 and 155 reads. One wonders if heme has a specific function in MCs. The gene SAMHD1 encodes a phosphorylase that has been shown to be of importance for the protection against HIV infection [136]. It showed the highest levels in T-cells, with between 131 and 155 reads, lower in monocytes and MCs and very low in B-cells. The protein encoded by NUDT16 gene plays a role in stabilizing 53BP1 and thereby in the repair of double strand breaks [137]. This gene was expressed at its highest level in monocytes with 104 and 152 reads and much lower in the other four cell types. Monocytes produce oxygen radicals when activated and such radicals can have damaging effects on DNA, which may be the reason why higher levels of this enzyme is needed. ALDH2 is encoding a detoxifying mitochondrial enzyme, an aldehyde dehydrogenase of major importance for alcohol metabolism [138]. It was here expressed at very high level in monocytes with 905 and 1627 reads, much lower in MCs and B-cells and almost absent in T-cells. A similar situation with high levels in monocytes, with 259 and 683 reads, low in B-cells and MCs and almost absent in T-cells, was seen for the next gene the ACSL1, a gene encoding long chain-fatty-acid CoA ligase 1. This is an enzyme that converts free long chain fatty acids into fatty acyl-CoA esters and thereby plays a key role in lipid biosynthesis and fatty acid degradation [139]. The enzyme encoded by the NUDT18 gene can degrade 8-oxo-7, 8-dihydroguanine and thereby take part in the rescue from the mutagenic effect of oxidized nucleosides [140]. As expected, this enzyme was also most highly expressed by monocytes, with 133 and 158 reads, as monocytes use oxygen radicals in the antimicrobial killing. The enzyme 6-phosphogluconate dehydrogenase encoded by the PGD gene catalyzes the oxidative decarboxylation of 6-phosphogluconate into ribose 5-phosphogluconate, generating pentose sugars for nucleic acid synthesis [141]. This enzyme was here expressed by all five cell types but at very much higher levels in monocytes, with 1630 and 3408 reads. The question is why monocytes need approximately 40 times more of this enzyme than other immune cells, especially since they do not typically re-enter the cell cycle. The same question can be asked for the enzyme encoded by the GLUL gene, the glutamate-ammonia ligase, an enzyme that catalyzes the synthesis of glutamine from glutamate and ammonia in an ATP dependent reaction and the enzyme is needed to remove excess ammonia. Transcripts of this gene were present in all five cell types, but 10-times higher in monocytes than in the lymphocytes, and 100-times higher in MCs, with 2816 and 5447 reads in MCs. Why do MCs need such exceptionally high levels of this enzyme?
N-alpha acethyltransferase 10 is encoded by the gene NAA10. This enzyme is bound to the ribosome and acetylates proteins co-translationally, an enzyme found in all kingdoms of life [142]. It was here expressed at 10 times higher levels in monocytes, with 167 and 251 reads, compared to the other four cell types (Table 13).
In contrast to the previous two sections the majority of enzymes in this table showed a high dominance in monocytes and not MCs, which may seem as fitting with their role similar to macrophages in cleaning functions, removing rest products but also in immune functions related to the killing of phagocytosed bacteria and possibly also in netosis mechanisms inhibiting bacteria from spreading.
2.15. Transcript Levels for Transcription Factors
Transcription factors control cell differentiation, but also the response to cell activation by increasing production of cytokines and chemokines, to change expression of cell surface receptors and cell adhesion molecules among many other functions. The expression of transcription factors is therefore highly characteristic for a specific cell lineage and for the state of activation of a cell. We demonstrate that some transcription factors were specific or almost specific for a certain cell type, such as GATA1 and GATA2 for MCs and GATA3 for T-cells (Table 14). We found a relatively large panel of transcription factors that were specifically, or almost specifically, expressed by MCs such as MITF, HES1, HEY1, MEIS2, EPAS1, PTRF, NR4A1, NFE2L3, PBX1, GLI1 and AFF2. Several of the transcription factors has been shown to be essential for the fate of the cell type in which they are expressed. We observed that GATA1, with 105 and 108 reads was expressed at a relatively low levels whereas GATA2 showed very high levels of expression with 2859 and 1421 reads (Table 14). By knock-out experiments GATA2 has been shown to be of central importance for both basophil and MC differentiation and maintenance [143]. It was essential for the expression of several MC-related genes including the high affinity IgE receptor alpha chain, c-kit, for the production of histamine and the expression of the cytokine IL-4 from basophils and IL-13 from MCs. MITF has also previously been shown to be of importance for the expression of MC tryptase and very recently also for the lineage commitment to the MC lineage during hematopoietic differentiation [144]. GATA1 has been shown to be of importance for the expression of tryptase [145]. So both GATA1 and GATA2 are of importance for MC development. What is striking is the large difference in expression levels between some of the factors in cells that we assume is representing a quite homogenous population such as the MCs. It is here GATA2 that is a bit of an odd bird as most of the other MC expressed transcription factors listed above are in the lower range with only a few with more than 500 reads (Table 14). It is unclear why GATA2 need to be at such a high level compared to the other factors? A possible explanation is its involvement is so many of the MC specific genes compared to GATA1, which seem to have a more restricted role in MC development. Interestingly, knocking out only one of the two copies of GATA2 resulted in lack of MCs in mice, indicating that high expression levels is needed for MC differentiation but not for basophils [143]. It should here be noted that GATA1 is not only expressed by MCs but is of key importance for red blood cell development [146]. This is more general situation where most transcription factors are not only involved in the differentiation of one single cell type but take part in the differentiation or more than one cell type.
MITF, the microphtalamia-associated transcription factor was here only detected in MCs, with 195 and 64 reads, and at very low levels in monocytes with 2 and 4 reads (Table 14). MITF is a helix-loop-helix leucine zipper transcription factor involved in the differentiation of melanocytes, osteoclasts and MCs [147]. HES1 was primarily expressed by MCs with 138 and 117 reads and at very low levels in B cells with 8 and 6 reads. HES1 belongs to a helix -loop helix family of transcription factors with seven members that repress transcription [148]. HES1 can also heterodimerize with the next transcription factor in this list HEY1 and has been shown to play a role in both the nervous and digestive systems [148]. HEY1 is also a helix-loop-helix transcriptional repressor that was only expressed by MCs with 86 and 206 reads. This gene was found to be expressed primarily during embryogenesis in mice [149]. MEIS2 is a homeobox gene that was expressed exclusively by MCs, with 193 and 275 reads, but that has previously been found among other activities to suppress myeloid cell development [150]. EPAS1 was also exclusively expressed by MCs with 436 and 835 reads. EPAS1 also known as hypoxia-inducible factor 2-alpha is a hypoxia inducible factor where several alleles contribute to high altitude adaptation in humans [151]. PTRF, also named Cavin-1 is here MC specific, expressed at relatively high levels with 465 and 707 reads. PTRF, has been shown to regulate ribosomal transcription in response to metabolic changes in adipocytes [152]. NR4A1 was primarily expressed by MCs with 147 and 997 reads (Table 13). The protein produced from this gene is involved in the regulation of cell cycle, inflammation and apoptosis and has been shown to play a proinflammatory role in macrophages [153]. Then we have four genes that are (almost) MC specific but expressed at much lower levels, NFE2L3, PBX1, GLI3 and AFF2, with between 18 and 95 reads. NFE2L3 is a leucine zipper transcription factor with still unknown function. PBX1 is a global regulator of embryonic development which has been shown to be essential for lymphoid cell development and to be one of the earliest-acting transcription factors that regulate de novo B-lineage lymphopoiesis but is not needed after the pre-B cell stage [154]. GLI3 belongs to the family of C2H2 zinc finger transcription factors, acting both as negative and positive regulator. GLI3 mutant mice have abnormalities in CNS, lungs and limbs [155,156]. AFF2, an X-linked gene encodes a protein that is not a classical transcription factor but involved in mRNA processing, more precisely in the regulation of alternative splicing [157]. The role of several of these factors have not been analyzed for their role in MCs development and biology, which warrants future studies.
We also found a number of transcription factors that were B-cell specific, some that were T cell specific and a few also which were primarily expressed by monocytes. GATA3 is considered to be specifically expressed by CD4+ T-cells, and particularly important for the development of Th2 cells. However, we detected GATA3 at the same levels in CD8+ cells within the range of 150 and 281 reads (Table 13). (Table 14). GATA3 is also expressed by naïve T cells. FOXP3 a transcription factor that is specific for regulatory T-cells was here expressed at low levels only in the CD4+ T-cells, with 30 and 23 reads (Table 14). Five to 10 % of CD4+ T cells in the circulation have been estimated to be regulatory T-cells, which is why the expression level of FOXP3 in the regulatory T-cells can be estimated to between 150 and 600 reads [158]. TBX21 or T-bet is a transcription factor used as marker for Th1 cells and this transcription factor was expressed at low levels in both CD4+ and CD8+ T-cells at levels between 15 and 78 reads (Table 13) [159]. RORC, a marker for Th17 cells, was here expressed also at very low levels in both CD4+ and CD8+ T cells, at levels between 5 and 17 reads (Table 14) [160]. In line with what was mentioned above concerning the cell type specificity of the majority of transcription factors, RORC also plays an important role in lymphoid organogenesis in particular lymph nodes and Peyer´s patches and may also be involved in regulating circadian rhythms [161]. FOXP3, T-bet, and RORC, were all expressed at relatively low levels with between 10 and 78 reads, most likely primarily due to the fact that they only were expressed by a small subpopulation of these T-cells. Interestingly also is the expression of both GATA3 and T-bet at similar levels in both CD4+ and CD8+ T-cells and that also RORC was expressed in CD8+ T-cells indicating that we have a similar separation into Type 1, Type 2 and Type 17 cells also in CD8+ positive cells as we have in CD4+ cells. It is only FOXP3 that seems exclusively expressed in CD4+ T cells.
We also found a number of transcription factors that are of major importance for B cell development including the two POU domain containing transcription factors, the POU2F2, also named OCT2, and the associated factor POU2AF1. POU2F2 was primarily expressed in B-cells and monocytes, within the range of 240 to 328 reads, but also lower levels in T-cells (Table 14). POU2F2 has been shown to regulate immunoglobulin and IL-6 gene transcription in B-cells [162]. POU2AF1 is an associated factor binding to OCT2 and stabilizing the complex and thereby enhancing transcription [163]. POU2AF1, was here almost B-cell specific with 307 and 435 reads and only 100-fold lower levels in CD4+ T-cells. POU2AF1 is of importance for multiple stages of B-cell development and the knock out shows impaired production of transitional B-cells and defective maturation of recirculating B-cells [164]. A related POU domain containing factor, POU2F1 also named OCT1, was here expressed only at very low levels in all five cell types.
Two other B-cell related genes that belongs to the SP family of transcriptional regulators are the SPI1 (PU1) and SPIB [163]. The SPI1 gene encodes the transcription factor PU.1 which was expressed at a relatively high level in monocytes with 369 and 252 reads and at lower levels in both B-cells and MCs. Humans with mutations in the SPI1 gene lack circulating B-cells and the majority of dendritic cells and the mutations also affect myeloid differentiation [165]. Mice lacking SPI1 (PU.1) die in utero [165]. SPIB expression was here specific for B-cells with 48 and 73 reads. It has been shown to be expressed in plasmacytoid dendritic cell precursors, and to be a negative regulator of T-, B- and NK-cell development [166]. However, in contrast to published data we did not detect expression of this factor in T cells.
Additional factors have been shown to be of major importance for B-cell development or were primarily expressed by B cells are PAX5, AFF3, KHDRBS2, EBF1, E2F5, BACH2 and SETBP1. PAX5, is a member of the paired box family, and a transcription factor of major importance for B cell development [167]. It was here expressed only by B-cells at relatively high levels, with 590 and 707 reads. PAX5 has been shown to be essential for B-cell commitment by suppressing alternative lineage choices [167]. AFF3 is a transcriptional activator that here was also almost B-cell specific with 148 and 125 reads (Table 14). AFF3 deficient mice exhibit low levels of immunoglobulins and appear to regulate class switching by binding to the switch regions and facilitate the recruitment of AID [168]. KHDRBS2 was here also essentially B-cell specific and with an expression level of 212 and 137 reads. KHDRBS2 is not a classical transcription factor but an RNA binding protein with affinity for poly A and poly U tails and is also involved in differential splicing [169]. Early B-cell factor 1 (EBF1) controls the expression of key proteins required for B-cell differentiation and signal transduction [170]. This gene was here almost exclusively expressed by B-cells with 53 and 68 reads. E2F5 belongs to the E2F family of transcription factors which are major regulators of cell proliferation [171]. This gene was expressed primarily in B-cells at a low level with 51 and 67 reads. BACH2 is a transcription factor of major importance for both B- and T-cell development. In B-cells this factor is needed both for early development and during late development during isotype switch and plasma cell development and in T-cells it seems to be of importance for Th2 development [172]. BACH2 was here expressed in both B- and T- cells, with 351 and 392 reads in B-cells and between 12 and 76 reads in T-cells. SETBP1, that has been shown to act as an epigenetic hub and be involved in several hematological malignancies was here expressed primarily in B-cell with 114 and 91 reads [173].
We also identified a few additional transcription factors that were expressed primarily in T-cell, in addition to the ones described further above. LEF1, a member of the T-cell factor/lymphoid enhancer factor family, was expressed at relatively high level and almost exclusively in both CD4+ and CD8+ T-cells at a level between 365 and 632 reads (Table 14). LEF1 has been shown to be essential for T-cell development and to enhance GATA3 expression and thereby to promote Th2 development and also to be essential for innate NK cells and for T-cell development [174]. RNF157 is a ring finger protein that here was primarily expressed by T-cells with between 40 and 56 reads. TCEA3 is a member of the translation elongation factor TFIIS family that here was expressed primarily by T-cells, with 70 to 140 reads (Table 14).
BHLHE40 is a helix loop helix transcription factor that is described as a key regulator of immunity during infection autoimmunity and inflammatory conditions, which here was expressed at very high levels by MCs, with 1449 and 969 reads and at relatively high in the other cell types except for B-cells where the expression was very low (Table 14) [175]. The hematopoietically expressed homeobox protein HHEX is a protein involved in developmental processes. Without the expression of this factor mice die in utero [176]. HHEX was here expressed at a higher level in B cells, with 170 and 173 reads, and lower in monocytes and MCs, but essentially absent in T cells.
A number of transcription factors was expressed in more than one cell type and at various levels. We start with a large group of zinc finger proteins. The human genome contains a number of different families of Zinc finger proteins where the majority belong to the C2H2 type, with two cysteins and two histidines, which coordinates the zinc binding. This class of zinc finger proteins is the second largest gene family in the human genome with estimated 700 members, which only is surpassed by the seven transmembrane receptors with approximately 900 members. The C2H2 zinc finger proteins is a highly evolving family of regulators where the members differ markedly between mouse and man and where we only have started to understand their role in human biology and where many are expressed in multiple cells and at relatively low levels [177,178,179].
We start the analysis of the zinc finger proteins with three members of the IKZF family. IKZF1, (Ikaros), was expressed by all five cell types, but higher in T cells and MCs with 56 to 158 reads. IKZF1, has been shown to be of major importance for early B-cell development and in the function of Th cells, but also of major importance for erythrocyte and granulocyte differentiation [180,181]. IKZF2, (Helios) was expressed in very low levels in B-cells, CD4+ T-cells and MCs, and slightly higher in CD8+ T-cells, with 16 and 12 reads, but not in monocytes. Helios has been shown to be expressed by both CD4+ and CD8+ T-regulatory cells, and to interact with FOXP3 [182]. However, here we primarily detected expression in CD8+ T- cells. IKZF3, (Aiolos) forms heterodimer with Ikaros and it has been described as lymphocyte specific [183]. In agreement, we also found IKZF3 transcripts in the lymphocytes with slightly higher levels in B-cells, with 112 and 183 reads, compared to T-cells and very low levels in MCs (Table 14).
GFI1 is a transcriptional repressor and a zinc finger protein of importance for normal hematopoiesis. It was expressed primarily in T-cells and MCs with between 11 and 116 reads (Table 14)[184]. ZEB1 is a zinc finger and homeodomain transcription factor that here is expressed at relatively low level in four out of these five cell types, but not in monocytes. ZEB1 has been shown to inhibit IL-2 and E-cadherin expression [185]. ZEB2 was in contrast to ZEB1 most highly expressed in monocytes and MCs, with between 236 and 463 reads, and lower in CD8+ T-cells and B-cells and almost absent in CD4+ T-cells (Table 14). ZEB2 is an R-SMAD binding protein involved in neural development [186]. ZEB2 has also been shown to be of major importance for the final development of NK-cells and effector CD8+ T-cells and also for monocytes and plasmacytoid dendritic cells [187].
KLF1 is a C2H2 zinc finger protein that is essential for proper maturation of erythrocytes. KLF1 was not expressed by any of the five cells in this analysis. This was in contrast to KLF4, which is expressed primarily by resting non-dividing cells and its overexpression induces cell cycle arrest [188]. KLF4 was here expressed at very high levels by the freshy isolated MCs, with 1751 and 1041 reads, high levels in monocytes, lower in B-cells, but almost absent in the T cells. Its expression is dramatically down regulated upon in vitro culturing the MCs for 3 weeks to levels below one read ([6] and Supplementary file S1). ZNF385A is not a regular transcription factor but an RNA-binding protein involved in the regulation of cell cycle and apoptosis [189]. It was here expressed primarily in monocytes, with 311 and 269 reads. ZNF467, which here was expressed primarily in monocytes, with 131 and 120 reads, is a C2H2 zinc finger protein involved in gene regulation by augmenting STAT3 activity by keeping it in the nucleus [190]. ZNF513 was here expressed in all five cell types in low except for in monocytes where the levels were approximately 10 times higher in the range of 226 to 271 reads. This zinc finger protein has been shown to be involved in the development and maintenance of the retina [191]. Its role in monocyte-macrophage biology seems unknown. ZNF521 showed only low-level expression in MCs. This gene has been shown to be associated with erythrocyte differentiation through direct binding to GATA1 [192]. To our knowledge its potential role in MC development is not known. ZNF703 is a transcriptional repressor by recruiting histone deacetylases to promoter regions but does not bind directly to DNA [193]. It was here expressed primarily in monocytes, with 74 and 83 reads, and at lower levels in MCs (Table 14). ZNF787 has been found to interact with HDAC1 and to regulate tight junction proteins and thereby affect blood brain barrier function [194]. It was here expressed by monocytes and only and at low level. ZNF827 is a single strand DNA binding protein promoting homologous recombination mediated DNA repair [195]. This gene is here expressed primarily in B and T lymphocytes at low levels. ZNF831 is another C2H2 zinc finger protein with a very similar expression pattern as ZNF827. ZNF831 may act as a transcriptional suppressor and enhancing apoptosis signals by inhibiting expression of STAT3/Bcl2 [196]. ZCCHC24 has been associated with adult-onset severe asthma [197]. This gene was here expressed primarily in MCs with 53 and 65 reads (Table 14). ZMIZ1 has been described as a coactivator of several transcription factors including p53, the androgen receptor and NOTCH1 and to be involved in neural development [198]. It was here expressed by all five cell types but at very much higher levels in monocytes and MCs than in B and T cells, with 2280 and 1103 reads in monocytes and 190 and 300 reads in MCs. CXXC1, being the last member of the zinc finger proteins in this list, is a CXXC type zinc finger protein also being a CpG-binding protein recognizing unmethylated CpG sequences and regulating gene expression [199]. It was expressed at very low levels in all five cell types, however, with higher levels in monocytes, with 76 and 85 reads.
Interferon regulatory factor IRF5 is a transcription factor with diverse roles including virus mediated activation of interferon, and polarizing macrophages into M1 type [200]. It was here expressed at high levels in monocytes, with 444 and 500 reads, lower levels in B cells, even lower in MCs and almost absent in T-cells (Table 14). CCAAT/enhancer binding protein alpha that is encoded by the CEBPA gene has been found to be essential for the development of mature granulocytes and monocytes, and also to impair adipocyte maturation [201]. It was here expressed essentially only by the monocytes with 54 and 96 reads. The protein encoded by the MAFG gene is a leucine zipper containing transcription factor. Mice lacking MAFG show mild neuronal phenotype and mild thrombocytopenia [202]. This gene was here expressed at relatively high levels in monocytes, with 411 and 390 reads, lower levels in MCs and almost absent in the lymphoid cells. ELF3 and VENTX were both essentially only expressed by monocytes and at similar levels within 46 to 76 reads. ELF3 has been shown to be involved in epithelial/mesenchymal transition but its role in monocyte biology seems less well known [203]. VENTX has been found to be primarily expressed by hematopoietic cells and to be involved in both proliferation and differentiation [204]. RUNX2 and MAF also showed a similar expression pattern with low level expression in T cells and MCs. RUNX2 has been described as a master regulator of bone due to its importance in osteoblast differentiation [205]. MAF transcription factors are involved in the development of many different organs and has been indicated to be a regulator of general energy homeostasis [206]. The ETS2 gene encodes C-ETS2 a protein belonging to the ETS family of transcription factors. ETS2 was expressed in all five cells but much higher and variable in monocytes and MCs, with 177 and 206 reads in monocytes and 395 and 9645 reads in MCs.
MYC is involved in stem cell biology and often connected to proliferation and therefore classified as a proto-oncogene [207]. It was here expressed at relatively high levels in all cell types, within the range of 79 to 259 reads, except monocytes which were essentially negative (Table 14). STRBP is a microtubule associated RNA binding protein involved in spermatid formation [208]. It was here expressed essentially only in the lymphoid cells with ten times higher levels in B cells than T cells with 258 and 270 reads in B cells. EIF2AK3 showed and expression profile similar to that of MYC, with expression in all cell types analyzed here except monocytes. EIF2AK3 is an enzyme that phosphorylates the alpha subunit of the translational initiation factor 2, leading to its inactivation and thereby reducing translational initiation. CTDSP1 was expressed at relatively high levels in all the cell types except for the monocytes where the level was very high 6-8 times higher with 1508 and 1675 reads. CTDSP1 is an N terminal domain of RNA polymerase II with phosphatase activity [209]. CCDC9 is an RNA binding protein and most likely a component of the exon junction complex [210]. It was here expressed in all five cell types but 10 times higher in monocytes, with 1118 and 585 reads, compared to the other cell types. The question is why monocytes need this exceptionally high levels of the polymerase component CTDSP1 and the exon intron junction binding protein CCDC9? We may speculate that this is needed for monocytes to be able to rapidly produce the extremely high levels of inflammatory cytokines and chemokines when encountering LPS, as we have seen previously [19]. SCML4 encodes a protein that is predicted to be a histone binding protein and to act as a negative regulator of transcription (NCBI, http://ncbi.nlm.nih.gove). It was here expressed at low levels only in lymphocytes.
The regulation of transcription is complex and many of the transcription factors that are important for a particular cell type can be expressed in many cell types in a non-exclusive manner; factors with broader expression may still be crucial to particular lineages [163].
2.16. Transcript Levels for SOX Members of Regulators of Tissue Development
The SRY related HMG box (SOX) genes constitute a large family of transcriptional regulators of differentiation that has been shown to regulate development of the eye lens, hair follicles, gut, B-cells, muscle and blood vessels, to name just a few [211]. As can be expected, based on their well-established role as regulators of cell fate decisions during early development, the members of the SOX family were almost totally absent in our analysis (Table 15) [211]. Only a few of them such as SOX4, 13, 17 and 18 were expressed at very low levels in MCs and SOX13 also at very low levels in CD8+ T-cells.
2.17. Transcript Levels for STATs
In contrast to many of the other protein families described in this communication the transcript levels for the seven signal transducers and activators of transcription (STATs), showed a relatively even distribution among these five cell types. STATs are important for connecting cytokine receptor triggering with transcriptional activation. They were here expressed at very similar levels in all five cell types, except for STAT4 that was almost T-cell specific (Table 16) [212]. The STATs are cytoplasmic transcription factors that upon phosphorylation by receptor associated kinases dimerize by forming homo- or heterodimers that translocate into the nucleus and act as transcription factors. The STATs are of major importance for many immune cells and their activity are regulated by key interleukins, interferons and other growth and differentiation factors [213]. As mentioned above, STAT4 was in contrast to the other STATs here essentially only expressed in T cells, with between 34 and 77 reads. It has been shown to be of major importance for Th1 differentiation [214].
2.18. Transcript Levels for Cytokines, Chemokines and Other Growth and Differentiation Factors
Cytokines are primarily used in intercellular communication to send a message from one cell to another. In most cases they are therefore silent during nonactivated states but can rapidly be turned on to send out a signal to other cells. As previously mentioned, we recently published a very clear example of this situation in a study of the response to LPS by human blood monocytes [19]. In that study the monocytes rapidly induced the expression of the major inflammatory cytokines and expressed these at very high levels. As an example, IL-6 increased 75000 times within 4 hours of the addition of LPS to the culture medium [19]. In line with this finding, we found that most of the cytokines in this analysis were expressed at very low levels, with the exception of a few cytokines that seemed to be constitutively expressed most likely for due to their functions in tissue homeostasis. Examples of the latter situation included lymphotoxin B, LTB, which was very highly expressed by B and T cells, and leukemia inhibiting factor, LIF, which was exclusively expressed by MCs (Table 17). To these cytokines we can also add one of the macrophage colony stimulating factors, the macrophage colony stimulating factor M-CSF, expressed by MCs and IL32 expressed by T cells, and also two of the chemokines, the CCL2, expressed by MCs and CCL5 expressed by T cells, primarily CD8+ T-cells.
LTB, was highly expressed in B- and T-cells within the range of 784 and 2219 reads and at much lower levels in monocytes, with 17 and 20 reads (Table 17). LTB is involved in promoting lymphoid tissue development and maintenance. It has also been reported to protect the host against pathogenic insults and to regulate the composition of the host microbiota [215]. LIF was expressed only by the MCs and at relatively high levels with 659 and 307 reads (Table 17). LIF is of major importance for stem cells to maintain their multipotency and appear to have non-redundant actions in maternal receptivity to blastocyst implantation, placental formation and in the development of the nervous system [216]. LIF is also preferentially expressed by mouse peritoneal MCs showing that the expression pattern is conserved between different mammals [21].
Tumor necrosis factor alpha (TNF) is an important inflammatory cytokine that was expressed by all five cell types but at relatively low and variable levels. A high individual variation was seen in the CD8+ T cells where one individual showed 63 reads and the second individual 371 reads, indicating that its expression is highly sensitive to external signals similar to what we found for monocyte responses to LPS (Table 17) [19]. TNFSF10 showed a similar pattern as TNF, with expression in all five cell types and at relatively low levels (Table 17). TNFSF10, which also is named TRAIL or CD253, acts as a ligand to induce programmed cell death by binding to TRAILR1 and 2 [217].
Of the three colony stimulating factors we only detected high expression for one namely CSF1, also named the macrophage colony stimulating factor M-CSF, with 1579 and 933 reads in MCs (Table 17). This may indicate that MCs have an important role in maintenance of macrophage tissue homeostasis. A low level of CSF2, also named GM-CSF, was seen in MCs, with 9 and 61 reads, but not in any of the other four cell types (Table 17). Upon in vitro culture for 3 weeks of the MCs, CSF1 levels decrease by approximately 50-70% but the CSF2 levels did instead increase 10-100-fold to between 276 and 799 reads ([6] and Supplementary file S1).
For the majority of the other cytokine genes, including erythropoietin (EPO), IL2, IL3, IL4, IL5, IL9, IL10, IL11, IL19, IL12B, IL17A, IL17F, IL20, IL21, IL22, IL25, IL26, IL28A, IL28B, IL29, IL31, IL34, IL36A, IL36B, IL36G and IL37 we found no or very low levels of expression in any of the five cell types (Table 17). A low or very low level of IL1A was seen in MCs with 4 and 5 reads. IL1B was expressed at very low levels by monocytes and MCs (Table 17). Low levels of both IL6 and IL7 were seen in B cells. IL8 was detected in monocytes and MCs with 32 and 38 reads and 65 and 80 reads, respectively (Table 17). IL13 expression was seen in MCs with 29 and 47 reads, and IL12A in B cells with 24 and 18 reads (Table 17). A low level of IL15 was also detected in B cells, monocytes and both CD4+ and CD8+ T-cells but not in MCs (Table 17). Very low levels were also observed for IL16 and IL17B in MCs and for IL23A and IL24 in both populations of T cells (Table 17). Interestingly, in contrast to the majority of the other interleukins we found very high levels of IL32 mRNA in both CD4+ and CD8+ T-cells, in the range of 1800 to 3500 reads, and much lower levels in MCs (Table 17). IL32 has been shown to have both pro and anti-inflammatory properties, and to be a metabolic regulator and to have a role in antimicrobial host defense. It shows a very low degree of sequence conservation among many mammalian species and is not found in rodents [218]. Transcripts for IL33, an important alarmin, was only observed in MCs and at a very low level with 4 and 2 reads (Table 17).
When it comes to the chemokines we found that MCs, but not any of the other cell types, expressed very high levels of CCL2, with 1518 and 1644 reads (Table 17). CCL2 (alternative name: monocyte chemoattractant protein 1, MCP1), is of importance for recruiting monocytes, memory T-cells and dendritic cells to the sites of inflammation [219]. High levels of this chemokine was also found in mouse peritoneal MCs showing that this pattern of expression is evolutionarily conserved [21]. Low levels of CCL3 was seen in monocytes, CD8+ T-cells and in MCs. Very high levels of CCL5 were observed in CD8+ T-cells, with 1778 and 1157 reads, and at lower levels in CD4+ T-cells (Table 17). In contrast to the above chemokines CXCL16 was more broadly expressed, within the range of 12 to 54 reads, and at higher levels in MCs with 263 and 160 reads. Very low levels of pro-platelet basic protein (PPBP), also named CXCL7, was seen at very low levels in three of the cell types and at high levels, with 154 and 97 reads in monocytes but was not seen in MCs. As described above we observed constitutive expression of some of the chemokines, such as CCL2 in MCs, CCL3 in monocytes, CCL4 in CD8+ T cells and MCs and CCL5 in T-cells (Table 17). One can only speculate about the functions of these constitutively expressed chemokines. A possibility is to maintain a steady state influx of a low numbers of immune cells into a tissue to allow for their rapid responses to inflammatory stimuli. Another question is if they are continuously released or require activation. Recently CCL5 has been shown to be released by CD8+ T-cells upon activation and to contribute to the pathology of primary Sjögren´s syndrome, indicating that activation is of importance at least for T cells [220]. Conversely, substantial baseline release was reported for skin MCs [3].
Among the vascular endothelial growth factors, which are of importance for blood vessel formation, we found a very high level of expression of VEGFA in MCs with 1948 and 1323 reads, and at quite high levels also in monocytes with 222 and 109 reads, but no expression in any of the other cell types. All five cell types express VEGFB but at variable levels. VEGFC was in contrast negative in all cell types.
The thymidine phosphorylase TYMP is not a classical growth factor but an enzyme with a prominent role in angiogenesis similar to VEGFs and therefore listed here. TYMP was expressed in all five cell types but at very different levels, with 574 and 637 reads in monocytes and in the range of 6 to 37 reads in the other four cell types.
Of the three members of the Platelet derived growth factor family, we observed expression only in MCs of PDGFA and PDGFC with 270 and 366 reads for PDGFA and 17 and 20 treads for PDGFC (Table 17). VEGFs and PDGFs are closely related and form a separate gene family named the VEGF/PDGF family.
GDF15 also named macrophage inhibitory cytokine 1 (MIC-1), belongs to the transforming growth factor beta family. Its function is not fully clear but seems to have a role in injured tissues and there in regulating inflammation, cell survival, proliferation and apoptosis [221]. GDF15 was here expressed primarily in MCs with 136 and 27 reads. Transforming growth factor A (TGFA) was only expressed by MCs and at a relatively low level. TGFB1I1 was also essentially MC-specific with expression levels of 137 and 149 reads. Studies suggests that TGFB1I1 is involved in an array of different functions including cell growth, proliferation, migration, differentiation and senescence and to be located primarily at focal adhesion points [222]. ADM is a gene encoding adrenomedullin. This gene was basically only expressed by monocytes and MCs within the range of 50 to 140 reads. ADM knock out is embryonically lethal and haploinsufficiency of its receptor has been shown to cause reduced fertility, hyperprolactinemia, skeletal abnormalities and endocrine abnormalities in mice [223]. Platelet factor 4 (PF4), also known as CXCL4 was here almost exclusively expressed by monocytes with 122 and 64 reads. PF4 is known to be produced by platelets and macrophages and released from alpha granules from platelets, but our findings suggest that it is also produced by resting monocytes. It is chemotactic for neutrophils and fibroblasts and has high affinity to various glucosaminoglycans (GAGs), including heparin and it promotes leucocyte adhesion to endothelium [224]. EGF-like module-containing mucin-like hormone receptor-like 2 also known as CD312 or EMR2 has been shown to be expressed by monocytes /macrophages and all granulocytes, which fits our data where it was expressed at high levels in monocytes and MCs within the range of 150 to 400 reads [225]. Ligation of EMR2 by antibodies promotes neutrophil and macrophage effector functions indicating a role in potentiating inflammation [226]. The fibroblast growth factor binding protein 2 (FGFBP2) was here expressed exclusively in CD8+ T-cells and at relatively high levels with 66 and 118 reads. In the human protein atlas (www.proteinatlas.org) it was also found to be expressed primarily by CD8+ T-cells and NK-cells among different immune cells. Its function seems still to be relatively unknown.
The expression of cytokines and chemokines are similarly to the transcription factors also very complex with some being expressed at high steady state levels and other only after activation. The question of the ones being expressed at high steady state levels is if they are released directly after synthesis for more general tissue maintenance purposes.
2.19. Transcript Levels for Cytokine Induced Proteins
We also observed a number of genes that are known to be induced by various cytokines including TNFAIP2 and 3, TGFBI and IFITM1 (Table 18). They have most likely several different roles in tissue homeostasis.
The full function of TNFAIP2, the primary response gene of TNF-α, is not known but it may have a role as regulator of cell proliferation and migration [227] (Table 18). It was here expressed primarily in monocytes at a high level, with 697 and 483 reads, and at a much lower level in MCs, with 44 and 58 reads. TNFAIP3, is a zinc finger protein and a deubiquitinating enzyme that has been shown to inhibit NFκB activation [228]. Knock out experiments have shown that TNFAIP3 is critical for limiting endotoxin and TNF induced NFκB responses [228]. This gene was here expressed at very high levels in T cells and MCs, with between 189 and 5148 reads, and at lower levels in monocytes and B cells (Table 18). Transforming growth factor beta induced (TGFBI) is a 68kDa protein that binds type I, II and IV collagens and regulate cell adhesion and serves a ligand for several integrins through its RGD motif [229]. TGFBI was here primarily expressed by monocytes with 380 and 244 reads. The gene encoding interferon induced membrane protein 1(IFTIM1) was here expressed in all five cell types but at considerably higher levels in both CD4+ and CD8+ T cells with levels between 475 and 713 reads. The proteins encoded by members of this small gene family are involved in the control of cell proliferation, promotion of homotypic cell adhesion, protection against viral infection, promotion of bone matrix maturation and mineralization, and germ cell development [230].
2.20. Transcript Levels for the Major Cytokine and Chemokine Receptors
To respond to the messages sent by different cytokines and chemokines cells need to express the corresponding receptors. By evaluating the expression of such receptors we found a highly selective pattern, which is logic as only some cells are supposed to respond to a particular cytokine or chemokine. These receptors are also typically expressed at relatively low levels, but with several exceptions to this rule, where the cytokine and its receptor most likely have functions related to tissue maintenance. One such exception is KIT the receptor for stem cell factor (SCF). KIT and SCF are central for the development of MCs and among the cells in this analysis KIT was highly expressed only by MCs, with 1023 and 458 reads (Table 19). Two other receptors showed a similar MC-specific expression pattern. These were the receptors for erythropoietin (EPO) and IL-33, EPOR and IL1RL1 (9). They were expressed in MCs with 105 and 35, and 125 and 289 reads, respectively. Very low levels were detected of the IL-1 receptor, IL1R1 in MCs and of the IL1R2 in monocytes and MCs. A complex pattern was seen for the different components of the IL-2 receptor. The alpha chain IL2RA was expressed at low levels in B-cells, CD4+ T-cells and MCs, whereas the beta chain IL2RB was relatively highly expressed in CD4+ and CD8+ T-cells only, with between 148 and 316 reads, and the gamma chain IL2RG was expressed in all five cell types, but with much higher levels in T-cells. The IL-3 receptor IL3RA was expressed at very low levels in monocytes and MCs, and at variable levels in the three other cell types. The very high level in one of the B cell samples is questionable, which is why we have marked it with a question mark. Interestingly, the IL-4 receptor IL4R was highly to very highly expressed in all five cell types, with reads reaching almost 1200 reads in one of the CD4+ T-cell samples. This is contradicting to a previous transcriptomic study where this receptor was primarily expressed by CD19+ B-cells [231]. The IL-5 receptor IL5RA was here only detected in MCs and at low levels. The IL-6 receptor IL6RA was expressed in all cells, except the B-cells, at varying and relatively low levels in the range of 6-98 reads. The IL-7 receptor IL7R was very highly expressed in both CD4+ and CD8+ T-cells, with between 390 and 762 reads and very low in MCs. The IL-9 receptor IL9R was expressed only in MCs and at very low levels. The IL-10 receptor alpha chain IL10RA was relatively highly expressed in the lymphocytes and the monocytes within the range of 167 to 334 reads. The IL10RB and the IL-11 receptor IL11RA were expressed at very low level in all five cell types. IL12RB1 was expressed at very low levels ranging from 3 to 14 reads, except MCs which was negative. The second IL-12 receptor IL12RB2, was only expressed at very low levels, with 1 to 3 reads in T-cells. Of the two IL-13 receptors, IL13RA1 and IL13RA2, only one was expressed at very low levels in B-cells, monocytes and MCs. The IL-15 receptor IL15R was expressed in all cell types at very low levels except monocytes with 35 and 45 reads. The IL-16 receptor is CD4 which has been described in previous sections. The different IL-17 receptors showed very different patterns of expression. IL17RA was expressed in all cell types with slightly higher levels in monocytes with 160 and 96 reads. IL17RB was negative in all cell types, IL17RC was expressed only at very low levels in monocytes and MCs, and IL17D only at very low levels in MCs. IL17RE was only expressed at very low levels in T-cells. The IL-18 receptor IL18R1 was expressed in T-cells and MCs, but at much higher levels in MCs than in T-cells with 280 and 216 reads in MCs. The two receptor subunits for IL-20, IL20RA and IL20RB, were essentially negative for all five cell types. The IL-21 receptor, IL21R, was expressed at low levels in B-cells and T-cells with expression in the range of 7 to 30 reads. The IL22 receptor subunits, IL22RA and IL22RB, and the IL-23 receptor, IL23R, were all negative. In contrast the IL-27 receptor, IL27RA, was expressed in all five cell types, but at relatively low levels. Both the IL-28 receptor, IL28RA, and the IL-31 receptor, IL31RA were negative in all cell types.
We also analyzed the expression of the receptors for the colony stimulating factors, G-CSF, M-CSF and GM-CSF. The expression of CSF1R, the receptor for macrophage colony stimulating factor (M-CSF) was expressed essentially only by the monocytes with 226 and 210 reads. The CSF2RA, which is the alpha subunit of the granulocyte macrophage colony stimulating factor (GM-CSF) was also expressed primarily in monocytes with 83 and 63 reads, but also at lower levels in MCs with 14 and 6 reads. The beta chain of the GM-CSF receptor (CSF2RB), was expressed at relatively high levels by both monocytes and MCs with expression levels in the range of 300 to 500 reads and at lower levels in B-cells. CSF3R, the receptor for granulocyte colony stimulating factor (G-CSF), was almost exclusively expressed by monocytes and at a very high level with 2682 and 2117 reads. The expression of the M-CSF receptor by monocytes make sense as it is the receptor that regulates their proliferative response [232]. In contrast, the extremely high levels of the G-CSF receptor were less expected. It is essential for granulocyte proliferation and differentiation but has also been found to be highly expressed by human macrophages in a large analysis of the human proteome (proteinatlas.org).
Several of the tumor necrosis factor receptor super family receptors were differentially expressed among these five cell types. Two were almost B-cell specific and two that were almost MC-specific, TNFRSF13B and C and TNFRSF9 and 21 respectively (Table 19). TNFRSF13B has been shown to play a very important role in B-cell development by controlling T cell-independent B-cell antibody responses, isotype switching, and B-cell homeostasis by binding APRIL, BAFF and CAML [233,234,235]. This receptor was exclusively expressed by B-cells with 93 and 55 reads. TNFRSF13C, also named BAFF-R or BR3, is a receptor for BAFF, which is an essential factor for B-cell maturation and survival [236]. This receptor was here also almost exclusively expressed by B-cells with 478 and 308 reads. The TNFRSF9, also named CD137, is a costimulatory molecule functioning to stimulate T cell proliferation, dendritic cell maturation, and promotion of antibody secretion, but is also described as a checkpoint inhibitor [237]. This receptor was here almost exclusively expressed by MCs with 159 and 351 reads. TNFRSF9 has been described as being expressed primarily on activated T-cells. Here it showed a very low expression level in T cells, with 1 and 2 reads, indicating that almost all T cell in this analysis were resting T-cells. Interestingly, the role of TNFRSF9 in MC function is less well known. However, it has been shown to be upregulated on MCs in response to an interaction with tumor cells [238]. TNFRSF21, also named death receptor 6 (DR6) interacts with TRADD and knock out experiments have indicated that this protein plays a role in T helper cell activation, and may be involved in inflammation and immune regulation [239]. This receptor was almost exclusively expressed by MCs with 292 and 226 reads.
The lymphotoxin beta receptor LTBR, also known as the TNFRSF3 can induce IL-8 secretion, in apoptosis and in the development of secondary lymphoid organs [240]. This receptor was expressed only by monocytes and MCs with 198 and 146 reads and 74 and 65 reads, respectively. This receptor was not expressed by B- and T-cells, which are the major producers of the ligand (lymphotoxin), indicating a direct communication between lymphocytes and monocytes and MCs by this cytokine (Table 19). The transforming growth factor beta receptor 3 (TGFBR3) was expressed by both T cells and MCs, with between 50 and 182 reads in T cells and 22 and 29 reads in MCs. The activin receptor ACVR1B was expressed in all cell at low level but slightly higher in monocytes and MCs. Activin belongs to the TGF-beta family of growth factors.
Some of the chemokine receptors were also differentially expressed among these five cell types. CXCR4 was highly expressed by B and T cells, with levels in the range of 180 to 1200 reads, and it was expressed at much lower levels in monocytes and MCs (Table 19). CXCR4 is the receptor for CXCL12 which acts as a strong attractant for lymphocytes and has also an essential role in homing of hematopoietic stem cells to the bone marrow, in cell migration during inflammation, in the establishment of functional lymphoid microenvironments and in organogenesis [241,242]. CXCR5, a receptor for CXCL13, has been shown to be essential for B-cell migration to the B-cell areas within the spleen and lymph nodes [243,244]. This receptor was here only expressed by B-cells with 126 and 136 reads and at 10 times lower level in CD4+ T-cells. CCR6 is a receptor for CCL20, also named MIP-3 alpha. This receptor binds only CCL20, which is relatively unique compared to other chemokine receptors, which often bind several ligands [245]. This receptor is here only expressed by T-cells with low expression levels. The CCR6 -CCL20 chemokine receptor pair has been shown to be important for B-lineage maturation and antigen driven B-cell differentiation but also for the recruitment of Th17 and T-reg cells during inflammatory responses [246]. We could however only detect mRNA for this receptor in T-cells and not in B-cells, in contrast to previous findings [245]. CCR7 is a receptor for both CCL19 and CCL21 and its main function is to guide immune cells to different organs such as lymph nodes, and also to promote the development of T-cells in the thymus and of CD8+ T-cell function in the spleen during infection [247,248]. This receptor was expressed by both B- and T-cells with between 52 and 286 reads and at very low level in MCs with 6 and 8 reads.
Cytokine receptor like 2 (CRLF2) forms complexes with the IL-7 receptor alpha chain and binds TSLP, an early alarmin [249,250]. This receptor has been detected on many cell types but was in our analysis expressed exclusively and at high level by MCs, with 194 and 427 reads. NFAT activating protein with ITAM motif 1 (NFAM1), is a receptor that has been reported to be involved in B-cell signaling and development [251]. However, we found no expression of this gene in B-cells but in monocytes with 700 and 705 reads and at very low levels in MCs, which is in line with a more recent study showing effects by this receptor on monocyte cytokine production [251].
Platelet activating factor receptor (PTAFR) was in this analysis expressed only at very low levels in monocytes with 6 and 10 reads and in MCs with 53 and 25 reads.
2.21. Transcript Levels for Other Receptors
Among other cell surface receptors, the ATP receptor P2RX5 was expressed at very high levels in B-cells with 658 and 1081 reads, and much lower levels in T-cells and monocytes and was absent in MCs (Table 20). This receptor has been shown to be of major importance for osteoclasts and in inflammatory bone loss but its role in B-cell biology seems less well characterized [252]. Mice lacking this receptor also show defects in inflammasome activation and increased sensitivity to Listeria infection [253]. The receptor for adiponectin, ADIPOR2, was weakly expressed in all cells, while MCs displayed higher levels, with 48 and 101 reads (Table 20. This receptor is primarily expressed by the liver and regulate glucose levels and fatty acid breakdown but its role in MCs have to our knowledge not been investigated [254]. The estrogen related receptor alpha ESRRA, is an orphan nuclear receptor, with no ligand yet identified. It is involved in regulating fat metabolism and absorption [255]. This gene was primarily expressed by the monocytes with 450 and 224 reads, and at very low levels in the other cell types. The beta-2 adrenergic receptor ADRB2, is a G-coupled receptor (GPCR) for epinephrine (adrenalin), and activates cells via adenylate signaling [256]. This receptor was expressed at low levels in all cell types, however, the highest levels were seen in CD8+ T cells and MCs with 73 and 205 reads, and 561 and 590 reads, respectively. Downregulation of ADRB2 is associated with asthma, obesity and type 2 diabetes [257].
The cannabinoid receptor type 2 (CNR2), which also is a GPCR, was expressed essentially only by B-cells with 39 and 60 reads and at very low levels in CD8+ T-cells (Table 20). This receptor has been shown to have immunoregulatory function and to be localized to monocytes, macrophages, B-cells and T-cells, but as shown in Table 20, we primarily found it in B-cells and not in monocytes, CD4+ T-cells or MCs [258]. CNRIP1 is a cannabinoid receptor interacting protein that here was exclusively expressed by MCs. Retinoic X receptor alpha (RXRA), is a receptor for retinoids and acts as a transcription factor for genes involved in lipid metabolism [259]. It showed low level expression in some of the cell types but very high in monocytes with 1420 and 1336 reads and also relatively high in MCs with 181 and 109 reads. Neurophilin 2, NRP2, is a member of the neurophilin family of receptor proteins, that has been reported to bind a large number of ligands including VEGF members and integrins and to be involved in multiple processes including cardiovascular development and inflammation [260]. This protein was almost exclusively expressed in MCs, with 87 and 132 reads. LRPAP1 is a chaperone that is involved in the trafficking of low-density lipoprotein (LDL) receptor family members [261]. It was expressed at high levels in monocytes (813 and 1307 reads) and at medium levels in the other cells.
Then we have a number of GPCRs of which GPR18 was expressed in both B- and T-cells within an expression range of 23 to 87 reads (Table 20). GPR56 was expressed only in CD8 positive T cells with 189 and 162 reads, GPR141 only in MCs with 80 and 79 reads, and GPR174 only in B- and T-lymphocytes with 76 to 156 reads. The GPR18 is a receptor for N-arachidonyl glycyl an endogenous lipid neurotransmitter with effects on microglial migration and of resolvin (RvD2) both with effects on resolution of an inflammatory response [262]. GPR174 has been shown to be a receptor for lysophosphatidylserine and has previously also been associated with Hypertensive Retinopathy [263,264]. GPR56/ADGRG1 is a member of the adhesion GPCR family, which in addition to several tissues has been shown to be a marker for CD8+ T-cells and a subgroup of NK-cells [265]. Finally, GPR141, is a member of the rhodopsin family of GPCRs, with unknown function [266]. The neuronal pentraxin receptor, NPTXR, was expressed at low levels only in the T-cells. This receptor is thought to mediate neuronal uptake of synaptic material but its role in T-cell biology is not known [267]. The MAS1L gene is encoding a GPCR that has been described as an oncogene [268]. It was here expressed exclusively in MCs with 26 and 174 reads.
We assessed two receptors for histamine, HRH2 and HRH4. HRH2 was only expressed at very low levels, with 5 and 4 reads in monocytes and HRH4 only in MCs with 27 and 7 reads (Table 20). HRH4 has been shown to be exclusively expressed by MCs also in the mouse [21]. The endothelin receptor B, EDNRB, which also is a GPCR, was only expressed in MCs with 101 and 63 reads (Table 20). This receptor, which is regulated by the transcription factor MITF, has a role in migration of melanocyte and enteric neuron precursors and a homozygous mutation in this gene in horses causes Lethal White Syndrome [269].
Dopamine receptors have a number of functions not only in the nervous system but also on immune cells [270]. Dopamine receptor D2, DRD2, which is a GPCR, is the main receptor for most antipsychotic drugs [271]. It was among these five cell types expressed only in MCs and at relatively low levels with 35 and 19 reads. In contrast, DRD5 was only expressed by monocytes and at relatively low level with 33 and 18 reads. AMHR2 is the anti-Müllerian hormone receptor type 2, a receptor for this hormone and for testosterone and involved in sex differentiation. This receptor is responsible for the regression of the Müllerian ducts in mammalian fetuses during male differentiation [272]. It was expressed only by MCs with 59 and 26 reads. ADORA3 is a GPCR for adenosine, that may be involved in inhibiting neutrophil degranulation and an antagonist to this receptor may have a therapeutic potential in bronchial asthma [273]. This receptor was expressed only by MCs and at a very low level. STAB1 is the gene for stabilin-1, a protein that may act as a scavenger receptor, and has been shown to be expressed primarily on sinusoidal endothelial cells of the liver, spleen and lymph node [274]. We found relatively high levels of STAB1 in monocytes with 159 and 192 reads and lower levels in MCs. GPBAR1, is a GPCR for bile salts implicated in the suppression of macrophage functions [275]. It was here expressed only at low levels in monocytes. PTGIR is the prostacyclin or prostaglandin I2 receptor and the activation of this receptor results in potent vasodilation [276]. This receptor was only expressed by monocytes and at relatively low level with 36 and 55 reads. LDLR is the low-density lipoprotein receptor which mediates the endocytosis of cholesterol-rich LDL. This receptor was expressed by all cells except the B cells and higher in monocytes and MCs, in the range of 78 to 535 reads, than in T cells. LRP1 is the low-density lipoprotein receptor-related protein 1 also known as alpha-2-macroglobulin receptor (A2MR) or the apolipoprotein E receptor (APOER). This receptor was almost exclusively expressed by monocytes and there at high levels with 424 and 841 reads. It is involved in numerous cellular processes including lipoprotein metabolism, clearance of matrix proteinases and cell motility [277,278,279]. APOBR is the apolipoprotein B receptor that binds to apolipoprotein B48 of dietary triglyceride-rich lipoproteins [280]. It was similar to LDLR, expressed by all of the cells in this analysis except B cells, and was highest in monocytes. VDR is the vitamin D receptor, also known as the calcitriol receptor [281]. It was a member of the nuclear receptor family of transcription factors, and is involved in a number of metabolic processes and downstream target genes include several genes involved in bone metabolism [282]. It was primarily expressed by monocytes, with 222 and 128 reads and at lower levels in MCs. Frizzled-1 and Frizzled-5 are encoded by the genes FDZ1 and FDZ5, which both are receptors for Wnt signaling, and both were expressed at low levels in both monocytes and MCs. The scavenger receptor SCARF1 was here found only in monocytes and MCs at a relatively low level of expression with 42 and 27 reads and 22 and 21 reads, respectively. This receptor is involved in the clearance of a number of molecules including acetylated low-density lipoprotein, heat shock proteins, calreticulin and apoptotic cells [283]. TSPAN4 showed a similar expression pattern as SCARF1 with expression essentially only in monocytes and MCs. TSPAN4 is a member of the transmembrane 4 superfamily, that is involved in regulating cell development, activation, growth and motility and is known to complex with integrins and other members of the transmembrane 4 superfamily [284]. It has recently also been shown to be involved in the formation of migrasomes, a newly discovered cell organelle formed by local swelling of retraction fibers [285]. MCOLN1 is encoding mucolipin-1, a receptor that transports iron ions across the endosome/lysosome membrane and that is a transmembrane protein important for lysosome function and vesicular trafficking, exocytosis and autophagy [286,287]. This gene was likewise expressed primarily in monocytes, with 227 and 133 reads. The plexin-B2 gene PLXNB2 was expressed at high levels in monocytes with 898 and 473 reads and at lower levels in MCs. This protein is essential for normal differentiation and migration of neuronal cells but little is known about its function in monocytes [288]. TRPM2 was also almost exclusively expressed in monocytes and at relatively high levels with 324 and 243 reads. TRPM2 is a non-selective calcium-permeable cation channel that is associated with a number of autoinflammatory and metabolic diseases and has also been shown to mediate induction of chemokine production in monocytes [289,290].
2.22. Transcript Levels for Calcium, Chloride and Potassium Channels and Transporters
A number of ion channels and transporters were found to be differentially expressed in the five cell populations (Table 21). These channels and transporters functions as gateways for charged ions that cannot freely diffuse across lipid membranes. They are involved in a number of different physiological processes including the regulation of ion homeostasis, but they can also act as regulators of for example Ca2+ that act as second messenger for granule release by MCs. CACNA2D1 and CACNA2D2 are two voltage dependent calcium channels (Table 21). CACNA2D1 was here only expressed at low level in MCs, with 35 and 43 reads, whereas CACNA2D2 was expressed at low levels in both CD8+ T-cells and MCs, within a range of 25 to 84 reads (Table 21). KCTD12 is a BTB/POZ domain protein and a potassium channel that has been shown to be an auxiliary receptor to the GABA-B receptor [291]. We found expression of this receptor primarily in monocytes at relatively high level, with 155 and 269 reads. KCNA3 is a voltage dependent potassium channel that has been shown to have an essential role in T cell proliferation and activation [292]. This channel was here as expected expressed by T cells, within a range of 107 to 263 reads, but also at slightly lower levels in B-cells. KCNH8 is another voltage gated potassium channel that is expressed in the central nervous system. It was expressed at relatively low levels in B-cells, with 47 and 71 reads [293]. ATP1B1 is the gene encoding the sodium/potassium-transporting ATPase beta-subunit. This is an enzyme that is responsible for establishing and maintaining the electrochemical gradients of sodium and potassium ions across the plasma membrane [294]. We found expression of this enzyme at very low levels in all cell except for MCs where the expression was much higher with 187 and 204 reads. The TTYH3 gene has been reported to encode a Ca2+ and cell volume regulated anion channel, however conclusive evidence seems still to be lacking for this function [295]. This gene was expressed at high levels in monocytes with between 500 and 900 reads and at much lower levels in B-cells and MCs (Table 21). FXYD6 belongs to a family of ion transport regulators that likely affects the activity of sodium/potassium ATPases [296]. This gene was primarily expressed in monocytes with 60 to 127 reads and at lower levels in MCs.
2.23. Transcript Levels for Angiogenesis Inhibitors and Promoters
In this screening we looked at the expression levels of two proteins, VSAH1 and ENG, that are involved in angiogenesis, but do not belonging to the VEGF family (Table 22). The VSAH1 gene encodes vasohibin an endothelium-derived negative feedback regulator of angiogenesis [297]. This protein was here expressed by monocytes at low levels, with 31 and 47 reads and at very low levels by T-cells. The ENG gene encodes the protein endoglin that is a type I membrane glycoprotein that has been shown to have a role in the development of the cardiovascular system and in vascular remodeling. Knockout of ENG results in death of mice due to cardiovascular abnormalities [298]. This gene showed a low-level expression primarily in monocytes and MCs, with 113 and 178 reads in MCs.
2.24. Transcript Levels for the Sialic Acid-Binding Ig-Lectin Family Members (Siglecs)
Sialic acid has several important regulatory functions and there are numerous proteins that bind sialic acid moieties. The major family of sialic acid binding proteins is the sialic acid-Ig-lectin family, the SIGLECs. We have here summarized the expression levels of 15 members of this family in the five cell types. No expression of SIGLEC1 was seen in any of the five cell types and very low level of SIGLEC4 (also named MAG) was observed only in MCs with 3 and 7 reads (Table 23). SIGLEC2, also named CD22, and SIGLC3 also named CD33 have been described previously in Table 5. SIGLEC2, was expressed primarily in B-cells but also by MCs with 737 and 655 reads for B-cells and 146 and 110 reads for MCs. SIGLEC3 was expressed exclusively by monocytes and MCs at relatively low levels with between 28 and 83 reads. SIGLEC3 has been described as myeloid specific with a function in inhibiting phagocytosis [299]. SIGLEC5, also named CD170, was expressed primarily in monocytes with 47 and 58 reads but also at low levels in B cells and MCs (Table 23). SIGLEC5 binds to linked sialic acid and also lipid compounds and has been shown to have a role in inhibiting the activation of human monocytes [300,301]. An important paralog of SIGLEC5 is SIGLEC14 which had a very similar expression pattern with a minor difference by a higher expression in B cells [302]. SIGLEC6 was almost exclusively expressed by MCs, with 484 and 289 reads, and at very low level by B-cells (Table 23). Its expression on the surface of MCs has been shown previously at the protein level but no physiological ligand to this protein with connection to MCs has been identified and it does not appear to be dependent on the glycolyl group of sialic acid [303,304]. SIGLEC7, or CD328 was produced only at low levels in monocytes with 15 and 32 reads and even lower in MCs with 6 and 5 reads. SIGLEC7 binds linked sialic acid and also di-sialo-gangliosides and is predicted to have an inhibitory role in immunity, primarily on NK-cells and monocytes [305]. SIGLEC7 is a paralog of SIGLEC9 which shows a very similar expression pattern with medium expression in monocytes with 70 and 70 reads and lower in MCs. Very little is known about the function of this molecule. SIGLEC8 was expressed in MCs with 129 and 33 reads. This is in line with previous studies where it has been shown to be expressed almost exclusively by eosinophils and MCs and to a lower extent on basophils [306]. The ligand to SIGLEC8 has not been determined but it binds strongly to 6-sulfo-sialyl Lewis X and crosslinking of SIGLEC8 has been shown to inhibit the release of prostaglandin D2 and histamine by MCs [307]. SIGLEC10 and 11 showed very similar pattern with between 90 to 130 reads in monocytes, and lower in B cells. They are paralogs that both bind alpha linked sialic acid residues and both have a cytoplasmic immune cell tyrosine-based inhibitory motif (ITIM) and at least SIGLEC10 may have an inhibitory function in controlling the response to danger associated molecular patterns (DAMPS) [308]. SIGLECs 12, 15 and 16 were essentially negative in all five cell populations of this study.
2.25. Transcript Levels for S100 Proteins
The members of the relatively large family of S100 proteins contain a calcium binding motif. This family includes more than 20 members where the encoded proteins are located in the cytoplasm or nucleus of a wide range of cells [309]. They are only found in vertebrates and are involved in regulation of proliferation, differentiation, apoptosis, Ca2+homeostasis, energy metabolism, inflammation and migration/invasion through interactions with a variety of target proteins [310].
S100A4 was expressed in all five cell types and at relatively high levels, within a range of 147 to 1189, except for in B-cells where we see a lower level of expression (Table 24). S100A4 has been shown to interact with another member of this family namely S100A1 [311]. S100A6 showed an almost identical pattern of expression as S100A4, with only slightly lower expression levels. S100A6 interacts with a number of molecules in a calcium-dependent manner and has been indicated to take part in a number of cellular processes [312]. Both S100A8 and S100A9 were here essentially monocyte specific and expressed at a very high level, in the range of 600 to 3600 reads (Table 24). They have been shown to be expressed constitutively in monocytes and neutrophils and to act as calcium sensors participating in cytoskeletal rearrangements and arachidonic acid metabolism [313]. S100A10 showed an expression pattern very similar to S100A4 and S100A6 with relatively high expression in all cells except in B-cells where the expression level was lower. S100A10 is unique among the S100 proteins in that it does not bind calcium. However, it has been shown to interact with a number of other molecules and to have several intracellular functions similar to other members of this family; it primarily seems to exist in a heterotetrameric complex with annexin A2 [309]. Expression of S100Z was only detected in monocytes within a range of 30-40 reads.
S100A11 showed low level expression in monocytes and T-cells and much higher levels in MCs within the range of 300 to 750 reads, whereas S100A12 was exclusively expressed by monocytes and in the range of 250 reads. S100A11 has been implicated in vesicular transport and membrane and cytoskeletal dynamics, and it interacts with a number of proteins including tubulin, actin, intermediate filaments and annexin I and II [314,315,316]. S100A12 has been shown to be expressed and secreted primarily by neutrophils and to have cytokine like activity, to interact with the receptor for advanced glycosylation end products (RAGE) and plays a role in pro-inflammatory reactions [317].
2.26. Transcript Levels for Cell Adhesion Molecules and Other Membrane Proteins
Cell adhesion molecules are essential for organ formation, cell migration and many other cellular processes and there are several large gene families of such molecules. One of them comprises integrins, of which we here list the expression levels of 20 members (Table 25). Some integrins were relatively highly expressed in all five cell types such as ITGB1 with expression levels varying between 82 and 331 reads, whereas others are totally absent such as ITGB5, ITGB6, ITGB8, ITGA2, ITGA7 and ITGA8 (Table 25). ITGB2 was very highly expressed in monocytes with 1079 and 1024 reads, and very high also in both CD4+ and CD8+ T-cells with 349 to 996 reads, lower in B-cells with 137 and 120 reads, and very low in MCs with 10 and 7 reads (Table 25). In contrast, ITGB3 was primarily expressed by MCs but at low level with 23 and 34 reads (Table 25). ITGB4 was only expressed at very low levels by MCs whereas ITGB7 was expressed only by B- and T-cells with between 16 and 71 reads (Table 25). ITGA1 was only seen in T cells and at very low levels (Table 25). ITGA3 was expressed primarily in MCs with 75 and 98 reads and much lower in the lymphocytes. ITGA4 was instead expressed at relatively high levels in all five cell types with between 71 and 257 in lymphocytes and monocytes. ITGA5 was most highly expressed in monocytes and MCs with between 162 and 447 reads, lower in T-cells and almost absent in B-cells. ITGA6 was most highly expressed by CD4+ T-cells with 106 and 135 reads, lower in CD8+ T-cells and MCs and absent in both B-cells and monocytes. ITGA9 was detected only in MCs with 127 and 148 reads and ITGAL showed the opposite pattern by being expressed at high levels in all cells except MCs. ITGAM showed expression primarily in monocytes with 387 and 292 reads and lower in MCs with 146 and 108 reads. ITGAV was also essentially only expressed by MCs with 29 and 148 reads. Finally, ITGAX was found to be expressed essentially only by monocytes and MCs with between 84 and 231 reads. We observed a very large variability in the expression of integrins in this study. Since the expression level of integrins can change quite markedly by activation, it is vital to handle the cells very carefully upon purification to obtain information concerning their true in vivo expression profile.
Another family of cell adhesion molecules is the intercellular adhesion molecules the ICAMs, which belong to the immunoglobulin superfamily of proteins. Most of them were expressed at relatively low levels, with ICAM1 at very low levels primarily in monocytes and MCs (Table 25). ICAM2 was instead broadly expressed but also at relatively low levels within the range of 13 to 82 reads (Table 25). ICAM3 is also relatively broadly expressed, in the range of 42 to 278 reads, except for being absent in MCs. (Table 22). Both ICAM4 and 5 were only expressed at very low level in monocytes and MCs (Table 25).
The focal adhesion protein paxillin, encoded by the PXN gene, is a signal transduction adaptor protein that interacts directly with the cytoplasmic tail of beta integrins [318]. PXN was expressed by all five cell types with between 127 and 405 reads in T-cells and MCs lower in monocytes and at very low levels in B-cells. The P selectin gene SELP was almost totally absent in all five cell types with expression levels not exceeding 3 reads (Table 25). In contrast its ligand SELPLG was relatively highly expressed by monocytes, T-cells and MCs, within the range of 21 to 192 reads and almost absent in B cells. This adhesion protein is of major importance for the interaction of immune cells with blood vessel endothelium and platelets which at inflammatory conditions express the P and E selectin [319]. The gene CELSR1, which encodes cadherin family member 9, was instead almost exclusively expressed by B-cells with 63 and 129 reads. This protein has been shown to have an important role in early brain development, but its role in B-cell development and function seems less well known [320]. Protocadherin FAT1 is encoded by the FAT1 gene, was expressed exclusively by MCs but at low level with 34 and 36 reads. It has been mainly associated with fetal epithelia and its knock out in mice resulted in perinatal death due to renal failure [321]. The gene encoding the epithelial membrane protein, EMP1, was here expressed almost exclusively in MCs and at a relatively high level with 333 and 517 reads. The tight junction protein ZO-2, encoded by the TJP2 gene, was here also almost exclusively expressed by MCs with 60 and 110 reads. It is a cytoplasmic protein that interacts with several tight junction proteins including occludin [322]. The MAL gene encodes a proteolipid that is found in the endoplasmic reticulum of T-cells and in myelin cells where it is thought to be involved in T cell receptor signaling in the former [323]. It was expressed at relatively high levels almost exclusively by the T cells and at approximately the same levels in CD4+ and CD8+ T-cells, within the range of 179 to 488 reads. Transmembrane glycoprotein NMB and its mouse ortholog osteoactivin is encoded by the GPNMB gene. This type I glycoprotein, which has been shown to be expressed in melanocytes, osteoclasts, osteoblasts and dendritic cells, was in the present study expressed exclusively in MCs and at relatively high level, with 467 and 543 reads (Table 25) [324]. The GPNMB gene has been shown to be regulated by the transcription factor MITF which most likely is the reason why it is also expressed in MCs [325]. Transmembrane protein 176B, encoded by the, TMEM176B gene, is thought to have a role in the maturation of dendritic cells [326]. It was here expressed at very high but variable levels in monocytes, with 149 and 1605 reads, and at low levels in MCs, with 34 and 36 reads. AMICA1 or junctional adhesion molecule like (JAML), binds and activates the coxsackie and adenovirus receptor (human CXADR and mouse CAR), which is needed for neutrophil extravasation [327]. This gene was here expressed almost exclusively by monocytes, with 85 and 188 reads. SID1 transmembrane family member 1 is encoded by the SIDT1 gene is a transmembrane dsRNA-gated channel that facilitates transport of dsRNA into cells and is required for systemic RNA interference [328]. It was here expressed only by B- and T-lymphocytes, within a range of 29 to 50 reads (Table 25). Aquaporin 3, encoded by the AQP3 gene, is a pore forming protein that allows exit of water but also of glycerol, ammonia, urea and hydrogen peroxide [329]. It was here expressed almost exclusively by T cells and at similar levels in both CD4+ and CD8+ T-cells in the range of 170 to 393 reads. The ITM2A gene encodes the integral membrane protein 2A that has been shown to be involved in the activation of T-cells [330]. It was primarily expressed by T cells within a range of 94 to 290 reads but also by MCs with only slightly lower level and at very low levels in B-cells.
2.27. Transcript Levels for Cell Signaling Proteins
A complex network of cell signaling proteins are involved in transferring the information received from external signals, such as binding of cytokines and chemokines to their receptors, and the interaction with other cells through cell adhesion molecules. The information to the interior of the cell machinery can then result in the activation of transcription factors, activation of the secretory machinery and other cellular processes. A large number of such signaling proteins were identified in this screening of the five cell types. In general cell signaling by a majority of these proteins is regulated by tyrosine or serine/threonine phosphorylation, but as suggested by our findings they may also be regulated by the level of transcription and thereby also by the levels of these proteins in the cytoplasm of these cells (Table 26). We found that some of these signaling proteins were expressed exclusively in one or a few of these cell types. BLK was almost exclusively expressed in B-cells and LCK, THEMIS and ZAP70 were exclusively expressed by T cells (Table 26). Interestingly, some other signaling proteins like BTK, which has an important role in B cell biology, were in addition to B-cells also expressed by monocytes and actually at 2-3 times higher levels in MCs than in B-cells (Table 26). Due to the massive size of our report, we will here just present the reads for this large set of signaling molecules without further details concerning their direct functions. However, we think the expression data is very valuable information for further analysis of the complex network of intracellular signaling in various immune cells why we keep the entire list for facilitating future analysis. A general observation was that there was very minor differences between CD4+ and CD8+ T-cells in the expression of these signaling proteins, indicating that the signaling machinery in these two subtypes of T-cells is very similar. This was in contrast to the clear differences found between monocytes, B-cells and MCs.
2.28. Transcript Levels for Apoptosis-Related Proteins
Regulated cell death is an important cellular mechanism during organ development and infection and involves both pro and anti-apoptotic proteins. One of the inhibitory proteins is the Fas apoptosis inhibitory molecule 2, which is encoded by the FAIM2 gene. Transcripts of this inhibitor of Fas/CD95 mediated apoptosis has previously primarily been found in various brain cells and was here found only in the MCs with 48 and 50 reads (Table 27) [331]. BCL2 is another anti-apoptotic protein that was highly expressed by both B- and T-lymphocytes, within the range of 251 and 432 reads, lower in MCs with 66 and 75 reads, and almost absent in monocytes. The anti-apoptotic protein Mcl-1, encoded by the MCL1 gene, which has been shown to be the most important anti-apoptotic protein for skin MCs, was found to be expressed at high levels in all five cell types but much higher in MCs with 2704 and 3365 reads [332]. CARD11 is encoding a CARD domain protein that interacts with BCL10, is activated upon B- and T-cell receptor stimulation, and is critical for B- and T-cell activation [333]. It was here expressed exclusively in B- and T-cells at relatively high levels, within the range of 198 to 293 reads (Table 27). Clusterin, encoded by the CLU gene, is an extracellular molecular chaperone, and that also can be found in the cytosol. It binds to misfolded proteins in body fluids, neutralize their toxicity and mediate their uptake by receptor mediated endocytosis; its overexpression can protect cells from apoptosis induced by cellular stress [334]. CLU was expressed exclusively by MCs and at very high levels with 799 and 958 reads. As for many genes in this analysis, that have shown an interesting expression pattern, further studies concerning their role in the biology of these cells are warranted.
2.29. Transcript Levels for Matrix Proteins
Immune cells are not generally considered major players in matrix protein production. However, we found that some members of the large collagen family were expressed at relatively high levels in B-cells, T-cells and MCs, and other matrix proteins also in other cells. The two collagens COL4A3 and COL19A1 were exclusively expressed by B-cells, but at quite different expression levels, with 31 and 54 reads for COL4A3 and 403 and 447 reads for COL19A1 (Table 28). COL4A3 is one of the subunits of collagen type IV, the major component of basement membranes. COL19A1 is a subunit of a fibril collagen of unknown function. COL6A2 is a subunit of beaded filament collagen found in most connective tissues. It is here expressed by T-cells and MCs, with a major difference in expression level between CD4+ and CD8+ T-cells, with 23 and 39 reads in CD4+ T-cells and 119 and 190 reads in CD8+ T- cells. COL13A1 is the alpha chain in one of the membrane-bound nonfibrillar collagens, a collagen of unknown function that here was expressed exclusively by the MCs at a relatively low level. FERMT2 also known as kindlin-2, is a component of the extracellular matrix and has a role in regulating the activation of integrins, and was here expressed exclusively by MCs with 92 and 103 reads (Table 28) [335]. Extracellular microfibril interface 2 is encoded by the EMILIN2 gene. The encoded protein is and extracellular glycoprotein that is predicted to confer elasticity of the extracellular matrix [336]. It was here expressed at high levels by both monocytes and MCs, with expression levels between 117 and 750 reads and at much lower levels in B cells. Laminin subunit alpha-5 is encoded by the gene LAMA5, which was expressed at relatively low levels in B-cells and MCs with between 27 and 70 reads. This protein exerts a myriad of effects including mediating attachment, migration and organization of cells in various tissues [337]. These findings indicate a larger role of various immune cells in the regulation of the extracellular matrix not only by directly interacting with the matrix cells but also by producing selective matrix components.
2.30. Transcript Levels for Solute Carriers
Cells need a controlled access to ions, amino acids, glucose, nucleosides and other small molecules. The large family of solute carriers plays a major role herein and entities of this family showed a complex expression pattern in these five cell types (Table 29). SLC1A5 is a sodium dependent amino acid transporter with a broad substrate range. SLC1A5 was expressed in the five cell types but at a higher level in MCs with 344 and 376 reads, lower in monocytes and much lower in the other cell types (Table 29). SLC2A9 is a glucose transporter. It was expressed almost exclusively by monocytes, and at a level of 51 and 118 reads. SLC6A8, which is a creatine transporter, was here expressed only by MCs with 30 and 72 reads. SLC7A7 is a sodium independent amino acid transporter of basic and large neutral amino acids from the cytoplasm to the extracellular space. This transporter was found primarily in monocytes with 102 and 95 reads and at a lower level in B-cells. SLC8A3 is a Na+/Ca2+ exchange protein involved in maintaining Ca2+ homeostasis. This protein was here expressed exclusively in MCs with 47 and 10. SLC9A1, alias NHE1, is a membrane bound Na+/H+ transporter involved in volume and pH regulation [338]. SLC9A1 was broadly expressed but with higher levels in MCs with 210 and 150 reads. The SLC9A7 gene encodes a sodium/potassium antiporter that is located primarily in the trans Golgi network and is involved in maintaining pH in organelles [339]. It was here expressed primarily in B-cells with 244 and 258 reads. The SLC9A9 gene was here expressed at low level in all five cell types. The SLC9A9 gene encodes a sodium/proton exchanger that is localized to late recycling endosomes and that may play an important role in maintaining cation homeostasis [340]. The SLC12A4 gene encodes a potassium-chloride transporter that here was expressed in all five cell types but higher in monocytes with 151 and 185 reads (Table 29) [341]. The SLC15A3 gene encodes a dipeptide transporter that transports histidine, certain dipeptides and peptidomimetics from inside the lysosome to the cytosol. It was here expressed in all five cells but at much higher levels in monocytes with 154 and 173 reads, which is in line with previous studies showing that this gene primarily expressed in macrophages [342]. The monocarboxylate transporter 4 (MCT4), which is encoded by the SLC16A3 gene. This gene was expressed in all five cell types but higher in monocytes and MCs with between 19 and 181 reads. The vesicular monoamine transporter 2 (VMAT2) is a protein that in humans is encoded by the SLC18A2 gene. This protein is an integral membrane protein that transports monoamines such as dopamine, norepinephrine, serotonin and histamine from cytosol to secretory vesicles [343]. It was expressed exclusively by MCs and at a very high level with 698 and 702 reads (Table 29). The SLC18B1 gene is a sister gene to the previousSLC18A2and to other vesicular monoamine and acetylcholine transporters, and it is the only known polyamine transporter, with unknown physiological role [344]. SLC18B1 was expressed by all five cell types at very low level but with slightly higher expression in the lymphocytes. The SLC25A44 gene encodes a transporter of branched amino acids, valine, leucine, isoleucine, into mitochondria in brown fat tissue for thermogenesis [345]. It was expressed at low levels in all cell types except the MCs where the expression was high with 189 and 467 reads. Equilibrative nucleoside transporter 1 (ENT1) is a protein that in humans is encoded by the SLC29A1 gene. This transporter, which mediates the cellular uptake of nucleosides from the surrounding medium, was expressed by all five cell types but at higher level in the MCs with 70 and 102 reads (Table 29) [346]. The Zinc transporter 1 is in humans is encoded by the SLC30A1 gene. It was expressed by all cells but here at higher levels in monocytes and MCs within a range of 50 to 98 reads. This protein downregulates not only Zn2+ influx, but also Ca2+influx, thereby protecting cells from the effects of excessive cation permeation [347]. The sodium-coupled neutral amino acid transporter 1 is encoded by the SLC38A1 gene. It is an important transporter of glutamine, an intermediate in the detoxification of ammonia and the production of urea [348]. SLC38A1 was expressed almost exclusively by the lymphocytes and at relatively high levels with between 74 and 186 reads. The protein encoded from the SLC39A11 gene (also named ZIP11) is predicted to be involved in transport of zinc across the Golgi, nucleus and plasma membranes [349]. It was here expressed in all five cell types, but higher in monocytes, with 68 and 260 reads. The SLC40A1 gene encodes the so far only known iron exporter from cells to blood [350]. It was expressed at very low levels in monocytes and CD8+ T-cells, not in B- cells and higher in CD4+ T-cells and MCs within a range of 33 to 68 reads (Table 29). The protein encoded by the SLC40A3 gene has been shown to mediate the uptake of purine nucleobases such as adenine, guanine and hypoxanthine without requiring typical driving ions such as Na+ and H+, but not to mediate the uptake of nucleosides [351]. It was expressed by all five cell types but at much higher levels in MCs with 352 and 387 reads. Choline transporter-like protein 1 is a protein that is encoded by the SLC44A1 gene, where loss of function mutations has implicated a role in ethanolamine transport [352]. It was expressed at very low levels in all five cell types except in MCs that expressed high levels, with 118 and 203 reads.
2.31. Transcript Levels for Cell Cycle and Immediate-Early Response Related Proteins
Depending on the proliferative potential of a cell and state of activation, the cell expresses different levels of cell cycle and immediate-early response related genes. CDK14 is one such gene that is predicted to encode a cyclin-dependent serine/threonine kinase, involved in G2/M transition of mitotic cell cycle and regulation of the canonical Wnt signaling pathway. This gene was only expressed by B-cells with 113 and 144 reads (Table 30). Another such protein is the G0/G1 switch 2 protein, which is encoded by the GOS2 gene. It is located to the mitochondrion and involved in positive extrinsic apoptosis signaling [353]. It was here expressed almost exclusively by monocytes and MCs, at a very high level in monocytes with 850 and 2437 reads and at a lower level by MCs with 45 and 252 reads.
Cyclins and cyclin dependent kinases CDKs were in general expressed at relatively low levels except for CDK4 and cyclin D1 (CCND1) in MCs with 129 and 152 reads and 131 and 178 reads, but also cyclin D2 and D3 in all five cell types with between 18 and 833 reads (Table 30).
The IER3 gene is encoding the radiation-inducible immediate-early gene IEX-1, a protein that functions in the protection of cells from FAS or tumor necrosis factor alpha-induced apoptosis [354]. It was expressed at very low levels in B- and T-cells, and at very high levels in both monocytes and MCs within a range of 510 and 1693 reads (Table 30). Early growth response protein 3 is a protein encoded by the EGR3 gene. It was expressed almost exclusively by the MCs and at a high level with 194 and 494 reads. The gene encodes a transcriptional regulator that belongs to the EGR family of C2H2-type zinc-finger proteins. It is an immediate-early growth response gene which is induced by mitogenic stimulation [355].
2.32. Transcript Levels for Nuclear Proteins and Splicing Factors
Nuclear proteins and splicing factors are of importance for nuclear organization, transcript transport, accurate splicing and for regulating differential splicing. Pleckstrin homology-like domain family A member 1, also known as TDAG51, is a protein that is encoded by the PHLDA1 gene. This protein is an evolutionarily conserved proline-histidine rich nuclear protein, which may play an important role in the anti-apoptotic effects of insulin-like growth factor-1 [356]. It was expressed at very low levels in monocytes and T-cells and at higher levels in MCs with 154 and 220 reads (Table 31). The AHNAK2 gene is encoding a large nuclear protein that may play a role in calcium signaling by associating with calcium channel proteins. It was here expressed exclusively by MCs with 75 and 154 reads. Human Schlafen family member 5 is a transcriptional co-repressor of STAT-1 mediated interferon responses and is encoded by the SLFN5 gene [357]. It was expressed at low levels in B-cells and monocytes and at higher levels in T-cells and MCs with between 65 and 208 reads. Prelamin-A/C, or lamin A/C is a nuclear lamina protein, whereby the lamina consists of a two-dimensional matrix of proteins located next to the inner nuclear membrane [358]. The gene encoding this protein, LMNA, was here expressed by all five cell types with between 15 and 77 reads in the lymphocytes, between 227 and 840 reads in the monocytes and at very high levels in the MCs with 4302 and 6983 reads (Table 31). B-cell CLL/lymphoma 7 protein family member A is a protein encoded by the BCL7A gene. This protein belongs to the SWI/SNF chromatin remodeling complex, a complex that is able to modify the interactions between DNA and histones [359]. It was expressed at very low levels in all of these cells except for in B-cells where we detected 43 and 87 reads.
The splicing factor encoded by the SF3B4 gene was expressed by all five cell types but considerably higher in monocytes with 102 and 110 reads.
2.33. Transcript Levels for Cytoskeleton Related Proteins
Cytoskeletal proteins are of major importance for many cellular processes such as vesicle transport, cell shape, cell division and migration. Cortactin-binding protein 2 is a protein with six ankyrin repeats and several proline-rich regions that may act as a regular of the actin cytoskeleton, and it is encoded by the CTTNBP2 gene [360]. It was exclusively expressed by MCs with 116 and 138 reads (Table 32). Tensin-1 is a protein that localizes to focal adhesions and that is encoded by the TNS1 gene [361]. It was expressed primarily in MCs and at very high levels with 683 and 848 reads and also at low levels in monocytes. Myosin-IF is a protein that is encoded by the MYO1F gene. It was expressed mainly in the immune system and might be involved in cell adhesion and motility [362]. It is here expressed by all five cell types at levels except for in monocytes where the levels were much higher with 868 and 2491 reads (Table 32). We may speculate that this protein contributes to the high mobility of monocytes in infected tissues. Another myosin, MYO10, was expressed by MCs only with 85 and 110 reads. The protein encoded by this gene is an actin-based motor protein that can localize to the tips of the finger-like cellular protrusions known as filipodia [363]. Tubulin polymerization promoting protein 3 (TPPP3), is a member of the tubulin polymerization family. It was expressed only by monocytes and MCs within a range of 48 to 179 reads. Lymphocyte-specific protein 1 is a protein that is encoded by the LSP1 gene. It is an intracellular F-actin-binding protein that is expressed by lymphocytes, neutrophils, macrophages and endothelium and it may regulate neutrophil motility, adhesion to fibrinogen, matrix proteins, and transendothelial migration [364]. It was expressed at very high levels in the lymphocyte populations with between 917 and 1459 reads, very low in MCs, and very high also in monocytes with 4812 and 5211 reads (Table 32). Drebrin is a cytoplasmic actin binding protein that is encoded by the DBN1 gene. It was here expressed primarily by CD8+ T-cells and MCs within a range of 65 to 120 reads. PDZ and LIM domain protein 7 is a protein (also named ENIGMA), that is encoded by the PDLIM7 gene. This protein is involved in the assembly of an actin filament-associated complex essential for transmission of ret/ptc2 mitogenic signaling [365]. It was here expressed by all five cell types but much higher in monocytes and MCs where the expression is between 95 and 216 reads (Table 32). The TNNI2 gene encodes the fast twitch skeletal muscle troponin I. It was expressed at very low levels in B -cells and MCs and at much higher levels in monocytes with 171 and 439 reads. The ADD2 gene is encoding beta-adducin, a protein involved in the assembly of spectrin-actin network in erythrocytes and at sites of cell-cell contact in epithelial tissues [366]. It was only expressed by B-cells and low levels. Tubulin beta 6, encoded by the TUBB6 gene, controls microtubule and actin dynamics [367]. It was here expressed at relatively low levels in B-cells monocytes and MCs, with between 23 and 145 reads. Gelsolin is an actin-binding protein that is a key regulator of actin filament assembly and disassembly, encoded by the GSN gene. It was expressed in all five cells but at very low levels by the lymphocytes and much higher by monocytes and MCs with between 135 and 205 reads. It has been found to play an important role in host innate immunity, by activating and localizing macrophages to sites of inflammation [368].
2.34. Transcript Levels for Vesicle and Protein Transport
Several immune cells store large amounts of material in cytoplasmic vesicles, which are being released upon receptor triggering, such as for the MCs upon allergen stimulation and for the cytotoxic T cells upon targeting virus infected cells. Proteins involved in vesicle transport and transport of proteins into various types of vesicles are then of importance in this process. The amount of such proteins may vary considerably across different cells. One such example is the NSG1 gene, which encodes the neuronal vesicle trafficking associated 1, a protein located in endoplasmic reticulum that is predicted to enable clathrin light chain binding activity. It was expressed almost exclusively by the T cells with between 52 and 13 reads (Table 33). The STX3 gene encodes the protein syntaxin 3, which is a member of the syntaxin family of cellular receptors for transport vesicles that participate in exocytosis in neutrophils [369]. It was expressed at very low levels in all cells except for in MCs where the expression was higher with 47 and 149 reads. The DYNLL1 gene encodes the dynein light chain 1, a cytoplasmic protein involved in intracellular transport and motility [370]. It was expressed at relatively low levels in all cell, except for in MCs where the expression was at least 10-fold higher with 457 and 756 reads. Syntaxin 11, a protein encoded by the STX11 gene, is a member of the t-SNARe family involved in intracellular membrane trafficking. Enhanced expression of Syntaxin 11 has been shown to augment the secretion and killing of tumor targets by NK-cells and CTLs [371]. It was expressed in all cells but 5-10 times higher in monocytes and MCs within between 196 and 327 reads (Table 33). The SNX21 gene is encoding sorting nexin-21, a protein involved in intracellular trafficking. It was expressed essentially only in monocytes, with 88 and 90 reads and lower in MCs. Another member of this family, SNX22, was expressed exclusively in B-cells with 82 and 210 reads. The VPS37C gene is encoding a subunit of ESCRT-I (endosomal sorting complex required for transport I), a complex in the class E vacuolar protein sorting (VPS) pathway required for sorting ubiquitinated transmembrane proteins into internal vesicles of multivesicular bodies [372]. VPS37C was expressed at very low levels in the lymphocytes, higher in MCs and much higher in monocytes with 167 and 177 reads. The AP5B1 gene encodes the beta subunit of the AP-5 complex of clathrin adaptor proteins involved in vesicular transport [373]. It was expressed in all cells at low levels except for in monocytes where the levels were approximately 10 times higher with 457 and 588 reads. A similar situation was seen for the translocator protein, encoded by the TSPO gene, a protein that may be involved in transporting cholesterol into mitochondria. It was expressed in all five cell types but 10 times higher in monocytes with 955 and 967 reads.
The EH domain binding protein 1 like 1, encoded by the EHBP1L1 gene, was also expressed in all five cell types but 25-50 times higher in monocytes with 5040 and 5041 reads. This protein is located in the cell membrane and predicted to be involved in cytoskeletal organization and potentially in vesicle trafficking. The reason why monocytes need so high level of this protein compared to MCs and cytotoxic T cells is intriguing but not known.
2.35. Transcript Levels for Endogenous Retroviruses and Oncogenes
Finally we assessed the expression levels of an endogenous retrovirus and a few oncogenes as shown in Table 34.
The ERVFRD-1 gene is part of a human endogenous retrovirus provirus on chromosome 6 that has inactivating mutations in the gag and pol genes. It was expressed exclusively in MCs with 85 and 174 reads (Table 34).
Deleted in liver cancer 1, encoded by the DLC1 gene, was also expressed exclusively in MCs and at a very high level with 419 and 690 reads. It is a candidate tumor suppressor gene [374]. Tyrosine-protein kinase Fes/Fps is also known as proto-oncogene c-Fes/Fps. The FES gene encodes the human cellular counterpart of a feline sarcoma retrovirus protein. FES was expressed primarily in monocytes with 154 and 171 reads and lower in MCs with 56 and 60 reads.
3. Materials and Methods
3.1. Purification of Human Peripheral Blood B Cells, Monocytes, and CD4+ and CD8+ T Cells by FACS Sorting
Enriched peripheral blood mononuclear cells (PBMC) were obtained from buffy coats of anonymized blood donors at Uppsala University hospital. Platelets were removed by centrifugation (2 x 200g, 10 minutes). The white blood cells were further enriched using Ficoll-Paque Premium (ρ=1.076 g/ml) (GE Healthcare, Little Chalfont, UK) in SepMate™-50 tubes (Stemcell Technologies, Vancouver, Canada). Enriched PBMC were vital frozen at -80 °C in heat inactivated fetal calf serum (FCS) (Sigma-Aldrich, St. Louis, MO, USA) with 10% of DMSO. After thawing, the PBMC were incubated in FACS buffer (PBS, pH 7.4 containing 2% heat inactivated FCS) and stained with the following fluorescent-conjugated antibodies from BD Bioscience and eBioscience, San Diego, CA, USA, targeting (clone names) CD4 (RPA-T4), CD8 (RPA-T8), CD14 (M5E2), CD19 (HIB19). The cell sorting was performed on a FACSAria III (BD Biosciences). One million cells of each population were collected in FACS buffer and pelleted for RNA preparation, and small fraction was used to acquire the purity check controls. Data analysis was performed using FlowJo software version 9.8. Total RNA was prepared using the RNeasy Plus mini kit from (Qiagen, Hilden, Germany), according to the manufacturers recommendations. The RNA was eluted with 30 μl of DEPC-treated water, and the concentration of RNA was determined by using a Nanodrop ND-1000 (Nano Drop Technologies, Wilmington, Delaware, USA). Later the integrity of the RNA was confirmed by visualization on 1.2% agarose gel using ethidium bromide staining.
3.2. Purification of Human Skin MCs
MC purification was performed as previously described [3,4] with modifications specified in more recent work [5]. Skin was cut into strips and treated with dispase (24.5 ml per preparation, activity: 50 U/ml; Corning, Kaiserslautern, Germany) at 4°C overnight. After removal of the epidermis, the dermis was chopped into small pieces and digested with 2.29 mg/ml collagenase (Worthington, Lakewood, NJ), 0.75 mg/ml hyaluronidase (Sigma, Deisenhofen, Germany), DNase I at 10 µg/ml (both from Roche, Basel, Switzerland), and 5 mM MgSO4 for 1 h at 37°C.
The cell suspensions were separated from remaining tissue by three steps of filtration. In case of breast skin, the undigested tissue still remaining after the first digestion was subjected to a second digestion step of 1 h at 37° C after the first filtration. MC purification from the dispersates was achieved by positive selection with anti-human c-Kit microbeads and an Auto-MACS separation device (both from Miltenyi Biotec, Bergisch Gladbach, Germany). MC purity always exceeded 98%, as assessed by acidic toluidine-blue staining (0.1% in 0.5 N HCl). Viability by trypan blue exclusion exceeded 99%. We used between 4.8 and 6.2 x 10⁶ MCs for one RNA isolation (ex vivo samples). Cultures were started from 1.5-6 x 10⁶ MCs; around 3 x 10⁶ were eventually used for one RNA preparation.
3.3. RNA Isolation and Heparinase Treatment of Human MCs
Total RNA was prepared from freshly isolated MCs following an established protocol for each preparation. Briefly, MCs were lysed in 700 µl QIAzol®lysis reagent (Qiagen, Hilden, Germany), mixed with 140 µl chloroform (Sigma) and 60 µl DEPC-treated water and transferred to a 2 ml gel tube (Quanta bio/VWR, Dresden, Germany). After centrifugation, the supernatant was transferred to a NucleoSpin® filter and RNA was isolated using the NucleoSpin RNA kit from Machery-Nagel (Düren, Germany) following the manufacturer’s instructions. For heparinase (BioLab, Braunschweig, Germany) treatment the resulting RNA solution was mixed with RNAse inhibitor (Thermo Fisher Scientific), and heparinase buffer (BioLab, Braunschweig, Germany) and incubated for 3 hours at 25°C. Another RNA isolation procedure was followed, using the NucleoSpin RNA kit from Machery-Nagel (Düren, Germany) according to the manufacturer’s protocol. To further concentrate preparations, RNA was precipitated overnight at -80°C using 100% ethanol and sodium acetate (Merck, Darmstadt, Germany). RNA of each preparation was eventually solved in 20 µl DEPC-treated water. After each treatment step, RNA concentration was determined by using a Nanodrop ND-1000 (Nano Drop Technologies, Wilmington, Delaware, USA).
3.4. Ampliseq Analysis of the Total Transcriptome
The transcriptome of the four different peripheral blood cell fractions and the freshly isolated MCs were analyzed for their total transcriptome by the Thermo-Fisher chip based Ampliseq transcriptomic platform at the SciLife lab in Uppsala, Sweden (Ion-Torrent next-generation sequencing system- Thermofisher.com). The sequence results were delivered in the form of a large Excel file.
3.5. Quantitative Transcriptome Analysis
Two samples for each of the purified cell populations were analyzed. The data, comprising ~21,000 transcripts, were then manually processed and presented in a series of Tables where the numbers of reads for the respective gens are presented, and where the different Tables focus on different categories of genes. Altogether the conducted analysis identified more than 780 transcripts that were differentially expressed among the assessed cell populations, and these transcripts were therefore selected for a detailed comparison of the phenotypes of the chosen cell populations. In our analysis, genes are divided according to functional characteristics, and by particularly emphasizing genes with a known impact on the respective cell populations.
The entire 15 sample Excel file including all 20803 listed genes is available as a Supplementary file S1. This file also includes the 4 samples of cultured human skin MCs analyzed in a previous comparative analysis of similarities and differences in the phenotype between freshly isolated and cultured human skin MCs [6]. The cultured human skin MCs originate from both female breast skin and male fore skin, two samples each.
4. Conclusion
Analyses of the total transcriptome of individual cells or cell fractions have opened new ways to obtain detailed information concerning the phenotype of different cell populations. We have here analyzed the entire transcriptome of five major human immune cell populations: B cells, monocytes, CD4+ T cells, CD8+ T cells and MCs. We identified more than 780 transcripts that were differentially expressed among these cells, making them particularly interesting for analysis of their roles in human immunity. The results were almost school book clear and confirmed the findings of many years of detailed work on the phenotype of these five cell populations. However, this study also added a number of new findings and clarified inconsistencies in the literature concerning the expression of many genes and proteins, for which previous results were often derived from analysis in cell lines or ex vivo cultured cells.
In spite of uncertainties such as half-life of the transcripts and the proteins produced and also how efficiently the mRNAs are translated, a transcriptomic analysis probably still is the best available technique to obtain the full picture of the expression levels of all 21 000 human genes in a cell. It should be noted that, regardless of methodology, mRNA or protein levels may differ depending on age, sex, weight, ethnicity, health status and disease burden. In the present study we used freshly isolated cells from healthy persons and for the MCs we analyzed both male and female cells with very similar results.
Findings from this large comparative analysis combined with previous studies of mouse MCs and organs demonstrate that the majority of MC granule proteases are expressed exclusively by MCs and therefore can be used as markers to estimate the fraction of MCs in a whole tissue sample [21]. In mice, we can also obtain a quite accurate estimate of the distribution of their respective subtypes, mucosal and connective tissue MCs, based on their differential expression of granule proteases [21]. The possibility to use of these MC proteases to map subpopulations of MCs in different tissues was recently also confirmed by single cell analysis in the mouse [375].
Interestingly, our data strongly suggest that human skin MCs are not even a minor producer of any granzymes, which have been debated for many years. The human skin MCs did not express any of the five human granzymes, at least not under the non-inflammatory conditions applied in this study (Table 1). We could also show that there was a correlation between the expression level of proteases and their respective protease inhibitors in a particular cell type.
When we analyzed CD markers that had been identified as good lineage-related surface markers, our results adhered nicely to the published information in most cases. However, we also obtained very interesting quantitative information concerning their expression levels in different human immune cells. For example in T cells, the 2-3 times higher levels of CD3E compared to CD3G and CD3D makes sense as they are needed in twice the amount as CD3E forms heterodimers with both CD3G and CD3D (Table 5). The high levels of CD4 in both monocytes and MCs was also of value for questions concerning the purification of CD4+ T-cells and for the biological function of CD4. It was also interesting to see the very low expression level of the lineage-specific marker CD19 on B cells, which still seems sufficient for cell surface expression and for efficient antibody-mediated purification of these cells. The very large difference in expression levels between the two signaling components of the B-cell receptor, the Igα and Igβ (CD79A and B) was also remarkable as in theory they should be expressed at equal levels. However, we could see that CD79A was expressed at 10 times higher levels than CD79B (Table 5).
Our analyses of Fc receptors showed that human skin MCs express the high affinity IgE receptor at an expression level 20-30 times higher than human blood monocytes, and that they only express one Fc receptor for IgG, the FCGR2A. Quite varying results have been presented concerning the expression of Fc receptors for IgG on MCs, why this information now clarifies these inconsistencies. We also found that the only MRGPRX receptor expressed among the five immune cells was MRGPRX2, and that MRGPRX2 was expressed exclusively by the skin MCs and at relatively high level. This receptor has received a lot of attention due to its role in non-IgE dependent MC activation and thereby as an alternative mechanism in causing allergy exacerbations. The present study identified expression of the Fc receptor like molecules LILRs and KIRs in normal freshly isolated and non-activated cells, with almost exclusive expression of LILRs in monocytes and KIRs in T cells. We also confirmed that both human MCs and T cells express very low levels of MHC class II and are therefore relatively poor antigen presenting cells compared to both B cells and monocytes. A highly interesting finding was the almost total lack of expression of MHC class I- B and C genes in one of the individuals indicating that we can live with a quite limited MHC class I repertoire, at least in a modern society without heavy parasite load and with effective vaccines. Several complement and coagulation components were found to be expressed by human monocytes and, as earlier shown, also by mouse peritoneal macrophages [41].
Analysis of genes related to the complement systems showed that the human monocytes express two components of the alternative pathway, the properdin (CFP) and factor D (CFD), and one component of the lectin pathway, the ficolin (FCN1). We have previously reported that mouse peritoneal macrophages express, in addition to this, also the three genes for C1Q (C1QA, B and C), the complement component C4a, factor H and factor B and also the coagulation factors V, VII and X [41]. Together, these findings indicate that both human monocytes and mouse macrophages are important players in the complement system and that the mouse macrophages also in the coagulation system.
Interestingly, we found remarkably low levels of the different pattern recognition receptors, including TLR, NOD and RIG receptors, in the five human immune cells, and this was previously shown also in mouse peritoneal MCs and macrophages (15)[41]. However as mentioned earlier higher expression levels have been obtained in other studies [42]. In spite of the apparent low levels of expression these pattern recognition receptors are extremely potent in inducing cytokine expression in various immune cells as we recently showed for human monocytes [19].
When it comes to enzymes involved in histamine and arachidonic acid synthesis we found that MCs were the only cells in the present study expressing the histidine decarboxylase, which is essential for the formation of histamine. MCs were the dominating cell type when it comes to expression of arachidonic acid metabolizing enzymes, which makes sense as MCs are major producers of both leukotriene C4 and prostaglandin D2, LTC4 and PGD2. MCs were also dominant regarding enzymes involved in the synthesis of heparin, chondroitin sulfate and other major carbohydrate containing compounds.
When analyzing transcription factors, we found that not only CD4+ T-cells, but also CD8+ T-cells, expressed transcription factors separating the three major Th subtypes, Th1, Th2 and Th17. Both CD4+ and CD8+ T-cells expressed equal levels of the Th2-related transcription factor GATA3 and the Th1-related T-bet, but compared to the CD4+ cells, CD8+ expressed lower levels of RORC, which specifies Th17 cells. This finding indicates that CD8+ T-cells may have similar subtypes as CD4+ cells, which is speculative but interesting. Notably, we identified a panel of additional transcription factors in MCs, which opens for future analysis of their potential role in MC differentiation.
The list of novel and interesting findings can be very long when looking at all the quantitative expression levels coming from this large comparative analysis. We hope that this detailed map across five major human immune cells can serve as a starting point, in combination with the human proteome atlas (https://www.proteinatlas.org), for continued in depth analysis of their respective roles in the steady state, during normal human immune response and in disease states.
We have summarized some of the most characteristic features of these five cell types in Figure 2.
We also make the entire Excel file available for the research community to study the remaining more than 20 000 transcripts not analyzed in detail in this communication. This file is also easily searchable by the gene name and the search tool in Excel without the need for any advanced bioinformatic skills.
Supplementary Materials
The following supporting information can be downloaded at the website of this paper posted on Preprints.org.
Acknowledgments
The study was supported by grants from Konsul Berghs Stiftelse (Srinivas Akula), Knut and Alice Wallenberg Foundation (KAW 2017-0022) (Lars Hellman, Jenny Hallgren, Sara Wernersson and Gunnar Pejler) and Deutsche Forschungsgemeinschaft DFG (BA-3769/3, BA-3769/4) (Magda Babina).
Abbreviations
| MC | mast cell; CPA3, carboxypeptidase A3. |
References
- Li Z, Liu S, Xu J, Zhang X, Han D, Liu J, et al. Adult Connective Tissue-Resident Mast Cells Originate from Late Erythro-Myeloid Progenitors. Immunity. 2018;49(4):640-53 e5. [CrossRef]
- Gentek R, Ghigo C, Hoeffel G, Bulle MJ, Msallam R, Gautier G, et al. Hemogenic Endothelial Fate Mapping Reveals Dual Developmental Origin of Mast Cells. Immunity. 2018;48(6):1160-71 e5. [CrossRef]
- Babina M, Guhl S, Starke A, Kirchhof L, Zuberbier T, Henz BM. Comparative cytokine profile of human skin mast cells from two compartments--strong resemblance with monocytes at baseline but induction of IL-5 by IL-4 priming. J Leukoc Biol. 2004;75(2):244-52. [CrossRef]
- Guhl S, Neou A, Artuc M, Zuberbier T, Babina M. Skin mast cells develop non-synchronized changes in typical lineage characteristics upon culture. Exp Dermatol. 2014;23(12):933-5. [CrossRef]
- Babina M, Wang Z, Franke K, Guhl S, Artuc M, Zuberbier T. Yin-Yang of IL-33 in Human Skin Mast Cells: Reduced Degranulation, but Augmented Histamine Synthesis through p38 Activation. The Journal of investigative dermatology. 2019;139(7):1516-25 e3. [CrossRef]
- Akula, S.; Tripathi, S.R.; Franke, K.; Wernersson, S.; Babina, M.; Hellman, L. Cultures of Human Skin Mast Cells, an Attractive In Vitro Model for Studies of Human Mast Cell Biology. Cells 2024, 13. [Google Scholar] [CrossRef] [PubMed]
- Schwartz, L.B.; Irani, A.M.; Roller, K.; Castells, M.C.; Schechter, N.M. Quantitation of histamine, tryptase, and chymase in dispersed human T and TC mast cells. J Immunol 1987, 138, 2611–2615. [Google Scholar] [CrossRef] [PubMed]
- Jogie-Brahim, S.; Min, H.K.; Fukuoka, Y.; Xia, H.Z.; Schwartz, L.B. Expression of alpha-tryptase and beta-tryptase by human basophils. J Allergy Clin Immunol 2004, 113, 1086–1092. [Google Scholar] [CrossRef] [PubMed]
- Hellman, L.; Thorpe, M. Granule proteases of hematopoietic cells, a family of versatile inflammatory mediators - an update on their cleavage specificity, in vivo substrates, and evolution. Biol Chem 2014, 395, 15–49. [Google Scholar] [CrossRef] [PubMed]
- Poorafshar, M.; Helmby, H.; Troye-Blomberg, M.; Hellman, L. MMCP-8, the first lineage-specific differentiation marker for mouse basophils. Elevated numbers of potent IL-4-producing and MMCP-8-positive cells in spleens of malaria-infected mice. Eur J Immunol 2000, 30, 2660–2668. [Google Scholar] [CrossRef]
- Iki, M.; Tanaka, K.; Deki, H.; Fujimaki, M.; Sato, S.; Yoshikawa, S.; Yamanishi, Y.; Karasuyama, H. Basophil tryptase mMCP-11 plays a crucial role in IgE-mediated, delayed-onset allergic inflammation in mice. Blood 2016, 128, 2909–2918. [Google Scholar] [CrossRef]
- Charles, N.; Watford, W.T.; Ramos, H.L.; Hellman, L.; Oettgen, H.C.; Gomez, G.; Ryan, J.J.; O'Shea, J.J.; Rivera, J. Lyn kinase controls basophil GATA-3 transcription factor expression and induction of Th2 cell differentiation. Immunity 2009, 30, 533–543. [Google Scholar] [CrossRef]
- Ugajin, T.; Kojima, T.; Mukai, K.; Obata, K.; Kawano, Y.; Minegishi, Y.; Eishi, Y.; Yokozeki, H.; Karasuyama, H. Basophils preferentially express mouse Mast Cell Protease 11 among the mast cell tryptase family in contrast to mast cells. J Leukoc Biol 2009, 86, 1417–1425. [Google Scholar] [CrossRef]
- Fu, Z.; Thorpe, M.; Alemayehu, R.; Roy, A.; Kervinen, J.; de Garavilla, L.; Abrink, M.; Hellman, L. Highly Selective Cleavage of Cytokines and Chemokines by the Human Mast Cell Chymase and Neutrophil Cathepsin G. J Immunol 2017, 198, 1474–1483. [Google Scholar] [CrossRef]
- Fu, Z.; Akula, S.; Thorpe, M.; Hellman, L. Highly Selective Cleavage of TH2-Promoting Cytokines by the Human and the Mouse Mast Cell Tryptases, Indicating a Potent Negative Feedback Loop on TH2 Immunity. International journal of molecular sciences 2019, 20. [Google Scholar] [CrossRef]
- Fu, Z.; Akula, S.; Olsson, A.K.; Kervinen, J.; Hellman, L. Mast Cells and Basophils in the Defense against Ectoparasites: Efficient Degradation of Parasite Anticoagulants by the Connective Tissue Mast Cell Chymases. International journal of molecular sciences 2021, 22. [Google Scholar] [CrossRef] [PubMed]
- Hellman, L.; Akula, S.; Fu, Z.; Wernersson, S. Mast Cell and Basophil Granule Proteases - In Vivo Targets and Function. Frontiers in immunology 2022, 13, 918305. [Google Scholar] [CrossRef] [PubMed]
- Akula, S.; Fu, Z.; Wernersson, S.; Hellman, L. The Evolutionary History of the Chymase Locus -a Locus Encoding Several of the Major Hematopoietic Serine Proteases. International journal of molecular sciences 2021, 22. [Google Scholar] [CrossRef] [PubMed]
- Lara, S.; Akula, S.; Fu, Z.; Olsson, A.K.; Kleinau, S.; Hellman, L. The Human Monocyte-A Circulating Sensor of Infection and a Potent and Rapid Inducer of Inflammation. International journal of molecular sciences 2022, 23. [Google Scholar] [CrossRef] [PubMed]
- Aybay, E.; Ryu, J.; Fu, Z.; Akula, S.; Enriquez, E.M.; Hallgren, J.; Wernersson, S.; Olsson, A.K.; Hellman, L. Extended cleavage specificities of human granzymes A and K, two closely related enzymes with conserved but still poorly defined functions in T and NK cell-mediated immunity. Frontiers in immunology 2023, 14, 1211295. [Google Scholar] [CrossRef]
- Akula, S.; Paivandy, A.; Fu, Z.; Thorpe, M.; Pejler, G.; Hellman, L. Quantitative In-Depth Analysis of the Mouse Mast Cell Transcriptome Reveals Organ-Specific Mast Cell Heterogeneity. Cells 2020, 9. [Google Scholar] [CrossRef]
- Linnevers, C.; Smeekens, S.P.; Bromme, D. Human cathepsin W, a putative cysteine protease predominantly expressed in CD8+ T-lymphocytes. FEBS letters 1997, 405, 253–259. [Google Scholar] [CrossRef]
- Pan, X.; Grigoryeva, L.; Seyrantepe, V.; Peng, J.; Kollmann, K.; Tremblay, J.; Lavoie, J.L.; Hinek, A.; Lubke, T.; Pshezhetsky, A.V. Serine carboxypeptidase SCPEP1 and Cathepsin A play complementary roles in regulation of vasoconstriction via inactivation of endothelin-1. PLoS Genet 2014, 10, e1004146. [Google Scholar] [CrossRef]
- Basler, M.; Kirk, C.J.; Groettrup, M. The immunoproteasome in antigen processing and other immunological functions. Current opinion in immunology 2013, 25, 74–80. [Google Scholar] [CrossRef]
- Nishishita, K.; Sakai, E.; Okamoto, K.; Tsukuba, T. Structural and phylogenetic comparison of napsin genes: the duplication, loss of function and human-specific pseudogenization of napsin B. Gene 2013, 517, 147–157. [Google Scholar] [CrossRef]
- Mentlein, R. Dipeptidyl-peptidase IV (CD26)--role in the inactivation of regulatory peptides. Regul Pept 1999, 85, 9–24. [Google Scholar] [CrossRef] [PubMed]
- Esterhazy, D.; Stutzer, I.; Wang, H.; Rechsteiner, M.P.; Beauchamp, J.; Dobeli, H.; Hilpert, H.; Matile, H.; Prummer, M.; Schmidt, A.; et al. Bace2 is a beta cell-enriched protease that regulates pancreatic beta cell function and mass. Cell Metab 2011, 14, 365–377. [Google Scholar] [CrossRef] [PubMed]
- DeLeo, F.R.; Quinn, M.T. Assembly of the phagocyte NADPH oxidase: molecular interaction of oxidase proteins. J Leukoc Biol 1996, 60, 677–691. [Google Scholar] [CrossRef]
- de Boer, M.; Hilarius-Stokman, P.M.; Hossle, J.P.; Verhoeven, A.J.; Graf, N.; Kenney, R.T.; Seger, R.; Roos, D. Autosomal recessive chronic granulomatous disease with absence of the 67-kD cytosolic NADPH oxidase component: identification of mutation and detection of carriers. Blood 1994, 83, 531–536. [Google Scholar] [CrossRef]
- Bayly-Jones, C.; Pang, S.S.; Spicer, B.A.; Whisstock, J.C.; Dunstone, M.A. Ancient but Not Forgotten: New Insights Into MPEG1, a Macrophage Perforin-Like Immune Effector. Frontiers in immunology 2020, 11, 581906. [Google Scholar] [CrossRef]
- Py, B.F.; Gonzalez, S.F.; Long, K.; Kim, M.S.; Kim, Y.A.; Zhu, H.; Yao, J.; Degauque, N.; Villet, R.; Ymele-Leki, P.; et al. Cochlin produced by follicular dendritic cells promotes antibacterial innate immunity. Immunity 2013, 38, 1063–1072. [Google Scholar] [CrossRef]
- Briggs, R.C.; Briggs, J.A.; Ozer, J.; Sealy, L.; Dworkin, L.L.; Kingsmore, S.F.; Seldin, M.F.; Kaur, G.P.; Athwal, R.S.; Dessypris, E.N. The human myeloid cell nuclear differentiation antigen gene is one of at least two related interferon-inducible genes located on chromosome 1q that are expressed specifically in hematopoietic cells. Blood 1994, 83, 2153–2162. [Google Scholar] [CrossRef]
- Griffin, D.O.; Holodick, N.E.; Rothstein, T.L. Human B1 cells in umbilical cord and adult peripheral blood express the novel phenotype CD20+ CD27+ CD43+ CD70. J Exp Med 2011, 208, 67–80. [Google Scholar] [CrossRef]
- Getu, A.A.; Tigabu, A.; Zhou, M.; Lu, J.; Fodstad, O.; Tan, M. New frontiers in immune checkpoint B7-H3 (CD276) research and drug development. Mol Cancer 2023, 22, 43. [Google Scholar] [CrossRef]
- Bullock, T.N. Stimulating CD27 to quantitatively and qualitatively shape adaptive immunity to cancer. Current opinion in immunology 2017, 45, 82–88. [Google Scholar] [CrossRef]
- Buchan, S.L.; Rogel, A.; Al-Shamkhani, A. The immunobiology of CD27 and OX40 and their potential as targets for cancer immunotherapy. Blood 2018, 131, 39–48. [Google Scholar] [CrossRef] [PubMed]
- Qi, J.C.; Wang, J.; Mandadi, S.; Tanaka, K.; Roufogalis, B.D.; Madigan, M.C.; Lai, K.; Yan, F.; Chong, B.H.; Stevens, R.L.; et al. Human and mouse mast cells use the tetraspanin CD9 as an alternate interleukin-16 receptor. Blood 2006, 107, 135–142. [Google Scholar] [CrossRef] [PubMed]
- Koberle, M.; Kaesler, S.; Kempf, W.; Wolbing, F.; Biedermann, T. Tetraspanins in mast cells. Frontiers in immunology 2012, 3, 106. [Google Scholar] [CrossRef]
- Yoon, S.O.; Zhang, X.; Lee, I.Y.; Spencer, N.; Vo, P.; Choi, Y.S. CD9 is a novel marker for plasma cell precursors in human germinal centers. Biochem Biophys Res Commun 2013, 431, 41–46. [Google Scholar] [CrossRef]
- Orinska, Z.; Hagemann, P.M.; Halova, I.; Draber, P. Tetraspanins in the regulation of mast cell function. Med Microbiol Immunol 2020, 209, 531–543. [Google Scholar] [CrossRef]
- Paivandy, A.; Akula, S.; Lara, S.; Fu, Z.; Olsson, A.K.; Kleinau, S.; Pejler, G.; Hellman, L. Quantitative In-Depth Transcriptome Analysis Implicates Peritoneal Macrophages as Important Players in the Complement and Coagulation Systems. International journal of molecular sciences 2022, 23. [Google Scholar] [CrossRef]
- Motakis, E.; Guhl, S.; Ishizu, Y.; Itoh, M.; Kawaji, H.; de Hoon, M.; Lassmann, T.; Carninci, P.; Hayashizaki, Y.; Zuberbier, T.; et al. Redefinition of the human mast cell transcriptome by deep-CAGE sequencing. Blood 2014, 123, e58–67. [Google Scholar] [CrossRef]
- Pennathur, S.; Pasichnyk, K.; Bahrami, N.M.; Zeng, L.; Febbraio, M.; Yamaguchi, I.; Okamura, D.M. The macrophage phagocytic receptor CD36 promotes fibrogenic pathways on removal of apoptotic cells during chronic kidney injury. Am J Pathol 2015, 185, 2232–2245. [Google Scholar] [CrossRef]
- Mistry, J.J.; Hellmich, C.; Moore, J.A.; Jibril, A.; Macaulay, I.; Moreno-Gonzalez, M.; Di Palma, F.; Beraza, N.; Bowles, K.M.; Rushworth, S.A. Free fatty-acid transport via CD36 drives beta-oxidation-mediated hematopoietic stem cell response to infection. Nat Commun 2021, 12, 7130. [Google Scholar] [CrossRef]
- Morsy, D.E.; Sanyal, R.; Zaiss, A.K.; Deo, R.; Muruve, D.A.; Deans, J.P. Reduced T-dependent humoral immunity in CD20-deficient mice. J Immunol 2013, 191, 3112–3118. [Google Scholar] [CrossRef]
- Lee, M.; Kiefel, H.; LaJevic, M.D.; Macauley, M.S.; Kawashima, H.; O'Hara, E.; Pan, J.; Paulson, J.C.; Butcher, E.C. Transcriptional programs of lymphoid tissue capillary and high endothelium reveal control mechanisms for lymphocyte homing. Nat Immunol 2014, 15, 982–995. [Google Scholar] [CrossRef] [PubMed]
- Parnes, J.R.; Pan, C. CD72, a negative regulator of B-cell responsiveness. Immunol Rev 2000, 176, 75–85. [Google Scholar] [CrossRef] [PubMed]
- Rosnet, O.; Blanco-Betancourt, C.; Grivel, K.; Richter, K.; Schiff, C. Binding of free immunoglobulin light chains to VpreB3 inhibits their maturation and secretion in chicken B cells. J Biol Chem 2004, 279, 10228–10236. [Google Scholar] [CrossRef]
- Flach, H.; Rosenbaum, M.; Duchniewicz, M.; Kim, S.; Zhang, S.L.; Cahalan, M.D.; Mittler, G.; Grosschedl, R. Mzb1 protein regulates calcium homeostasis, antibody secretion, and integrin activation in innate-like B cells. Immunity 2010, 33, 723–735. [Google Scholar] [CrossRef]
- Griffin, D.O.; Rothstein, T.L. Human b1 cell frequency: isolation and analysis of human b1 cells. Frontiers in immunology 2012, 3, 122. [Google Scholar] [CrossRef]
- Yanez-Mo, M.; Barreiro, O.; Gordon-Alonso, M.; Sala-Valdes, M.; Sanchez-Madrid, F. Tetraspanin-enriched microdomains: a functional unit in cell plasma membranes. Trends Cell Biol 2009, 19, 434–446. [Google Scholar] [CrossRef]
- Netchiporouk, E.; Moreau, L.; Rahme, E.; Maurer, M.; Lejtenyi, D.; Ben-Shoshan, M. Positive CD63 Basophil Activation Tests Are Common in Children with Chronic Spontaneous Urticaria and Linked to High Disease Activity. Int Arch Allergy Immunol 2016, 171, 81–88. [Google Scholar] [CrossRef]
- Ziegler, S.F.; Ramsdell, F.; Alderson, M.R. The activation antigen CD69. Stem Cells 1994, 12, 456–465. [Google Scholar] [CrossRef]
- Ziegler, S.F.; Ramsdell, F.; Hjerrild, K.A.; Armitage, R.J.; Grabstein, K.H.; Hennen, K.B.; Farrah, T.; Fanslow, W.C.; Shevach, E.M.; Alderson, M.R. Molecular characterization of the early activation antigen CD69: a type II membrane glycoprotein related to a family of natural killer cell activation antigens. Eur J Immunol 1993, 23, 1643–1648. [Google Scholar] [CrossRef]
- Levy, S.; Todd, S.C.; Maecker, H.T. CD81 (TAPA-1): a molecule involved in signal transduction and cell adhesion in the immune system. Annual review of immunology 1998, 16, 89–109. [Google Scholar] [CrossRef]
- Fuchs, A.; Cella, M.; Giurisato, E.; Shaw, A.S.; Colonna, M. Cutting edge: CD96 (tactile) promotes NK cell-target cell adhesion by interacting with the poliovirus receptor (CD155). J Immunol 2004, 172, 3994–3998. [Google Scholar] [CrossRef] [PubMed]
- Leemans, J.C.; te Velde, A.A.; Florquin, S.; Bennink, R.J.; de Bruin, K.; van Lier, R.A.; van der Poll, T.; Hamann, J. The epidermal growth factor-seven transmembrane (EGF-TM7) receptor CD97 is required for neutrophil migration and host defense. J Immunol 2004, 172, 1125–1131. [Google Scholar] [CrossRef] [PubMed]
- Schaer, D.J.; Schaer, C.A.; Buehler, P.W.; Boykins, R.A.; Schoedon, G.; Alayash, A.I.; Schaffner, A. CD163 is the macrophage scavenger receptor for native and chemically modified hemoglobins in the absence of haptoglobin. Blood 2006, 107, 373–380. [Google Scholar] [CrossRef]
- Fabriek, B.O.; van Bruggen, R.; Deng, D.M.; Ligtenberg, A.J.; Nazmi, K.; Schornagel, K.; Vloet, R.P.; Dijkstra, C.D.; van den Berg, T.K. The macrophage scavenger receptor CD163 functions as an innate immune sensor for bacteria. Blood 2009, 113, 887–892. [Google Scholar] [CrossRef]
- Yoon, S.I.; Hong, M.; Wilson, I.A. An unusual dimeric structure and assembly for TLR4 regulator RP105-MD-1. Nat Struct Mol Biol 2011, 18, 1028–1035. [Google Scholar] [CrossRef]
- Egli, N.; Zajonz, A.; Burger, M.T.; Schweighoffer, T. Human CD180 Transmits Signals via the PIM-1L Kinase. PLoS One 2015, 10, e0142741. [Google Scholar] [CrossRef]
- Pietila, M.; Lehtonen, S.; Tuovinen, E.; Lahteenmaki, K.; Laitinen, S.; Leskela, H.V.; Natynki, A.; Pesala, J.; Nordstrom, K.; Lehenkari, P. CD200 positive human mesenchymal stem cells suppress TNF-alpha secretion from CD200 receptor positive macrophage-like cells. PLoS One 2012, 7, e31671. [Google Scholar] [CrossRef]
- Khan, K.A.; McMurray, J.L.; Mohammed, F.; Bicknell, R. C-type lectin domain group 14 proteins in vascular biology, cancer and inflammation. FEBS J 2019, 286, 3299–3332. [Google Scholar] [CrossRef]
- Cantoni, C.; Bottino, C.; Augugliaro, R.; Morelli, L.; Marcenaro, E.; Castriconi, R.; Vitale, M.; Pende, D.; Sivori, S.; Millo, R.; et al. Molecular and functional characterization of IRp60, a member of the immunoglobulin superfamily that functions as an inhibitory receptor in human NK cells. Eur J Immunol 1999, 29, 3148–3159. [Google Scholar] [CrossRef]
- Bachelet, I.; Munitz, A.; Moretta, A.; Moretta, L.; Levi-Schaffer, F. The inhibitory receptor IRp60 (CD300a) is expressed and functional on human mast cells. J Immunol 2005, 175, 7989–7995. [Google Scholar] [CrossRef]
- Voss, O.H.; Tian, L.; Murakami, Y.; Coligan, J.E.; Krzewski, K. Emerging role of CD300 receptors in regulating myeloid cell efferocytosis. Mol Cell Oncol 2015, 2, e964625. [Google Scholar] [CrossRef] [PubMed]
- Braud, V.M.; Allan, D.S.; O'Callaghan, C.A.; Soderstrom, K.; D'Andrea, A.; Ogg, G.S.; Lazetic, S.; Young, N.T.; Bell, J.I.; Phillips, J.H.; et al. HLA-E binds to natural killer cell receptors CD94/NKG2A, B and C. Nature 1998, 391, 795–799. [Google Scholar] [CrossRef] [PubMed]
- Kinet, J.P. The high-affinity IgE receptor (Fc epsilon RI): from physiology to pathology. Annual review of immunology 1999, 17, 931–972. [Google Scholar] [CrossRef]
- Akula, S.; Mohammadamin, S.; Hellman, L. Fc receptors for immunoglobulins and their appearance during vertebrate evolution. PLoS One 2014, 9, e96903. [Google Scholar] [CrossRef]
- Wang, Y.; Jonsson, F. Expression, Role, and Regulation of Neutrophil Fcgamma Receptors. Frontiers in immunology 2019, 10, 1958. [Google Scholar] [CrossRef]
- Chaudhury, C.; Mehnaz, S.; Robinson, J.M.; Hayton, W.L.; Pearl, D.K.; Roopenian, D.C.; Anderson, C.L. The major histocompatibility complex-related Fc receptor for IgG (FcRn) binds albumin and prolongs its lifespan. J Exp Med 2003, 197, 315–322. [Google Scholar] [CrossRef]
- Kubagawa, H.; Honjo, K.; Ohkura, N.; Sakaguchi, S.; Radbruch, A.; Melchers, F.; Jani, P.K. Functional Roles of the IgM Fc Receptor in the Immune System. Frontiers in immunology 2019, 10, 945. [Google Scholar] [CrossRef]
- Akula, S.; Hellman, L. The Appearance and Diversification of Receptors for IgM During Vertebrate Evolution. Curr Top Microbiol Immunol 2017, 408, 1–23. [Google Scholar] [CrossRef]
- Davis, R.S. Roles for the FCRL6 Immunoreceptor in Tumor Immunology. Frontiers in immunology 2020, 11, 575175. [Google Scholar] [CrossRef]
- Mamidi, M.K.; Huang, J.; Honjo, K.; Li, R.; Tabengwa, E.M.; Neeli, I.; Randall, N.L.; Ponnuchetty, M.V.; Radic, M.; Leu, C.M.; et al. FCRL1 immunoregulation in B cell development and malignancy. Frontiers in immunology 2023, 14, 1251127. [Google Scholar] [CrossRef]
- Nagai, K.; Tahara-Hanaoka, S.; Morishima, Y.; Tokunaga, T.; Imoto, Y.; Noguchi, E.; Kanemaru, K.; Imai, M.; Shibayama, S.; Hizawa, N.; et al. Expression and function of Allergin-1 on human primary mast cells. PLoS One 2013, 8, e76160. [Google Scholar] [CrossRef] [PubMed]
- Cherwinski, H.M.; Murphy, C.A.; Joyce, B.L.; Bigler, M.E.; Song, Y.S.; Zurawski, S.M.; Moshrefi, M.M.; Gorman, D.M.; Miller, K.L.; Zhang, S.; et al. The CD200 receptor is a novel and potent regulator of murine and human mast cell function. J Immunol 2005, 174, 1348–1356. [Google Scholar] [CrossRef]
- Van Remoortel, S.; Lambeets, L.; De Winter, B.; Dong, X.; Rodriguez Ruiz, J.P.; Kumar-Singh, S.; Martinez, S.I.; Timmermans, J.P. Mrgprb2-dependent Mast Cell Activation Plays a Crucial Role in Acute Colitis. Cell Mol Gastroenterol Hepatol 2024, 18, 101391. [Google Scholar] [CrossRef]
- Redondo-Garcia, S.; Barritt, C.; Papagregoriou, C.; Yeboah, M.; Frendeus, B.; Cragg, M.S.; Roghanian, A. Human leukocyte immunoglobulin-like receptors in health and disease. Frontiers in immunology 2023, 14, 1282874. [Google Scholar] [CrossRef]
- Abdallah, F.; Coindre, S.; Gardet, M.; Meurisse, F.; Naji, A.; Suganuma, N.; Abi-Rached, L.; Lambotte, O.; Favier, B. Leukocyte Immunoglobulin-Like Receptors in Regulating the Immune Response in Infectious Diseases: A Window of Opportunity to Pathogen Persistence and a Sound Target in Therapeutics. Frontiers in immunology 2021, 12, 717998. [Google Scholar] [CrossRef]
- Hirayasu, K.; Saito, F.; Suenaga, T.; Shida, K.; Arase, N.; Oikawa, K.; Yamaoka, T.; Murota, H.; Chibana, H.; Nakagawa, I.; et al. Microbially cleaved immunoglobulins are sensed by the innate immune receptor LILRA2. Nat Microbiol 2016, 1, 16054. [Google Scholar] [CrossRef]
- Merck, E.; Gaillard, C.; Scuiller, M.; Scapini, P.; Cassatella, M.A.; Trinchieri, G.; Bates, E.E. Ligation of the FcR gamma chain-associated human osteoclast-associated receptor enhances the proinflammatory responses of human monocytes and neutrophils. J Immunol 2006, 176, 3149–3156. [Google Scholar] [CrossRef]
- Raulet, D.H. Roles of the NKG2D immunoreceptor and its ligands. Nat Rev Immunol 2003, 3, 781–790. [Google Scholar] [CrossRef]
- Christiansen, D.; Mouhtouris, E.; Milland, J.; Zingoni, A.; Santoni, A.; Sandrin, M.S. Recognition of a carbohydrate xenoepitope by human NKRP1A (CD161). Xenotransplantation 2006, 13, 440–446. [Google Scholar] [CrossRef]
- Kaiser, B.K.; Barahmand-Pour, F.; Paulsene, W.; Medley, S.; Geraghty, D.E.; Strong, R.K. Interactions between NKG2x immunoreceptors and HLA-E ligands display overlapping affinities and thermodynamics. J Immunol 2005, 174, 2878–2884. [Google Scholar] [CrossRef]
- Nakamura, S.; Kuroki, K.; Ohki, I.; Sasaki, K.; Kajikawa, M.; Maruyama, T.; Ito, M.; Kameda, Y.; Ikura, M.; Yamamoto, K.; et al. Molecular basis for E-cadherin recognition by killer cell lectin-like receptor G1 (KLRG1). J Biol Chem 2009, 284, 27327–27335. [Google Scholar] [CrossRef] [PubMed]
- Ng, S.S.; De Labastida Rivera, F.; Yan, J.; Corvino, D.; Das, I.; Zhang, P.; Kuns, R.; Chauhan, S.B.; Hou, J.; Li, X.Y.; et al. The NK cell granule protein NKG7 regulates cytotoxic granule exocytosis and inflammation. Nat Immunol 2020, 21, 1205–1218. [Google Scholar] [CrossRef] [PubMed]
- Kruse, P.H.; Matta, J.; Ugolini, S.; Vivier, E. Natural cytotoxicity receptors and their ligands. Immunol Cell Biol 2014, 92, 221–229. [Google Scholar] [CrossRef] [PubMed]
- Memmer, S.; Weil, S.; Beyer, S.; Zoller, T.; Peters, E.; Hartmann, J.; Steinle, A.; Koch, J. The Stalk Domain of NKp30 Contributes to Ligand Binding and Signaling of a Preassembled NKp30-CD3zeta Complex. J Biol Chem 2016, 291, 25427–25438. [Google Scholar] [CrossRef]
- Erdei, A.; Kovacs, K.G.; Nagy-Balo, Z.; Lukacsi, S.; Macsik-Valent, B.; Kurucz, I.; Bajtay, Z. New aspects in the regulation of human B cell functions by complement receptors CR1, CR2, CR3 and CR4. Immunol Lett 2021, 237, 42–57. [Google Scholar] [CrossRef]
- Conti, B.J.; Davis, B.K.; Zhang, J.; O'Connor, W., Jr.; Williams, K.L.; Ting, J.P. CATERPILLER 16.2 (CLR16.2), a novel NBD/LRR family member that negatively regulates T cell function. J Biol Chem 2005, 280, 18375–18385. [Google Scholar] [CrossRef]
- Brisse, M.; Ly, H. Comparative Structure and Function Analysis of the RIG-I-Like Receptors: RIG-I and MDA5. Frontiers in immunology 2019, 10, 1586. [Google Scholar] [CrossRef]
- Kato, H.; Takeuchi, O.; Mikamo-Satoh, E.; Hirai, R.; Kawai, T.; Matsushita, K.; Hiiragi, A.; Dermody, T.S.; Fujita, T.; Akira, S. Length-dependent recognition of double-stranded ribonucleic acids by retinoic acid-inducible gene-I and melanoma differentiation-associated gene 5. J Exp Med 2008, 205, 1601–1610. [Google Scholar] [CrossRef]
- Zust, R.; Cervantes-Barragan, L.; Habjan, M.; Maier, R.; Neuman, B.W.; Ziebuhr, J.; Szretter, K.J.; Baker, S.C.; Barchet, W.; Diamond, M.S.; et al. Ribose 2'-O-methylation provides a molecular signature for the distinction of self and non-self mRNA dependent on the RNA sensor Mda5. Nat Immunol 2011, 12, 137–143. [Google Scholar] [CrossRef]
- Kischkel, F.C.; Lawrence, D.A.; Tinel, A.; LeBlanc, H.; Virmani, A.; Schow, P.; Gazdar, A.; Blenis, J.; Arnott, D.; Ashkenazi, A. Death receptor recruitment of endogenous caspase-10 and apoptosis initiation in the absence of caspase-8. J Biol Chem 2001, 276, 46639–46646. [Google Scholar] [CrossRef]
- Balachandran, S.; Venkataraman, T.; Fisher, P.B.; Barber, G.N. Fas-associated death domain-containing protein-mediated antiviral innate immune signaling involves the regulation of Irf7. J Immunol 2007, 178, 2429–2439. [Google Scholar] [CrossRef] [PubMed]
- Garcia, M.A.; Gil, J.; Ventoso, I.; Guerra, S.; Domingo, E.; Rivas, C.; Esteban, M. Impact of protein kinase PKR in cell biology: from antiviral to antiproliferative action. Microbiol Mol Biol Rev 2006, 70, 1032–1060. [Google Scholar] [CrossRef]
- Vazquez, C.; Horner, S.M. MAVS Coordination of Antiviral Innate Immunity. J Virol 2015, 89, 6974–6977. [Google Scholar] [CrossRef]
- von Bernuth, H.; Picard, C.; Jin, Z.; Pankla, R.; Xiao, H.; Ku, C.L.; Chrabieh, M.; Mustapha, I.B.; Ghandil, P.; Camcioglu, Y.; et al. Pyogenic bacterial infections in humans with MyD88 deficiency. Science 2008, 321, 691–696. [Google Scholar] [CrossRef]
- Gavin, A.L.; Huang, D.; Huber, C.; Martensson, A.; Tardif, V.; Skog, P.D.; Blane, T.R.; Thinnes, T.C.; Osborn, K.; Chong, H.S.; et al. PLD3 and PLD4 are single-stranded acid exonucleases that regulate endosomal nucleic-acid sensing. Nat Immunol 2018, 19, 942–953. [Google Scholar] [CrossRef]
- Drummond, R.A.; Brown, G.D. The role of Dectin-1 in the host defence against fungal infections. Curr Opin Microbiol 2011, 14, 392–399. [Google Scholar] [CrossRef]
- Ohtsu, H.; Tanaka, S.; Terui, T.; Hori, Y.; Makabe-Kobayashi, Y.; Pejler, G.; Tchougounova, E.; Hellman, L.; Gertsenstein, M.; Hirasawa, N.; et al. Mice lacking histidine decarboxylase exhibit abnormal mast cells. FEBS letters 2001, 502, 53–56. [Google Scholar] [CrossRef]
- Edmondson, D.E.; Binda, C.; Mattevi, A. Structural insights into the mechanism of amine oxidation by monoamine oxidases A and B. Arch Biochem Biophys 2007, 464, 269–276. [Google Scholar] [CrossRef]
- Babina, M.; Franke, K.; Bal, G. How "Neuronal" Are Human Skin Mast Cells? International journal of molecular sciences 2022, 23. [Google Scholar] [CrossRef]
- Haeggstrom, J.Z.; Funk, C.D. Lipoxygenase and leukotriene pathways: biochemistry, biology, and roles in disease. Chem Rev 2011, 111, 5866–5898. [Google Scholar] [CrossRef]
- Rakonjac, M.; Fischer, L.; Provost, P.; Werz, O.; Steinhilber, D.; Samuelsson, B.; Radmark, O. Coactosin-like protein supports 5-lipoxygenase enzyme activity and up-regulates leukotriene A4 production. Proc Natl Acad Sci U S A 2006, 103, 13150–13155. [Google Scholar] [CrossRef] [PubMed]
- Peters-Golden, M.; Brock, T.G. 5-lipoxygenase and FLAP. Prostaglandins Leukot Essent Fatty Acids 2003, 69, 99–109. [Google Scholar] [CrossRef]
- Nandy, A.; Jenatschke, S.; Hartung, B.; Milde-Langosch, K.; Bamberger, A.M.; Gellersen, B. Genomic structure and transcriptional regulation of the human NAD+-dependent 15-hydroxyprostaglandin dehydrogenase gene. J Mol Endocrinol 2003, 31, 105–121. [Google Scholar] [CrossRef]
- Kanaoka, Y.; Ago, H.; Inagaki, E.; Nanayama, T.; Miyano, M.; Kikuno, R.; Fujii, Y.; Eguchi, N.; Toh, H.; Urade, Y.; et al. Cloning and crystal structure of hematopoietic prostaglandin D synthase. Cell 1997, 90, 1085–1095. [Google Scholar] [CrossRef]
- Bakhle, Y.S. Structure of COX-1 and COX-2 enzymes and their interaction with inhibitors. Drugs Today (Barc) 1999, 35, 237–250. [Google Scholar] [CrossRef]
- Dennis, E.A. Diversity of group types, regulation, and function of phospholipase A2. J Biol Chem 1994, 269, 13057–13060. [Google Scholar] [CrossRef]
- Wang, L.H.; Kulmacz, R.J. Thromboxane synthase: structure and function of protein and gene. Prostaglandins Other Lipid Mediat 2002, 68-69, 409–422. [Google Scholar] [CrossRef]
- Abate, W.; Alrammah, H.; Kiernan, M.; Tonks, A.J.; Jackson, S.K. Lysophosphatidylcholine acyltransferase 2 (LPCAT2) co-localises with TLR4 and regulates macrophage inflammatory gene expression in response to LPS. Sci Rep 2020, 10, 10355. [Google Scholar] [CrossRef]
- Benesch, M.G.; Zhao, Y.Y.; Curtis, J.M.; McMullen, T.P.; Brindley, D.N. Regulation of autotaxin expression and secretion by lysophosphatidate and sphingosine 1-phosphate. J Lipid Res 2015, 56, 1134–1144. [Google Scholar] [CrossRef]
- Shindou, H.; Shimizu, T. Acyl-CoA:lysophospholipid acyltransferases. J Biol Chem 2009, 284, 1–5. [Google Scholar] [CrossRef]
- Wallner, B.P.; Mattaliano, R.J.; Hession, C.; Cate, R.L.; Tizard, R.; Sinclair, L.K.; Foeller, C.; Chow, E.P.; Browing, J.L.; Ramachandran, K.L.; et al. Cloning and expression of human lipocortin, a phospholipase A2 inhibitor with potential anti-inflammatory activity. Nature 1986, 320, 77–81. [Google Scholar] [CrossRef] [PubMed]
- Angerth, T.; Huang, R.Y.; Aveskogh, M.; Pettersson, I.; Kjellen, L.; Hellman, L. Cloning and structural analysis of a gene encoding a mouse mastocytoma proteoglycan core protein; analysis of its evolutionary relation to three cross hybridizing regions in the mouse genome. Gene 1990, 93, 235–240. [Google Scholar] [CrossRef]
- Habuchi, H.; Kobayashi, M.; Kimata, K. Molecular characterization and expression of heparan-sulfate 6-sulfotransferase. Complete cDNA cloning in human and partial cloning in Chinese hamster ovary cells. J Biol Chem 1998, 273, 9208–9213. [Google Scholar] [CrossRef] [PubMed]
- Noonan, D.M.; Fulle, A.; Valente, P.; Cai, S.; Horigan, E.; Sasaki, M.; Yamada, Y.; Hassell, J.R. The complete sequence of perlecan, a basement membrane heparan sulfate proteoglycan, reveals extensive similarity with laminin A chain, low density lipoprotein-receptor, and the neural cell adhesion molecule. J Biol Chem 1991, 266, 22939–22947. [Google Scholar] [CrossRef] [PubMed]
- Bennett, E.P.; Hassan, H.; Mandel, U.; Hollingsworth, M.A.; Akisawa, N.; Ikematsu, Y.; Merkx, G.; van Kessel, A.G.; Olofsson, S.; Clausen, H. Cloning and characterization of a close homologue of human UDP-N-acetyl-alpha-D-galactosamine:Polypeptide N-acetylgalactosaminyltransferase-T3, designated GalNAc-T6. Evidence for genetic but not functional redundancy. J Biol Chem 1999, 274, 25362–25370. [Google Scholar] [CrossRef]
- Bengtsson, J.; Eriksson, I.; Kjellen, L. Distinct effects on heparan sulfate structure by different active site mutations in NDST-1. Biochemistry 2003, 42, 2110–2115. [Google Scholar] [CrossRef]
- Forsberg, E.; Pejler, G.; Ringvall, M.; Lunderius, C.; Tomasini-Johansson, B.; Kusche-Gullberg, M.; Eriksson, I.; Ledin, J.; Hellman, L.; Kjellen, L. Abnormal mast cells in mice deficient in a heparin-synthesizing enzyme. Nature 1999, 400, 773–776. [Google Scholar] [CrossRef]
- Weissmann, B.; Chao, H.; Chow, P. A glucosamine O,N-disulfate O-sulfohydrolase with a probable role in mammalian catabolism of heparan sulfate. Biochem Biophys Res Commun 1980, 97, 827–833. [Google Scholar] [CrossRef]
- Said, S.M.; Murphree, M.I.; Mounajjed, T.; El-Youssef, M.; Zhang, L. A novel GBE1 gene variant in a child with glycogen storage disease type IV. Hum Pathol 2016, 54, 152–156. [Google Scholar] [CrossRef]
- Carey, D.J.; Evans, D.M.; Stahl, R.C.; Asundi, V.K.; Conner, K.J.; Garbes, P.; Cizmeci-Smith, G. Molecular cloning and characterization of N-syndecan, a novel transmembrane heparan sulfate proteoglycan. The Journal of cell biology 1992, 117, 191–201. [Google Scholar] [CrossRef]
- Volpi, S.; Yamazaki, Y.; Brauer, P.M.; van Rooijen, E.; Hayashida, A.; Slavotinek, A.; Sun Kuehn, H.; Di Rocco, M.; Rivolta, C.; Bortolomai, I.; et al. EXTL3 mutations cause skeletal dysplasia, immune deficiency, and developmental delay. J Exp Med 2017, 214, 623–637. [Google Scholar] [CrossRef] [PubMed]
- McCormick, C.; Leduc, Y.; Martindale, D.; Mattison, K.; Esford, L.E.; Dyer, A.P.; Tufaro, F. The putative tumour suppressor EXT1 alters the expression of cell-surface heparan sulfate. Nat Genet 1998, 19, 158–161. [Google Scholar] [CrossRef] [PubMed]
- Takahashi, S.; Takahashi, K.; Kaneko, T.; Ogasawara, H.; Shindo, S.; Kobayashi, M. Human renin-binding protein is the enzyme N-acetyl-D-glucosamine 2-epimerase. Journal of biochemistry 1999, 125, 348–353. [Google Scholar] [CrossRef]
- Sturm, A.; Lensch, M.; Andre, S.; Kaltner, H.; Wiedenmann, B.; Rosewicz, S.; Dignass, A.U.; Gabius, H.J. Human galectin-2: novel inducer of T cell apoptosis with distinct profile of caspase activation. J Immunol 2004, 173, 3825–3837. [Google Scholar] [CrossRef] [PubMed]
- Jia, J.; Claude-Taupin, A.; Gu, Y.; Choi, S.W.; Peters, R.; Bissa, B.; Mudd, M.H.; Allers, L.; Pallikkuth, S.; Lidke, K.A.; et al. Galectin-3 Coordinates a Cellular System for Lysosomal Repair and Removal. Dev Cell 2020, 52, 69–87. [Google Scholar] [CrossRef] [PubMed]
- Gotoh, T.; Sonoki, T.; Nagasaki, A.; Terada, K.; Takiguchi, M.; Mori, M. Molecular cloning of cDNA for nonhepatic mitochondrial arginase (arginase II) and comparison of its induction with nitric oxide synthase in a murine macrophage-like cell line. FEBS letters 1996, 395, 119–122. [Google Scholar] [CrossRef]
- Nakayama-Hamada, M.; Suzuki, A.; Kubota, K.; Takazawa, T.; Ohsaka, M.; Kawaida, R.; Ono, M.; Kasuya, A.; Furukawa, H.; Yamada, R.; et al. Comparison of enzymatic properties between hPADI2 and hPADI4. Biochem Biophys Res Commun 2005, 327, 192–200. [Google Scholar] [CrossRef]
- Islam, M.M.; Takeyama, N. Role of Neutrophil Extracellular Traps in Health and Disease Pathophysiology: Recent Insights and Advances. International journal of molecular sciences 2023, 24. [Google Scholar] [CrossRef]
- Liu, R.; Zhang, X.; Nie, L.; Sun, S.; Liu, J.; Chen, H. Heme oxygenase 1 in erythropoiesis: an important regulator beyond catalyzing heme catabolism. Annals of hematology 2023, 102, 1323–1332. [Google Scholar] [CrossRef]
- Okano, S.; Zhou, L.; Kusaka, T.; Shibata, K.; Shimizu, K.; Gao, X.; Kikuchi, Y.; Togashi, Y.; Hosoya, T.; Takahashi, S.; et al. Indispensable function for embryogenesis, expression and regulation of the nonspecific form of the 5-aminolevulinate synthase gene in mouse. Genes Cells 2010, 15, 77–89. [Google Scholar] [CrossRef]
- Powell, R.D.; Holland, P.J.; Hollis, T.; Perrino, F.W. Aicardi-Goutieres syndrome gene and HIV-1 restriction factor SAMHD1 is a dGTP-regulated deoxynucleotide triphosphohydrolase. J Biol Chem 2011, 286, 43596–43600. [Google Scholar] [CrossRef] [PubMed]
- Zhang, F.; Lou, L.; Peng, B.; Song, X.; Reizes, O.; Almasan, A.; Gong, Z. Nudix Hydrolase NUDT16 Regulates 53BP1 Protein by Reversing 53BP1 ADP-Ribosylation. Cancer Res 2020, 80, 999–1010. [Google Scholar] [CrossRef]
- Chen, C.H.; Ferreira, J.C.; Gross, E.R.; Mochly-Rosen, D. Targeting aldehyde dehydrogenase 2: new therapeutic opportunities. Physiol Rev 2014, 94, 1–34. [Google Scholar] [CrossRef]
- Mashek, D.G.; Bornfeldt, K.E.; Coleman, R.A.; Berger, J.; Bernlohr, D.A.; Black, P.; DiRusso, C.C.; Farber, S.A.; Guo, W.; Hashimoto, N.; et al. Revised nomenclature for the mammalian long-chain acyl-CoA synthetase gene family. J Lipid Res 2004, 45, 1958–1961. [Google Scholar] [CrossRef]
- Takagi, Y.; Setoyama, D.; Ito, R.; Kamiya, H.; Yamagata, Y.; Sekiguchi, M. Human MTH3 (NUDT18) protein hydrolyzes oxidized forms of guanosine and deoxyguanosine diphosphates: comparison with MTH1 and MTH2. J Biol Chem 2012, 287, 21541–21549. [Google Scholar] [CrossRef]
- Adams, M.J.; Ellis, G.H.; Gover, S.; Naylor, C.E.; Phillips, C. Crystallographic study of coenzyme, coenzyme analogue and substrate binding in 6-phosphogluconate dehydrogenase: implications for NADP specificity and the enzyme mechanism. Structure 1994, 2, 651–668. [Google Scholar] [CrossRef]
- Starheim, K.K.; Gevaert, K.; Arnesen, T. Protein N-terminal acetyltransferases: when the start matters. Trends Biochem Sci 2012, 37, 152–161. [Google Scholar] [CrossRef]
- Li, Y.; Qi, X.; Liu, B.; Huang, H. The STAT5-GATA2 pathway is critical in basophil and mast cell differentiation and maintenance. J Immunol 2015, 194, 4328–4338. [Google Scholar] [CrossRef]
- Mo, J.; Wermeling, F.; Nilsson, G.; Dahlin, J.S. CRISPR/Cas9-mediated gene disruption determines the roles of MITF and CITED2 in human mast cell differentiation. Blood Adv 2024, 8, 3941–3945. [Google Scholar] [CrossRef]
- Ohneda, K.; Ohmori, S.; Yamamoto, M. Mouse Tryptase Gene Expression is Coordinately Regulated by GATA1 and GATA2 in Bone Marrow-Derived Mast Cells. International journal of molecular sciences 2019, 20. [Google Scholar] [CrossRef]
- Gutierrez, L.; Tsukamoto, S.; Suzuki, M.; Yamamoto-Mukai, H.; Yamamoto, M.; Philipsen, S.; Ohneda, K. Ablation of Gata1 in adult mice results in aplastic crisis, revealing its essential role in steady-state and stress erythropoiesis. Blood 2008, 111, 4375–4385. [Google Scholar] [CrossRef] [PubMed]
- Hershey, C.L.; Fisher, D.E. Mitf and Tfe3: members of a b-HLH-ZIP transcription factor family essential for osteoclast development and function. Bone 2004, 34, 689–696. [Google Scholar] [CrossRef] [PubMed]
- Kageyama, R.; Ohtsuka, T.; Kobayashi, T. The Hes gene family: repressors and oscillators that orchestrate embryogenesis. Development 2007, 134, 1243–1251. [Google Scholar] [CrossRef]
- Leimeister, C.; Externbrink, A.; Klamt, B.; Gessler, M. Hey genes: a novel subfamily of hairy- and Enhancer of split related genes specifically expressed during mouse embryogenesis. Mech Dev 1999, 85, 173–177. [Google Scholar] [CrossRef]
- Fujino, T.; Yamazaki, Y.; Largaespada, D.A.; Jenkins, N.A.; Copeland, N.G.; Hirokawa, K.; Nakamura, T. Inhibition of myeloid differentiation by Hoxa9, Hoxb8, and Meis homeobox genes. Exp Hematol 2001, 29, 856–863. [Google Scholar] [CrossRef]
- Hanaoka, M.; Droma, Y.; Basnyat, B.; Ito, M.; Kobayashi, N.; Katsuyama, Y.; Kubo, K.; Ota, M. Genetic variants in EPAS1 contribute to adaptation to high-altitude hypoxia in Sherpas. PLoS One 2012, 7, e50566. [Google Scholar] [CrossRef]
- Liu, L.; Pilch, P.F. PTRF/Cavin-1 promotes efficient ribosomal RNA transcription in response to metabolic challenges. Elife 2016, 5. [Google Scholar] [CrossRef]
- Pei, L.; Castrillo, A.; Tontonoz, P. Regulation of macrophage inflammatory gene expression by the orphan nuclear receptor Nur77. Mol Endocrinol 2006, 20, 786–794. [Google Scholar] [CrossRef]
- Sanyal, M.; Tung, J.W.; Karsunky, H.; Zeng, H.; Selleri, L.; Weissman, I.L.; Herzenberg, L.A.; Cleary, M.L. B-cell development fails in the absence of the Pbx1 proto-oncogene. Blood 2007, 109, 4191–4199. [Google Scholar] [CrossRef]
- Humke, E.W.; Dorn, K.V.; Milenkovic, L.; Scott, M.P.; Rohatgi, R. The output of Hedgehog signaling is controlled by the dynamic association between Suppressor of Fused and the Gli proteins. Genes Dev 2010, 24, 670–682. [Google Scholar] [CrossRef]
- Matissek, S.J.; Elsawa, S.F. GLI3: a mediator of genetic diseases, development and cancer. Cell Commun Signal 2020, 18, 54. [Google Scholar] [CrossRef] [PubMed]
- Melko, M.; Douguet, D.; Bensaid, M.; Zongaro, S.; Verheggen, C.; Gecz, J.; Bardoni, B. Functional characterization of the AFF (AF4/FMR2) family of RNA-binding proteins: insights into the molecular pathology of FRAXE intellectual disability. Hum Mol Genet 2011, 20, 1873–1885. [Google Scholar] [CrossRef] [PubMed]
- Jiang, T.J.; Cao, X.L.; Luan, S.; Cui, W.H.; Qiu, S.H.; Wang, Y.C.; Zhao, C.J.; Fu, P. Percentage and function of CD4+CD25+ regulatory T cells in patients with hyperthyroidism. Mol Med Rep 2018, 17, 2137–2144. [Google Scholar] [CrossRef] [PubMed]
- Szabo, S.J.; Kim, S.T.; Costa, G.L.; Zhang, X.; Fathman, C.G.; Glimcher, L.H. A novel transcription factor, T-bet, directs Th1 lineage commitment. Cell 2000, 100, 655–669. [Google Scholar] [CrossRef]
- Castro, G.; Liu, X.; Ngo, K.; De Leon-Tabaldo, A.; Zhao, S.; Luna-Roman, R.; Yu, J.; Cao, T.; Kuhn, R.; Wilkinson, P.; et al. RORgammat and RORalpha signature genes in human Th17 cells. PLoS One 2017, 12, e0181868. [Google Scholar] [CrossRef]
- Eberl, G.; Littman, D.R. The role of the nuclear hormone receptor RORgammat in the development of lymph nodes and Peyer's patches. Immunol Rev 2003, 195, 81–90. [Google Scholar] [CrossRef]
- Karnowski, A.; Chevrier, S.; Belz, G.T.; Mount, A.; Emslie, D.; D'Costa, K.; Tarlinton, D.M.; Kallies, A.; Corcoran, L.M. B and T cells collaborate in antiviral responses via IL-6, IL-21, and transcriptional activator and coactivator, Oct2 and OBF-1. J Exp Med 2012, 209, 2049–2064. [Google Scholar] [CrossRef]
- Laidlaw, B.J.; Cyster, J.G. Transcriptional regulation of memory B cell differentiation. Nat Rev Immunol 2021, 21, 209–220. [Google Scholar] [CrossRef]
- Hess, J.; Nielsen, P.J.; Fischer, K.D.; Bujard, H.; Wirth, T. The B lymphocyte-specific coactivator BOB.1/OBF.1 is required at multiple stages of B-cell development. Mol Cell Biol 2001, 21, 1531–1539. [Google Scholar] [CrossRef]
- Le Coz, C.; Nguyen, D.N.; Su, C.; Nolan, B.E.; Albrecht, A.V.; Xhani, S.; Sun, D.; Demaree, B.; Pillarisetti, P.; Khanna, C.; et al. Constrained chromatin accessibility in PU.1-mutated agammaglobulinemia patients. J Exp Med 2021, 218. [Google Scholar] [CrossRef]
- Schotte, R.; Rissoan, M.C.; Bendriss-Vermare, N.; Bridon, J.M.; Duhen, T.; Weijer, K.; Briere, F.; Spits, H. The transcription factor Spi-B is expressed in plasmacytoid DC precursors and inhibits T-, B-, and NK-cell development. Blood 2003, 101, 1015–1023. [Google Scholar] [CrossRef] [PubMed]
- Nutt, S.L.; Heavey, B.; Rolink, A.G.; Busslinger, M. Commitment to the B-lymphoid lineage depends on the transcription factor Pax5. Nature 1999, 401, 556–562. [Google Scholar] [CrossRef] [PubMed]
- Tsukumo, S.I.; Subramani, P.G.; Seija, N.; Tabata, M.; Maekawa, Y.; Mori, Y.; Ishifune, C.; Itoh, Y.; Ota, M.; Fujio, K.; et al. AFF3, a susceptibility factor for autoimmune diseases, is a molecular facilitator of immunoglobulin class switch recombination. Sci Adv 2022, 8, eabq0008. [Google Scholar] [CrossRef] [PubMed]
- Iijima, T.; Iijima, Y.; Witte, H.; Scheiffele, P. Neuronal cell type-specific alternative splicing is regulated by the KH domain protein SLM1. The Journal of cell biology 2014, 204, 331–342. [Google Scholar] [CrossRef] [PubMed]
- Treiber, T.; Mandel, E.M.; Pott, S.; Gyory, I.; Firner, S.; Liu, E.T.; Grosschedl, R. Early B cell factor 1 regulates B cell gene networks by activation, repression, and transcription- independent poising of chromatin. Immunity 2010, 32, 714–725. [Google Scholar] [CrossRef]
- Gaubatz, S.; Lindeman, G.J.; Ishida, S.; Jakoi, L.; Nevins, J.R.; Livingston, D.M.; Rempel, R.E. E2F4 and E2F5 play an essential role in pocket protein-mediated G1 control. Mol Cell 2000, 6, 729–735. [Google Scholar] [CrossRef]
- Liu, G.; Liu, F. Bach2: A Key Regulator in Th2-Related Immune Cells and Th2 Immune Response. J Immunol Res 2022, 2022, 2814510. [Google Scholar] [CrossRef]
- Piazza, R.; Magistroni, V.; Redaelli, S.; Mauri, M.; Massimino, L.; Sessa, A.; Peronaci, M.; Lalowski, M.; Soliymani, R.; Mezzatesta, C.; et al. SETBP1 induces transcription of a network of development genes by acting as an epigenetic hub. Nat Commun 2018, 9, 2192. [Google Scholar] [CrossRef]
- Carr, T.; Krishnamoorthy, V.; Yu, S.; Xue, H.H.; Kee, B.L.; Verykokakis, M. The transcription factor lymphoid enhancer factor 1 controls invariant natural killer T cell expansion and Th2-type effector differentiation. J Exp Med 2015, 212, 793–807. [Google Scholar] [CrossRef]
- Cook, M.E.; Jarjour, N.N.; Lin, C.C.; Edelson, B.T. Transcription Factor Bhlhe40 in Immunity and Autoimmunity. Trends Immunol 2020, 41, 1023–1036. [Google Scholar] [CrossRef]
- Hallaq, H.; Pinter, E.; Enciso, J.; McGrath, J.; Zeiss, C.; Brueckner, M.; Madri, J.; Jacobs, H.C.; Wilson, C.M.; Vasavada, H.; et al. A null mutation of Hhex results in abnormal cardiac development, defective vasculogenesis and elevated Vegfa levels. Development 2004, 131, 5197–5209. [Google Scholar] [CrossRef] [PubMed]
- Abrink, M.; Aveskogh, M.; Hellman, L. Isolation of cDNA clones for 42 different Kruppel-related zinc finger proteins expressed in the human monoblast cell line U-937. DNA Cell Biol 1995, 14, 125–136. [Google Scholar] [CrossRef] [PubMed]
- Mark, C.; Abrink, M.; Hellman, L. Comparative analysis of KRAB zinc finger proteins in rodents and man: evidence for several evolutionarily distinct subfamilies of KRAB zinc finger genes. DNA Cell Biol 1999, 18, 381–396. [Google Scholar] [CrossRef]
- Looman, C.; Abrink, M.; Mark, C.; Hellman, L. KRAB zinc finger proteins: an analysis of the molecular mechanisms governing their increase in numbers and complexity during evolution. Molecular biology and evolution 2002, 19, 2118–2130. [Google Scholar] [CrossRef]
- Georgopoulos, K.; Winandy, S.; Avitahl, N. The role of the Ikaros gene in lymphocyte development and homeostasis. Annual review of immunology 1997, 15, 155–176. [Google Scholar] [CrossRef]
- Papathanasiou, P.; Perkins, A.C.; Cobb, B.S.; Ferrini, R.; Sridharan, R.; Hoyne, G.F.; Nelms, K.A.; Smale, S.T.; Goodnow, C.C. Widespread failure of hematolymphoid differentiation caused by a recessive niche-filling allele of the Ikaros transcription factor. Immunity 2003, 19, 131–144. [Google Scholar] [CrossRef]
- Nakagawa, H.; Wang, L.; Cantor, H.; Kim, H.J. New Insights Into the Biology of CD8 Regulatory T Cells. Adv Immunol 2018, 140, 1–20. [Google Scholar] [CrossRef]
- Morgan, B.; Sun, L.; Avitahl, N.; Andrikopoulos, K.; Ikeda, T.; Gonzales, E.; Wu, P.; Neben, S.; Georgopoulos, K. Aiolos, a lymphoid restricted transcription factor that interacts with Ikaros to regulate lymphocyte differentiation. The EMBO journal 1997, 16, 2004–2013. [Google Scholar] [CrossRef]
- Person, R.E.; Li, F.Q.; Duan, Z.; Benson, K.F.; Wechsler, J.; Papadaki, H.A.; Eliopoulos, G.; Kaufman, C.; Bertolone, S.J.; Nakamoto, B.; et al. Mutations in proto-oncogene GFI1 cause human neutropenia and target ELA2. Nat Genet 2003, 34, 308–312. [Google Scholar] [CrossRef]
- Williams, T.M.; Moolten, D.; Burlein, J.; Romano, J.; Bhaerman, R.; Godillot, A.; Mellon, M.; Rauscher, F.J., 3rd; Kant, J.A. Identification of a zinc finger protein that inhibits IL-2 gene expression. Science 1991, 254, 1791–1794. [Google Scholar] [CrossRef]
- Bassez, G.; Camand, O.J.; Cacheux, V.; Kobetz, A.; Dastot-Le Moal, F.; Marchant, D.; Catala, M.; Abitbol, M.; Goossens, M. Pleiotropic and diverse expression of ZFHX1B gene transcripts during mouse and human development supports the various clinical manifestations of the "Mowat-Wilson" syndrome. Neurobiol Dis 2004, 15, 240–250. [Google Scholar] [CrossRef] [PubMed]
- Wu, X.; Briseno, C.G.; Grajales-Reyes, G.E.; Haldar, M.; Iwata, A.; Kretzer, N.M.; Kc, W.; Tussiwand, R.; Higashi, Y.; Murphy, T.L.; et al. Transcription factor Zeb2 regulates commitment to plasmacytoid dendritic cell and monocyte fate. Proc Natl Acad Sci U S A 2016, 113, 14775–14780. [Google Scholar] [CrossRef] [PubMed]
- Chen, X.; Johns, D.C.; Geiman, D.E.; Marban, E.; Dang, D.T.; Hamlin, G.; Sun, R.; Yang, V.W. Kruppel-like factor 4 (gut-enriched Kruppel-like factor) inhibits cell proliferation by blocking G1/S progression of the cell cycle. J Biol Chem 2001, 276, 30423–30428. [Google Scholar] [CrossRef]
- Das, S.; Raj, L.; Zhao, B.; Kimura, Y.; Bernstein, A.; Aaronson, S.A.; Lee, S.W. Hzf Determines cell survival upon genotoxic stress by modulating p53 transactivation. Cell 2007, 130, 624–637. [Google Scholar] [CrossRef]
- Nakayama, K.; Kim, K.W.; Miyajima, A. A novel nuclear zinc finger protein EZI enhances nuclear retention and transactivation of STAT3. The EMBO journal 2002, 21, 6174–6184. [Google Scholar] [CrossRef]
- Li, L.; Nakaya, N.; Chavali, V.R.; Ma, Z.; Jiao, X.; Sieving, P.A.; Riazuddin, S.; Tomarev, S.I.; Ayyagari, R.; Riazuddin, S.A.; et al. A mutation in ZNF513, a putative regulator of photoreceptor development, causes autosomal-recessive retinitis pigmentosa. American journal of human genetics 2010, 87, 400–409. [Google Scholar] [CrossRef]
- Matsubara, E.; Sakai, I.; Yamanouchi, J.; Fujiwara, H.; Yakushijin, Y.; Hato, T.; Shigemoto, K.; Yasukawa, M. The role of zinc finger protein 521/early hematopoietic zinc finger protein in erythroid cell differentiation. J Biol Chem 2009, 284, 3480–3487. [Google Scholar] [CrossRef]
- Nakamura, M.; Choe, S.K.; Runko, A.P.; Gardner, P.D.; Sagerstrom, C.G. Nlz1/Znf703 acts as a repressor of transcription. BMC Dev Biol 2008, 8, 108. [Google Scholar] [CrossRef]
- Zhang, L.; Zhu, B.; Zhou, X.; Ning, H.; Zhang, F.; Yan, B.; Chen, J.; Ma, T. ZNF787 and HDAC1 Mediate Blood-Brain Barrier Permeability in an In Vitro Model of Alzheimer's Disease Microenvironment. Neurotox Res 2024, 42, 12. [Google Scholar] [CrossRef]
- Yang, S.F.; Nelson, C.B.; Wells, J.K.; Fernando, M.; Lu, R.; Allen, J.A.M.; Malloy, L.; Lamm, N.; Murphy, V.J.; Mackay, J.P.; et al. ZNF827 is a single-stranded DNA binding protein that regulates the ATR-CHK1 DNA damage response pathway. Nat Commun 2024, 15, 2210. [Google Scholar] [CrossRef]
- Fan, J.; Zhang, Z.; Chen, H.; Chen, D.; Yuan, W.; Li, J.; Zeng, Y.; Zhou, S.; Zhang, S.; Zhang, G.; et al. Zinc finger protein 831 promotes apoptosis and enhances chemosensitivity in breast cancer by acting as a novel transcriptional repressor targeting the STAT3/Bcl2 signaling pathway. Genes Dis 2024, 11, 430–448. [Google Scholar] [CrossRef]
- Dhondalay, G.K.R.; Bunning, B.; Bauer, R.N.; Barnathan, E.S.; Maniscalco, C.; Baribaud, F.; Nadeau, K.C.; Andorf, S. Transcriptomic and methylomic features in asthmatic and nonasthmatic twins. Allergy 2020, 75, 989–992. [Google Scholar] [CrossRef] [PubMed]
- Carapito, R.; Ivanova, E.L.; Morlon, A.; Meng, L.; Molitor, A.; Erdmann, E.; Kieffer, B.; Pichot, A.; Naegely, L.; Kolmer, A.; et al. ZMIZ1 Variants Cause a Syndromic Neurodevelopmental Disorder. American journal of human genetics 2019, 104, 319–330. [Google Scholar] [CrossRef] [PubMed]
- Voo, K.S.; Carlone, D.L.; Jacobsen, B.M.; Flodin, A.; Skalnik, D.G. Cloning of a mammalian transcriptional activator that binds unmethylated CpG motifs and shares a CXXC domain with DNA methyltransferase, human trithorax, and methyl-CpG binding domain protein 1. Mol Cell Biol 2000, 20, 2108–2121. [Google Scholar] [CrossRef] [PubMed]
- Krausgruber, T.; Blazek, K.; Smallie, T.; Alzabin, S.; Lockstone, H.; Sahgal, N.; Hussell, T.; Feldmann, M.; Udalova, I.A. IRF5 promotes inflammatory macrophage polarization and TH1-TH17 responses. Nat Immunol 2011, 12, 231–238. [Google Scholar] [CrossRef] [PubMed]
- Ohlsson, E.; Schuster, M.B.; Hasemann, M.; Porse, B.T. The multifaceted functions of C/EBPalpha in normal and malignant haematopoiesis. Leukemia 2016, 30, 767–775. [Google Scholar] [CrossRef]
- Shavit, J.A.; Motohashi, H.; Onodera, K.; Akasaka, J.; Yamamoto, M.; Engel, J.D. Impaired megakaryopoiesis and behavioral defects in mafG-null mutant mice. Genes Dev 1998, 12, 2164–2174. [Google Scholar] [CrossRef]
- Subbalakshmi, A.R.; Sahoo, S.; Manjunatha, P.; Goyal, S.; Kasiviswanathan, V.A.; Mahesh, Y.; Ramu, S.; McMullen, I.; Somarelli, J.A.; Jolly, M.K. The ELF3 transcription factor is associated with an epithelial phenotype and represses epithelial-mesenchymal transition. J Biol Eng 2023, 17, 17. [Google Scholar] [CrossRef]
- Wu, X.; Gao, H.; Bleday, R.; Zhu, Z. Homeobox transcription factor VentX regulates differentiation and maturation of human dendritic cells. J Biol Chem 2014, 289, 14633–14643. [Google Scholar] [CrossRef]
- Wysokinski, D.; Pawlowska, E.; Blasiak, J. RUNX2: A Master Bone Growth Regulator That May Be Involved in the DNA Damage Response. DNA Cell Biol 2015, 34, 305–315. [Google Scholar] [CrossRef]
- Tsuchiya, M.; Misaka, R.; Nitta, K.; Tsuchiya, K. Transcriptional factors, Mafs and their biological roles. World J Diabetes 2015, 6, 175–183. [Google Scholar] [CrossRef] [PubMed]
- Nie, Z.; Hu, G.; Wei, G.; Cui, K.; Yamane, A.; Resch, W.; Wang, R.; Green, D.R.; Tessarollo, L.; Casellas, R.; et al. c-Myc is a universal amplifier of expressed genes in lymphocytes and embryonic stem cells. Cell 2012, 151, 68–79. [Google Scholar] [CrossRef] [PubMed]
- Pires-daSilva, A.; Nayernia, K.; Engel, W.; Torres, M.; Stoykova, A.; Chowdhury, K.; Gruss, P. Mice deficient for spermatid perinuclear RNA-binding protein show neurologic, spermatogenic, and sperm morphological abnormalities. Dev Biol 2001, 233, 319–328. [Google Scholar] [CrossRef]
- Yeo, M.; Lin, P.S.; Dahmus, M.E.; Gill, G.N. A novel RNA polymerase II C-terminal domain phosphatase that preferentially dephosphorylates serine 5. J Biol Chem 2003, 278, 26078–26085. [Google Scholar] [CrossRef]
- Woodward, L.A.; Mabin, J.W.; Gangras, P.; Singh, G. The exon junction complex: a lifelong guardian of mRNA fate. Wiley Interdiscip Rev RNA 2017, 8. [Google Scholar] [CrossRef]
- Sarkar, A.; Hochedlinger, K. The sox family of transcription factors: versatile regulators of stem and progenitor cell fate. Cell Stem Cell 2013, 12, 15–30. [Google Scholar] [CrossRef]
- Takeda, K.; Akira, S. STAT family of transcription factors in cytokine-mediated biological responses. Cytokine & growth factor reviews 2000, 11, 199–207. [Google Scholar] [CrossRef]
- Awasthi, N.; Liongue, C.; Ward, A.C. STAT proteins: a kaleidoscope of canonical and non-canonical functions in immunity and cancer. J Hematol Oncol 2021, 14, 198. [Google Scholar] [CrossRef]
- Nishikomori, R.; Usui, T.; Wu, C.Y.; Morinobu, A.; O'Shea, J.J.; Strober, W. Activated STAT4 has an essential role in Th1 differentiation and proliferation that is independent of its role in the maintenance of IL-12R beta 2 chain expression and signaling. J Immunol 2002, 169, 4388–4398. [Google Scholar] [CrossRef]
- Upadhyay, V.; Fu, Y.X. Lymphotoxin signalling in immune homeostasis and the control of microorganisms. Nat Rev Immunol 2013, 13, 270–279. [Google Scholar] [CrossRef]
- Nicola, N.A.; Babon, J.J. Leukemia inhibitory factor (LIF). Cytokine & growth factor reviews 2015, 26, 533–544. [Google Scholar] [CrossRef]
- Dadey, R.E.; Grebinoski, S.; Zhang, Q.; Brunazzi, E.A.; Burton, A.; Workman, C.J.; Vignali, D.A.A. Regulatory T Cell-Derived TRAIL Is Not Required for Peripheral Tolerance. Immunohorizons 2021, 5, 48–58. [Google Scholar] [CrossRef]
- Aass, K.R.; Kastnes, M.H.; Standal, T. Molecular interactions and functions of IL-32. J Leukoc Biol 2021, 109, 143–159. [Google Scholar] [CrossRef]
- Deshmane, S.L.; Kremlev, S.; Amini, S.; Sawaya, B.E. Monocyte chemoattractant protein-1 (MCP-1): an overview. t: Journal of interferon & cytokine research, 2009; 29. [Google Scholar] [CrossRef]
- Hinrichs, A.C.; Blokland, S.L.M.; Kruize, A.A.; Lafeber, F.P.J.; Leavis, H.L.; van Roon, J.A.G. CCL5 Release by CCR9+ CD8 T Cells: A Potential Contributor to Immunopathology of Primary Sjogren's Syndrome. Frontiers in immunology 2022, 13, 887972. [Google Scholar] [CrossRef]
- Zimmers, T.A.; Jin, X.; Hsiao, E.C.; McGrath, S.A.; Esquela, A.F.; Koniaris, L.G. Growth differentiation factor-15/macrophage inhibitory cytokine-1 induction after kidney and lung injury. Shock 2005, 23, 543–548. [Google Scholar]
- Wang, X.; Hu, G.; Betts, C.; Harmon, E.Y.; Keller, R.S.; Van De Water, L.; Zhou, J. Transforming growth factor-beta1-induced transcript 1 protein, a novel marker for smooth muscle contractile phenotype, is regulated by serum response factor/myocardin protein. J Biol Chem 2011, 286, 41589–41599. [Google Scholar] [CrossRef]
- Kadmiel, M.; Fritz-Six, K.; Pacharne, S.; Richards, G.O.; Li, M.; Skerry, T.M.; Caron, K.M. Research resource: Haploinsufficiency of receptor activity-modifying protein-2 (RAMP2) causes reduced fertility, hyperprolactinemia, skeletal abnormalities, and endocrine dysfunction in mice. Mol Endocrinol 2011, 25, 1244–1253. [Google Scholar] [CrossRef]
- Gray, A.L.; Karlsson, R.; Roberts, A.R.E.; Ridley, A.J.L.; Pun, N.; Khan, B.; Lawless, C.; Luis, R.; Szpakowska, M.; Chevigne, A.; et al. Chemokine CXCL4 interactions with extracellular matrix proteoglycans mediate widespread immune cell recruitment independent of chemokine receptors. Cell Rep 2023, 42, 111930. [Google Scholar] [CrossRef]
- Lin, H.H.; Stacey, M.; Hamann, J.; Gordon, S.; McKnight, A.J. Human EMR2, a novel EGF-TM7 molecule on chromosome 19p13.1, is closely related to CD97. Genomics 2000, 67, 188–200. [Google Scholar] [CrossRef]
- Yona, S.; Lin, H.H.; Dri, P.; Davies, J.Q.; Hayhoe, R.P.; Lewis, S.M.; Heinsbroek, S.E.; Brown, K.A.; Perretti, M.; Hamann, J.; et al. Ligation of the adhesion-GPCR EMR2 regulates human neutrophil function. FASEB J 2008, 22, 741–751. [Google Scholar] [CrossRef]
- Jia, L.; Shi, Y.; Wen, Y.; Li, W.; Feng, J.; Chen, C. The roles of TNFAIP2 in cancers and infectious diseases. J Cell Mol Med 2018, 22, 5188–5195. [Google Scholar] [CrossRef] [PubMed]
- Lee, E.G.; Boone, D.L.; Chai, S.; Libby, S.L.; Chien, M.; Lodolce, J.P.; Ma, A. Failure to regulate TNF-induced NF-kappaB and cell death responses in A20-deficient mice. Science 2000, 289, 2350–2354. [Google Scholar] [CrossRef] [PubMed]
- Corona, A.; Blobe, G.C. The role of the extracellular matrix protein TGFBI in cancer. Cell Signal 2021, 84, 110028. [Google Scholar] [CrossRef]
- Hickford, D.; Frankenberg, S.; Shaw, G.; Renfree, M.B. Evolution of vertebrate interferon inducible transmembrane proteins. BMC genomics 2012, 13, 155. [Google Scholar] [CrossRef]
- Su, A.I.; Wiltshire, T.; Batalov, S.; Lapp, H.; Ching, K.A.; Block, D.; Zhang, J.; Soden, R.; Hayakawa, M.; Kreiman, G.; et al. A gene atlas of the mouse and human protein-encoding transcriptomes. Proc Natl Acad Sci U S A 2004, 101, 6062–6067. [Google Scholar] [CrossRef]
- Stanley, E.R.; Berg, K.L.; Einstein, D.B.; Lee, P.S.; Pixley, F.J.; Wang, Y.; Yeung, Y.G. Biology and action of colony--stimulating factor-1. Mol Reprod Dev 1997, 46, 4–10. [Google Scholar] [CrossRef]
- Yu, G.; Boone, T.; Delaney, J.; Hawkins, N.; Kelley, M.; Ramakrishnan, M.; McCabe, S.; Qiu, W.R.; Kornuc, M.; Xia, X.Z.; et al. APRIL and TALL-I and receptors BCMA and TACI: system for regulating humoral immunity. Nat Immunol 2000, 1, 252–256. [Google Scholar] [CrossRef]
- Cascalho, M.; Platt, J.L. TNFRSF13B Diversification Fueled by B Cell Responses to Environmental Challenges-A Hypothesis. Frontiers in immunology 2021, 12, 634544. [Google Scholar] [CrossRef]
- Seshasayee, D.; Valdez, P.; Yan, M.; Dixit, V.M.; Tumas, D.; Grewal, I.S. Loss of TACI causes fatal lymphoproliferation and autoimmunity, establishing TACI as an inhibitory BLyS receptor. Immunity 2003, 18, 279–288. [Google Scholar] [CrossRef]
- Rauch, M.; Tussiwand, R.; Bosco, N.; Rolink, A.G. Crucial role for BAFF-BAFF-R signaling in the survival and maintenance of mature B cells. PLoS One 2009, 4, e5456. [Google Scholar] [CrossRef]
- Thum, E.; Shao, Z.; Schwarz, H. CD137, implications in immunity and potential for therapy. Front Biosci (Landmark Ed) 2009, 14, 4173–4188. [Google Scholar] [CrossRef] [PubMed]
- Wensman, H.; Kamgari, N.; Johansson, A.; Grujic, M.; Calounova, G.; Lundequist, A.; Ronnberg, E.; Pejler, G. Tumor-mast cell interactions: induction of pro-tumorigenic genes and anti-tumorigenic 4-1BB in MCs in response to Lewis Lung Carcinoma. Mol Immunol 2012, 50, 210–219. [Google Scholar] [CrossRef] [PubMed]
- Pan, G.; Bauer, J.H.; Haridas, V.; Wang, S.; Liu, D.; Yu, G.; Vincenz, C.; Aggarwal, B.B.; Ni, J.; Dixit, V.M. Identification and functional characterization of DR6, a novel death domain-containing TNF receptor. FEBS letters 1998, 431, 351–356. [Google Scholar] [CrossRef] [PubMed]
- Chang, Y.H.; Hsieh, S.L.; Chen, M.C.; Lin, W.W. Lymphotoxin beta receptor induces interleukin 8 gene expression via NF-kappaB and AP-1 activation. Exp Cell Res 2002, 278, 166–174. [Google Scholar] [CrossRef]
- Zou, Y.R.; Kottmann, A.H.; Kuroda, M.; Taniuchi, I.; Littman, D.R. Function of the chemokine receptor CXCR4 in haematopoiesis and in cerebellar development. Nature 1998, 393, 595–599. [Google Scholar] [CrossRef]
- Miyasaka, M.; Tanaka, T. Lymphocyte trafficking across high endothelial venules: dogmas and enigmas. Nat Rev Immunol 2004, 4, 360–370. [Google Scholar] [CrossRef]
- Forster, R.; Mattis, A.E.; Kremmer, E.; Wolf, E.; Brem, G.; Lipp, M. A putative chemokine receptor, BLR1, directs B cell migration to defined lymphoid organs and specific anatomic compartments of the spleen. Cell 1996, 87, 1037–1047. [Google Scholar] [CrossRef]
- Hardtke, S.; Ohl, L.; Forster, R. Balanced expression of CXCR5 and CCR7 on follicular T helper cells determines their transient positioning to lymph node follicles and is essential for efficient B-cell help. Blood 2005, 106, 1924–1931. [Google Scholar] [CrossRef]
- Schutyser, E.; Struyf, S.; Van Damme, J. The CC chemokine CCL20 and its receptor CCR6. Cytokine & growth factor reviews 2003, 14, 409–426. [Google Scholar] [CrossRef]
- Yamazaki, T.; Yang, X.O.; Chung, Y.; Fukunaga, A.; Nurieva, R.; Pappu, B.; Martin-Orozco, N.; Kang, H.S.; Ma, L.; Panopoulos, A.D.; et al. CCR6 regulates the migration of inflammatory and regulatory T cells. J Immunol 2008, 181, 8391–8401. [Google Scholar] [CrossRef]
- Alrumaihi, F. The Multi-Functional Roles of CCR7 in Human Immunology and as a Promising Therapeutic Target for Cancer Therapeutics. Front Mol Biosci 2022, 9, 834149. [Google Scholar] [CrossRef] [PubMed]
- Sharma, N.; Benechet, A.P.; Lefrancois, L.; Khanna, K.M. CD8 T Cells Enter the Splenic T Cell Zones Independently of CCR7, but the Subsequent Expansion and Trafficking Patterns of Effector T Cells after Infection Are Dysregulated in the Absence of CCR7 Migratory Cues. J Immunol 2015, 195, 5227–5236. [Google Scholar] [CrossRef] [PubMed]
- Babina, M.; Wang, Z.; Franke, K.; Zuberbier, T. Thymic Stromal Lymphopoietin Promotes MRGPRX2-Triggered Degranulation of Skin Mast Cells in a STAT5-Dependent Manner with Further Support from JNK. Cells 2021, 10. [Google Scholar] [CrossRef] [PubMed]
- Lin, S.C.; Cheng, F.Y.; Liu, J.J.; Ye, Y.L. Expression and Regulation of Thymic Stromal Lymphopoietin and Thymic Stromal Lymphopoietin Receptor Heterocomplex in the Innate-Adaptive Immunity of Pediatric Asthma. International journal of molecular sciences 2018, 19. [Google Scholar] [CrossRef] [PubMed]
- Juchem, K.W.; Gounder, A.P.; Gao, J.P.; Seccareccia, E.; Yeddula, N.; Huffmaster, N.J.; Cote-Martin, A.; Fogal, S.E.; Souza, D.; Wang, S.S.; et al. NFAM1 Promotes Pro-Inflammatory Cytokine Production in Mouse and Human Monocytes. Frontiers in immunology 2021, 12, 773445. [Google Scholar] [CrossRef]
- Kim, H.; Walsh, M.C.; Takegahara, N.; Middleton, S.A.; Shin, H.I.; Kim, J.; Choi, Y. The purinergic receptor P2X5 regulates inflammasome activity and hyper-multinucleation of murine osteoclasts. Sci Rep 2017, 7, 196. [Google Scholar] [CrossRef]
- Jeong, Y.H.; Walsh, M.C.; Yu, J.; Shen, H.; Wherry, E.J.; Choi, Y. Mice Lacking the Purinergic Receptor P2X5 Exhibit Defective Inflammasome Activation and Early Susceptibility to Listeria monocytogenes. J Immunol 2020, 205, 760–766. [Google Scholar] [CrossRef]
- Yamauchi, T.; Kamon, J.; Ito, Y.; Tsuchida, A.; Yokomizo, T.; Kita, S.; Sugiyama, T.; Miyagishi, M.; Hara, K.; Tsunoda, M.; et al. Cloning of adiponectin receptors that mediate antidiabetic metabolic effects. Nature 2003, 423, 762–769. [Google Scholar] [CrossRef]
- Luo, J.; Sladek, R.; Carrier, J.; Bader, J.A.; Richard, D.; Giguere, V. Reduced fat mass in mice lacking orphan nuclear receptor estrogen-related receptor alpha. Mol Cell Biol 2003, 23, 7947–7956. [Google Scholar] [CrossRef]
- Johnson, M. Molecular mechanisms of beta(2)-adrenergic receptor function, response, and regulation. J Allergy Clin Immunol 2006, 117, 18–24. [Google Scholar] [CrossRef]
- Rebordosa, C.; Kogevinas, M.; Guerra, S.; Castro-Giner, F.; Jarvis, D.; Cazzoletti, L.; Pin, I.; Siroux, V.; Wjst, M.; Anto, J.M.; et al. ADRB2 Gly16Arg polymorphism, asthma control and lung function decline. Eur Respir J 2011, 38, 1029–1035. [Google Scholar] [CrossRef] [PubMed]
- Galiegue, S.; Mary, S.; Marchand, J.; Dussossoy, D.; Carriere, D.; Carayon, P.; Bouaboula, M.; Shire, D.; Le Fur, G.; Casellas, P. Expression of central and peripheral cannabinoid receptors in human immune tissues and leukocyte subpopulations. European journal of biochemistry / FEBS 1995, 232, 54–61. [Google Scholar] [CrossRef] [PubMed]
- Huang, P.; Chandra, V.; Rastinejad, F. Retinoic acid actions through mammalian nuclear receptors. Chem Rev 2014, 114, 233–254. [Google Scholar] [CrossRef] [PubMed]
- Harman, J.L.; Sayers, J.; Chapman, C.; Pellet-Many, C. Emerging Roles for Neuropilin-2 in Cardiovascular Disease. International journal of molecular sciences 2020, 21. [Google Scholar] [CrossRef]
- Bu, G.; Geuze, H.J.; Strous, G.J.; Schwartz, A.L. 39 kDa receptor-associated protein is an ER resident protein and molecular chaperone for LDL receptor-related protein. The EMBO journal 1995, 14, 2269–2280. [Google Scholar] [CrossRef]
- Chiang, N.; Dalli, J.; Colas, R.A.; Serhan, C.N. Identification of resolvin D2 receptor mediating resolution of infections and organ protection. J Exp Med 2015, 212, 1203–1217. [Google Scholar] [CrossRef]
- Liang, J.; Inoue, A.; Ikuta, T.; Xia, R.; Wang, N.; Kawakami, K.; Xu, Z.; Qian, Y.; Zhu, X.; Zhang, A.; et al. Structural basis of lysophosphatidylserine receptor GPR174 ligand recognition and activation. Nat Commun 2023, 14, 1012. [Google Scholar] [CrossRef]
- Yue, J.; Zhao, X. GPR174 suppression attenuates retinopathy in angiotensin II (Ang II)-treated mice by reducing inflammation via PI3K/AKT signaling. Biomed Pharmacother 2020, 122, 109701. [Google Scholar] [CrossRef]
- Singh, A.K.; Lin, H.H. The role of GPR56/ADGRG1 in health and disease. Biomed J 2021, 44, 534–547. [Google Scholar] [CrossRef]
- Fredriksson, R.; Hoglund, P.J.; Gloriam, D.E.; Lagerstrom, M.C.; Schioth, H.B. Seven evolutionarily conserved human rhodopsin G protein-coupled receptors lacking close relatives. FEBS letters 2003, 554, 381–388. [Google Scholar] [CrossRef]
- Kirkpatrick, L.L.; Matzuk, M.M.; Dodds, D.C.; Perin, M.S. Biochemical interactions of the neuronal pentraxins. Neuronal pentraxin (NP) receptor binds to taipoxin and taipoxin-associated calcium-binding protein 49 via NP1 and NP2. J Biol Chem 2000, 275, 17786–17792. [Google Scholar] [CrossRef] [PubMed]
- Gembardt, F.; Grajewski, S.; Vahl, M.; Schultheiss, H.P.; Walther, T. Angiotensin metabolites can stimulate receptors of the Mas-related genes family. Mol Cell Biochem 2008, 319, 115–123. [Google Scholar] [CrossRef] [PubMed]
- Santschi, E.M.; Purdy, A.K.; Valberg, S.J.; Vrotsos, P.D.; Kaese, H.; Mickelson, J.R. Endothelin receptor B polymorphism associated with lethal white foal syndrome in horses. Mamm Genome 1998, 9, 306–309. [Google Scholar] [CrossRef] [PubMed]
- Li, M.; Zhou, L.; Sun, X.; Yang, Y.; Zhang, C.; Wang, T.; Fu, F. Dopamine, a co-regulatory component, bridges the central nervous system and the immune system. Biomed Pharmacother 2022, 145, 112458. [Google Scholar] [CrossRef]
- Rampino, A.; Marakhovskaia, A.; Soares-Silva, T.; Torretta, S.; Veneziani, F.; Beaulieu, J.M. Antipsychotic Drug Responsiveness and Dopamine Receptor Signaling; Old Players and New Prospects. Front Psychiatry 2018, 9, 702. [Google Scholar] [CrossRef]
- Mullen, R.D.; Ontiveros, A.E.; Moses, M.M.; Behringer, R.R. AMH and AMHR2 mutations: A spectrum of reproductive phenotypes across vertebrate species. Dev Biol 2019, 455, 1–9. [Google Scholar] [CrossRef]
- Miwatashi, S.; Arikawa, Y.; Matsumoto, T.; Uga, K.; Kanzaki, N.; Imai, Y.N.; Ohkawa, S. Synthesis and biological activities of 4-phenyl-5-pyridyl-1,3-thiazole derivatives as selective adenosine A3 antagonists. Chem Pharm Bull (Tokyo) 2008, 56, 1126–1137. [Google Scholar] [CrossRef]
- Prevo, R.; Banerji, S.; Ni, J.; Jackson, D.G. Rapid plasma membrane-endosomal trafficking of the lymph node sinus and high endothelial venule scavenger receptor/homing receptor stabilin-1 (FEEL-1/CLEVER-1). J Biol Chem 2004, 279, 52580–52592. [Google Scholar] [CrossRef]
- Kawamata, Y.; Fujii, R.; Hosoya, M.; Harada, M.; Yoshida, H.; Miwa, M.; Fukusumi, S.; Habata, Y.; Itoh, T.; Shintani, Y.; et al. A G protein-coupled receptor responsive to bile acids. J Biol Chem 2003, 278, 9435–9440. [Google Scholar] [CrossRef]
- Tanaka, Y.; Yamaki, F.; Koike, K.; Toro, L. New insights into the intracellular mechanisms by which PGI2 analogues elicit vascular relaxation: cyclic AMP-independent, Gs-protein mediated-activation of MaxiK channel. Curr Med Chem Cardiovasc Hematol Agents 2004, 2, 257–265. [Google Scholar] [CrossRef]
- Actis Dato, V.; Chiabrando, G.A. The Role of Low-Density Lipoprotein Receptor-Related Protein 1 in Lipid Metabolism, Glucose Homeostasis and Inflammation. International journal of molecular sciences 2018, 19. [Google Scholar] [CrossRef] [PubMed]
- Etique, N.; Verzeaux, L.; Dedieu, S.; Emonard, H. LRP-1: a checkpoint for the extracellular matrix proteolysis. Biomed Res Int 2013, 2013, 152163. [Google Scholar] [CrossRef] [PubMed]
- Lillis, A.P.; Mikhailenko, I.; Strickland, D.K. Beyond endocytosis: LRP function in cell migration, proliferation and vascular permeability. J Thromb Haemost 2005, 3, 1884–1893. [Google Scholar] [CrossRef] [PubMed]
- Brown, M.L.; Ramprasad, M.P.; Umeda, P.K.; Tanaka, A.; Kobayashi, Y.; Watanabe, T.; Shimoyamada, H.; Kuo, W.L.; Li, R.; Song, R.; et al. A macrophage receptor for apolipoprotein B48: cloning, expression, and atherosclerosis. Proc Natl Acad Sci U S A 2000, 97, 7488–7493. [Google Scholar] [CrossRef]
- Moore, D.D.; Kato, S.; Xie, W.; Mangelsdorf, D.J.; Schmidt, D.R.; Xiao, R.; Kliewer, S.A. International Union of Pharmacology. LXII. The NR1H and NR1I receptors: constitutive androstane receptor, pregnene X receptor, farnesoid X receptor alpha, farnesoid X receptor beta, liver X receptor alpha, liver X receptor beta, and vitamin D receptor. Pharmacol Rev 2006, 58, 742–759. [Google Scholar] [CrossRef]
- Fleet, J.C.; Schoch, R.D. Molecular mechanisms for regulation of intestinal calcium absorption by vitamin D and other factors. Crit Rev Clin Lab Sci 2010, 47, 181–195. [Google Scholar] [CrossRef]
- Ramirez-Ortiz, Z.G.; Pendergraft, W.F., 3rd; Prasad, A.; Byrne, M.H.; Iram, T.; Blanchette, C.J.; Luster, A.D.; Hacohen, N.; El Khoury, J.; Means, T.K. The scavenger receptor SCARF1 mediates the clearance of apoptotic cells and prevents autoimmunity. Nat Immunol 2013, 14, 917–926. [Google Scholar] [CrossRef]
- Tachibana, I.; Bodorova, J.; Berditchevski, F.; Zutter, M.M.; Hemler, M.E. NAG-2, a novel transmembrane-4 superfamily (TM4SF) protein that complexes with integrins and other TM4SF proteins. J Biol Chem 1997, 272, 29181–29189. [Google Scholar] [CrossRef]
- Dharan, R.; Huang, Y.; Cheppali, S.K.; Goren, S.; Shendrik, P.; Wang, W.; Qiao, J.; Kozlov, M.M.; Yu, L.; Sorkin, R. Tetraspanin 4 stabilizes membrane swellings and facilitates their maturation into migrasomes. Nat Commun 2023, 14, 1037. [Google Scholar] [CrossRef]
- Dong, X.P.; Cheng, X.; Mills, E.; Delling, M.; Wang, F.; Kurz, T.; Xu, H. The type IV mucolipidosis-associated protein TRPML1 is an endolysosomal iron release channel. Nature 2008, 455, 992–996. [Google Scholar] [CrossRef]
- Di Paola, S.; Scotto-Rosato, A.; Medina, D.L. TRPML1: The Ca((2+))retaker of the lysosome. Cell Calcium 2018, 69, 112–121. [Google Scholar] [CrossRef] [PubMed]
- Junqueira Alves, C.; Dariolli, R.; Haydak, J.; Kang, S.; Hannah, T.; Wiener, R.J.; DeFronzo, S.; Tejero, R.; Gusella, G.L.; Ramakrishnan, A.; et al. Plexin-B2 orchestrates collective stem cell dynamics via actomyosin contractility, cytoskeletal tension and adhesion. Nat Commun 2021, 12, 6019. [Google Scholar] [CrossRef] [PubMed]
- Zhong, Z.; Zhai, Y.; Liang, S.; Mori, Y.; Han, R.; Sutterwala, F.S.; Qiao, L. TRPM2 links oxidative stress to NLRP3 inflammasome activation. Nat Commun 2013, 4, 1611. [Google Scholar] [CrossRef] [PubMed]
- Yamamoto, S.; Shimizu, S.; Kiyonaka, S.; Takahashi, N.; Wajima, T.; Hara, Y.; Negoro, T.; Hiroi, T.; Kiuchi, Y.; Okada, T.; et al. TRPM2-mediated Ca2+influx induces chemokine production in monocytes that aggravates inflammatory neutrophil infiltration. Nature medicine 2008, 14, 738–747. [Google Scholar] [CrossRef] [PubMed]
- Zheng, S.; Abreu, N.; Levitz, J.; Kruse, A.C. Structural basis for KCTD-mediated rapid desensitization of GABA(B) signalling. Nature 2019, 567, 127–131. [Google Scholar] [CrossRef] [PubMed]
- DeCoursey, T.E.; Chandy, K.G.; Gupta, S.; Cahalan, M.D. Voltage-gated K+ channels in human T lymphocytes: a role in mitogenesis? Nature 1984, 307, 465–468. [Google Scholar] [CrossRef]
- Zou, A.; Lin, Z.; Humble, M.; Creech, C.D.; Wagoner, P.K.; Krafte, D.; Jegla, T.J.; Wickenden, A.D. Distribution and functional properties of human KCNH8 (Elk1) potassium channels. Am J Physiol Cell Physiol 2003, 285, C1356–1366. [Google Scholar] [CrossRef]
- Tokhtaeva, E.; Sachs, G.; Vagin, O. Assembly with the Na,K-ATPase alpha(1) subunit is required for export of beta(1) and beta(2) subunits from the endoplasmic reticulum. Biochemistry 2009, 48, 11421–11431. [Google Scholar] [CrossRef]
- Li, B.; Hoel, C.M.; Brohawn, S.G. Structures of tweety homolog proteins TTYH2 and TTYH3 reveal a Ca(2+)-dependent switch from intra- to intermembrane dimerization. Nat Commun 2021, 12, 6913. [Google Scholar] [CrossRef]
- Sweadner, K.J.; Rael, E. The FXYD gene family of small ion transport regulators or channels: cDNA sequence, protein signature sequence, and expression. Genomics 2000, 68, 41–56. [Google Scholar] [CrossRef]
- Watanabe, K.; Hasegawa, Y.; Yamashita, H.; Shimizu, K.; Ding, Y.; Abe, M.; Ohta, H.; Imagawa, K.; Hojo, K.; Maki, H.; et al. Vasohibin as an endothelium-derived negative feedback regulator of angiogenesis. J Clin Invest 2004, 114, 898–907. [Google Scholar] [CrossRef] [PubMed]
- Li, D.Y.; Sorensen, L.K.; Brooke, B.S.; Urness, L.D.; Davis, E.C.; Taylor, D.G.; Boak, B.B.; Wendel, D.P. Defective angiogenesis in mice lacking endoglin. Science 1999, 284, 1534–1537. [Google Scholar] [CrossRef] [PubMed]
- Bhattacherjee, A.; Daskhan, G.C.; Bains, A.; Watson, A.E.S.; Eskandari-Sedighi, G.; St Laurent, C.D.; Voronova, A.; Macauley, M.S. Increasing phagocytosis of microglia by targeting CD33 with liposomes displaying glycan ligands. J Control Release 2021, 338, 680–693. [Google Scholar] [CrossRef] [PubMed]
- Erickson-Miller CL, Freeman SD, Hopson CB, D'Alessio KJ, Fischer EI, Kikly KK, et al. Characterization of Siglec-5 (CD170) expression and functional activity of anti-Siglec-5 antibodies on human phagocytes. Exp Hematol. 3: 2003;31(5), 2003.
- Suematsu, R.; Miyamoto, T.; Saijo, S.; Yamasaki, S.; Tada, Y.; Yoshida, H.; Miyake, Y. Identification of lipophilic ligands of Siglec5 and -14 that modulate innate immune responses. J Biol Chem 2019, 294, 16776–16788. [Google Scholar] [CrossRef]
- Ali, S.R.; Fong, J.J.; Carlin, A.F.; Busch, T.D.; Linden, R.; Angata, T.; Areschoug, T.; Parast, M.; Varki, N.; Murray, J.; et al. Siglec-5 and Siglec-14 are polymorphic paired receptors that modulate neutrophil and amnion signaling responses to group B Streptococcus. J Exp Med 2014, 211, 1231–1242. [Google Scholar] [CrossRef]
- Yokoi, H.; Myers, A.; Matsumoto, K.; Crocker, P.R.; Saito, H.; Bochner, B.S. Alteration and acquisition of Siglecs during in vitro maturation of CD34+ progenitors into human mast cells. Allergy 2006, 61, 769–776. [Google Scholar] [CrossRef]
- Brinkman-Van der Linden, E.C.; Varki, A. New aspects of siglec binding specificities, including the significance of fucosylation and of the sialyl-Tn epitope. Sialic acid-binding immunoglobulin superfamily lectins. J Biol Chem 2000, 275, 8625–8632. [Google Scholar] [CrossRef]
- Yoshimura, A.; Asahina, Y.; Chang, L.Y.; Angata, T.; Tanaka, H.; Kitajima, K.; Sato, C. Identification and functional characterization of a Siglec-7 counter-receptor on K562 cells. J Biol Chem 2021, 296, 100477. [Google Scholar] [CrossRef]
- Kikly, K.K.; Bochner, B.S.; Freeman, S.D.; Tan, K.B.; Gallagher, K.T.; D'Alessio K, J.; Holmes, S.D.; Abrahamson, J.A.; Erickson-Miller, C.L.; Murdock, P.R.; et al. Identification of SAF-2, a novel siglec expressed on eosinophils, mast cells, and basophils. J Allergy Clin Immunol 2000, 105, 1093–1100. [Google Scholar] [CrossRef]
- Yokoi, H.; Choi, O.H.; Hubbard, W.; Lee, H.S.; Canning, B.J.; Lee, H.H.; Ryu, S.D.; von Gunten, S.; Bickel, C.A.; Hudson, S.A.; et al. Inhibition of FcepsilonRI-dependent mediator release and calcium flux from human mast cells by sialic acid-binding immunoglobulin-like lectin 8 engagement. J Allergy Clin Immunol 2008, 121, 499–505. [Google Scholar] [CrossRef]
- Chen, G.Y.; Tang, J.; Zheng, P.; Liu, Y. CD24 and Siglec-10 selectively repress tissue damage-induced immune responses. Science 2009, 323, 1722–1725. [Google Scholar] [CrossRef] [PubMed]
- Okura, G.C.; Bharadwaj, A.G.; Waisman, D.M. Recent Advances in Molecular and Cellular Functions of S100A10. Biomolecules 2023, 13. [Google Scholar] [CrossRef] [PubMed]
- Donato, R.; Cannon, B.R.; Sorci, G.; Riuzzi, F.; Hsu, K.; Weber, D.J.; Geczy, C.L. Functions of S100 proteins. Curr Mol Med 2013, 13, 24–57. [Google Scholar] [CrossRef] [PubMed]
- Wang, G.; Rudland, P.S.; White, M.R.; Barraclough, R. Interaction in vivo and in vitro of the metastasis-inducing S100 protein, S100A4 (p9Ka) with S100A1. J Biol Chem 2000, 275, 11141–11146. [Google Scholar] [CrossRef]
- Wang, Y.; Kang, X.; Kang, X.; Yang, F. S100A6: molecular function and biomarker role. Biomark Res 2023, 11, 78. [Google Scholar] [CrossRef]
- Wang, S.; Song, R.; Wang, Z.; Jing, Z.; Wang, S.; Ma, J. S100A8/A9 in Inflammation. Frontiers in immunology 2018, 9, 1298. [Google Scholar] [CrossRef]
- Broome, A.M.; Eckert, R.L. Microtubule-dependent redistribution of a cytoplasmic cornified envelope precursor. The Journal of investigative dermatology 2004, 122, 29–38. [Google Scholar] [CrossRef]
- Mohammed, T.O.; Lin, Y.R.; Akter, L.; Weissenbruch, K.; Ngo, K.X.; Zhang, Y.; Kodera, N.; Bastmeyer, M.; Miyanari, Y.; Taoka, A.; et al. S100A11 promotes focal adhesion disassembly via myosin II-driven contractility and Piezo1-mediated Ca2+ entry. Journal of cell science 2024, 137. [Google Scholar] [CrossRef]
- Ashraf, A.P.K.; Gerke, V. The resealing factor S100A11 interacts with annexins and extended synaptotagmin-1 in the course of plasma membrane wound repair. Front Cell Dev Biol 2022, 10, 968164. [Google Scholar] [CrossRef]
- Pietzsch, J.; Hoppmann, S. Human S100A12: a novel key player in inflammation? Amino acids 2009, 36, 381–389. [Google Scholar] [CrossRef]
- Turner, C.E. Paxillin and focal adhesion signalling. Nat Cell Biol 2000, 2, E231–236. [Google Scholar] [CrossRef] [PubMed]
- Li, F.; Wilkins, P.P.; Crawley, S.; Weinstein, J.; Cummings, R.D.; McEver, R.P. Post-translational modifications of recombinant P-selectin glycoprotein ligand-1 required for binding to P- and E-selectin. J Biol Chem 1996, 271, 3255–3264. [Google Scholar] [CrossRef] [PubMed]
- Hadjantonakis, A.K.; Sheward, W.J.; Harmar, A.J.; de Galan, L.; Hoovers, J.M.; Little, P.F. Celsr1, a neural-specific gene encoding an unusual seven-pass transmembrane receptor, maps to mouse chromosome 15 and human chromosome 22qter. Genomics 1997, 45, 97–104. [Google Scholar] [CrossRef] [PubMed]
- Ciani, L.; Patel, A.; Allen, N.D.; ffrench-Constant, C. Mice lacking the giant protocadherin mFAT1 exhibit renal slit junction abnormalities and a partially penetrant cyclopia and anophthalmia phenotype. Mol Cell Biol 2003, 23, 3575–3582. [Google Scholar] [CrossRef]
- Itoh, M.; Morita, K.; Tsukita, S. Characterization of ZO-2 as a MAGUK family member associated with tight as well as adherens junctions with a binding affinity to occludin and alpha catenin. J Biol Chem 1999, 274, 5981–5986. [Google Scholar] [CrossRef]
- Alonso, M.A.; Weissman, S.M. cDNA cloning and sequence of MAL, a hydrophobic protein associated with human T-cell differentiation. Proc Natl Acad Sci U S A 1987, 84, 1997–2001. [Google Scholar] [CrossRef]
- Abdelmagid, S.M.; Barbe, M.F.; Arango-Hisijara, I.; Owen, T.A.; Popoff, S.N.; Safadi, F.F. Osteoactivin acts as downstream mediator of BMP-2 effects on osteoblast function. J Cell Physiol 2007, 210, 26–37. [Google Scholar] [CrossRef]
- Loftus, S.K.; Antonellis, A.; Matera, I.; Renaud, G.; Baxter, L.L.; Reid, D.; Wolfsberg, T.G.; Chen, Y.; Wang, C.; Program, N.C.S.; et al. Gpnmb is a melanoblast-expressed, MITF-dependent gene. Pigment Cell Melanoma Res 2009, 22, 99–110. [Google Scholar] [CrossRef]
- Picotto, G.; Morse, L.R.; Nguyen, N.; Saltzman, J.; Battaglino, R. TMEM176A and TMEM176B Are Candidate Regulators of Inhibition of Dendritic Cell Maturation and Function after Chronic Spinal Cord Injury. J Neurotrauma 2020, 37, 528–533. [Google Scholar] [CrossRef]
- Zen, K.; Liu, Y.; McCall, I.C.; Wu, T.; Lee, W.; Babbin, B.A.; Nusrat, A.; Parkos, C.A. Neutrophil migration across tight junctions is mediated by adhesive interactions between epithelial coxsackie and adenovirus receptor and a junctional adhesion molecule-like protein on neutrophils. Mol Biol Cell 2005, 16, 2694–2703. [Google Scholar] [CrossRef]
- Elhassan, M.O.; Christie, J.; Duxbury, M.S. Homo sapiens systemic RNA interference-defective-1 transmembrane family member 1 (SIDT1) protein mediates contact-dependent small RNA transfer and microRNA-21-driven chemoresistance. J Biol Chem 2012, 287, 5267–5277. [Google Scholar] [CrossRef] [PubMed]
- Sasaki, S.; Ishibashi, K.; Marumo, F. Aquaporin-2 and -3: representatives of two subgroups of the aquaporin family colocalized in the kidney collecting duct. Annu Rev Physiol 1998, 60, 199–220. [Google Scholar] [CrossRef] [PubMed]
- Kirchner, J.; Bevan, M.J. ITM2A is induced during thymocyte selection and T cell activation and causes downregulation of CD8 when overexpressed in CD4(+)CD8(+) double positive thymocytes. J Exp Med 1999, 190, 217–228. [Google Scholar] [CrossRef]
- Reich, A.; Spering, C.; Gertz, K.; Harms, C.; Gerhardt, E.; Kronenberg, G.; Nave, K.A.; Schwab, M.; Tauber, S.C.; Drinkut, A.; et al. Fas/CD95 regulatory protein Faim2 is neuroprotective after transient brain ischemia. J Neurosci 2011, 31, 225–233. [Google Scholar] [CrossRef]
- Hazzan, T.; Eberle, J.; Worm, M.; Babina, M. Apoptotic resistance of human skin mast cells is mediated by Mcl-1. Cell Death Discov 2017, 3, 17048. [Google Scholar] [CrossRef]
- Bertin, J.; Wang, L.; Guo, Y.; Jacobson, M.D.; Poyet, J.L.; Srinivasula, S.M.; Merriam, S.; DiStefano, P.S.; Alnemri, E.S. CARD11 and CARD14 are novel caspase recruitment domain (CARD)/membrane-associated guanylate kinase (MAGUK) family members that interact with BCL10 and activate NF-kappa B. J Biol Chem 2001, 276, 11877–11882. [Google Scholar] [CrossRef]
- Wyatt, A.R.; Yerbury, J.J.; Ecroyd, H.; Wilson, M.R. Extracellular chaperones and proteostasis. Annu Rev Biochem 2013, 82, 295–322. [Google Scholar] [CrossRef]
- Rognoni, E.; Ruppert, R.; Fassler, R. The kindlin family: functions, signaling properties and implications for human disease. Journal of cell science 2016, 129, 17–27. [Google Scholar] [CrossRef]
- Doliana, R.; Bot, S.; Mungiguerra, G.; Canton, A.; Cilli, S.P.; Colombatti, A. Isolation and characterization of EMILIN-2, a new component of the growing EMILINs family and a member of the EMI domain-containing superfamily. J Biol Chem 2001, 276, 12003–12011. [Google Scholar] [CrossRef]
- Sampaolo, S.; Napolitano, F.; Tirozzi, A.; Reccia, M.G.; Lombardi, L.; Farina, O.; Barra, A.; Cirillo, F.; Melone, M.A.B.; Gianfrancesco, F.; et al. Identification of the first dominant mutation of LAMA5 gene causing a complex multisystem syndrome due to dysfunction of the extracellular matrix. J Med Genet 2017, 54, 710–720. [Google Scholar] [CrossRef]
- Cardone, R.A.; Alfarouk, K.O.; Elliott, R.L.; Alqahtani, S.S.; Ahmed, S.B.M.; Aljarbou, A.N.; Greco, M.R.; Cannone, S.; Reshkin, S.J. The Role of Sodium Hydrogen Exchanger 1 in Dysregulation of Proton Dynamics and Reprogramming of Cancer Metabolism as a Sequela. International journal of molecular sciences 2019, 20. [Google Scholar] [CrossRef] [PubMed]
- Khayat, W.; Hackett, A.; Shaw, M.; Ilie, A.; Dudding-Byth, T.; Kalscheuer, V.M.; Christie, L.; Corbett, M.A.; Juusola, J.; Friend, K.L.; et al. A recurrent missense variant in SLC9A7 causes nonsyndromic X-linked intellectual disability with alteration of Golgi acidification and aberrant glycosylation. Hum Mol Genet 2019, 28, 598–614. [Google Scholar] [CrossRef] [PubMed]
- Patak, J.; Hess, J.L.; Zhang-James, Y.; Glatt, S.J.; Faraone, S.V. SLC9A9 Co-expression modules in autism-associated brain regions. Autism Res 2017, 10, 414–429. [Google Scholar] [CrossRef] [PubMed]
- Casula, S.; Shmukler, B.E.; Wilhelm, S.; Stuart-Tilley, A.K.; Su, W.; Chernova, M.N.; Brugnara, C.; Alper, S.L. A dominant negative mutant of the KCC1 K-Cl cotransporter: both N- and C-terminal cytoplasmic domains are required for K-Cl cotransport activity. J Biol Chem 2001, 276, 41870–41878. [Google Scholar] [CrossRef]
- Song, F.; Yi, Y.; Li, C.; Hu, Y.; Wang, J.; Smith, D.E.; Jiang, H. Regulation and biological role of the peptide/histidine transporter SLC15A3 in Toll-like receptor-mediated inflammatory responses in macrophage. Cell Death Dis 2018, 9, 770. [Google Scholar] [CrossRef]
- Eiden, L.E.; Schafer, M.K.; Weihe, E.; Schutz, B. The vesicular amine transporter family (SLC18): amine/proton antiporters required for vesicular accumulation and regulated exocytotic secretion of monoamines and acetylcholine. Pflugers Arch 2004, 447, 636–640. [Google Scholar] [CrossRef]
- Fredriksson, R.; Sreedharan, S.; Nordenankar, K.; Alsio, J.; Lindberg, F.A.; Hutchinson, A.; Eriksson, A.; Roshanbin, S.; Ciuculete, D.M.; Klockars, A.; et al. The polyamine transporter Slc18b1(VPAT) is important for both short and long time memory and for regulation of polyamine content in the brain. PLoS Genet 2019, 15, e1008455. [Google Scholar] [CrossRef]
- Yoneshiro, T.; Wang, Q.; Tajima, K.; Matsushita, M.; Maki, H.; Igarashi, K.; Dai, Z.; White, P.J.; McGarrah, R.W.; Ilkayeva, O.R.; et al. BCAA catabolism in brown fat controls energy homeostasis through SLC25A44. Nature 2019, 572, 614–619. [Google Scholar] [CrossRef]
- Griffiths, M.; Beaumont, N.; Yao, S.Y.; Sundaram, M.; Boumah, C.E.; Davies, A.; Kwong, F.Y.; Coe, I.; Cass, C.E.; Young, J.D.; et al. Cloning of a human nucleoside transporter implicated in the cellular uptake of adenosine and chemotherapeutic drugs. Nature medicine 1997, 3, 89–93. [Google Scholar] [CrossRef]
- Segal, D.; Ohana, E.; Besser, L.; Hershfinkel, M.; Moran, A.; Sekler, I. A role for ZnT-1 in regulating cellular cation influx. Biochem Biophys Res Commun 2004, 323, 1145–1150. [Google Scholar] [CrossRef]
- Gu, S.; Roderick, H.L.; Camacho, P.; Jiang, J.X. Characterization of an N-system amino acid transporter expressed in retina and its involvement in glutamine transport. J Biol Chem 2001, 276, 24137–24144. [Google Scholar] [CrossRef] [PubMed]
- Wu, L.; Chaffee, K.G.; Parker, A.S.; Sicotte, H.; Petersen, G.M. Zinc transporter genes and urological cancers: integrated analysis suggests a role for ZIP11 in bladder cancer. Tumour Biol 2015, 36, 7431–7437. [Google Scholar] [CrossRef] [PubMed]
- Ward, D.M.; Kaplan, J. Ferroportin-mediated iron transport: expression and regulation. Biochimica et biophysica acta 2012, 1823, 1426–1433. [Google Scholar] [CrossRef] [PubMed]
- Furukawa, J.; Inoue, K.; Maeda, J.; Yasujima, T.; Ohta, K.; Kanai, Y.; Takada, T.; Matsuo, H.; Yuasa, H. Functional identification of SLC43A3 as an equilibrative nucleobase transporter involved in purine salvage in mammals. Sci Rep 2015, 5, 15057. [Google Scholar] [CrossRef]
- Taylor, A.; Grapentine, S.; Ichhpuniani, J.; Bakovic, M. Choline transporter-like proteins 1 and 2 are newly identified plasma membrane and mitochondrial ethanolamine transporters. J Biol Chem 2021, 296, 100604. [Google Scholar] [CrossRef]
- Welch, C.; Santra, M.K.; El-Assaad, W.; Zhu, X.; Huber, W.E.; Keys, R.A.; Teodoro, J.G.; Green, M.R. Identification of a protein, G0S2, that lacks Bcl-2 homology domains and interacts with and antagonizes Bcl-2. Cancer Res 2009, 69, 6782–6789. [Google Scholar] [CrossRef]
- Wu, M.X.; Ao, Z.; Prasad, K.V.; Wu, R.; Schlossman, S.F. IEX-1L, an apoptosis inhibitor involved in NF-kappaB-mediated cell survival. Science 1998, 281, 998–1001. [Google Scholar] [CrossRef]
- Patwardhan, S.; Gashler, A.; Siegel, M.G.; Chang, L.C.; Joseph, L.J.; Shows, T.B.; Le Beau, M.M.; Sukhatme, V.P. EGR3, a novel member of the Egr family of genes encoding immediate-early transcription factors. Oncogene 1991, 6, 917–928. [Google Scholar]
- Toyoshima, Y.; Karas, M.; Yakar, S.; Dupont, J.; Lee, H.; LeRoith, D. TDAG51 mediates the effects of insulin-like growth factor I (IGF-I) on cell survival. J Biol Chem 2004, 279, 25898–25904. [Google Scholar] [CrossRef]
- Arslan, A.D.; Sassano, A.; Saleiro, D.; Lisowski, P.; Kosciuczuk, E.M.; Fischietti, M.; Eckerdt, F.; Fish, E.N.; Platanias, L.C. Human SLFN5 is a transcriptional co-repressor of STAT1-mediated interferon responses and promotes the malignant phenotype in glioblastoma. Oncogene 2017, 36, 6006–6019. [Google Scholar] [CrossRef]
- Buxboim, A.; Swift, J.; Irianto, J.; Spinler, K.R.; Dingal, P.C.; Athirasala, A.; Kao, Y.R.; Cho, S.; Harada, T.; Shin, J.W.; et al. Matrix elasticity regulates lamin-A,C phosphorylation and turnover with feedback to actomyosin. Current biology : CB 2014, 24, 1909–1917. [Google Scholar] [CrossRef] [PubMed]
- Balinas-Gavira, C.; Rodriguez, M.I.; Andrades, A.; Cuadros, M.; Alvarez-Perez, J.C.; Alvarez-Prado, A.F.; de Yebenes, V.G.; Sanchez-Hernandez, S.; Fernandez-Vigo, E.; Munoz, J.; et al. Frequent mutations in the amino-terminal domain of BCL7A impair its tumor suppressor role in DLBCL. Leukemia 2020, 34, 2722–2735. [Google Scholar] [CrossRef] [PubMed]
- Wu, H.; Parsons, J.T. Cortactin, an 80/85-kilodalton pp60src substrate, is a filamentous actin-binding protein enriched in the cell cortex. The Journal of cell biology 1993, 120, 1417–1426. [Google Scholar] [CrossRef] [PubMed]
- Eto, M.; Kirkbride, J.; Elliott, E.; Lo, S.H.; Brautigan, D.L. Association of the tensin N-terminal protein-tyrosine phosphatase domain with the alpha isoform of protein phosphatase-1 in focal adhesions. J Biol Chem 2007, 282, 17806–17815. [Google Scholar] [CrossRef]
- Kim, S.V.; Mehal, W.Z.; Dong, X.; Heinrich, V.; Pypaert, M.; Mellman, I.; Dembo, M.; Mooseker, M.S.; Wu, D.; Flavell, R.A. Modulation of cell adhesion and motility in the immune system by Myo1f. Science 2006, 314, 136–139. [Google Scholar] [CrossRef]
- Tokuo, H. Myosin X. Adv Exp Med Biol 2020, 1239, 391–403. [Google Scholar] [CrossRef]
- Li, Y.; Guerrero, A.; Howard, T.H. The actin-binding protein, lymphocyte-specific protein 1, is expressed in human leukocytes and human myeloid and lymphoid cell lines. J Immunol 1995, 155, 3563–3569. [Google Scholar] [CrossRef]
- Guy, P.M.; Kenny, D.A.; Gill, G.N. The PDZ domain of the LIM protein enigma binds to beta-tropomyosin. Mol Biol Cell 1999, 10, 1973–1984. [Google Scholar] [CrossRef]
- Gilligan, D.M.; Lozovatsky, L.; Gwynn, B.; Brugnara, C.; Mohandas, N.; Peters, L.L. Targeted disruption of the beta adducin gene (Add2) causes red blood cell spherocytosis in mice. Proc Natl Acad Sci U S A 1999, 96, 10717–10722. [Google Scholar] [CrossRef]
- Maurin, J.; Morel, A.; Guerit, D.; Cau, J.; Urbach, S.; Blangy, A.; Bompard, G. The Beta-Tubulin Isotype TUBB6 Controls Microtubule and Actin Dynamics in Osteoclasts. Front Cell Dev Biol 2021, 9, 778887. [Google Scholar] [CrossRef]
- Witke, W.; Sharpe, A.H.; Hartwig, J.H.; Azuma, T.; Stossel, T.P.; Kwiatkowski, D.J. Hemostatic, inflammatory, and fibroblast responses are blunted in mice lacking gelsolin. Cell 1995, 81, 41–51. [Google Scholar] [CrossRef] [PubMed]
- Martin-Martin, B.; Nabokina, S.M.; Lazo, P.A.; Mollinedo, F. Co-expression of several human syntaxin genes in neutrophils and differentiating HL-60 cells: variant isoforms and detection of syntaxin 1. J Leukoc Biol 1999, 65, 397–406. [Google Scholar] [CrossRef] [PubMed]
- Hirokawa, N. Kinesin and dynein superfamily proteins and the mechanism of organelle transport. Science 1998, 279, 519–526. [Google Scholar] [CrossRef] [PubMed]
- Arneson, L.N.; Brickshawana, A.; Segovis, C.M.; Schoon, R.A.; Dick, C.J.; Leibson, P.J. Cutting edge: syntaxin 11 regulates lymphocyte-mediated secretion and cytotoxicity. J Immunol 2007, 179, 3397–3401. [Google Scholar] [CrossRef]
- Eastman, S.W.; Martin-Serrano, J.; Chung, W.; Zang, T.; Bieniasz, P.D. Identification of human VPS37C, a component of endosomal sorting complex required for transport-I important for viral budding. J Biol Chem 2005, 280, 628–636. [Google Scholar] [CrossRef]
- Weigel, A.V.; Tamkun, M.M.; Krapf, D. Quantifying the dynamic interactions between a clathrin-coated pit and cargo molecules. Proc Natl Acad Sci U S A 2013, 110, E4591–4600. [Google Scholar] [CrossRef]
- Durkin, M.E.; Yuan, B.Z.; Zhou, X.; Zimonjic, D.B.; Lowy, D.R.; Thorgeirsson, S.S.; Popescu, N.C. DLC-1:a Rho GTPase-activating protein and tumour suppressor. J Cell Mol Med 2007, 11, 1185–1207. [Google Scholar] [CrossRef]
- Tauber, M.; Basso, L.; Martin, J.; Bostan, L.; Pinto, M.M.; Thierry, G.R.; Houmadi, R.; Serhan, N.; Loste, A.; Bleriot, C.; et al. Landscape of mast cell populations across organs in mice and humans. J Exp Med 2023, 220. [Google Scholar] [CrossRef]
Figure 1.
Isolation of human peripheral blood cell subpopulations by FACS. Blood PBMCs isolated from buffy coats were stained with antibodies against CD4, CD8, CD14 and CD19 to isolate CD8+ T cells, CD4+ T cells, CD19+ B cells and CD14+ monocytes, respectively. A. Gating strategy for the FACS of the different immune cell populations. B. A fraction of isolated cells was used for assessment of the purity of the populations. The data are representative of the two different samples.
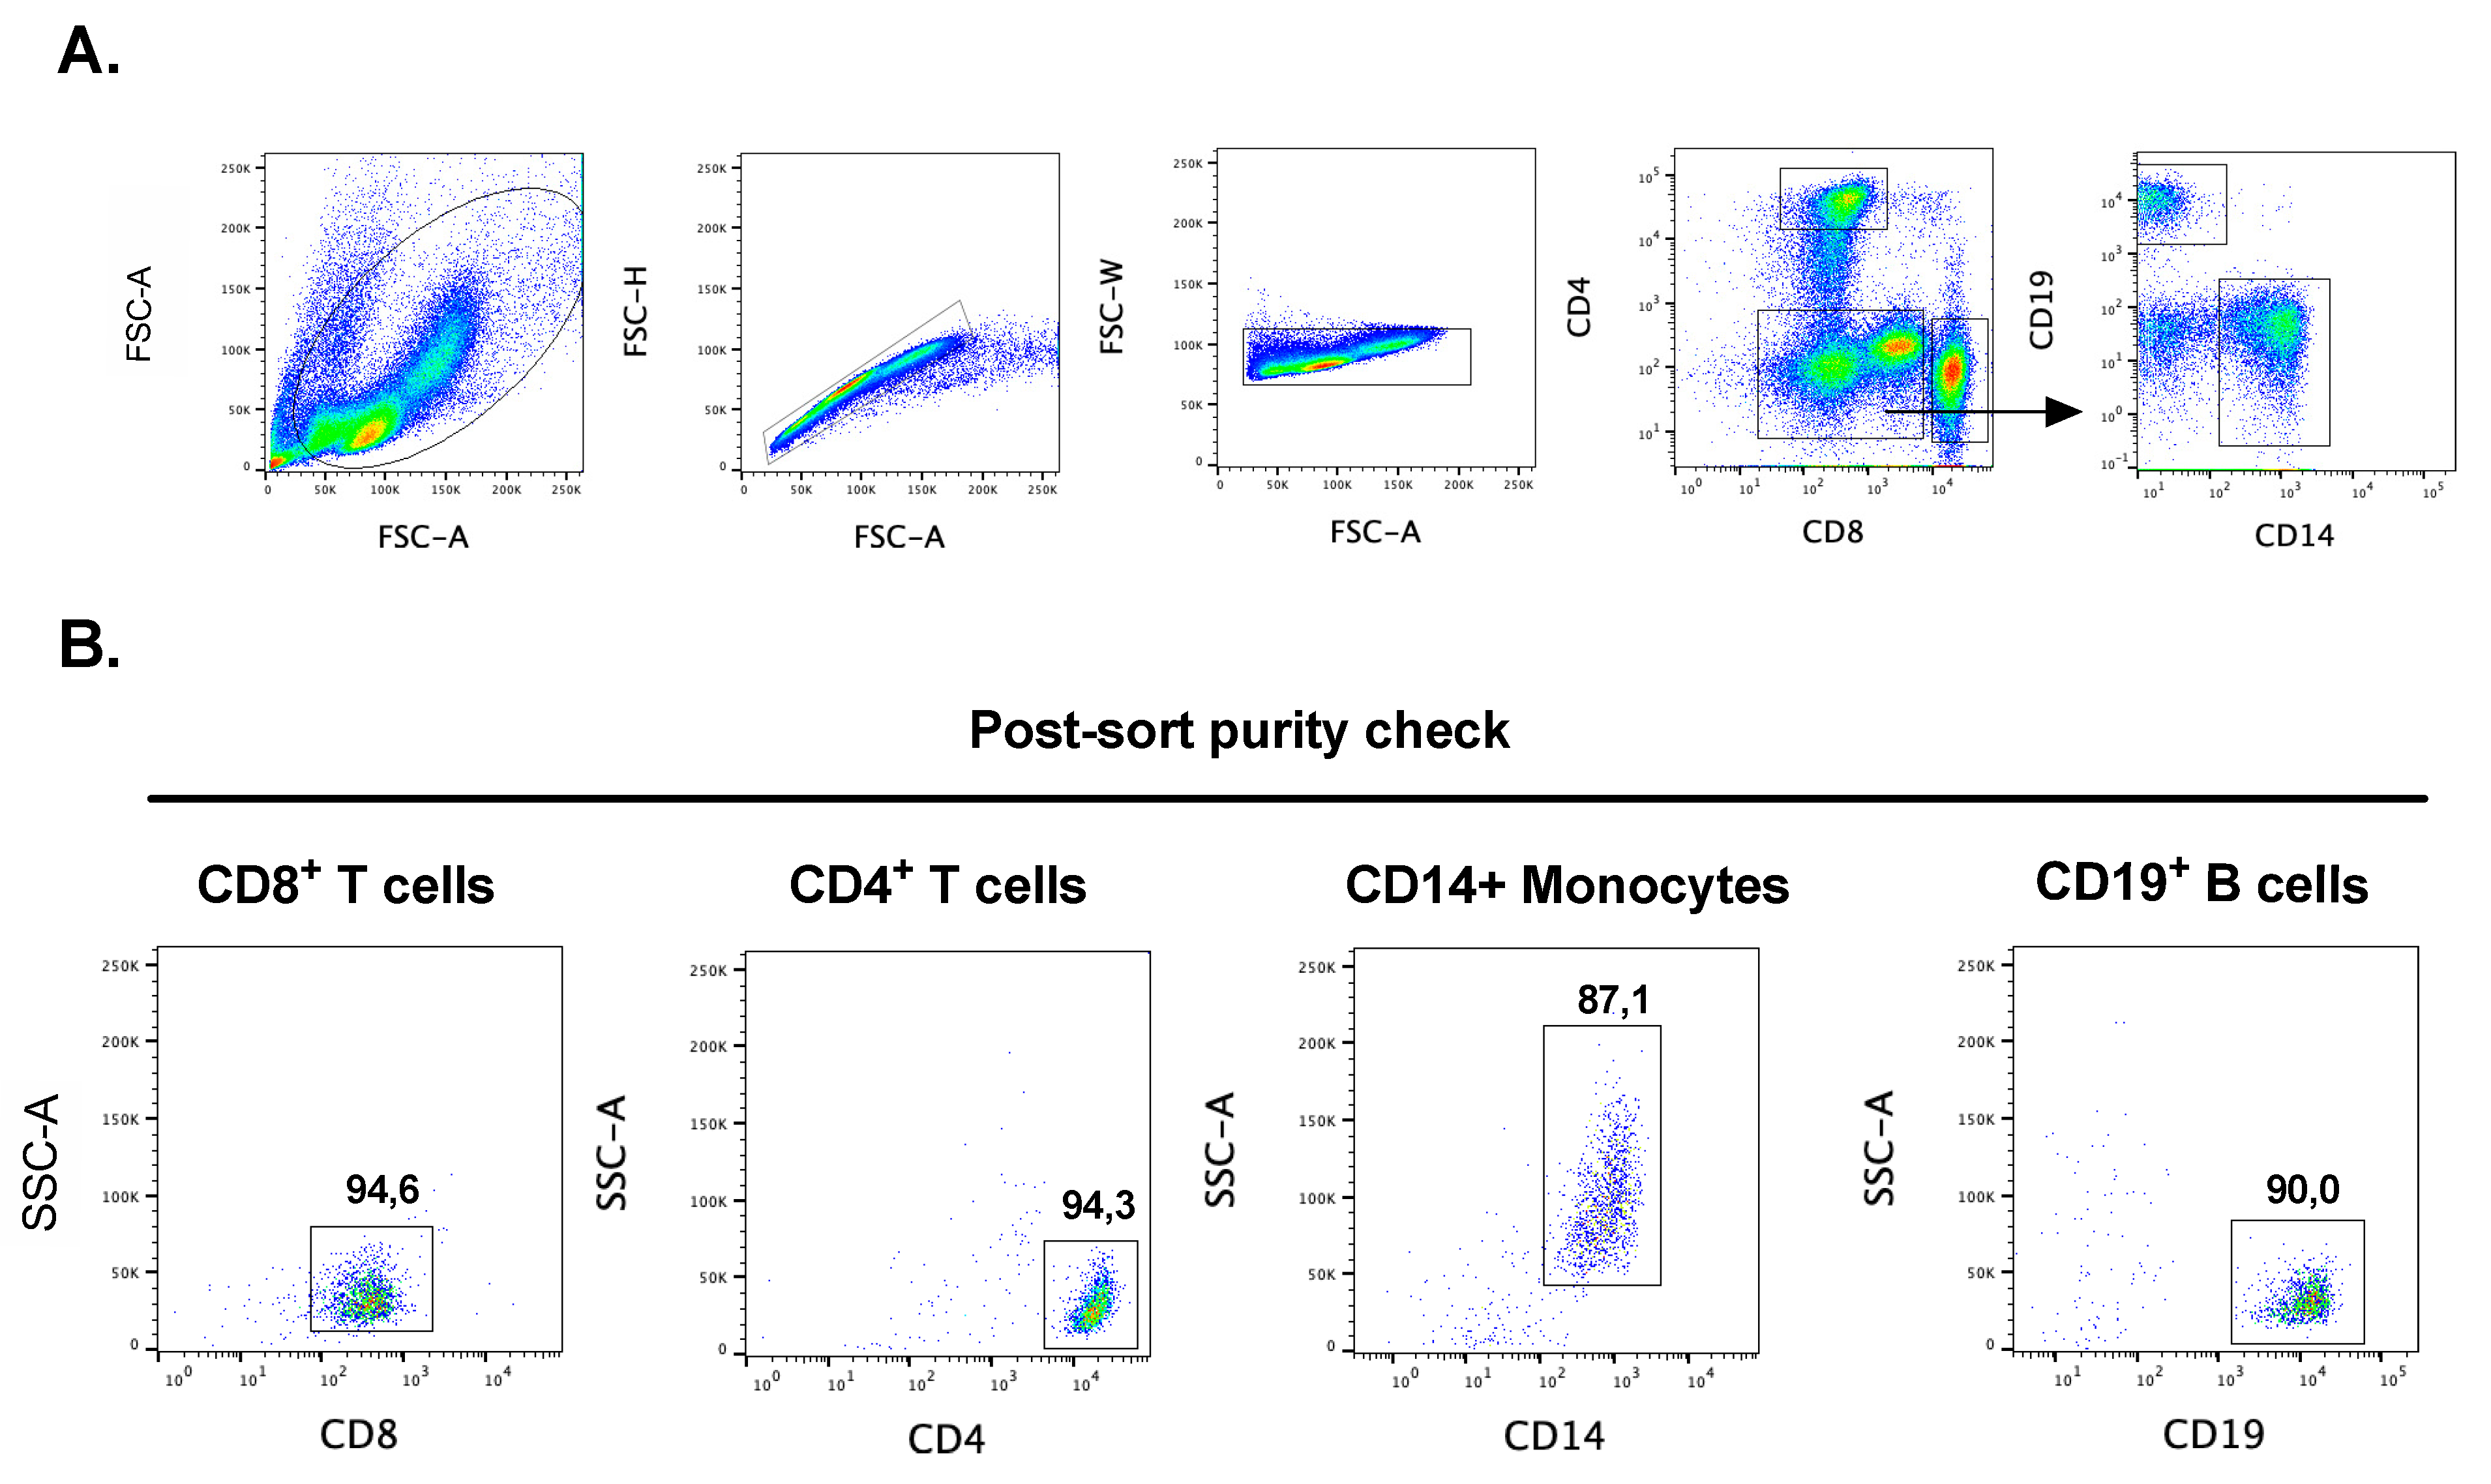
Figure 2.
A summary figure of some of the most important genes for the phenotype of these five cell types. The genes have been listed in a few major categories including secreted proteins, granule proteins, surface receptors, complement components, cytokines and chemokines, transcription factors and enzymes.
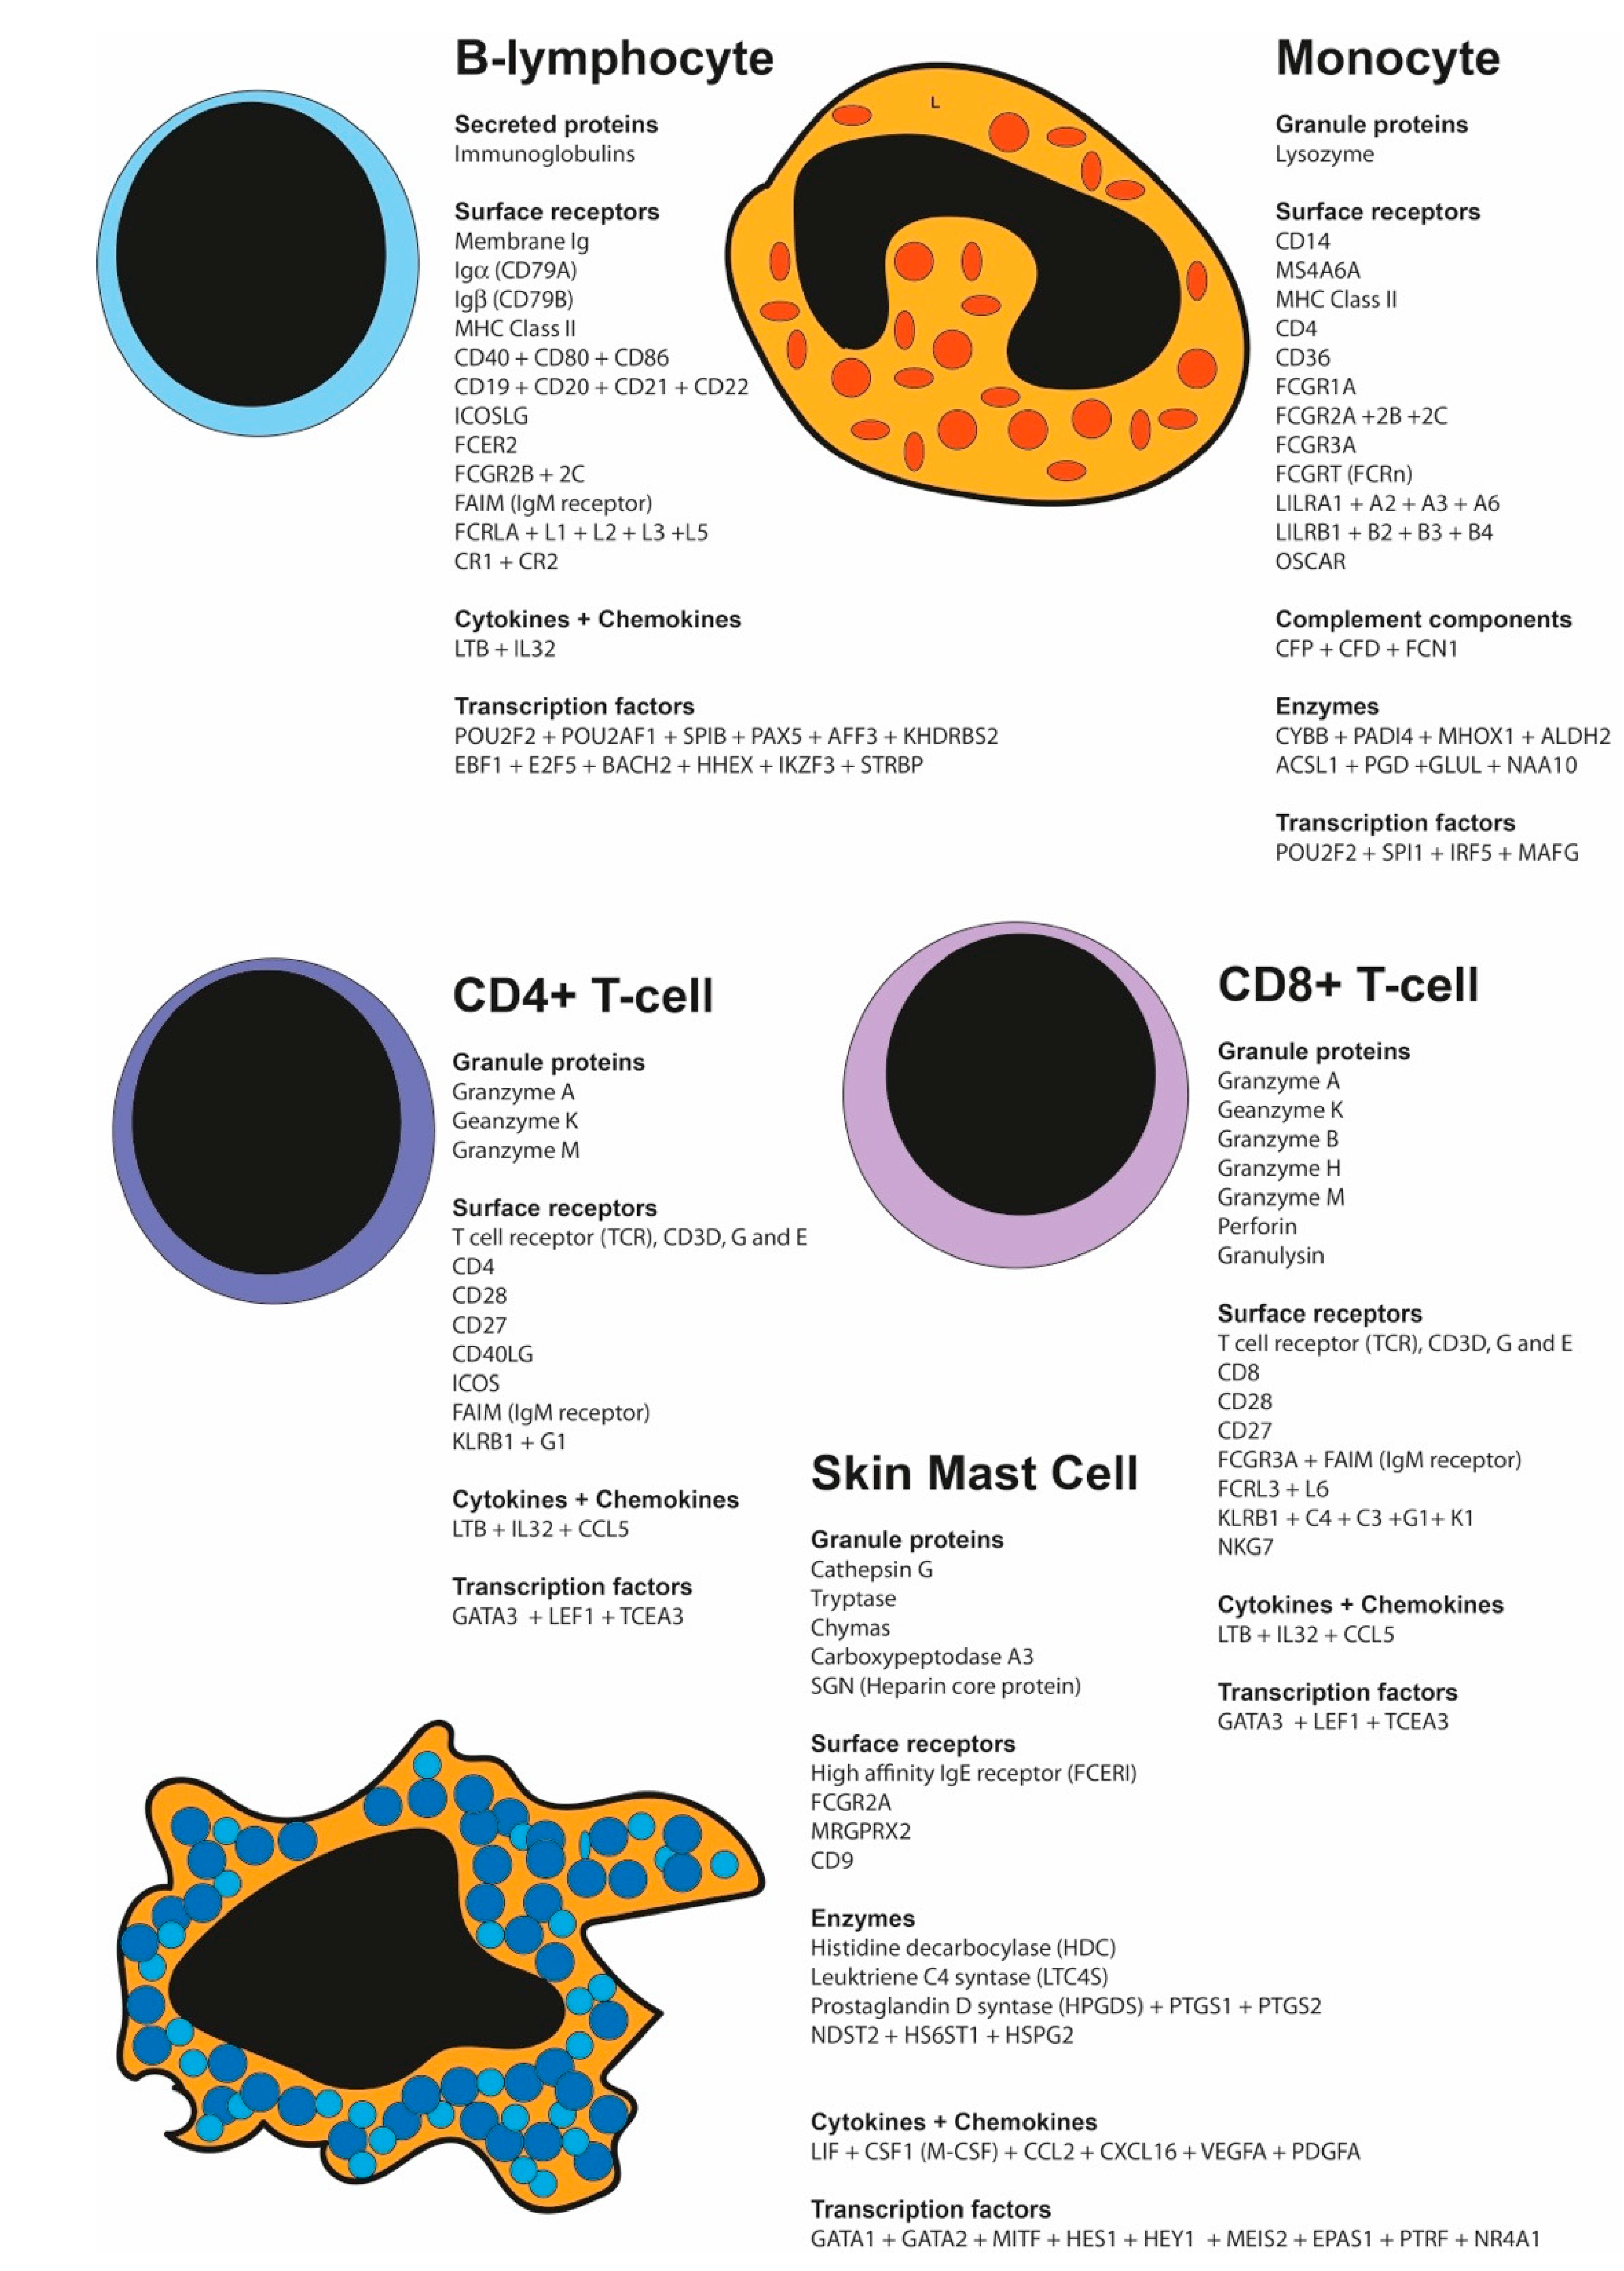

Table 1.
Granule proteases.
| Gene | B-cell | B-cell | Monocyte | Monocyte | CD4+ T-cell |
CD4+ T-cell |
CD8+ T-cell |
CD8+ T-cell |
MC | MC |
|---|---|---|---|---|---|---|---|---|---|---|
| CTSG | 0.1 | 0 | 0.5 | 1 | 0.3 | 0.1 | 0.2 | 2 | 9445 | 6194 |
| TPSB2 | 0.5 | 0 | 0 | 0.4 | 0.1 | 0.4 | 0 | 0 | 7096 | 6177 |
| CPA3 | 0 | 0 | 0 | 0.3 | 0 | 0.1 | 0.2 | 0 | 4403 | 3086 |
| CMA1 | 3 | 0 | 1 | 20 | 3 | 0 | 7 | 1 | 1713 | 1359 |
| TPSD1 | 0 | 0 | 0 | 0 | 0.2 | 0 | 0.2 | 0 | 418 | 67 |
| TPSG1 | 0 | 0 | 0 | 0 | 0 | 0 | 0 | 0 | 86 | 49 |
| CPM | 0.2 | 0.8 | 0.6 | 0.9 | 0.1 | 0.2 | 0 | 0 | 140 | 81 |
| GZMA | 0.1 | 0 | 0.4 | 0.1 | 68 | 38 | 219 | 268 | 0 | 0 |
| GZMK | 0 | 0 | 0 | 0.1 | 148 | 51 | 228 | 146 | 0 | 0 |
| GZMH | 0 | 0 | 0 | 0 | 9 | 0.4 | 280 | 103 | 0 | 0 |
| GZMB | 0.4 | 0.1 | 0 | 0 | 2 | 0.6 | 155 | 70 | 0.4 | 0.2 |
| GZMM | 0 | 0 | 0 | 0.2 | 65 | 41 | 160 | 279 | 0 | 0 |
| PRF1(perforin) | 0.1 | 0 | 0 | 0 | 41 | 15 | 274 | 632 | 0 | 0.4 |
| GNLY(Granulycin) | 0.7 | 0.8 | 6 | 2 | 109 | 50 | 722 | 205 | 1 | 2 |
| PRTN3 | 0 | 0 | 0.1 | 0 | 0 | 0 | 0 | 0 | 0 | 0.1 |
| ELANE | 0 | 0.2 | 0.4 | 4 | 0 | 0 | 0 | 0 | 0.4 | 0.5 |
| PRSS57(NSP4) | 0 | 0 | 0 | 0 | 0 | 0 | 0 | 2 | 0 | 0 |
| CTSC | 5 | 6 | 30 | 21 | 22 | 17 | 40 | 13 | 23 | 28 |
Table 2.
Other proteases.
| Gene | B-cell | B-cell | Monocyte | Monocyte | CD4+ T-cell |
CD4+ T-cell |
CD8+ T-cell |
CD8+ T-cell |
MC | MC | |
|---|---|---|---|---|---|---|---|---|---|---|---|
| CTSD | 60 | 55 | 1792 | 1517 | 139 | 175 | 210 | 511 | 2356 | 1723 | |
| CTSS | 147 | 175 | 538 | 1011 | 122 | 89 | 147 | 22 | 24 | 15 | |
| CTSB | 16 | 18 | 88 | 28 | 91 | 72 | 32 | 26 | 241 | 315 | |
| CTSL1 | 0 | 0.1 | 4 | 3 | 4 | 1 | 0.8 | 0 | 48 | 158 | |
| CTSA | 47 | 30 | 296 | 352 | 64 | 105 | 104 | 208 | 49 | 49 | |
| CTSW | 1 | 4 | 0.3 | 0.3 | 104 | 156 | 627 | 1153 | 32 | 12 | |
| SCPEP1 | 35 | 62 | 206 | 303 | 9 | 12 | 9 | 8 | 10 | 10 | |
| ADAM15 | 6 | 9 | 207 | 169 | 12 | 12 | 12 | 19 | 23 | 27 | |
| ADAM19 | 147 | 195 | 14 | 61 | 38 | 38 | 9 | 4 | 4 | 5 | |
| ADAM23 | 11 | 15 | 0 | 0 | 47 | 49 | 9 | 6 | 1 | 2 | |
| ADAM28 | 37 | 38 | 2 | 1 | 0.2 | 0 | 0.1 | 0.7 | 0.4 | 0 | |
| ADAMTS7 | 0.2 | 0 | 0 | 0 | 0.1 | 0 | 0 | 0.1 | 80 | 58 | |
| ADAMTS6 | 22 | 14 | 0 | 0 | 7 | 4 | 24 | 6 | 1 | 4 | |
| PSMB10 | 118 | 91 | 796 | 1314 | 73 | 78 | 82 | 59 | 31 | 21 | |
| NAPSB | 113 | 103 | 410 | 459 | 2 | 2 | 0.9 | 0 | 0.7 | 0.1 | |
| PRSS12 | 0.1 | 0 | 0 | 0.2 | 0 | 0 | 0 | 0 | 38 | 59 | |
| MMP17 | 21 | 54 | 47 | 79 | 0 | 0 | 0 | 0 | 4 | 4 | |
| PLAU | 0.1 | 0 | 3 | 2 | 0 | 0 | 0 | 0.1 | 102 | 38 | |
| (PLAUR) | 0.5 | 0.2 | 970 | 1371 | 8 | 4 | 5 | 8 | 888 | 415 | |
| DPP4 | 1 | 0.3 | 0 | 0 | 129 | 111 | 71 | 81 | 32 | 15 | |
| CASP3 | 5 | 5 | 5 | 5 | 7 | 5 | 9 | 18 | 88 | 74 | |
| CAPN10 | 8 | 10 | 47 | 43 | 10 | 13 | 14 | 9 | 5 | 6 | |
| BACE2 | 10 | 12 | 0 | 0.1 | 0.1 | 0 | 0 | 0 | 103 | 49 | |
Table 3.
Protease inhibitors.
| Gene | B-cell | B-cell | Monocyte | Monocyte | CD4+ T-cell |
CD4+ T-cell |
CD8+ T-cell |
CD8+ T-cell |
MC | MC |
|---|---|---|---|---|---|---|---|---|---|---|
| CST3 | 7 | 4 | 4677 | 6287 | 21 | 25 | 32 | 18 | 564 | 586 |
| CST7 | 0.1 | 0 | 0 | 0.3 | 89 | 23 | 290 | 50 | 111 | 91 |
| TIMP1 | 7 | 6 | 216 | 129 | 153 | 218 | 105 | 329 | 407 | 357 |
| TIMP2 | 28 | 18 | 491 | 488 | 10 | 9 | 7 | 8 | 52 | 48 |
| TIMP3 | 0 | 0 | 0.3 | 0 | 0 | 0 | 0 | 0 | 1270 | 995 |
| SERPINB1 | 29 | 31 | 42 | 61 | 68 | 50 | 66 | 16 | 333 | 156 |
| SERPINH1 | 0.8 | 1 | 4 | 1 | 5 | 5 | 4 | 4 | 270 | 352 |
| SERPINE1 | 0 | 0 | 2 | 0.8 | 0 | 0.1 | 0.5 | 0 | 200 | 339 |
| LXN | 0.8 | 2 | 0.1 | 0 | 2 | 2 | 1 | 1 | 27 | 132 |
| ITIH4 | 3 | 2 | 78 | 48 | 3 | 2 | 1 | 1 | 3 | 2 |
| SPINT1 | 13 | 11 | 100 | 75 | 4 | 3 | 2 | 1 | 23 | 18 |
Table 4.
Eosinophil, neutrophil and macrophage granule proteins.
| Gene | B-cell | B-cell | Monocyte | Monocyte | CD4+ T-cell |
CD4+ T-cell |
CD8+ T-cell |
CD8+ T-cell |
MC | MC |
|---|---|---|---|---|---|---|---|---|---|---|
| RNASE3 (ECP) | 0 | 0 | 0.3 | 0.5 | 0 | 0 | 0 | 0 | 0.1 | 1 |
| RNASE2 (EDN) | 0 | 0.2 | 14 | 19 | 0 | 0 | 0.2 | 0.4 | 0.1 | 2 |
| (RNASE6) | 35 | 77 | 40 | 37 | 1 | 2 | 3 | 0.2 | 1 | 0 |
| EPX(EPO) | 0 | 0 | 0 | 0 | 0 | 0 | 0 | 0 | 0 | 0 |
| PRG2(MBP) | 0 | 0.1 | 0.6 | 0.6 | 0 | 0 | 0.5 | 0.2 | 13 | 29 |
| CLC | 0 | 0 | 0 | 0 | 0.1 | 0.2 | 0 | 0.1 | 0 | 0 |
| MPO | 0.2 | 0 | 13 | 9 | 0 | 0 | 0 | 0 | 0 | 0 |
| LTF | 0 | 0.2 | 0.6 | 0 | 0 | 0 | 0 | 0 | 0.5 | 0.7 |
| NCF1 | 194 | 198 | 604 | 618 | 0.2 | 0.2 | 0.8 | 0.2 | 2 | 0.7 |
| NCF2 | 12 | 15 | 358 | 225 | 7 | 1 | 7 | 1 | 0.3 | 0.6 |
| LYZ | 12 | 6 | 18602 | 23009 | 38 | 23 | 78 | 15 | 29 | 13 |
| MPEG1 | 52 | 28 | 36 | 52 | 0.6 | 0.2 | 1 | 0.2 | 1 | 0 |
| COCH | 63 | 59 | 0.6 | 0 | 0 | 0.1 | 0.5 | 1 | 3 | 5 |
| MNDA | 29 | 4 | 152 | 26 | 1 | 0 | 2 | 0.9 | 1 | 1 |
Table 5.
Surface markers.
| Gene | B-cell | B-cell | Monocyte | Monocyte | CD4+T-cell | CD4+T-cell | CD8+T-cell | CD8+T-cell | MC | MC |
|---|---|---|---|---|---|---|---|---|---|---|
| CD2 | 0 | 0 | 0.1 | 0.1 | 128 | 74 | 128 | 26 | 0.7 | 1 |
| SLAMF6 | 40 | 41 | 0 | 0 | 18 | 19 | 47 | 21 | 0.1 | 0.1 |
| CD4 | 0.4 | 0.1 | 193 | 197 | 536 | 501 | 18 | 1 | 238 | 157 |
| CD5 | 24 | 24 | 0.6 | 0.3 | 908 | 798 | 564 | 702 | 0 | 0.7 |
| CD6 | 10 | 6 | 0.4 | 0 | 468 | 371 | 261 | 407 | 0.3 | 0.1 |
| CD7 | 0.2 | 0.1 | 29 | 6 | 406 | 490 | 600 | 2355 | 4 | 11 |
| CD8A | 0.1 | 0 | 0 | 0 | 10 | 0.5 | 781 | 332 | 0.1 | 0.2 |
| CD8B | 0 | 0 | 0.4 | 0.5 | 9 | 0.7 | 875 | 1479 | 0.4 | 0.3 |
| CD3D | 0 | 0 | 0 | 0 | 358 | 358 | 352 | 216 | 0 | 0.2 |
| CD3E | 0.2 | 0.2 | 0.3 | 0.1 | 1311 | 1688 | 1468 | 2349 | 0.4 | 1 |
| CD3G | 0.8 | 0 | 0 | 0 | 444 | 588 | 567 | 479 | 0.3 | 0 |
| CD247(CD3Z) | 0.1 | 0 | 0.3 | 0.6 | 328 | 335 | 371 | 353 | 0 | 0.4 |
| CD28 | 0 | 0 | 0.1 | 0 | 158 | 198 | 94 | 66 | 0.1 | 0 |
| TESPA1 | 26 | 26 | 0.4 | 0.3 | 229 | 351 | 196 | 229 | 528 | 272 |
| BTLA(CD272) | 69 | 103 | 0.3 | 0.1 | 9 | 10 | 6 | 1 | 0.1 | 0.2 |
| CTLA4 | 0.1 | 0 | 0 | 0 | 23 | 19 | 4 | 2 | 0 | 0.3 |
| ICOS | 0 | 0 | 0.1 | 0 | 51 | 50 | 28 | 3 | 0 | 0.5 |
| ICOSLG | 533 | 372 | 216 | 160 | 13 | 7 | 9 | 12 | 26 | 32 |
| PDCD1(PD1) | 0.2 | 0.2 | 0.3 | 0.4 | 14 | 3 | 15 | 14 | 0 | 0.1 |
| CD274(PD-L1) | 2 | 0.7 | 0 | 0.3 | 4 | 5 | 5 | 3 | 106 | 158 |
| PDCD1LG2 PD-L2 | 0.7 | 0 | 0 | 0 | 0.6 | 0.5 | 0.5 | 0.1 | 8 | 5 |
| CD27 | 45 | 35 | 0 | 0.1 | 106 | 153 | 109 | 541 | 0 | 0 |
| CD80 (B7:1) | 21 | 14 | 0.1 | 0.4 | 0.8 | 1 | 0.8 | 0 | 3 | 9 |
| CD86 (B7:2) | 15 | 25 | 28 | 29 | 1 | 0.1 | 0.6 | 0 | 1 | 0.8 |
| CD276(B7-H3) | 0 | 0 | 0.1 | 0 | 0 | 0 | 0 | 0 | 17 | 32 |
| CD40 | 164 | 120 | 11 | 9 | 2 | 2 | 2 | 5 | 9 | 12 |
| CD40LG | 0.1 | 0.1 | 0.3 | 0.3 | 84 | 68 | 19 | 14 | 0.4 | 0.2 |
| CD9 | 4 | 15 | 6 | 2 | 1 | 2 | 8 | 3 | 931 | 1078 |
| CD14 | 1 | 0.3 | 1304 | 1388 | 3 | 2 | 4 | 2 | 22 | 26 |
| MS4A6A | 2 | 1 | 578 | 378 | 2 | 1 | 5 | 2 | 49 | 18 |
| CD33 | 0.7 | 0 | 83 | 38 | 0.8 | 0 | 1 | 0 | 42 | 28 |
| CD36 | 0.2 | 0.2 | 117 | 138 | 0.8 | 0.7 | 2 | 0 | 3 | 7 |
| LY86 | 97 | 143 | 69 | 62 | 0.9 | 2 | 0.6 | 0.6 | 0.7 | 0.1 |
| CD19 | 11 | 16 | 0 | 0 | 0 | 0 | 0.1 | 0 | 0 | 0 |
| MS4A1(CD20) | 214 | 359 | 0.1 | 0 | 2 | 0.4 | 3 | 0.4 | 0 | 0 |
| CR2(CD21) | 40 | 40 | 0 | 0.1 | 4 | 5 | 5 | 5 | 0.3 | 0 |
| CD22(Siglec-2) | 737 | 655 | 3 | 0.4 | 0.2 | 0 | 1 | 0 | 146 | 110 |
| CD53 | 18 | 36 | 0.3 | 0.3 | 0 | 0 | 0.2 | 0.2 | 0 | 0 |
| CD34 | 0 | 0 | 0.1 | 0 | 0 | 0 | 0 | 0 | 4 | 2 |
| CD72 | 42 | 53 | 5 | 3 | 0.9 | 2 | 3 | 4 | 4 | 2 |
| CD79A (Ig) | 3902 | 4312 | 10 | 4 | 6 | 6 | 33 | 33 | 0 | 0.2 |
| CD79B (Ig) | 314 | 304 | 4 | 2 | 12 | 12 | 6 | 23 | 8 | 5 |
| IGLL5 | 207 | 686 | 0.3 | 0 | 0.6 | 0 | 0.5 | 0 | 0.3 | 0 |
| VPREB1 | 0.2 | 0.1 | 0.3 | 0 | 0.2 | 0 | 0 | 0 | 0 | 0 |
| VPREB3 | 135 | 162 | 0.1 | 0.1 | 0.1 | 0.1 | 0.2 | 0 | 0.3 | 0 |
| IGJ | 206 | 270 | 0.4 | 0.4 | 1 | 0.9 | 0.5 | 0 | 0.3 | 0 |
| MZB1 | 66 | 51 | 0.3 | 0 | 0.1 | 0.2 | 0.2 | 0.5 | 0.8 | 0.5 |
| CD63 | 33 | 33 | 369 | 658 | 37 | 37 | 56 | 41 | 265 | 306 |
| CD68 | 15 | 20 | 347 | 663 | 6 | 7 | 8 | 3 | 355 | 305 |
| CD69 | 632 | 1447 | 1 | 1 | 1044 | 1129 | 880 | 773 | 2143 | 341 |
| CD81 | 397 | 507 | 29 | 30 | 284 | 235 | 351 | 854 | 682 | 1025 |
| CD82 | 137 | 198 | 53 | 26 | 79 | 77 | 32 | 64 | 549 | 596 |
| CD83 | 481 | 221 | 57 | 11 | 9 | 10 | 8 | 48 | 1555 | 969 |
| CD96 | 3 | 34 | 0.1 | 0 | 198 | 190 | 251 | 58 | 0.1 | 0.4 |
| CD97 | 57 | 32 | 68 | 89 | 162 | 145 | 187 | 71 | 533 | 606 |
| CD163 | 0.5 | 0 | 37 | 48 | 0 | 0.2 | 0.5 | 0.1 | 3 | 2 |
| CD180 | 40 | 44 | 8 | 3 | 0.1 | 0 | 0.1 | 0 | 0 | 0 |
| LY86(MD-1) | 97 | 143 | 69 | 62 | 0.9 | 2 | 0.6 | 0.6 | 0.7 | 0.1 |
| CD200 | 44 | 63 | 0 | 0.1 | 2 | 4 | 0.5 | 0.1 | 10 | 13 |
| CD248 | 3 | 2 | 1 | 3 | 4 | 6 | 123 | 244 | 44 | 2 |
| CD300A | 1 | 2 | 31 | 22 | 21 | 14 | 59 | 92 | 56 | 35 |
| CD300C | 1 | 0.3 | 47 | 53 | 0.7 | 0.2 | 1 | 0.1 | 16 | 15 |
| CD300E | 0.2 | 0 | 344 | 171 | 0.2 | 0.1 | 2 | 0.2 | 0.3 | 0.1 |
| CD300LB | 0.2 | 0 | 23 | 15 | 0 | 0 | 0.5 | 0.2 | 1 | 0.5 |
| CD300LF | 0.4 | 0.1 | 161 | 119 | 0.1 | 0 | 0.2 | 0.2 | 12 | 5 |
Table 6.
MHC and related transcripts.
| Gene | B-cell | B-cell | Monocyte | Monocyte | CD4+ T-cell |
CD4+ T-cell |
CD8+ T-cell |
CD8+ T-cell |
MC | MC |
|---|---|---|---|---|---|---|---|---|---|---|
| HLA-DRA | 6459 | 5685 | 1208 | 994 | 63 | 35 | 71 | 28 | 75 | 65 |
| HLA-DPA1 | 6014 | 5205 | 2486 | 2516 | 116 | 119 | 212 | 200 | 93 | 60 |
| HLA-DRB1 | 2356 | 4672 | 1130 | 3761 | 33 | 70 | 55 | 68 | 146 | 121 |
| HLA-DPB1 | 2055 | 2907 | 956 | 1153 | 83 | 80 | 198 | 189 | 39 | 28 |
| HLA-DQA1 | 11 | 458 | 4 | 83 | 0 | 3 | 0.3 | 4 | 17 | 8 |
| HLA-DQA2 | 0 | 0 | 0 | 0.1 | 0 | 0 | 0 | 0 | 0 | 0.1 |
| HLA-DQB2 | 0 | 0 | 0 | 0 | 0 | 0 | 0 | 0 | 0.1 | 1 |
| HLA-DMA | 762 | 538 | 582 | 542 | 12 | 16 | 20 | 27 | 31 | 21 |
| HLA-DOA | 93 | 137 | 8 | 8 | 2 | 2 | 14 | 26 | 2 | 0.6 |
| HLA-DOB | 157 | 195 | 1 | 0.6 | 0.4 | 0.1 | 0.9 | 0 | 0.1 | 0.1 |
| CD74 | 1134 | 1030 | 168 | 156 | 99 | 68 | 98 | 58 | 111 | 63 |
| CIITA | 900 | 804 | 408 | 244 | 3 | 2 | 9 | 12 | 7 | 3 |
| CD1A | 3 | 7 | 4 | 6 | 0 | 0 | 0.2 | 0 | 1 | 0 |
| CD1B | 0 | 0 | 0 | 0.1 | 0 | 0 | 0 | 0 | 0.3 | 0.1 |
| CD1C | 3 | 5 | 1 | 2 | 0.2 | 0.4 | 0 | 0 | 0 | 0 |
| CD1D | 40 | 15 | 466 | 441 | 0 | 0 | 0.8 | 0 | 0.3 | 0 |
| B2M | 4231 | 5756 | 1574 | 2081 | 11150 | 8743 | 11103 | 5838 | 2244 | 2218 |
| HLA-A | 1470 | 521 | 1754 | 1087 | 2498 | 1218 | 6862 | 344 | 326 | 1470 |
| HLA-B | 33 | 2159 | 45 | 5368 | 29 | 3042 | 28 | 3134 | 297 | 188 |
| HLA-C | 2 | 2193 | 5 | 514 | 17 | 4421 | 10 | 9613 | 552 | 241 |
| HLA-E | 3951 | 3493 | 4625 | 3166 | 4026 | 4662 | 4306 | 7743 | 1533 | 1614 |
Table 7.
Fc-Receptors.
| Gene | B-cell | B-cell | Monocyte | Monocyte | CD4+ T-cell |
CD4+ T-cell |
CD8+ T-cell |
CD8+ T-cell |
MC | MC |
|---|---|---|---|---|---|---|---|---|---|---|
| FCER1A | 0.1 | 0 | 8 | 5 | 0.6 | 0.9 | 0.5 | 0.1 | 214 | 127 |
| MS4A2 | 0 | 0 | 0 | 0.1 | 0 | 0 | 0.1 | 0 | 817 | 441 |
| FCER1G | 0.6 | 0.7 | 741 | 816 | 17 | 7 | 34 | 57 | 910 | 848 |
| FCER2 | 598 | 643 | 6 | 4 | 0.6 | 0.1 | 0.3 | 0.1 | 0 | 0 |
| FCGR1A | 0.2 | 0.2 | 13 | 15 | 0.1 | 0 | 0.3 | 0 | 0 | 0 |
| FCGR2A | 1 | 0.6 | 66 | 61 | 0.3 | 0 | 0.8 | 1 | 142 | 199 |
| FCGR2B | 31 | 34 | 38 | 188 | 0.3 | 0 | 1 | 1 | 2 | 0.4 |
| FCGR2C | 30 | 32 | 38 | 190 | 0.3 | 0.1 | 2 | 2 | 2 | 1 |
| FCGR3A | 0 | 0.3 | 6 | 8 | 1 | 1 | 58 | 65 | 0.3 | 0 |
| FCGR3B | 0 | 0 | 0 | 0 | 0 | 0 | 0 | 0.1 | 0 | 0 |
| FCGRT | 9 | 16 | 135 | 235 | 19 | 21 | 17 | 4 | 28 | 19 |
| FAIM3 | 468 | 422 | 2 | 0 | 297 | 362 | 282 | 199 | 0.1 | 0.1 |
| FCRLA | 114 | 184 | 0.1 | 0 | 0 | 0 | 0.5 | 0 | 0 | 0 |
| FCRLB | 1 | 2 | 0.3 | 0.1 | 0.3 | 0.1 | 0.8 | 1 | 0.8 | 0 |
| FCRL1 | 443 | 518 | 0.4 | 0 | 2 | 3 | 2 | 1 | 0 | 0 |
| FCRL2 | 25 | 23 | 0 | 0 | 0.1 | 0 | 0.2 | 0 | 0 | 0 |
| FCRL3 | 66 | 47 | 0 | 0 | 4 | 5 | 24 | 16 | 0 | 0 |
| FCRL4 | 0 | 0 | 0 | 0 | 0 | 0 | 0 | 0 | 0 | 0 |
| FCRL5 | 160 | 87 | 1 | 0.1 | 0 | 0 | 0.5 | 0 | 0 | 0 |
| FCRL6 | 0.1 | 0 | 0.4 | 0 | 0.8 | 0.4 | 126 | 72 | 0.1 | 0.5 |
| MILR1 | 33 | 27 | 42 | 37 | 0.3 | 0.2 | 0.7 | 0.2 | 57 | 29 |
| CD200R1 | 0 | 0.2 | 0 | 0 | 2 | 1 | 3 | 0 | 24 | 6 |
| MRGPRX1 | 0 | 0.1 | 0 | 0 | 0 | 0 | 0 | 0 | 0 | 0.1 |
| MRGPRX2 | 0 | 0 | 0 | 0 | 0 | 0 | 0.1 | 0 | 365 | 253 |
| MRGPRX3 | 0.2 | 0 | 0.5 | 0.6 | 0 | 0 | 0.1 | 0.1 | 0 | 0.1 |
| MRGPRX4 | 0.7 | 0 | 0 | 0 | 0 | 0 | 0 | 0 | 0 | 0 |
Table 8.
Leukocyte immunoglobulin-like and killer cell lectin-like receptors.
| Gene | B-cell | B-cell | Monocyte | Monocyte | CD4+ T-cell |
CD4+ T-cell |
CD8+ T-cell |
CD8+ T-cell |
MC | MC |
|---|---|---|---|---|---|---|---|---|---|---|
| LILRA1 | 0.4 | 0.1 | 42 | 53 | 0.4 | 0 | 0,2 | 0.2 | 2 | 0.3 |
| LILRA2 | 0.4 | 0.7 | 96 | 106 | 0.1 | 0.4 | 2 | 0 | 17 | 4 |
| LILRA3 | 0.2 | 0 | 78 | 34 | 0.2 | 0 | 1 | 0.4 | 0.1 | 0 |
| LILRA6 | 0 | 0.3 | 141 | 128 | 2 | 1 | 2 | 2 | 2 | 4 |
| LILRB1 | 34 | 37 | 47 | 48 | 0.2 | 0 | 10 | 1 | 0.1 | 0 |
| LILRB2 | 0.1 | 0.4 | 245 | 240 | 0.8 | 0.5 | 1 | 0.6 | 4 | 1 |
| LILRB3 | 2 | 0.7 | 335 | 500 | 2 | 2 | 2 | 0.2 | 8 | 2 |
| LILRB4 | 0.4 | 0.4 | 107 | 147 | 0.1 | 0.5 | 0.3 | 0 | 1 | 0.3 |
| OSCAR | 0 | 0 | 327 | 284 | 0 | 0 | 0.5 | 0.1 | 0 | 0.7 |
| KLRB1 | 0.2 | 0.3 | 0.5 | 0 | 504 | 245 | 420 | 183 | 0.4 | 1 |
| KLRC4 | 0 | 0 | 0 | 0 | 0.4 | 0 | 71 | 23 | 0 | 0.2 |
| KLRC3 | 0 | 0 | 0.1 | 0 | 0.4 | 0 | 82 | 58 | 0 | 0.1 |
| KLRG1 | 3 | 4 | 0.4 | 0.9 | 101 | 97 | 197 | 178 | 202 | 96 |
| KLRK1 | 34 | 19 | 0.3 | 0 | 5 | 0.4 | 641 | 424 | 1 | 0.8 |
| NKG7 | 1 | 2 | 13 | 13 | 84 | 32 | 1423 | 1129 | 0.4 | 0.5 |
| NCR3 | 39 | 56 | 0.3 | 0 | 18 | 19 | 46 | 72 | 0.7 | 0 |
Table 9.
Complement and coagulation components and receptors.
| Gene | B-cell | B-cell | Monocyte | Monocyte | CD4+ T-cell |
CD4+ T-cell |
CD8+ T-cell |
CD8+ T-cell |
MC | MC |
|---|---|---|---|---|---|---|---|---|---|---|
| C1QA | 0 | 0 | 20 | 15 | 0 | 0 | 0.2 | 0 | 2 | 0.9 |
| C1QB | 0.2 | 0 | 2 | 0.4 | 0 | 0 | 0 | 0.1 | 5 | 2 |
| C1QC | 0 | 0 | 2 | 0.1 | 0 | 0 | 0.1 | 0 | 10 | 2 |
| C2 | 0 | 0.2 | 5 | 8 | 0 | 0 | 0 | 0.1 | 13 | 12 |
| CFP | 3 | 1 | 732 | 837 | 26 | 37 | 11 | 17 | 1 | 1 |
| CFD | 3 | 0.7 | 478 | 431 | 3 | 1 | 4 | 7 | 107 | 93 |
| FCN1 | 3 | 0.6 | 1166 | 766 | 5 | 2 | 10 | 4 | 0.7 | 0 |
| FCN2 | 0 | 0 | 0 | 0 | 0 | 0 | 0 | 0.1 | 0 | 0 |
| FCN3 | 0 | 0 | 0 | 0 | 0 | 0 | 0 | 0 | 0 | 0.2 |
| C3 | 0 | 0 | 0.1 | 2 | 0 | 0 | 0.1 | 0 | 8 | 7 |
| C9 | 0 | 0 | 0 | 0 | 0 | 0 | 0 | 0 | 0 | 0.1 |
| CFH | 0 | 0 | 0 | 0 | 7 | 9 | 8 | 4 | 14 | 1 |
| C3AR1 | 0 | 0 | 0.9 | 1 | 4 | 1 | 3 | 0.6 | 31 | 6 |
| PROCR | 0 | 0 | 0.6 | 2 | 0.2 | 0.1 | 1 | 0.5 | 36 | 19 |
| CR1 | 24 | 23 | 1 | 12 | 3 | 4 | 6 | 2 | 0.1 | 0 |
| CR2 | 40 | 40 | 0 | 0.1 | 4 | 5 | 5 | 5 | 0.3 | 0 |
Table 10.
Pattern recognition receptors.
| Gene | B-cell | B-cell | Monocyte | Monocyte | CD4+ T-cell |
CD4+ T-cell |
CD8+ T-cell |
CD8+ T-cell |
MC | MC |
|---|---|---|---|---|---|---|---|---|---|---|
| TLR1 | 12 | 10 | 3 | 7 | 2 | 3 | 2 | 0.3 | 0.3 | 0.1 |
| TLR2 | 0.7 | 0.4 | 7 | 4 | 0.8 | 1 | 0.2 | 0.6 | 2 | 1 |
| TLR3 | 0 | 0 | 0 | 0 | 1 | 0 | 2 | 0.1 | 1 | 0.5 |
| TLR4 | 0 | 1 | 6 | 6 | 0 | 0 | 0 | 0 | 14 | 8 |
| TLR5 | 0 | 0 | 3 | 4 | 6 | 5 | 3 | 0.1 | 1 | 0.4 |
| TLR6 | 11 | 8 | 1 | 1 | 0.2 | 0.4 | 0 | 0.1 | 0 | 0 |
| TLR7 | 7 | 13 | 2 | 1 | 0 | 0.1 | 0 | 0 | 0.4 | 0.1 |
| TLR8 | 0.1 | 0 | 32 | 11 | 0.3 | 0 | 0.6 | 0 | 0 | 0 |
| TLR9 | 12 | 11 | 5 | 3 | 0.3 | 0.4 | 0.1 | 0 | 0.7 | 0.7 |
| TLR10 | 2 | 5 | 0 | 0 | 0 | 0 | 0 | 0 | 0 | 0 |
| NOD1 | 18 | 23 | 5 | 6 | 8 | 8 | 8 | 6 | 11 | 5 |
| NOD2 | 0.1 | 0.2 | 29 | 43 | 3 | 3 | 1 | 0.9 | 0.1 | 0.5 |
| NLRC3 | 19 | 23 | 0 | 0 | 39 | 42 | 45 | 23 | 4 | 2 |
| DDX58(RIG1) | 16 | 17 | 5 | 5 | 10 | 14 | 15 | 13 | 39 | 33 |
| IFIH1(MDA5) | 17 | 18 | 1 | 2 | 9 | 10 | 12 | 2 | 17 | 13 |
| FADD | 9 | 8 | 8 | 6 | 26 | 25 | 23 | 23 | 8 | 16 |
| EIF2AK2 (PKR) | 95 | 95 | 29 | 27 | 76 | 121 | 86 | 100 | 44 | 44 |
| MAVS | 35 | 30 | 21 | 11 | 22 | 32 | 26 | 22 | 26 | 22 |
| MYD88 | 30 | 26 | 100 | 99 | 27 | 25 | 39 | 36 | 49 | 43 |
| PLD4 | 83 | 178 | 23 | 21 | 1 | 2 | 0.3 | 0.1 | 2 | 0 |
| CLEC7A | 0.2 | 0.2 | 41 | 30 | 0.2 | 0.2 | 0.2 | 0.1 | 0 | 0 |
| FPR1(Formyl pep. R) | 0.1 | 0.2 | 48 | 23 | 0 | 0 | 0.4 | 0 | 0 | 0.3 |
Table 11.
Histamine, leukotriene and prostaglandin synthesis.
| Gene | B-cell | B-cell | Monocyte | Monocyte | CD4+ T-cell |
CD4+ T-cell |
CD8+ T-cell |
CD8+ T-cell |
MC | MC |
|---|---|---|---|---|---|---|---|---|---|---|
| HDC | 0 | 0 | 0 | 0 | 0.2 | 0 | 0 | 0 | 853 | 796 |
| MAOA | 0 | 0 | 0.3 | 0 | 0 | 0.5 | 0.2 | 0 | 9 | 10 |
| MAOB | 0 | 0 | 0 | 0 | 0 | 0.6 | 0.1 | 0 | 200 | 105 |
| ALOX5 | 311 | 249 | 235 | 289 | 6 | 5 | 3 | 0.4 | 307 | 1423 |
| COTL1 (CLP) | 439 | 596 | 1032 | 780 | 541 | 515 | 516 | 536 | 259 | 297 |
| ALOX5AP (FLAP) | 72 | 82 | 35 | 47 | 175 | 134 | 183 | 281 | 312 | 130 |
| LTC4S | 0.1 | 0.2 | 2 | 2 | 3 | 4 | 3 | 2 | 129 | 60 |
| HPGD | 0.2 | 0.2 | 0.1 | 0.1 | 8 | 9 | 8 | 10 | 1296 | 1021 |
| HPGDS | 0 | 0 | 0.1 | 0 | 0 | 0.2 | 0 | 0 | 705 | 484 |
| PTGS1 | 40 | 30 | 50 | 40 | 0 | 0.5 | 0.5 | 0.5 | 378 | 357 |
| PTGS2 | 0 | 0.1 | 4 | 2 | 0.1 | 0 | 0 | 0 | 523 | 392 |
| PLA2G2A | 0 | 0 | 0 | 0 | 0 | 0 | 0 | 0 | 272 | 579 |
| TBXAS1 | 5 | 9 | 297 | 323 | 13 | 7 | 3 | 1 | 26 | 18 |
| LPCAT2 | 0 | 0.2 | 27 | 39 | 0 | 0.9 | 0.3 | 0 | 202 | 95 |
| ENPP2 | 1 | 2 | 0 | 0.1 | 5 | 18 | 4 | 12 | 107 | 86 |
| MBOAT7 | 28 | 30 | 332 | 263 | 20 | 35 | 20 | 51 | 291 | 324 |
| ANXA1 | 0.8 | 0.8 | 439 | 366 | 585 | 361 | 547 | 204 | 3919 | 5423 |
Table 12.
Proteoglycan synthesis and binding and other carbohydrate containing or interacting proteins.
Table 12.
Proteoglycan synthesis and binding and other carbohydrate containing or interacting proteins.
| Gene | B-cell | B-cell | Monocyte | Monocyte | CD4+ T-cell |
CD4+ T-cell |
CD8+ T-cell |
CD8+ T-cell |
MC | MC |
|---|---|---|---|---|---|---|---|---|---|---|
| SRGN | 78 | 45 | 1125 | 1350 | 1117 | 690 | 1258 | 897 | 5850 | 7939 |
| HS3ST1 | 2 | 5 | 0 | 0 | 0 | 0.1 | 0 | 0 | 46 | 19 |
| HS6ST1 | 13 | 20 | 64 | 29 | 9 | 5 | 6 | 3 | 293 | 108 |
| HSPG2 | 1 | 0.2 | 0.4 | 0.4 | 0.7 | 3 | 0.7 | 0.2 | 198 | 127 |
| GALNT6 | 3 | 5 | 13 | 17 | 4 | 2 | 5 | 3 | 59 | 68 |
| NDST1 | 5 | 6 | 19 | 22 | 0.4 | 1 | 0.8 | 0.5 | 65 | 54 |
| NDST2 | 113 | 99 | 148 | 103 | 84 | 109 | 79 | 91 | 799 | 183 |
| GNS | 10 | 9 | 29 | 23 | 24 | 19 | 32 | 16 | 135 | 270 |
| B4GALT5 | 8 | 8 | 12 | 5 | 8 | 9 | 13 | 11 | 129 | 255 |
| GBE1 | 11 | 12 | 1 | 1 | 6 | 8 | 8 | 9 | 139 | 151 |
| SDC3 | 1 | 1 | 4 | 4 | 0.7 | 0.2 | 0.2 | 0 | 87 | 74 |
| B3GNT5 | 0 | 0.1 | 14 | 12 | 0 | 0.1 | 0 | 0.9 | 79 | 100 |
| EXTL3 | 1 | 3 | 2 | 5 | 4 | 4 | 5 | 2 | 65 | 25 |
| EXT1 | 5 | 7 | 10 | 18 | 8 | 8 | 10 | 6 | 119 | 91 |
| GLT1D1 | 0.2 | 0 | 75 | 103 | 0 | 0.2 | 0.3 | 0 | 0 | 0.1 |
| RENBP | 6 | 4 | 90 | 88 | 5 | 4 | 4 | 2 | 99 | 63 |
| VCAN | 0.4 | 0 | 140 | 774 | 0.9 | 0.4 | 2 | 0.4 | 3 | 2 |
| LGALS2 | 0.5 | 0.2 | 88 | 136 | 0.2 | 0.7 | 1 | 0.2 | 1 | 0.4 |
| LGALS3 | 1 | 1 | 96 | 59 | 53 | 24 | 24 | 10 | 679 | 885 |
Table 13.
Other enzymes.
| Gene | B-cell | B-cell | Monocyte | Monocyte | CD4+ T-cell |
CD4+ T-cell |
CD8+ T-cell |
CD8+ T-cell |
MC | MC |
|---|---|---|---|---|---|---|---|---|---|---|
| CYBB | 134 | 190 | 725 | 1465 | 2 | 2 | 7 | 0.4 | 4 | 0.9 |
| ARG2 | 0 | 0.7 | 0.9 | 0 | 0.1 | 0.4 | 0.4 | 5 | 68 | 47 |
| PADI2 | 0.2 | 0.2 | 63 | 64 | 0.1 | 0.2 | 0.4 | 0 | 59 | 47 |
| PADI4 | 0 | 0.1 | 100 | 98 | 0.4 | 0.1 | 0 | 0 | 0 | 0 |
| EPHX2 | 1 | 1 | 0 | 0 | 32 | 50 | 25 | 13 | 1 | 2 |
| HMOX1 | 4 | 3 | 414 | 466 | 1 | 0.5 | 2 | 1 | 29 | 13 |
| ALAS1 | 6 | 5 | 18 | 17 | 11 | 9 | 11 | 12 | 155 | 90 |
| SAMHD1 | 7 | 7 | 91 | 48 | 154 | 155 | 149 | 131 | 36 | 49 |
| NUDT16 | 7 | 7 | 104 | 152 | 5 | 6 | 3 | 9 | 16 | 12 |
| ALDH2 | 11 | 17 | 905 | 1627 | 1 | 0.5 | 2 | 3 | 65 | 63 |
| ACSL1 | 16 | 13 | 259 | 683 | 7 | 7 | 7 | 2 | 40 | 40 |
| NUDT18 | 17 | 24 | 158 | 133 | 5 | 8 | 7 | 19 | 2 | 2 |
| PGD | 45 | 39 | 1630 | 3408 | 33 | 53 | 49 | 83 | 91 | 139 |
| GLUL | 26 | 22 | 462 | 536 | 40 | 32 | 22 | 6 | 2816 | 5447 |
| NAA10 | 21 | 19 | 167 | 251 | 21 | 28 | 20 | 10 | 30 | 33 |
Table 14.
Transcription Factors.
| Gene | B-cell | B-cell | Monocyte | Monocyte | CD4+ T-cell |
CD4+ T-cell |
CD8+ T-cell |
CD8+ T-cell |
MC | MC |
|---|---|---|---|---|---|---|---|---|---|---|
| GATA1 | 0 | 0.1 | 0 | 0 | 0 | 0 | 0.1 | 0.1 | 105 | 108 |
| GATA2 | 0.1 | 0 | 0.6 | 0.3 | 0.1 | 0.2 | 0.1 | 0 | 2859 | 1421 |
| GATA3 | 0.1 | 0.4 | 0.4 | 0 | 196 | 174 | 150 | 281 | 0.4 | 2 |
| FOXP3 | 0 | 0.3 | 0 | 0.1 | 30 | 23 | 2 | 0.2 | 0.3 | 0.1 |
| TBX21(T-bet) | 5 | 3 | 0 | 0 | 27 | 15 | 78 | 21 | 0.1 | 0.6 |
| RORC | 0 | 0 | 0 | 0.5 | 17 | 10 | 6 | 5 | 0 | 0.2 |
| POU2F1(Oct1) | 9 | 12 | 3 | 2 | 8 | 9 | 8 | 2 | 15 | 4 |
| POU2F2(Oct2) | 292 | 249 | 328 | 240 | 25 | 33 | 27 | 83 | 0.5 | 1 |
| POU2AF1 | 307 | 435 | 2 | 0.1 | 2 | 4 | 1 | 0.1 | 0.1 | 0 |
| MITF | 0 | 0 | 2 | 4 | 0 | 0 | 0 | 0 | 195 | 64 |
| HES1 | 8 | 6 | 1 | 0.8 | 0 | 0 | 0 | 0.4 | 138 | 117 |
| HEY1 | 0 | 0.1 | 0 | 0 | 0 | 0.1 | 0 | 0.1 | 86 | 206 |
| MEIS2 | 0.1 | 0.2 | 0 | 0.1 | 0 | 0 | 0.2 | 0 | 275 | 193 |
| EPAS1 | 0.1 | 0.2 | 0.6 | 0.1 | 3 | 1 | 5 | 2 | 436 | 835 |
| PTRF | 0 | 0.2 | 0.8 | 0.6 | 0.4 | 2 | 0.3 | 0.4 | 465 | 707 |
| NR4A1 | 11 | 9 | 8 | 24 | 4 | 3 | 2 | 7 | 997 | 147 |
| NFE2L3 | 1 | 0.8 | 2 | 0.9 | 4 | 3 | 1 | 1 | 18 | 19 |
| PBX1 | 0 | 0 | 0.5 | 0.1 | 0.9 | 0.1 | 0.5 | 0.1 | 53 | 44 |
| GLI3 | 0 | 0 | 0 | 0 | 0.3 | 0.6 | 1 | 1 | 57 | 47 |
| AFF2 | 5 | 5 | 4 | 2 | 2 | 9 | 4 | 2 | 95 | 48 |
| SPI1 (PU.1) | 63 | 66 | 369 | 252 | 1 | 1 | 3 | 0.9 | 56 | 17 |
| SPIB | 48 | 73 | 0.3 | 0.3 | 0.1 | 0.2 | 0 | 0 | 0.5 | 0 |
| PAX5 | 590 | 707 | 1 | 0.1 | 0.8 | 0 | 1 | 0.1 | 0 | 0 |
| AFF3 | 148 | 125 | 2 | 0.6 | 4 | 7 | 4 | 1 | 1 | 2 |
| KHDRBS2 | 212 | 137 | 2 | 0.4 | 0 | 0 | 0.1 | 0 | 0 | 0 |
| EBF1 | 53 | 68 | 0 | 0.5 | 0.2 | 0 | 0.2 | 0 | 16 | 0.1 |
| E2F5 | 51 | 67 | 1 | 0 | 1 | 2 | 4 | 1 | 2 | 0.8 |
| BACH2 | 351 | 392 | 4 | 0.8 | 73 | 61 | 76 | 12 | 3 | 4 |
| SETBP1 | 114 | 91 | 3 | 1 | 0.3 | 0.9 | 9 | 4 | 8 | 11 |
| LEF1 | 4 | 4 | 0 | 0 | 365 | 501 | 399 | 632 | 2 | 1 |
| RNF157 | 0.4 | 0.1 | 0 | 0 | 50 | 56 | 40 | 48 | 3 | 3 |
| TCEA3 | 0 | 0.1 | 4 | 1 | 99 | 168 | 70 | 140 | 21 | 29 |
| BHLHE40 | 9 | 9 | 165 | 190 | 226 | 145 | 167 | 66 | 1449 | 969 |
| HHEX | 170 | 173 | 50 | 43 | 1 | 1 | 1 | 1 | 33 | 27 |
| IKZF1(Ikaros) | 50 | 79 | 20 | 19 | 129 | 112 | 133 | 56 | 158 | 133 |
| IKZF2(Helios) | 1 | 3 | 0 | 0 | 3 | 5 | 16 | 12 | 4 | 1 |
| IKZF3(Aiolos) | 112 | 183 | 0.3 | 0.1 | 36 | 42 | 85 | 20 | 5 | 5 |
| GFI1 | 0.8 | 0.7 | 4 | 4 | 30 | 21 | 39 | 11 | 116 | 41 |
| ZEB1 | 76 | 60 | 0 | 0 | 92 | 79 | 78 | 28 | 18 | 16 |
| ZEB2 | 69 | 49 | 469 | 236 | 6 | 2 | 75 | 17 | 316 | 346 |
| KLF1 | 0 | 0 | 0 | 0 | 0 | 0 | 0 | 0 | 0.1 | 0 |
| KLF4 | 84 | 42 | 328 | 207 | 3 | 6 | 1 | 3 | 1751 | 1041 |
| ZNF385A | 13 | 16 | 311 | 269 | 1 | 1 | 3 | 1 | 12 | 16 |
| ZNF467 | 0.8 | 0.7 | 131 | 120 | 4 | 6 | 3 | 4 | 4 | 6 |
| ZNF513 | 27 | 26 | 271 | 226 | 18 | 25 | 15 | 18 | 17 | 24 |
| ZNF521 | 0.1 | 0.2 | 0 | 0 | 0 | 0 | 0.1 | 0 | 43 | 19 |
| ZNF703 | 9 | 7 | 74 | 83 | 1 | 1 | 1 | 3 | 20 | 23 |
| ZNF787 | 1 | 0.7 | 12 | 32 | 0.9 | 0.9 | 0.5 | 0.5 | 2 | 0.8 |
| ZNF827 | 48 | 22 | 0.5 | 0 | 10 | 17 | 29 | 33 | 4 | 8 |
| ZNF831 | 12 | 13 | 0.1 | 0 | 56 | 50 | 57 | 34 | 0.1 | 0 |
| ZCCHC24 | 2 | 2 | 15 | 8 | 0.9 | 1 | 1 | 5 | 53 | 65 |
| ZMIZ1 | 5 | 4 | 2280 | 1103 | 38 | 49 | 28 | 28 | 190 | 300 |
| CXXC1 | 8 | 6 | 76 | 85 | 10 | 15 | 7 | 9 | 6 | 5 |
| IRF5 | 66 | 60 | 444 | 500 | 5 | 5 | 2 | 6 | 16 | 11 |
| CEBPA | 0.5 | 0.3 | 96 | 54 | 0.2 | 0.5 | 3 | 6 | 2 | 4 |
| MAFG | 9 | 6 | 411 | 390 | 4 | 5 | 5 | 0.9 | 38 | 69 |
| ELF3 | 1 | 0.5 | 51 | 46 | 0.3 | 1 | 0.7 | 0.1 | 0 | 0.2 |
| VENTX | 1 | 1 | 76 | 46 | 0 | 0 | 0.1 | 0 | 3 | 2 |
| RUNX2 | 6 | 4 | 10 | 9 | 41 | 44 | 33 | 53 | 61 | 23 |
| MAF | 0.1 | 0 | 0.4 | 0.5 | 42 | 30 | 30 | 22 | 23 | 59 |
| ETS2 | 4 | 3 | 206 | 177 | 14 | 15 | 14 | 17 | 395 | 9645 |
| MYC | 209 | 216 | 2 | 1 | 115 | 135 | 79 | 82 | 149 | 259 |
| STRBP | 270 | 258 | 2 | 2 | 26 | 29 | 25 | 10 | 4 | 9 |
| EIF2AK3 | 246 | 178 | 4 | 2 | 22 | 30 | 25 | 37 | 92 | 254 |
| CTDSP1 | 218 | 241 | 1508 | 1675 | 170 | 209 | 184 | 284 | 254 | 221 |
| CCDC9 | 170 | 75 | 1118 | 585 | 33 | 38 | 38 | 49 | 66 | 70 |
| SCML4 | 14 | 16 | 0 | 0 | 26 | 44 | 35 | 18 | 0.1 | 0 |
Table 15.
SOX-members.
| Gene | B-cell | B-cell | Monocyte | Monocyte | CD4+ T-cell |
CD4+ T-cell |
CD8+ T-cell |
CD8+ T-cell |
MC | MC |
|---|---|---|---|---|---|---|---|---|---|---|
| SOX1 | 0 | 0 | 0 | 0.2 | 0.1 | 0 | 0.2 | 0.1 | 0.7 | 0.4 |
| SOX2 | 0 | 0 | 0 | 0.2 | 0 | 0 | 0 | 0.1 | 0.5 | 1 |
| SOX3 | 0 | 0 | 0 | 0 | 0 | 0 | 0.2 | 0 | 0 | 0.2 |
| SOX4 | 2 | 6 | 3 | 4 | 0.6 | 7 | 2 | 3 | 62 | 29 |
| SOX5 | 0 | 0 | 0 | 0.1 | 0 | 0 | 0 | 0 | 0.8 | 0.3 |
| SOX6 | 0 | 0 | 0 | 0 | 0 | 0 | 0 | 0.1 | 0.4 | 0.4 |
| SOX7 | 3 | 1 | 0 | 0 | 0 | 0 | 0 | 0 | 46 | 2 |
| SOX8 | 0 | 0 | 0.1 | 0 | 4 | 7 | 2 | 11 | 4 | 5 |
| SOX9 | 0 | 0 | 0 | 0 | 0 | 0 | 0 | 0 | 1 | 1 |
| SOX10 | 0 | 0 | 0 | 0.1 | 0 | 0 | 0 | 0 | 17 | 2 |
| SOX11 | 0 | 0 | 0 | 0 | 0 | 0 | 0 | 0.1 | 0.3 | 0.1 |
| SOX12 | 3 | 2 | 2 | 7 | 6 | 3 | 5 | 1 | 7 | 1 |
| SOX13 | 0.1 | 0.1 | 0.3 | 0.1 | 5 | 2 | 10 | 11 | 105 | 135 |
| SOX14 | 0 | 0 | 0 | 0 | 0 | 0 | 0 | 0 | 0 | 0 |
| SOX15 | 0.2 | 0.1 | 2 | 2 | 0.1 | 0 | 0 | 0 | 4 | 4 |
| SOX17 | 0 | 0 | 0 | 0 | 0 | 0 | 0 | 0 | 37 | 60 |
| SOX18 | 0 | 0 | 0 | 0 | 0 | 0 | 0 | 0 | 33 | 38 |
Table 16.
STATs.
| Gene | B-cell | B-cell | Monocyte | Monocyte | CD4+ T-cell |
CD4+ T-cell |
CD8+ T-cell |
CD8+ T-cell |
MC | MC |
|---|---|---|---|---|---|---|---|---|---|---|
| STAT1 | 24 | 32 | 53 | 168 | 156 | 150 | 126 | 25 | 46 | 25 |
| STAT2 | 104 | 97 | 109 | 152 | 49 | 75 | 50 | 34 | 60 | 48 |
| STAT3 | 46 | 42 | 46 | 85 | 121 | 101 | 117 | 36 | 222 | 199 |
| STAT4 | 3 | 3 | 0.8 | 2 | 34 | 77 | 60 | 53 | 0.5 | 0.2 |
| STAT5A | 48 | 35 | 111 | 80 | 84 | 63 | 88 | 77 | 80 | 56 |
| STAT5B | 108 | 108 | 39 | 28 | 225 | 230 | 204 | 240 | 111 | 100 |
| STAT6 | 557 | 427 | 646 | 561 | 160 | 211 | 167 | 274 | 158 | 116 |
Table 17.
Cytokines and Chemokines.
| Gene | B-cell | B-cell | Monocyte | Monocyte | CD4+ T-cell |
CD4+ T-cell |
CD8+ T-cell |
CD8+ T-cell |
MC | MC |
|---|---|---|---|---|---|---|---|---|---|---|
| LTB | 1087 | 1240 | 17 | 20 | 1403 | 1944 | 784 | 2219 | 3 | 2 |
| LIF | 0 | 0 | 0 | 0 | 0 | 0.2 | 0 | 0.4 | 659 | 307 |
| TNF | 8 | 18 | 25 | 36 | 58 | 136 | 63 | 371 | 138 | 124 |
| TNFSF10 | 3 | 4 | 55 | 46 | 28 | 33 | 12 | 14 | 89 | 93 |
| CSF1 | 0 | 0.4 | 3 | 2 | 8 | 8 | 4 | 1 | 1579 | 933 |
| CSF2 | 0 | 0 | 0 | 0 | 1 | 0 | 0.5 | 0.2 | 9 | 61 |
| CSF3 | 0 | 0.2 | 0 | 0.1 | 0.1 | 0 | 0 | 0 | 65 | 3 |
| EPO | 0 | 0 | 0 | 0.1 | 0 | 0 | 0 | 0 | 0 | 0.4 |
| IL1A | 0 | 0 | 0 | 0 | 0 | 0 | 0 | 0 | 4 | 5 |
| IL1B | 0 | 0.1 | 19 | 1 | 0 | 0 | 0 | 0.1 | 20 | 10 |
| IL2 | 0 | 0 | 0 | 0 | 0.7 | 0.9 | 1 | 0 | 0 | 0 |
| IL3 | 0 | 0 | 0 | 0 | 0 | 0.5 | 0.4 | 0.6 | 0.3 | 0.4 |
| IL4 | 0 | 0 | 0 | 0 | 0 | 0 | 0 | 0 | 0 | 0.1 |
| IL5 | 0 | 0 | 0 | 0 | 0 | 0 | 0.4 | 0 | 0.1 | 0 |
| IL6 | 28 | 25 | 0.4 | 0.1 | 0 | 0 | 0 | 0 | 262 | 7 |
| IL7 | 6 | 13 | 0.1 | 0.1 | 0.6 | 0.4 | 0.2 | 0.1 | 0.8 | 2 |
| IL8 | 0 | 0.2 | 32 | 38 | 0.2 | 0 | 0.4 | 0.2 | 65 | 80 |
| IL9 | 0 | 0 | 0 | 0 | 0 | 0 | 0 | 0 | 0 | 0 |
| IL10 | 0.7 | 0.2 | 0.6 | 0.8 | 0.1 | 0.4 | 0.4 | 0 | 1 | 0.5 |
| IL13 | 0.5 | 0 | 0 | 0.3 | 0.4 | 0.2 | 0.5 | 0 | 29 | 47 |
| IL11 | 0.2 | 0.2 | 0 | 0 | 0.2 | 0.1 | 0.2 | 0.1 | 0.8 | 2 |
| IL19 | 0.1 | 0 | 0 | 0 | 0 | 0 | 0.1 | 0 | 0 | 0 |
| IL12A | 24 | 18 | 1 | 2 | 0.4 | 0.4 | 2 | 4 | 0.5 | 0.8 |
| IL12B | 0 | 0 | 0 | 0 | 0 | 0 | 0 | 0 | 0 | 0 |
| IL15 | 13 | 9 | 8 | 12 | 6 | 7 | 4 | 3 | 0.7 | 0.9 |
| IL16 | 0 | 0 | 0 | 0 | 0 | 0 | 0 | 0.2 | 3 | 4 |
| IL17A | 0 | 0 | 0 | 0 | 0.2 | 0 | 0 | 0 | 0 | 0 |
| IL17B | 0 | 0 | 0 | 0 | 0 | 0 | 0 | 0 | 2 | 3 |
| IL17F | 0 | 0 | 0,.1 | 0 | 0 | 0 | 0 | 0.1 | 0.1 | 0 |
| IL20 | 0 | 0 | 0 | 0 | 0 | 0 | 0 | 0 | 0 | 0 |
| IL21 | 0 | 0 | 0 | 0 | 0 | 0 | 0 | 0 | 0 | 0 |
| IL22 | 0 | 0 | 0.4 | 0.6 | 0 | 0 | 0 | 0 | 0 | 0 |
| IL23A | 1 | 0.5 | 0 | 0 | 8 | 6 | 4 | 1 | 0.7 | 0.2 |
| IL24 | 0.5 | 3 | 0 | 0 | 8 | 7 | 8 | 0.7 | 0.3 | 0.4 |
| IL25 | 0 | 0 | 0 | 0 | 0 | 0 | 0 | 0 | 0 | 0 |
| IL26 | 0.7 | 0.8 | 0 | 0.1 | 0.4 | 0 | 0.8 | 0 | 0 | 0 |
| IL28A | 0 | 0 | 0 | 0 | 0.3 | 0 | 0.6 | 0 | 0.4 | 0.1 |
| IL28B | 0.2 | 0 | 0.9 | 1 | 0.1 | 0 | 0 | 0 | 0 | 0 |
| IL29 | 0 | 0 | 0 | 0.1 | 0 | 0.1 | 0 | 0 | 0 | 0 |
| IL31 | 0 | 0 | 0 | 0 | 0 | 0 | 0 | 0 | 0 | 0 |
| IL32 | 0.4 | 0.3 | 2 | 0.3 | 2636 | 1843 | 2728 | 3462 | 23 | 70 |
| IL33 | 0 | 0 | 0 | 0 | 0 | 0 | 0 | 0 | 4 | 2 |
| IL34 | 0 | 0 | 0 | 0 | 0 | 0 | 0.3 | 0 | 2 | 0.8 |
| IL36A | 0 | 0 | 0 | 0 | 0.4 | 2 | 0.6 | 1 | 0 | 0 |
| IL36B | 0 | 0 | 0 | 0 | 0 | 0 | 0 | 0 | 0 | 0 |
| IL36G | 0 | 0 | 0 | 0 | 0 | 0 | 0 | 0 | 0 | 0 |
| IL37 | 0 | 0 | 0.1 | 0 | 0 | 0.4 | 0 | 0 | 0 | 0 |
| CCL2 | 0 | 0 | 0.6 | 0.1 | 0 | 0.1 | 0.1 | 0 | 1518 | 1644 |
| CCL3 | 0.8 | 1 | 24 | 16 | 0.2 | 0.2 | 7 | 3 | 6 | 4 |
| CCL4 | 0.2 | 1 | 3 | 0.8 | 3 | 1 | 81 | 69 | 76 | 34 |
| CCL5 | 3 | 1 | 7 | 5 | 283 | 142 | 1778 | 1157 | 0.3 | 0.7 |
| CXCL16 | 33 | 24 | 50 | 54 | 26 | 12 | 22 | 25 | 263 | 160 |
| PPBP(CXCL7) | 6 | 15 | 154 | 97 | 3 | 8 | 6 | 9 | 0 | 0 |
| VEGFA | 0.7 | 0.1 | 222 | 109 | 0.9 | 0.1 | 0.6 | 0.5 | 1948 | 1323 |
| VEGFB | 116 | 117 | 12 | 7 | 53 | 59 | 49 | 96 | 138 | 87 |
| VEGFC | 0 | 0 | 0 | 0 | 0 | 0 | 0 | 0 | 1 | 0 |
| TYMP | 12 | 9 | 574 | 637 | 8 | 7 | 6 | 12 | 23 | 37 |
| PDGFA | 0.7 | 0.1 | 3 | 0.4 | 0.9 | 0.4 | 3 | 0.6 | 270 | 366 |
| PDGFB | 0 | 0 | 0 | 0 | 0 | 0.5 | 0.2 | 1 | 0 | 1 |
| PDGFC | 0.1 | 0 | 4 | 3 | 0 | 0 | 0 | 0 | 17 | 20 |
| GDF15 | 0 | 0.2 | 5 | 3 | 0 | 0 | 0 | 0 | 136 | 27 |
| TGFA | 0 | 0 | 1 | 0.6 | 1 | 0.2 | 2 | 5 | 31 | 21 |
| TGFB1I1 | 0.1 | 0.3 | 0.4 | 0.2 | 0.3 | 0 | 0.5 | 0.4 | 137 | 149 |
| ADM | 0.1 | 0.2 | 107 | 135 | 0.7 | 2 | 1 | 6 | 55 | 113 |
| PF4 (CXCL4) | 4 | 7 | 122 | 64 | 1 | 4 | 4 | 4 | 0 | 0 |
| EMR2 | 0.5 | 0.3 | 394 | 472 | 1 | 0.6 | 1 | 0.5 | 154 | 207 |
| FGFBP2 | 0.2 | 0.1 | 0 | 0.1 | 3 | 0.9 | 118 | 66 | 0.5 | 0.5 |
Table 18.
Cytokine induced proteins.
| Gene | B-cell | B-cell | Monocyte | Monocyte | CD4+ T-cell |
CD4+ T-cell |
CD8+ T-cell |
CD8+ T-cell |
MC | MC |
|---|---|---|---|---|---|---|---|---|---|---|
| TNFAIP2 | 0.1 | 0.1 | 697 | 483 | 0.1 | 0.2 | 1 | 0.6 | 44 | 58 |
| TNFAIP3 | 21 | 35 | 43 | 223 | 1074 | 710 | 437 | 189 | 5148 | 1318 |
| TGFBI | 3 | 3 | 380 | 244 | 8 | 5 | 6 | 2 | 92 | 7 |
| IFITM1 | 15 | 26 | 71 | 98 | 515 | 475 | 567 | 713 | 87 | 90 |
Table 19.
Cytokine and chemokine receptors.
| Gene | B-cell | B-cell | Monocyte | Monocyte | CD4+ T-cell |
CD4+ T-cell |
CD8+ T-cell |
CD8+ T-cell |
MC | MC |
|---|---|---|---|---|---|---|---|---|---|---|
| KIT | 0 | 0 | 0 | 0.1 | 2 | 2 | 0.7 | 1 | 1023 | 458 |
| EPOR | 2 | 4 | 0.8 | 0.8 | 0.4 | 1 | 0.5 | 1 | 105 | 38 |
| IL1RL1(IL33R) | 0 | 0 | 0 | 0 | 0 | 0 | 0 | 0 | 125 | 289 |
| IL1R1 | 0 | 0 | 0.1 | 0.3 | 1 | 0.7 | 0.5 | 0.2 | 10 | 6 |
| IL1R2 | 0 | 0 | 4 | 6 | 0.2 | 0.1 | 0 | 0 | 6 | 2 |
| IL2RA | 20 | 13 | 0 | 0 | 24 | 18 | 4 | 2 | 17 | 32 |
| IL2RB | 2 | 0.7 | 1 | 1 | 198 | 148 | 316 | 201 | 0.4 | 2 |
| IL2RG | 71 | 128 | 10 | 22 | 430 | 357 | 391 | 92 | 28 | 29 |
| IL3RA | 162? | 3 | 14 | 4 | 10 | 0 | 2 | 0 | 10 | 11 |
| IL4R | 245 | 405 | 151 | 249 | 1189 | 909 | 829 | 339 | 169 | 291 |
| IL5RA | 0 | 0 | 0 | 0 | 0 | 0 | 0 | 0 | 17 | 11 |
| IL6RA | 0.8 | 2 | 71 | 89 | 65 | 66 | 27 | 6 | 69 | 98 |
| IL6ST | 13 | 8 | 3 | 3 | 76 | 134 | 52 | 58 | 124 | 252 |
| IL7R | 0.1 | 0.1 | 0 | 0 | 762 | 605 | 614 | 390 | 8 | 11 |
| IL9R | 0 | 0 | 0 | 0 | 2 | 1 | 1 | 0.4 | 4 | 11 |
| IL10RA | 249 | 171 | 334 | 264 | 323 | 218 | 324 | 167 | 4 | 2 |
| IL10RB | 11 | 15 | 5 | 12 | 5 | 10 | 7 | 7 | 11 | 11 |
| IL11RA | 2 | 2 | 4 | 4 | 14 | 9 | 9 | 0.9 | 13 | 11 |
| IL12RB1 | 3 | 1 | 7 | 14 | 10 | 7 | 7 | 3 | 0 | 0 |
| IL12RB2 | 0 | 0 | 0.1 | 0.3 | 3 | 2 | 3 | 1 | 0 | 0 |
| IL13RA1 | 3 | 3 | 5 | 5 | 0.5 | 0 | 0.4 | 0 | 3 | 3 |
| IL13RA2 | 0 | 0 | 0 | 0 | 0 | 0 | 0 | 0 | 0 | 0.1 |
| IL15R | 3 | 3 | 45 | 35 | 8 | 7 | 6 | 4 | 5 | 8 |
| IL16R(CD4) | 0.4 | 0.1 | 193 | 197 | 536 | 501 | 18 | 1 | 238 | 157 |
| IL17RA | 21 | 17 | 160 | 96 | 59 | 63 | 60 | 51 | 35 | 37 |
| IL17RB | 0.7 | 0 | 0 | 0 | 0 | 0.6 | 0.5 | 0 | 0.4 | 0.3 |
| IL17RC | 0 | 0 | 8 | 6 | 0.2 | 0 | 0 | 0.2 | 5 | 5 |
| IL17RD | 0 | 0 | 0 | 0 | 0 | 0 | 0 | 0 | 3 | 6 |
| IL17RE | 0 | 0 | 0 | 0 | 2 | 2 | 2 | 1 | 0.1 | 0.2 |
| IL18R1 | 1 | 1 | 0.5 | 0.5 | 10 | 12 | 6 | 17 | 280 | 216 |
| IL20RA | 0 | 0 | 0 | 0 | 0 | 0 | 0 | 0 | 0 | 0.1 |
| IL20RB | 0.1 | 0.1 | 0.3 | 0.3 | 0 | 0.4 | 0.6 | 0.7 | 2 | 0.7 |
| IL21R | 7 | 18 | 1 | 1 | 30 | 16 | 30 | 9 | 0 | 0.2 |
| IL22RA1 | 0 | 0 | 0 | 0 | 0 | 0 | 0 | 0.1 | 0.3 | 0 |
| IL22RA2 | 0 | 0 | 0 | 0 | 0 | 0 | 0 | 0 | 0 | 0 |
| IL23R | 0 | 0 | 0 | 0 | 0.7 | 1 | 0.6 | 2 | 0 | 0.2 |
| IL27RA | 27 | 29 | 74 | 70 | 42 | 54 | 35 | 47 | 9 | 14 |
| IL28RA | 7 | 7 | 0 | 0 | 0.8 | 0.1 | 1 | 2 | 0 | 0 |
| IL31RA | 0 | 0 | 0.3 | 0.1 | 0.1 | 0 | 0 | 0.1 | 0 | 0.2 |
| CSF1R | 0.7 | 0.2 | 226 | 210 | 2 | 1 | 1 | 0.1 | 2 | 1 |
| CSF2RA | 0.2 | 0.1 | 83 | 64 | 0.3 | 0.6 | 0.2 | 0.7 | 14 | 6 |
| CSF2RB | 69 | 50 | 440 | 389 | 2 | 4 | 0.7 | 0.1 | 512 | 347 |
| CSF3R | 2 | 1 | 2682 | 2117 | 2 | 0.4 | 2 | 3 | 2 | 0.3 |
| TNFRSF13B | 93 | 55 | 0 | 0 | 0 | 0 | 0.3 | 0.1 | 0 | 0 |
| TNFRSF13C | 478 | 308 | 4 | 0.7 | 7 | 3 | 8 | 6 | 0 | 0 |
| TNFRSF9 | 0.1 | 0 | 0.3 | 2 | 2 | 1 | 2 | 2 | 159 | 351 |
| TNFRSF21 | 1 | 3 | 0 | 0.5 | 0 | 0.4 | 0.1 | 0.1 | 292 | 226 |
| LTBR | 0.2 | 0.1 | 198 | 146 | 1 | 0.2 | 1 | 1 | 74 | 65 |
| TGFBR3 | 0.2 | 0 | 0.4 | 0 | 88 | 50 | 182 | 129 | 22 | 29 |
| ACVR1B | 4 | 3 | 21 | 13 | 7 | 5 | 6 | 4 | 28 | 62 |
| CXCR4 | 662 | 876 | 9 | 4 | 901 | 483 | 1185 | 176 | 43 | 10 |
| CXCR5 | 136 | 126 | 0 | 0.1 | 15 | 16 | 2 | 0.2 | 0.3 | 0 |
| CCR2 | 0.6 | 0.9 | 4 | 2 | 4 | 3 | 1 | 2 | 0 | 0 |
| CCR5 | 0 | 0 | 0 | 0 | 3 | 0.6 | 3 | 1 | 0.3 | 0.3 |
| CCR6 | 0.5 | 1 | 0 | 0 | 42 | 18 | 12 | 3 | 0 | 0.1 |
| CCR7 | 83 | 52 | 0 | 0 | 124 | 129 | 145 | 286 | 6 | 8 |
| CRLF2 | 0 | 0 | 0.4 | 0.5 | 0.8 | 1 | 1 | 0 | 194 | 427 |
| NFAM1 | 0.1 | 0.2 | 700 | 705 | 0.3 | 0.2 | 0.5 | 0.6 | 14 | 5 |
| PTAFR | 0.2 | 0.3 | 6 | 10 | 0.1 | 0 | 0.2 | 0 | 53 | 25 |
Table 20.
Other receptors.
| Gene | B-cell | B-cell | Monocyte | Monocyte | CD4+ T-cell |
CD4+ T-cell |
CD8+ T-cell |
CD8+ T-cell |
MC | MC |
|---|---|---|---|---|---|---|---|---|---|---|
| P2RX5(ATP) | 1081 | 658 | 11 | 8 | 13 | 15 | 15 | 18 | 0.8 | 0.2 |
| ADIPOR2 | 3 | 7 | 3 | 4 | 4 | 4 | 8 | 9 | 48 | 101 |
| ESRRA | 16 | 11 | 450 | 224 | 9 | 6 | 12 | 18 | 9 | 12 |
| ADRB2 | 16 | 16 | 23 | 24 | 36 | 27 | 73 | 205 | 561 | 590 |
| CNR2 | 39 | 60 | 0.1 | 0 | 0 | 0 | 3 | 2 | 0 | 0 |
| CNRIP1 | 0 | 0 | 0 | 0 | 0 | 0 | 0 | 0 | 113 | 74 |
| RXRA | 14 | 7 | 1420 | 1336 | 14 | 11 | 13 | 11 | 181 | 109 |
| NRP2 | 2 | 0.6 | 2 | 3 | 0.1 | 0 | 0.1 | 0 | 87 | 132 |
| LRPAP1 | 85 | 58 | 813 | 1307 | 95 | 94 | 91 | 48 | 56 | 59 |
| GPR18 | 79 | 87 | 0.1 | 0.3 | 36 | 23 | 48 | 32 | 0 | 0 |
| GPR56 | 0 | 0 | 0.6 | 0.1 | 3 | 0.9 | 189 | 162 | 32 | 2 |
| GPR141 | 0 | 0 | 5 | 3 | 0 | 0 | 10 | 2 | 80 | 79 |
| GPR174 | 76 | 111 | 0.3 | 0 | 148 | 151 | 156 | 105 | 0.4 | 0.1 |
| NPTXR | 0.2 | 0.1 | 0 | 0 | 14 | 12 | 12 | 45 | 6 | 9 |
| MAS1L | 0 | 0 | 0 | 0 | 0 | 0 | 0.2 | 0 | 119 | 26 |
| LRP4 | 0 | 0 | 0.1 | 0 | 0 | 0 | 0 | 0 | 148 | 131 |
| HRH2 | 0 | 0 | 5 | 4 | 0.1 | 0 | 0 | 0.4 | 0.1 | 0 |
| HRH4 | 0 | 0 | 0 | 0 | 0.6 | 0.4 | 0 | 0 | 27 | 7 |
| EDNRB | 0 | 0 | 0 | 0.1 | 0 | 0 | 0 | 0 | 101 | 63 |
| DRD2 | 0 | 0 | 0 | 0 | 0 | 0 | 0 | 0 | 35 | 19 |
| DRD5 | 0 | 0 | 33 | 18 | 0.1 | 0 | 0.1 | 0 | 0 | 0 |
| AMHR2 | 0 | 0 | 0 | 0 | 0.1 | 0 | 0 | 0 | 59 | 26 |
| ADORA3 | 0 | 0 | 0.5 | 0.3 | 0 | 0 | 0 | 0 | 16 | 3 |
| STAB1 | 0 | 0.1 | 159 | 192 | 0.2 | 0 | 0.3 | 0.2 | 22 | 14 |
| GPBAR1 | 0.1 | 0 | 16 | 19 | 0.1 | 0.1 | 0.3 | 0.1 | 0 | 0 |
| PTGIR | 1 | 0.5 | 36 | 55 | 0.9 | 4 | 0.1 | 0.4 | 1 | 2 |
| LDLR | 1 | 1 | 279 | 78 | 32 | 22 | 42 | 24 | 263 | 535 |
| LRP1 | 1 | 1 | 424 | 841 | 4 | 7 | 6 | 2 | 59 | 1 |
| APOBR | 1 | 2 | 186 | 171 | 37 | 17 | 42 | 27 | 25 | 9 |
| VDR | 2 | 0.1 | 222 | 128 | 1 | 0.9 | 0.6 | 2 | 10 | 22 |
| FZD1 | 0.4 | 0.9 | 15 | 14 | 0 | 0 | 0.2 | 0 | 28 | 24 |
| FZD5 | 1 | 0.5 | 10 | 14 | 0.1 | 0 | 0.4 | 3 | 46 | 30 |
| SCARF1 | 0.4 | 0.2 | 42 | 27 | 0.1 | 0.6 | 0.4 | 1 | 22 | 21 |
| TSPAN4 | 4 | 0.8 | 15 | 19 | 2 | 0.5 | 3 | 2 | 86 | 69 |
| MCOLN1 | 10 | 8 | 227 | 133 | 10 | 11 | 8 | 11 | 46 | 32 |
| PLXNB2 | 11 | 2 | 898 | 473 | 0.8 | 2 | 2 | 12 | 34 | 45 |
| TRPM2 | 12 | 7 | 324 | 243 | 0.3 | 0.9 | 1 | 4 | 4 | 3 |
Table 21.
Calcium, sodium, chloride and potassium channels-transporters and regulators.
| Gene | B-cell | B-cell | Monocyte | Monocyte | CD4+ T-cell |
CD4+ T-cell |
CD8+ T-cell |
CD8+ T-cell |
MC | MC |
|---|---|---|---|---|---|---|---|---|---|---|
| CACNA2D1 | 0 | 0 | 0 | 0 | 0 | 0 | 0 | 0 | 35 | 43 |
| CACNA2D2 | 0.4 | 1 | 0.1 | 0 | 6 | 2 | 25 | 46 | 84 | 59 |
| KCTD12 | 2 | 1 | 155 | 269 | 3 | 4 | 2 | 3 | 55 | 7 |
| KCNA3 | 71 | 95 | 3 | 2 | 263 | 251 | 238 | 107 | 0.9 | 3 |
| KCNH8 | 71 | 47 | 0.4 | 0.1 | 0.2 | 0 | 0 | 0 | 0.8 | 0.3 |
| ATP1B1 | 3 | 9 | 4 | 2 | 8 | 7 | 3 | 3 | 204 | 187 |
| TTYH3 | 15 | 13 | 886 | 511 | 5 | 3 | 7 | 4 | 32 | 69 |
| FXYD6 | 0.5 | 0.1 | 60 | 127 | 0.1 | 0 | 0.5 | 0 | 10 | 1 |
Table 22.
Angiogenesis inhibitors and promoters.
| Gene | B-cell | B-cell | Monocyte | Monocyte | CD4+ T-cell |
CD4+ T-cell |
CD8+ T-cell |
CD8+ T-cell |
MC | MC |
|---|---|---|---|---|---|---|---|---|---|---|
| VASH1 | 0.5 | 0.7 | 47 | 31 | 3 | 4 | 6 | 7 | 6 | 0.5 |
| ENG | 4 | 5 | 39 | 18 | 5 | 6 | 8 | 12 | 113 | 178 |
Table 23.
Sialic acid-binding Ig-like lectins (siglecs).
| Gene | B-cell | B-cell | Monocyte | Monocyte | CD4+ T-cell |
CD4+ T-cell |
CD8+ T-cell |
CD8+ T-cell |
MC | MC |
|---|---|---|---|---|---|---|---|---|---|---|
| SIGLEC1 | 0 | 0 | 0.4 | 0.3 | 0 | 0 | 0 | 0 | 0 | 0 |
| CD22 (Siglec-2) | 737 | 655 | 3 | 0.4 | 0.2 | 0 | 1 | 0 | 146 | 110 |
| CD33 (Siglec-3) | 0.7 | 0 | 83 | 38 | 0.8 | 0 | 1 | 0 | 42 | 28 |
| MAG (Siglec-4) | 0.8 | 0.3 | 0.9 | 0.6 | 0 | 0.1 | 0 | 0.2 | 7 | 3 |
| SIGLEC5 | 7 | 3 | 47 | 58 | 0 | 0 | 0.1 | 0.4 | 16 | 10 |
| SIGLEC6 | 16 | 14 | 0.1 | 0.1 | 0 | 0.1 | 0 | 0 | 484 | 289 |
| SIGLEC7 | 0 | 0 | 15 | 32 | 0.1 | 0 | 3 | 0.7 | 6 | 5 |
| SIGLEC8 | 0 | 0 | 0 | 0 | 0 | 0 | 0 | 0 | 129 | 33 |
| SIGLEC9 | 0 | 0 | 70 | 70 | 1 | 0.2 | 4 | 1 | 19 | 25 |
| SIGLEC10 | 42 | 18 | 90 | 140 | 0.8 | 0 | 0.7 | 2 | 2 | 1 |
| SIGLEC11 | 39 | 20 | 96 | 131 | 0.2 | 0 | 0.2 | 2 | 2 | 0.5 |
| SIGLEC12 | 0.1 | 0.6 | 3 | 0.6 | 0 | 0 | 0 | 0 | 2 | 2 |
| SIGLEC14 | 24 | 27 | 34 | 34 | 0.3 | 0.2 | 0.6 | 0.7 | 12 | 10 |
| SIGLEC15 | 0 | 0 | 0 | 0 | 0 | 0 | 0 | 0 | 0 | 0 |
| SIGLEC16 | 0.5 | 2 | 4 | 4 | 1 | 0.7 | 2 | 0.5 | 0.8 | 0.8 |
Table 24.
S100 proteins.
| Gene | B-cell | B-cell | Monocyte | Monocyte | CD4+ T-cell |
CD4+ T-cell |
CD8+ T-cell |
CD8+ T-cell |
MC | MC |
|---|---|---|---|---|---|---|---|---|---|---|
| S100A4 | 49 | 38 | 575 | 1189 | 623 | 430 | 385 | 147 | 357 | 227 |
| S100A6 | 40 | 45 | 251 | 535 | 210 | 151 | 168 | 91 | 233 | 200 |
| S100A8 | 2 | 1 | 807 | 1134 | 3 | 1 | 8 | 4 | 0 | 0.4 |
| S100A9 | 2 | 3 | 1959 | 3562 | 5 | 3 | 9 | 3 | 0 | 0 |
| S100A10 | 28 | 41 | 1867 | 212 | 319 | 234 | 250 | 117 | 102 | 248 |
| S100Z | 0.2 | 0.2 | 32 | 40 | 2 | 1 | 0.1 | 0.5 | 0.1 | 0 |
| S100A11 | 4 | 3 | 74 | 94 | 48 | 20 | 30 | 4 | 322 | 749 |
| S100A12 | 0.5 | 0.7 | 266 | 255 | 0.4 | 0.1 | 2 | 0.5 | 0.1 | 0 |
Table 25.
Cell adhesion and other membrane proteins.
| Gene | B-cell | B-cell | Monocyte | Monocyte | CD4+T-cell | CD4+T-cell | CD8+T-cell | CD8+T-cell | MC | MC |
|---|---|---|---|---|---|---|---|---|---|---|
| ITGB1 | 104 | 104 | 107 | 98 | 331 | 203 | 270 | 82 | 177 | 244 |
| ITGB2 | 137 | 120 | 1079 | 1024 | 409 | 349 | 566 | 996 | 10 | 7 |
| ITGB3 | 0.2 | 2 | 6 | 2 | 0 | 0.4 | 0.1 | 1 | 23 | 34 |
| ITGB4 | 0.6 | 0 | 0.1 | 0.3 | 0.2 | 0.5 | 0 | 0.1 | 4 | 5 |
| ITGB5 | 0 | 0 | 0 | 0.1 | 0.2 | 0 | 0.2 | 0 | 0.2 | 0.1 |
| ITGB6 | 0 | 0 | 0 | 0 | 0 | 0 | 0 | 0 | 0 | 0 |
| ITGB7 | 16 | 22 | 3 | 2 | 71 | 56 | 64 | 16 | 0.3 | 1 |
| ITGB8 | 0.1 | 0 | 0 | 0 | 0.4 | 0 | 0 | 0 | 0.5 | 0.3 |
| ITGA1 | 0 | 0 | 0 | 0.6 | 9 | 5 | 18 | 4 | 1 | 2 |
| ITGA2 | 0 | 0 | 0 | 0.1 | 0.7 | 0.2 | 0 | 0 | 0.1 | 0 |
| ITGA3 | 3 | 5 | 0 | 0.2 | 5 | 5 | 4 | 6 | 98 | 75 |
| ITGA4 | 257 | 231 | 115 | 71 | 195 | 222 | 246 | 225 | 53 | 25 |
| ITGA5 | 3 | 3 | 447 | 163 | 33 | 47 | 36 | 65 | 162 | 358 |
| ITGA6 | 0 | 0 | 0.1 | 0.5 | 106 | 135 | 91 | 31 | 29 | 33 |
| ITGA7 | 0.5 | 0.2 | 0.9 | 1 | 0.4 | 0.1 | 0.3 | 0.1 | 0.2 | 0.1 |
| ITGA8 | 0 | 0 | 0 | 0 | 0 | 0 | 0 | 0 | 0.2 | 0.1 |
| ITGA9 | 0.2 | 0.1 | 0.5 | 0.5 | 0 | 0.2 | 0 | 0.2 | 148 | 127 |
| ITGAL | 95 | 83 | 358 | 282 | 258 | 320 | 500 | 614 | 2 | 0.4 |
| ITGAM | 29 | 20 | 387 | 292 | 5 | 3 | 41 | 21 | 146 | 108 |
| ITGAV | 1 | 0.5 | 5 | 5 | 2 | 2 | 4 | 1 | 29 | 148 |
| ITGAX | 5 | 1 | 84 | 142 | 1 | 0.2 | 4 | 5 | 86 | 231 |
| ICAM1 | 1 | 1 | 2 | 13 | 4 | 0.7 | 2 | 0.9 | 17 | 15 |
| ICAM2 | 34 | 44 | 20 | 13 | 82 | 74 | 66 | 69 | 22 | 20 |
| ICAM3 | 42 | 69 | 91 | 278 | 141 | 134 | 87 | 47 | 0.8 | 0.5 |
| ICAM4 | 0.1 | 0.1 | 2 | 2 | 0.3 | 0 | 0.4 | 0 | 4 | 5 |
| ICAM5 | 0 | 0 | 4 | 3 | 0 | 0 | 0.1 | 0.4 | 8 | 5 |
| PXN | 3 | 4 | 73 | 43 | 235 | 164 | 243 | 406 | 180 | 127 |
| SELP | 2 | 3 | 0.9 | 0.4 | 1 | 3 | 1 | 1 | 2 | 3 |
| SELPLG | 4 | 2 | 80 | 109 | 192 | 130 | 155 | 87 | 60 | 21 |
| CELSR1 | 129 | 63 | 0.4 | 0.3 | 1 | 0.6 | 0.9 | 2 | 7 | 7 |
| FAT1 | 0.1 | 0.5 | 0 | 0 | 0 | 0.1 | 0 | 0 | 34 | 36 |
| EMP1 | 0.4 | 0.2 | 15 | 7 | 1 | 0.5 | 1 | 2 | 333 | 517 |
| TJP2 | 2 | 0.7 | 13 | 9 | 5 | 4 | 2 | 2 | 60 | 110 |
| MAL | 0.2 | 2 | 0 | 0 | 320 | 398 | 179 | 488 | 6 | 14 |
| GPNMB | 0 | 0 | 1 | 1 | 0 | 0 | 0 | 0 | 543 | 467 |
| TMEM176B | 0.2 | 1 | 149 | 1605 | 0 | 0.2 | 0.2 | 2 | 30 | 36 |
| AMICA1 | 0.1 | 0 | 85 | 188 | 2 | 2 | 3 | 2 | 0 | 0.3 |
| SIDT1 | 41 | 31 | 1 | 0.1 | 29 | 31 | 50 | 39 | 0.5 | 0.7 |
| AQP3 | 5 | 6 | 0.6 | 0.1 | 268 | 242 | 170 | 393 | 8 | 29 |
| ITM2A | 9 | 28 | 0.1 | 0.3 | 148 | 290 | 94 | 104 | 93 | 135 |
Table 26.
Cell signaling proteins.
| Gene |
B-cell | B-cell | Monocyte | Monocyte | CD4+ T-cell |
CD4+ T-cell |
CD8+ T-cell |
CD8+ T-cell |
MC | MC |
|---|---|---|---|---|---|---|---|---|---|---|
| TYROBP | 3 | 4 | 1164 | 1169 | 10 | 11 | 170 | 103 | 735 | 543 |
| LYN | 504 | 428 | 125 | 93 | 3 | 2 | 22 | 7 | 84 | 68 |
| SYK | 305 | 215 | 315 | 197 | 2 | 0.5 | 2 | 0.5 | 35 | 16 |
| BTK | 38 | 44 | 11 | 8 | 0 | 0.1 | 0.4 | 0 | 155 | 66 |
| BLK | 41 | 58 | 0.4 | 0.3 | 0.7 | 1 | 2 | 0.7 | 0 | 0 |
| BLNK | 250 | 291 | 22 | 31 | 38 | 26 | 37 | 13 | 81 | 67 |
| LCK | 0.2 | 0.2 | 0 | 0 | 8 | 10 | 12 | 15 | 0 | 0 |
| THEMIS | 0 | 0 | 0 | 0 | 40 | 45 | 72 | 29 | 0 | 0 |
| LIME1 | 18 | 20 | 6 | 4 | 231 | 272 | 198 | 300 | 2 | 4 |
| ZAP70 | 3 | 1 | 0.5 | 0.4 | 140 | 185 | 191 | 314 | 0 | 0.7 |
| LCP2 | 3 | 6 | 68 | 48 | 259 | 283 | 249 | 114 | 427 | 252 |
| LAT | 7 | 3 | 108 | 125 | 237 | 328 | 251 | 615 | 290 | 352 |
| JAK3 | 72 | 67 | 30 | 44 | 148 | 183 | 99 | 149 | 3 | 2 |
| MATK | 4 | 4 | 3 | 0.9 | 23 | 24 | 101 | 162 | 10 | 3 |
| FYB | 4 | 2 | 427 | 191 | 1068 | 1287 | 960 | 1136 | 2 | 1 |
| RAB3D | 10 | 12 | 303 | 363 | 6 | 11 | 8 | 10 | 64 | 22 |
| RAB34 | 5 | 5 | 165 | 206 | 1 | 5 | 3 | 2 | 60 | 54 |
| HCST | 9 | 10 | 72 | 81 | 183 | 136 | 332 | 263 | 38 | 17 |
| HCK | 58 | 36 | 254 | 177 | 0.6 | 0.2 | 2 | 2 | 2 | 0.1 |
| RASGEF1B | 125 | 75 | 8 | 2 | 7 | 5 | 12 | 29 | 434 | 645 |
| RASGRP4 | 0.4 | 0.2 | 54 | 43 | 0.7 | 0.6 | 0.5 | 0.1 | 118 | 48 |
| FGD2 | 93 | 117 | 108 | 168 | 1 | 0.2 | 0.4 | 0.2 | 0.9 | 0 |
| PRAM1 | 0.8 | 0.4 | 708 | 501 | 2 | 1 | 2 | 0.7 | 0.4 | 2 |
| GCSAML | 0.1 | 0.1 | 0.3 | 0.2 | 0.2 | 0.1 | 0 | 0 | 468 | 663 |
| RHOU | 0 | 0.1 | 200 | 141 | 3 | 2 | 3 | 1 | 13 | 13 |
| RALGPS2 | 148 | 223 | 0.6 | 0.2 | 5 | 5 | 6 | 0.6 | 3 | 3 |
| ICOSLG | 533 | 372 | 216 | 160 | 13 | 7 | 9 | 12 | 26 | 32 |
| TBC1D8 | 7 | 1 | 333 | 165 | 0.4 | 1 | 0.6 | 0.9 | 7 | 18 |
| TBC1D9 | 464 | 283 | 75 | 78 | 1 | 0.4 | 1 | 0.1 | 16 | 27 |
| BANK1 | 332 | 516 | 1 | 0.6 | 0.4 | 0 | 0.7 | 0.1 | 0 | 0.1 |
| TCL1A | 182 | 342 | 0.1 | 0.1 | 0.2 | 0 | 0.6 | 0 | 0 | 0.1 |
| PLEKHG1 | 172 | 120 | 0.3 | 0 | 2 | 4 | 1 | 2 | 11 | 14 |
| PLCG2 | 767 | 461 | 682 | 591 | 1 | 0.1 | 20 | 8 | 192 | 89 |
| RHOH | 574 | 642 | 0.9 | 0.3 | 297 | 388 | 325 | 531 | 351 | 166 |
| TPD52 | 112 | 153 | 0.6 | 0.3 | 39 | 29 | 33 | 8 | 3 | 2 |
| PDE3B | 3 | 3 | 4 | 0.3 | 87 | 96 | 155 | 173 | 0.5 | 0.3 |
| PDE4D | 98 | 78 | 5 | 3 | 0.8 | 4 | 1 | 2 | 12 | 30 |
| SNX22 | 82 | 210 | 0 | 0.3 | 0 | 0 | 0.2 | 0 | 0.4 | 0.6 |
| RIN1 | 0.2 | 0.2 | 27 | 22 | 2 | 3 | 4 | 3 | 30 | 92 |
| RIN2 | 1 | 0.4 | 132 | 132 | 0.1 | 0.2 | 0.3 | 0.2 | 54 | 45 |
| ITK | 0.1 | 0 | 0 | 0.1 | 208 | 241 | 203 | 193 | 78 | 395 |
| YES1 | 0.2 | 0.2 | 0.3 | 0.1 | 27 | 36 | 71 | 44 | 84 | 107 |
| GNAI1 | 0 | 0 | 0 | 0.1 | 1 | 0.1 | 0.3 | 0 | 98 | 28 |
| GNAQ | 0.4 | 0.7 | 154 | 125 | 80 | 118 | 57 | 29 | 127 | 108 |
| PPM1H | 0 | 0 | 1 | 4 | 0 | 0 | 0.1 | 0 | 118 | 37 |
| CALB2 | 0 | 0 | 0 | 0 | 0 | 0 | 0 | 0 | 98 | 295 |
| PDE3A | 0 | 0 | 0.1 | 0 | 0 | 0 | 0.1 | 0 | 44 | 17 |
| PDE4B | 826 | 508 | 43 | 31 | 201 | 122 | 179 | 125 | 7 | 10 |
| TIE1 | 0 | 0 | 0 | 0.1 | 0 | 0 | 0.2 | 0.4 | 27 | 28 |
| RUSC2 | 0 | 0.2 | 45 | 26 | 0.6 | 0.4 | 0.2 | 0.2 | 40 | 48 |
| RAB32 | 0 | 0 | 22 | 11 | 0 | 0 | 0.5 | 0 | 40 | 38 |
| RGS13 | 0.2 | 0.1 | 0.3 | 0 | 0.2 | 0 | 0 | 0 | 281 | 181 |
| NEDD9 | 0 | 0.4 | 0.8 | 5 | 8 | 7 | 6 | 2 | 158 | 167 |
| RAB27B | 0.1 | 0.2 | 2 | 1 | 2 | 2 | 3 | 0.4 | 277 | 87 |
| RAB40C | 11 | 10 | 125 | 129 | 10 | 10 | 7 | 11 | 12 | 11 |
| PREX1 | 40 | 40 | 65 | 128 | 108 | 55 | 101 | 12 | 13 | 6 |
| GMPR | 0 | 0.3 | 10 | 3 | 0.3 | 0.5 | 0.5 | 0.7 | 88 | 52 |
| ARHGAP18 | 7 | 5 | 10 | 10 | 5 | 7 | 9 | 7 | 299 | 345 |
| ARHGAP22 | 5 | 4 | 73 | 51 | 0 | 0 | 0 | 0 | 0.1 | 0.4 |
| ARHGEF10L | 6 | 3 | 376 | 247 | 0.5 | 0 | 0.6 | 0.2 | 14 | 1 |
| ARHGEF40 | 0 | 0.1 | 33 | 36 | 0.2 | 0 | 0.9 | 0 | 104 | 91 |
| PIK3R3 | 0 | 0 | 0 | 0 | 0.6 | 0.6 | 3 | 0.9 | 43 | 40 |
| EVPL | 0 | 0 | 0 | 0 | 0.3 | 0.1 | 3 | 4 | 327 | 168 |
| GIMAP7 | 0 | 0 | 4 | 13 | 52 | 83 | 77 | 11 | 12 | 6 |
| AGAP1 | 0.1 | 0 | 0 | 0 | 9 | 7 | 15 | 22 | 226 | 200 |
| ITK | 0.1 | 0 | 0 | 0.1 | 208 | 241 | 203 | 193 | 78 | 395 |
| DAPK1 | 0.5 | 0.4 | 113 | 64 | 0.2 | 0.5 | 0.4 | 0.9 | 75 | 121 |
| RILP | 0.5 | 0.7 | 119 | 116 | 0.9 | 1 | 0.5 | 0.4 | 12 | 8 |
| SIRPB1 | 0.4 | 0.7 | 76 | 76 | 2 | 3 | 2 | 3 | 0 | 0 |
| TIAM1 | 0.8 | 0.2 | 149 | 183 | 19 | 18 | 10 | 13 | 123 | 98 |
| FHL3 | 1 | 2 | 85 | 36 | 3 | 3 | 10 | 45 | 42 | 41 |
| LMTK3 | 1 | 1 | 0 | 0 | 18 | 19 | 24 | 47 | 0 | 0.1 |
| CASS4 | 0.8 | 0.1 | 2 | 3 | 60 | 53 | 59 | 58 | 19 | 4 |
| JDP2 | 2 | 1 | 121 | 116 | 0.2 | 0.2 | 0.1 | 0 | 6 | 5 |
| NDRG2 | 2 | 2 | 3 | 0.4 | 15 | 12 | 14 | 22 | 191 | 158 |
| FSCN1 | 2 | 1 | 10 | 8 | 3 | 4 | 5 | 7 | 211 | 230 |
| PLCB3 | 3 | 3 | 355 | 117 | 3 | 3 | 2 | 8 | 21 | 24 |
| DUSP3 | 11 | 6 | 59 | 40 | 7 | 9 | 6 | 22 | 132 | 143 |
| DUSP4 | 6 | 2 | 0 | 0 | 32 | 18 | 13 | 21 | 146 | 488 |
| DUSP6 | 24 | 17 | 28 | 33 | 3 | 5 | 4 | 6 | 728 | 951 |
| DUSP7 | 8 | 7 | 310 | 296 | 40 | 49 | 39 | 79 | 254 | 137 |
| DUSP14 | 4 | 3 | 0.3 | 0.2 | 17 | 13 | 16 | 16 | 130 | 433 |
| DUSP23 | 6 | 9 | 190 | 287 | 17 | 20 | 29 | 47 | 52 | 36 |
| TBC1D9 | 464 | 283 | 75 | 78 | 1 | 0.4 | 0.9 | 0.1 | 16 | 27 |
| TNIK | 4 | 3 | 3 | 0.5 | 54 | 100 | 65 | 85 | 261 | 278 |
| AIF1 | 5 | 5 | 1515 | 1965 | 33 | 67 | 97 | 131 | 6 | 3 |
| NREP | 7 | 7 | 13 | 13 | 0.7 | 2 | 2 | 2 | 60 | 45 |
| LPPR2 | 8 | 5 | 146 | 173 | 4 | 5 | 6 | 3 | 20 | 18 |
| LRRK2 | 68 | 40 | 57 | 89 | 0.2 | 0 | 0.3 | 0.2 | 2 | 2 |
| SDCBP | 8 | 12 | 5 | 15 | 122 | 40 | 81 | 12 | 278 | 240 |
| FGD6 | 11 | 14 | 222 | 157 | 0.4 | 1 | 0.4 | 1 | 10 | 11 |
| ALS2 | 12 | 9 | 10 | 13 | 4 | 8 | 9 | 8 | 145 | 80 |
| ADAP1 | 13 | 4 | 322 | 148 | 11 | 6 | 34 | 19 | 27 | 32 |
| SIT1 | 13 | 16 | 0 | 0 | 39 | 31 | 39 | 85 | 0 | 0 |
| PITPNC1 | 13 | 20 | 15 | 9 | 159 | 153 | 207 | 205 | 30 | 38 |
| PSTPIP1 | 34 | 23 | 802 | 496 | 42 | 41 | 39 | 52 | 0.3 | 0.2 |
| PPM1F | 13 | 20 | 390 | 263 | 19 | 19 | 19 | 43 | 16 | 16 |
| ARAP1 | 18 | 19 | 298 | 805 | 19 | 17 | 13 | 2 | 55 | 81 |
| DGKG | 29 | 9 | 107 | 89 | 0 | 0.1 | 0.1 | 0 | 5 | 7 |
| CYFIP1 | 13 | 7 | 598 | 490 | 8 | 10 | 3 | 6 | 89 | 87 |
| PLEK | 26 | 14 | 545 | 543 | 3 | 1 | 33 | 8 | 14 | 7 |
| ABI3 | 20 | 14 | 351 | 188 | 10 | 12 | 40 | 49 | 7 | 6 |
| ARAP1 | 18 | 19 | 298 | 805 | 19 | 17 | 13 | 2 | 55 | 81 |
| RASA4 | 17 | 5 | 369 | 161 | 3 | 5 | 2 | 7 | 23 | 39 |
| CAMK4 | 17 | 7 | 0.5 | 0.3 | 377 | 575 | 294 | 144 | 0.3 | 0.9 |
| DOK2 | 14 | 11 | 1558 | 1532 | 140 | 172 | 123 | 134 | 60 | 53 |
Table 27.
Apoptosis-related molecules and chaperons.
| B-cell | B-cell | Monocyte | Monocyte | CD4+ T-cell |
CD4+ T-cell |
CD8+ T-cell |
CD8+ T-cell |
MC | MC | |
|---|---|---|---|---|---|---|---|---|---|---|
| FAIM2 | 0 | 0 | 0 | 0 | 0.2 | 0 | 0.1 | 0 | 50 | 48 |
| BCL2 | 304 | 218 | 1 | 3 | 332 | 306 | 251 | 432 | 75 | 66 |
| MCL1 | 232 | 259 | 154 | 306 | 564 | 473 | 504 | 225 | 2704 | 3365 |
| CARD11 | 293 | 232 | 2 | 0.4 | 239 | 198 | 239 | 220 | 0.9 | 0.5 |
| CLU | 0.2 | 1 | 16 | 4 | 9 | 3 | 9 | 6 | 958 | 799 |
Table 28.
Matrix proteins.
| B-cell | B-cell | Monocyte | Monocyte | CD4+ T-cell |
CD4+ T-cell |
CD8+ T-cell |
CD8+ T-cell |
MC | MC | |
|---|---|---|---|---|---|---|---|---|---|---|
| COL4A3 | 54 | 31 | 0.1 | 0 | 0 | 0 | 0.3 | 0 | 0.3 | 0.1 |
| COL19A1 | 447 | 403 | 2 | 0.7 | 0 | 0 | 0.3 | 0 | 0.1 | 0.5 |
| COL6A2 | 1 | 0.2 | 0.1 | 0 | 39 | 23 | 119 | 190 | 242 | 15 |
| COL13A1 | 0 | 0 | 0 | 0 | 0 | 0 | 0.4 | 0.6 | 72 | 34 |
| FERMT2 | 0 | 0 | 0 | 0 | 0.8 | 0.9 | 0.5 | 0 | 92 | 103 |
| EMILIN2 | 39 | 6 | 317 | 117 | 0.9 | 0.5 | 0.6 | 1 | 700 | 750 |
| LAMA5 | 37 | 27 | 1 | 0 | 0 | 0 | 0 | 0 | 49 | 70 |
Table 29.
Solute carriers.
| Gene | B-cell | B-cell | Monocyte | Monocyte | CD4+ T-cell |
CD4+ T-cell |
CD8+ T-cell |
CD8+ T-cell |
MC | MC |
|---|---|---|---|---|---|---|---|---|---|---|
| SLC1A5 | 3 | 5 | 32 | 42 | 4 | 6 | 5 | 13 | 344 | 376 |
| SLC2A9 | 0.2 | 0.3 | 51 | 118 | 0 | 0.4 | 0.6 | 0.4 | 0.7 | 0.8 |
| SLC6A8 | 0.5 | 0.1 | 1 | 0.2 | 0.7 | 0.1 | 0.3 | 0.1 | 30 | 72 |
| SLC7A7 | 32 | 21 | 102 | 95 | 2 | 0.2 | 1 | 1 | 2 | 2 |
| SLC8A3 | 0.1 | 0.1 | 0 | 0 | 0 | 0 | 0 | 0 | 47 | 10 |
| SLC9A1 | 17 | 12 | 24 | 16 | 15 | 16 | 17 | 36 | 210 | 150 |
| SLC9A7 | 258 | 244 | 16 | 8 | 6 | 9 | 5 | 6 | 0.8 | 0.5 |
| SLC9A9 | 19 | 24 | 6 | 3 | 27 | 35 | 23 | 8 | 4 | 5 |
| SLC12A4 | 5 | 4 | 151 | 185 | 4 | 4 | 6 | 3 | 14 | 15 |
| SLC15A3 | 22 | 23 | 154 | 173 | 1 | 1 | 3 | 2 | 6 | 6 |
| SLC16A3 | 4 | 3 | 24 | 19 | 6 | 5 | 5 | 10 | 52 | 181 |
| SLC18A2 | 0 | 0 | 0.4 | 0 | 0.6 | 0.7 | 1 | 2 | 698 | 702 |
| SLC18B1 | 40 | 47 | 7 | 2 | 11 | 21 | 17 | 16 | 1 | 2 |
| SLC25A44 | 6 | 6 | 11 | 5 | 10 | 8 | 9 | 18 | 467 | 189 |
| SLC29A1 | 1 | 0.8 | 9 | 14 | 1 | 1 | 1 | 0.7 | 102 | 70 |
| SLC30A1 | 9 | 9 | 98 | 78 | 9 | 9 | 20 | 24 | 57 | 50 |
| SLC38A1 | 130 | 74 | 0 | 0.3 | 156 | 123 | 186 | 91 | 4 | 5 |
| SLC39A11 | 6 | 8 | 68 | 260 | 9 | 11 | 9 | 2 | 26 | 7 |
| SLC40A1 | 0 | 0.2 | 6 | 4 | 35 | 33 | 7 | 3 | 68 | 58 |
| SLC43A3 | 6 | 5 | 43 | 46 | 9 | 10 | 14 | 15 | 352 | 387 |
| SLC44A1 | 6 | 10 | 5 | 3 | 15 | 16 | 12 | 13 | 118 | 203 |
Table 30.
Cell cycle and immediate-early response proteins.
| B-cell | B-cell | Monocyte | Monocyte | CD4+ T-cell |
CD4+ T-cell |
CD8+ T-cell |
CD8+ T-cell |
MC | MC | |
|---|---|---|---|---|---|---|---|---|---|---|
| CDK14 | 144 | 113 | 4 | 3 | 0.4 | 0.6 | 0.4 | 0.1 | 2 | 7 |
| G0S2 | 1 | 1 | 850 | 2437 | 2 | 2 | 2 | 2 | 252 | 45 |
| CDK2 | 15 | 17 | 9 | 10 | 8 | 12 | 15 | 8 | 28 | 32 |
| CDK4 | 8 | 10 | 13 | 18 | 9 | 14 | 13 | 27 | 152 | 129 |
| CDK6 | 28 | 44 | 4 | 3 | 41 | 64 | 47 | 54 | 48 | 33 |
| CCNA1 | 0 | 0 | 0 | 0 | 0 | 0 | 0 | 0 | 1 | 4 |
| CCNA2 | 0.4 | 0.2 | 0.3 | 0 | 0.1 | 0.4 | 0.4 | 0.2 | 1 | 0.4 |
| CCND1 | 4 | 2 | 0,3 | 0 | 0 | 0.6 | 0.1 | 0.1 | 131 | 178 |
| CCND2 | 18 | 25 | 57 | 40 | 272 | 245 | 223 | 166 | 108 | 128 |
| CCND3 | 82 | 111 | 163 | 139 | 210 | 293 | 270 | 833 | 137 | 129 |
| CCNE1 | 0.6 | 0.7 | 0.5 | 0.1 | 0.7 | 3 | 2 | 0.5 | 6 | 4 |
| CCNE2 | 0 | 0.2 | 0.1 | 0 | 0.1 | 0 | 1 | 0.1 | 6 | 5 |
| IER3 | 2 | 0.4 | 904 | 510 | 3 | 12 | 5 | 79 | 1186 | 1693 |
| EGR3 | 2 | 3 | 0 | 0.7 | 0.9 | 7 | 0.5 | 43 | 494 | 194 |
Table 31.
Nuclear proteins and splicing factors.
| Gene | B-cell | B-cell | Monocyte | Monocyte | CD4+ T-cell |
CD4+ T-cell |
CD8+ T-cell |
CD8+ T-cell |
MC | MC |
|---|---|---|---|---|---|---|---|---|---|---|
| PHLDA1 | 0 | 0.2 | 2 | 2 | 9 | 11 | 10 | 36 | 154 | 220 |
| AHNAK2 | 0.2 | 0.1 | 0 | 0 | 0 | 0 | 0 | 0 | 139 | 75 |
| SLFN5 | 6 | 3 | 23 | 13 | 143 | 160 | 175 | 192 | 208 | 65 |
| LMNA | 61 | 15 | 840 | 227 | 77 | 56 | 63 | 39 | 4302 | 6983 |
| BCL7A | 43 | 87 | 0.9 | 1 | 2 | 3 | 3 | 2 | 7 | 2 |
| SF3B4 | 3 | 2 | 110 | 102 | 10 | 14 | 16 | 46 | 6 | 11 |
Table 32.
Cytoskeletal and related proteins.
| B-cell | B-cell | Monocyte | Monocyte | CD4+ T-cell |
CD4+ T-cell |
CD8+ T-cell |
CD8+ T-cell |
MC | MC | |
|---|---|---|---|---|---|---|---|---|---|---|
| CTTNBP2 | 0 | 0 | 2 | 0 | 0.1 | 0 | 0 | 0 | 138 | 116 |
| TNS1 | 0.2 | 0 | 34 | 10 | 0 | 0.1 | 0 | 0 | 848 | 683 |
| MYO1F | 36 | 23 | 2491 | 868 | 74 | 49 | 117 | 128 | 34 | 12 |
| MYO10 | 0.2 | 0.1 | 2 | 0.3 | 0 | 0.1 | 0 | 0 | 85 | 110 |
| TPPP3 | 0.3 | 0 | 73 | 48 | 0 | 0.1 | 0.6 | 0 | 95 | 179 |
| LSP1 | 1209 | 1200 | 4812 | 5211 | 808 | 917 | 921 | 1459 | 12 | 12 |
| DBN1 | 1 | 0.6 | 30 | 15 | 3 | 2 | 91 | 120 | 66 | 65 |
| PDLIM7 | 9 | 13 | 216 | 95 | 4 | 5 | 8 | 23 | 124 | 179 |
| TNNI2 | 10 | 7 | 439 | 171 | 0 | 0.2 | 0 | 0.4 | 11 | 4 |
| ADD2 | 30 | 57 | 0.1 | 0.1 | 0.6 | 6 | 3 | 6 | 0.4 | 0.6 |
| TUBB6 | 24 | 23 | 46 | 30 | 0.2 | 0.1 | 0.1 | 0 | 99 | 145 |
| GSN | 15 | 11 | 135 | 180 | 2 | 2 | 5 | 4 | 205 | 198 |
Table 33.
Vesicle and protein transport.
| Gene | B-cell | B-cell | Monocyte | Monocyte | CD4+ T-cell |
CD4+ T-cell |
CD8+ T-cell |
CD8+ T-cell |
MC | MC |
|---|---|---|---|---|---|---|---|---|---|---|
| NSG1 | 0 | 0 | 0 | 0 | 60 | 52 | 113 | 83 | 1 | 1 |
| STX3 | 7 | 4 | 11 | 20 | 2 | 2 | 3 | 0.7 | 149 | 47 |
| DYNLL1 | 15 | 21 | 31 | 14 | 30 | 32 | 34 | 46 | 457 | 756 |
| STX11 | 11 | 10 | 262 | 204 | 31 | 26 | 36 | 35 | 196 | 327 |
| SNX21 | 2 | 0.9 | 90 | 88 | 0.6 | 2 | 0.9 | 1 | 13 | 17 |
| SNX22 | 82 | 210 | 0 | 0.3 | 0 | 0 | 0.2 | 0 | 0.4 | 0.6 |
| VPS37C | 13 | 8 | 177 | 167 | 3 | 5 | 2 | 3 | 29 | 34 |
| AP5B1 | 28 | 36 | 588 | 457 | 15 | 17 | 15 | 31 | 14 | 20 |
| TSPO | 33 | 52 | 955 | 967 | 70 | 93 | 54 | 96 | 69 | 70 |
| EHBP1L1 | 231 | 165 | 5041 | 5040 | 120 | 106 | 107 | 72 | 57 | 69 |
Table 34.
Endogenous retrovirus and oncogenes.
| Gene | B-cell | B-cell | Monocyte | Monocyte | CD4+ T-cell |
CD4+ T-cell |
CD8+ T-cell |
CD8+ T-cell |
MC | MC |
|---|---|---|---|---|---|---|---|---|---|---|
| ERVFRD-1 | 0 | 0 | 0.1 | 0 | 1 | 1 | 0 | 0.1 | 174 | 85 |
| DLC1 | 0 | 0 | 0 | 0.3 | 0 | 0 | 0.3 | 0 | 690 | 419 |
| FES | 4 | 9 | 154 | 171 | 0.3 | 0.2 | 0.5 | 3 | 60 | 56 |
Disclaimer/Publisher’s Note: The statements, opinions and data contained in all publications are solely those of the individual author(s) and contributor(s) and not of MDPI and/or the editor(s). MDPI and/or the editor(s) disclaim responsibility for any injury to people or property resulting from any ideas, methods, instructions or products referred to in the content. |
© 2024 by the authors. Licensee MDPI, Basel, Switzerland. This article is an open access article distributed under the terms and conditions of the Creative Commons Attribution (CC BY) license (http://creativecommons.org/licenses/by/4.0/).
Copyright: This open access article is published under a Creative Commons CC BY 4.0 license, which permit the free download, distribution, and reuse, provided that the author and preprint are cited in any reuse.


