
Submitted:
14 November 2024
Posted:
18 November 2024
You are already at the latest version
Abstract
This study examines the association between managerial ability and audit pricing in the Nigerian banking sector between 2011 and 2022. Using a multi-theoretical framework, audit pricing is regressed on managerial ability using shape-restricted regression splines comprising restricted cubic splines, monotone spline, integrated spline, integrated basis spline, basis spline, natural cubic spline, and integrated natural cubic spline. Managerial ability is proxied using bias-corrected two-stage bootstrapped truncated regression. Consequently, managerial ability is classified into low, intermediate, and high-ability regions. Audit pricing is proxied by audit fees. The results show three knots demarcating the boundaries of four segments, indicating non-linearity. Furthermore, the results reveal that the effect of managerial ability on audit pricing is insignificantly negative in the low-ability region, statistically positive in the intermediate-ability region, and statistically negative in the high-ability region. The study recommends continuous learning and training programmes aimed at improving managers’ abilities.
Keywords:
Managerial ability
; audit pricing
; external auditors
; bias-corrected two-stage truncated regression
; regression splines
; breakpoints
1. Introduction
The pricing of audit engagements is one of the well-researched domains in auditing because of the information content of audit pricing (Hou et al. 2020; Wang et al. 2024). High audit pricing may be interpreted as evidence of quality audit, compensation for specialisation or litigation risk, or as a bribe to allow clients’ aggressive financial reporting (Hay et al. 2006), while low pricing may indicate poor quality, economies of scale arising from specialisation or a low-balling pricing strategy (Cho et al. 2021; Choi et al. 2010; Ferguson et al. 2003). Several empirical studies grounded on the seminal ideology of Simunic (1980) have been conducted on the audit pricing model. The neo-classical economic theory posits that the determinants of audit pricing comprise the characteristics of the audit firm, client, and audit engagements (Ge et al. 2023). The agency theory partially aligns with the neo-classical theory; which though acknowledges the role of managers in making decisions on behalf of the shareholders, argues that managers follow the same objectives, thus ignoring the heterogeneity in individual manager’s preferences, skills, experience, and knowledge (Andreou et al. 2016). However, the upper-echelon (Hambrick and Mason 1984) and the resource-based theories (Barney 1991; Penrose 1996) argue that managers are heterogeneous and resourceful, and their traits enable them to make different corporate decisions (Kabir et al. 2024). In line with these theories, studies have shown that management heterogeneity and idiosyncrasy are invaluable in value creation and form the basis of differences in organisational outcomes and decision-making (Andreou et al. 2017; Bertrand and Schoar 2003; Sewpersadh and Dalwai 2024).
Thus, managerial ability (christened as “high-ability”, “able”, or “effective management” with superior skills, general and industry-specific knowledge, and experience) can achieve high and tangible results for their organisation with minimal costs (Cheng et al. 2020; Cheng and Cheung 2021; Shelih and Wang 2024). The Demerjian et al. (2012) influential model of deriving managerial ability score based on data envelopment analysis (DEA) has outperformed the earlier proxies of managerial ability which focus exclusively on the firm rather than management features (Qin et al. 2024). They adopted a two-step DEA-Tobit regression, wherein in the first step, the firm’s efficiency is determined by analysing input and output variables via the DEA. Meanwhile, in the second step, the efficiency scores derived from the first step are regressed on some firm-specific characteristics using the Tobit regression model. The residual from the second step is labelled the managerial ability score.
In the management science literature, managerial ability has been related to organisational outcomes (Zhang and Wang 2024). For instance, managerial ability is said to influence performance, firm value, accounting and disclosure policies, risk-taking, financial distress, dividend policy, information asymmetry, and financial reporting quality (Andreou et al. 2016; DeJong and Ling 2013; Jiraporn et al. 2016; Leverty and Grace 2012; Yung and Chen 2018; Yung and Nguyen 2020). Furthermore, evidence has shown that managerial ability is relevant to audit pricing. For instance, Duellman et al. (2015, p, 149) posit that “management still wields significant influence over the audit process.” However, studies on the association between managerial ability and audit pricing can be broadly categorised into two strands. The first and most popular strand posits a negative association between managerial ability and audit pricing (Krishnan and Wang 2015; Mitra et al. 2019; Salehi et al. 2020). Thus, “able” managers are assumed to improve earnings quality and curtail audit risks, which invariably reduces audit fees. This view is anchored on the resource-based and upper-echelon theories, which posit that managerial characteristics positively influence organisational values and outcomes (Hambrick 2007). The second strand of the literature shows how some contextual factors moderate the association between managerial ability and audit pricing (e.g., Gul et al. 2018; Li and Luo 2017).
Our study identifies four gaps in the empirical literature. First, prior empirical studies focus on the developed economies except for Salehi et al. (2020) who focus on Iran and no reference to the developing economies in sub-Saharan Africa. Therefore, there is a need to test the results of prior studies in developing economies where different institutional and governance frameworks exist. This position also aligns with the submission of Anggraini and Sholihin (2023, p. 11) that further studies should investigate the “role of managerial ability in international and non-US countries’ settings, since there are not many internationally studied areas yet, and different countries may offer a unique and interesting context to be studied.” We attempt to respond to this call for further studies using the Nigerian banking sector. Thus, we extend the body of knowledge in prior studies (Gul et al. 2018; Krishnan and Wang 2015; Mitra et al. 2019; Salehi et al. 2020) by testing the effect of managerial ability on audit pricing in Nigerian banks. Second, the association between managerial ability and audit pricing may be nonlinear, which may warrant the adoption of a nonlinear model that best represents the underlying structure. This study addresses this concern and probes the association between managerial ability and audit fees using a non-linear regression model.
Third, though some theories (e.g., agency theory, neo-classical economic theory, upper-echelon theory, and resource-based theory) offer invaluable insights into the association between managerial ability and audit pricing, they are inadequate in addressing breakpoints (if any) in the relationship. Therefore, this study applies the threshold, bargaining, and audit demand/supply theories to complement the existing theoretical underpinnings. Threshold theory investigates the association between a response variable and an explanatory variable at different thresholds of the explanatory variable and subsequently estimates separate regressions for these thresholds (Jauk et al. 2013). The bargaining theory places responsibility on the audit firm or client to use its bargaining power to procure favourable terms. The audit demand theory permits the firm management to employ specialist audit firms to secure the confidence of the principal, while the audit supply theory allows the audit firm to determine audit price based on its reputation, litigation risk, and specialised industry-specific knowledge. Fourth, we present some methodological contributions in two specific ways. The first is the use of the DEA-Bias-corrected two-stage bootstrapped truncated regression model of Simar and Wilson (2007) to determine the managerial ability score against the Demerjian et al. (2012) DEA-Tobit Regression model. The second way is the plausibility of breakpoints (the points at which the data are split that signal changes in the data structure) within the managerial ability, which may necessitate using a spline model (Yang et al. 2023). Breakpoints are critical change points that show significant thresholds of an impact that may be overlooked (Lu and Chang 2020). We posit that the association between managerial ability and audit pricing may exhibit one or more breakpoints, thereby making the use of linear regression models to give misleading results. Using a regression spline model to analyse managerial ability would reveal the plausibility of breakpoints that may extend the body of knowledge. Therefore, we propose a regression spline model to achieve the objective. Regression splines comprise a family of methods for estimating variables that change slopes at different points (Edwards and Parry 2018; Marsh and Cormier 2001).
The remainder of the study is outlined: Section 2 explains the literature review and statement of hypotheses. Section 3 addresses the research design. Section 4 presents the regression results, discussion, additional analyses, and contribution to knowledge, while Section 5 presents the conclusion and limitations of the study.
2. Literature Review
2.1. Institutional Context
The Nigerian banking industry is used as a case study. Nigeria is classified as a developing economy in sub-Saharan Africa with prospects for economic growth and development. Crude oil is the mainstay of the economy, though the elected executives are making efforts to diversify the country’s revenue base. Saibu et al. (2009), using the financial service view posit that the bank and market-based views drive the economic development of Nigeria. There are 26 commercial banks (referred to as deposit money banks) comprising 13 publicly-quoted and 13 privately-quoted banks (CBN 2024). Furthermore, seven banks have licenses to operate internationally, 15 are licensed to operate nationally, and four are licensed to operate regionally. The banking industry is heavily regulated by many agencies having regulatory oversight. These agencies are the Central Bank of Nigeria (CBN), the Security and Exchange Commission (SEC), the Nigerian Deposit Insurance Corporation (NDIC), the Nigerian Exchange Group (NGX), and the Financial Reporting Council of Nigeria (FRCN). Despite the regulatory oversight, the industry is bedevilled with many challenges, including accusations by stakeholders of excessive audit fees and poor audit quality by the audit firms (Bakre 2007; Okike 2004; Otunsaya and Lauwo 2010; Otusanya et al. 2013). Incidentally, more than 90 per cent of the audit engagements in the Nigerian banking sector are undertaken by the four big international audit firms (Big4), who pride themselves as industry experts. Though studies on audit fees in the Nigerian banking sector are substantial, their association with managerial ability is scant.
2.2. Conceptualisation of Audit Pricing and Managerial Ability
Audit pricing is the fees to audit firms as compensation for conducting audits, and these fees cover all the costs incurred by the audit firm and a certain percentage as profit (Liu et al. 2024). Audit pricing is determined in conjunction with the professional body's oversight over the auditing firms, and this differs from one economy to another. The seminal contribution of Simunic (1980), which argues that audit pricing reflects risk premium and audit effort and has been a cornerstone in auditing (Costa and Habib 2023). Audit pricing is usually measured as audit fees (Craswell et al. 2002; Hay et al. 2006; Kanapathippillai et al. 2024). Managerial ability is a latent, intangible, unobservable, and multidimensional concept that is subject to several conceptualisations (Ahmad et al. 2024; Curi and Lozano-Vivas 2020; Vo et al. 2021). Managerial ability (also known as managerial talent, managerial skills, managerial capabilities, managerial competencies, and managerial efficiency) refers to the management team's cognitive characteristics (skills, knowledge, and style) (Kabir et al. 2024; Kim and Koo 2024). Cheng and Cheung (2021, pg. 2) define it as “talents, skills, proficiency, or capabilities managers possess to perform their work.” Some of the proxies that have been used to proxy managerial ability in the literature include industry-adjusted returns on assets (ROA), average ROA over some years minus the industry ROA over the same period, chief executive officer (CEO) media citation, CEO characteristics such as ownership, compensation, tenure, experience, and expertise (Ahn et al., 2023; Atawnah et al., 2024; Baik et al., 2012). Some studies (e.g., Chen and Lin 2018; Jang et al. 2024) have criticised these proxies as inappropriate because they accommodate measurement errors and do not reflect variables within the control of management.
However, Demerjian et al. (2012) defines managerial ability as “the CEO or top management team’s ability to efficiently transform corporate resources into revenue, profit or some value relative to its industry peers” and subsequently developed a managerial ability score widely acclaimed as a suitable guide and adopted by studies in the managerial ability domain. Furthermore, they posit that “high-ability managers generate higher revenue for a given level of resources or, conversely, minimise resources for a given level of revenue.” Essentially, a high-ability manager achieves higher efficiency than other managers in the use of resources (Bui et al. 2023; Shan et al. 2024).
Following Demerjian et al. (2012), the analysis of managerial ability involves a two-step process. The first step is determining firm efficiency through data envelopment analysis (a non-parametric methodology). While, the second step involves the determination of the managerial ability score, where the efficiency scores in the first step are regressed on some contextual variables in the second step. The residual from the second step is captured as the managerial ability score, separate from the characteristics of the whole firm.
2.3. Hypotheses Development
The literature on the association between managerial ability and audit fees is scant but growing. In the first strand of literature, the consensus view is a negative association between managerial ability and audit fees, indicating that high-ability managers position their firms to achieve low audit risk, reduce information asymmetry, attract higher earnings, and record high financial reporting quality, thereby reducing audit fees (Gul et al. 2018; Krishna and Wang 2015; Li and Luo 2017; Mitra et al. 2019; Salehi et al. 2020). This result is supported by some theories (e.g., resource-based theory, upper echelon theory), which recognise the heterogeneous nature of management and its ability to negotiate and achieve positive results for the organisation (Desir et al. 2024; Hambrick 2007; Holcomb et al. 2009). The second strand of literature documents a positive association between managerial ability and audit fees (Gul et al. 2018). This position aligns with the audit firm choice theory and reputation management theory, which underscore high-ability managers' motivation to engage reputable specialist auditors' services to demonstrate their competence, accountability, transparency, and performance, which may come with increased audit fees.
However, these studies assume linearity in the association between managerial ability and audit pricing. Literature has shown that the components of audit pricing comprise the forces of demand and supply (Causholli et al. 2010). The supply side is driven by audit firm characteristics, including audit firm industry specialisation, economies of scale, reputation, and risk premium, which influence audit pricing. From the demand side, managers may employ specialist auditors as a signalling indicator of their effectiveness to the owners, and this decision may come with higher audit fees. Therefore, we propose a nonlinear model because the association between managerial ability and audit pricing may not be linear. In a linear regression model, a change in an explanatory variable causes a linear change in the expected value of the response variable. In a nonlinear regression model, the slope may change at certain levels of an explanatory variable. These changes are called switch points (breakpoints or change points) and are often overlooked in empirical studies (Hastie and Tibshirani 1990). Given the idea of the possibility of breakpoints, the study hypothesises as follows:
H1.
Breakpoints exist in the association between managerial ability and audit pricing.
The theoretical underpinnings for the association between managerial ability and audit pricing include agency theory, neo-classical economic theory, resource-based theory, upper echelon theory, and signalling theory (Ahn et al. 2023; Shelih and Wang 2024; Sewpersadh and Dalwai 2024). However, as invaluable as these theories are, they do not offer explanations to support the presence of breakpoints in the explanatory variable. We complement existing theories with threshold, bargaining and audit demand/supply theories. We “borrow” the Threshold theory concept using regression splines to explain the breakpoints in the association between managerial ability and audit pricing. The threshold theory permits an explanatory variable to be split at some breakpoints and estimates separate regressions for each segment (Jauk et al. 2013), which may give a positive or a negative outcome. Regression splines allow the data to speak for itself and provide more flexibility for modelling non-linear effects (Ronkko et al. 2022). We deviate from using a median split to distinguish between high-and-low-ability managers (Chen and Lin 2018; Doukas and Zhang 2020) because of its limitations (MacCallum et al. 2002). Furthermore, adding polynomial terms may not capture switch points (Arin et al. 2022).
Therefore, the study adopts a shape-restricted regression spline, dividing an independent variable into many intervals. The association between the explanatory and response variables is estimated separately for each interval. The values of the explanatory variable on which the intervals are created are referred to as knots, and each knot defines the start and end of an interval. The study categorises managerial ability into three regions, described as low, intermediate, and high, which may have either a positive or a negative effect. Following prior studies (e.g., Glover and Prawitt 2014; Lowry 2008), the low region is between the 0th and 34th percentile, the intermediate region is between the 35th and 69th percentile, and the high region is from the 70th percentile. The audit supply theory recognises an audit firm's role in dictating audit fees (discount or premium) based on reputation, economies of scale, specialisation, and litigation risks (Caramanis and Lennox 2008). In contrast, the audit demand theory recognises the role of stakeholders especially managers to demand high-quality audits as a legitimacy/signalling approach to impress the owners about the management of the financial reporting process (DeFond and Zhang 2014; Simunic 1980; Skinner and Srinivasan 2012). Based on the foregoing argument, the study hypothesises as follows:
H2
. Managerial ability exerts a statistically significant and positive effect on audit pricing in the low-ability region.
H3
. Managerial ability exerts a statistically significant and negative effect on audit pricing in the intermediate ability region.
H4
. Managerial ability exerts a statistically significant and negative effect on audit pricing in the high-ability region.
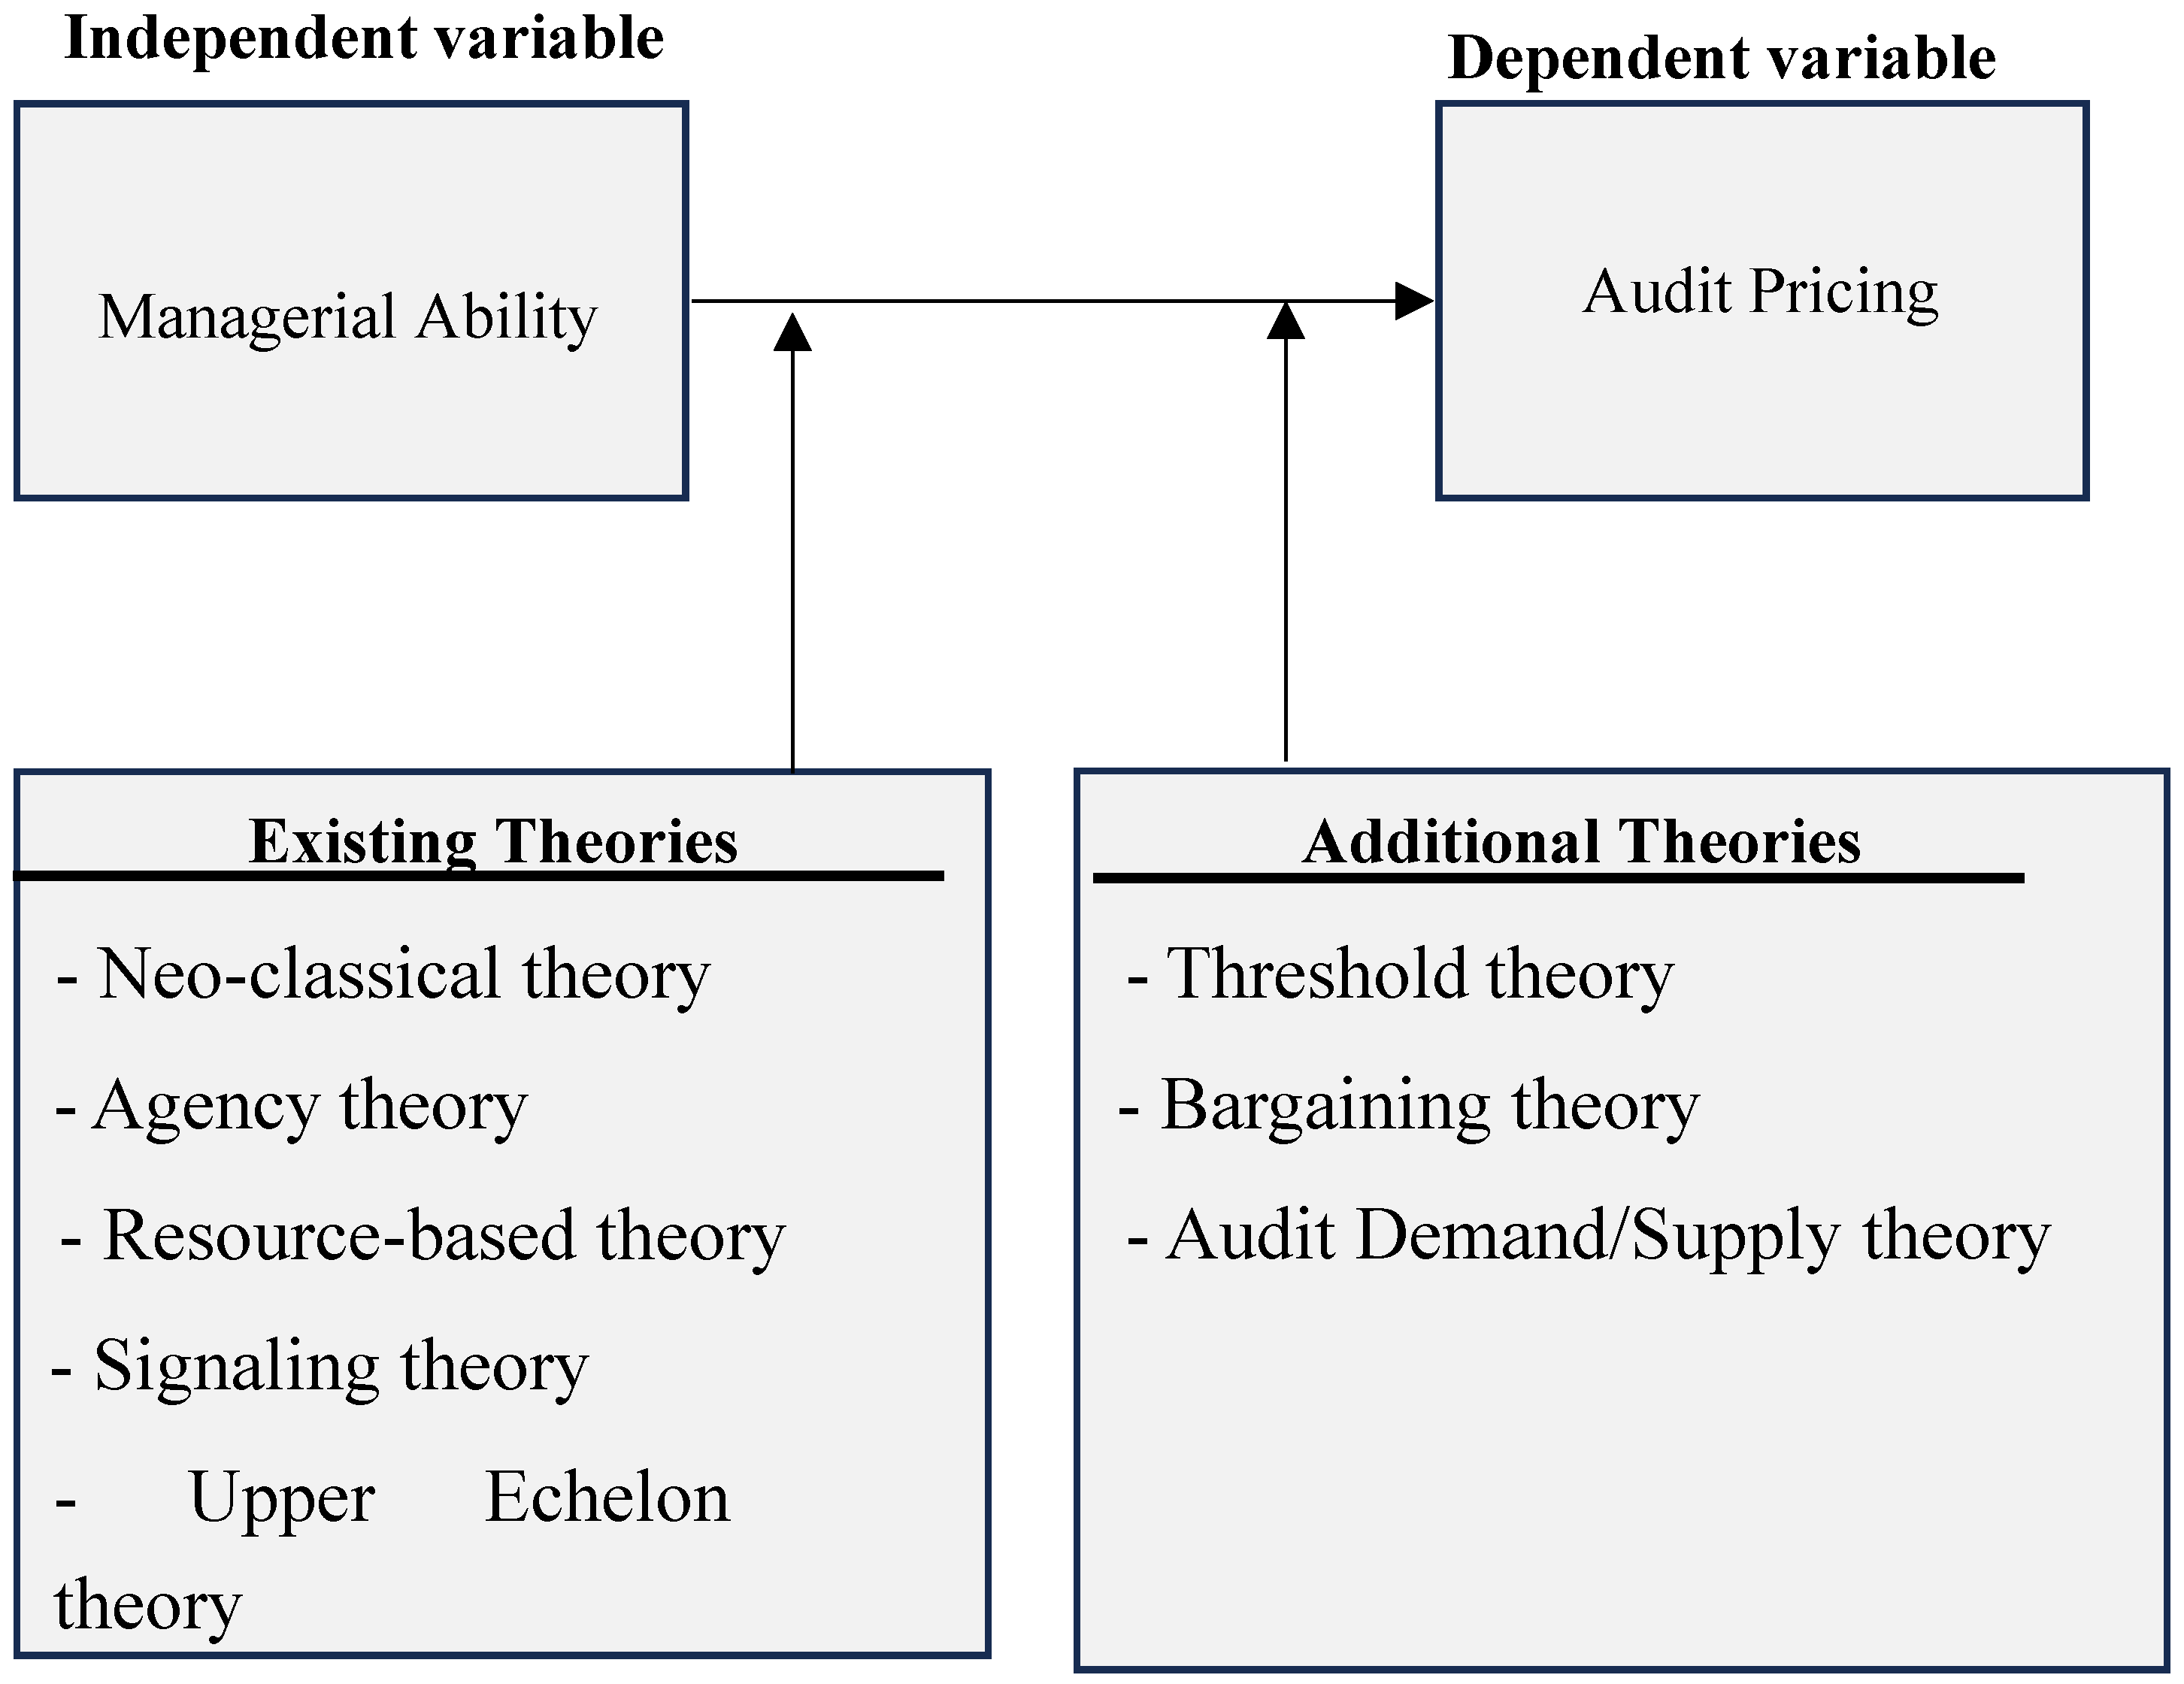
Figure 1 shows the multi-theoretical framework on the effect of managerial ability on audit pricing. The diagram shows the existing theoretical underpinnings and the complementary theories proposed by our study.
3. Methodology
3.1. Data and Sample
Data are drawn from the audited financial statements of 11 deposit money banks between 2011 and 2022. The base period, 2011, is adopted to control the effect of the new regulatory environment occasioned by the adoption of the International Financial Reporting Standards (IFRS) in 2011 and its attendant increase in audit fees. The sample focuses on interest-bearing banks (deposit money banks) and is based on banks with complete information between the sample periods. The criteria for selecting the sample size are reported in Table I.

Table 1.
Sample selection.
| Number | |
|---|---|
| Total population | 26 |
| (-) Privately owned banks expunged | (12) |
| (-) Banks reporting in currency other than Nigerian currency (Naira) | (1) |
| (-) Banks that are taken over during the period under study | (2) |
| Study sample | 11 |
Source: CBN 2024.
3.2. Model Specification and Analytical Technique
3.2.1. First Step
In the first step, the firm’s efficiency which comprises the observable firm characteristics and the unobservable managerial ability, is determined. Different models exist to analyse the efficiency scores based on a mix of input and output variables. Table II shows the input and output variables in some selected empirical literature (Ben Abdesslam et al. 2022; Curi and Lozano-Vivas 2020; Garcia-Meca and Garcia-Sanchez 2018). However, the literature (e.g., Jenkins and Anderson, 2003) has established the need to justify the input and output variables in determining efficiency scores by applying the DEA. Prior studies have shown that the DEA’s ability to discriminate among firms is dependent on the selection of the right number of input and output variables (Meng et al. 2008; Nataraja and Johnson 2011). Simar and Wilson (2008) argue that using a large number of input and output variables vis-à-vis the number of decision-making units can bias the efficiency frontier upward, resulting in more efficient units. For instance, using the model of Garcia-Meca and Garcia-Sanchez (2018) in our studies does not discriminate effectively among the DMUs (see Table IV); this may be attributable to a large number of inputs and output variables compared to the DMUs.
Therefore, the study conducts principal component analysis-data envelopment analysis (PCA-DEA) to determine the appropriate numbers of input and output variables. The extraction of factors from the transformation of six input and five output variables is done using the Kaiser oblique promax rotation for data collected from 11 banks between 2011 and 2022. Using the PCA, the first factor accounts for about 90% of the data’s variance, justifying its use as an uncorrelated representation of the reduced input(output) factors. The results show principal components for eigenvalues more significant than one and factor loadings greater than 0.40. This test is also supplemented by two other tests: the best-summated rating scale (Millar 2011, Stata command: optifact) and the clustering of variables around latent components (Hardouin 2019, Stata command: clv). Table III presents the diagnostic tests for determining the optimal number of variables that can discriminate efficiency levels among the DMUs. Though the results of the PCA suggest three output variables, two variables are selected based on the best-summated rating scale and the grouping of variables around latent elements. This aligns with the recommendations of prior studies (e.g., Cooper et al. 2001; Cooper et al. 2004) that adding the input and output variables multiplied by three should not be greater than the number of DMUs. The results of the adopted mix of input and output variables (Panel B of Table IV) show an excellent discriminating power. Furthermore, there are significant correlations among the input and output variables, justifying their inclusion in the model (Table V). Therefore, the study adopts two input and two output variables. The input variables comprise property, plant, and equipment (PPE), and staff cost (LABOUR), while the output variables comprise deposits (DEP) and net interest income (NETINC). Therefore, the model for the banks’ efficiency analysis is as follows:
Regarding DEA orientation, the input-based model is preferred to the output-based model because the DMUs may not operate optimally. In terms of the DEA return to scale assumption, the variable return to scale (VRS) is adopted because of its good finite sample properties, most productive scale size, and its ability to converge quickly (Banker and Park 2021; Kneip et al. 2016).
Table 2.
Input and output variables in prior empirical studies.
| SN | Studies | Input variables | Output variables |
|---|---|---|---|
| 1. | Garcia-Meca and Garcia-Sanchez (2018) | Property, plant, and equipment; Intangible assets; personnel cost; interest expenses; and operating rental expenses | Deposits, Loans, Investments, and Interest income. |
| 2. | Curi and Lozano-Vivas (2020) | Personnel expenses, interest expenses, physical capital. | Loans; Other earning assets |
| 3. | Ben Abdesslem et al. (2022) | Personnel expenses; property, plant, and equipment; deposit; short term funding | Loans; Other earning assets |
Table 3.
Results of diagnostic tests on the optimal number of input and output variables.
| SN | Techniques | Input variables | Output variables |
| 1. | Principal component analysis | Property, plant, and equipment; Labour cost | Deposits; Net interest income; Loan |
| 2. | Best summated rating scale (Stata command-optifact) | Property, plant, and equipment; Labour cost | Deposits; Net interest income |
| 3. | Clustering of variables around latent components (Stata command- clv) | Property, plant, and equipment; Labour cost | Deposits; Net interest income |
Table 4.
DEA score description.
| Number of efficient banks based on Garcia-Meca and Garcia-Sanchez (2018) | Number of efficient banks based on PCA-DEA | |||
|---|---|---|---|---|
| Panel A | Panel B | |||
| Year | Absolute | Relative (%) | Absolute | Relative (%) |
| 2011 | 8 | 67 | 3 | 25 |
| 2012 | 6 | 50 | 2 | 17 |
| 2013 | 9 | 75 | 2 | 17 |
| 2014 | 8 | 67 | 2 | 17 |
| 2015 | 7 | 58 | 3 | 25 |
| 2016 | 8 | 67 | 2 | 17 |
| 2017 | 8 | 67 | 4 | 33 |
| 2018 | 9 | 75 | 3 | 25 |
| 2019 | 10 | 83 | 2 | 17 |
| 2020 | 9 | 75 | 2 | 17 |
| 2021 | 8 | 67 | 2 | 17 |
| 2022 | 10 | 83 | 3 | 25 |
Table 5.
Descriptive statistics and correlation matrix of selected input and output variables.
| PPE | LABOUR | DEP | NETINC | |
|---|---|---|---|---|
| PPE | 1.000 | |||
| LABOUR | 0.883* | 1.000 | ||
| DEP | 0.888* | 0.892* | 1.000 | |
| NETINC | 0.884* | 0.893* | 0.944* | 1.000 |
| Descriptive Statistics: | ||||
| Mean | 17.671 | 17.229 | 20.921 | 18.236 |
| Std. Dev | 0.827 | 0.718 | 0.992 | 0.904 |
| Min | 15.869 | 15.691 | 18.809 | 16.281 |
| Max | 19.496 | 18.674 | 23.144 | 19.754 |
3.2.2. Second Step
In the first step, the efficiency scores generated (Equation 1) are attributable to the whole firm. The second step comprises the estimation of managerial ability by regressing firm efficiency scores generated in the first stage on bank-specific characteristics, such as size, market share, free cash flow, age, and number of subsidiaries, which are outside the discretionary control of the managers (Banker et al. 2019). We follow prior studies (e.g., Chen et al. 2023; Garcia-Meca and Garcia-Sanchez 2018) to extract the managerial ability score as the residual of the following model:
DEASC represents efficiency scores in the first stage; SIZ represents banks’ total assets; MKT represents market share; FLOW represents free cash flow; AGE represents the number of years the bank has existed; SUB represents the number of subsidiaries; and YEAR represents year dummies.
While many studies (e.g., Demerjian et al. 2012) apply the DEA-Tobit regression model to extract the managerial ability score, this study adopts the bias-corrected two-stage bootstrapped truncated regression model of Simar and Wilson (2007). DEA efficiency scores range between 0 and 1 and are not a product of data censoring (Banker et al. 2019), which makes the Tobit regression inefficient (Simar and Wilson 2011). Studies have shown that the first stage of the two-way model is fraught with serial correlation and measurement errors. The bias-corrected two-stage bootstrapped truncated regression model removes this distortion and bias in the second-stage regression occasioned by high correlation among the mix of input and output variables that generated the efficiency scores (Simar and Wilson, 2007, 2011, 2015). We adopt the bias-corrected two-stage bootstrapped truncated regression technique (Badumenko and Tauchman 2019, Stata command: simarwilson).
3.2.3. Model specification
To test the effect of managerial ability on audit pricing, the following regression model is adopted:
Audit pricing proxied by audit fees is denoted as LNFEES, while MGR represents managerial ability. Three control variables are introduced into the model in line with the literature. These variables are joint audit (JOINT), specialist auditor (SPEC), and financial risk (LOSS). The agency and resource dependence theories support the inclusion of joint audits (JOINT). Agency theory seeks to mitigate agency conflict by including multiple audit firms as a governance mechanism to enhance oversight and reduce collusion. The resource dependency theory provides for the diversification of risks as a result of the deployment of many resources from more than one audit firm, resulting in competitive audit pricing. The effect of a joint audit on audit fees can be either positive or negative. A joint audit is measured as the engagement of two audit firms for an audit engagement (Lesage et al. 2017).
The inclusion of audit firm industry specialisation (SPEC) in the model is justified based on the agency and differentiation strategy theories. The two theories argue that agents may employ specialist auditors to signal their stewardship to the management, and this decision can have implications on audit fees (Choi et al. 2008; Ferguson et al. 2003; Huang et al. 2007; Mayhew and Wilkins 2003). Audit firm industry specialisation is measured as an audit firm having a market share greater than 30 per cent in the respective industry (Habib and Bhuiyan 2011). Finally, the agency and risk-based audit approach facilitates the inclusion of financial risk (LOSS) into the model. Agency theory argues that the conflict between the principal and the agent may reflect high-risk exposure, necessitating a risk-based audit approach. This approach involves extensive audit work and additional effort with repercussions on audit fees. Financial risk is measured as a binary variable where ‘1’ signifies a negative net income and 0 otherwise (Asthana and Boone 2012; Zaman et al. 2011). We expect all the control variables to exert positive effects on audit fees.
We adopt the regression spline method to analyse the data. Using a regression spline model would reveal the plausibility of breakpoints that may be present in the data. Regression splines comprise a family of methods for estimating variables that change slopes at different points (Edwards and Parry 2018; Marsh and Cormier 2001).
3.2.4. Data Analysis Strategy
The data analysis process follows a 5-stage process. In the first stage, we graphically investigate the functional association between managerial ability and audit pricing (Ronkko et al. 2022). We also investigate the occurrence of switch points in the data using the closed-test approach, which automatically detects the positioning of switch points in equally spaced centiles of the variable’s distribution. In the second stage, descriptive statistics and correlation matrix are computed to gain initial insights into the data. We also conduct diagnostic tests in the third stage to ensure the model fits the data. In the fourth stage, we run spline regression, which comprises seven shape-restricted regression splines (Meyer 2008; Wang and Ghosh 2012; Wang and Yan 2021) with the restricted cubic spline (RCS) as the baseline estimator. The remaining six estimators are natural cubic spline (N-spline), basis spline (B-spline), integrated spline (I-spline), integrated basis spline (integrated B-spline), integrated natural cubic spline (integrated N-spline) and monotone spline (M-spline). The shape-restricted regression splines are preferred to kernel smoothers and smoothing splines because they are adaptively flexible, have optimal convergence, prevent over-fitting, and are robust to knot selection with capacity for smoothing functionalities (Meyer 2008). Additional analyses are conducted in the fifth stage. All studies are performed using Stata 18 with a 5% significance level.
4. Analysis and Discussion
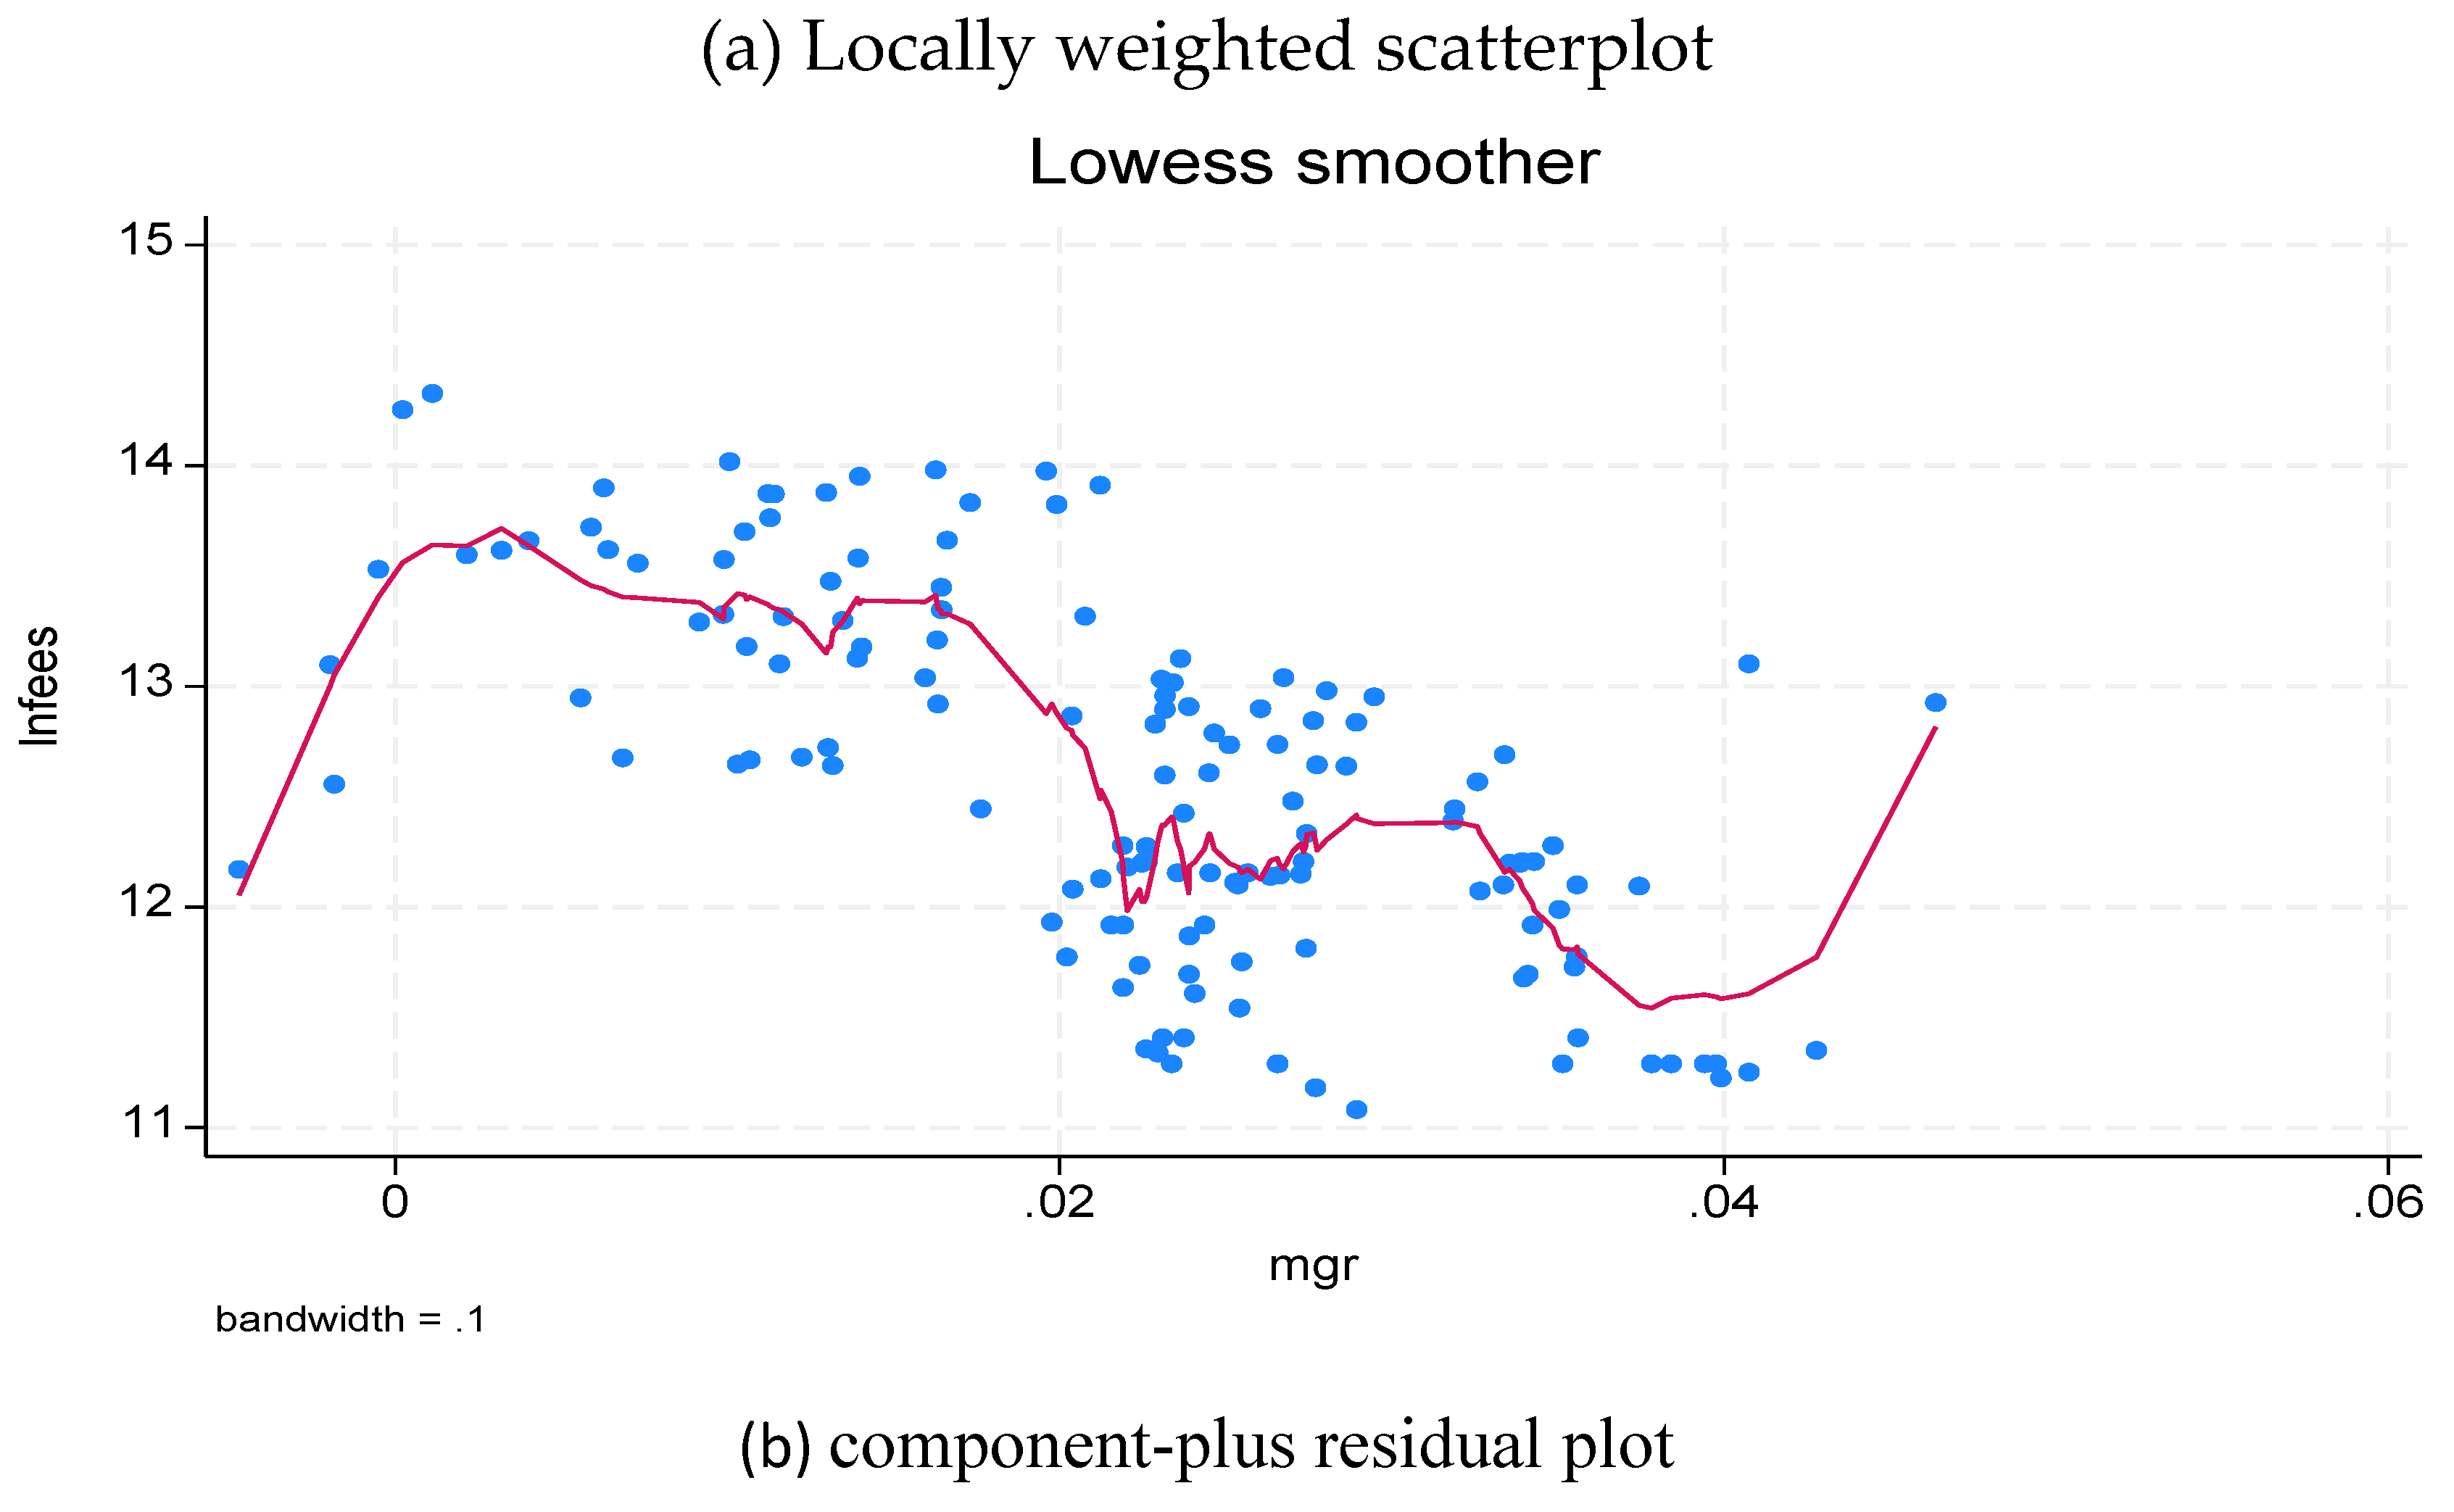
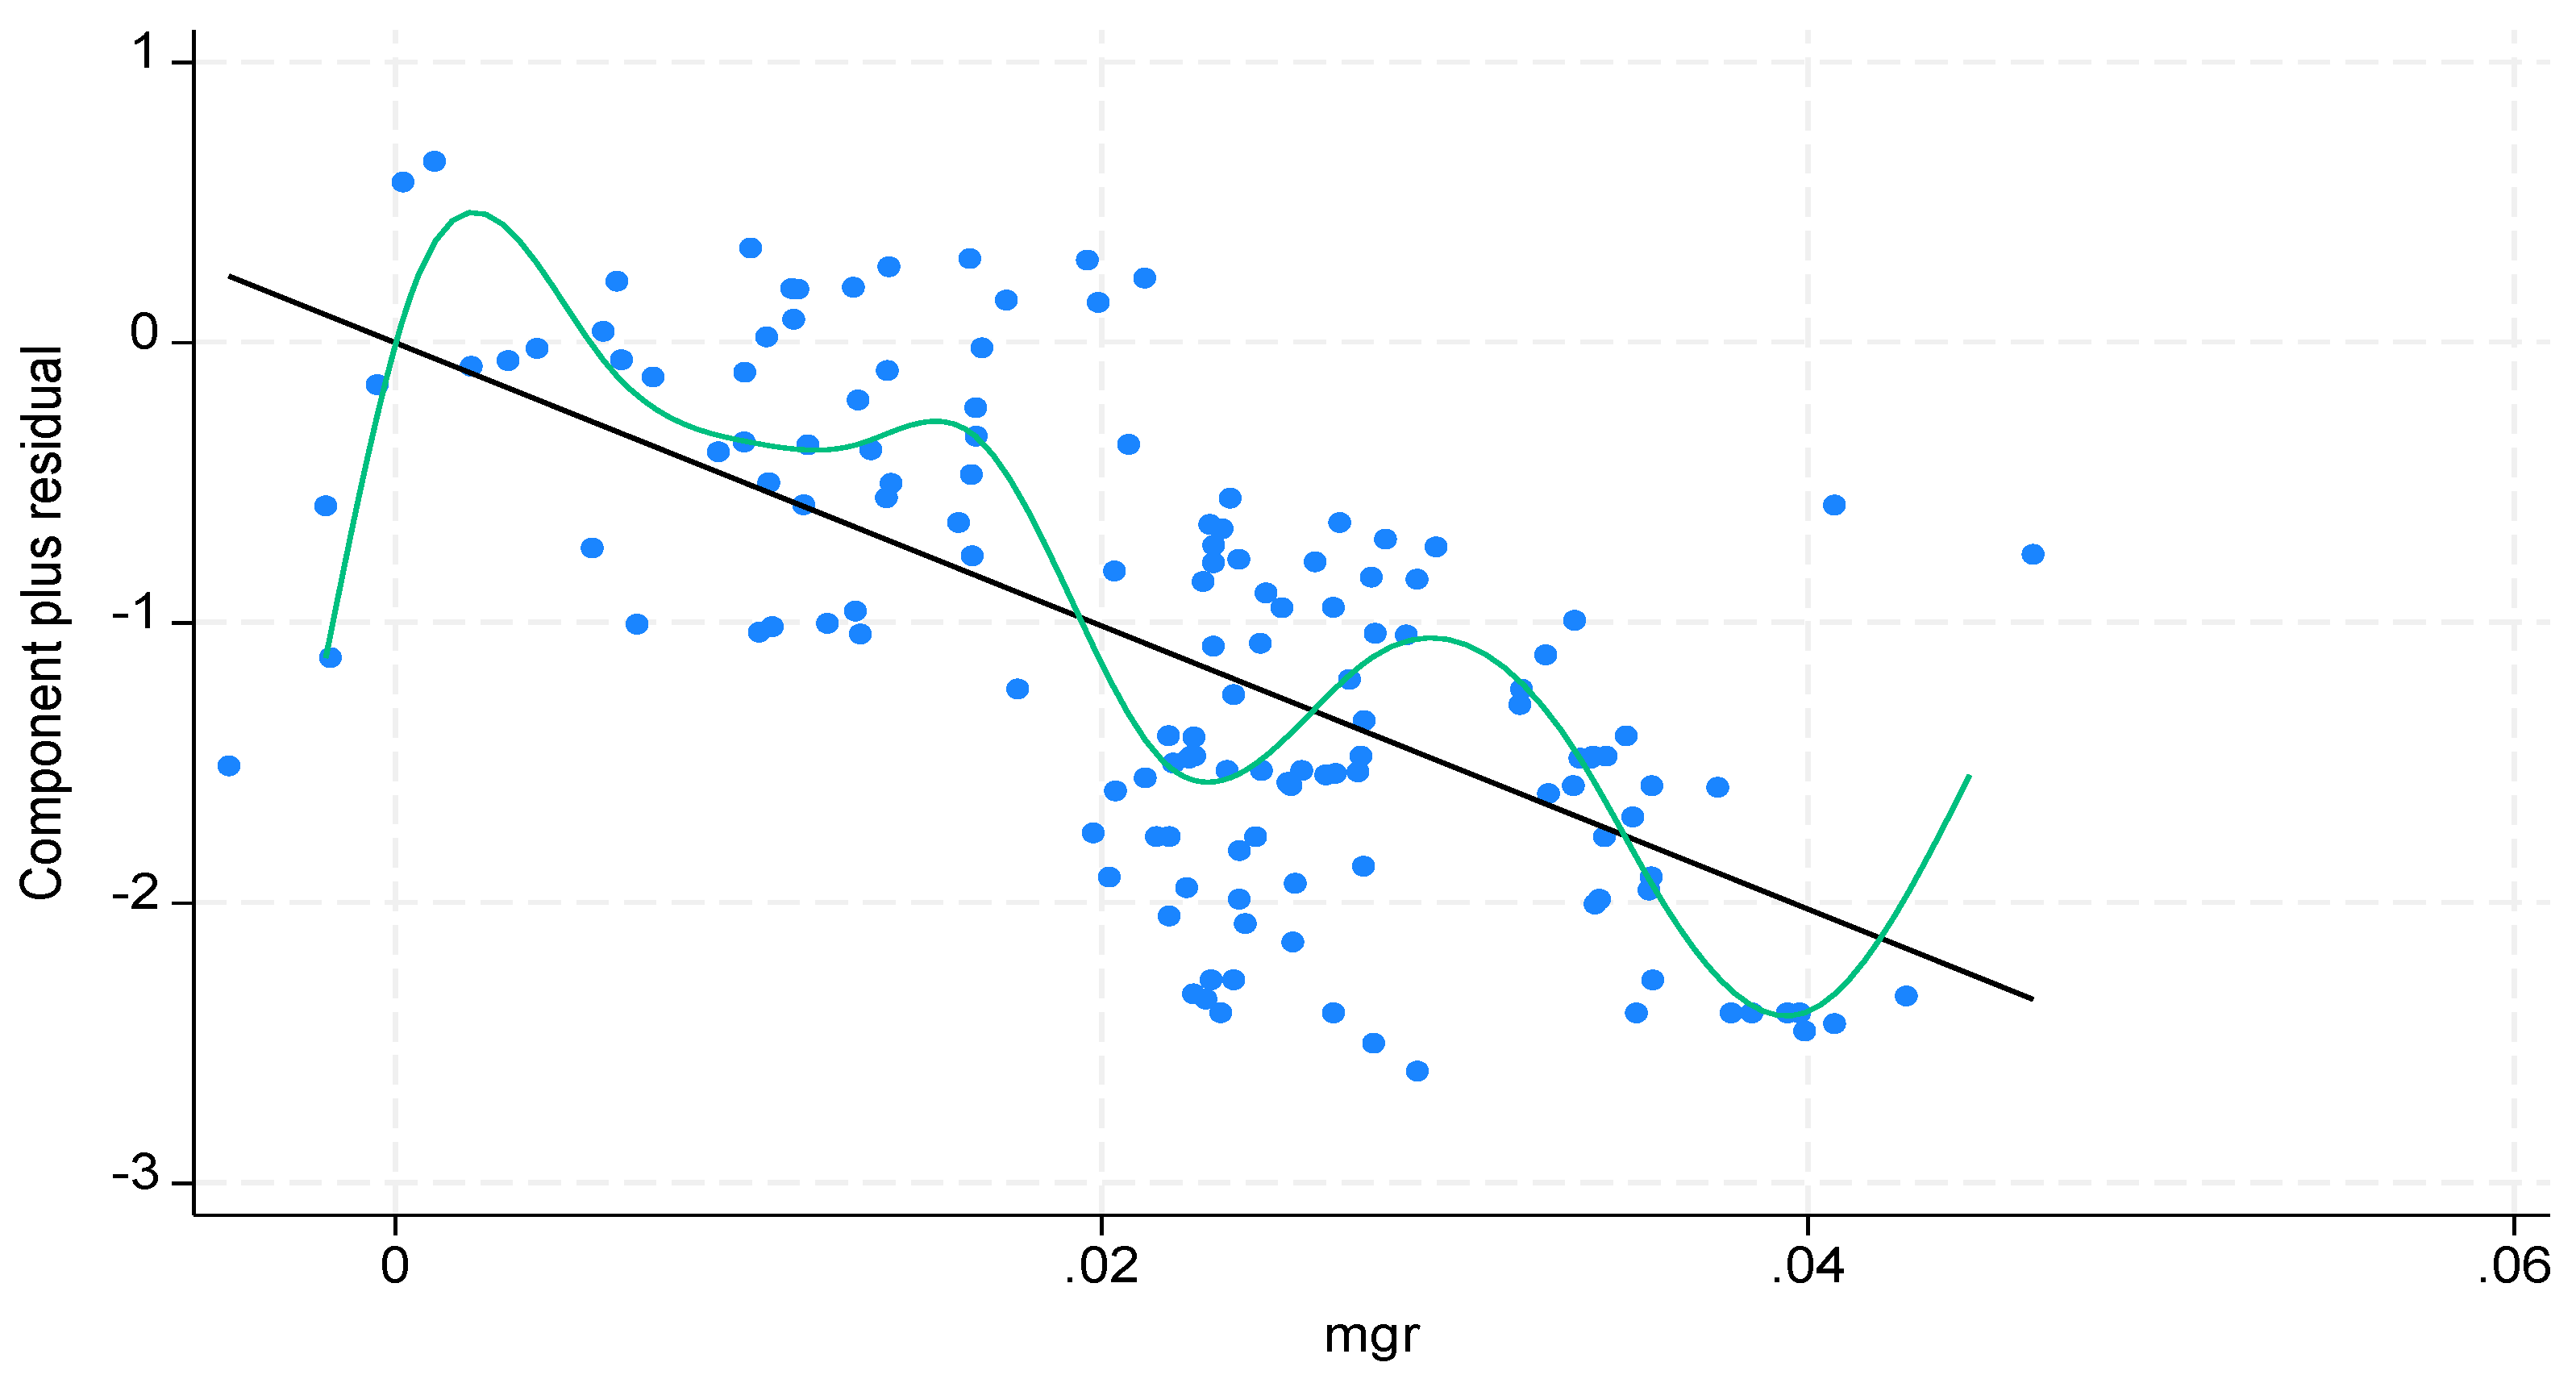
4.1. Functional Relationship and Switch Point Analysis
The study uses plots to depict the functional association between managerial ability and audit pricing. The plots comprise a locally weighted scatterplot smoother (Cleveland 1979; Jacoby 2000) and the component-plus-residual plot (Chatterjee and Hadi 2015) (Stata commands: “lowess” and “cprplot,” respectively). The results of the locally weighted scatterplot smoother and the component-plus-residual plot (Figure II a & b) show a departure from linearity. We apply the closed-test approach, which automatically identifies the positioning of the switch points based on an equally spaced centile of the regression (Royston 2007) (Stata command: mvrs and uvrs). The results show the presence of three knots demarcating boundaries of four segments with markedly different slopes. Therefore, the results validate the first hypothesis (H1), which states that breakpoints exist in the association between managerial ability and audit pricing. This result validates the threshold theory, which postulates that the association between a response variable and an explanatory variable varies depending on the breakpoints of the explanatory variable. The presence of the breakpoints results in the extension of Equation (3) as follows:
The variable “managerial ability” (MGR) in Equation (3) is decomposed into three knots, demarcating four segments. The new variables are MGR1, MGR2, and MGR3, representing the first, second, and third regions of managerial ability, respectively. Following prior studies (e.g., Glover and Prawitt 2014; Lowry 2008), the first region (between the 0th and 34th percentiles) is labelled the low managerial ability region, and the second region (between the 35th and 69th percentile) is labelled the intermediate managerial ability region. The third region (70th and 100%) is the high managerial ability region. We test the equality of matched pairs of the three regions of managerial ability by using the Wilcoxon matched-pairs signed-ranks test (Wilcoxon 1945). The null hypothesis signifies equal distribution, while the alternate hypothesis signifies unequal distribution. The results (using Stata command: signrank) show that the distributions of MGR1 and MGR 2 (z = 4.868, p = 0.000), MGR1 and MGR3 (z = 4.868, p = 0.000), and MGR2 and MGR3 (z = -6.077, p = 0.000) are not the same.
Figure 2.
(a): Functional relationship between managerial ability and audit pricing (b): Functional relationship between managerial ability and audit pricing.
Figure 2.
(a): Functional relationship between managerial ability and audit pricing (b): Functional relationship between managerial ability and audit pricing.
4.2. Descriptive Statistics and Correlation Matrix
Table VI presents the descriptive statistics and correlation matrix of the variables. Audit fees have a mean value of 12.57. The results show that about seven per cent of the banks are engaged by joint auditors, while about 33 per cent engaged audit industry specialists. An average of five per cent experienced negative returns on assets during the period. The correlation matrix shows a significant and negative correlation between audit fees and the low region of managerial ability, joint audit, and loss. At the same time, it is significantly and positively correlated with managerial ability (intermediate and high regions) and audit firm industry specialisation.
4.3. Diagnostic Tests
Table VII presents the results of the diagnostic tests. The study conducts five diagnostic tests comprising a functional form test, specification test, heteroskedasticity test, outlier test, and normality test. Ramsey’s regression specification error test (RESET) test which examines the functional form of a model is conducted, and the results show that an appropriate functional form is adopted (Wooldridge 2018). A linktest for specification error (Wooldridge 2018) is undertaken, and the results show no specification error. The Breusch-Pagan test for heteroskedasticity (Gujarati 2021) is undertaken, and the results show that the model does not have the challenge of heteroskedasticity. An outlier test using Cook's distance measure (Pardoe 2020) is also conducted; the results show the absence of any influential observation, as no distance is above the cut-off point. Fifth, the normality is conducted using the Shapiro-Wilk W normality test (Shapiro and Wilk 1965); the results show a normally distributed residual. The three regions of the managerial ability variable have variance inflation factors above a cut-off point of 10; however, Harrell (2001) argues that multicollinearity may not present a severe problem in restricted cubic splines analyses.
Table 6.
Descriptive statistics and correlation matrix of the effect of managerial ability on audit pricing.
Table 6.
Descriptive statistics and correlation matrix of the effect of managerial ability on audit pricing.
| LNFEES | MGR1 | MGR2 | MGR3 | JOINT | SPEC | LOSS | |
|---|---|---|---|---|---|---|---|
| Correlation Matrix | |||||||
| LNFEES | 1.00 | ||||||
| MGR1 | -0.66* | 1.00 | |||||
| MGR2 | 0.60* | -0.95* | 1.00 | ||||
| MGR3 | 0.58* | -0.94* | 0.99* | 1.00 | |||
| JOINT | -0.17* | -0.12 | 0.06 | 0.06 | 1.00 | ||
| SPEC | 0.46* | -0.35* | 0.31* | 0.30* | -0.19* | 1.00 | |
| LOSS | -0.24* | 0.05* | 0.02* | -0.02 | -0.06 | -0.02 | 1.00 |
| Descriptive Statistics | |||||||
| Observations | 144 | 144 | 144 | 144 | 144 | 144 | 144 |
| Mean | 12.57 | 0.00 | 0.00 | 21.30 | 0.07 | 0.33 | 0.05 |
| Std. Dev | 0.81 | 0.01 | 0.00 | 0.98 | 0.26 | 0.47 | 0.22 |
| Min | 11.08 | -0.02 | -0.00 | -0.00 | 0.00 | 0.00 | 0.00 |
| Median | 12.58 | 0.00 | -0.00 | -1.83 | 0.00 | 0.00 | 0.00 |
| Max | 14.33 | 0.02 | 0.02 | 23.42 | 1.00 | 1.00 | 1.00 |
Table 7.
Diagnostic Tests.
| S/N | Tests | Analytical techniques | Results |
|---|---|---|---|
| 1. | Functional form | Ramsey test | F (3,134) = 2.046; p = 0.110 |
| 2. | Specification test | Linktest | t = 0.605; p = 0.546 |
| 3. | Heteroskedasticity test | Breusch-Pagan test | Chi = 0.238; p = 0.626 |
| 4. | Outlier test | Cook’s distance | No distance is above the cutoff of 1 |
| 5. | Normality test | Shapiro-Wilk W normality test | Z = 0.407; p = 0.342 |
4.4. Regression Results and Discussion
The study adopts shape-restricted splines to achieve its objective. Table VIII reveals the regression results of estimating Eq. (4). Panel A shows the a priori expectation for each variable. Panel B presents the results of the effect of managerial ability and audit pricing using the restricted cubic spline. Panels C, D, E, F, G and H show the results of the natural cubic splines, integrated natural cubic splines, monotone splines, integrated splines, integrated basis splines, and the basis splines respectively. The restricted cubic spline (Panel B) is adopted as the baseline result because it is a flexible model for analysing nonlinear relationships while improving the behaviour of the model by using linear functions that accommodate extreme boundaries before the first knot and after the last knot (Lusa and Ahlin 2020). In the restricted cubic spline regression analysis, we “mean-centre” the predictors to reduce the impact of multicollinearity (Cohen et al. 2013) and apply the winsorisation function at 1 and 99 per cent of the continuous predictors. The restricted cubic spline (Panel B) results show that managerial ability is significant at two breakpoints: intermediate and high regions of managerial ability. The results are interpreted in line with the hypotheses.
The second hypothesis (H2) states that managerial ability exerts a statistically significant and positive effect on audit pricing in the low-ability region. However, the results show an insignificant negative association, invalidating the hypothesis. One of the reasons adduced for the insignificant relationship could be that managers at this level may be irresponsive to average audit pricing. The third hypothesis (H3) predicts managerial ability exerts a statistically significant and negative effect on audit pricing in the intermediate-ability region. The results which invalidate the third hypothesis show that managerial ability exerts a significantly positive effect on audit pricing in the intermediate area of managerial ability (t = 2.57, p = 0.011). The positive effect of managerial ability on audit pricing at the intermediate region of managerial ability is consistent with the audit demand/supply theory (DeFond and Zhang 2014).
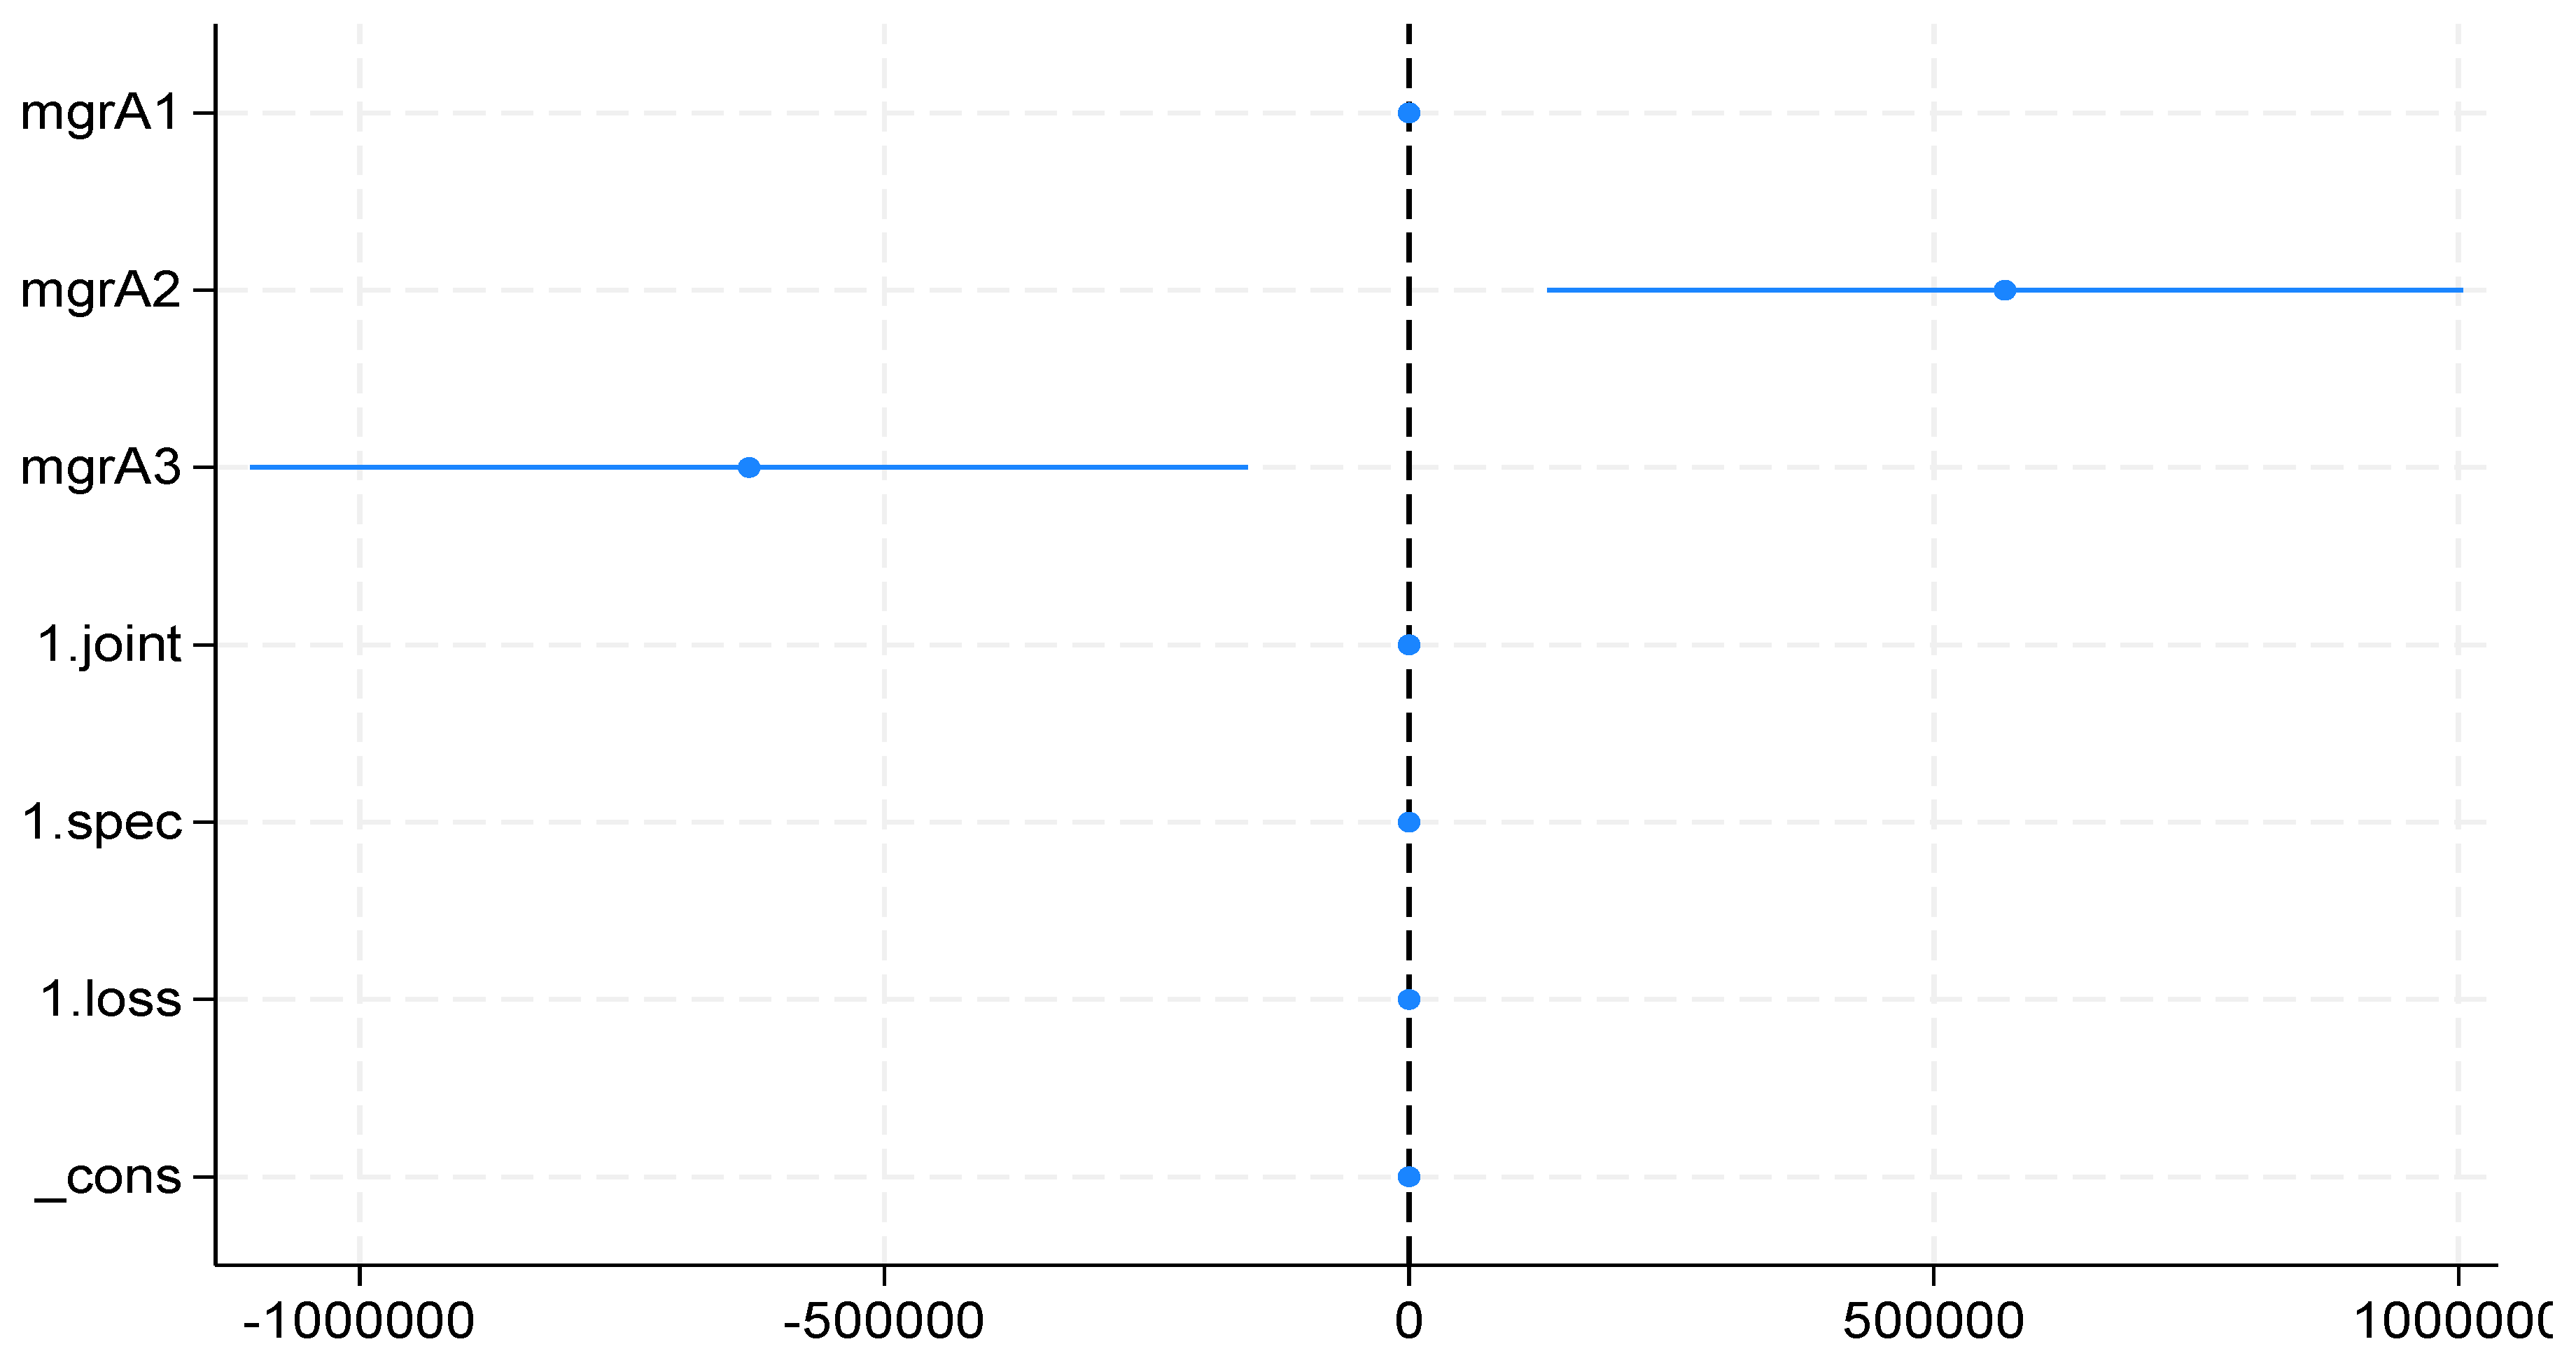
As a legitimacy/signalling measure to demonstrate effectiveness, an intermediate-ability manager may request a high-quality audit (Caramanis and Lennox 2008; Lim and Mali 2021), which aligns with the audit demand, legitimacy, and signalling theories. However, the audit supply theory infers that an audit firm will extract an audit fee premium based on specialisation, reputation, and litigation risk (Chen et al. 2019; Skinner and Srinivasan 2012). The fourth hypothesis (H4) predicts managerial ability exerts a statistically significant and negative effect on audit pricing in the high-ability region. The results support this hypothesis (t = -2.62, p = 0.10). This result aligns with audit demand theory which suggests that high-ability managers adopt conservative estimates for reliable financial reporting systems, resulting in reduced audit risk and audit fees discount (Krishnan and Wang 2015). It also aligns with the bargaining theory, which argues that an audit client can use its bargaining ability to negotiate for audit discounts (Carcello and Nagy 2004). Furthermore, using Porter’s (1985) competitive force theory, high-ability managers with bargaining power extract audit fees discount (Huang et al. 2007) even when the firm employs specialist auditors (Fung et al. 2012). Figure III complements the baseline model results by showing that intermediate managerial ability positively correlates with audit fees. In contrast, high managerial ability exerts a negative effect on audit fees. In summary, the results show an ambiguous association between managerial ability and audit pricing, as the association exhibits positive and negative tendencies.
Table 8.
Regression results of the association between managerial ability and audit pricing using shape-restricted regression splines.
Table 8.
Regression results of the association between managerial ability and audit pricing using shape-restricted regression splines.
| Model 1 |
Model 2 |
Model 3 |
Model 4 |
Model 5 |
Model 6 |
Model 7 |
||
|---|---|---|---|---|---|---|---|---|
| Panel | A | B | C | D | E | F | G | H |
| Var. | A priori | rcs | ns | ins | ms | is | ibs | bs |
| mgrA1 | +/- | -18.231 (-1.09) |
4.445*** (7.48) |
-279.220*** (-8.58) |
.006** (2.45) |
1.546*** (3.33) |
264.877*** (3.33) |
1.085** (2.45) |
| mgrA2 | +/- | 568** (2.57) |
-.357 (-1.09) |
3.475* (1.97) |
.005 (1.64) |
-2.654*** (-2.87) |
-288.820*** (-2.87) |
0.580 (1.64) |
| mgrA3 | +/- | -629** (-2.62) |
0.037 (0.13) |
0.639 (0.41) |
-.009*** (-2.80) |
.689 (0.65) |
74.968 (0.65) |
-.934*** (-2.80) |
| mgrA4 | +/- | .002 (0.77) |
.242 (0.23) |
50.927 (0.23) |
0.348 (0.77) |
|||
| mgrA5 | +/ | -.005*** (-3.04) |
-1.520 (-1.36) |
-453.617 (-1.36) |
-1.620*** (-3.04) |
|||
| Joint | + | -.642*** (-3.46) |
-.642*** (-3.46) |
-.497** (-2.36) |
-.341* (-1.70) |
-.354* (-1.75) |
-.354* (-1.75) |
-.341* (-1.70) |
| Spec | + | .332*** (3.22) |
.332*** (3.22) |
.340*** (3.12) |
.421*** (3.76) |
.424*** (3.71) |
.424*** (3.71) |
.421*** (3.76) |
| loss | + | -.819*** (-3.99) |
-.819*** (-3.99) |
-.800*** (-3.71) |
-.837*** (-3.71) |
-.820*** (-3.58) |
-.820*** (-3.58) |
-.837*** (-3.71) |
| N | 144 | 144 | 144 | 144 | 144 | 144 | 144 | |
| F Stat | 34.27 | 34.27 | 29.24 | 18.80 | 18.02 | 18.02 | 18.80 | |
| Prob | 0.000 | 0.000 | 0.000 | 0.000 | 0.000 | 0.000 | 0.000 | |
| Adj. R2 | 0.5826 | 0.5826 | 0.5423 | 0.4989 | 0.4878 | 0.4878 | 0.4989 | |
| RMSE | .52772 | .52772 | .55261 | .57823 | .58463 | .58463 | .57823 |
The restricted cubic spline is denoted as “rcs,” the natural cubic spline is denoted as “ns,” the integrated natural cubic spline is denoted as “ins,” the monotone spline is denoted as “ms,” the integrated spline is denoted as “is,” integrated basis spline is denoted as “ibs,” and basis spline is denoted as “bs.” T-statistics in parentheses; ***p<0.01, **p<0.05, *p<0.1.
Figure 3.
Plot of managerial ability thresholds on audit pricing.
While there are controversies in the literature on the relevance of p-values, we demonstrate the rigour, reproducibility, and scientific relevance of our results by complementing our results with the second-generation p-values, which control Type 1 error effectively (Blume et al. 2018, 2019). The results show the following second-generation p-value: mgrA1 (0.50), mgrA2 (0.00), mgrA3 (0.00), joint (0.00), spec (0.00), and loss (0.00). These p-values are similar to the traditional p-values, thus supporting the reliability of the baseline results. The results of four other estimators (monotone spline, integrated spline, integrated basis spline, and basis spline) align with the baseline results. While two estimators (natural cubic spline and integrated natural cubic spline) had different results, natural cubic splines show that managerial ability has a statistically significant and positive effect on audit pricing, and integrated natural cubic splines show that managerial ability exerts a negative effect on audit pricing. The opposing results may be due to the natural cubic spline and the integrated natural cubic spline subjective placement of knots and the forceful linearisation at the tails, which impact its flexibility at the boundaries (Perperoglou et al. 2019).
The control variables also show some interesting results. Audit firm industry specialisation (SPEC) positively correlates with audit pricing, indicating that specialist auditor charges higher audit fees (Yeboah et al. 2023). Joint audit (JOINT) negatively correlates with audit pricing, which indicates efficiency gains and economies of scale occasioned by the combined efforts of the audit firms, thereby resulting in audit fee discounts. Financial risk (LOSS) also negatively correlates with audit pricing. The results can also be justified based on the bargaining theory, where high-ability managers negotiate for audit discounts despite the higher financial risks.
4.5. Contribution to Knowledge
The study makes a theoretical contribution to managerial ability-audit pricing studies. It applies the threshold theory, bargaining power theory, and the audit demand/supply theory in addition to other theories (e.g., upper echelon theory, resource-based theory, and agency theory) to underpin the study. The threshold theory explains the three thresholds (breakpoints) within the continuum of managerial ability. The bargaining power theory supports the bargaining power of high-ability managers to extract audit discounts from the specialist audit firm. Audit demand theory places responsibility on high-ability managers to demand high-quality audits by employing specialist auditors to signal their effectiveness, erase the owners’ doubt about financial reporting manipulation, and reduce information asymmetry between the principal and the agents. The audit supply theory places responsibility on the audit firms to conduct quality audits based on their expertise and skilled industry knowledge.
The study also makes methodological contributions in two distinct ways. First, the study adopts the bias-corrected two-stage bootstrapped truncated regression technique of Simar and Wilson (2007) in preference to the DEA-Tobit regression. Simar and Wilson’s (2007) method resolves the serial correlation and measurement bias associated with the first stage of the analysis of the firm efficiency. The study also uses the closed-test approach to identify three knots demarcating boundaries of four segments indicative of non-linearity. Finally, the study adopts shape-restricted regression splines to analyse the association between managerial ability and audit pricing.
The results have implications for banks’ board of directors (board). The board should ensure that managers improve their negotiating and technical skills which will enable them to demand audit discounts on the grounds of quality financial reporting systems and lower audit risks. Since high-ability managers successfully negotiate favourable audit fees for their firms, the board should develop continuous learning and training programmes aimed at improving the abilities of the management. Additionally, the board can introduce performance incentives that will encourage efficiency in the management of the banks.
4.6. Additional Analyses
4.6.1. Simultaneous Quantile Regression
For additional analyses, simultaneous quantile regression is applied, where the dependent variable is divided into five regions, namely low audit fees region (10th quantile), fair audit fees region (25th quantile), average audit fees region (50th quantile), high audit fees regions (75th quantile), and very high audit fees region (90th quantile). The results (Table IX) show that at the low audit fees region (10th quantile), managerial ability exhibits statistically significant positive and negative effects on audit fees respectively. The results show insignificant relationships at the fair (25th quantile) and average (50th quantile) levels of audit fees. However, managerial ability exerted statistically significant positive and negative effects at the high (75th quantile) and very high (90th quantile) levels of audit fees.
Table 9.
Estimation of managerial ability on audit pricing across different quantiles using simultaneous quantile regression.
Table 9.
Estimation of managerial ability on audit pricing across different quantiles using simultaneous quantile regression.
| Quantile | mgrA1 | mgrA2 | mgrA3 | joint | spec | loss |
| q10 | 7.546 (0.27) |
994916*** (3.00) |
-1082372*** (-3.05) |
-.469 (-1.40) |
.255 (1.20) |
-.609*** (-2.86) |
| q25 | -29.11 (-1.02) |
345911 (0.93) |
-369179 (-0.92) |
-.652** (-2.91) |
.360*** (3.51) |
-.779*** (-5.46) |
| q50 | -11.681 (-0.38) |
541604 (1.19) |
-593936 (-1.16) |
-.679** (-2.43) |
.412** (2.43) |
-.941*** (-4.00) |
| q75 | -25.356 (-0.96) |
660681** (2.08) |
-769072** (-2.21) |
-.886** (-2.47) |
.325*** (2.92) |
-.995*** (-3.35) |
| q90 | -.019 (-0.00) |
941556*** (4.38) |
-1055375*** (-4.82) |
-.421 (-1.62) |
.319*** (4.57) |
-.846*** (-3.22) |
Mgr1—mgr3 are the three knots of managerial ability. Joint represents a joint auditor, spec represents specialist auditors, and loss represents firms with negative returns on assets. *p <0.1, **p <0.05, ***p <0.01.
4.6.2. Penalised Spline
While the shape-restricted splines are regression splines, we also consider penalised splines to support the baseline results. The results show that low-region managerial ability (z = -1.09, p = 0.277) has a negative but insignificant effect on audit pricing; intermediate-region managerial ability (z = 2.57, p = 0.010) has a significantly positive effect on audit pricing; while high-region managerial ability (z = -2.62, p = 0.009) has a significantly negative effect on audit pricing. Joint audit (JOINT) and financial risk (LOSS) exerted a negative effect on audit pricing, while audit firm industry specialisation (SPEC) exerts a significantly positive effect on audit pricing. These results support the baseline results.
5. Conclusions
This study investigates the effect of managerial ability on audit pricing in the Nigerian banking (deposit money banks) industry between 2011 and 2022. Managerial ability is proxied using a bias-corrected two-stage bootstrapped truncated regression model based on data envelopment analysis, while audit pricing is proxied using audit fees. A multi-theoretical framework comprising threshold theory, bargaining theory and audit demand/supply theories is adopted to complement existing theories. Shape-restricted regression splines comprising six estimators (restricted cubic splines, natural cubic splines, integrated natural cubic splines, basis splines, monotone splines, integrated splines, and integrated basis splines) are applied to achieve the objective. The results show evidence of non-linearity, with three knots demarcating the boundaries of four segments. The results also show that the effects of managerial ability on audit pricing are insignificant at the low-ability region, significantly positive at the intermediate-ability region, and significantly negative at the high-ability region of managerial ability, respectively.
This study has limitations. First, it is conducted within the Nigerian banking industry; therefore, caution should be exercised when generalising the results to other industries and economies. Second, the study adopts shape-restricted regression splines; other methods, including the Bayesian techniques, can be adopted in future studies. Third, other studies can investigate the indirect association between managerial ability and audit pricing through mediation analysis. Prior studies have focused on the direct association between managerial ability and audit pricing and the moderating effect of contextual factors. Finally, future studies can use classification breakpoints to analyse the relationship.
References
- Ahmad, S.; Mohti, W.; Khan, M.; Irfan, M.; Bhatti, O.K. (2024). Creating a bridge between ESG and firm's financial performance in Asian emerging markets: catalytic role of managerial ability and institutional quality. Journal of Economic and Administrative Sciences.
- Ahn, D.; Yoo, S.; Cho, S. Do competent managers increase labor productivity? Evidence from Korea. Journal of Derivatives and Quantitative Studies 2023, 31, 242–260. [Google Scholar] [CrossRef]
- Andreou, P.C.; Karasamani, I.; Louca, C.; Ehrlich, D. The impact of managerial ability on crisis-period corporate investment. Journal of Business Research 2017, 79, 107–122. [Google Scholar] [CrossRef]
- Andreou, P.C.; Philip, D.; Robejsek, P. Bank liquidity creation and risk-taking: Does managerial ability matter? Journal of Business Finance and Accounting 2016, 43, 226–259. [Google Scholar] [CrossRef]
- Anggraini, P.G.; Sholihin, M. What do we know about managerial ability? A systematic literature review. Management Review Quarterly 2023, 73, 1–30. [Google Scholar] [CrossRef]
- Arin, P.; Minniti, M.; Murtinu, S.; Spagnolo, N. Inflection points, kinks, and jumps: A statistical approach to detecting nonlinearities. Organizational Research Methods 2022, 25, 786–814. [Google Scholar] [CrossRef]
- Asthana, S.C.; Boone, J.P. Abnormal audit fee and audit quality. Auditing 2012, 31, 1–22. [Google Scholar] [CrossRef]
- Atawnah, N.; Eshraghi, A.; Baghdadi, G.A.; Bhatti, I. Managerial ability and firm value: A new perspective. Research in International Business and Finance 2024, 67. [Google Scholar] [CrossRef]
- Badunenko, O.; Tauchmann, H. Simar and Wilson's two-stage efficiency analysis for Stata. Stata Journal 2019, 19, 950–988. [Google Scholar] [CrossRef]
- Baik, B.; Choi, S.; Farber, D.B.; Zhang, J. Managerial ability and earnings quality: An international analysis. 2012, 66, 37–39.
- Bakre, O.M. The unethical practices of accountants and auditors and the compromising stance of professional bodies in the corporate world: Evidence from corporate Nigeria. Accounting Forum 2007, 31, 277–303. [Google Scholar] [CrossRef]
- Banker, R.; Natarajan, R.; Zhang, D. Two-stage estimation of the impact of contextual variables in stochastic frontier production function models using data envelopment analysis: Second stage OLS versus bootstrap approaches. European Journal of Operational Research 2019, 278, 368–384. [Google Scholar] [CrossRef]
- Banker, R.D.; Park, H.U. Three-stage approach to analyze managerial ability. Data Envelopment Analysis Journal 2021, 5, 27–54. [Google Scholar] [CrossRef]
- Barney, J. Firm resources and sustained competitive advantage. Journal of Management 1991, 17, 99–120. [Google Scholar] [CrossRef]
- Ben Abdesslem, R.; Chkir, I.; Dabbou, H. Is managerial ability a moderator? The effect of credit risk and liquidity risk on the likelihood of bank default. International Review of Financial Analysis 2022, 80. [Google Scholar] [CrossRef]
- Bertrand, M.; Schoar, A. Managing with style: The effect of managers on firm policies. The Quarterly Journal of Economics 2003, 118, 1169–1208. [Google Scholar] [CrossRef]
- Blume, J.D.; D’Agostino McGowan, L.; Dupont, W.D.; Greevy, R.A. Second-generation p-values: Improved rigour, reproducibility, & transparency in statistical analyses. PLoS ONE 2018, 13. [Google Scholar] [CrossRef]
- Blume, J.D.; Greevy, R.A.; Welty, V.F.; Smith, J.R.; Dupont, W.D. An introduction to second-generation p-values. American Statistician 2019, 73, 157–167. [Google Scholar] [CrossRef]
- Bui, D.G.; Chen, Y.; Chen, Y.S.; Lin, C.Y. Managerial ability and financial statement disaggregation decisions. Journal of Empirical Finance 2023, 74. [Google Scholar] [CrossRef]
- Caramanis, C.; Lennox, C. Audit effort and earnings management. Journal of Accounting and Economics 2008, 45, 116–138. [Google Scholar] [CrossRef]
- Carcello, J.V.; Nagy, A.L. Client size, auditor specialization and fraudulent financial reporting. Managerial Auditing Journal 2004, 19, 651–668. [Google Scholar] [CrossRef]
- Causholli, M.; De Martinis, M.; Hay, D.; Knechel, W.R. Audit markets, fees and production: Towards an integrated view of empirical audit research. Journal of Accounting Literature 2010, 29, 167–215. [Google Scholar]
- Central Bank of Nigeria (2024). List of financial institutions. Retrieved online from cbn.gov.ng/supervision/inst-dm.asp.
- Chatterjee, S.; Hadi, A.S. (2015). Regression analysis by example. John Wiley & Sons. [CrossRef]
- Chen, H.; Hua, S.; Liu, Z.; Zhang, M. Audit fees, perceived audit risk, and the financial crisis of 2008. Asian Review of Accounting 2019, 27, 97–111. [Google Scholar] [CrossRef]
- Chen, S.S.; Lin, C.Y. Managerial ability and acquirer returns. Quarterly Review of Economics and Finance 2018, 68, 171–182. [Google Scholar] [CrossRef]
- Chen, T.K.; Tseng, Y.; Hung, Y.S.; Huang, M.L. Management efficiency uncertainty and its implications for bondholders. International Review of Economics and Finance 2023, 85, 73–92. [Google Scholar] [CrossRef]
- Cheng, L.; Cheung, A. (Waikong). Is there a dark side of managerial ability? Evidence from the use of derivatives and firm risk in China. Evidence from the use of derivatives and firm risk in China. Journal of Contemporary Accounting and Economics 2021, 17. [Google Scholar] [CrossRef]
- Cheng, T.Y.; Li, Y.Q.; Lin, Y.E.; Chih, H.H. Does the fit of managerial ability with firm strategy matters on firm performance? Journal of Asian Finance, Economics and Business 2020, 7, 9–19. [Google Scholar] [CrossRef]
- Cho, M.; Kwon, S.Y.; Krishnan, G.V. Audit fee lowballing: determinants, recovery, and future audit quality. Journal of Accounting and Public Policy 2021, 40. [Google Scholar] [CrossRef]
- Choi, J.H.; Kim, J.B.; Liu, X.; Simunic, D.A. Audit pricing, legal liability regimes, and big 4 premiums: Theory and cross-country evidence. Contemporary Accounting Research 2008, 25, 55–99. [Google Scholar] [CrossRef]
- Choi, J.H.; Kim, J.B.; Zang, Y. Do abnormally high audit fees impair audit quality? Auditing 2010, 29, 115–140. [Google Scholar] [CrossRef]
- Cleveland, W.S. Robust locally weighted regression and smoothing scatterplots. Journal of the American Statistical Association 1979, 74(368), 829–836. [Google Scholar] [CrossRef]
- Cohen, J.; Cohen, P.; West, S.G.; Aiken, L.S. (2013). Applied multiple regression/correlation analysis for the behavioral sciences. Routledge. [CrossRef]
- Cooper, W.W.; Li, S.; Seiford, L.M.; Tone, K.; Thrall, R.M.; Zhu, J. Sensitivity and stability analysis in DEA: Some recent developments. Journal of Productivity Analysis 2001, 15, 217–246. [Google Scholar] [CrossRef]
- Cooper, W.W.; Seiford, L.M.; Zhu, J. (2004). Handbook on Data Envelopment Analysis. Kluwer Academic Publishers, Boston.
- Costa, M.D.; Habib, A. Local creative culture and audit fees. British Accounting Review 2023, 55. [Google Scholar] [CrossRef]
- Craswell, A.; Stokes, D.J.; Laughton, J. Auditor independence and fee dependence. Journal of Accounting and Economics 2002, 33, 253–275. [Google Scholar] [CrossRef]
- Curi, C.; Lozano-Vivas, A. Managerial ability as a tool for prudential regulation. Journal of Economic Behavior and Organization 2020, 174, 87–107. [Google Scholar] [CrossRef]
- DeFond, M.; Zhang, J. A review of archival auditing research. Journal of Accounting and Economics 2014, 58, 275–326. [Google Scholar] [CrossRef]
- Dejong, D.; Ling, Z. Managers: their effects on accruals and firm policies. Journal of Business Finance and Accounting 2013, 40, 82–114. [Google Scholar] [CrossRef]
- Demerjian, P.; Lev, B.; McVay, S. Quantifying managerial ability: A new measure and validity tests. Management Science 2012, 58, 1229–1248. [Google Scholar] [CrossRef]
- Desir, R.; Rakestraw, J.; Seavey, S.; Wainberg, J.; Young, G. Managerial ability, CEO age and the moderating effect of firm characteristics. Journal of Business Finance and Accounting 2024, 51, 148–179. [Google Scholar] [CrossRef]
- Doukas, J.A.; Zhang, R. Corporate managerial ability, earnings smoothing, and acquisitions. Journal of Corporate Finance 2020, 65. [Google Scholar] [CrossRef]
- Duellman, S.; Hurwitz, H.; Sun, Y. Managerial overconfidence and audit fees. Journal of Contemporary Accounting and Economics 2015, 11, 148–165. [Google Scholar] [CrossRef]
- Edwards, J.R.; Parry, M.E. On the use of spline regression in the study of congruence in organizational research. Organizational Research Methods 2018, 21, 68–110. [Google Scholar] [CrossRef]
- Ferguson, A.; Francis, J.R.; Stokes, D.J. The effects of firm-wide and office-level industry expertise on audit pricing. The Accounting Review 2003, 78, 429–448. [Google Scholar] [CrossRef]
- Fung, S.Y.K.; Gul, F.A.; Krishnan, J. City-level auditor industry specialization, economies of scale, and audit pricing. The Accounting Review 2012, 87, 1281–1307. [Google Scholar] [CrossRef]
- García-Meca, E.; García-Sánchez, I.M. Does managerial ability influence the quality of financial reporting? European Management Journal 2018, 36, 544–557. [Google Scholar] [CrossRef]
- Ge, Y.; Hung, S.; Huang, W.; Qiao, Z.; Deng, X. Mutual fund herding and audit pricing. Research in International Business and Finance 2023, 64. [Google Scholar] [CrossRef]
- Glover, S.M.; Prawitt, D.F. Enhancing auditor professional scepticism: The professional scepticism continuum. Current Issues in Auditing 2014, 8, P1–P10. [Google Scholar] [CrossRef]
- Gujarati, D.N. (2021). Essentials of Econometrics. Sage Publications.
- Gul, F.A.; Khedmati, M.; Lim, E.K.Y.; Navissi, F. Managerial ability, financial distress, and audit fee. Accounting Horizons 2018, 32, 29–51. [Google Scholar] [CrossRef]
- Habib, A.; Bhuiyan, M.B.U. Audit firm industry specialization and the audit report lag. Journal of International Accounting, Auditing and Taxation 2011, 20, 32–44. [Google Scholar] [CrossRef]
- Hambrick, D.C. Upper echelons theory: an update. Academy of Management Review 2007, 32, 334–343. [Google Scholar] [CrossRef]
- Hambrick, D.C.; Mason, P.A. Upper echelons: The organization as a reflection of its top managers. The Academy of Management Review 1984, 9, 193–206. [Google Scholar] [CrossRef]
- Hardouin, J.B. (2019). CLV: Stata module to implement a clustering of variables around latent components. Statistical Software Components S453101, Boston College Department of Economics.
- Harrell, F.E. (2001). Regression modeling strategies: with applications to linear models, logistic regression, and survival analysis., 608, New York: Springer.
- Hay, D.C.; Knechel, W.R.; Wong, N. (2006). Audit fees: A meta-analysis of the effect of supply and demand attributes. Contemporary Accounting Research. [CrossRef]
- Hermalin, B.E.; Weisbach, M.S. Endogenously chosen boards of directors and their monitoring of the CEO. American Economic Review 1998, 88, 96–118. [Google Scholar]
- Holcomb, T.R.; Holmes, R.M.; Connelly, B.L. Making the most of what you have: Managerial ability as a source of resource value creation. Strategic Management Journal 2009, 30, 457–485. [Google Scholar] [CrossRef]
- Hou, F.; Liu, J.; Pang, T.; Xiong, H. Signing auditors’ foreign experience and audit pricing. Economic Modelling 2020, 91, 300–312. [Google Scholar] [CrossRef]
- Huang, H.W.; Liu, L.L.; Raghunandan, K.; Rama, D.V. Auditor industry specialization, client bargaining power, and audit fees: further evidence. Auditing 2007, 26, 147–158. [Google Scholar] [CrossRef]
- Jacoby, W.G. Loess: A nonparametric, graphical tool for depicting relationships between variables. Electoral Studies 2000, 19, 577–613. [Google Scholar] [CrossRef]
- Jang, S.; Choi, H.; Kim, H. Managerial ability and cost of equity capital. Advances in Accounting 2024, 65. [Google Scholar] [CrossRef]
- Jauk, E.; Benedek, M.; Dunst, B.; Neubauer, A.C. The relationship between intelligence and creativity: New support for the threshold hypothesis by means of empirical breakpoint detection. Intelligence 2013, 41, 212–221. [Google Scholar] [CrossRef]
- Jenkins, L.; Anderson, M. A multivariate statistical approach to reducing the number of variables in data envelopment analysis. European Journal of Operational Research 2003, 147, 51–61. [Google Scholar] [CrossRef]
- Jiraporn, P.; Leelalai, V.; Tong, S. The effect of managerial ability on dividend policy: How do talented managers view dividend payouts? Applied Economics Letters 2016, 23, 857–862. [Google Scholar] [CrossRef]
- Kabir, M.; Rahman, D.; Jamil, T. Torn between two debt types? The role of managerial ability in a firmʼs choice between bank loans and public debt. Journal of Banking & Finance 2024, 164, 107205. [Google Scholar]
- Kanapathippillai, S.; Yaftian, A.; Mirshekary, S.; Sami, H.; Gul, F.A. Director turnover, board monitoring and audit fees: Some Australian evidence. Pacific Basin Finance Journal 2024, 83. [Google Scholar] [CrossRef]
- Kim, B.; Koo, M. Managerial ability and firm’s tweeting activity. Research in International Business and Finance 2024, 69. [Google Scholar] [CrossRef]
- Kneip, A.; Simar, L.; Wilson, P.W. Testing hypotheses in nonparametric models of production. Journal of Business & Economic Statistics 2016, 34, 435–456. [Google Scholar] [CrossRef]
- Krishnan, G.V.; Wang, C. The relation between managerial ability and audit fees and going concern opinions. Auditing 2015, 34, 139–160. [Google Scholar] [CrossRef]
- Lesage, C.; Ratzinger-Sakel, N.V.S.; Kettunen, J. Consequences of the abandonment of mandatory joint audit: An empirical study of audit costs and audit quality effects. European Accounting Review 2017, 26, 311–339. [Google Scholar] [CrossRef]
- Leverty, J.T.; Grace, M.F. Dupes or incompetents? An examination of management's impact on firm distress. Journal of Risk and Insurance 2012, 79, 751–783. [Google Scholar] [CrossRef]
- Li, Y.; Luo, Y. The contextual nature of the association between managerial ability and audit fees. Review of Accounting and Finance 2017, 16, 2–20. [Google Scholar] [CrossRef]
- Lim, H.J.; Mali, D. Do credit ratings influence the demand/supply of audit effort? Journal of Applied Accounting Research 2021, 22, 72–92. [Google Scholar] [CrossRef]
- Liu, X.; Li, B.; Zhang, S.; Yang, Z. Does the resignation of an independent director affect audit fees? An empirical study based on Chinese A-share listed companies. International Review of Financial Analysis 2024, 92. [Google Scholar] [CrossRef]
- Lowry, R. (2008). Concepts and Applications of Inferential Statistics. Vassar College.
- Lu, K.P.; Chang, S.T. Robust algorithms for multiphase regression models. Applied Mathematical Modelling 2020, 77, 1643–1661. [Google Scholar] [CrossRef]
- Lusa, L.; Ahlin, Č. Restricted cubic splines for modelling periodic data. PLoS ONE 2020, 15. [Google Scholar] [CrossRef]
- MacCallum, R.C.; Zhang, S.; Preacher, K.J.; Rucker, D.D. On the practice of dichotomization of quantitative variables. Psychological Methods 2002, 7, 19–40. [Google Scholar] [CrossRef] [PubMed]
- Marsh, L.C.; Cormier, D.R. (2001). Spline Regression Models. 137, Sage.
- Mayhew, B.W.; Wilkins, M.S. Audit firm industry specialization as a differentiation strategy: Evidence from fees charged to firms going public. Auditing 2003. [Google Scholar] [CrossRef]
- Meng, W.; Zhang, D.; Qi, L.; Liu, W. Two-level DEA approaches in research evaluation. Omega 2008, 36, 950–957. [Google Scholar] [CrossRef]
- Meyer, M.C. Inference using shape-restricted regression splines. Annals of Applied Statistics 2008, 2, 1013–1033. [Google Scholar] [CrossRef]
- Millar, P. (2011). OPTIFACT: Stata module to find the best-summated rating scale from a list of items. Statistical Software Components S449503, Boston College Department of Economics.
- Mitra, S.; Jaggi, B.; Al-Hayale, T. Managerial overconfidence, ability, firm-governance and audit fees. Review of Quantitative Finance and Accounting 2019, 52, 841–870. [Google Scholar] [CrossRef]
- Nataraja, N.R.; Johnson, A.L. Guidelines for using variable selection techniques in data envelopment analysis. European Journal of Operational Research 2011, 215, 662–669. [Google Scholar] [CrossRef]
- Okike, E. Management of crisis: the response of the auditing profession in Nigeria to the challenge to its legitimacy. Accounting, Auditing & Accountability Journal 2004, 17, 705–730. [Google Scholar] [CrossRef]
- Otusanya, J.O.; Lauwo, S. The role of auditors in the Nigerian banking crisis. Accountancy Business and the Public Interest 2010, 9, 159–204. [Google Scholar]
- Otusanya, O.J.; Lauwo, S.; Ajibolade, S.O. An investigation of corporate executive fraud by CEOs in the Nigerian banking sector. African Journal of Accounting, Auditing and Finance 2013, 2, 65–89. [Google Scholar] [CrossRef]
- Pardoe, I. (2020). Regression model building II. In Applied Regression Modelling. Wiley, 221–285. [CrossRef]
- Penrose, E. The theory of the growth of the firm. Long Range Planning 1996, 29, 596. [Google Scholar] [CrossRef]
- Perperoglou, A., Sauerbrei, W., Abrahamowicz, M., & Schmid, M. (2019). A review of spline function procedures in R. BMC Medical Research Methodology. [CrossRef]
- Porter, M.E. (1985). Competitive advantage: creating and sustaining superior performance. New York.
- Qin, J.; Li, M.; You, J.; Zhang, Z. Financial opening deepening, managerial ability, and corporate cost stickiness. Finance Research Letters 2024, 67, 105786. [Google Scholar] [CrossRef]
- Rönkkö, M.; Aalto, E.; Tenhunen, H.; Aguirre-Urreta, M.I. Eight simple guidelines for improved understanding of transformations and nonlinear effects. Organizational Research Methods 2022, 25, 48–87. [Google Scholar] [CrossRef]
- Royson, P.S.W. Multivariate modelling with cubic splines: A principled approach. Stata Journal 2007, 7, 45–70. [Google Scholar] [CrossRef]
- Saibu, M.O.; Bowale, K.E.I.; Akinlo, A.E. Financial structure and economic growth: Empirical evidence from Nigeria. International Journal of Business and Emerging Markets 2009, 1, 264–281. [Google Scholar] [CrossRef]
- Salehi, M.; Mousavi Shiri, M.; Hossini, S.Z. The relationship between managerial ability, earnings management and internal control quality on audit fees in Iran. International Journal of Productivity and Performance Management 2020, 69, 685–703. [Google Scholar] [CrossRef]
- Sewpersadh, N.S.; Dalwai, T. Managerial ability, intellectual property rights, R&D: does firm age play a role? Competitiveness Review: An International Business Journal 2024, 34, 61–87. [Google Scholar] [CrossRef]
- Shan, H.; Ko, D.; Wang, L.; Wang, G. (2024). Managerial ability, digital transformation and innovation efficiency: empirical evidence from Chinese manufacturing listed companies. Chinese Management Studies. [CrossRef]
- Shapiro, S.S.; Wilk, M.B. An analysis of variance test for normality (complete samples). Biometrika. 52 1965, 591. [Google Scholar] [CrossRef]
- Shelih, R.; Wang, L. The moderating effect of financial constraints on the relationship between stock price crash risk and managerial ability. International Journal of Accounting and Information Management 2024, 32, 122–146. [Google Scholar] [CrossRef]
- Simar, L.; Wilson, P.W. Estimation and inference in two-stage, semi-parametric models of production processes. Journal of Econometrics 2007, 136, 31–64. [Google Scholar] [CrossRef]
- Simar, L.; Wilson, P.W. (2008). Statistical Inference in Nonparametric Frontier Models: Recent Developments and Perspectives. In: The Measurement of Productive Efficiency and Productivity Change. Oxford University Press. [CrossRef]
- Simar, L.; Wilson, P.W. Two-stage DEA: Caveat emptor. Journal of Productivity Analysis 2011, 36, 205–218. [Google Scholar] [CrossRef]
- Simar, L.; Wilson, P.W. Statistical approaches for non-parametric frontier models: A guided tour. International Statistical Review 2015, 83, 77–110. [Google Scholar] [CrossRef]
- Simunic, D.A. The pricing of audit services: Theory and evidence. Journal of Accounting Research 1980, 18, 161. [Google Scholar] [CrossRef]
- Skinner, D.J.; Srinivasan, S. Audit quality and auditor reputation: Evidence from Japan. Accounting Review 2012, 87, 1737–1765. [Google Scholar] [CrossRef]
- StataCorp. (2023). Stata Statistical Software: Release 18. College Station, TX: StataCorp LLC.
- Vo, X.V.; Pham, T.H.A.; Doan, T.N.; Luu, H.N. Managerial ability and bank lending behaviour. Finance Research Letters 2021, 39. [Google Scholar] [CrossRef]
- Wang, J.; Ghosh, S.K. Shape-restricted nonparametric regression with Bernstein polynomials. Computational Statistics & Data Analysis 2012, 56, 2729–2741. [Google Scholar] [CrossRef]
- Wang, W.; Yan, J. Shape-restricted regression splines with R package splines2. Journal of Data Science 2021, 19, 498–517. [Google Scholar] [CrossRef]
- Wang, J.; Zhong, H.; Li, M. The effect of environmental credit rating on audit fees: A quasi-natural experiment from China. Heliyon 2024, 10. [Google Scholar] [CrossRef]
- Wilcoxon, F. Individual comparisons by ranking methods. Biometrics Bulletin 1945, 1, 80. [Google Scholar] [CrossRef]
- Wooldridge, J.M. (2018). Introductory Econometrics. Cengage Learning.
- Yang, G.; Zhang, B.; Zhang, M. Estimation of knots in linear spline models. Journal of the American Statistical Association 2023, 118, 639–650. [Google Scholar] [CrossRef]
- Yeboah, E.N.; Addai, B.; Appiah, K.O. Audit pricing puzzle: Do audit firm industry specialization and audit report lag matter? Cogent Business and Management 2023, 10. [Google Scholar] [CrossRef]
- Yung, K.; Chen, C. Managerial ability and firm risk-taking behaviour. Review of Quantitative Finance and Accounting 2018, 51, 1005–1032. [Google Scholar] [CrossRef]
- Yung, K.; Nguyen, T. Managerial ability, product market competition, and firm behaviour. International Review of Economics & Finance 2020, 70, 102–116. [Google Scholar] [CrossRef]
- Zaman, M.; Hudaib, M.; Haniffa, R. Corporate governance quality, audit fees and non-audit services fees. Journal of Business Finance and Accounting 2011, 38, 165–197. [Google Scholar] [CrossRef]
- Zhang, H.; Wang, J. Managerial ability, political risk and political spending disclosure. Meditari Accountancy Research 2024, 32, 1493–1526. [Google Scholar] [CrossRef]
Figure 1.
Conceptual Review.
Disclaimer/Publisher’s Note: The statements, opinions and data contained in all publications are solely those of the individual author(s) and contributor(s) and not of MDPI and/or the editor(s). MDPI and/or the editor(s) disclaim responsibility for any injury to people or property resulting from any ideas, methods, instructions or products referred to in the content. |
© 2024 by the authors. Licensee MDPI, Basel, Switzerland. This article is an open access article distributed under the terms and conditions of the Creative Commons Attribution (CC BY) license (http://creativecommons.org/licenses/by/4.0/).
Copyright: This open access article is published under a Creative Commons CC BY 4.0 license, which permit the free download, distribution, and reuse, provided that the author and preprint are cited in any reuse.


