
Submitted:
17 November 2024
Posted:
19 November 2024
You are already at the latest version
Abstract
We report the results of a zinc oxide (ZnO) low-power micro sensor for sub-ppm detection of NO2 and H2S in air at 200°C. NO2 emission is predominantly produced by combustion processes of fossil fuels while coal-fired power plants are the main emitter of H2S. Fossil fuels (oil, natural gas, and coal) combined contained 74% of USA energy production in 2023. It is foreseeable that the energy industry will utilize fossil-based fuels more in the ensuing decades despite the severe climate crises. Precise NO2 and H2S sensors will contribute to reduce the detrimental effect of the hazardous emission gases in addition to the optimization of the combustion processes for higher output. Fossil fuel industry and the Solid-oxide fuel cells (SOFCs) are exceptional examples of energy conversion-production technologies that will profit from advances in H2S and NO2 sensors.
Porosity and surface activity of metal oxide semiconductors (MOS) based sensors are both vital for sensing at low temperatures. Oxygen vacancies (V_O^(••)) act as surface active sites for target gases, while porosity enables target gases to come in contact with a larger MOS area for sensing. We were able to create an open porosity network throughout the ZnO microstructure and simultaneously achieve an abundance of oxygen vacancies by using a heat treatment procedure. Surface chemistry and oxygen vacancy content in ZnO were examined using XPS and AES. SEM was used to understand the morphology of the unique characteristics of distinctive grain growth during heat treatment. Electrical resistivity measurements were completed. Valance band was examined by UPS.
Engineered Porosity approach allowed the entire ZnO act as an open surface together with creation of abundant oxygen vacancies (V_O^(••)). NO2 detection is challenging since both oxygen (O2) and NO2 are oxidizing gases and they coexist in combustion environments. Engineered porosity ZnO micro sensor detected sub-ppm NO2 under O2 interference affect mimicking realistic sensor operation conditions. Engineered Porosity ZnO performed better than previous literature findings for H2S and NO2 detection. The exceptionally high in sensor response attributed to the high number of oxygen vacancies (V_O^(••)) and porosity extending through the thickness of the ZnO with high degree of tortuosity. These features enhance gas adsorption and diffusion via porosity leading to high sensor response.
Keywords:
Hydrogen sulfide (H2S)
; Nitrogen dioxide (NO2)
; Sensor
; Oxygen Vacancy
; Adsorbed Oxygen
; XPS
; Tortuosity
; AES
; SOFCs
; Electrical Resistance
; Surface Chemistry
; Zinc Oxide
1. Introduction
Fossil fuel usage has risen dramatically, about eightfold since the 1950s and approximately doubling since the 1980s. Fossil fuels have been fundamental to building industrialized societies worldwide and accumulation wealth. In contrast, their detrimental effects on environment, human health, and the climate suggest that we must move away from them. Despite obviously the worst climate crises across the globe affecting everyday life severely, it is apparent that the energy industry will utilize fossil-based fuels more in the coming decade [1].
We have witnessed record utilization of wide range of fossil-based energy sources after the industrial revolution. In 2019, the production output of oil and petroleum reached a record high. Similarly, natural gas plant liquids (NGPL) production has been rising steadily since 2005 and reached a record high in 2023. Renewable energy output in 2023 was about 9%. The contribution of coal to total U.S. energy output has declined from 37% in 1950 to 9% in 2023, equalizing it to the total renewable contribution in the same year. The anticipated upsurge in the accumulation of hazardous emissions (H2S and NO2) into the environment places greater importance on the environmental and operational concerns associated with hydrocarbon management and energy production-conversion in the near term. The major energy production in the USA by source is as follows; natural gas 36%, oil 38% followed by coal 9%. Fossil fuels (oil, natural gas, and coal) retained 78% of energy production in 2017 which increased to 83% in 2024, while renewable energy is only 9% of the total output [2,3,4].
One of the main drivers of the gas sensor market’s rapid growth is the need to monitor environmentally hazardous gases [5]. Gas sensors for pollutants and toxic gases such as nitrogen dioxide (NO2) and hydrogen sulfide (H2S) receive significant attention to safeguard human health, nature, and habitat [6,7]. These sensors are also used to optimize various energy production-conversion, regulate exhaust emissions and desulphurization [8]. The NO2 and H2S are principal air pollutants causing harm to ecosystem balance, destroying the stratosphere’s protective ozone layer, and accelerating deforestation. NO2 is easily oxidized to nitric acids. H2S is also infamously known to be used as a chemical warfare agent during WW2 [9,10,11,12]. The primary and secondary exposure limits for NO2 is 1 ppm arithmetic mean annual concentration, while it is for H2S 5 ppm [13].
NO2 and H2S emissions are primarily produced by the combustion of natural gas, oil, and coal in refineries, process furnaces, fluid catalytic cracking (FCC) regenerators, electric power plant boilers, gas turbines where they are converted into serviceable products for energy production-conversion for commercial and residential use [14,15,16]. 65% of total NO2 emission is produced by human activity stemming from combustion processes such as; cars, ships, airplanes, petroleum refineries, industrial processes, and power plants. Handling H2S and NO2 is challenging at every phase of hydrocarbon including production, purifying, and transport. Emission control has become a major challenge due to the increased utilization of fossil fuels by both developing and developed nations [17,18,19,20,21,22].
Solid oxide fuel cells (SOFCs) are promising energy production conversion industry due to their low-carbon footprint without hazardous exhaust emissions such as H2S and NO2 [23]. SOFCs can utilize a variety of renewable, environmentally friendly inexpensive fuel sources such as natural and landfill gases, coal syngas, biomass, sewage, municipal, and green wastes. Considering the composition of the fuels, the emission of the following hazardous gases is anticipated; NO2 and H2S.
The Ni-based (nickel oxide) composite is the most common anode material for SOFCs; however, the just-mentioned gases found in fuel sources cause degradation of SOFCs by poisoning the Ni-based anode. As a result, the energy conversion-production industry as well as green energy production initiatives will greatly benefit from real-time monitoring of H2S and NO2 concentration to regulate/maintain optimal fuel utilization. In addition to that, safe-guarding environmental protection will be in place without expensive and cumbersome regulations-filtering-testing requirements [17,18,24,25].
H2S detection is realized by the following MOS-based gas sensors; WO3, CeO2, SnO2, ZnO, CuO, platinum and palladium oxides, Fe2O3, In2O3, TiO2, CdO [5,26,27,28,29]. WO3 and SnO2 lacked stability and showed cross-sensitivity in addition to a requirement for high temperature (>300°C). Table 2 provides literature findings for H2S sensors, materials, and performances together with results obtained in our current work. Liewhiran et al. used SnO2 for H2S sensing at 300°C, the sensor response (S) was 8 for 10 ppm H2S [30]. Some mixed-modified unconventional materials were investigated for H2S at lower temperatures. Fe2O3-Fe2(MoO4)3 showed high sensitivity for H2S at 225°C. La0.7Pb0.3Fe0.4Ni0.6O3 and CdIn2O4 did not exhibit sufficient sensing at a temperature range of 100-350°C. Varying ferrites were also tried but the magnitude of sensitivity was in the range of 0-10% resistivity change between 100-400°C [31,32,33,34]. Kersen utilized Fe2O3 with Fe2(MoO4)3 thick oxide films for 1, 10 and 20 ppm of H2S at 225°C [5,34]. Sun et al. utilized carbon nanotube templated hematite (α-Fe2O3) against 10 ppm H2S at 130°C [29]. Chaudhari et al. concluded that TiO2 with 5 wt.% Al2O3 and 0.5 wt% Pd increased the sensor response (S) up to 0.8 at 250°C for 200-1000 ppm of H2S, while beyond 350°C a step decrease was detected in sensor response [35,36]. Ciftyurek et al. attributed this detrimental decrease to the abrupt desorption of chemisorbed oxygen species after 350°C by showing a sudden drop in the amount of chemisorbed oxygen species by using photoelectron techniques [37,38]. Shirsta et al. reported on polyaniline nanowires decorated with gold nano-particles for the detection of H2S at 25°C [39].
NO2 detection materialized through mainly ZnO, WO3, TiO2, SnO2, In2O3, V2O5, and NiO. Numerous synthesis/deposition approaches such as sputtering, spray pyrolysis, atomic layer deposition (ALD), chemical vapor deposition (CVD), physical vapor deposition (PVD), sol-gel, spray pyrolysis, hydrothermal technique have been utilized to produce ZnO sensor in pure or doped-alloyed forms within various multi-component heterostructures for NO2 sensing Cai et al. used gold (Au) doped ZnO nanowires activated via ultraviolet light (UV) that produced a 2.3 sensor response to 1 ppm of NO2 25°C [40]. ZnO equipped with reduced graphene oxide (rGO) detected NO2 at 110°C [41]. Doping ZnO with Ni showed 108% increase in electrical resistance against 100 ppm NO2 at 200°C [42]. Au-polyaniline/ZnO nano-composite showed a sensor response of 21 against 50 ppm of NO2 at 300°C [43]. Table 2 provides literature findings for H2S and NO2 sensors, materials and performances together with results obtained in our current work. Mai et al. reported on ALD deposited 50 nm thick ZnO sensor for NO2 sensing at 330°C without any oxygen interference but the sensor response was fairly low due to the confined-densely packed microstructure of ZnO and lower concentration of oxygen vacancies () [44]. In other words, this low sensor signal is the outcome of a lack of porosity-tortuosity due to the jam-packed grain structure on the ZnO surface. This densely packed microstructure decreases the both effective ZnO surface area that come in contact with NO2 and target gas penetration through the thickness of the ZnO.
ZnO thin films have been a dynamic field of research and application due to their applications in electronics, biomedicine, sensing applications, transducers, optoelectronics, and catalysts since the 1960s. ZnO is a direct, wide-band gap metal oxide semiconductor (MOS). The most standard utilization form of ZnO is its polycrystalline form. ZnO has direct band gap energy of 3.37 eV. ZnO has a hexagonal lattice and is made up of two interconnecting sublattices of Zn2+ and O2− in wurtzite crystal symmetry such that each O2- ion is enveloped by tetrahedra of Zn2+ ions. This architecture’s large piezoelectric and pyroelectric properties result from missing the center of symmetry [45].
Metal oxide semiconductor (MOS) based sensors are the most frequently used gas sensors, due to their straightforward operation principle with high sensitivity, compatible with inexpensive mass fabrication approaches such as screen printing and MEMS. Conversely, MOS sensors suffer from high energy consumption due to high working temperature which is required for the generation-activation of chemisorbed oxygen species. The oxygen species are essential for gas sensing in metal oxide-based sensors. Adsorption of molecular oxygen via chemisorption and dissociation onto stoichiometric metal oxide surfaces is not possible while both are readily feasible on non-stoichiometric metal oxide surfaces [37,38,46].
In our current work, we selected ZnO due to its easiness to integrate desired surface physical and chemical features at lower temperatures. By design, we are aiming to have proper surface chemistry promoting to accommodate a high amount of chemisorbed oxygen species in addition to desired surface texture-porosity facilitating gas diffusion through porosity network open to the external surface. The creation of more active oxygen species such as (,) is favorably associated with the ZnO surface activity. Oxygen vacancy sites () function as dissociative centers to convert oxygen molecules into to desired oxygen species (,).
We remarkably improved the sensor response of ZnO at lower temperatures using defect chemistry and sintering principles. By creating an open microstructure for gas diffusion and oxygen vacancy abundance on the ZnO surface, we were able to increase the effective surface area and tortuosity of ZnO and enhance the catalytic sensing reactions required for sensing to be realized at lower temperatures. In this work, we created oxygen vacancy-abundant high porosity ZnO by heat treatment leading to controlled coarsening of ZnO nano-sized grains under low temperature sintering conditions applied.
The gas sensing mechanism and sequence were explained based on electrical and surface chemistry measurements. The microstructural characterization was completed through SEM analysis. Surface chemistry of ZnO and stoichiometry analysis for the oxygen vacancy () concentration were realized through AES, XPS, and UPS measurements. NO2 detecting in combustion environments such as an automobile exhaust is challenging because of coexistence of O2 and NO2 in combustion processes, this is because we utilized oxygen (O2) gas together with NO2 throughout the sensor tests to realize realistic testing conditions.
The H2S and NO2 detection using MOS at low temperatures with high sensor response without an expensive catalyst and/or other cumbersome modification techniques is very challenging. In our work, we developed Engineered Porosity approach leading ZnO with high porosity and tortuosity together with abundant oxygen vacancies () that enabled NO2 and H2S sensing at 200°C with an extraordinarily high sensor response. We developed a micro gas sensor architecture based on Engineered Porosity ZnO with high tortuosity and abundant oxygen vacancies.
2. Experimental
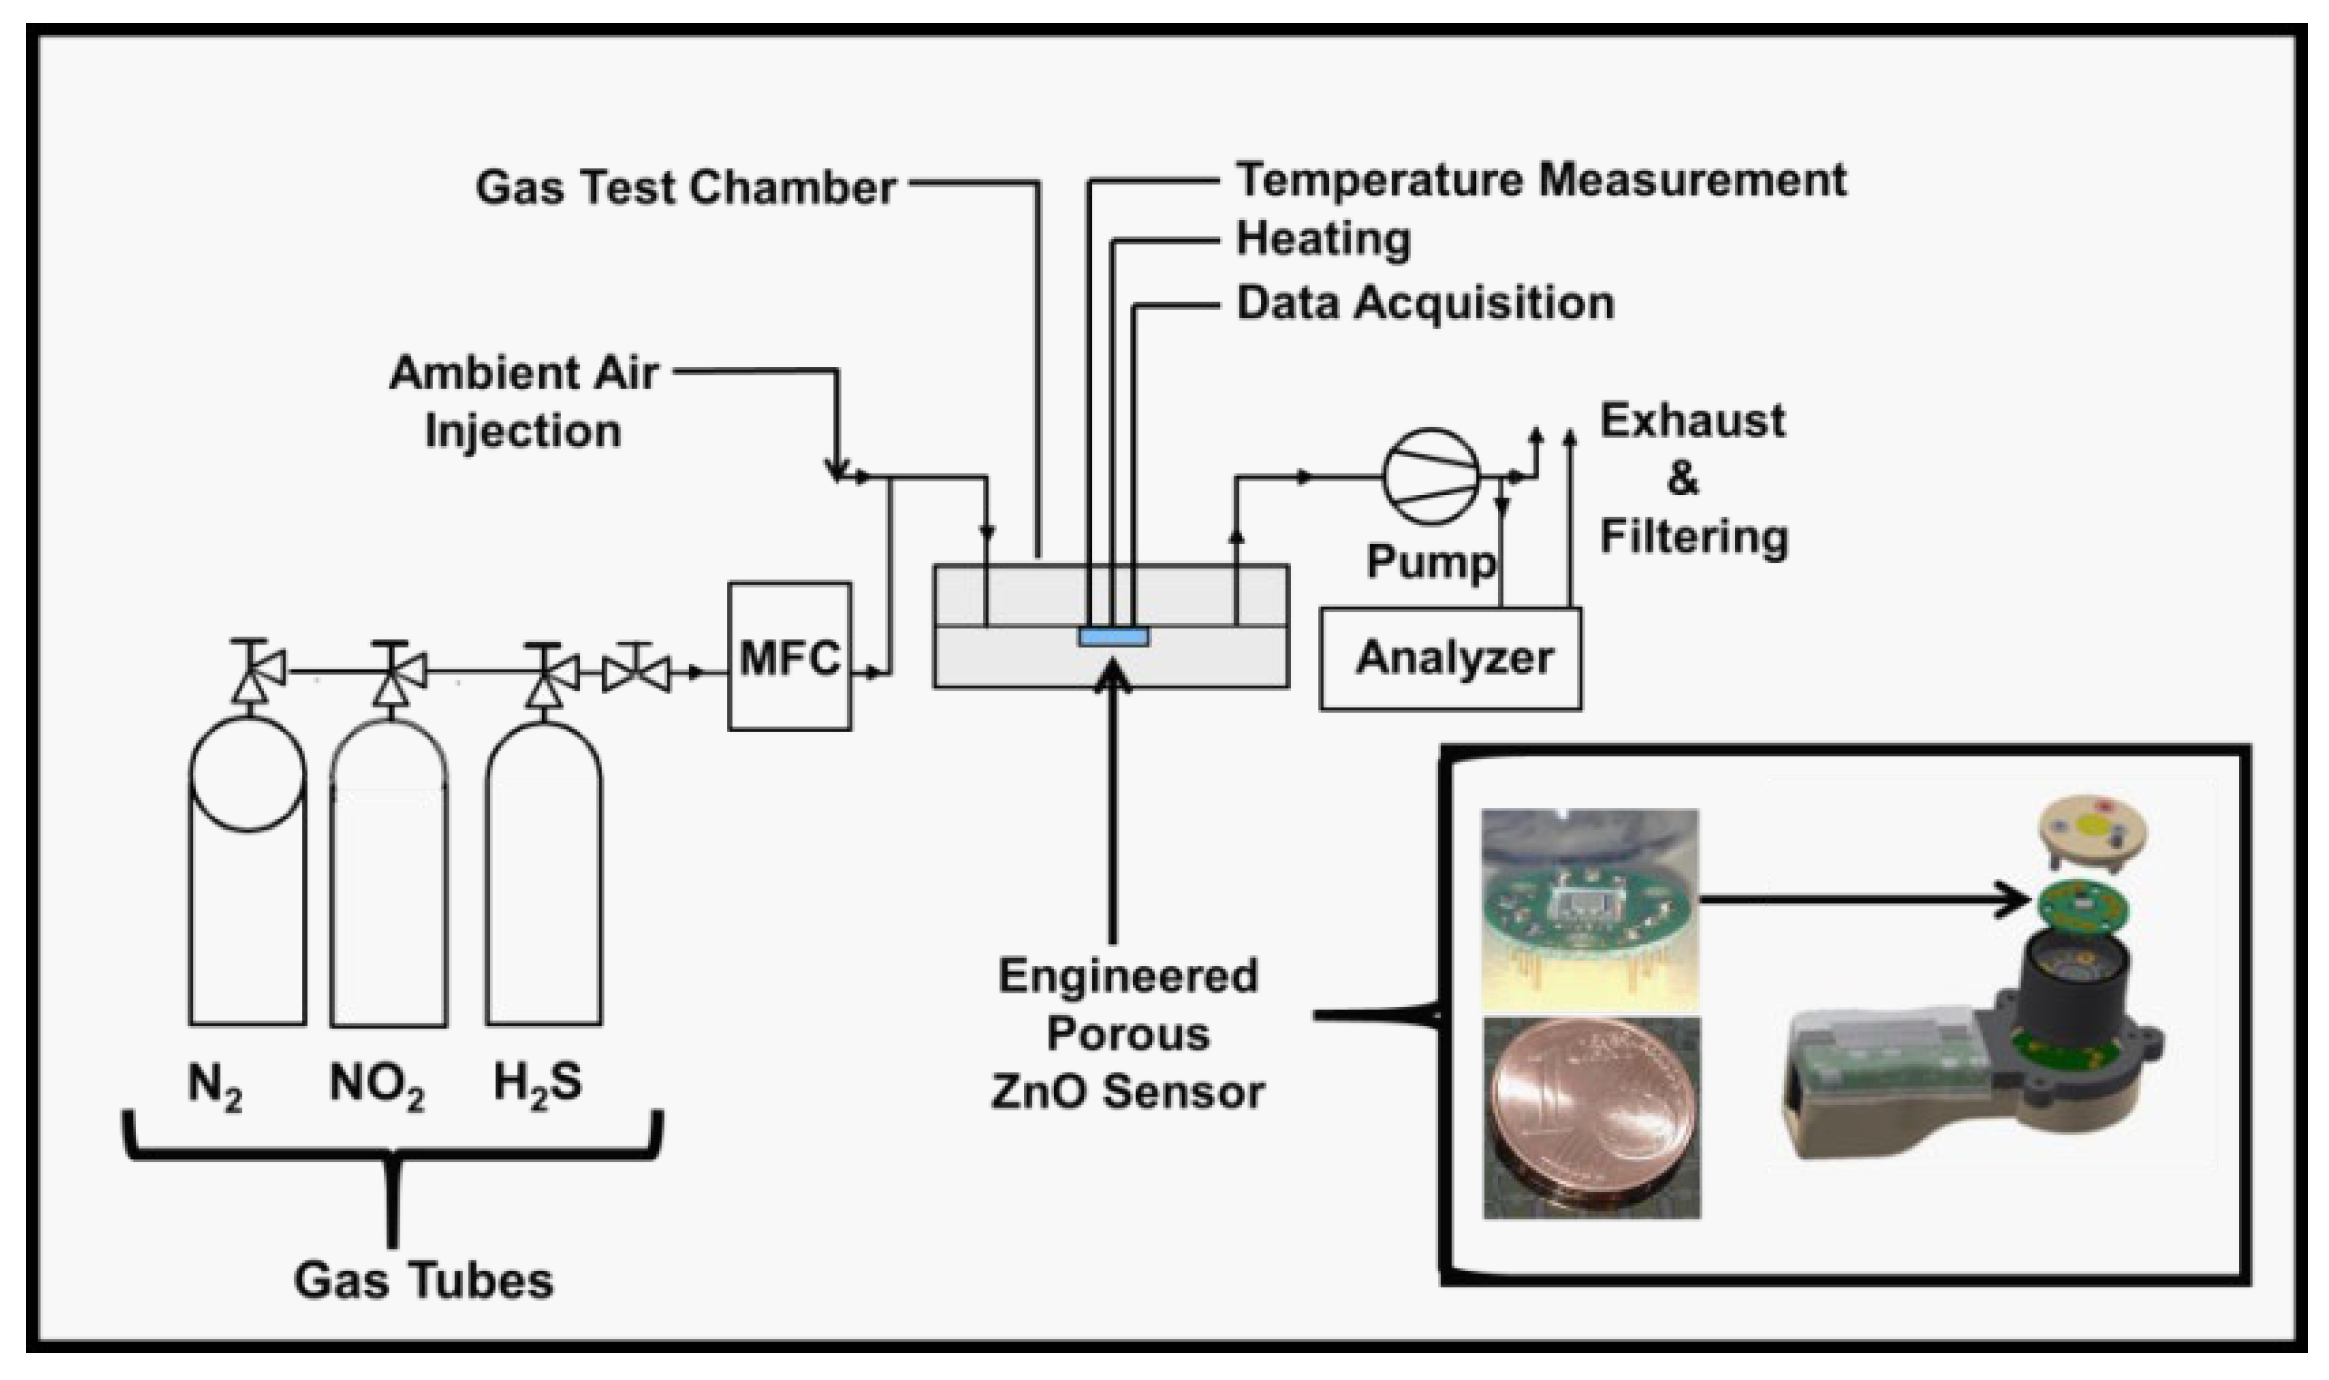
The ZnO was deposited over sapphire (Al2O3) substrates at 30 nm thickness. The sensor head shown in Figure 1 contained an integrated platinum (Pt) heating element and Pt-1000 heat sensor. The ZnO was characterized by vdP, XPS, UPS, AFM, and SEM. An in-house designed 4-point probe used for van der Pauw (vdP) electrical resistivity measurements between 25–350°C. The data acquisition was completed with National Instruments (NI, TX, USA) PXIe-1071 digital multimeter (DMM). The XPS and UPS investigations were accomplished using Material Science Beamline (MATLINE) at ASTRID2 synchrotron facility. The spectra for all elements are referenced to Au 4f7/2 at 84.00 eV and Fermi level corrections are applied. The samples were not sputter cleaned before analysis to avoid misguiding results, as it is well known that sputter cleaning causes reduction of metal oxides or preferential sputtering of surface adsorbed species. The sensor tests were carried out with H2S and NO2. The sensor response (S) for reducing gas H2S is defined as the ratio of Rair/Rgas, while the response for oxidizing gas NO2 is defined as Rgas/Rair, in which Rgas is the electrical resistance of ZnO sensor in the air while Rgas is electrical resistance upon exposure to reducing (H2S) or oxidizing (NO2) gas. Figure 1 shows the details of the sensor architecture and gas testing setup. The test gases were mixed from the ultra-high purity compressed gas bottles using mass flow controllers. For H2S testing, 0.2 ppm to 2.25 ppm H2S pulses were diluted in high-purity nitrogen (NO2) carrier gas. NO2 tests were carried out between 3 ppm to 15 ppm NO2 carried in N2 under intentional interference of 4.5 to 18 ppm oxygen (O2). For H2S and NO2, 30 and 15 min. pulses were realized.
3. Result
3.1. Conception and Creation of Engineered Porosity ZnO with Oxygen Vacancies ()
ALD makes use of low deposition temperature for metal oxides resulting in fine grain size with low surface roughness and limited porosity which all severely reduces surface area. Because of their limited porosity, metal oxides produced by the ALD technique have hardly any gas adsorption sites in as deposited state. From the perspective of gas sensor designer adsorption of oxygen species (,) on MOS is crucial for gas sensing action. The sensing performance of MOS sensor can be improved by generating more gas adsorption sites, creating more oxygen vacancies (), and boosting the surface catalytic activity.
These objectives can be accomplished in a variety of ways, including surface alloying, nano-composite formation, ion bombardment, precious metals additives, and nano-size texturing. In order to create limited grain coarsening and grain growth on the ZnO surface that increases the open porosity network, surface area, and vacancy abundance, we used a unique heat treatment technique in our work.
Grain-to-grain contact and coarsening can reduce the total surface area and minimize the thin film’s total interfacial and surface energy [18,47,48,49,50,51,52,53,54,55]. This work will primarily concentrate on the development of coarsening and grain growth through the distinct control of a sufficient grain-to-grain to contact with high-level porosity network through the ZnO film thickness. We created Engineered Porosity ZnO enriched with oxygen vacancies to have inter-grain contacts without extensive necking thus having a large porosity network with vast tortuosity. Fine homogeneously distributed and interconnected porosity established throughout the material which is crucial for target gas distribution pathways and essential to expanding the contact area between sensing material ZnO and porosity interface.
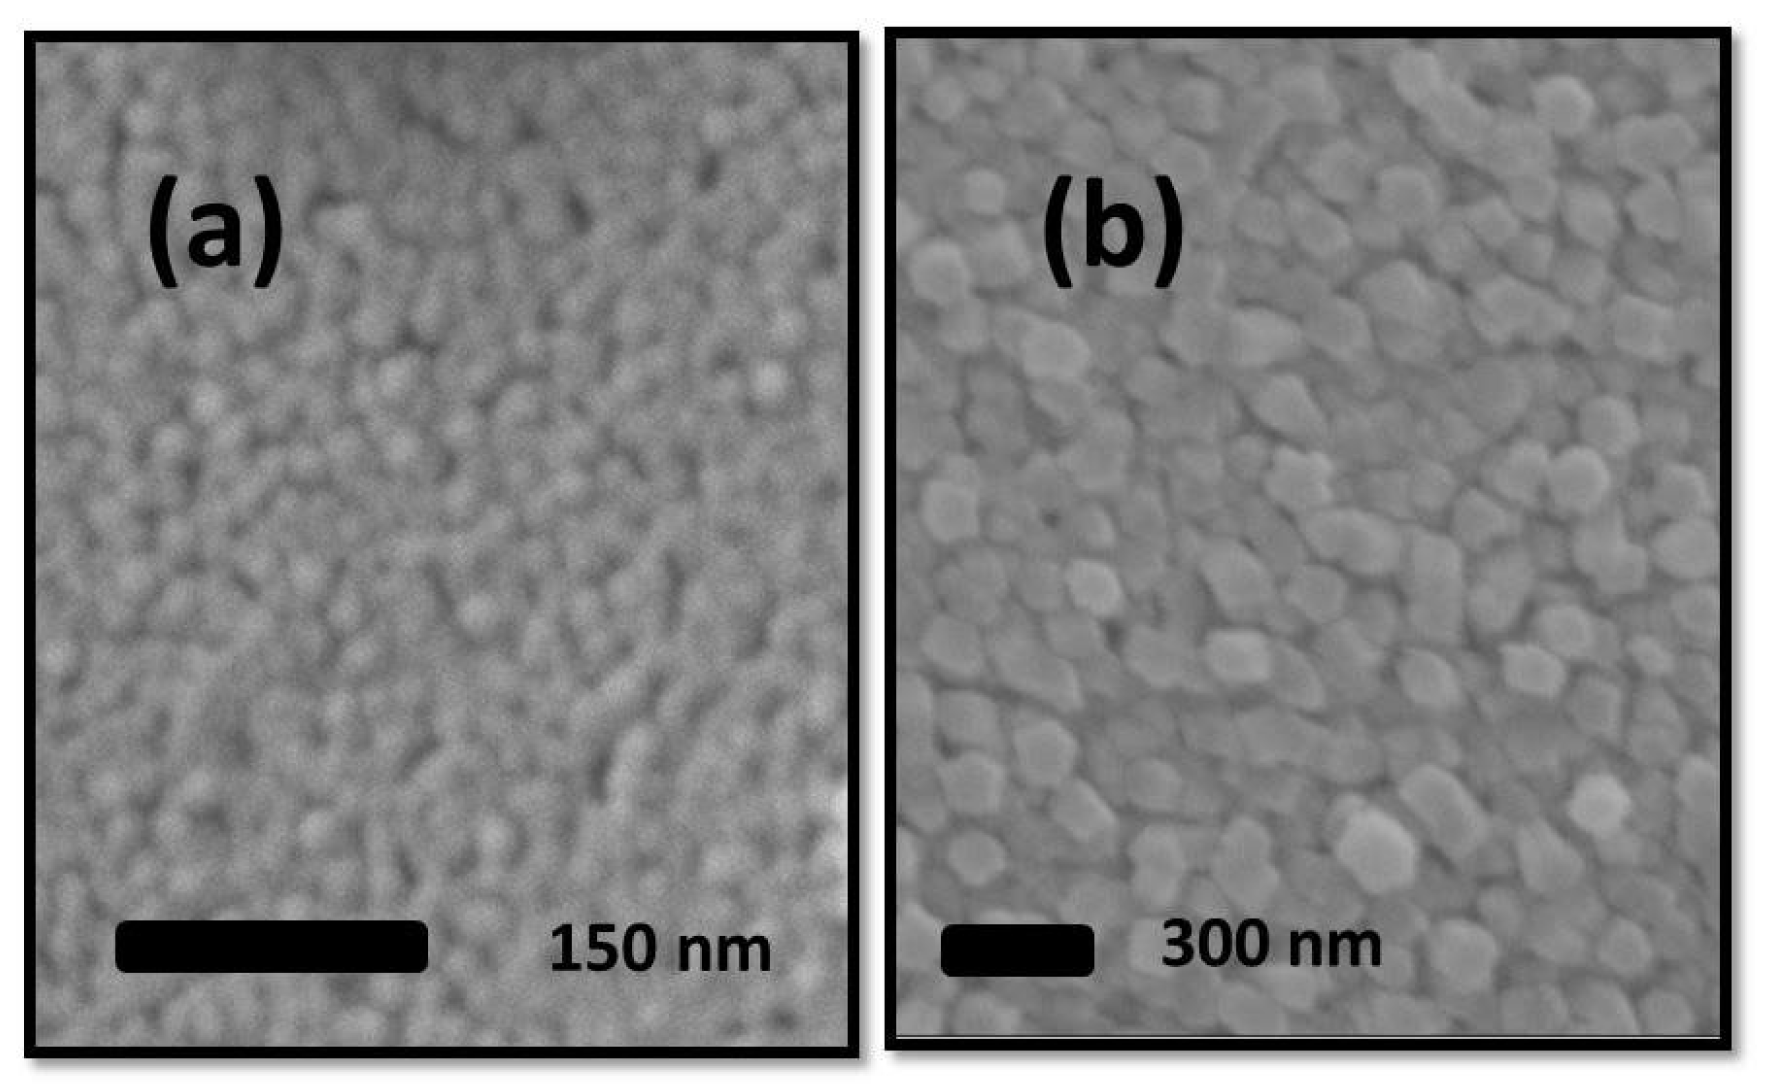
3.2. ZnO Microstructure Analysis
ZnO was deposited to a thickness of ~30 nm, with a grain size of ~15 nm. Figure 2-a shows the as deposited state of the ZnO; a poorly percolated ZnO microstructure maintains low tortuosity throughout the polycrystalline thin film. Low-level grain coalescence is the result of granular microstructure produced by low-temperature sputtering and evaporation thin film deposition techniques. The thin films having nano-size grains maintain high driving force for grain growth and coarsening.
As shown in Figure 2-b, a vermicular-shaped ZnO microstructure with an average grain size of ~100 nm was produced in our work following 4 hours of annealing at 300ºC. The SEM micrograph also demonstrates how the annealing of ZnO formed a structure that included more porosity, tortuosity and clearly visible ZnO grains. In contrast to materials with larger grain sizes, the thermodynamic stabilization of surface area minimization is the driving force behind the unique features of grain growth/coarsening during the sintering of nano grain-sized ZnO.
High-level of gas adsorption sites and a fine and homogeneous granular structure are achieved. Heat treatment that resulted in grain coarsening greatly expanded the gas diffusion pathways. It is crucial to note that ZnO coarsening resulted from grain boundary migration, and that the grain boundaries did not impede the grain coarsening because they also co-occurred with the reduction-induced creation of oxygen vacancies.
Figure 2.
30 nm thick ZnO; SEM micrograph (a) before heat treatment (b) after heat treatment at 300°C for 4 hours.
Figure 2.
30 nm thick ZnO; SEM micrograph (a) before heat treatment (b) after heat treatment at 300°C for 4 hours.
A high degree of tortuosity resulted from the controlled sintering/coarsening process, which simultaneously increased porosity and grain boundaries. Section 3 will go into detail about the chemistry of gas adsorption sites. The heat treatment led to the abundance of oxygen vacancy concentration on the surface, together with well-defined gas diffusion pathways with high tortuosity. Both produce ideally perfect gas sensing conditions.
3.3. Zinc oxide (ZnO) Electrical Resistance Investigation
Normally, ZnO maintains a small amount of oxygen deficiency. This makes ZnO transition metal oxide oxygen deficient n-type semiconductor with a typical electrical resistivity of 0.01-3 Ω•m at room temperature [58,59,60,61]. The substantial deviances among the reported electrical resistivity values in the literature are linked to diverse deposition systems and/or post-deposition treatment resulting in different microstructures, stoichiometries, and surface properties. Oxygen deficiency, in other words, oxygen vacancies has a strong effect on the electrical, chemical and sensory properties of the ZnO. The oxygen vacancies and oxygen deficiency were investigated and examined using UPS and XPS in the next two sections.
Figure 3.
Electrical resistivity measurement for 30 nm thick ZnO film from 25°C to 350°C.
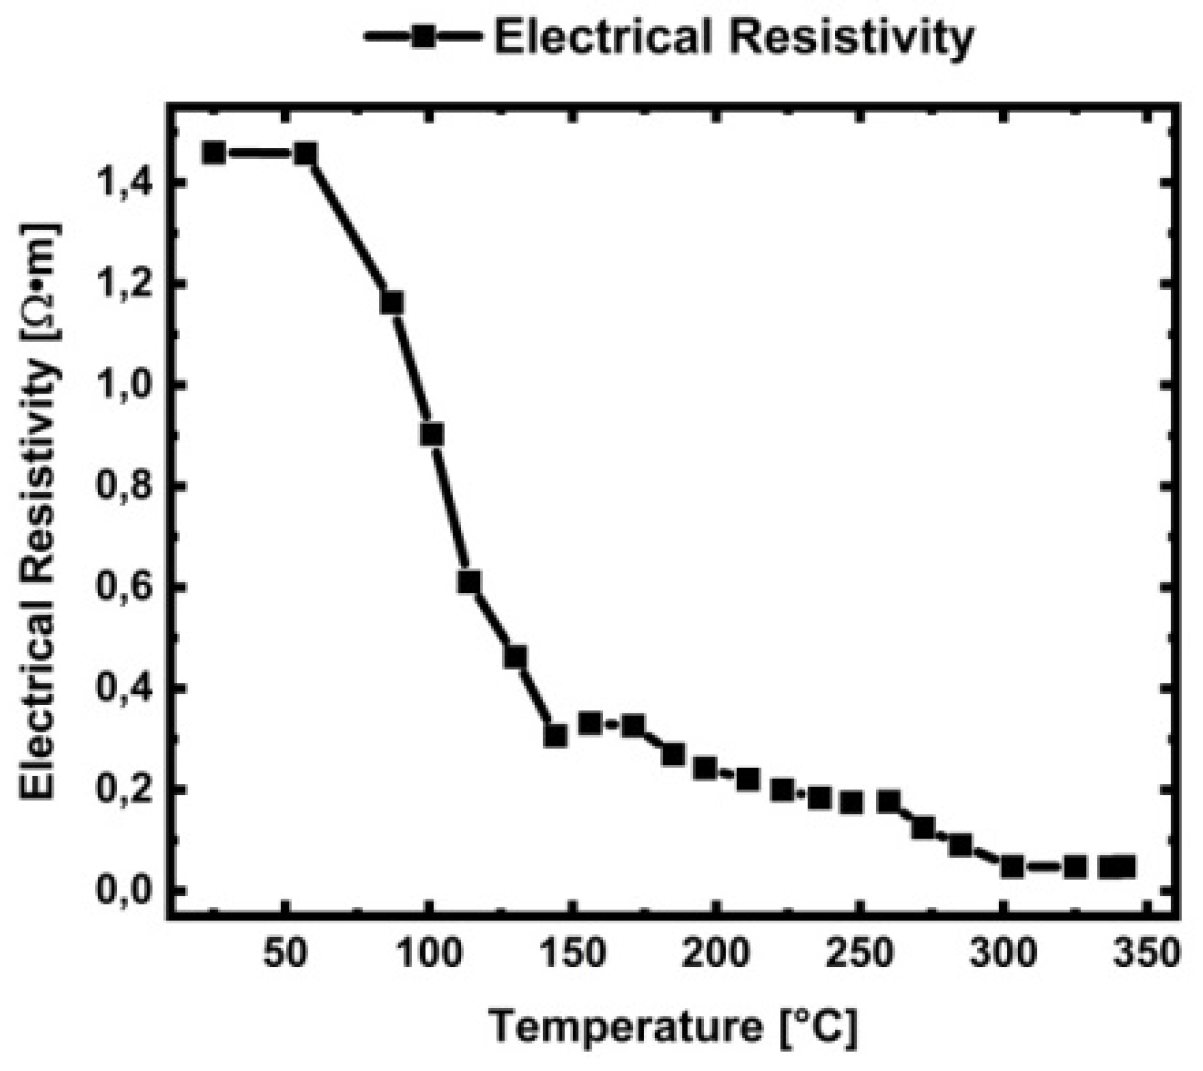
Error! Reference source not found. displays the resistivity values of the 50 nm thick ZnO thin film. The electrical resistivity as a function of temperature was measured under environmental conditions in the 25-350°C temperature range. An increase in temperature continually reduced the resistivity values for ZnO thin film. The resistivity at room temperature (25°C) was 1.45 Ω•m, and it showed a sharp decrease, down to 0.30 Ω•m at 140°C. When the temperature was raised to 150°C, the resistivity decrease rhythm slowed. Due to lattice uptake of adsorbed oxygen, some of the oxygen vacancies ( on the surface were annealed, causing a slight decrease after 200°C.
3.4. ZnO Valence Band Investigation
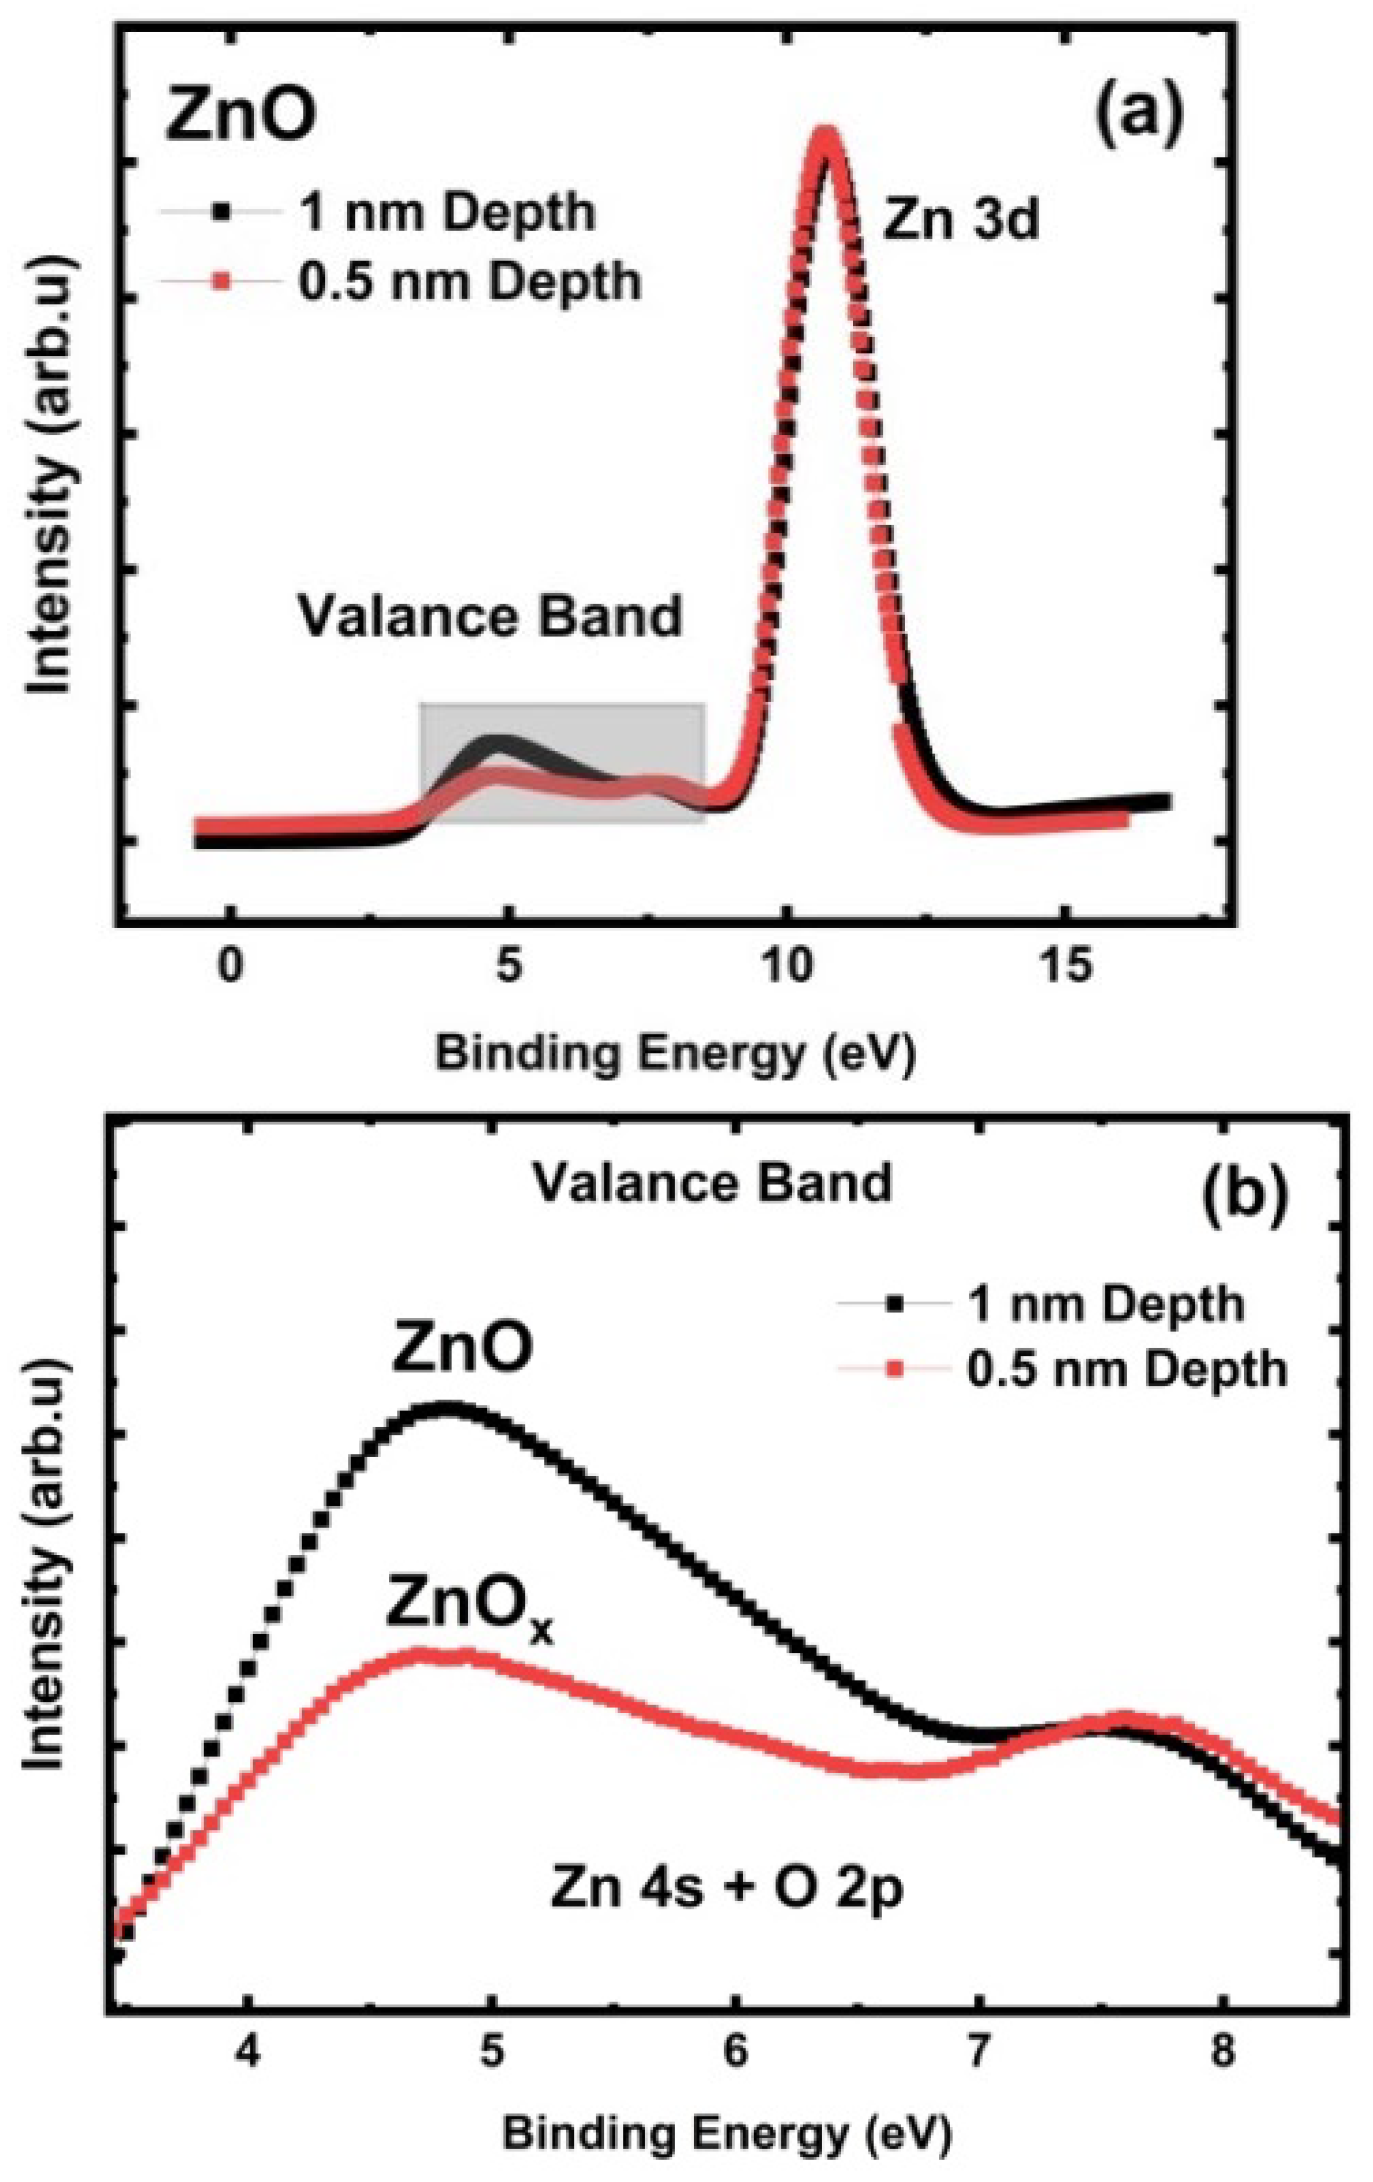
The Zn 4s valance electrons form a bond with the oxygen (O) 2p valance electrons in ZnO, where Zn ions are in tetrahedral coordination with O ions. The bonding between Zn and O ions is ionic, owing to the large variance in their respective electronegativity; as Zn possesses 1.65 while O has 3.44. We measured the ZnO valance band with 150 and 300 eV excitation X-ray photons to probe the surface (0.5 nm depth from the surface) and subsurface areas (1 nm depth from the surface) independently.
Figure 4 shows the valance band region of ZnO in the vicinity of the Zn 3d peak. Figure 4-a shows Zn 3d and valance band region together with distinct bordering. The valence band is represented by Zn 4s-O 2p blended states near 3-8.5 eV while Zn 3d is observable near 10.7 eV. The broad features of the Zn 4s-O 2p valance band suggest that surface stoichiometry is highly influenced by the high amount of oxygen vacancies (.
At 1 nm depth measurement, the valance band shows defect-free features of fully stoichiometric ZnO. A decrease in the occupation of the Zn 4s+O 2p blended states from 1 nm to 0.5 nm depth measurements indicates an increase in the concentration of surface oxygen vacancies. At 0.5 nm measurement depth; oxygen vacancies (were observed in the valance region as they gave rise to a perturbation around 7-8 eV at the same time causing a decrease in the intensity around 4-7 eV region.
As seen in Figure 4-b, the deeper measurement (1 nm depth, black colored) confirmed the stoichiometric ZnO phase. However, 0.5 nm (red colored) depth measurement showed the dominant existence of oxygen vacancy ( rich ZnOx phase on the surface. The intensity of Zn 4s+O 2p blended state decreased from ZnO to ZnOx thus showing the outer surface is dominated by reduced-oxygen deficient-oxygen vacancy rich ZnOx phase.
Figure 4.
Engineered Porosity ZnO; 1 nm and 0.5 nm depths from the surface (a) Valance band and Zn 3d regions together (b) Enlarged view of the valence band region; Zn 4s+O 2p blending feature.
Figure 4.
Engineered Porosity ZnO; 1 nm and 0.5 nm depths from the surface (a) Valance band and Zn 3d regions together (b) Enlarged view of the valence band region; Zn 4s+O 2p blending feature.
3.5. ZnO Auger Peak (AES) Analysis for Stoichiometric Understanding
AES has larger chemical shifts than XPS core-level shifts, so it allows chemical state analysis in cases that are unlikely for XPS [59]. Determination of the oxidation state of zinc (Zn) will contain significant uncertainties if it is solely based on XPS analysis of zinc (Zn) 2p photoelectron line. In the best scenario, Zn 2p demonstrates a minor shift of ~0.2 eV in the binding energy between zinc (Zn) metal and fully oxidized ZnO; in most of the cases, there is a strong overlap [62]. The binding energy for Zn 2p3/2 for Zn metal and ZnO are 1021.7 eV and 1021.9 eV, respectively [63,64]. Due to this slight shift in fully oxidized ZnO and Zn metal; perform quantitative-qualitative peak analysis and determination of the oxidation state of Zn based XPS 2p analysis is very challenging. To overcome this obstacle; we proposed to utilize AES in conjunction with XPS.
In situations where XPS is unable to identify the chemical state, a shift of about 4 eV in the Auger peaks distinguishes Zn metal from ZnO. AES is an effective surface sensitive technique capable of probing down to 1 nm depth below the surface. Using the Auger line L3M45M45, a precise chemical state analysis of ZnO was performed. AES peaks are historically represented in the electron kinetic energy scale [65]. Figure 2 shows L3M45M45 position for ZnO. According to published reports in the literature, L3M45M45 values for in ZnO range from 987 eV to 989 eV. In contrast, L3M45M45 for metallic Zn ranges from 992 eV to 993 eV. Table 1 provides the bulk of the XSP and AES reported literature along with our findings for ZnO.
Figure 5.
ZnO L3M45M45 position with 1147 eV excitation x-ray photons.
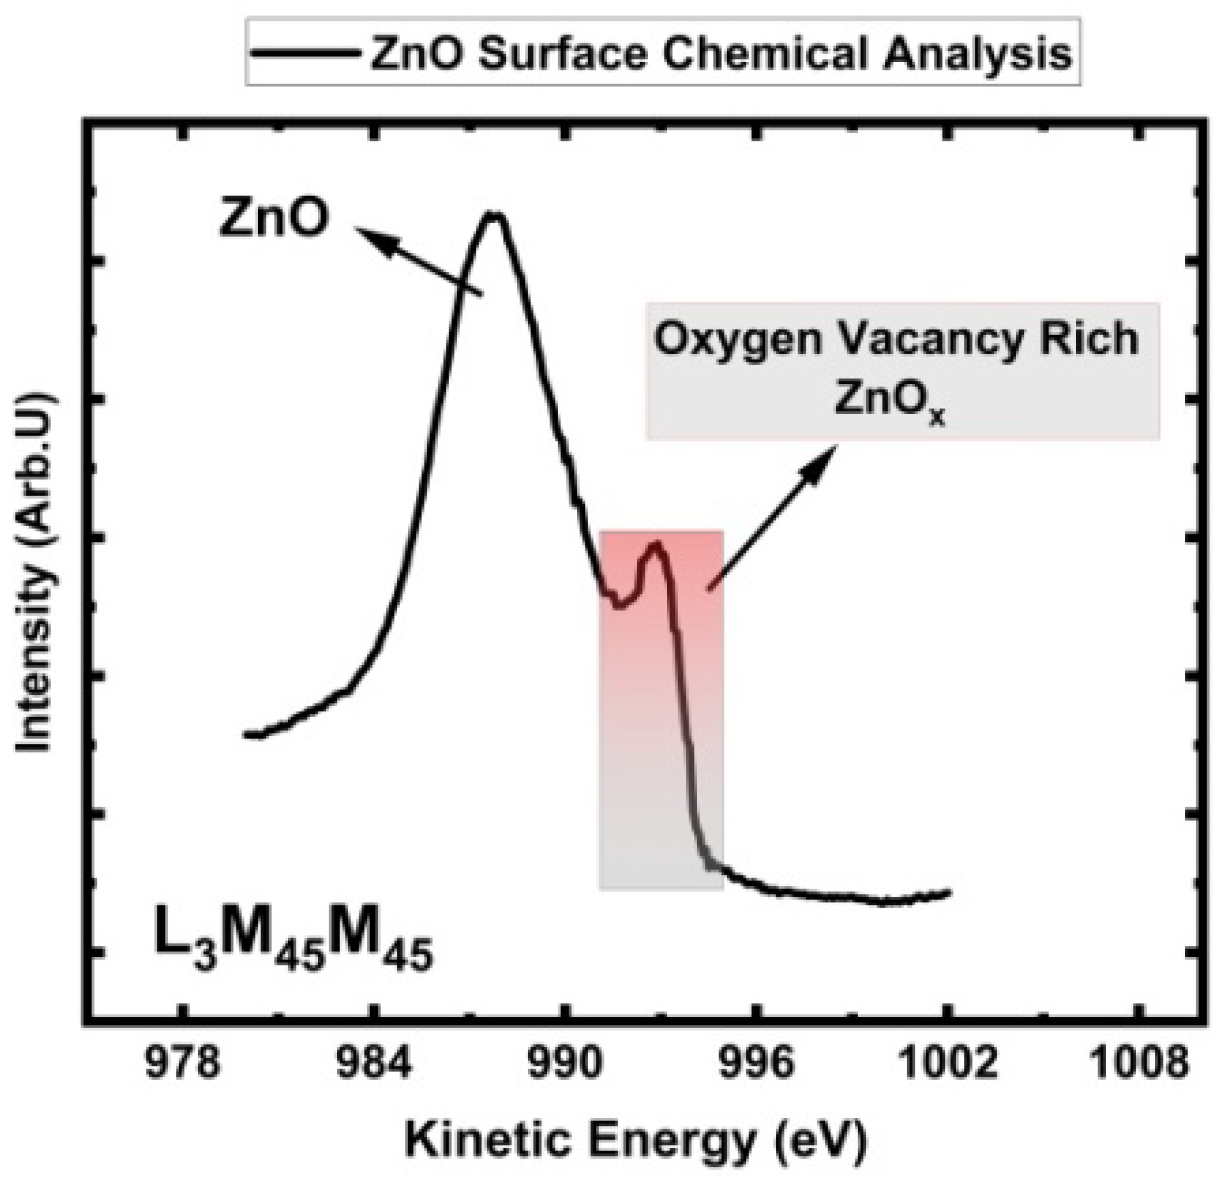
We report 987.9 eV for zinc oxide (ZnO) L3M45M45. On the other hand, in the Figure 2, we propose that the shoulder seen on the higher kinetic energy site located at 992.3 eV presents ZnOx. ZnOx phase contains large amounts of oxygen vacancies and this is because it showed up in the similar region that metal Zn reported in the literature. Thanks to a larger kinetic energy separation between ZnO and ZnOx; the shoulder strongly confirmed the existence of oxygen vacancy ( rich zinc oxide (ZnOx) as a minority phase within the measurement depth of 1 nm. The amount of the corresponding phases will be calculated from the XPS measurements presented in the following section. We showed that the outer ZnO surface is covered by oxygen vacancy rich ZnOx phase.

Table 1.
Core Level XPS and AES Literature findings for ZnO in comparison with our measurement results.
Table 1.
Core Level XPS and AES Literature findings for ZnO in comparison with our measurement results.
| Electron Level | Zn 3s in ZnO |
Zn 3p1/2 in ZnO | Zn 3p3/2 in ZnO | Zn 3d in ZnO | O 1s in ZnO |
L3M4,5M4,5 in ZnO |
L3M4,5M4,5 in Zn |
| Ciftyurek and Schierbaum (this work) | 140.0 | 91.6 | 88.8 | 10.7 | 529.8 | 987.9 | 992.3 |
| Vesely and Langer [66] | 139.8 | 92.0 | 89.0 | 10.5 | 530.9 | 988.9 | - |
| Gaarenstroom and Winograd [67] | - | - | - | 10.7 | - | 987.7 | - |
| Kowalczyk [68] | - | - | - | - | - | - | 991.9 |
| Wagner [69] | - | - | - | - | - | - | 992.0 |
| Schoen [65] | 139.6 | 91.8 | 88.7 | 10.3 | 530.3 | 988.5 | 992.5 |
| Barr and Hackenberg [70] | - | - | - | 10.3 | 530.3 | 987.9 | 992.0 |
| Klein and Hercules [71] | - | - | - | 10.4 | - | 988.2 | 992.3 |
| Strohmeier and Hercules [72] | 139.2 | - | 88.3 | - | 529.9 | 988.9 | 992.4 |
| Powell [73] | - | - | - | - | - | - | 992.4 |
| Ley and Kowalczyk [74] | - | - | - | 10.4 | - | - | 991.9 |
| Wehner and Mercer [75] | - | - | - | - | - | 988.1 | 992.1 |
| Dake and Baer [76] | - | - | - | - | - | 988.1 | 992.2 |
3.6. Concentration of Oxygen Vacancy ( in Engineered Porosity ZnO
Oxygen vacancies facilitate replenishment of the adsorbed oxygen (,) on the ZnO sensor surface which is essential for chemical sensing in metal oxides. Therefore, it is important to measure the concentration of the oxygen vacancies (. Concentration of oxygen vacancies can be calculated either from the oxidation state of the zinc (Zn) in the ZnO or oxygen (O) 1s peak analysis. In our current work, we both analyzed Zn and O via XPS in Engineered Porosity ZnO enriched with oxygen vacancies.
3.6.1. Zn 3p Analysis
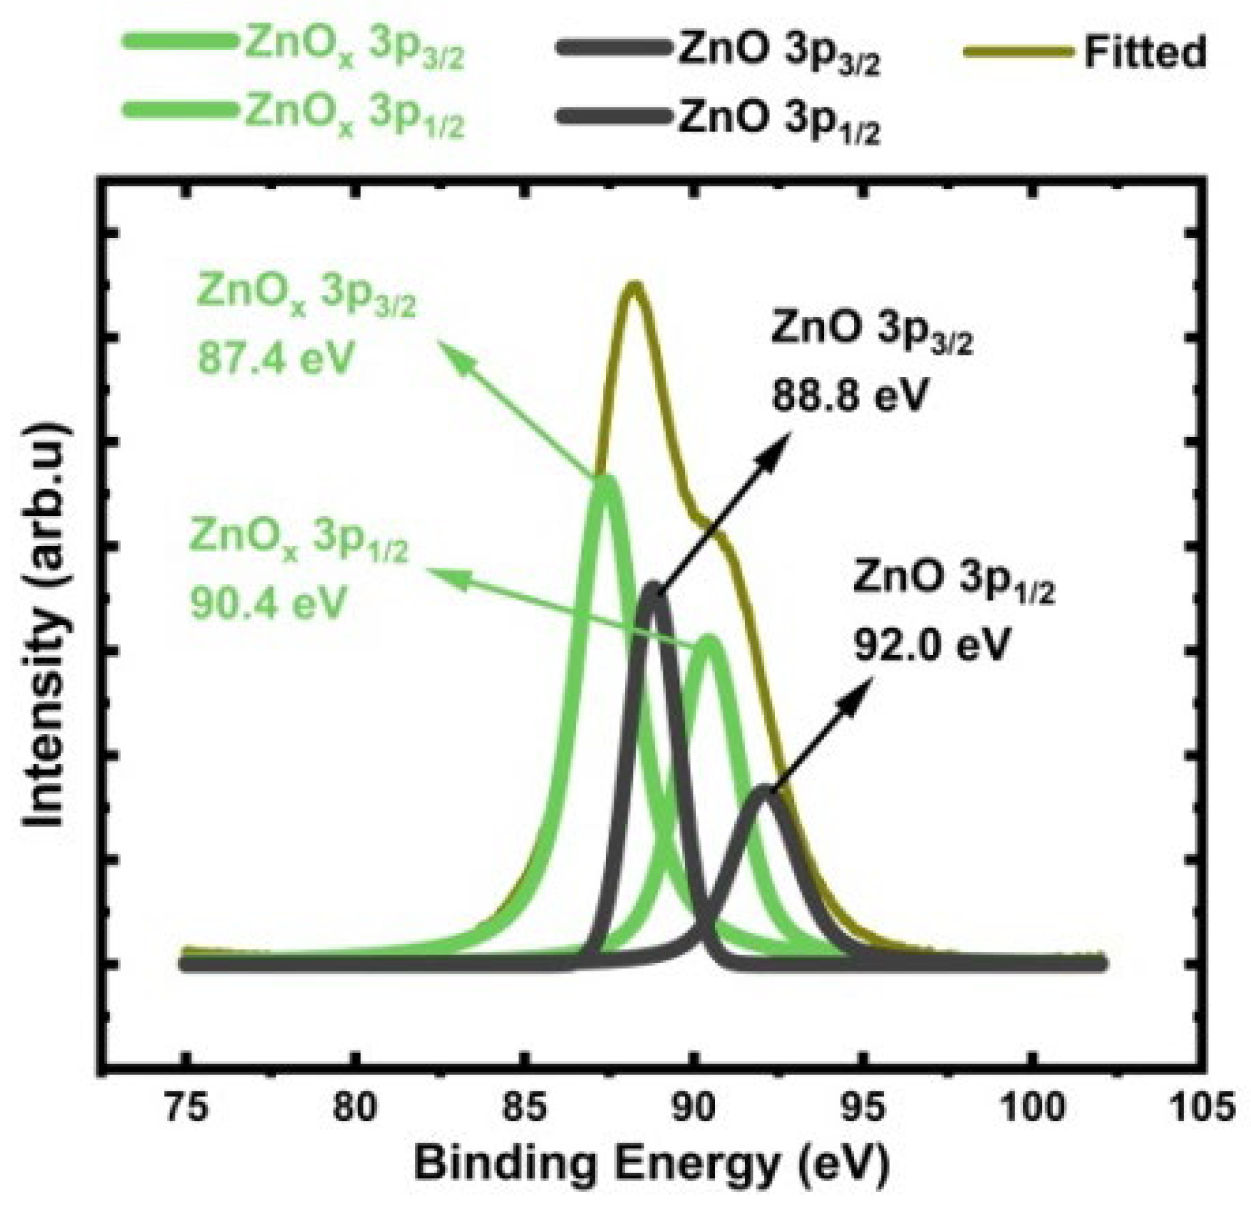
Auger analysis proved existence of ZnOx phase on the ZnO surface. We continued with Zn 3p peak analysis to determine the amounts of each ZnO and ZnOx. The Zn 3p spectrum from the depth of 1 nm is shown in Figure 4. Deconvolution analysis was used to quantify the amounts of ZnO and oxygen vacancy ( abundant non-stoichiometric ZnOx. The Zn 3p envelope was deconvoluted into two distinct chemical states; stoichiometric ZnO and ZnOx. We measured binding energy of 3p3/2 for ZnOx is 87.4 eV while 3p3/2 for ZnO is 88.8 eV. The binding energies (BE) we reported for 3p3/2 for ZnO and ZnOx are in good agreement with literature values [65,66,72,77]. The decrease in the 3p electron binding energy in ZnOx in comparison to the ZnO is due to high level of oxygen vacancies created in the ZnOx as it was processed through heat treatment-sintering-coarsening for creation porosity and tortuosity.
The amount ZnO and ZnOx phases are 33 at.% and 67 at.%, respectively. ZnOx being a dominant phase and homogeneously distributed through the surface and will dictate the sensors interaction with target gaseous environment.
Figure 6.
Deconvoluted Zn 3p peak, showing non-stoichiometric ZnOx associated with oxygen vacancies.
Figure 6.
Deconvoluted Zn 3p peak, showing non-stoichiometric ZnOx associated with oxygen vacancies.
3.6.2. Oxygen 1s Analysis
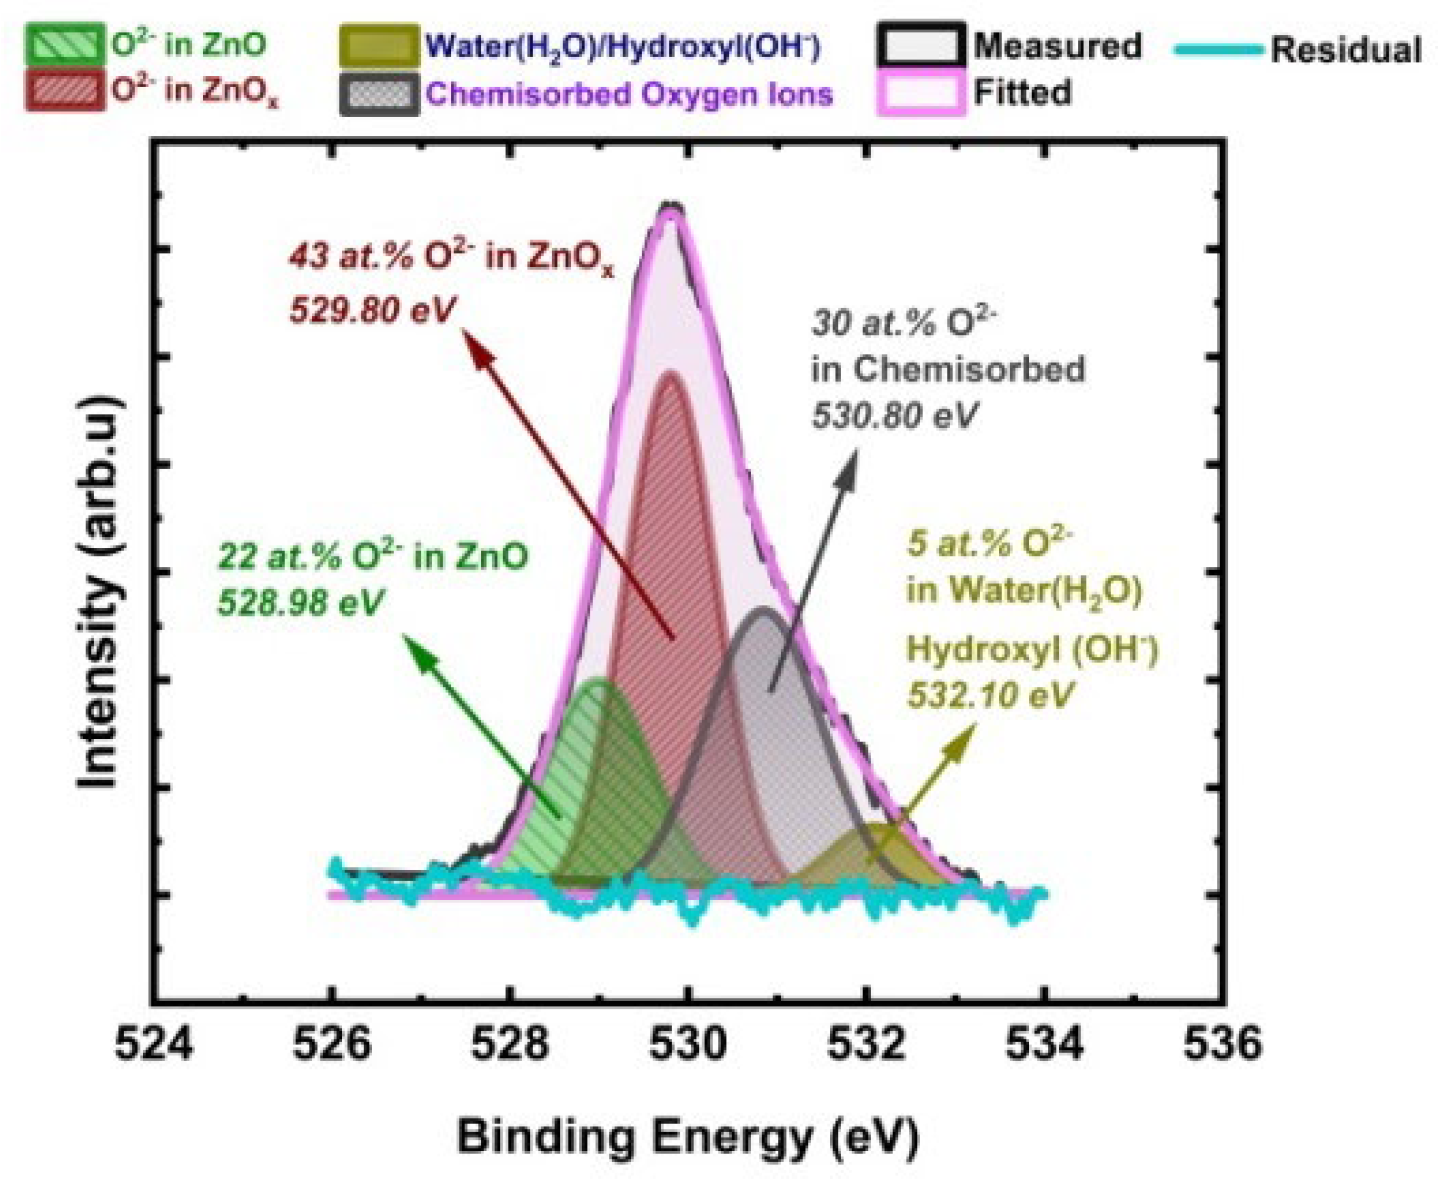
Figure 7 shows the XPS spectrum of oxygen O 1s spectrum from Engineered Porosity ZnO surface. The quantification of different oxygen ion containing species; water/hydroxide groups (H2O/OH−), chemisorbed oxygen ions (), and lattice oxygen ions connected to ZnOx and ZnO were completed. Analysis also focused on the calculation amounts of ZnO and ZnOx separately. The O 1s spectra are fitted to four sub-spectra centered at 528.98, 529.80, 530.80, and 532.10 eV, accounting for the lattice oxygen ions in ZnO, lattice oxygen ions in oxygen vacancy rich ZnOx, chemisorbed oxygen ions and water-hydroxyl groups, respectively. The binding energies we report for water/hydroxide, chemisorbed oxygen, and lattice oxygen ions are in good match with literature reported for ZnO and other metal oxides used for gas sensing [18,37,38,78,79].
Amount of chemisorbed oxygen ions and water-hydroxyl groups are 30 at.%, and 5 at.%, respectively. The high amount of chemisorbed oxygen ions shows that ZnOx is rich in oxygen vacancies since the chemisorbed oxygen ions attach oxygen vacancy ( and ) centers on ZnO surface. The amount of lattice oxygen ions connected to ZnO is 22 at.%. However, the amount of lattice oxygen ions in oxygen vacancy rich ZnOx is 43 at.%. That shows that majority of the ZnO sensor surface interactions is dictated by the oxygen vacancy abundant ZnOx.
Figure 7.
O 1s spectrum with 545 eV excitation photon energies corresponding to 1 nm depth from the Engineered Porosity ZnO sensor surface. Binding energies and amount of each component are also provided in the graph.
Figure 7.
O 1s spectrum with 545 eV excitation photon energies corresponding to 1 nm depth from the Engineered Porosity ZnO sensor surface. Binding energies and amount of each component are also provided in the graph.
3.6.3. Zinc (Zn) to Oxygen (O) Stoichiometric Quantification (ZnO)
We used intensity factors and ratio between the normalized areas of the O 1s and Zn 3p contributions, O/Zn was found to be 0.73 at.%. We determined x in ZnOx, x=0.73, so the oxygen vacancy abundant phase is ZnO0.73. That shows that majority of the ZnO sensor surface is governed by the oxygen vacancy abundant ZnO0.73.
3.7. Gas Sensor Testing for H2S and NO2
3.7.1. An overview of the sensing mechanism and the involvement of oxygen ions in metal oxide semiconductor (MOS) sensors’ gas sensing reactions
The sensing mechanism for all MOS sensors explained on the basis of adsorption/chemisorption of oxygen ions on MOS surface. Concentration of a certain specific type negatively charged adsorbed/chemisorbed oxygen ions dictates the numbers of electrons in MOS sensor conduction band thus establishes a constant electrical resistance (R). are the most common chemisorbed oxygen species taking place in gas sensing reactions [37,38,80,81,82,83,84,85].
Equations (2) and (3) illustrate adsorption of oxygen gas and consumption of conduction band electrons from ZnO leading to an increase in electrical resistance (R). Subsequently, adsorbed oxygen ions dissociated on the ZnO surface through the processes governed by Equation 4 through Equation 6, requiring consumption of additional ZnO electrons and raising the electrical resistance even further. Equation 7 shows the annihilation of the oxygen vacancy site via adsorption and dissociation of oxygen molecules into vacancy location under suitable temperature and oxygen partial pressure conditions. Target gases such as H2S, CO, SO2, etc. consume the adsorbed oxygen ions thus leading to return of electrons to ZnO conduction band, decreasing the electrical resistance [18,48,80,81,82,84,85,86]. Equations presented from Equations (2) to (7) are reversible if the certain conditions are satisfied.
Monoatomic oxygen ions () are compared to molecular oxygen ions () [37,38]. The creation of (Equation 6) is an exothermic reaction that results in ~1 eV decrease in free energy, whereas other reactions presented Equation 1 through 7 are endothermic. transformation to occurs at ~150–200°C (Equations 3 and 5). The dissociation of O2 into (Equation 5) necessitates ~0.5 eV. Monoatomic oxygen ions () can tolerate temperatures up to >400°C before departing the ZnO surface. ions comparing to , and are more long-lasting at elevated temperatures on a ZnO surface, , moreover if ions are trapped (Equation7) by and vacancy centers, ions cannot be distinguished from the lattice oxygen ions. The creation of (Equation 4) requires about 5 eV, and a formation of (Equation 6) will require higher energy of ~20 eV [37,38,81,82,87,88].
The most active and populous species of adsorbed oxygen ions are anticipated to be at the testing temperature of 200°C used in this work This is because we will only include in the sensing mechanism equations from Equation8 to Equation13 that are presented in Kröger–Vink notation.
3.7.2. Initial Tests on Adsorption Kinetics with Oxygen (O2) and Nitrogen (N2)
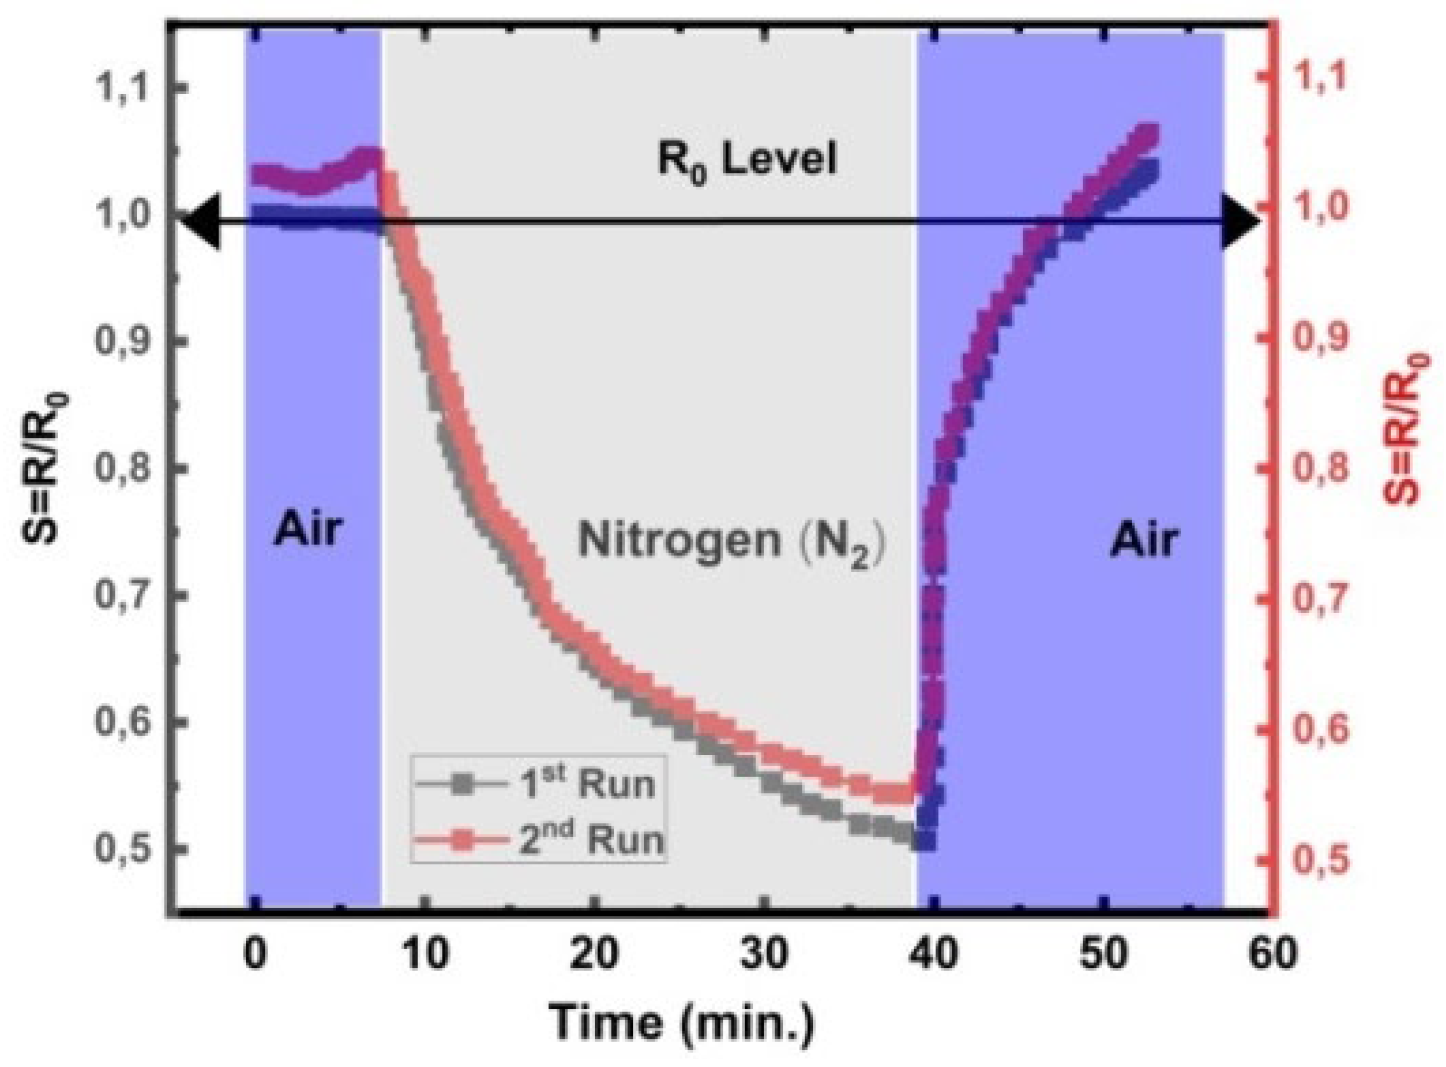
We investigated absorption-dissociation of O2 on the Engineered Porosity ZnO surface. The O2 source was atmospheric air. Figure 8 illustrates how the electrical resistance (R/R0) of Engineered Porosity ZnO changes upon exposure to O2 and N2 successively. R0 denotes electrical resistance as ZnO sensor is maintained under constant O2 flow, while R denotes the electrical resistance under N2 flow. N2 molecules kick off oxygen ions ( from their positions on the surface as soon as O2 flow is eliminated by N2 introduction. This causes an injection of electrons back into the ZnO conduction band, which causes ~55% decrease in the electrical resistance (R). Following the removal of the N2 flow, as shown in Figure 8 at the 40th minute, and the reintroduction of O2; the O2 adsorption-dissociation described in Equations 2 to 7 caused the Engineered Porosity ZnO electrical resistance to rise to the initial level.
Engineered Porosity ZnO has a great deal of oxygen vacancies and a high degree of network of open porosity. Figure 8 illustrates how a single exposure to atmospheric air containing 21% O2 increased electrical resistance by nearly 100%. In other words, large number of oxygen vacancies and high-level connected porosity facilitated large amount of O2 adsorption and dissociation through the reactions given in Eqs. 2 through 7.
Figure 8.
Adsorption and dissociation of O2 molecules on ZnO and their effect on the electrical resistance at 200°C in air. High purity N2 introduced between Air pulses containing 21% O2.
Figure 8.
Adsorption and dissociation of O2 molecules on ZnO and their effect on the electrical resistance at 200°C in air. High purity N2 introduced between Air pulses containing 21% O2.
3.7.3. Hydrogen Sulfide (H2S) Testing
Figure 9 shows Engineered Porosity ZnO sensor’s H2S response at 200°C as the concentration of H2S varies from a minimum of 0.2 ppm to a maximum of 2.25 ppm. The sensor showed typical n-type semiconductor performance by displaying a decrease in electrical resistance upon exposure to the H2S reducing gas. During H2S exposures, chemisorbed oxygen ions interacted with H2S, releasing electrons back to the conduction band, thus decreasing the electrical resistance according to the mechanisms governed by Equation8 and Equation 9.
Our sensor testing temperature is 200°C, thus we consider to be the most active adsorbed oxygen specie because ion formation is favored at ~150–200°C either by direct reduction from O2 (Equation 3) and/or transformation from to (Equation 4 and Equation 5). Equation 8 presents the reaction between H2S and . As was previously mentioned, surface oxygen vacancy () defect centers associated with ZnOx helped to facilitate the entire process presented in Equation 8. The reaction between H2S and adsorbed oxygen () produces by product of SO2 [17,18,46] [81]. Because SO2 itself is also reducing agent; SO2 will interact with the adsorbed oxygen species in the manner outlined in Equation 9.
Figure 9.
Engineered Porosity ZnO tested for sub-ppm H2S at 200°C.
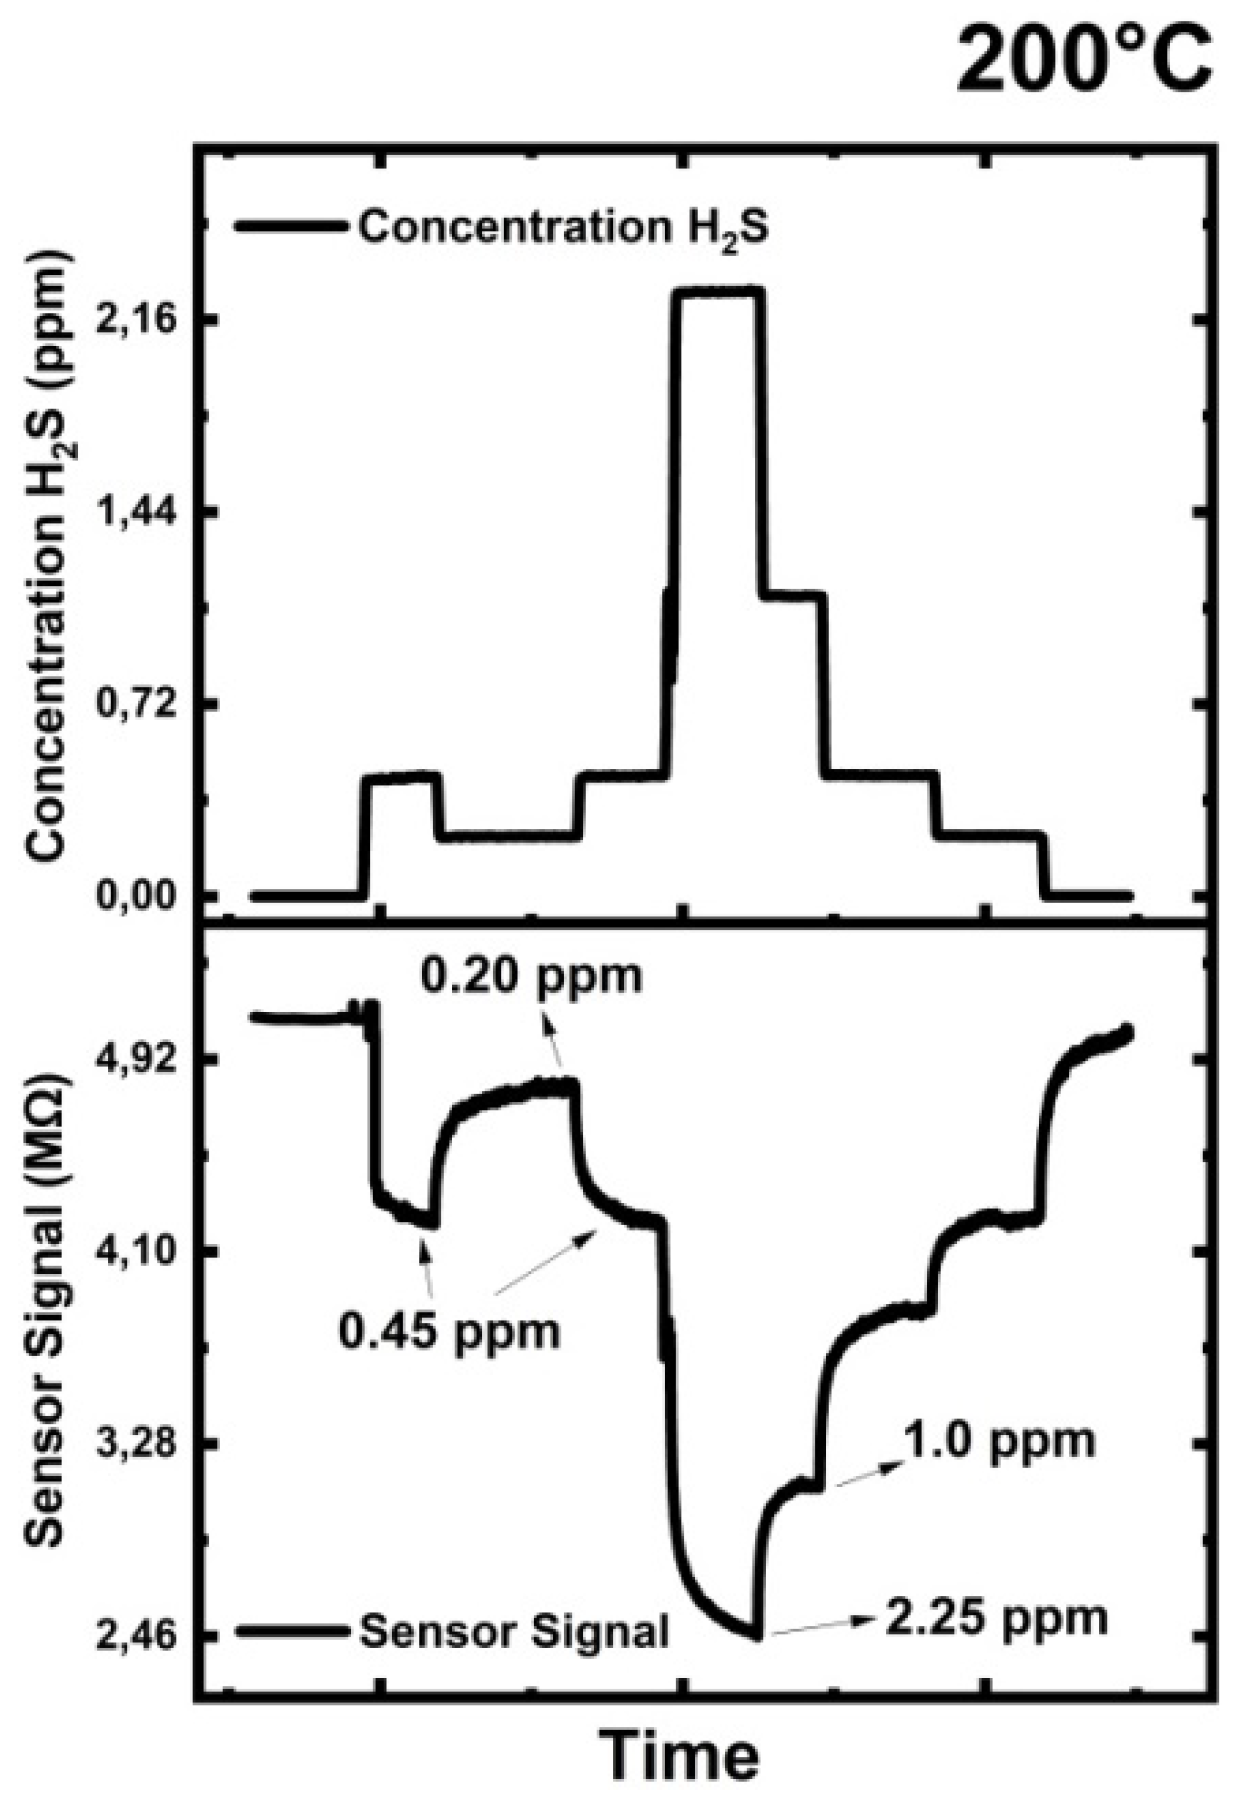
At the end of the H2S testing, Engineered Porosity ZnO sensor reintroduced into an oxygen-rich atmosphere relocating the consumed adsorbed oxygen species in accordance with the Equation 2 to Equation 6, as a result we observed the electrical resistance recovered back to its initial value before H2S introduction. SO2 is a by-product of complete combusting of H2S. According to Equation8, H2S reaction with adsorbed oxygen O- produces three free electrons (e-) per reaction, whereas SO2 reaction yields one free electron (e-). The sensing sequence for H2S ends with sulfur trioxide (SO3) as SO2 oxidized to SO3 as seen in Equation 9.
In summary, Engineered Porosity ZnO abundant with oxygen vacancies showed an n-type sensing behavior for H2S. ZnO sensor demonstrated exceptional sensing performance, exhibiting high response to 1 ppm H2S with 45% decrease in electrical resistance yielding a sensor response of 1.7. Table 2 provides the literature findings for H2S with the various material-compositions-dopants-precious metals additions etc. along with the results we obtained in our current work.
Examining Table 2, it is evident that Engineered Porosity ZnO has distinguished itself with exceptional properties and outperformed the majority of the tabulated literature thanks to its high sensor response and straightforward, simple, and affordable production method. Given that the most recent research in the literature, as shown in Table 2, makes use of costly precious metal addition, surface alloying, multi-step doping, and/or laborious nano-composites. ZnO sensor can differentiate between extremely low concentrations of H2S, including 2.25, 1, 0.45, and 0.2 ppm with high accuracy. The ZnO sensor when exposed to CO2 did not show any sensor response; showed very less toward CO, less than 1% change in electrical resistance.
3.7.4. Nitrogen Oxide (NO2) Testing
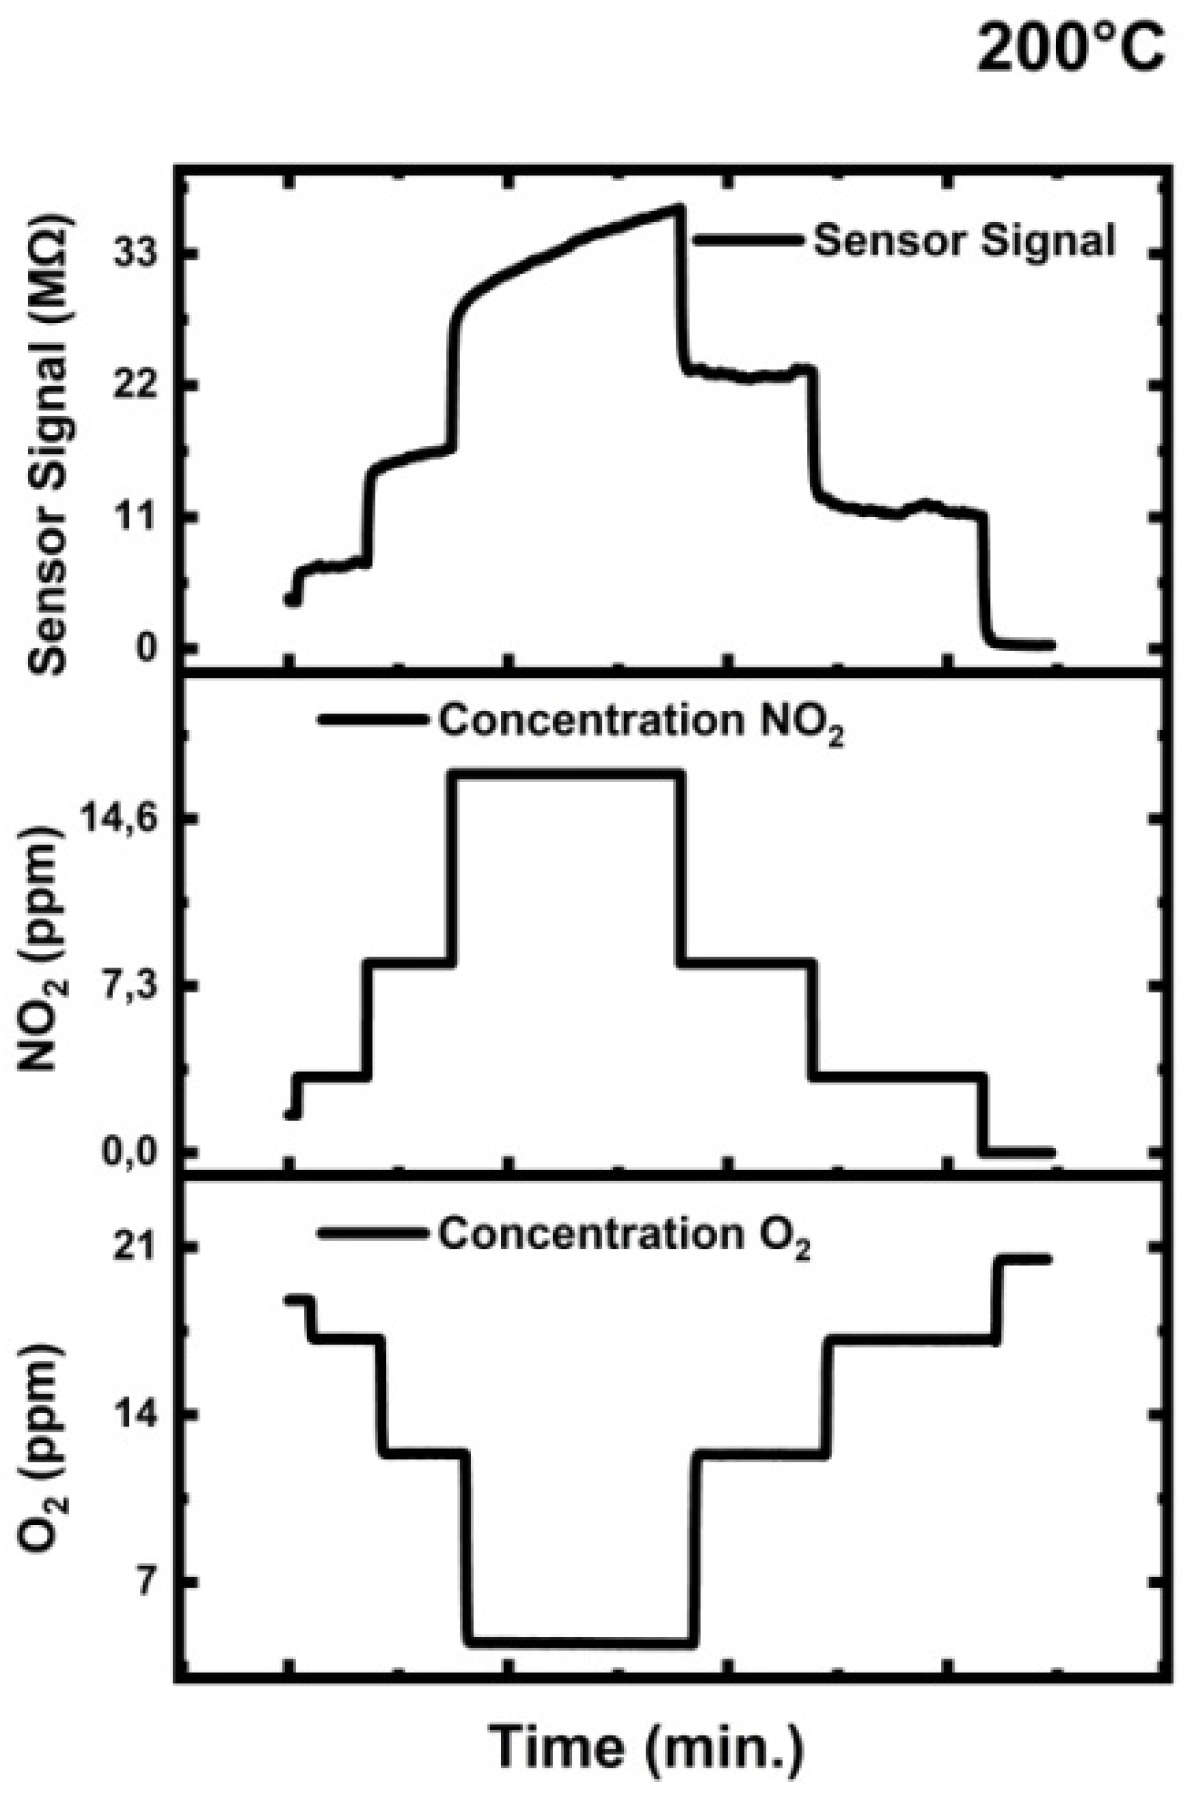
Figure 10 displays the testing results for NO2 at 200°C which also includes the concentrations profiles of O2 and NO2 during sensor testing. Combustion processes produce NO2, which, in fact, coexist in the same environment as another oxidation gas, namely oxygen (O2). Because of this demanding condition, Engineered Porosity ZnO was tested for NO2 while being interfered with by oxygen (O2). Even with high O2 interference, ZnO demonstrated exceptional sensing performance at different NO2 concentrations. Table 2 compares the NO2 sensor results from our current work with those from other studies that used different material-compositions-dopants-precious metal additions and/or burdensome nano-composite formations etc. with our results obtained in the current work.
NO2 introduction increased the electrical resistance due to consumption of conduction band electron as noted from Equation10 to Equation14. Figure 10 illustrates how the sensor’s electrical resistance increased as the NO2 concentration was gradually raised, eventually reaches its saturation peak value for 15 ppm of NO2. As NO2 concentration decreased, the Engineered Porosity ZnO electrical resistance decreased to its initial value, emphasizing excellent reversibility and the sensor’s reliability and repeatability.
The Engineered Porosity ZnO sensor showed maximum response of 15 to 15 ppm NO2. Even under the interference of 18 ppm of O2, the sensor managed to detect 3 ppm of NO2. In comparison to the previous research provided in Table 2, the exceptional sensor response from Engineered Porosity ZnO is attributed to a straightforward development process; a high porosity, a well-established tortuosity in microstructure, and a large number of NO2 pull centers, specifically oxygen vacancies (). The gas sensing tests of the Engineered Porosity ZnO sensor with CO2, CO, toluene and H2 did not lead to detectable change in the electrical resistance so the results are not presented here.
The reactions for NO2 sensing are given from Equation 10 to Equation13. Engineered Porosity ZnO has capability to sense NO2 even under the presence of O2 as demonstrated by Eqs. 11 to 13. NO2 molecules can be adsorbed on oxidized sites on ZnOx surface (Equation10 to and Equation11), on the other hand; the dissociation and adsorption of NO2 happens to be at oxygen vacancy sites () as seen in Eqs. 12 and 13 [38]. Dissociation and adsorption of NO2 enabled by the surface oxygen vacancies abundantly found in Engineered Porosity ZnO. NO2 dissociates to NO by oxidizing surface oxygen vacancies via donation of and ions as given in Eqs. 12 and 13.
As an interference gas, different concentrations of oxygen (O2) were added. This was completed in order to determine whether changes in oxygen gas concentrations could have an impact on the gas sensing mechanism in situations like those found in typical combustion environments with high and fluctuating oxygen content. Because oxygen (O2) interference cannot credibly impact the sensor signal, as demonstrated by the experiments, the Engineered Porosity ZnO is extraordinarily effective at detecting NO2 in realistic environmental settings.
Figure 10.
Engineered Porosity ZnO tested for NO2 at 200°C under O2 interference.
The Table 2 reviews H2S and NO2 sensing performances of different compositional and microstructural formations of ZnO including nano-fiber; nano-composites; nano-rods and nano-spheres in various architectures to improve the sensor response. CuO; SnO2; WS2 some of the materials were used in addition to the costly precious metals such as platinum (Pt); gold (Au) and palladium (Pd) as surface decoration; doping; additives and/or mechanical alloying. In addition to being difficult; costly; and time-consuming to manufacture; these compositional and microstructural formations have limited applicability for large-scale practice within an acceptable standardization for real-world industrial use. Engineered Porosity ZnO enriched with surface oxygen vacancies () showed sensor response of 15 towards 15 ppm of NO2 and 2.2 to 2.25 ppm of H2S 200°C. Engineered Porosity ZnO produced very successful results for NO2 and H2S when compared to the results from complex-doped-alloyed-composite material sets presented in Table 2.
Engineered Porosity ZnO did not have any sensing promoter agent commonly used in the other sensing materials presented in the Table 2. This work uses engineered porosity designed surface oxygen vacancy () enriched ZnO, which outperforms other sensor platforms-configurations (see Table 2) in terms of sensor response magnitude, simplicity, and design robustness. In our work, we reached to such an extraordinary sensor response for pure ZnO material thanks to the heat treatment, engineered porosity-tortuosity network, and enriched surface oxygen vacancy concentration.
Table 2.
Gas Sensing results obtained in this work for Engineered Porosity ZnO, together with literature findings for H2S and NO2 under different gas concentrations and testing temperature. Variety of dopants, additives of other oxide composites and/or precious metals modified ZnO literature findings tabulated for the comparison purposes.
| Sensing Material Composition and Physical State & Form |
Sensor Testing Temperature (°C) | Test Gas Concentration | Response Magnitude (Rair/Rgas) for H2S (Rgas/Rair) for NO2 |
|---|---|---|---|
| Engineered Porosity ZnO (this work) | 200 | 2.25 ppm H2S | 2.2 (This Work) |
| CuO/SnO2-ZnO core shell NWs [89] | 25 | 10 ppm H2S | 1.6 |
| ZnO/SnO2 nano-fibers [90] | 250 | 50 ppm H2S | 63.3 |
| ZnO Nano-rods [91] | 250 | 10 ppm H2S | 20 |
| Cu–ZnO nanograins [92] | 250 | 15 ppm H2S | 0.9 |
| Au modified ZnO nanowires [93] | 25 | 5 ppm H2S | 6.1 |
| Pd–SnO2–ZnO [94] | 25 | 20 ppm H2S | 0.06 |
| ZnO Nanowires [95] | 25 | 1 ppm H2S | 1.5 |
| Engineered Porosity ZnO (this work) | 200 | 15 ppm NO2 | 15 (This Work) |
| ZnO thin film [96] | 250 | 1 ppm NO2 | 2.4 |
| ZnO/SnO2-rGO nano-composite [97] | 30 | 5 ppm NO2 | 1.4 |
| UV Irradiated Au doped ZnO [40] | 25 | 1 ppm NO2 | 2 |
| Co-doped ZnO nano-capsules [98] | 280 | 100 ppm NO2 | 3.86 |
| Ni doped ZnO [99] | 200 | 100 ppm NO2 | 2 |
| Au decorated ZnO-PANI [100] | 300 | 50 ppm NO2 | 14 |
4. Conclusions
We created a microsensor architecture for the low temperature (200°C) detection of environmentally hazardous gases (NO2 and H2S) in the air using zinc oxide (ZnO) enriched with oxygen vacancy () population and a high degree of interconnected porosity and tortuosity. We established heat treatment procedure leading controlled nano-grain coarsening in order to produce Engineered Porosity ZnO with a network of porosity and tortuosity throughout the active layer thickness.
The sensor demonstrated sensor response against 2.25 ppm of H2S with a response of 2.2; while for 15 ppm of NO2; the response was 15 at 200°C. Engineered Porosity ZnO showed an exceptionally high response at low temperature with an excellent stability-reversibility-repeatability through quick response-recovery times in comparison to the literature findings tabulated in Table 2. This high sensor response attributed to the two primary reasons; firstly, abundance of oxygen vacancies () created by heat treatment procedure and secondly, novel sintered/coarsened grain formation that activated network of porosity and island like connected structures.
Surface analysis of Engineered Porosity ZnO revealed that lattice oxygen attached to ZnO is 22 at.%, whereas 30 at.% of oxygen is found in chemisorbed oxygen. Lattice oxygen in the oxygen vacancy rich phase ZnOx, on the other hand, is 43 at.%. This indicates that the oxygen vacancy- abundant ZnOx controls the majority of the ZnO sensor surface interactions. The O/Zn was found to be 0.73 at.%. We determined x in ZnOx, x=0.73, so the oxygen vacancy abundant phase is ZnO0.73.
Engineered Porosity ZnO detected sub-ppm NO2 even under oxygen (O2) interference affect simulating actual sensor operating conditions. The application we accomplished is feasible for industrial level gas sensor production thanks to the straightforward creation of an Engineered Porosity ZnO sensing layer on the sensor chip illustrated in Figure 1.
In conclusion, heat treatment-coarsening-sintering strategy for creation of oxygen vacancies designed to simultaneously form connected open porous microstructure through the ZnO film led to an exceptional gas sensing properties for NO2 and H2S at 200°C. Surface oxygen vacancies assisted in the capture of target gases and oxygen ions, which propel the sensing to the extraordinary high levels because of the partially empty d-bands achieved in ZnOx.
Author Contributions
The experimental design, planning, and original writing of the paper were completed by E.C. The sensor measurements, interpretation of literature findings and data analysis were completed by K.S and E.C. Z.L and E.C completed the synchrotron-based measurements. K.S. and E.C. completed the intellectual discussion and impact of the paper. All authors have read and agreed to the published version of the manuscript.
Funding
Engin Ciftyurek and Klaus Schierbaum thank the European Funds for Regional Development (EFRE- 0800672-FunALD) for funding. Engin Ciftyurek acknowledges the utilization of MATLINE end station in ASTRID2 located at the Aarhus Synchrotron facility in Aarhus, Denmark.
Acknowledgments
The authors thank Lukas Mai and Anjana Devi for deposition of ZnO. Authors acknowledge the support from IUTA (Institut für Energie und Umwelttechnik eV) facility for gas sensing set-up.
References
- H. Ritchie ve P. Rosado , «Fossil fuels,» Our World in Data, 2024.
- U. E. I. Administration, " U.S. Energy Information Administration, Monthly Energy Review, Energy Overview, Table 1.2," April 2024.
- U. E. I. Administration, «Monthly Energy Review, Energy consumption by sector, Tables 2.1.a and 2.1.b,» April 2024.
- T. A. G. Institute, «What are the major sources and users of energy in the United States?,» 2017.
- S. K. Pandey, K. H. Kim and K. T. Tang, "A review of sensor-based methods for monitoring hydrogen sulfide," Trends in Analytical Chemistry, vol. 32, pp. 87-99, 2012.
- X. Zheng, P. Orellano, H. Lin, M. Jiang and W. Gaun, "Short-term exposure to ozone, nitrogen dioxide, and sulphur dioxide and emergency department visits and hospital admissions due to asthma: A systematic review and meta-analysis," Environment International, vol. 150, no. pp. 106435, 2021. [CrossRef]
- P. Orellano, N. Quaranta, J. Reynoso, B. Balbi and J. Vasquez, "Effect of outdoor air pollution on asthma exacerbations in children and adults: Systematic review and multilevel meta-analysis," PLoS ONE, vol. 12(3). 2017. [CrossRef]
- «Environmental Health Criteria 19,» IPCS INTERNATIONAL PROGRAMME ON CHEMICAL SAFETY , Geneva, World Health Organization 1981, Hydrogen Sulfide.
- C.H Foulkes, “GAS!” The Story of the Special Brigade, N&M Press, 2009.
- "EPA (2024). Inventory of U.S. Greenhouse Gas Emissions and Sinks: 1990-2022 U.S. Environmental Protection Agency, EPA 430R-24004.".
- "U.S. Energy Information Administration, Monthly Energy Review, Energy consumption by sector and Environment, April 2024, preliminary data for 2023.".
- "U.S. Environmental Protection Agency, Inventory of U.S. Greenhouse Gas Emissions and Sinks: 1990-2022, April 2024. Includes U.S., Territories.".
- "U.S. Department of Labor," Occupational Safety and Health Administration, [Online]. Available: https://www.osha.gov/annotated-pels/table-z-1. [Accessed 09 10 2024].
- "Integrated Pollution Prevention and Control (IPPC) Reference Document on Best Available Techniques for Mineral Oil and Gas Refineries," EUROPEAN COMMISSION, 2003.
- Håvard Devold, "Oil and gas production handbook An introduction to oil and gas production, transport, refining and petrochemical industry," ISBN 978-82-997886-3-2, Oslo, 2013.
- "Nitrogen Oxides (NOx), Why and How They Are Controlled," EPA 456/F-99-006R, Clean Air Technology Center (MD-12) Information Transfer and Program Integration Division, 1999.
- E. Ciftyürek, K. Sabolsky and E. M. Sabolsky, "High temperature selective sensing of hydrogen with MgO-modified SrMoO4 micro-fibers," Sensors and Actuators B: Chemical, vol. 249, no. pp. 296-310, 2017. [CrossRef]
- E. Ciftyurek, "Nano-derived sensors for high-temperature sensing of H2, SO2 and H2S," Graduate Theses, Dissertations, and Problem Reports. 7305, West Virginia University (WVU), Morgantown, West Virginia (WV), USA., 2014.
- F. . J. Corpas, "NO and H2S Contribute to Crop Resilience against Atmospheric Stressors," Int. J. Mol. Sci. , vol. 25(6), no. p. 3509, 2024. [CrossRef]
- M. Filonchyk and M. P. Peterson, "NO2 emissions from oil refineries in the Mississippi Delta," Science of The Total Environment, vol. 898, no. p. 165569, 2023. [CrossRef]
- M. Monteleone , G. Di Luca, M. Filomia , A. Fuoco, A. Figoli and J. C. Jansen, "Odours in Asphalt: Analysis of the Release of H2S from Bitumen by a Mass Spectrometric Residual Gas Analyser," Methods Protoc., vol. 7(4), no. p. 55, 2024. [CrossRef]
- B. Saruhan, A. A. Haidry, A. Yüce, E. Ciftyürek and G. C. M. Rodríguez, "A Double Layer Sensing Electrode “BaTi(1-X)RhxO3/Al-Doped TiO2” for NO2 Detection above 600 °C," Chemosensors, vol. 4 (2), no. 8, 2016/4/29.
- Selmar de Souza, Steven J Visco and Lutgard C De Jonghe, "Thin-film solid oxide fuel cell with high performance at low-temperature," Solid State Ionics, vol. 98, no. pp. 57-61, 1997. [CrossRef]
- T. Ross, J. W. Zondlo, E. Sabolsky, E. Ciftyurek, A. Koneru, T. Thomas, I. Celik, I. Liu, H. Sezer and U. Damo, "Performance and stability of large planar solid oxide fuel cells using phosphine contaminated hydrogen fuel," Journal of Power Sources, vol. 395, no. pp. 185-194, 2018. [CrossRef]
- X. Chunchuan , P. Gansor, J. Zondlo, K. Sabolsky ve E. Sabolsky, «An H2S-tolerant Ni-GDC anode with a GDC barrier layer,» Journal of The Electrochemical Society, cilt 158(11), no. p. B1405, 2011. [CrossRef]
- G. Fang, Z. Liu, C. Liu and K. Yao, "Room Temperature H2S Sensing Properties and Mechanism of CeO2-SnO2 Sol-gel Thin Films," Sensors and Actuators B: Chemical, vol. 66, no. 1-3, pp. 46-48, 2000.
- S. C. Lee, S. Y. Kim, B. W. Hwang, S. Y. Jung, D. Ragupathy, I. S. Son, D. D. Lee and J. C. Kim, "Improvement of H2S Sensing Properties of SnO2-Based Thick Film Gas Sensors Promoted with MoO3 and NiO," Sensors, vol. 13, pp. 3889-3901, 2013.
- G. Eranna, B. C. Joshi, D. P. Runthala and R. P. Gupta, "Oxide Materials for Development of Integrated Gas Sensors-A Comprehensive Review," Critical Reviews in Solid State and Materials Sciences, vol. 29, no. 3-4, pp. 111-188, 2010.
- Z. Sun, H. Yuan, Z. Liu, B. Han and X. Zhang, "A Highly Efficient Chemical Sensor Material for H2S: Fe2O3 Nanotubes Fabricated Using Carbon Nanotube Templates," Advanced Materials, vol. 17, pp. 2993-2997, 2005.
- C. Liewhiran, N. Tamaekong, A. Wisitsora and S. Phanichphant, "The Monitoring of H2S and SO2 Noxious Gases from Industrial Environment with Sensors Based on Flame-spray-made SnO2 Nanoparticles," Engineering Journal, vol. 16, no. 3, pp. 123-134, 2012.
- C. V. Gopal, S. V. Reddy, S. V. Manorama and V. J. Rao, "Preparation and Characterization of Ferrites as Gas Sensor Materials," Journal of Material Science Letter, vol. 19, no. 9, pp. 775-778, 200.
- G. N. Chaudhari, M. A. Alvi, H. G. Wankhadea, A. B. Bodade and S. V. Manorama, "Nanocrystalline chemically modified CdIn2O4 thick films for H2S gas sensor," Thin Solid Films, vol. 520, no. 11, pp. 4057–4062, 2012.
- S. V. Jagtab, V. Kadu A, V. S. Sangawar, s. V. Manorama and G. N. Chaudhari, "H2S sensing characteristics of La0.7Pb0.3Fe0.4Ni0.6O3 based nanocrystalline thick film gas sensor," Sensors and Actuators B: Chemical, vol. 131, no. 1, pp. 290-294, 2008.
- U. Kersen and L. Holappa, "Surface Characterization and H2S sensing potential of iron molybdate particles produced by supercritical solvothermal method and subsequent oxidation," Appl. Phys. A, vol. 85, pp. 431-436, 2006.
- G. N. Chaudhari, D. R. Bambole, A. B. Bodade and P. R. Padole, "Characterization of nanosized TiO2 H2S gas sensor," J. Mater. Sci., vol. 41, pp. 4860-4864, 2006.
- M. Hübner, D. Koziej, M. Bauer, N. Barsan, K. Kvashnina, M. D. Rossell, U. Weimar and J.-D. Grunwaldt, "The Structure and Behavior of Platinum in SnO2-Based Sensors under Working Conditions," Angewandte Chemie International Edition, vol. 50 (12), no. pp.2841-2844, 2011. [CrossRef]
- E. Ciftyurek, Z. Li and K. Schierbaum, "Adsorbed oxygen ions and oxygen vacancies: Their concentration and distribution in metal oxide chemical sensors and influencing role in sensitivity and sensing mechanisms," Sensors , vol. 23(1). p. 29, 2022. [CrossRef]
- E. Ciftyürek, S. Bretislav , Z. Li, V. Matolin and K. Schierbaum, "Spectroscopic Understanding of SnO2 and WO3 Metal Oxide Surfaces with Advanced Synchrotron Based; XPS-UPS and Near Ambient Pressure (NAP) XPS Surface Sensitive Techniques for Gas Sensor Applications under Operational Conditions," Sensors, vol. 19(21). p. 4737, 2019. [CrossRef]
- M. D. Shirsat, M. A. Bangar, M. A. Deshusses, N. V. Myung ve A. Mulchandani, «Polyaniline nanowires-gold nanoparticles hybrid network based chemiresistive hydrogen sulfide sensor,» Appl. Phys. Lett., cilt 94 (8). pp. 083502 , 2009. [CrossRef]
- Z. Cai, K.-K. Kim and S. Park, "Room temperature detection of NO2 gas under UV irradiation based on Au nanoparticle-decorated porous ZnO nanowires," Journal of Materials Research and Technology, vol. 9 (6). pp. 16289-16302, 2020. [CrossRef]
- P. Cao, Y. Cai , D. Pawar , N. S.T. , C. Rao, S. Han, W. Xu, M. Fang, X. Liu, W. Liu, D. Zhu and Y. Lu, "Down to ppb level NO2 detection by ZnO/rGO heterojunction based chemiresistive sensors," Chemical Engineering Journal, vol. 401, no. p. 125491, 2020. [CrossRef]
- V. Ganbavle, S. Inamdar, G. Agawane, J. Kim and K. Rajpure, "Synthesis of fast response, highly sensitive and selective Ni:ZnO based NO2 sensor," Chemical Engineering Journal, vol. 286. pp. 36-47, 2016. [CrossRef]
- M. Bonyani , S. M. Zebarjad, K. Janghorban, J.-Y. Kim, H. W. Kim ve S. S. Kim, «Au-Decorated Polyaniline-ZnO Electrospun Composite Nanofiber Gas Sensors with Enhanced Response to NO2 Gas,» Chemosensors, cilt 10(10). p. 388, 2022. [CrossRef]
- L. Mai, F. Mitschker, C. Bock, A. Niesen, E. Ciftyurek, D. Rogalla, J. Mickler, M. Erig, Z. Li, P. Awakowicz, K. Schierbaum and A. Devi, "From Precursor Chemistry to Gas Sensors: Plasma-Enhanced Atomic Layer Deposition Process Engineering for Zinc Oxide Layers from a Nonpyrophoric Zinc Precursor for Gas Barrier and Sensor Applications," Small, vol. 16, no. 2020. [CrossRef]
- D. C. Look, "Zinc Oxide Bulk, Thin Films and Nanostructures;Processing, Properties and Applications," in Chapter 2 :Doping and Defects in ZnO.
- E. Ciftyürek, K. Sabolsky and E. M. Sabolsky, "Molybdenum and tungsten oxide based gas sensors for high temperature detection of environmentally hazardous sulfur species," Sensors and Actuators B: Chemical, vol. 237, no. pp. 262-274, 2016. [CrossRef]
- E. M. Sabolsky, E. Çiftyürek, C. Wildfire, K. Sabolsky, J. Taub, K. Sierros and T. H. Evans, "Nano-Derived Microsensors for Monitoring Gas Species in Harsh-Environments," ECS Transactions , vol. 61 (2), no. p. 375, 2014. [CrossRef]
- E. M. Sabolsky, C. Wildfire, E. Ciftyurek and K. Sabolsky, "Nano-Derived, Micro-Chemical Sensors for High-Temperature Applications," ECS Transactions, vol. 45 (3), no. pp. 495-506, 2012. [CrossRef]
- H. Kim, N. D. Theodore and T. L. Alford, "Comparison of texture evolution in Ag and Ag(Al) alloy thin films on amorphous," Journal of Applied Physics, vol. 95, no. p. 5180–5188, 2004. [CrossRef]
- G. L. Selman, J. G. Day and A. A. Bourne, "Dispersion Strengthened Platinum," Platinum Metals Review, vol. 18 (2), pp. 46-57, 1974.
- D.J. Frankel, G.P. Bernhardt, B.T. Sturtevant, T. Moonlight, M. Pereira da Cunha and R.J. Lad, "Stable electrodes and ultrathin passivation coatings for high temperature sensors in harsh environments," SENSORS, 2008 IEEE, no. 2008. [CrossRef]
- K. Sieradzki, K. Bailey and T. L. Alford, "Agglomeration and percolation conductivity," Appl. Phys. Lett., vol. 79, no. p. 3401–3403, 2001. [CrossRef]
- K. F McCarty, J. C Hamilton, Y. Sato, A. Saá, R. Stumpf, J. de la Figuera, K. Thürmer, F. Jones, K. A. Schmid, A. A. Talin and C. N. Bartelt, "How metal films de-wet substrates-identifying the kinetic pathways and energetic driving forces," New Journal of Physics, vol. 11(4), no. pp. 043001, 2009. [CrossRef]
- K. Sreenivas, I. Reaney, T. Maeder, N. Setter, C. Jagadish and R. G. Elliman, "Investigation of Pt/Ti bilayer metallization on silicon for ferroelectric thin film integration," J. Appl. Phys., vol. 75, no. pp. 232–239, 1994. [CrossRef]
- D. Srolovitz and M. Goldiner, "The thermodynamics and kinetics of film agglomeration," JOM, vol. 47 (3). pp. pp.31-36, 1995. [CrossRef]
- E. Çiftyürek, K. Sabolsky and E. M. Sabolsky, "Platinum thin film electrodes for high-temperature chemical sensor applications," Sensors & Actuators: B. Chemical, vol. 181. pp. 702-714, 2013. [CrossRef]
- E. Ciftyurek, C. D. McMillen, K. Sabolsky and E. M. Sabolsky, "Platinum–zirconium composite thin film electrodes for high-temperature micro-chemical sensor applications," Sensors and Actuators B: Chemical, vol. 207, no. pp. 206-215, 2015. [CrossRef]
- C. Jagadish and S. Pearton, Zinc Oxide Bulk, Thin Films and Nanostructures Processing, Properties and Applications, Elsevier Science, 2006.
- R. C. Brundle, C. A. Evans and S. Wilson, Encyclopedia of Materials Characterization Surfaces, Interfaces, Thin Films, pp-291: Butterworth-Heinemann, 1992.
- D. L. Raimondi and E. Kay, "High Resistivity Transparent ZnO Thin Films," J. Vac. Sci. Technol., vol. 7, no. pp. 96-99, 1970. [CrossRef]
- T. J. Coutts, X. Li, T. M. Barnes, B. M. Keyes, C. L. Perkins, S. E. Asher, S. B. Zhang and S.-H. Wei, "Chapter 3 - Synthesis and Characterization of Nitrogen-Doped ZnO Films Grown by MOCVD," in Zinc Oxide Bulk, Thin Films and Nanostructures Processing, Properties and Applications, 2006, pp. 43-83.
- F. Moulder, W. Stickle, P. Sobol and K. Bomben, Handbook of X-ray Photoelectron Spectroscopy, A Reference Book of Standard Spectra for Identification and Interpretation of XPS Data: Physical Electronics Division, Perkin-Elmer Corporation, 1992.
- Y.K. Gao, F. Traeger, O. Shekhah, H. Idriss and C. Wöll, "Probing the interaction of the amino acid alanine with the surface of ZnO (1010)," Journal of Colloid and Interface Science, vol. 338, no. pp. 16-21, 2009. [CrossRef]
- C. Wöll, "The chemistry and physics of zinc oxide surfaces," Progress in Surface Science, vol. 82, no. pp. 55-120, 2007. [CrossRef]
- S. Gunnar, "Auger and direct electron spectra in X-ray photoelectron studies of zinc, zinc oxide, gallium and gallium oxide," Journal of Electron Spectroscopy and Related Phenomena, vol. 2, no. pp. 75-86, 1973. [CrossRef]
- D. W. Langer and C. J. Vesely, "Electronic Core Levels of Zinc Chalcogenides," Phys. Rev. B, vol. 2, no. p. 4885, 1970. [CrossRef]
- S. W. Gaarenstroom and N. Winograd, "Initial and final state effects in the ESCA spectra of cadmium and silver oxides," J. Chem. Phys., vol. 67, p. 3500–3506, 1977.
- S. P. Kowalczyk, R. A. Pollak, F. R. McFeely, L. Ley and D. A. Shirley, "L2,3M45M45 Auger Spectra of Metallic Copper and Zinc: Theory and Experiment," Phys. Rev. B, vol. 8, no. p. 2387, 1973. [CrossRef]
- C. D. Wagner, "Chemical shifts of Auger lines, and the Auger parameter," Faraday Discussions of the Chemical Society, vol. 60, 1975.
- J. J. H. Tery L. Barr, "Studies of the low temperature oxidation of alloys by X-ray photoelectron spectroscopy: CuZn," Applications of Surface Science, vol. 10, pp. 523-545, 1982.
- D. M. H. Joseph C. Klein, "Surface characterization of model Urushibara catalysts," Journal of Catalysis, vol. 82, pp. 424-441, 1983.
- Brian R. Strohmeier and David M. Hercules, "Surface spectroscopic characterization of the interaction between zinc ions and γ-alumina," Journal of Catalysis, vol. 86, no. pp. 266-279, 1984. [CrossRef]
- C. Powell, "Recommended Auger-electron kinetic energies for 42 elemental solids," Journal of Electron Spectroscopy and Related Phenomena, Vols. 182 (1-2), no. pp. 11-18, 2010. [CrossRef]
- S. P. Kowalczyk, L. Ley, F. R. McFeely, R. A. Pollak and D. A. Shirley, "Relative effect of extra-atomic relaxation on Auger and binding-energy shifts in transition metals and salts," Phys. Rev. B, vol. 381, no. 9, p. 1974. [CrossRef]
- P.S. Wehner, P.N. Mercer and G. Apai, "Interaction of H2 and CO with Rh4(CO)12 supported on ZnO," Journal of Catalysis, vol. 84/1, no. pp. 244-247, 1983. [CrossRef]
- L. S. Dake, D. R. Baer and J. M. Zachara, "Auger parameter measurements of zinc compounds relevant to zinc transport in the environment," Surface and Interface Analysis, Vols. 14/1-2, no. pp. 71-75, 1989. [CrossRef]
- M.W. Wang, J.F. Swenberg, R.J. Miles, M.C. Phillips, E.T. Yua, J.O. McCaldin, R.W. Grant and T.C. McGill, "Measurement of the MgSe/Cd0.54Zn0.46Se valence band offset by X-ray photoelectron spectroscopy," Journal of Crystal Growth, vol. 138, no. pp. 508-512, 1994. [CrossRef]
- Hsin-Yen Lee, Bin-Kun Wu and Ming-Yau Chern, "Study on the Formation of Zinc Peroxide on Zinc Oxide with Hydrogen Peroxide Treatment Using X-ray Photoelectron Spectroscopy (XPS)," Electron. Mater. Lett., vol. 10, no. 1, pp. 51-55, 2014.
- O. Hirsch, K. O. Kvashnina, L. Luo, M. Sueess, P. Glatzel and D. Koziej, "High-energy resolution X-ray absorption and emission spectroscopy reveals insight into unique selectivity of La-based nanoparticles for CO2.," Proceedings of the National Academy of Sciences of the United States of America, vol. 112, no. pp. 15803-15808 , 2015. [CrossRef]
- M. J. Madou and S. R. Morrison, Chemical sensing with Solid State Devices, San Diego: Academic Press, INC, 1989.
- A. M. Azad, S. A. Akbar, S. G. Mhaisalkar, L. D. Birkefeld and K. S. Goto, "Solid State Gas Sensors A review," J. Electrochem. Soc., vol. 139, no. 12, pp. 3690-3701, 1992.
- H. Windischmann and P. Mark, "A model for the Operation of a Thin film SnOx Conductance Modulation Carbon Monoxide Sensor," J. Electrochem Soc., vol. 126, pp. 627-633, 1979.
- E. B. Varhegyi, J. Gerblinger, F. Reti, I. V. Perczel and H. Meixner, "Study of the behaviour of CeO2 in SO2 containing atmosphere," Sensors and Actuators B, Vols. 24-25 (1-3), no. pp. 631-635, 1995. [CrossRef]
- Christina Wildfire, Engin Çiftyürek, Katarzyna Sabolsky and Edward M Sabolsky, "Investigation of doped-gadolinium zirconate nanomaterials for high-temperature hydrogen sensor applications," Journal of Materials Science, vol. 49, no. pp. 4735-4750, 2014. [CrossRef]
- C. Wildfire, E. Çiftyürek, K. Sabolsky and E. Sabolsky, "Fabrication and testing of high-temperature nano-derived resistive-type microsensors for hydrogen sensing," Journal of The Electrochemical Society, vol. 161 (2), no. pp. B3094-B3102, 2013. [CrossRef]
- L. D. Birkefeld, A. M. Azad and S. A. Akbar, "Carbon Monoxide and Hydrogen Detection by Anatase Modification of Titanium Dioxide," J. Am. Ceram. Soc., vol. 75 (11), no. p. 2964, 1992. [CrossRef]
- P. Mark, "Photo-induced chemisorption on insulating CdS crystals," J. Chem. Phys. Solids., vol. 25, no. pp. 911-920, 1964. [CrossRef]
- A. M. Azad, S. G. Mhaisalkar, L. D. Birkefeld, S. A. Akbar and K. S. Goto, "Behaviour of a New ZrO2-MoO3 Sensor for Carbon Monoxide Detection," J. Electrochern. Soc, vol. 139, no. 10, pp. 2913-2920, 1992.
- Jae-Hun Kim, Ali Mirzaei , Jae Hoon Bang, Hyoun Woo Kim and Hyoun Woo Kim, "Selective H2S sensing without external heat by a synergy effect in self-heated CuO-functionalized SnO2-ZnO core-shell nanowires," Sensors and Actuators B: Chemical, vol. 300, no. p. 126981, 2019. [CrossRef]
- Zhaorui Lu, Qu Zhou, Caisheng Wang, Zhijie Wei, Lingna Xu and Yingang Gui, "Electrospun ZnO-SnO2 Composite Nanofibers and Enhanced Sensing Properties to SF6 Decomposition Byproduct H2S," Front Chem., vol. 6, no. p. 540, 2018. [CrossRef]
- Umar, Ahmad, Ibrahim, Ahmed A., Alhamami, Mohsen A., Algadi, Hassan, Ahmed, Faheem, Hussain, S., Fouad, Hassan and Akbar, Sheikh , "ZnO nanorods assembled microflower-based gas sensor for detecting formaldehyde," Materials Express, vol. 12, no. pp. 1481-1487(7), 2022. [CrossRef]
- K. Girija, K. Somasundaram, A. Topkar and Vatsa, "Highly selective H2S gas sensor based on Cu-doped ZnO nanocrystalline films deposited by RF magnetron sputtering of powder target.," J. Alloys Compd., vol. 684, no. pp. 15-20, 2016. [CrossRef]
- Niranjan S. Ramgir, Preetam K. Sharma, N. Datta, M. Kaur, A.K. Debnath, D.K. Aswal and S.K. Gupta, "Room temperature H2S sensor based on Au modified ZnO nanowires," Sensors and Actuators B: Chemical, vol. 186, no. pp. 718-726, 2013. [CrossRef]
- Hyunsu Kim, Changhyun Jin, Sunghoon Park and Chongmu Lee, "Enhanced H2S gas sensing properties of multiple-networked Pd-doped SnO2-core/ZnO-shell nanorod sensors," Materials Research Bulletin, vol. 47, no. pp. 2708-2712, 2012. [CrossRef]
- Florian Huber, Sören Riegert, Manfred Madel and Klaus Thonke, "H2S sensing in the ppb regime with zinc oxide nanowires," Sensors and Actuators B: Chemical, vol. 239, no. pp. 358-363, 2017. [CrossRef]
- A. Catto, L. da Silva, M. Bernardi, S. Bernardini, K. Aguir, E. Longo and V. Masterlaro, "Local Structure and Surface Properties of CoxZn1–xO Thin Films for Ozone Gas Sensing," ACS Applied Materials & Interfaces, vol. 8 (39), no. p. 26066–26072, 2016. [CrossRef]
- Ziying Wang, Shang Gao, Teng Fei, Sen Liu and Tong Zhang, "Construction of ZnO/SnO2 Heterostructure on Reduced Graphene Oxide for Enhanced Nitrogen Dioxide Sensitive Performances at Room Temperature," ACS Sensors, vol. 4 (8), no. p. 2048–2057, 2019. [CrossRef]
- V. S. Kamble, Y. Navale, V. Patil, N. K. Desai, S. N. Vajekar and S. Salunkhe, "Studies on structural, spectral and morphological properties of co-precipitation derived Co-doped ZnO nanocapsules for NO2 sensing applications," Journal of Materials Science: Materials in Electronics, vol. 32(8), no. 2021. [CrossRef]
- V.V. Ganbavle, S.I. Inamdar, G.L. Agawane, J.H. Kim and K.Y. Rajpure, "Synthesis of fast response, highly sensitive and selective Ni:ZnO based NO2 sensor," Chemical Engineering Journal, vol. 286, no. pp. 36-47, 2016. [CrossRef]
- M. Bonyani, S. M. Zebarjad , K. Janghorban, J.-Y. Kim , H. W. Kim ve S. S. Kim, «Au-Decorated Polyaniline-ZnO Electrospun Composite Nanofiber Gas Sensors with Enhanced Response to NO2 Gas,» Chemosensors, cilt 10 (10), no. p. 388, 2022. [CrossRef]
Figure 1.
The schematic view of gas testing components and peripheral units used in H2S and NO2 testing. The integrated sensor architecture includes a heating element, a temperature sensor, and the Engineered Porosity ZnO sensing layer.
Figure 1.
The schematic view of gas testing components and peripheral units used in H2S and NO2 testing. The integrated sensor architecture includes a heating element, a temperature sensor, and the Engineered Porosity ZnO sensing layer.
Disclaimer/Publisher’s Note: The statements, opinions and data contained in all publications are solely those of the individual author(s) and contributor(s) and not of MDPI and/or the editor(s). MDPI and/or the editor(s) disclaim responsibility for any injury to people or property resulting from any ideas, methods, instructions or products referred to in the content. |
© 2024 by the authors. Licensee MDPI, Basel, Switzerland. This article is an open access article distributed under the terms and conditions of the Creative Commons Attribution (CC BY) license (http://creativecommons.org/licenses/by/4.0/).
Copyright: This open access article is published under a Creative Commons CC BY 4.0 license, which permit the free download, distribution, and reuse, provided that the author and preprint are cited in any reuse.


