
Submitted:
16 November 2024
Posted:
19 November 2024
You are already at the latest version
Abstract
Fire is a major hazard in hospitals, often caused by flammable liquids and medical gases, and can lead to significant losses due to limited patient mobility. This study simulated the effectiveness of portable and ceiling exhaust systems in reducing smoke, heat, and toxic gases in a hospital Neonatal Intensive Care Unit (NICU) using Computational Fluid Dynamics (CFD).The study began by converting a 2D sketch of the NICU into a 3D model using SketchUp, which was then imported into PyroSim software. Properties of objects and fire scenarios were set in PyroSim, and simulation results for temperature, visibility, and toxic gases (CO, CO2, O2) were generated as 3D cross-sectional views and profiles.In the simulation, the ceiling exhaust contained smoke within the fire room, preserving visibility in other areas, while the portable exhaust spread smoke to corridors, reducing visibility to zero. The ceiling exhaust maintained temperatures between 60–70°C, while the portable exhaust exceeded 80°C. CO concentrations peaked at 700 ppm without exhaust, dropped to 400 ppm with portable exhaust, and 300 ppm with ceiling exhaust. Oxygen levels fell to 18% with either exhaust, but remained at 20% with ceiling exhaust. The ceiling exhaust also reduced CO2 in exit rooms from 18,000 ppm to below 12,000 ppm, while portable exhaust reduced it by only 2,000 ppm. These findings can guide hospital designers and firefighting teams in selecting optimal fire control equipment, enhancing building safety and firefighting strategies.
Keywords:
Fire
; Computational Fluid Dynamics (CFD)
; Hospital
; Ceiling exhaust
; Portable exhaust
1. Introduction
Fire is one of the most devastating disasters.The occurrence of fire in residential, commercial, and industrial buildings can cause significant human, financial, and environmental losses every year[1]. It also affects social development[2]. The direct economic losses caused by a fire is five times greater than that of an earthquake, and in terms of frequency, fires rank first among all world events[3]. Reports indicate that 50% of fire-related casualties occur within buildings[4]. Hospitals are complex and potentially vulnerable structures that must be sufficiently prepared to respond to predictable and unpredictable events[5]. The safety of healthcare facilities is classified as sensitive and vital[4,6]. Due to the presence of medical gases, flammable liquids, and electrical equipment, hospitals face a higher risk of fire compared to other types of buildings[7,8]. Numerous factors have caused severe damages and deaths in hospitals in case of fire accident; including the presence of vulnerable individuals, the necessity for uninterrupted services, limited knowledge of firefighting techniques, the rapid spread of fires, and the substantial smoke emissions[9,10,11,12]. Hospital fires frequently lead to extensive damage, casualties, and significant financial burdens due to the costs of equipment procurement and replacement[10]. Therefore, fire safety has become one of the most significant challenges for designers and users of these facilities[13]. Based on the information obtained from the reiterated fires in hospitals, the main factors causing fires in these places include incidents such as fires in trash cans, smoking, fires in the kitchen, and electrical system failures[14]. Furthermore, numerous studies have assessed hospital safety level. In a study conducted by Lari et al., the review results showed that the hospitals under study, have a weak safety level and require immediate action to protect patients and staff[15]. The study by Hokamabadi et al. (2017) revealed that the safety of buildings, people, and activities is at its lowest level, with the highest risk and fire potential directed towards people[16]. In a study by Sarsangi et al. (2013), it was found that the fire risk for individuals in all units is greater than 1, indicating a high risk of fire in the hospital complex with potential intolerable damage in case of a fire[17]. In a study by Bashyal et al. (2022), it was found that the hospital has insufficient firefighting equipment and lacks adequate preparedness to deal with fires[18]. However, studies show that by implementing safety principles, 75% of these fires are predictable and preventable[19]. Hashemi (2020) conducted a study on a fire incident in an office building using the Fire Dynamics Simulator (FDS). The study found that detectors speed up evacuation, while sprinklers reduce damage. Delayed evacuation can result in risks such as decreased visibility and inhalation of toxic gases (HCl, CO, and CO2) [20]. In another study conducted by Guangxia Hu (2020) focusing on high-rise residential buildings, the findings indicated that during the initial 60 seconds of a fire incident, the area surrounding the fire is conducive for evacuation. Moreover, the state of the door in the room where the fire originated significantly influences the successful evacuation of individuals[21]. Therefore, using suitable methods to identifying hazards, evaluating consequences, assessing the risk, and implementing technical and managerial measures to control incidents can greatly reduce fire damages. One of the most critical and challenging areas during emergencies, in hospitals is the Neonatal Intensive Care Unit (NICU), where the most vulnerable population, infants, receive specialized care. These infants encounter various medical issues, and ensuring proper temperature regulation, respiratory support, cardiac monitoring, and other essential interventions are crucial for their survival. As a result, discharging these infants in case of emergencies, poses one of the most demanding challenges in emergencies[22,23]. Chowdhury (2013) examined 34 fires in Indian hospitals, and found that that they occurred in areas with oxygen gas near patients and electronic devices, especially in the NICU and ICU units[24]. The outcome of fire accidents is influenced by factors such as heat generation, smoke, and dispersion. Obtaining this data is complex and is typically done through two methods: conducting real (live) fires in structures to measure temperature, smoke levels, and pollutant emissions with sensors. this approach is a costly and time-consuming process. An alternative method, has gained attention among fire engineering experts, is simulating fires in buildings. This method avoids actual fires, reduces costs and time, and eliminates the risk of fatalities entirely[20]. One practical approach for simulating fire consequences is Computational Fluid Dynamics (CFD) studies,which have various applications in fluids simulations. Due to the complexity and time-consuming nature of CFD calculations, specialized software is utilized to enhance accuracy and speed. Pyrosim is a CFD tool based on FDS which is commonly used for fire simulation in indoor building spaces[25]. This software can predict temperature, visibility, and toxic gas levels before and after a fire, allowing for analysis of fire scenarios in locations like metro stations, residential, commercial, and hospital buildings[26]. Given the significance of fire safety in hospitals, the aim of this study, was to numerically simulate the fire behavior and evaluate the efficiency of control devices in the neonatal intensive care unit (NICU). To demonstrate the applicability of the method, a practical CFD study was conducted in a hospital at Bushehr province in Iran.
2. Materials and Methods
This research was conducted in several stages to achieve its objectives.
2.1. Sketching Up the 3D Structure of a Building and Specifying Its Internal Details
At this stage, the two-dimensional map of NICU (including the overall dimensions of the building, the sizes of walls, doors, windows, and other elements), obtained from the hospital's civil engineering office. Subsequently, the two-dimensional map transferred into the SketchUp software version 2024 to generate a 3D map. Subsequently, the 3D map was imported into PyroSim software version 2023 (Figure 1). Afterward, the dimensions of tables, chairs, closets, beds (for babies and mothers), and all objects relevant to the simulation, along with their positions, were manually measured and transferred into the PyroSim. It should be noted that the NICU unit covers an area of 432 m2 with an exit door width of 160 cm, a ceiling height of 3 meters, and walls with a thickness of 40 cm. It includes 18 rooms with 27 beds for sick babies and 8 beds for babies’ mothers (Figure 1).
In Figure 1, points A, B, C, and D describe the measurement points for temperature, visibility, and levels of toxic gases (carbon dioxide, carbon monoxide, and oxygen) respectively. Points 1, 2, and 3, demonstrate the ceiling exhausts, and point 4 displays the location of portable exhaust located at a height of 1 meter from the ground. At point 1, also, there is a smoke detector with a darkness threshold of 3.28%/m. The structural composition and materials of surfaces and objects in the NICU unit are detailed in Table 1, and the thermal properties of these materials are provided in Table 2.
2.2. Importing Fire Simulation Data
In designing fire simulation scenarios, the principle of selecting the most unfavorable (worst case) fire scenario is typically followed. The characteristics of simulations in this study were chosen based on the most common and severe source and rate of fire [21]. In this instance, a fire source of 1 m2 (1 * 1 m) meter, which originated from the mattress of a patient's bed in the room (where the sick babies are hospitalized), was identified as the source of the fire. The heat release rate (HRR) of the fire source under consideration was determined at 1009.58 KW/m2, with an assumed duration of 600 seconds [28]. The fire was assumed that initiated from an electrical connection in medical equipment in the room. In this simulation, a mesh size of 0.23 x 0.23 x 0.23 was used to investigate the spread of fire components, and a total of 134,430 cells were obtained. To allow for the circulation of smoke in the environment, the mesh was left open at two points: one at the window of the room where the fire started and the other at the exit door of this treatment section. Polyurethane foam (GM27) was defined as fire reaction [29] .
2.3. Determination of Scenarios
The study evaluated the effectiveness of portable and ceiling exhaust systems in reducing smoke, temperature, and toxic gases in three fire scenarios. The details of scenarios for this study can be found in Table 3. Also Figure 1, demonstrates the spatial location of exhaust systems. Figure 2 displays the picture of the exhaust systems used in scenarios 2 and 3. To evaluate the fire consequence, cross-sections or points at a height of 1.65 meters from the ground[20] were chosen near the fire's origin, the room's exit door, and the center of the department's corridors. Also, the smoke detector was placed near the fire origin point. Additionally, ceiling exhausts were installed at a height of 2.85 meters from the ground at three equidistant points from the sides, as shown in Figure 1. The specific locations are described in the Figure 1.
Figure 2 shows the portable and ceiling smoke exhausts used in fire scenarios.
2.4. Definition of Human Life Safety Standard
A tolerable environment is one that sustains human life for a specific duration. In the case of a building fire, the fire characteristics play a crucial role in determining people's responses to the situation. The primary and most influential factor affecting people's reactions to fire is the nature of the fire itself. Hence, in this study, threshold limits for temperature, visibility, and toxic gases (CO, CO2, and O2) was established based on prior research and established standards. These threshold limits are illustrated in Figure 3.
3. Results
After transforming the data into the PyroSim and running the simulation, the results of the fire scenarios, such as smoke quantity, temperature, visibility, and toxic gas levels, were generated as 3D cross-sections and Figures. The following section provides a detailed overview of the results.
3.1. 3D View of Smoke Spread
Figure 4, shows a 3D cross-section view of the smoke spread from various fire scenarios at different times (300 and 600 Sec.).
As can be seen from Figure 4, in scenario 1, at time of 300s, the smoke has spreaded from the fire origin room to the corridors, and by 600 seconds, the smoke has enveloped the entire area. In both time slices of scenario 2, the smoke has covered the room where the fire started and the corridors. By the second 600, in addition to the abovementioned spaces, the smoke has propagated to some rooms, including the mothers' rest room. In scenario 3, throughout the entire duration of the fire simulation, the smoke remains confined solely to the room where the fire originated, with variations in smoke concentration observed across different time slices.
3.2. 3D Visibility
A 3D representation in Figure 5, illustrates the cross-sectional visibility in fire scenarios at different simulation time points (Again 300 and 600 Sec).
According to Figure 5, in scenario 1, at 600 seconds, visibility is zero in Almost all locations Also, in both time slices of Scenario 2, there is complete visibility in specific areas, such as the exit corridors and adjacent rooms. Additionally, the smoke has increased in the rooms on the north side of this section. In both time slices of scenario 3, the reduction of visibility is limited to the room where the fire is located, and the only difference between these time slices is the amount of visibility.
3.3. Visibility Figure
Figure 6 illustrates visibility levels across various fire scenarios over time.
Note: Visibility in the first 100 seconds of the simulation is 30 meters, but this detail is omitted from the figure.
According to Figure 6, which illustrates the visibility levels at different points and time slices, it can be seen that at point A, visibility decreases below 5 meters (around 170 seconds) in all three scenarios, eventually reaching zero. Only in scenario 3 visibility exceed 5 meters in the last 50 seconds of simulation time. At point B, visibility drops below 5 meters at 180 seconds in scenarios 1 and 2, and occurs 20 seconds later in scenario 3. For point C, visibility falls below 5 meters at 270 seconds in scenarios 1 and 2, while in scenario 3, visibility remains above 10 meters throughout the simulation. At point D, visibility dips below 5 meters at 350 seconds in scenario 1, reaching 5 meters, whereas in scenarios 2 and 3, visibility remains constant throughout the simulation.
3.5. Temperature Profiles Figure
Figure 7 shows temperature profiles from fire scenarios over time.
Note: The temperature stays at 20°C for the first 50 seconds of the simulation, but this is not clearly shown in the figure.
According to Figure 7, at point A, the temperature is above 80 °C from 290 to 410 seconds in scenario 1 and from 295 to 395 seconds in scenario 2. In scenario 3, the maximum temperature is 60 to 70 °C for 310 to 350 seconds. At point B, between 320 to 380 seconds, the temperature is above 80 °C in scenarios 1 and 2, and between 60 to 70 °C in scenario 3. At point C, the temperature is below 30 °C in scenarios 1 and 2, and 20 °C in scenario 3. At point D, the temperature is almost below 22 °C in all three scenarios.
3.6. CO Concentration Figure
Figure 8 displays carbon monoxide levels in different fire scenarios over time.
Note: The carbon monoxide concentration is zero until the 100th second of the simulation and is not shown on the graph.
According to Figure 8, in scenario 1, the CO concentration at point A is below 700 ppm. in scenario 2 it is below 600 ppm, and in scenario 3 it is below 300 ppm. At point B in scenario 1, between 350 to 430 seconds, the gas concentration ranges from 700 to 750 ppm. In scenario 2, between 330 to 430 seconds, CO levels are between 600 to 700 ppm. In scenario 3, the concentration remains below 500 ppm. At point C in scenario 1, the CO level is 0 ppm. In scenario 2, the total simulation time is under 250 ppm, and in scenario 3, it is under 170 ppm. At point D in scenario 1, the peak value is 70 ppm, while in scenarios 2 and 3, no CO is generated.
3.7. CO2 Concentration Figure
Figure 9 also shows the levels of CO2 concentration resulting from various fire scenarios at different simulation times.
Note: The graph omits the CO2 concentration for the first 100 seconds of the simulation for clarity.
According to Figure 9, in Scenario 1, at point A, the concentration of CO2 varies between 12,000 to 16,000 ppm over a duration of 310 to 440 seconds. In scenario 2, the concentration varies between 12,000 - 14,000 parts ppm within a period ranging from 330 to 390 seconds and in scenario 3, the concentration falls below 7000 ppm. At point B, in scenario 1, the carbon dioxide concentration fluctuates between 12,000 to 18,000 ppm from 310 to 420 seconds. In scenario 2, the concentration surpasses 12,000 to 16,000 ppm between 310 to 480 seconds. In scenario 3, the concentration remains below 12,000 ppm for the entire duration of the simulation. At point C, in scenario 1, CO2 concentration fluctuates between 5000 to 7500 ppm from 340 seconds until the end of the simulation. In scenario 2, the concentration varies between 2000 to 5000 ppm from 330 to 430 seconds. In Scenario 3 shows a peak concentration of 500 ppm. At point D, in scenario 1, the maximum concentration peaks at 2000 ppm, while in scenarios 2 and 3, it remains stable compared to the initial time.
3.8. Oxygen Concentration Figure
Figure 10 shows O2 concentration (%) during fire scenarios at various times.
Note: The oxygen concentration stays at 21% for the initial 100 seconds of the simulation, but this information is not depicted in the graph.
According to Figure 10, in scenario 1, point A shows the lowest O2 concentration at 18% between 320 to 440 seconds. In scenario 2, the concentration drops to 18% between 340 to 370 seconds, and in scenario 3, it reaches 20% between 240 to 490 seconds of the simulation. At point B, in scenario 1, the lowest O2 concentration is 18% from seconds 320 to 560, in scenario 2, it is 18% from seconds 320 to 370, and in scenario 3, it is 19% from seconds 300 to 460 of the simulation. At point C in scenario 1, the oxygen concentration is 20% from 275 seconds onwards, and in scenario 2, it is 20% from 310 seconds until the end of the simulation. In scenario 3 at point C and in all scenarios at point D, the oxygen concentration remains constant at 21%. At point C, in scenario 1, O2 concentration is 20% from 275 seconds until the end of the simulation. In scenario 2, it remains at 20% from 310 seconds until the end. In scenario 3 at point C and in all scenarios at point D, O2 concentration remains constant at 21%.
4. Discussion
The primary goal of fire safety is to ensure safe evacuation and protect human life. In the event of a building fire, factors such as fire growth rate, spread, smoke volume, heat intensity, toxicity, and visibility play a critical role in determining response strategies[20]. This study evaluated the effectiveness of both portable and ceiling exhaust systems in controlling fire byproducts to reduce risks for occupants and firefighters.Three scenarios were defined: Scenario 1 had no control measures, Scenario 2 employed a portable exhaust system, and Scenario 3 utilized ceiling exhaust systems.The analysis of 3D figures at the 600th second of the fire demonstrated that Scenario 3 was more effective than Scenario 2 in reducing smoke levels and enhancing visibility, despite both scenarios utilizing identical exhaust systems.This difference may be attributed to several factors. For instance, in both scenarios, the smoke detectors are activated simultaneously. However, in Scenario 2, there is a 2-minute delay in the activation of the portable exhaust system due to the manual installation and activation process. Additionally, because hot air has a lower density than cold air and rises upward, ceiling exhaust systems are more effective at removing smoke. This process reduces smoke concentration in the area, thereby enhancing visibility. Another contributing factor is that the ceiling exhaust system is installed in three optimal positions, which facilitates the extraction of smoke from various directions. Liang et al. (2019) similarly found that effective air vent positioning, airflow, and optimal design can improve occupant evacuation safety during a fire[34]. In Scenario 3, visibility near the fire source and exit door remained above 5 meters for approximately 170 seconds after ignition. Figure 3 shows that only nurses and familiar individuals can successfully evacuate at this visibility level. Moreover, during the simulation, visibility in the middle of the NICU and its exit corridors was sufficient to ensure the safe evacuation of both medical personnel and visitors.In Scenario 3, temperatures near the fire and exit door ranged from 60 to 70°C from 310 to 380 seconds. According to Figure 3, this duration of exposure is shorter than the maximum endurance time for this range, so prompt evacuation poses no risk to patients, staff, or visitors. Conversely, Scenario 2 indicates that portable exhaust systems are less efficient than ceiling systems, leading to a smaller temperature decrease. As a result, from seconds 290 to 390, the fire ignition temperature exceeded 80°C. According to Figure 3, this temperature is unacceptable and poses a significant risk of harm to individuals.In a study conducted by Long et al. (2017), the results indicated that the highest temperatures occur in the room where the fire originated [25], which aligns with the findings of the current study.The carbon monoxide (CO) concentration in all scenarios was not hazardous due to short exposure times. However, Scenario 1 recorded a CO level of 750 ppm near the fire room exit, which can cause headaches, unconsciousness, and vomiting after 45 minutes. Exhaust systems have not effectively reduced CO2 levels in the fire room, which can elevate blood pressure and heart rate. In the middle and exit corridors, located away from the fire, CO2 levels are safe for occupancy. This study identifies the lowest oxygen concentration in Scenario 1, which is located near the fire room exit and the portable exhaust system. As shown in Figure 3, this low level can impair judgment and balance. The decrease in oxygen is due to increased CO2 and other gases in the confined space, along with oxygen consumption from combustion. Additionally, the proximity to the exit and the exhaust intake leads to the accumulation of toxic gases and further reduction in oxygen levels. The study found that the portable exhaust system raised oxygen levels by 1%, while a ceiling exhaust system increased them by 2% compared to the scenario without any exhaust system.Behbahani et al. (2021) analyzed two fire scenarios: one with and one without a ventilation system. The results revealed a 93% reduction in smoke concentration and a 65% decrease in temperature in the ventilated scenario compared to the non-ventilated one[35].This study confirms these findings. Also Hashemi (2019) emphasizes that smoke exhaust systems are effective in removing toxic gases and smoke in crowded or fire-prone areas[19] , which was consistent with the findings of the present study.
5. Conclusions
This study was conducted to evaluate the effectiveness of portable and ceiling exhaust systems in removing fire products, concluding that ceiling systems are more effective. Based on the results of this study, it is recommended to use CFD simulation for modeling fire consequences and evaluating the efficiency of control devices, in order to increase accuracy and facilitate the process. The findings of this study significantly enhance the comprehension of fire control equipment among medical facility architects and hospital firefighting teams, thereby facilitating its effective utilization to mitigate fire-related damage. This research assesses the advantages and disadvantages of various fire control devices through performance simulations, which empowers builders to make informed design choices and improve safety measures. Additionally, firefighting teams can refine their incident management strategies, ultimately reducing casualties and financial losses during emergency situations.
Author Contributions
Conceptualization, M.O. and R.M.; methodology, M.O. and R.M.; software, R.M.; validation M.O. and R.M.; formal analysis, M.O. and R.M.; investigation, M.O. and R.M.; resources, M.O. and R.M.; data curation, M.O. and R.M.; writing—original draft preparation, M.O. and R.M.; writing—review and editing, M.O. and R.M.; visualization, M.O. and R.M.; supervision, M.O. and R.M.; project administration, M.O. and R.M.; funding acquisition, M.O. and R.M.;. All authors have read and agreed to the published version of the manuscript.
Funding
research was funded by the Bushehr University of Medical Sciences, grant number 2213 and The APC was funded by the Bushehr University of Medical Sciences.
Data Availability Statement
The original contributions presented in the study are included in the article, further inquiries can be directed to the corresponding author.
Conflicts of Interest
The authors declare no conflicts of interest.
References
- Ouache R, Ruparathna R, Sadiq R, Hewage K. Fire risk assessment model for residential buildings using bow-tie method. The University of British Columbia. 2018.
- Cai Q, Tang S, He L, Hu Q, Li Z, Zhang C. A safety risk decision approach to fire secondary accidents in operating subway environment. FRESENIUS ENVIRONMENTAL BULLETIN. 2022;31(7):6800-18.
- Zhi-Xiang X, Xiao-Fang Z, Hua S, Wen-Li G. Applied research of performance-based fire protection design in a large building. Procedia Engineering. 2011;11:566-74. [CrossRef]
- HR S. Analyzing the Risk of Fire in a Hospital Complex by" Fire Risk Assessment Method for Engineering"(FRAME). International Archives of Health Sciences. 2014;1(1).
- Alibeigi M, Goli NA, Safarabadi M, Choghaee M, Eyni E, Jokar A. Assessing the level of preparedness of Arak teaching hospitals for dealing with natural disasters and unexpected events in 2016. J Adv Pharm Educ Res. 2019;9(Suppl 2):111.
- HOSSEINI SH, Seddighi A, HOSSEINI AH. Pathology of Mashhad hospitals with emphasis on passive defense approach case study: Razavi and Emam Reza hospitals. 2014.
- Sahebi A, Jahangiri K, Alibabaei A, Khorasani-Zavareh D. Factors influencing hospital emergency evacuation during fire: A systematic literature review. International journal of preventive medicine. 2021;12. [CrossRef]
- Shafiei E, Yousefi K, Sahebi A. Lessons learned; hospital emergency evacuation in Ilam, Iran. 2019.
- Rahmani A, Salem M. Simulation of fire in super high-rise hospitals using fire dynamics simulator (FDS). Electronic Journal of General Medicine. 2020;17(3):5. [CrossRef]
- Sharma R, Bakshi H, Banerjee A. Fire safety hazards: How safe are our hospitals? Indian journal of community medicine. 2020;45(1):104-5.
- Habibi E. Evaluation of the Risk of Fire by FRAME method and survey effect of sprinkler system existence, on the level of fire risk in the University hospital in 2016.
- Lu S, Mei P, Wang J, Zhang H. Fatality and influence factors in high-casualty fires: A correspondence analysis. Safety science. 2012;50(4):1019-33. [CrossRef]
- Hurley MJ, Gottuk DT, Hall Jr JR, Harada K, Kuligowski ED, Puchovsky M, et al. SFPE handbook of fire protection engineering: Springer; 2015.
- Zaroushani V, Khajehnasiri F. Challenges on Hospital Fire Safety during COVID-19 Crisis. Journal of Health and Safety at Work. 2022;12(2):237-43.
- Bahranifard A, Rahzani K, Rad AAM, Malekpour M. Proposing an optimization procedure and applying management performance in health and medical emergency on preparedness of emergency department in suburb city hospitals. 2017.
- Hokmabadi R, Mahdinia M, Zaree R, Mirzaee M, Kahsari P. Fire risk assessment by FRAME in a hospital complex. Journal of University of Medical Sciences. 2017;9(2):173-82. [CrossRef]
- Sarsangi V, Saberi H, Malakutikhah M, Sadeghnia M, Rahimizadeh A, Aboee Mehrizi E. Analyzing the risk of fire in a hospital complex by “fire risk assessment method for engineering”(FRAME). International Archives of Health Sciences. 2014;1(1):9-13.
- Bashyal C, Mishra K, Aithal P. Fire Safety Compliance Among Hospital Buildings: A Case Study from Nepal-Asia. Bashyal, C, Mishra, AK, and Aithal, PS (2022) Fire Safety Compliance Among Hospital Buildings. 2022:33-57. [CrossRef]
- Hashem S, Kouhpaei A. Fire Risk Assessment. 2nd ed.Tehran, Iran: Fanavaran Publication; 2018. pp. 71-73.
- Hashemi A. The Use of Fire Dynamics Simulation in the Analysis of a Fire Incident in an Office Building,Semnan University, Iran. 2020.
- Hu G, editor Research on the Fire of High-rise Residential Building Based on Pyrosim Numerical Simulation. IOP Conference Series: Earth and Environmental Science; 2020: IOP Publishing.
- Mousavipour S-S, Sohrabizadeh S. Emergency evacuation of the Neonatal Intensive Care Unit (NICU) during disasters: A systematic literature review. Acta Medica Iranica. 2021. [CrossRef]
- Smith VC, Dukhovny D, Zupancic JA, Gates HB, Pursley DM. Neonatal intensive care unit discharge preparedness: primary care implications. Clinical pediatrics. 2012;51(5):454-61.
- Chowdhury K. Fires in Indian hospitals: root cause analysis and recommendations for their prevention. Journal of clinical anesthesia. 2014;26(5):414-24. [CrossRef]
- Long X, Zhang X, Lou B. Numerical simulation of dormitory building fire and personnel escape based on Pyrosim and Pathfinder. Journal of the Chinese Institute of Engineers. 2017;40(3):257-66. [CrossRef]
- Pyrosim User Manual, Thunderhead Engineering, National Science Foundation, manhattan, 2023.
- McGrattan K, Hostikka S, Floyd J, McDermott R, Vanella M. NIST Special Publication 1018-1. Fire Dynamics Simulator. Technical Reference Guide. Volume 1: Mathematical Model.- November 19, 2021.
- Kim H-J, Lilley DG. Heat release rates of burning items in fires. Journal of propulsion and power. 2002;18(4):866-70. [CrossRef]
- Hurley MJ, Gottuk DT, Hall Jr JR, Harada K, Kuligowski ED, Puchovsky M, et al. SFPE Handbook, 5th Edition, Tables A.38 and A.39 Springer; 2015.
- Bilge Mİ. CFD simulation of train fire in the İstanbul metro tunnel: Middle East Technical University; 2018.
- Foschia M. Assessment of the software Fire Dynamics Simulator (FDS) for fire simulation in train convoyes. 2017.
- Shin S-K, Bae Y-H, Choi J-H. Evaluating fire risk of long-term care hospitals for the elderly. Fire science and engineering. 2021;35(6):53-60. [CrossRef]
- Conrad AN. Data inaccuracies in Texas state agency testing for ambient and indoor carbon dioxide concentrations 2005-2011.
- Liang T, Liu J, Tao P, editors. The implementation of the numerical simulation by utilization of pyrosim on the rectification of the hazard of fires. Proceedings of the 11th International Conference on Computer Modeling and Simulation; 2019.
- Behbahani F, Hamzei M, Mehrdoost Z, Moghiman M. Temperature and smoke profile of fire in the parking of a commercial building with Pyrosim software. Journal of New Applied and Computational Findings in Mechanical Systems. 2022;1(4):50-6.
Figure 1.
Fire parameter measurement and exhaust device locations in the NICU.
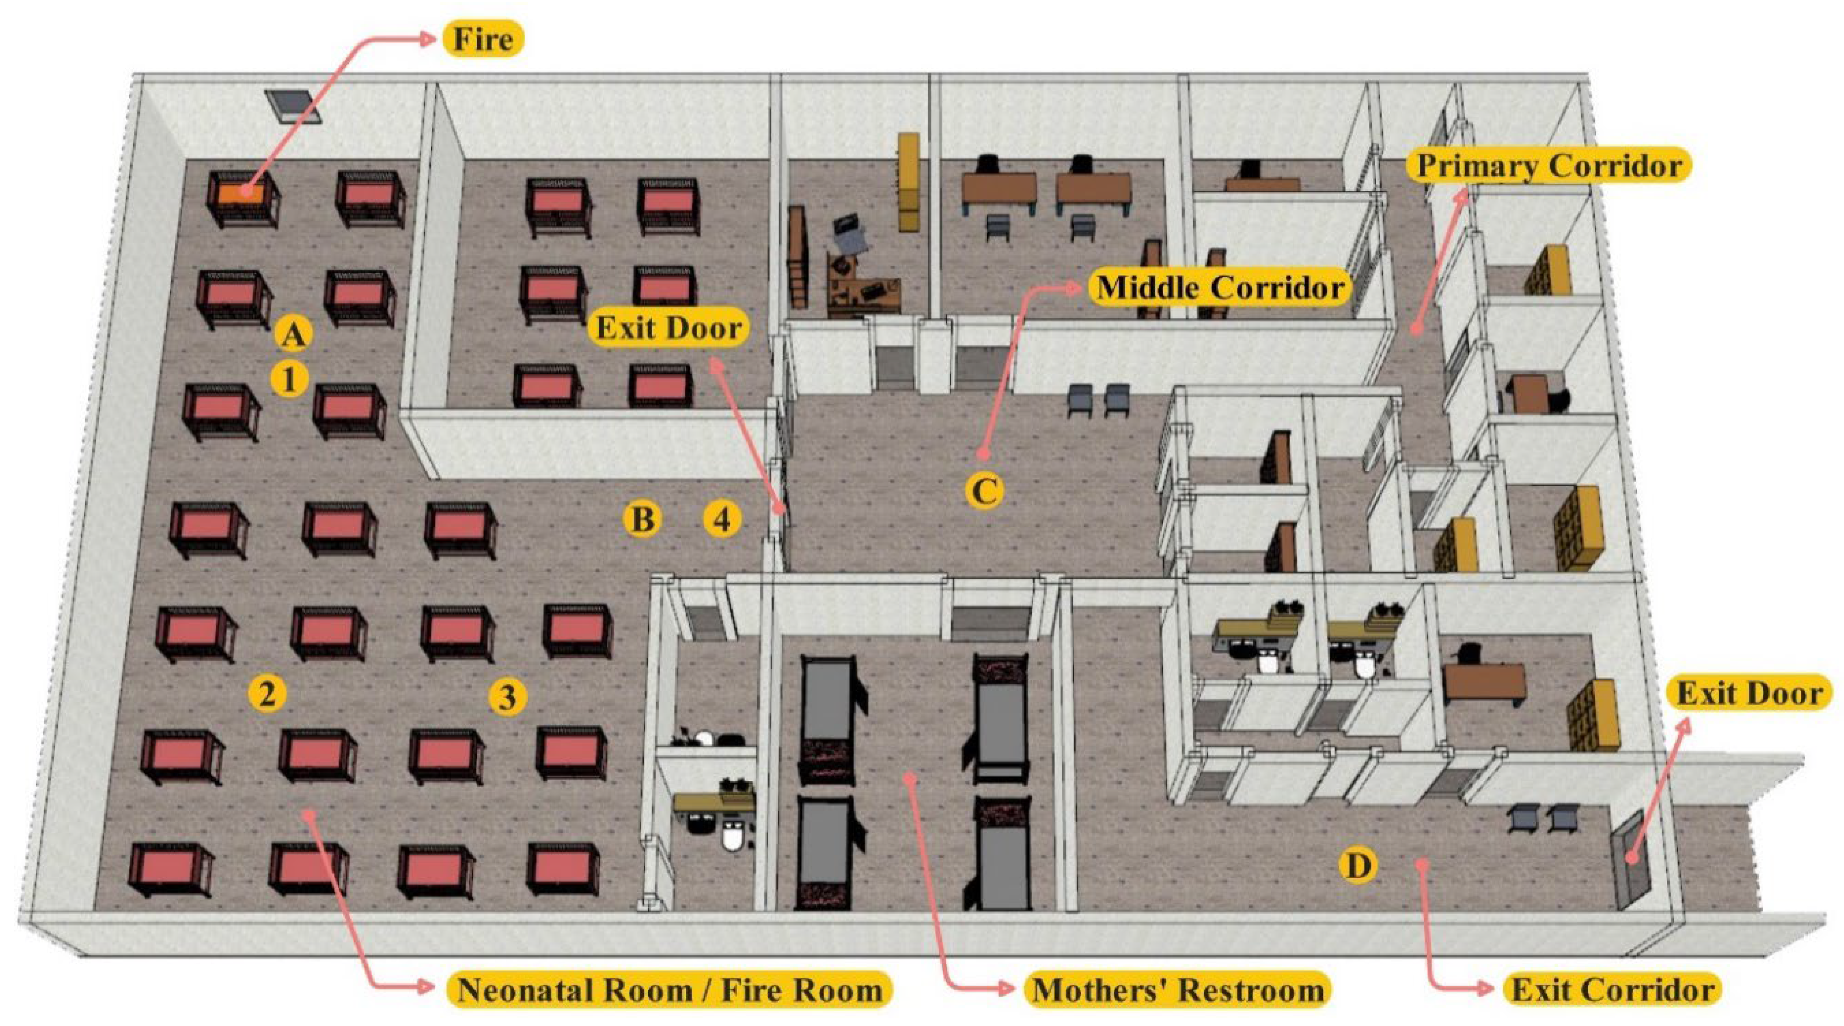
Figure 2.
Images of portable exhaust systems and the ceiling.
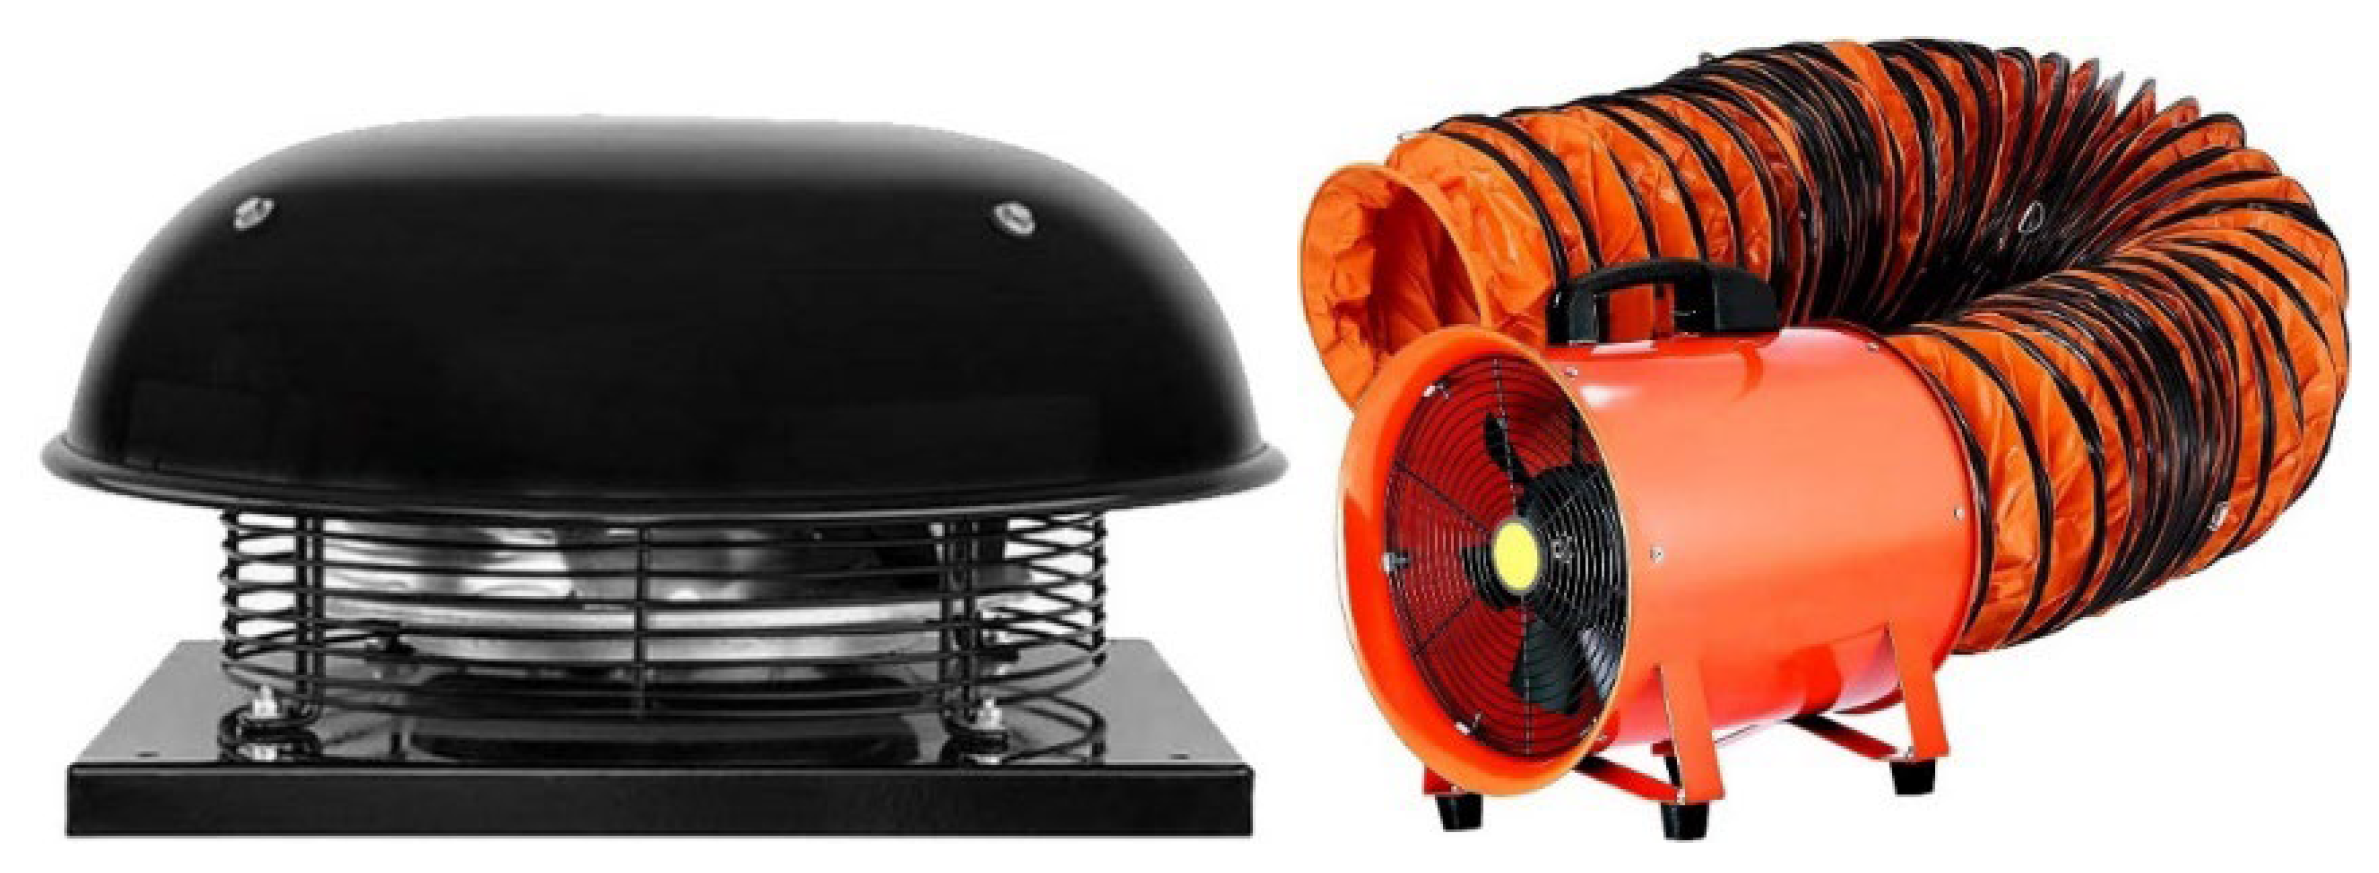
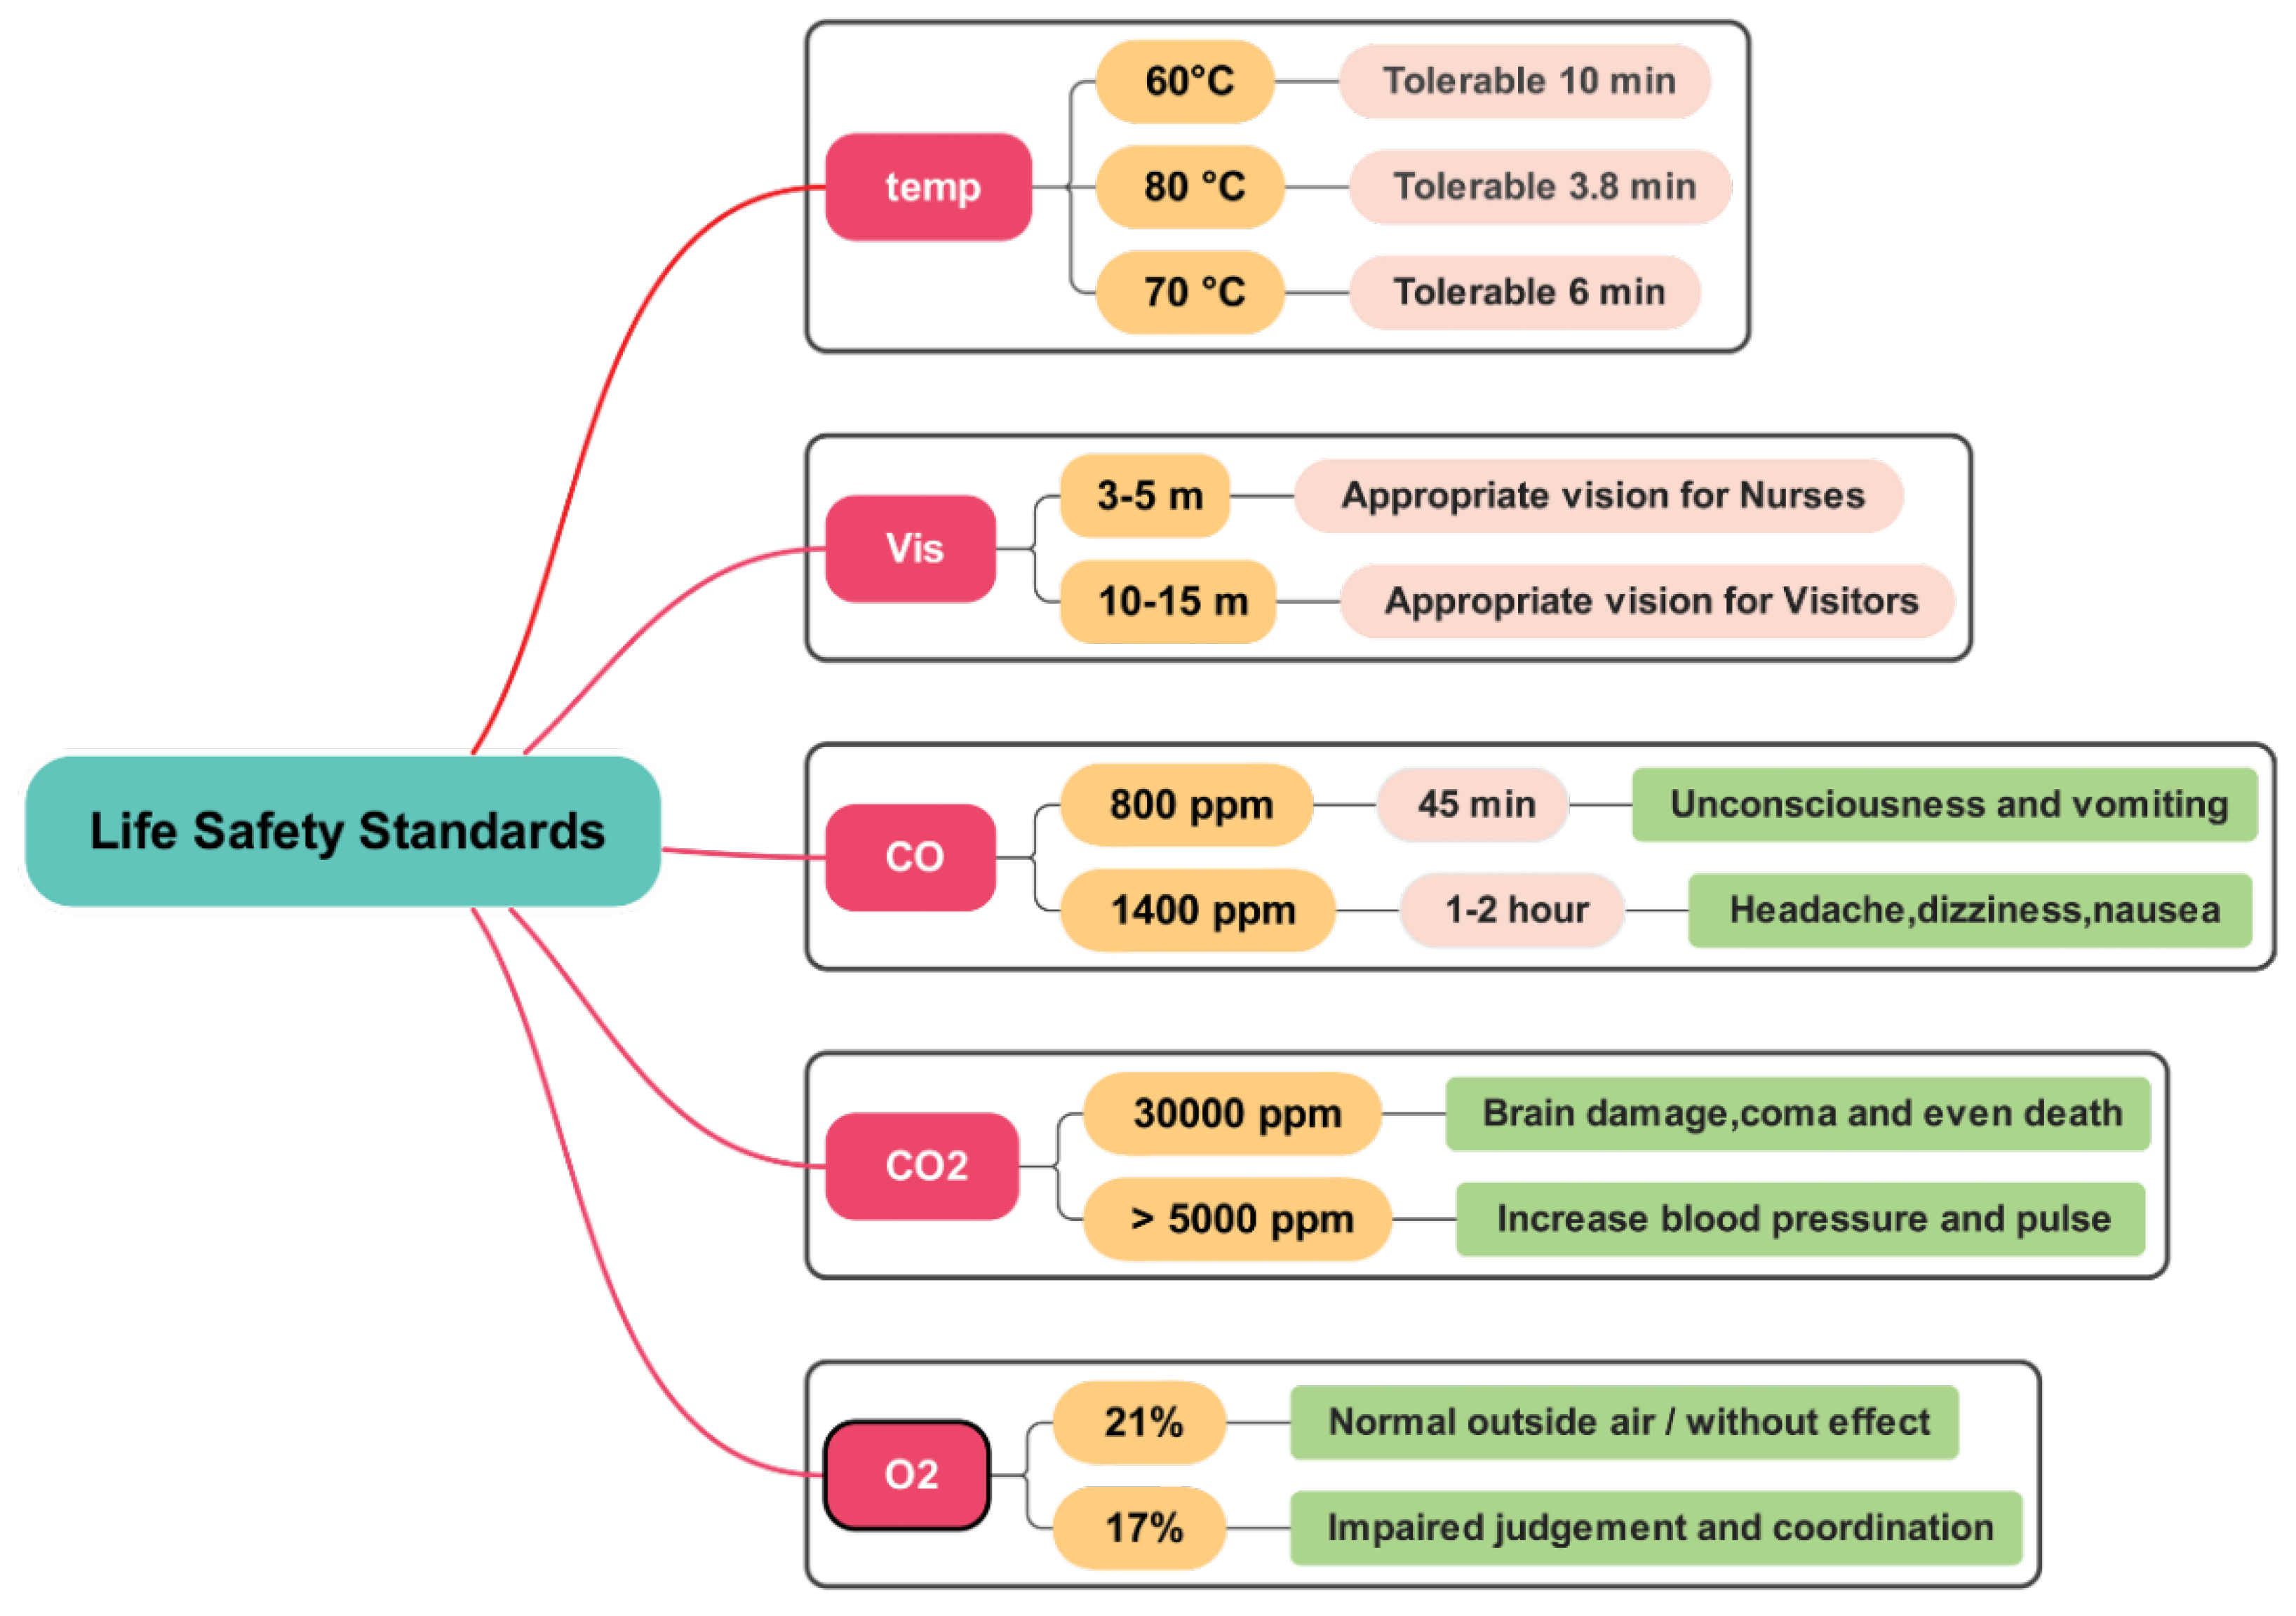
Figure 4.
3D cross-sectional view of fire smoke.
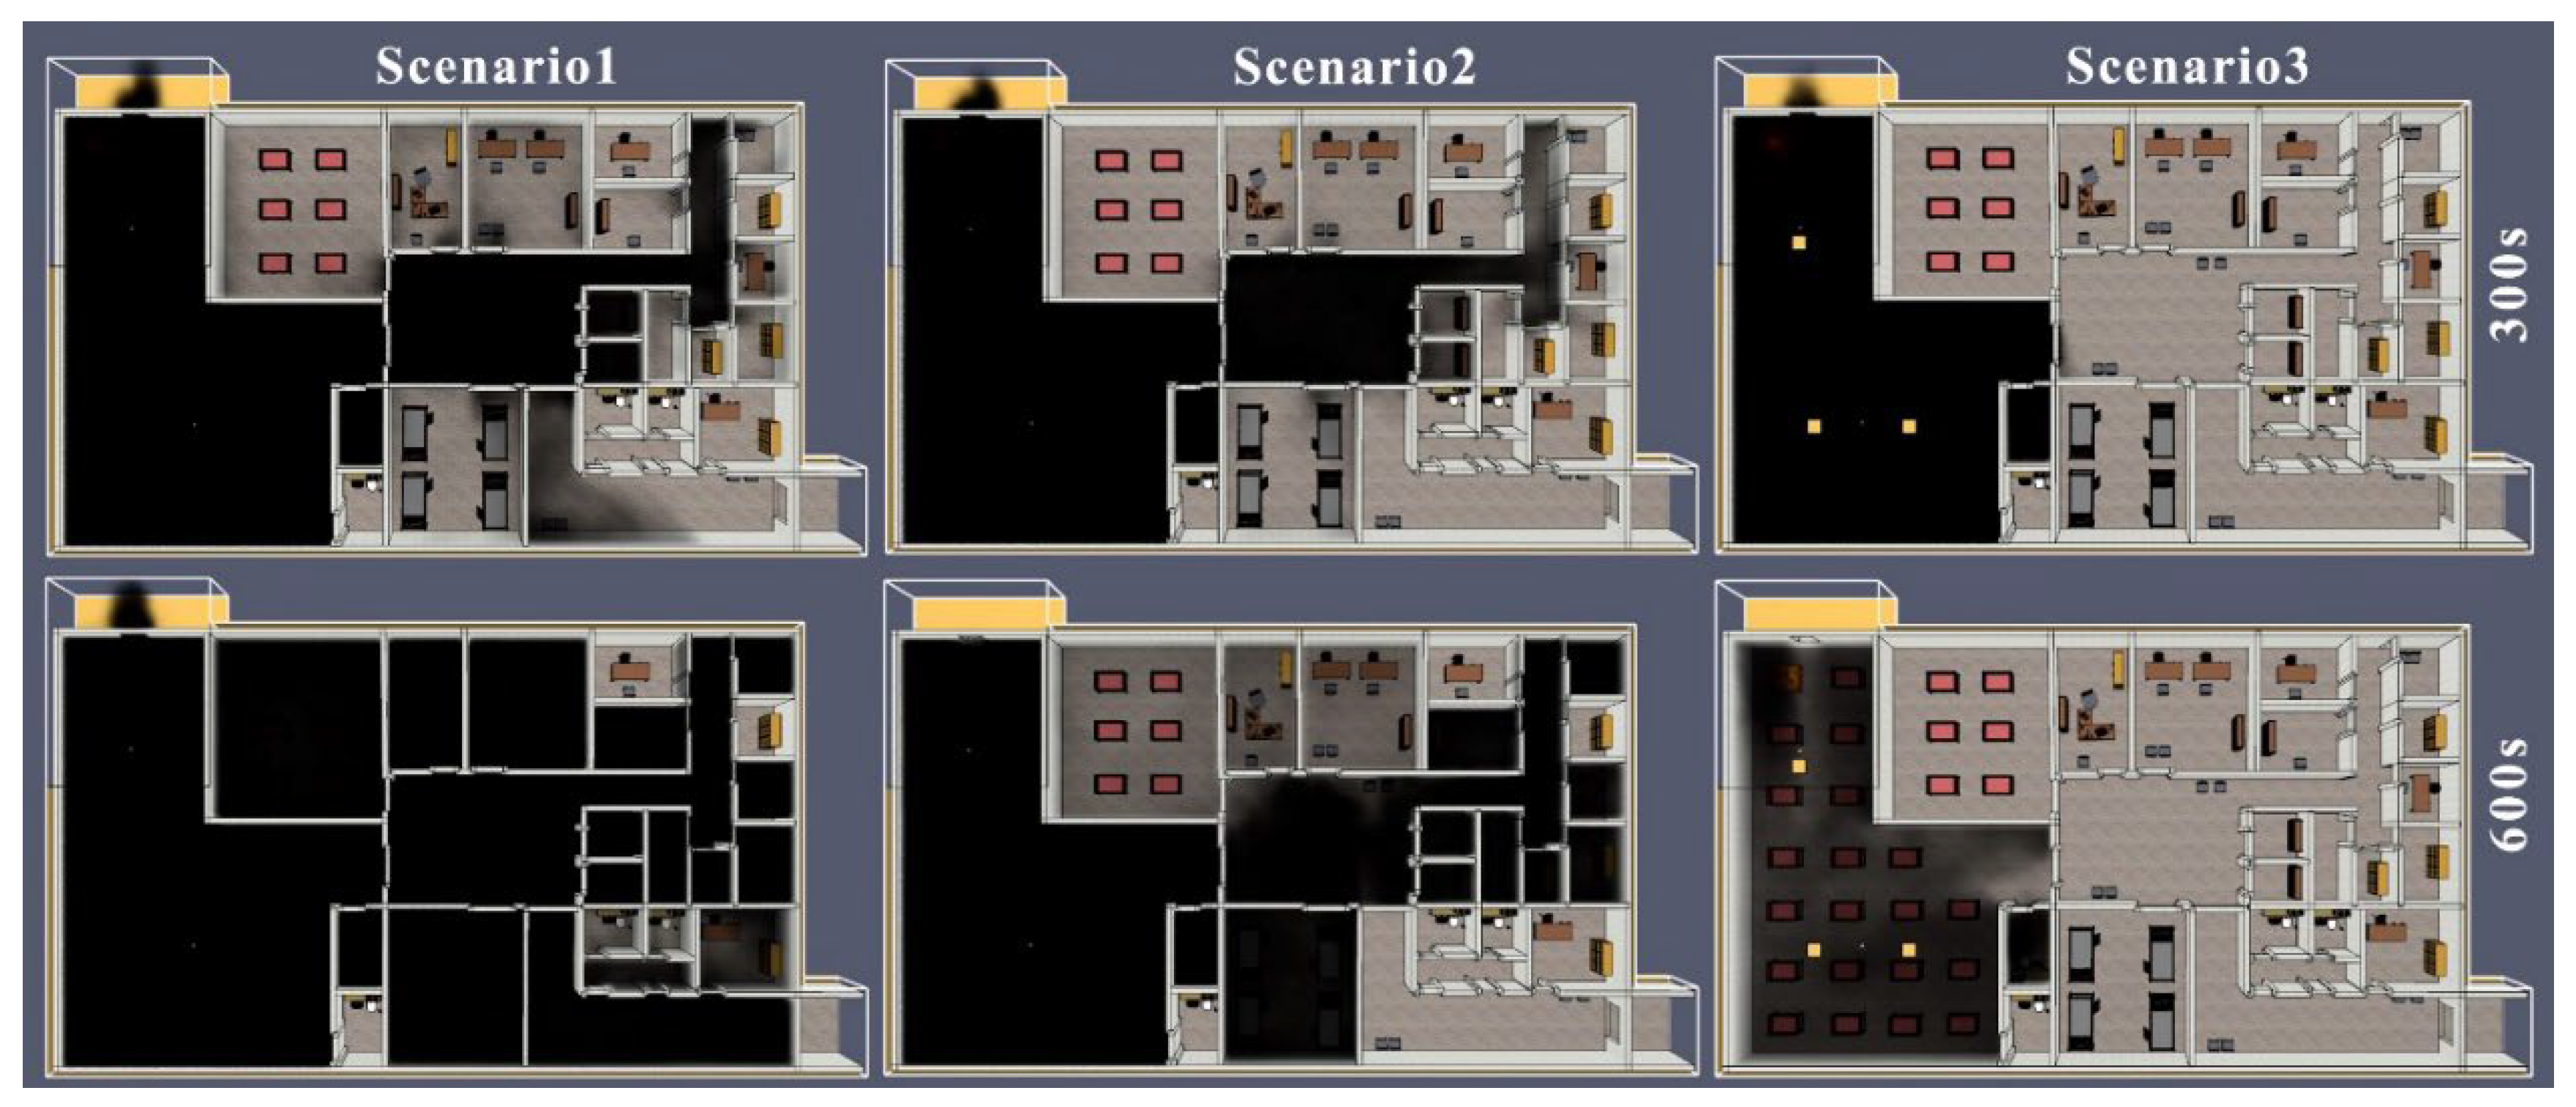
Figure 5.
3D cross-sectional view of visibility.
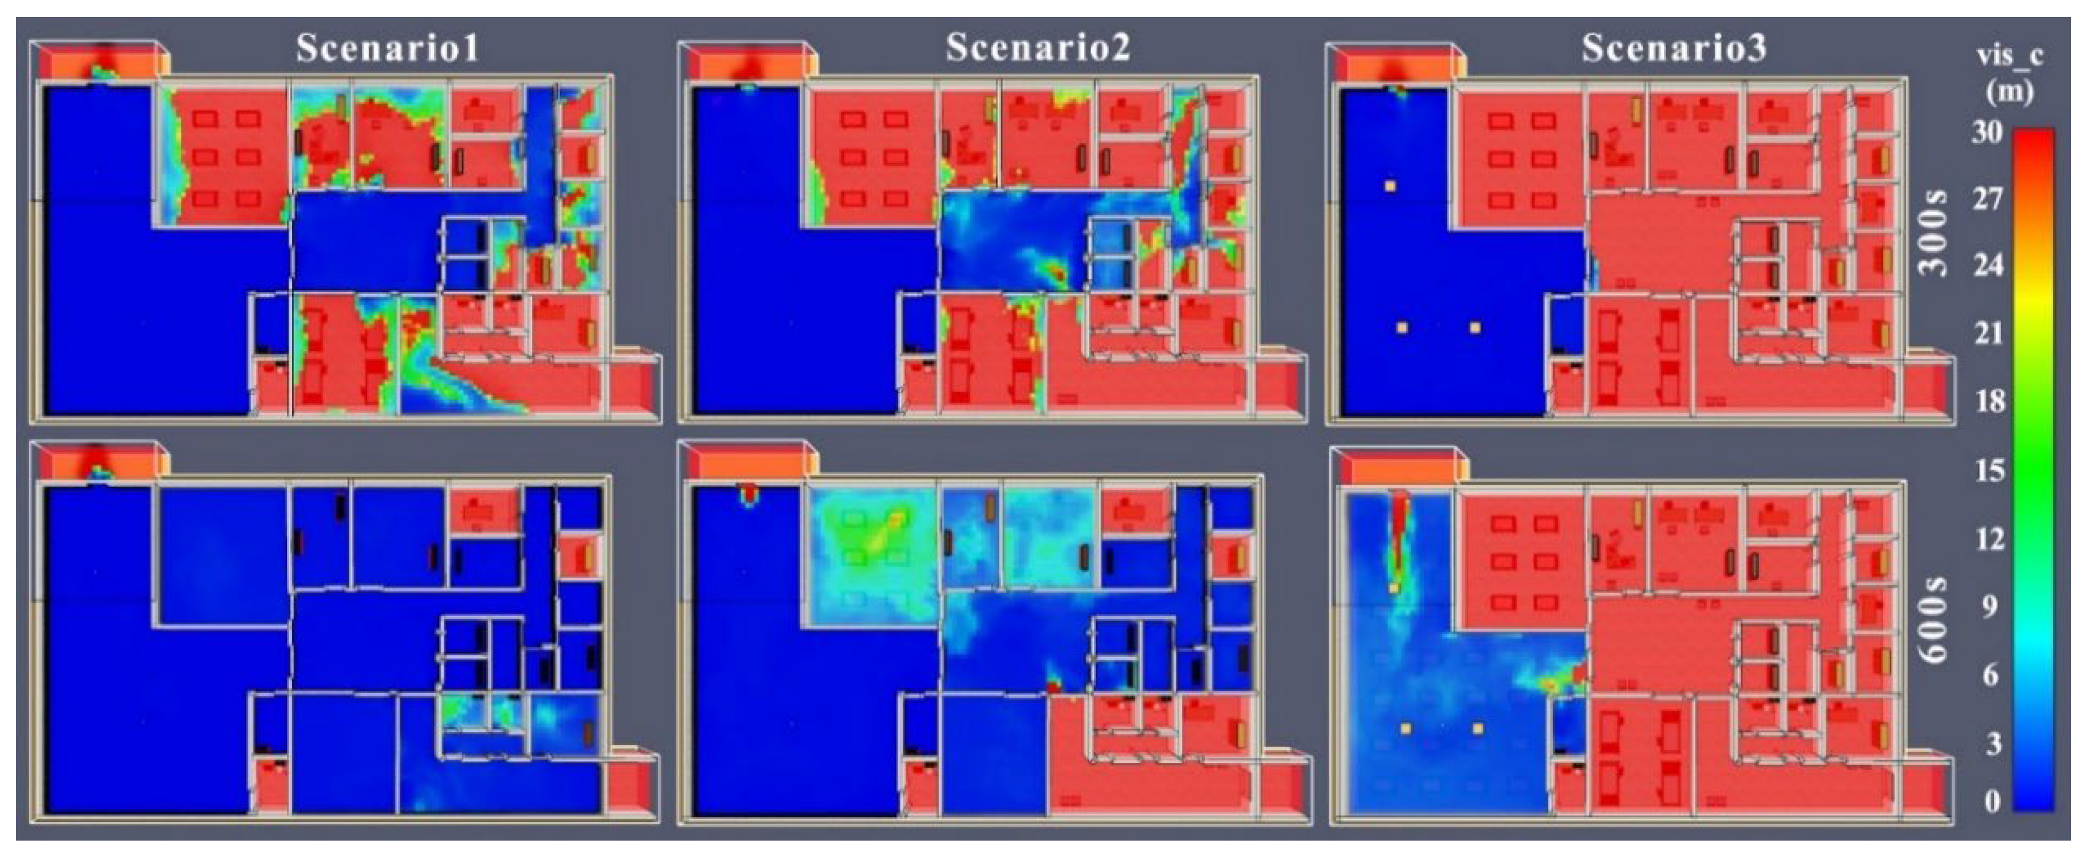
Figure 6.
diagram of Visibility Levels in Various Scenarios.
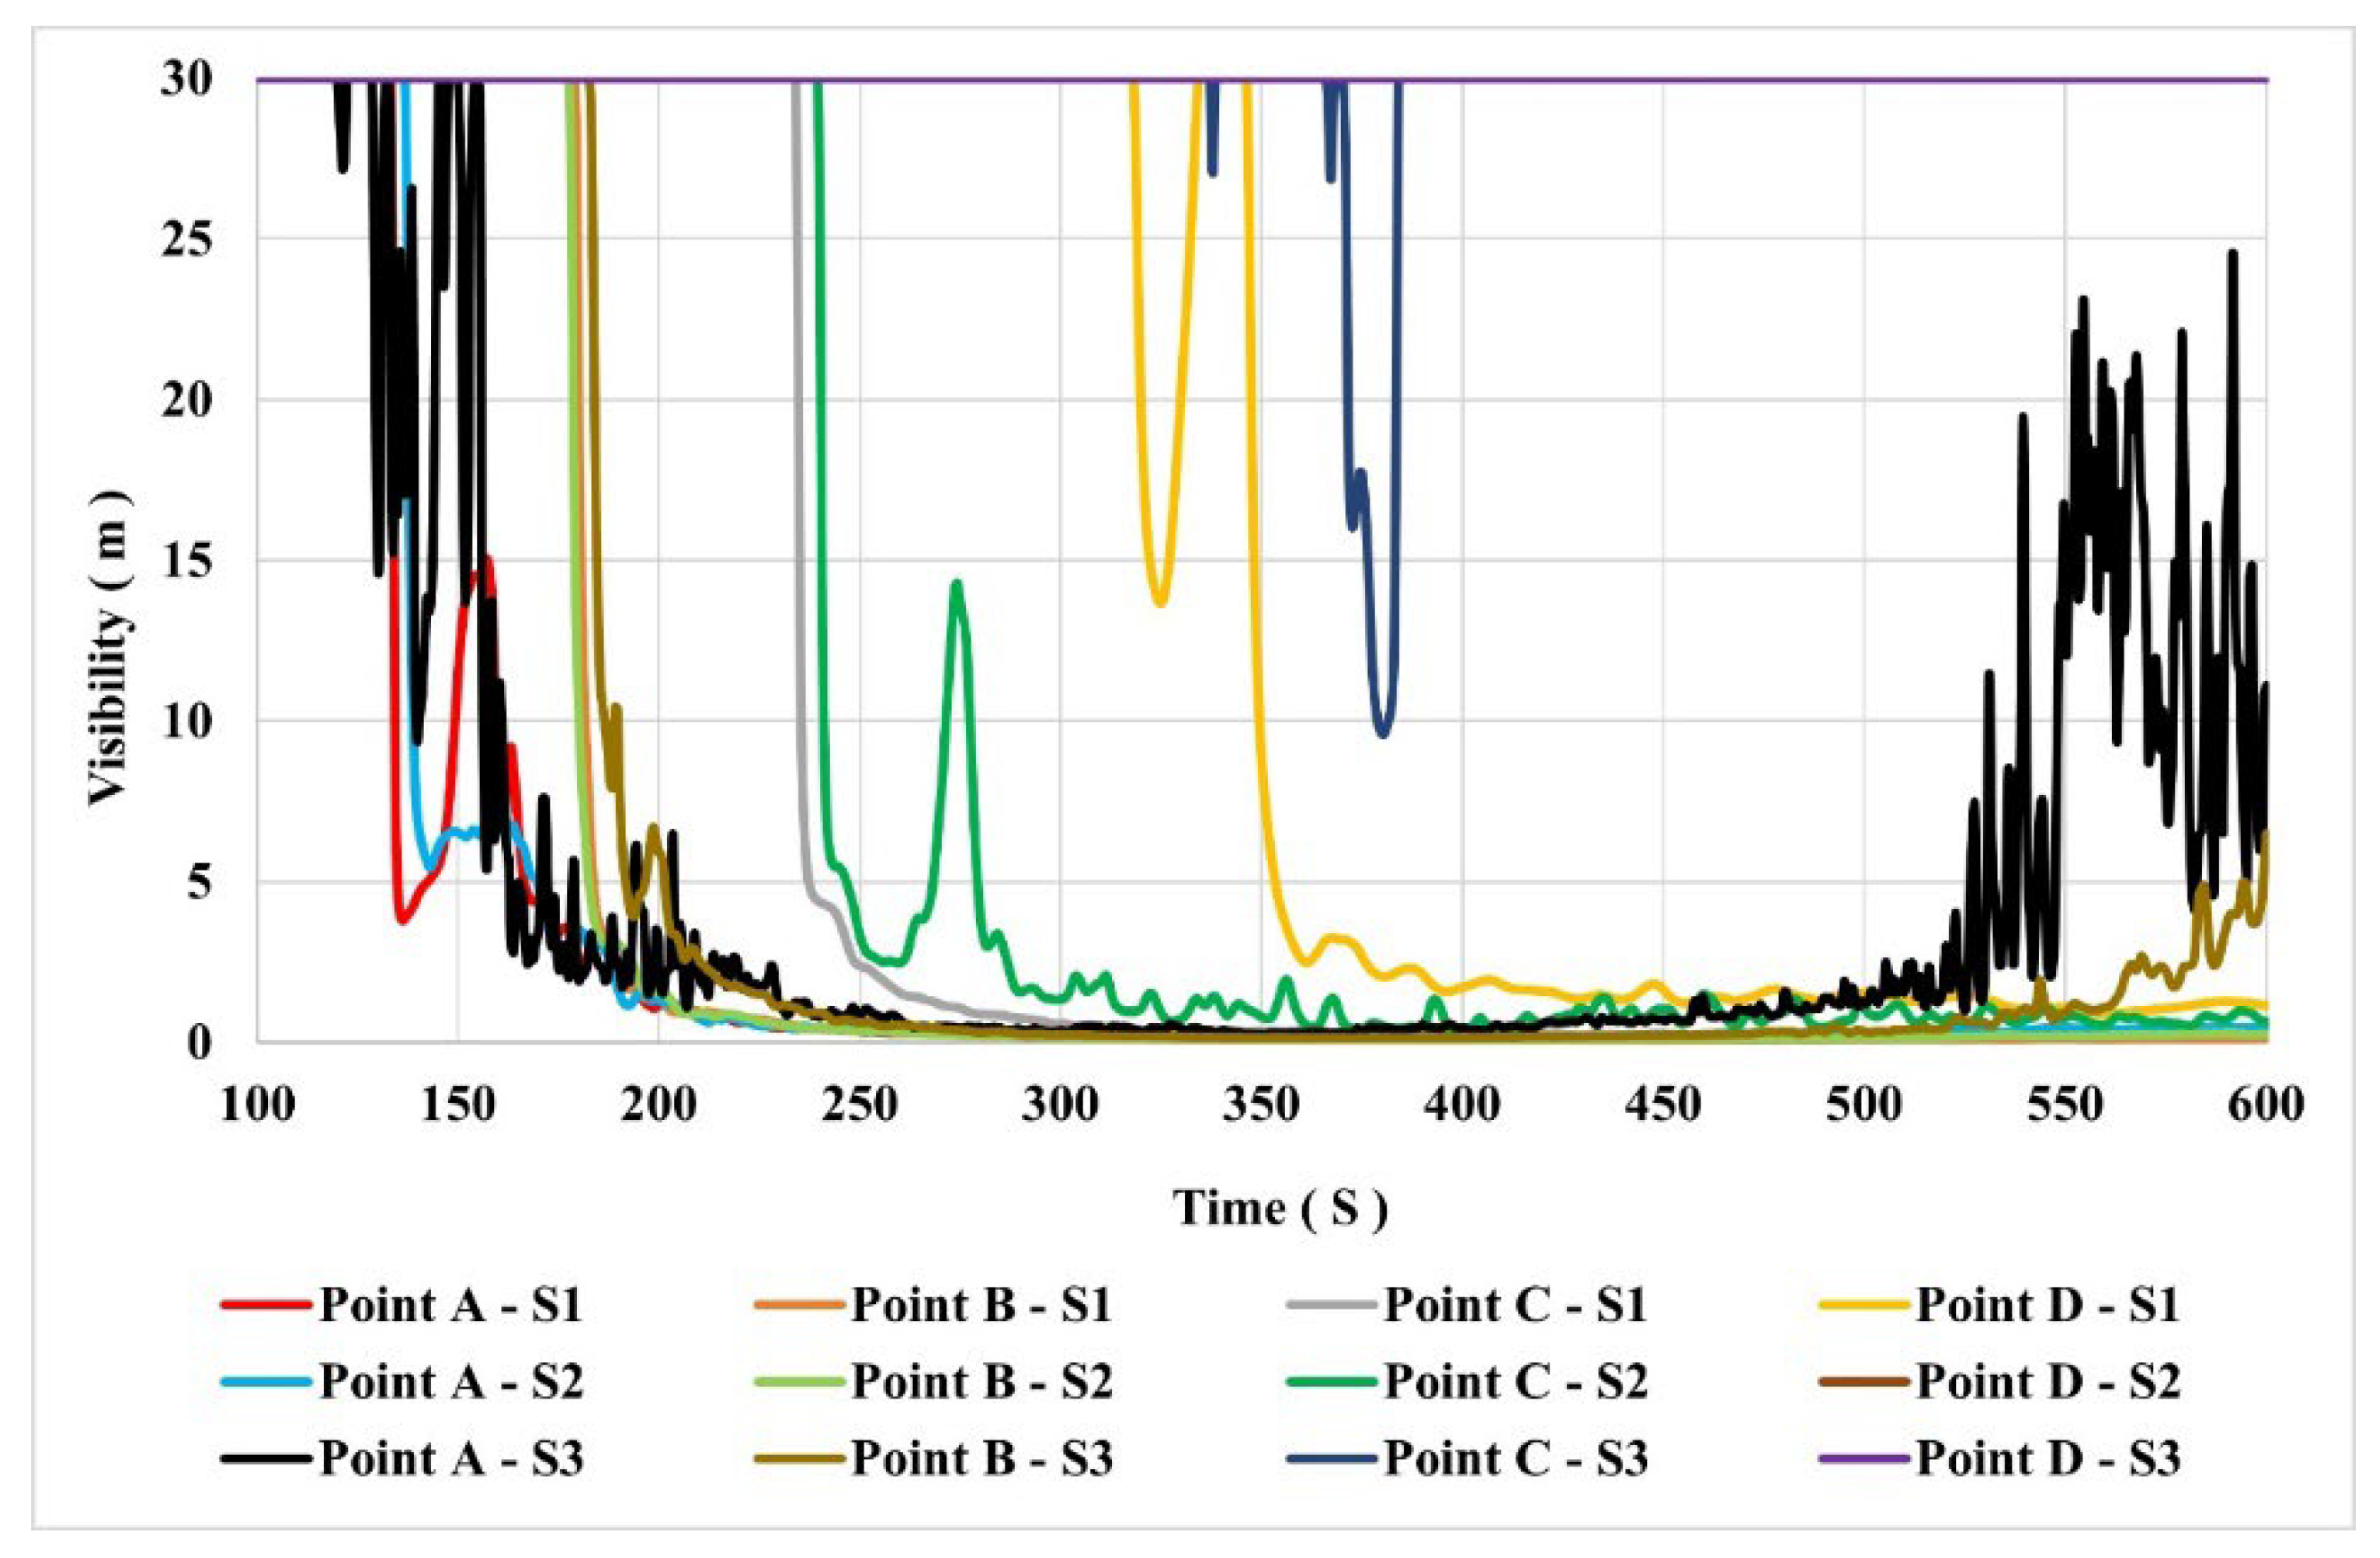
Figure 7.
diagram of Temperature Levels in Various Scenarios.
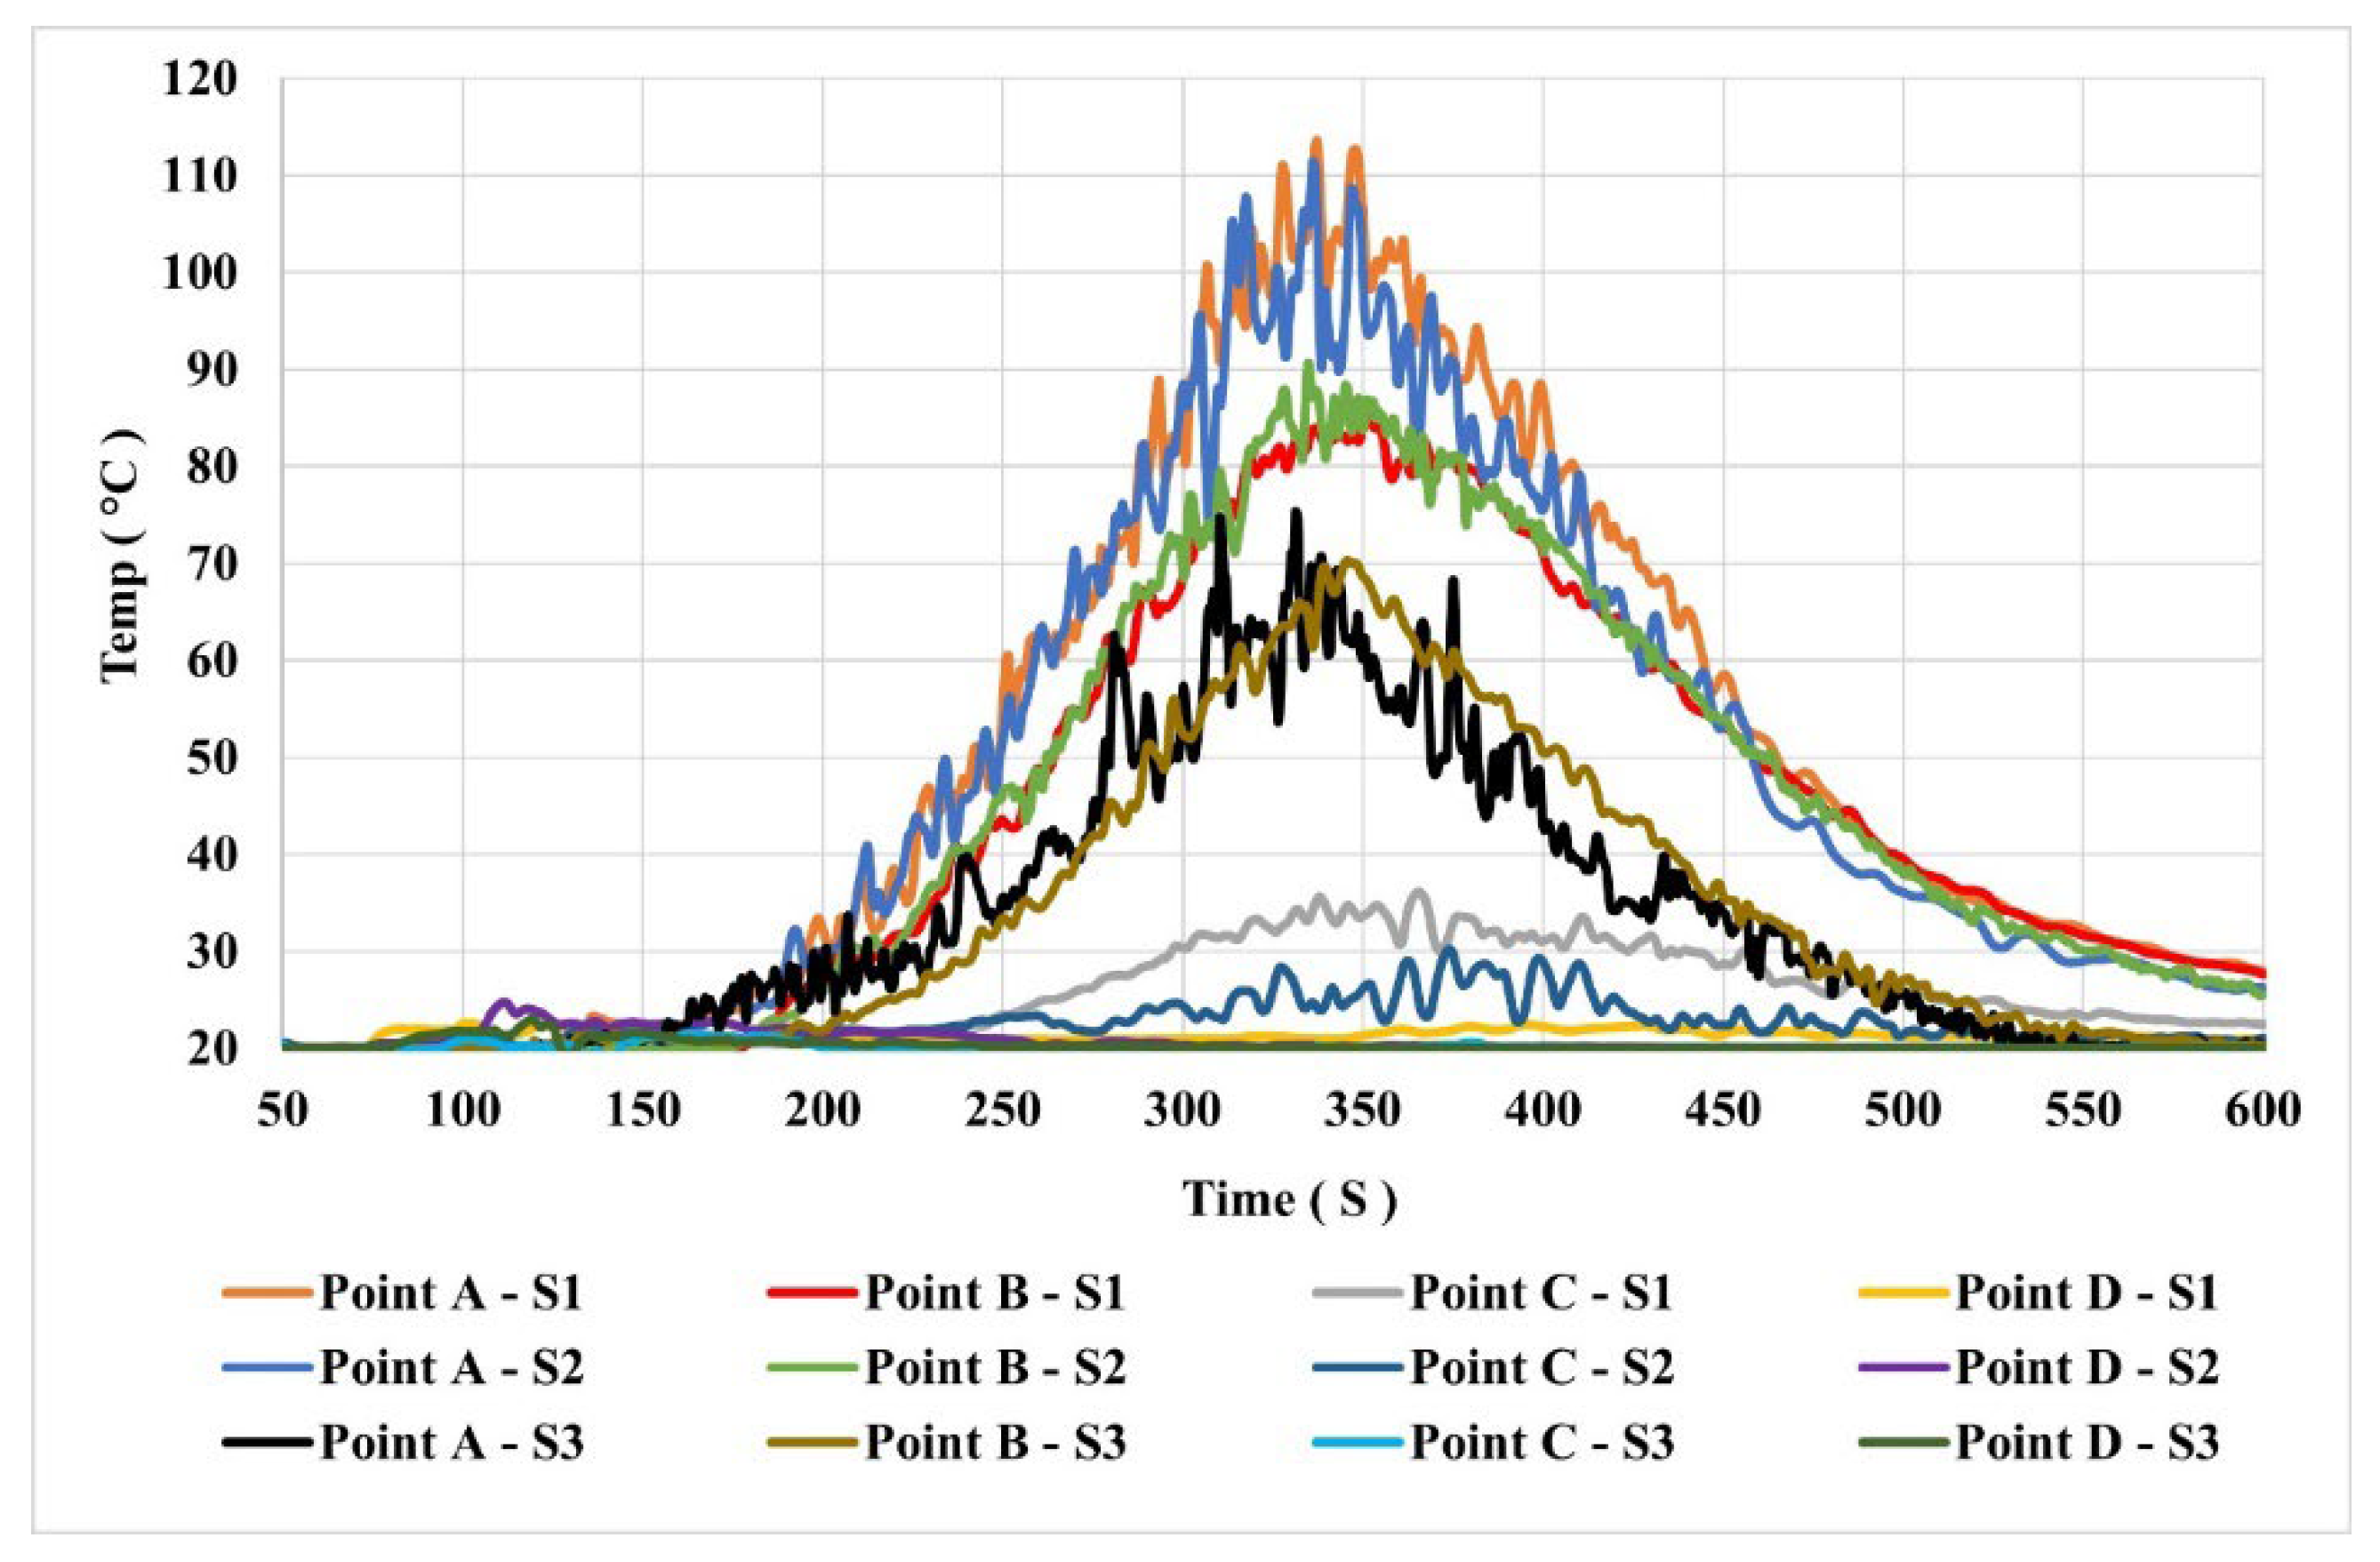
Figure 8.
Diagram of CO Concentration Levels in Various Scenarios.
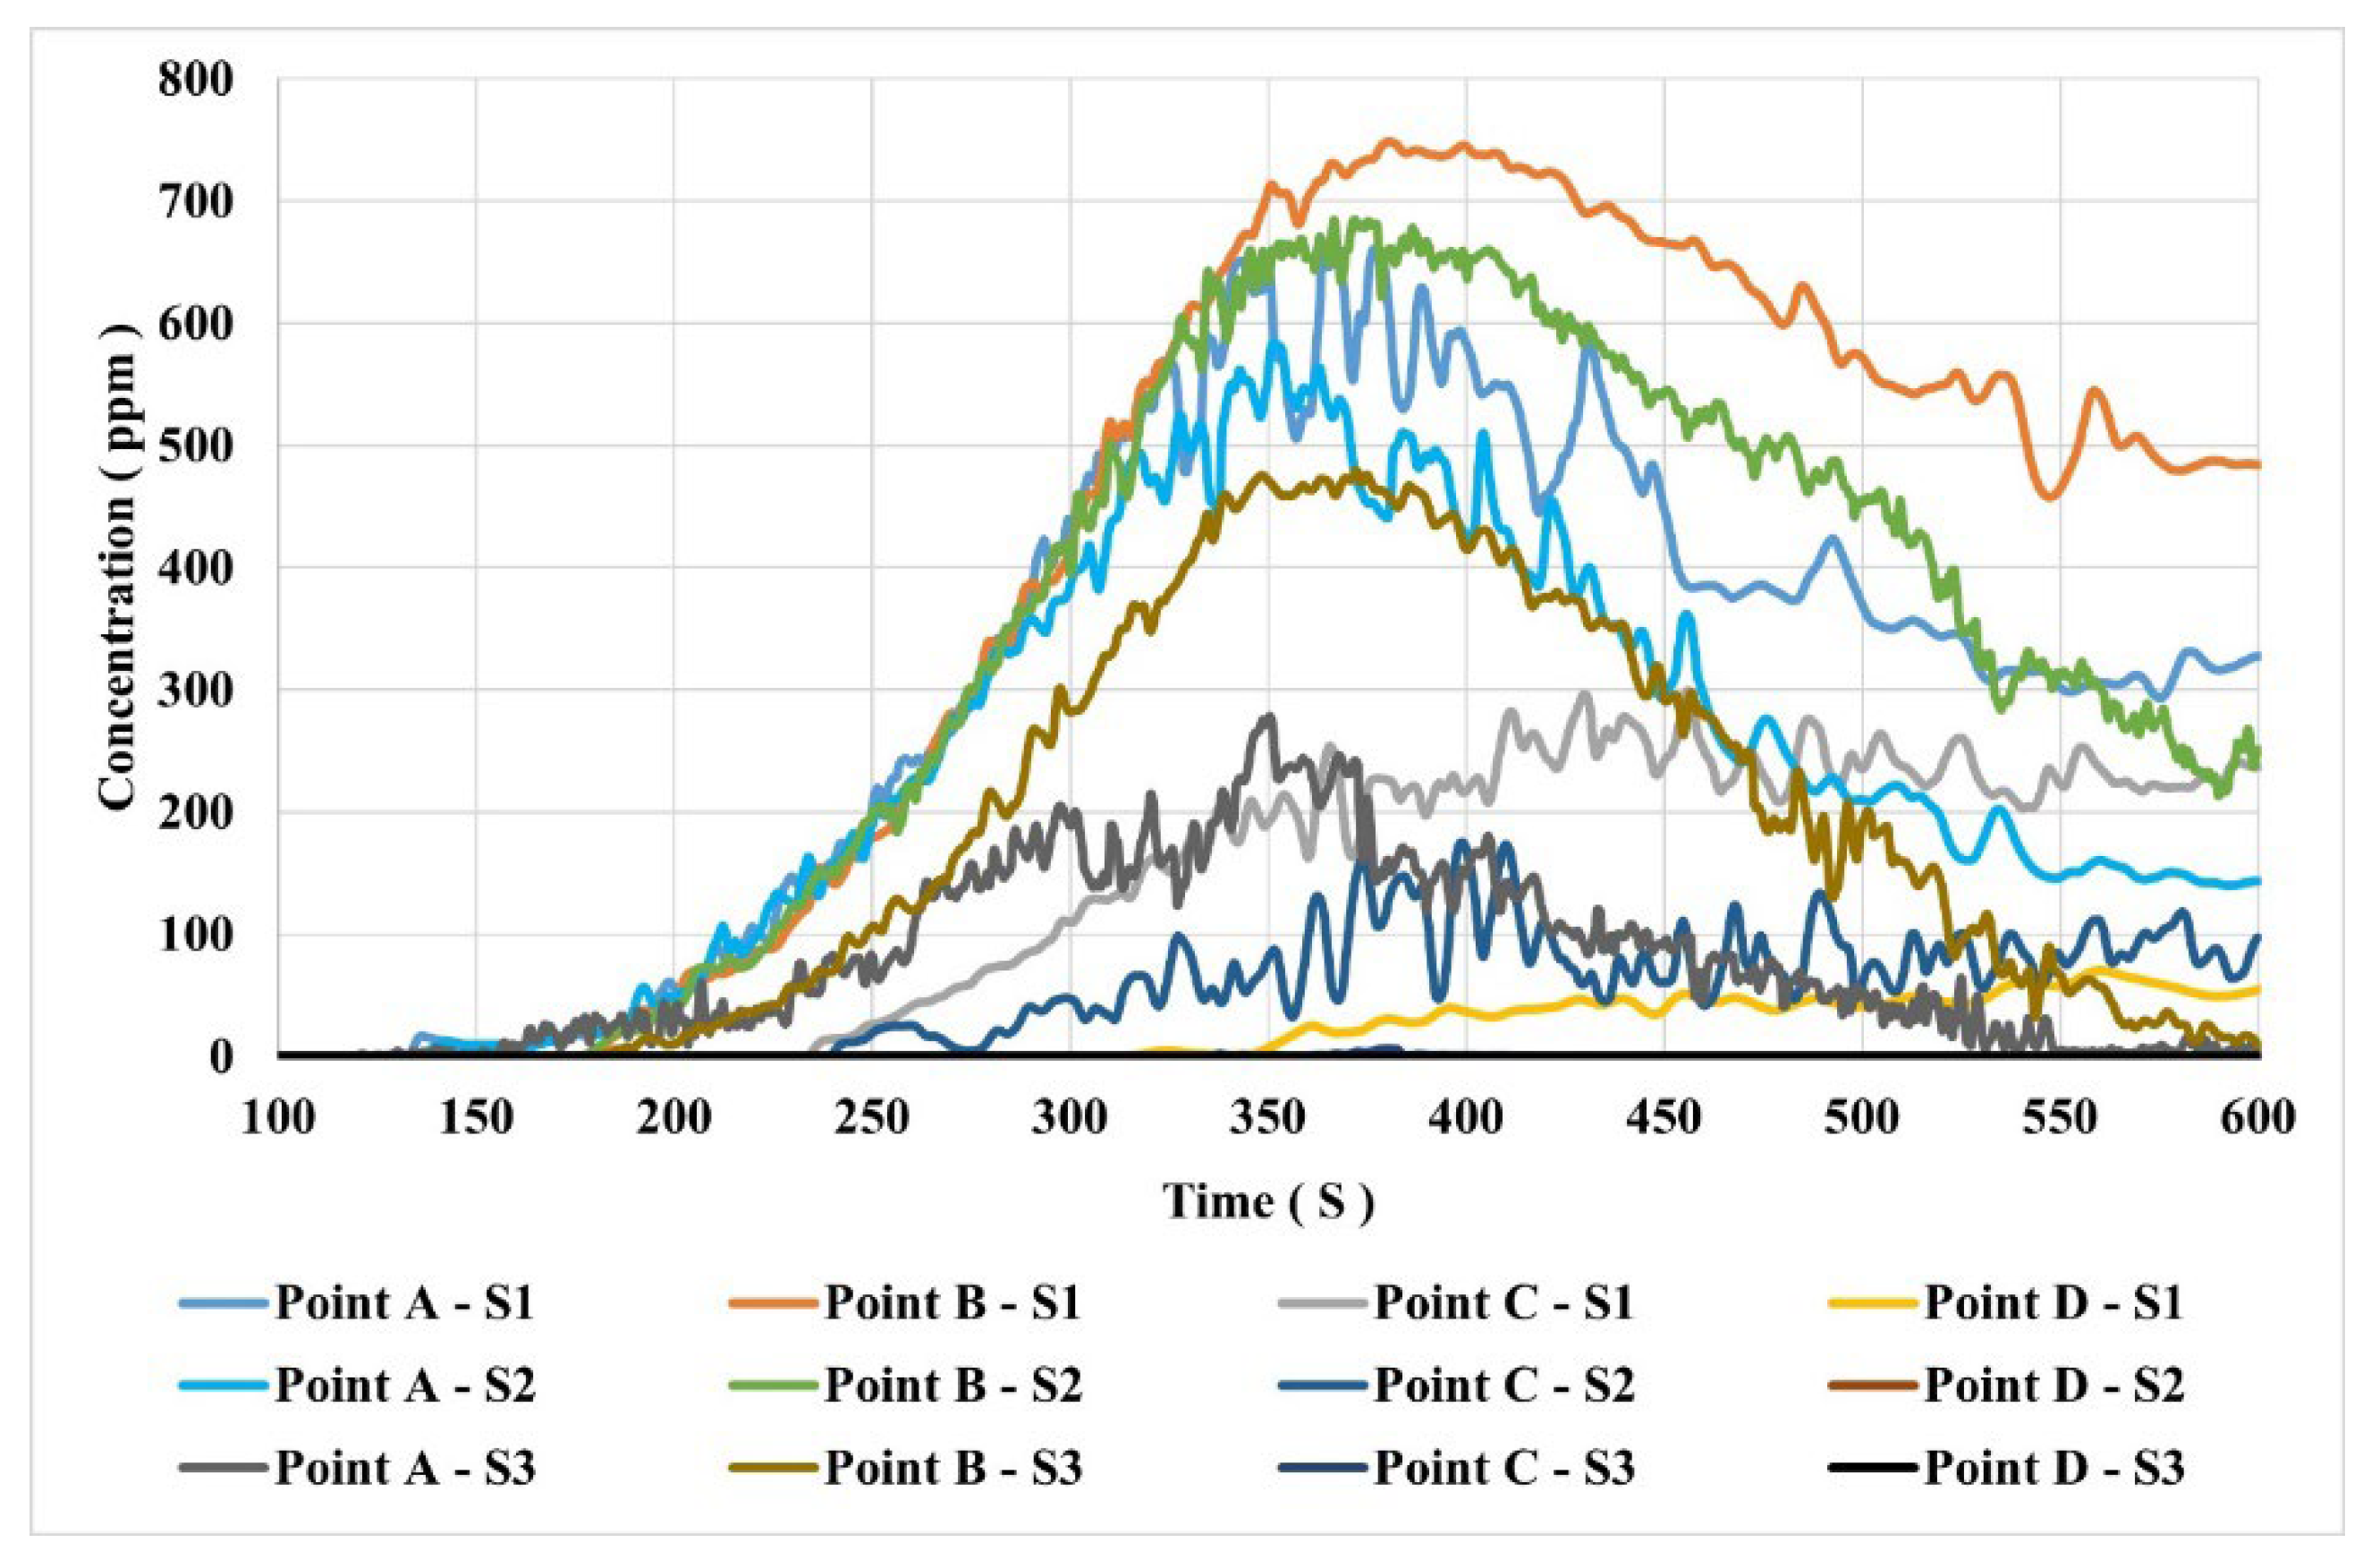
Figure 9.
Diagram of CO2 Concentration Levels in Various Scenarios.
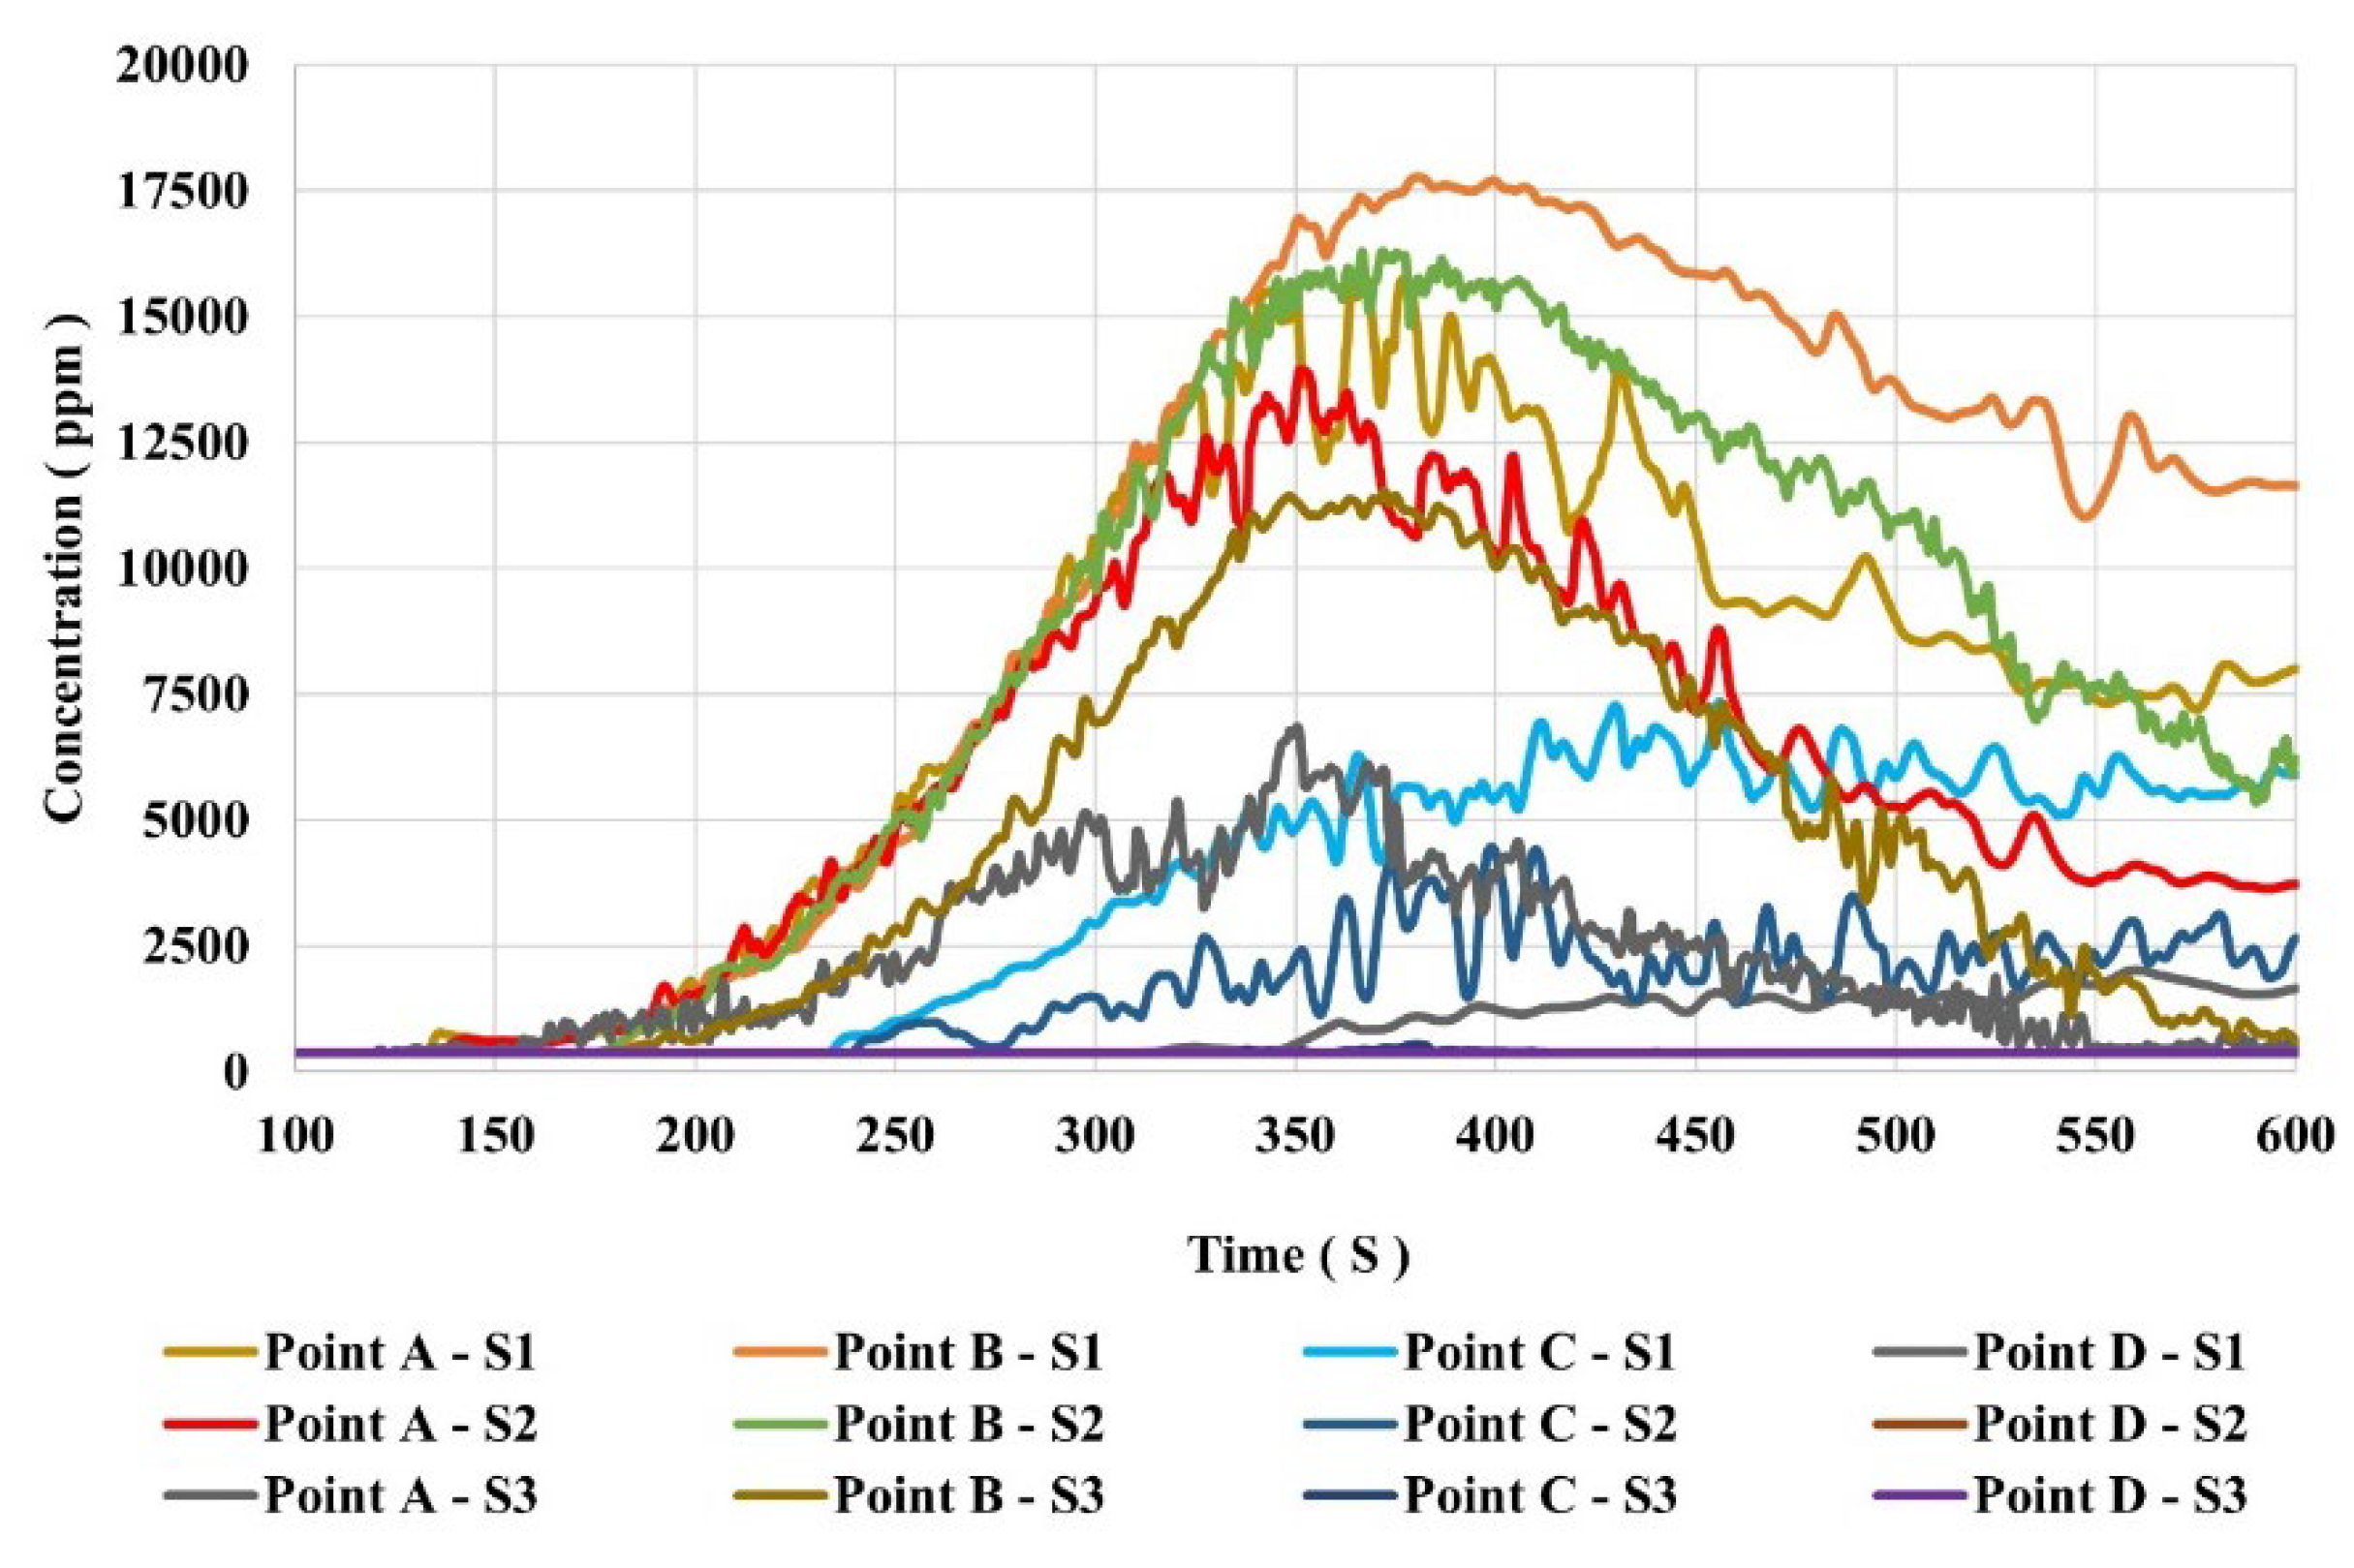
Figure 10.
Diagram of O₂ Percentage in Various Scenarios.
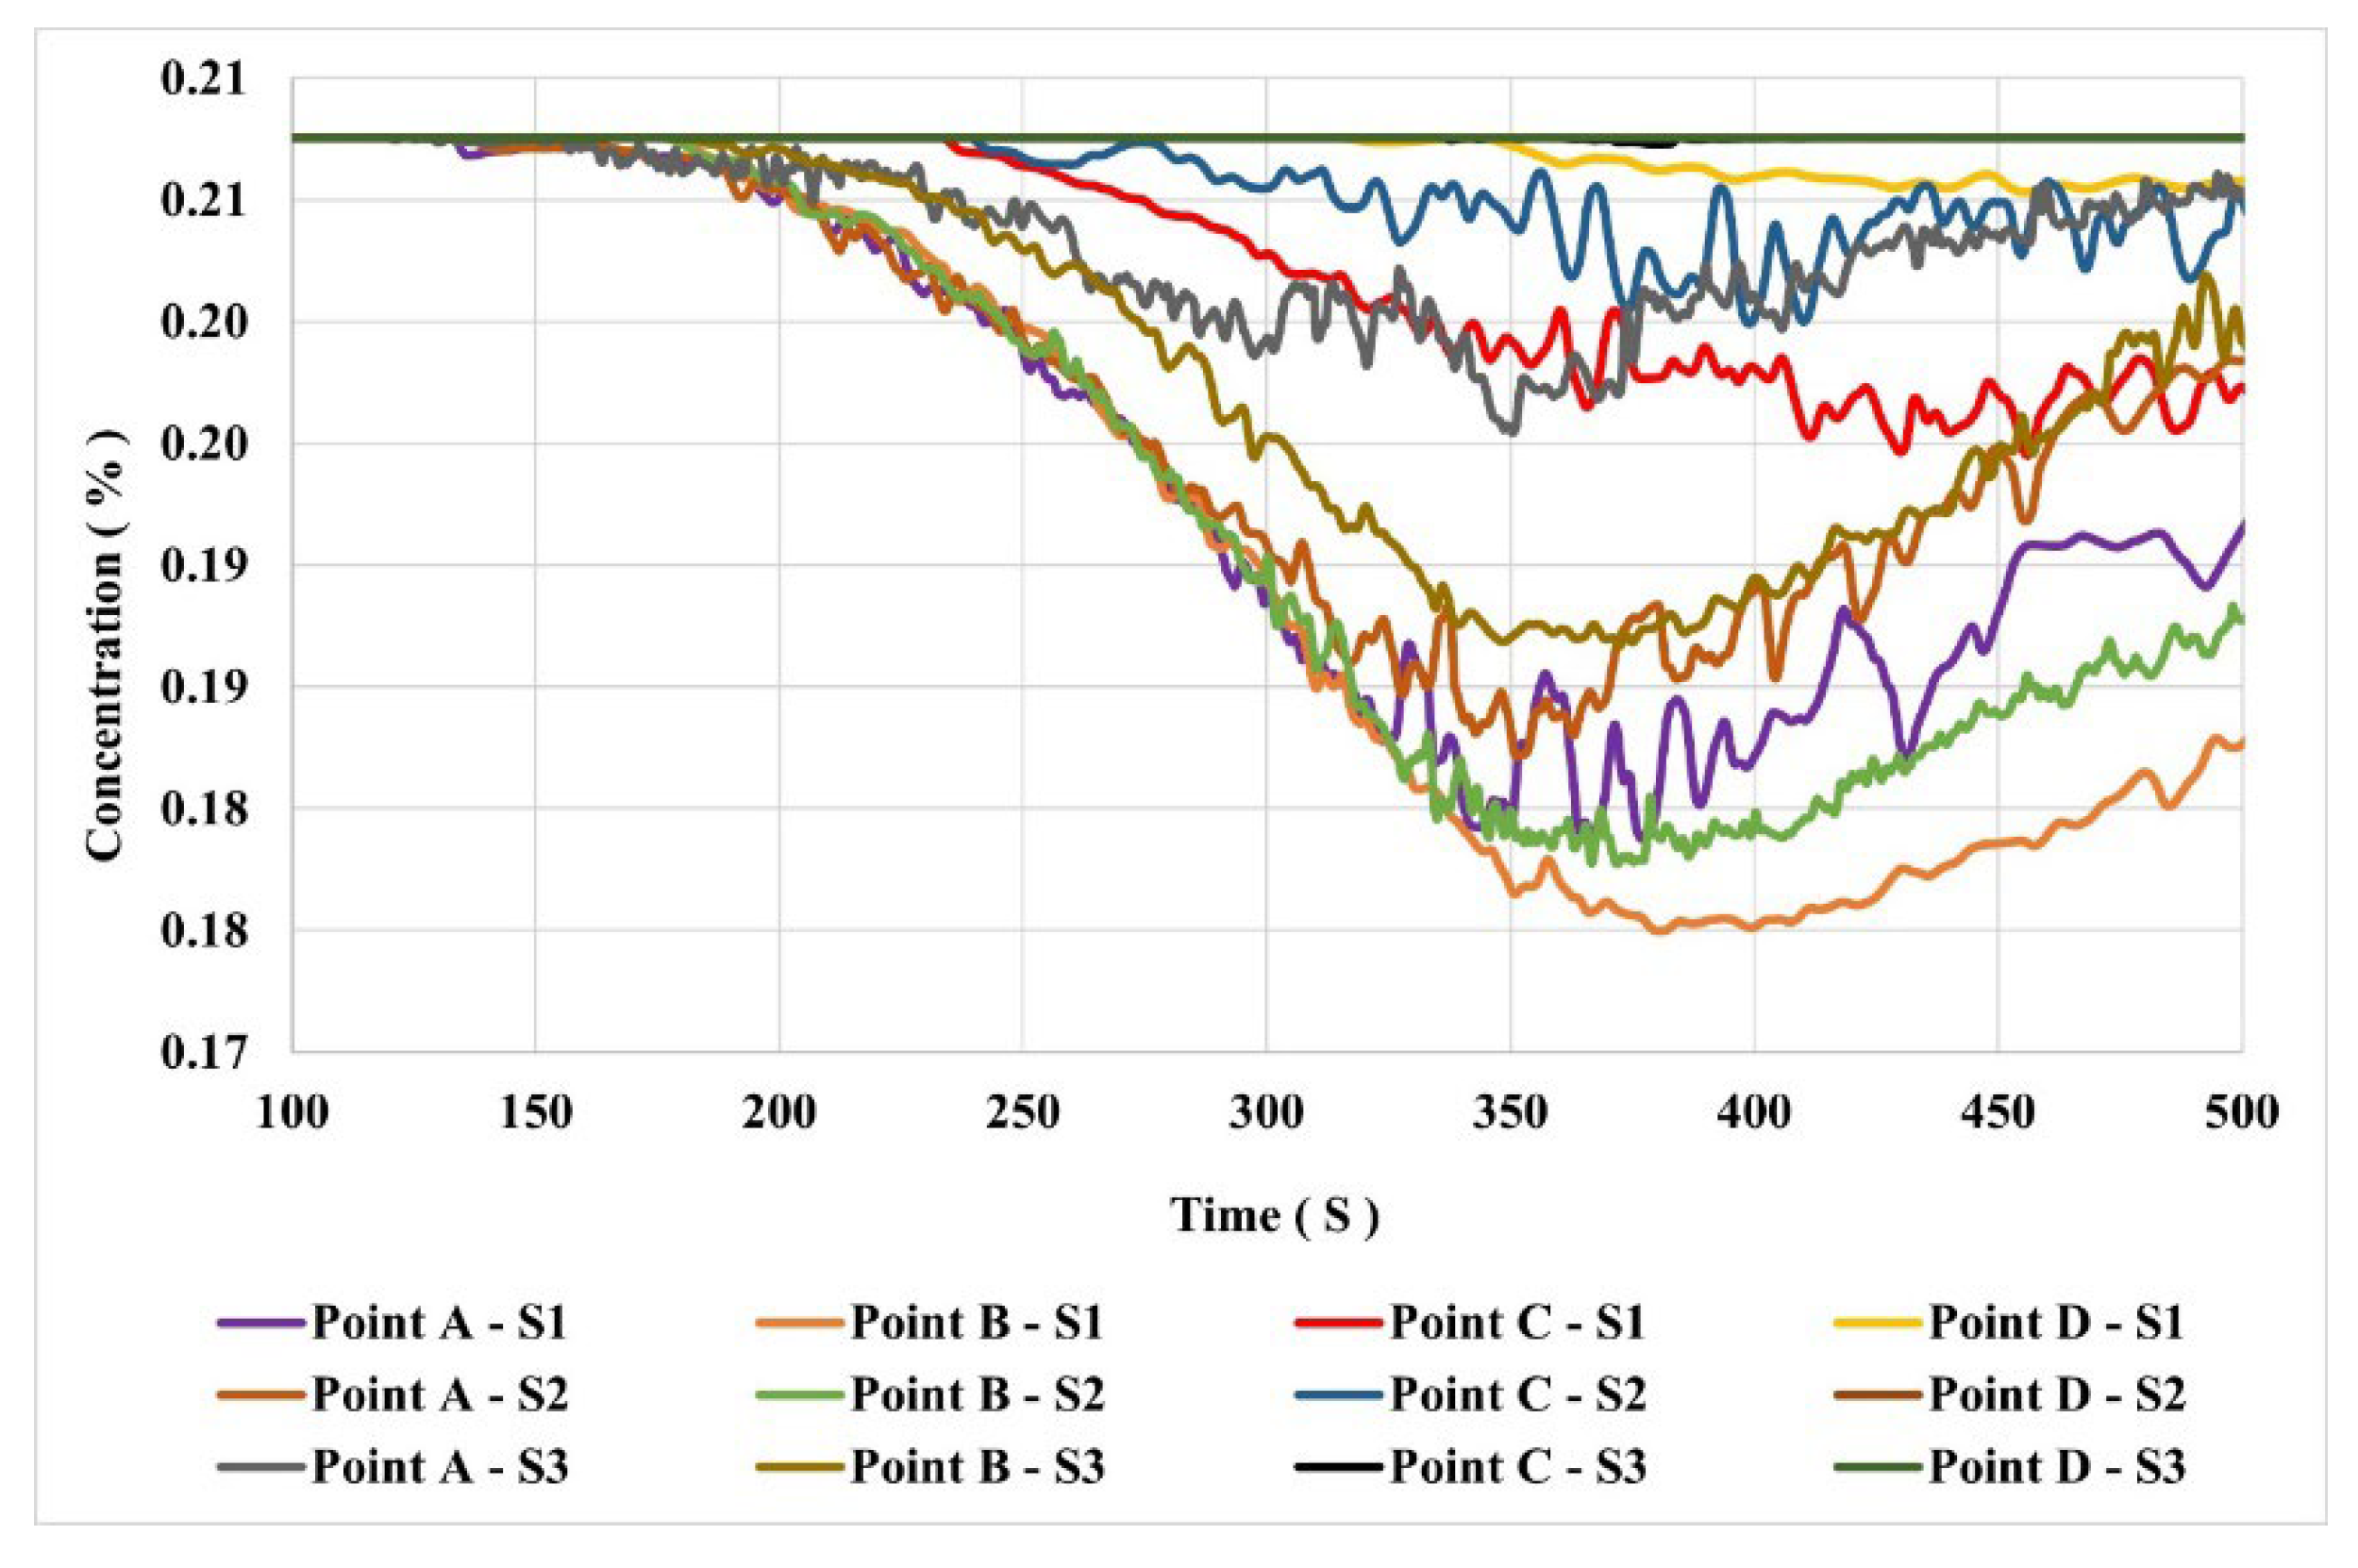

Table 1.
Structural composition and materials in the NICU.
| Surfaces and objects | Material and composition ratio (m) |
|---|---|
| Wall | Plaster 0.05 - Concrete 0.35 |
| Table | Wood 0.06 - Metal 0.005 |
| The chair | Foam 0.08 - Fabric 0.003 - Metal 0.005 |
| hospital bed | Foam 0.1 - Fabric 0.005 - Metal 0.005 |
| ceiling | Concrete 0.3- plaster 0.1 |
| Surface Materials | Density (Kg/m3) |
Heat Conductivity (W/m·K) | Heat Capacity (kJ/kg·K) | Heat of Combustion (Kj/mol) |
|---|---|---|---|---|
| Foam | 28 | 0.05 | 1/7 | 25400 |
| Cloth | 100 | 0.1 | 1/357 | - |
| Concrete | 2280 | 8/1 | 1/04 | - |
| Wood | 540 | 0.166 | 2/4 | 196500 |
| Gypsum Plaster | 1440 | 0.48 | 0.84 | - |
| Iron | 7900 | 80 | 0.45 | - |
Table 3.
Characteristics of fire simulation scenarios.
| Scenario | Scenario Specifications | |||||
| Control equipment | No. | Time and Method of Activation |
Installation Location | Flow rate (m³/s) | D (m) | |
| 1 | Fire starts without control devices | |||||
| 2 | Portable exhaust Model: BTF-60 |
1 | Smoke detector + 2 min | Point 6 | 3/99 | 0/5 |
| 3 | Ceiling exhaust Model: Zilabag |
3 | Smoke detector | Point 1,3,4 | 1/33 | 0/5 |
Disclaimer/Publisher’s Note: The statements, opinions and data contained in all publications are solely those of the individual author(s) and contributor(s) and not of MDPI and/or the editor(s). MDPI and/or the editor(s) disclaim responsibility for any injury to people or property resulting from any ideas, methods, instructions or products referred to in the content. |
© 2024 by the authors. Licensee MDPI, Basel, Switzerland. This article is an open access article distributed under the terms and conditions of the Creative Commons Attribution (CC BY) license (http://creativecommons.org/licenses/by/4.0/).
Copyright: This open access article is published under a Creative Commons CC BY 4.0 license, which permit the free download, distribution, and reuse, provided that the author and preprint are cited in any reuse.


