
Submitted:
15 November 2024
Posted:
19 November 2024
You are already at the latest version
Abstract
Blastocystis is a common intestinal protist with global distribution, frequently found in humans and various animals. Despite its prevalence, its role in human health remains debated, oscillating between being a harmless commensal and a potential pathogen, also linked to gastrointestinal disorders, such as irritable bowel syn-drome (IBS) and inflammatory bowel disease (IBD). In Italy, the genetic and spatial diversity of Blastocystis remains understudied, despite the country's diverse urbanized and environmental landscapes. This study focuses on the haplotypic and spatial diversity of clinical isolates of Blastocystis across two different Italian regions, with an emphasis on subtype distribution and genetic variation. Using a network-based haplotype analysis, the study reveals a heterogeneous subtype distribution, with subtype ST4 being the most prevalent, followed by ST3, ST1, and ST2. Notably, ST4 shows limited haplotypic variation, suggesting a more stable population structure potentially linked to a human-adapted lineage. In contrast, ST1 and ST2 exhibit greater genetic diversity, likely due to ongoing zoonotic transmission. These findings contribute to understanding the epidemiology of Blastocystis in Italy and highlight the need for further research on its pathogenic potential and transmission dynamics.
Keywords:
Blastocystis
; phylogenesis
; haplotype
1. Introduction
Blastocystis is a common intestinal Stramenopiles with a cosmopolitan distribution, frequently detected in humans and a wide variety of animal hosts. Despite its widespread occurrence, its role in human health remains contentious, oscillating between commensalism and potential pathogenicity. Numerous studies have associated Blastocystis with gastrointestinal symptoms, including irritable bowel syndrome (IBS) and inflammatory bowel disease (IBD), although conclusive evidence regarding its pathogenicity is still lacking [1]. The organism’s genetic diversity and potential to undergo zoonotic transmission have been emphasized as crucial elements in understanding its epidemiology [2].
Italy offers a unique setting for the study of Blastocystis, given its diverse environmental and urbanized landscapes, which may influence the distribution and genetic structure of Blastocystis populations. While several studies have documented the presence of Blastocystis in Italian populations, a comprehensive analysis of the spatial and genetic diversity of the protist across different regions remains scarce [3].
Haplotypic analysis provides a powerful approach for understanding intraspecies genetic diversity and its association with host and geographic factors. By focusing on haplotypes — specific genetic variants found within a population — it is possible to trace the evolutionary history of Blastocystis strains, infer patterns of transmission, and explore potential connections between genetic variants and pathogenicity. Previous studies have identified more than 40 distinct subtypes of Blastocystis, with ST1 to ST4 being the most prevalent in humans worldwide [4]. However, within these subtypes, considerable haplotypic diversity exists[3,5].
Nevertheless, little is known about the haplotypic diversity within these subtypes and how it correlates with spatial factors such as geographic location or urbanization levels. Network-based haplotype analysis can reveal hidden structures within Blastocystis populations by clustering isolates with shared genetic features, allowing for a deeper understanding of the spatial relationships and potential transmission routes.
This study aims to characterize the spatial and genetic diversity of Blastocystis clinical isolates from Italy, with a particular focus on haplotypic variation. Through network analysis, we will explore the connections between different haplotypes across two Italian regions, highlighting potential epidemiological patterns in shaping Blastocystis diversity. By integrating genetic and spatial data, this research seeks to fill the existing knowledge gaps on the distribution and evolution of Blastocystis in Italy, contributing to a broader understanding of its public health implications.
2. Materials and Methods
2.1. Sampling
In this work, 791 fecal samples from 636 symptomatic patients were analyzed. These samples were collected between July 2021 and October 2022 at the Unit of Parasitology of the Azienda Ospedaliera Universitaria Policlinico Tor Vergata (PTV) of Rome, Central Italy, which handles over 50.000 accesses annually. The samples were tested for Blastocystis using the Allplex™ Gastrointestinal Panel-Parasite Assay for Protozoa Detection in Stool Samples. Due to the higher sensitivity of RT-PCR, only isolates with cycle threshold (Ct) values lower than 30 were selected. Genotyping of a 600 bp segment of the Blastocystis SSU-rDNA was performed using end-point PCR as described by Scicluna et al. [6]. Amplicons were purified with the mi-PCR Purification Kit (Metabion International AG) and sent to Bio-Fab Research (Rome, Italy) for sequencing. The chromatograms obtained were manually inspected with Finch TV 1.4 software (Geo-Spiza, Inc., Seattle, WA, USA) to detect any potential double peaks, which could indicate mixed infections or single-nucleotide polymorphisms (SNPs).
For each patient, sex and age data were collected. Diagnostic results were anonymized before analysis, as were patient data prior to processing. The identity of each participant was protected by the attribution of an anonymous code to each stool sample collected. This research was conducted without any “Invasive act”, affecting the physical, psychological, or moral integrity of the participants. All experiments were performed following the ethical standards established by the Universal Declaration of Human Rights (1948), and the Declaration of Helsinki (1964), and its successive amendments were complied with.
The new samples obtained, along with Blastocystis sequences from patients attending the same hospital between March 2014 and March 2017, were collected in the dataset DATASET1.
2.2. Subtype, Allele Attribution and Phylogenetic Analysis
All isolates in DATASET1 were tested using PubMLST [7] to verify their subtype and allele.
The phylogenetic analysis focused on the sequences present in the dataset DATASET1 was conducted using MEGA11 software [8]. The Neighbor Joining (NJ) method was employed, based on the Tamura 3-parameter model, as selected by ModelTest using the Akaike Information Criterion (AIC). A bootstrap value of 1000 was applied to assess the robustness of the obtained clades.
2.3. Statistical Analysis
The results obtained from the comparison of subtypes and different alleles of Blastocystis, as well as the age of the patients, were evaluated using the chi-square test (χ²). A P-value < 0.05 was considered statistically significant. All statistical analyses were conducted using IBM SPSS Statistics software [9].
2.4. Haplotype and Network Analysis
To facilitate an appropriate comparison between our data and those available in Italy, another dataset was constructed (DATASET2), encompassing all Blastocystis sequences present in GenBank from human as host in Italy and also including those collected in DATASET1. To obtain the sequences from GenBank, a multistep strategy was employed by entering the keywords "Blastocystis," AND/OR "Italy," AND/OR "Italian" into the search field of the "Nucleotide database" and considering only sequences with 99% of identity with Blastocystis sp. This was followed by a thorough verification of the "Country Isolation and Host" information to ensure the accuracy of the data collected.
The haplotype analysis was conducted on DATASET2 on polymorphic sites using DnaSP v.6 software [10] and Tajima’s D test [11]. PoPART (Population Analysis with Reticulate Trees) genetic software [12] was used to perform the Minimum Spanning Network calculation [13]. The analysis was performed with sequences trimmed to the shortest length with high-quality fragments and sites, considering alignment gaps. In case of ambiguous sequences (unphased data) sequences were excluded from the analysis.
3. Results
In this study, 62 fecal samples from patients were tested as positive for Blastocystis during the analysis period, with an infection rate of 9.75%. Among them, 37 isolates with a cycle threshold (Ct) <30 were analyzed. The molecular analysis, conducted using the previously described PCR protocol, yielded high-quality sequences for 31 out of 37 samples. All sequences were identified as Blastocystis, demonstrating high identity values ranging from 99.46% to 100% with homologous sequences of Blastocystis isolates deposited in GenBank and PubMLST.
3.1. Subtype, Allele Attribution and Phylogenetic Analysis
Subsequently, DATASET1 was constructed, incorporating the sequences from the 31 isolates obtained in this study, along with 24 previously acquired Blastocystis sequences, as detailed in Section 2, resulting in a total of 55 sequences. Among these, 32 sequences were from females (58.2%), and 18 were from males (32.7%). For 5 patients, this data could not be obtained. The age of the patients ranged from 6 to 88 years, with a mean age of 47.85 years. In Table 1 Blastocystis subtypes based on the demographic characteristics of the patients are shown. The statistical analysis suggested that the STs distribution is independent of the age and gender of the patient.
For the correct attribution of subtype and associated allele, the sequences were analyzed using the PubMLST website. The results obtained for the isolates present in DATASET1 are presented in Table S1.
Overall, 9 sequences were assigned to subtype ST1 (9/55; 16.4%) with 3 isolates (BHHS3, BHHS12, BHHS51) showing identical sequences; 7 to subtype ST2 (7/55; 12.7%) with BHHS19 and BHHS2 equal to BHHS20 and BHHS6 respectively; 11 to subtype ST3 (11/55; 20%) with all identical sequences except for BHHS1 and BHHS23; 26 to subtype ST4 (26/55; 47.3%), all identical. Additionally, two samples were attributed one to subtype ST6 (1/55; 1.8%) and the other to subtype ST7 (1/55; 1.8%). Representative sequences within each subtype were deposited in GenBank under the accession numbers PQ483073- PQ483086; PQ565643-PQ565647.
From the analysis of the alleles, eight different variants were identified across the various subtypes (Table 2). A single allele was found for subtype ST1 (allele 4), and similarly, ST4 was particularly homogeneous, represented by a single allele (allele 42). The alleles identified for subtypes ST6 and ST7 were allele 123 and allele 137, respectively. For subtypes ST2 and ST3, two different alleles were observed. In the case of ST2, alleles 9 and 12 were identified. For subtype ST3, two alleles, allele 34 and allele 36, were found, with allele 34 also being more prevalent, accounting for 91% of the samples.
The phylogenetic analysis allowed for the grouping of the isolates in DATASET1 into six distinct subtypes of Blastocystis, confirming the results obtained through the PubMLST website. Specifically, of the 55 isolates present in the dataset, 9 clustered with ST1, 7 formed a clade with reference sequences of ST2, 11 grouped with ST3 sequences, and 26 clustered with reference sequences of ST4. Additionally, two isolates corresponded to ST6 and ST7, forming a distinct clade with their respective reference sequences (Figure 1). The topology of the Neighbor-Joining tree generated using partial SSU-rDNA gene showed two well defined different clades, formed by ST1/ST2 and ST6/ST7/ST9 supported by high bootstrap values (100 and 98 respectively), while ST5 rely on a separated branch. Less defined is the relationship between ST3, ST4 and ST8.
3.2. Statistical Analysis
No statistically significant correlation was found between the different subtypes and alleles of Blastocystis and the age of the patients. The chi-square test (χ²) results yielded P-values greater than 0.05, indicating the absence of any significant association.
3.3. Haplotype and Network Analyses
Through the search specified in Section 2, 52 sequences from Italy were obtained from GenBank allowing the construction of DATASET2 also including those collected in DATASET1, for a total of 107 sequences. The selected region spanned encompassed 561 sites. Alignment gaps were included in the evaluation, and the number of variable sites identified was 166. Regarding haplotype distribution, 46 distinct haplotypes were observed (see Table S2), resulting in a haplotype diversity (Hd) of 0.8850.
The most frequently observed haplotypes (hp) were hp34 and hp41, which were associated with ST3 and ST4, respectively. Subtype2, on the other hand, was mostly associated with hp22 and hp20, while ST1 was linked to hp7 and hp5.
The variability observed across different subtypes in terms of haplotypes showed no variability in ST4, which was entirely represented by hp41 and allele 42 (except for one isolate belonging to hp40 and allele 89). Moderate variability was observed in ST3, which was mostly associated with hp34 and allele 34, while ST1 and ST2 exhibited high variability.
From a spatial perspective the network analysis showed hp41 (ST4) and haplotypes within ST1 predominantly associated with the Lazio region, lesser extent to other Italian regions (ND) and absent in Sardinia. In contrast, hp 34 (ST3) and haplotypes related to ST2 are represented in Lazio, Sardinia as well as in several other Italian regions (ND). To note the presence of four specific haplotypes for ST3 and one for ST2 in Sardinia (Figure 2).
4. Discussion
This study sheds light on the genetic and spatial diversity of Blastocystis in Italy, add data for a more comprehensive view of its haplotypic structure across multiple subtypes.
The prevalence of the different subtypes related to the isolates obtained in the present study reveals that ST4 was the most frequently identified, accounting for 47.3% of all samples, followed by ST3 (20%), ST1 (16.4%), ST2 (12.7%), ST6 (1.8%) and ST7 (1.8%). These findings are consistent with trends observed in several European countries where ST4 is frequently reported together with ST3 as the dominant subtypes in human isolates [14]. For instance, in a study conducted in Denmark, ST4 also showed high prevalence among symptomatic patients, indicating a potential regional clustering of this subtype [15]. Moreover, the predominance of ST4 parallels findings from studies in other southern European countries, where environmental factors and human behavior likely contribute to its successful establishment in human populations. The distribution of ST4 contrasts between Europe and regions such as the West and South Asia, Americas, and Africa (less frequently detected) [14]. Rodents have been identified as reservoir hosts of ST4 [15], but exposure to rodent feces is likely to be universal. These observations seem to suggest that other environmental, cultural, and perhaps host-specific factors could be influencing the geographical distribution of ST4 and, in general, of the other subtypes, though the exact reasons remain uncertain.
The low haplotypic variation observed in all Blastocystis sequences available from Italy in ST4 contrasts with the higher variability detected in ST1 and ST2 and the moderate variability of ST3. Subtype ST4 was almost exclusively represented by haplotype hp41 and allele 42 (except for one isolate), whereas ST1 and ST2 demonstrated significant haplotypic diversity. The results presented here aligns closely with Mattiucci et al. [3] particularly regarding the dominance of ST3 and ST4 and the limited genetic diversity within this last subtype. The widespread presence of almost a single haplotype as revealed in this study and as reported in a previous work [3], supports the idea of a relatively stable and homogeneous population.
Unlike ST1, ST2, and ST3, which are commonly found in a wide range of animal hosts, ST4 appears to have a more specialized association with humans and rodents [5,16].
The absence of haplotypic variation within ST4 supports the hypothesis of a stable and homogeneous population in the human host, likely due to a recent evolutionary entry in human population [3,5,16]. The evolutionary history of Blastocystis subtypes could offer an explanation for this lack of diversity in ST4. It suggests that ST4 might have undergone a more recent evolutionary bottleneck, resulting in reduced genetic variation compared to other subtypes.
In contrast, ST1 and ST2, which exhibit significantly higher haplotypic diversity, are thought to have a more complex evolutionary history involving zoonotic transmission [17]. Both subtypes are frequently found in humans as well as various animals, suggesting ongoing genetic exchange between human and animal populations. This continual interspecies transmission likely contributes to the higher haplotypic diversity observed in ST1 and ST2, which show a wide range of haplotypes. These findings suggest that Blastocystis subtypes with zoonotic potential are generally more genetically diverse due to their broader host range and exposure to different environmental pressures.
The spatial distribution of haplotypes also provides interesting insights into the epidemiology of Blastocystis in Italy. Haplotypes associated with ST4 (hp41) were predominantly found in the Lazio region, while haplotypes associated to ST1 and ST3 were more widely distributed. To note the absence of ST1 and ST4 [18] and the presence of single rare haplotypic variants in Sardinia island, further emphasizing the complex interaction between environmental factors and Blastocystis transmission dynamics. However, it is important to note that the spatial analysis conducted in this study is still incomplete due to the scarcity of data from Italy. This limitation introduces a bias that should be addressed through new sequences and further studies on Blastocystis from other Italian regions.
The lack of haplotypic variation in ST4 raises intriguing questions about its pathogenic potential. Although Blastocystis pathogenicity remains a topic of debate for many years, more recent research, particularly studies examining Blastocystis in the context of gut microbiota, seems to suggest that it is generally linked with a healthy bacterial community [19,20]. Nevertheless, some evidence suggests that a more complex and nuanced perspective may be needed [21]. The genetic homogeneity of ST4 could imply a more stable interaction with the human host. However, considering that in the present study only isolates from sympromatc patients were analyzed, further research is needed to explore whether the reduced diversity in ST4 has any direct implications for its virulence or its ability to cause disease in human populations.
5. Conclusions
In conclusion: the findings of this study offers new insights into the genetic and spatial characteristics of Blastocystis subtypes in Italy with evidence of a possible link between geographical distribution and subtypes variability, likely reflecting the specific ecological and anthropogenic contexts of Italian landscape. A particular focus is on the low haplotypic diversity in ST4. The evolutionary and epidemiological implications of this reduced variability suggest that ST4 is a relatively recent and possibly human-adapted lineage, with limited zoonotic transmission potential, making it a key subtype for further investigation in terms of pathogenicity and transmission dynamics. Future research should focus on exploring the evolutionary history of ST4 in more detail and investigating whether its genetic stability impacts its role in human health.
Supplementary Materials
The following supporting information can be downloaded at the website of this paper posted on Preprints.org.
Author Contributions
Conceptualization, I.G.P., F.B., D.D.C.; methodology, I.G.P., F.B., D.D.C.; software, I.G.P., F.B.; validation, I.G.P., F.B., D.D.C.; formal analysis, I.G.P., F.B., D.D.C.; investigation, I.G.P., F.B., D.D.C.; data curation, I.G.P., F.B., D.D.C.; writing—original draft preparation, I.G.P.; writing—review and editing, I.G.P., F.B., D.D.C.; supervision, I.G.P., F.B., D.D.C.; project administration, I.G.P., F.B., D.D.C.; All authors have read and agreed to the published version of the manuscript.
Funding Statement: This research received no external funding.
Informed Consent Statement
Diagnostic results were anonymized before analysis, as were patient data prior to processing. The identity of each participant was protected by the attribution of an anonymous code to each stool sample collected. This research was conducted without any “Invasive act”, affecting the physical, psychological, or moral integrity of the participants. All experiments were performed following the ethical standards established by the Universal Declaration of Human Rights (1948), and the Declaration of Helsinki (1964), and its successive amendments were complied with.
Data Availability Statement
The data that support the findings of this study are available in the public database GenBank [https://www.ncbi.nlm.nih.gov/nucleotide/].
Conflicts of Interest
The authors declare no conflicts of interest.
References
- Stensvold, C.R.; Lewis, H.C.; Hammerum, A.M.; Porsbo, L.J.; Nielsen, S.S.; Olsen, K.E.; Arendrup, M.C.; Nielsen, H.V.; Mølbak, K. Blastocystis: unravelling potential risk factors and clinical significance of a common but neglected parasite. Epidemiol. Infect. 2009, 137, 1655–1663. [Google Scholar] [CrossRef] [PubMed]
- Betts, E.L.; Gentekaki, E.; Thomasz, A.; Breakell, V.; Carpenter, A.I.; Tsaousis, A.D. Genetic diversity of Blastocystis in non-primate animals. Parasitology 2018, 145, 1228–1234. [Google Scholar] [CrossRef] [PubMed]
- Mattiucci, S.; Crisafi, B.; Gabrielli, S.; Paoletti, M.; Cancrini, G. Molecular epidemiology and genetic diversity of Blastocystis infection in humans in Italy. Epidemiol. Infect. 2016, 144, 635–646. [Google Scholar] [CrossRef] [PubMed]
- Santin, M.; Figueiredo, A.; Molokin, A.; George, N.S.; Köster, P.C.; Dashti, A.; González-Barrio, D.; Carmena, D.; Maloney, J.G. Division of Blastocystis ST10 into three new subtypes: ST42-ST44. J. Eukaryot. Microbiol. 2024, 7, e12998. [Google Scholar]
- Stensvold, C.R.; Alfellani, M.; Clark, C.G. Levels of genetic diversity vary dramatically between Blastocystis subtypes. Infect. Genet. Evol. 2012, 12, 263–273. [Google Scholar] [CrossRef] [PubMed]
- Scicluna, S.M.; Tawari, B.; Clark, C.G. DNA barcoding of Blastocystis. Protist 2006, 157, 77–85. [Google Scholar] [CrossRef] [PubMed]
- Jolley, K.A.; Bray, J.E.; Maiden, M.C.J. Open-access bacterial population genomics: BIGSdb software, the PubMLST.org website and their applications. Wellcome Open. Res. 2018, 3, 124. [Google Scholar] [CrossRef] [PubMed]
- Tamura, K.; Stecher, G.; Kumar, S. MEGA11: Molecular Evolutionary Genetics Analysis Version 11. Mol. Biol. Evol. 2021, 38, 3022–3027. [Google Scholar] [CrossRef] [PubMed]
- IBM Corp. IBM SPSS Statistics for Windows, Version 26.0. 2019.
- Rozas, J.; Ferrer-Mata, A.; Sánchez-DelBarrio, J.C.; Guirao-Rico, S.; Librado, P.; Ramos-Onsins, S.E.; Sánchez-Gracia, A. DnaSP 6: DNA Sequence Polymorphism Analysis of Large Data Sets. Mol. Biol. Evol. 2017, 34, 3299–3302. [Google Scholar] [CrossRef] [PubMed]
- Tajima, F. Statistical method for testing the neutral mutation hypothesis by DNA polymorphism. Genetics 1989, 123, 585–595. [Google Scholar] [CrossRef] [PubMed]
- Leigh, J.W.; Bryant, D. POPART: Full-feature software for haplotype network construction. Methods Ecol. Evol. 2015, 6, 1110–1116. [Google Scholar] [CrossRef]
- Bandelt, H.J.; Forster, P.; Röhl, A. Median-joining networks for inferring intraspecific phylogenies. Mol. Biol. Evol. 1999, 16, 37–48. [Google Scholar] [CrossRef] [PubMed]
- Popruk, S.; Adao, D.E.V.; Rivera, W.L. Epidemiology and subtype distribution of Blastocystis in humans: A review. Infect. Gene.t Evol. 2021, 95, 105085. [Google Scholar] [CrossRef] [PubMed]
- Stensvold, C.R.; Christiansen, D.B.; Olsen, K.E.; Nielsen, H.V. Blastocystis sp. subtype 4 is common in Danish Blastocystis-positive patients presenting with acute diarrhea. Am. J. Trop. Med. Hyg. 2011, 84, 883–885. [Google Scholar] [CrossRef] [PubMed]
- Scanlan, P.D.; Stensvold, C.R. Blastocystis: getting to grips with our guileful guest. Trends Parasitol. 2013, 29, 523–529. [Google Scholar] [CrossRef] [PubMed]
- Popruk, S.; Koompapong, K.; Mahittikorn, A.; Andersen, L.O.; Stensvold, C.R. Cats and dogs as hosts of Blastocystis - What is the evidence? Vet. Parasitol. 2024, 332, 110325. [Google Scholar] [CrossRef] [PubMed]
- Meloni, D.; Sanciu, G.; Poirier, P.; El Alaoui, H.; Chabé, M.; Delhaes, L.; Dei-Cas, E.; Delbac, F.; Luigi Fiori, P.; Di Cave, D.; Viscogliosi, E. Molecular subtyping of Blastocystis sp. isolates from symptomatic patients in Italy. Parasitol. Res. 2011, 109, 613–619. [Google Scholar] [CrossRef] [PubMed]
- Krogsgaard, L.R.; Andersen, L.O.; Johannesen, T.B.; Engsbro, A.L.; Stensvold, C.R.; Nielsen, H.V.; Bytzer, P. Characteristics of the bacterial microbiome in association with common intestinal parasites in irritable bowel syndrome. Clin Transl Gastroenterol. 2018, 9, 161. [Google Scholar] [CrossRef] [PubMed]
- Piperni, E.; Nguyen, L.H.; Manghi, P.; Kim, H.; Pasolli, E.; Andreu-Sánchez, S.; Arrè, A.; Bermingham, K.M.; Blanco-Míguez, A.; Manara, S.; Valles-Colomer, M.; Bakker, E.; Busonero, F.; Davies, R.; Fiorillo, E.; Giordano, F.; Hadjigeorgiou, G.; Leeming, E.R.; Lobina, M.; Masala, M.; Maschio, A.; McIver, L.J.; Pala, M.; Pitzalis, M.; Wolf, J.; Fu, J.; Zhernakova, A.; Cacciò, S.M.; Cucca, F.; Berry, S.E.; Ercolini, D.; Chan, A.T.; Huttenhower, C.; Spector, T.D.; Segata, N.; Asnicar, F. Intestinal Blastocystis is linked to healthier diets and more favorable cardiometabolic outcomes in 56,989 individuals from 32 countries. Cell. 2024, 187, 4554–4570. [Google Scholar] [CrossRef] [PubMed]
- Aykur, M.; Malatyalı, E.; Demirel, F.; Cömert-Koçak, B.; Gentekaki, E.; Tsaousis, A.D.; Dogruman-Al, F. Blastocystis: A Mysterious Member of the Gut Microbiome. Microorganisms. 2024, 12, 461. [Google Scholar] [CrossRef] [PubMed]
Figure 1.
Phylogenetic analysis performed using the Neighbor-Joining (NJ) method on the partial Blastocystis SSU-rDNA sequences present in DATASET1, comparing them with reference sequences obtained from GenBank. The values at the nodes of the tree indicate bootstrap values greater than 80%. The clades are color-coded to reflect their assignments to different subtypes (ST).
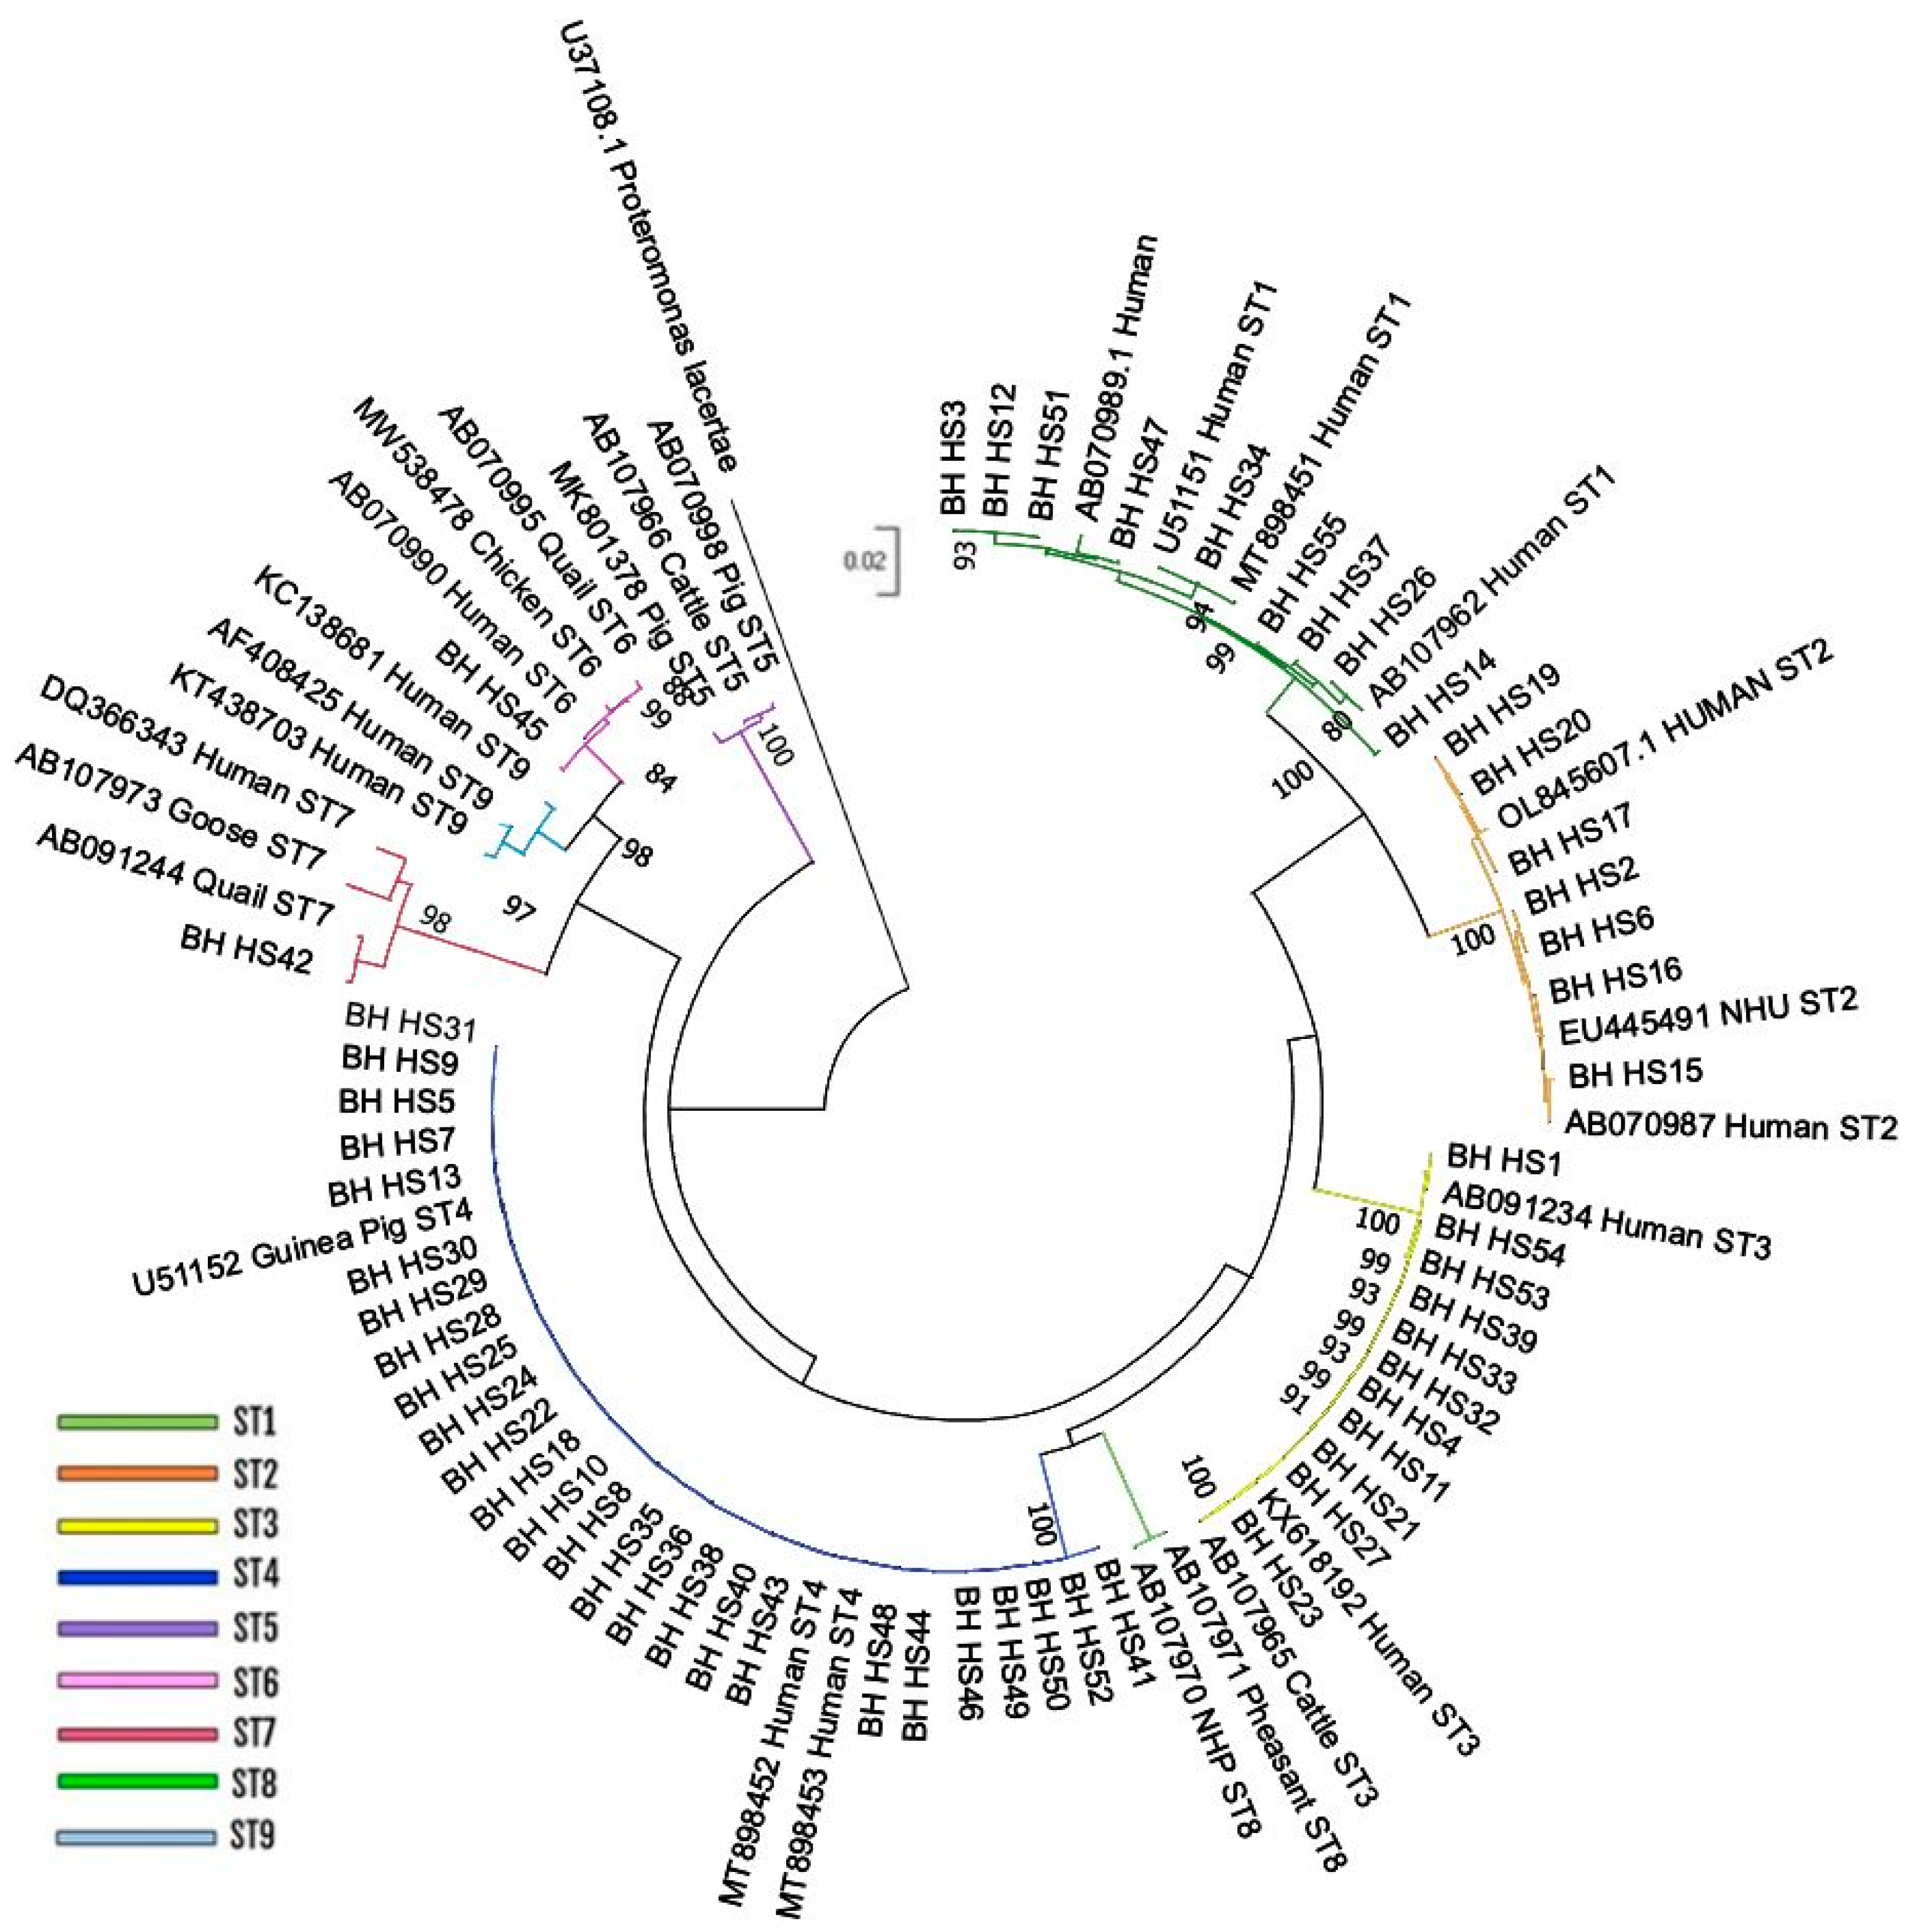
Figure 2.
Minimum-Spanning haplotype networks built in PoPART software for DATASET2. Haplotypes are represented by circles proportional to relative haplotypes abundance; different shades indicate different areas of origin. Notches refer to the mutational steps between haplotypes. Coloured circles indicate alleles most represented for the single haplotypes. Subtypes and alleles are indicated. ND indicates Italian regions not defined in the reference.
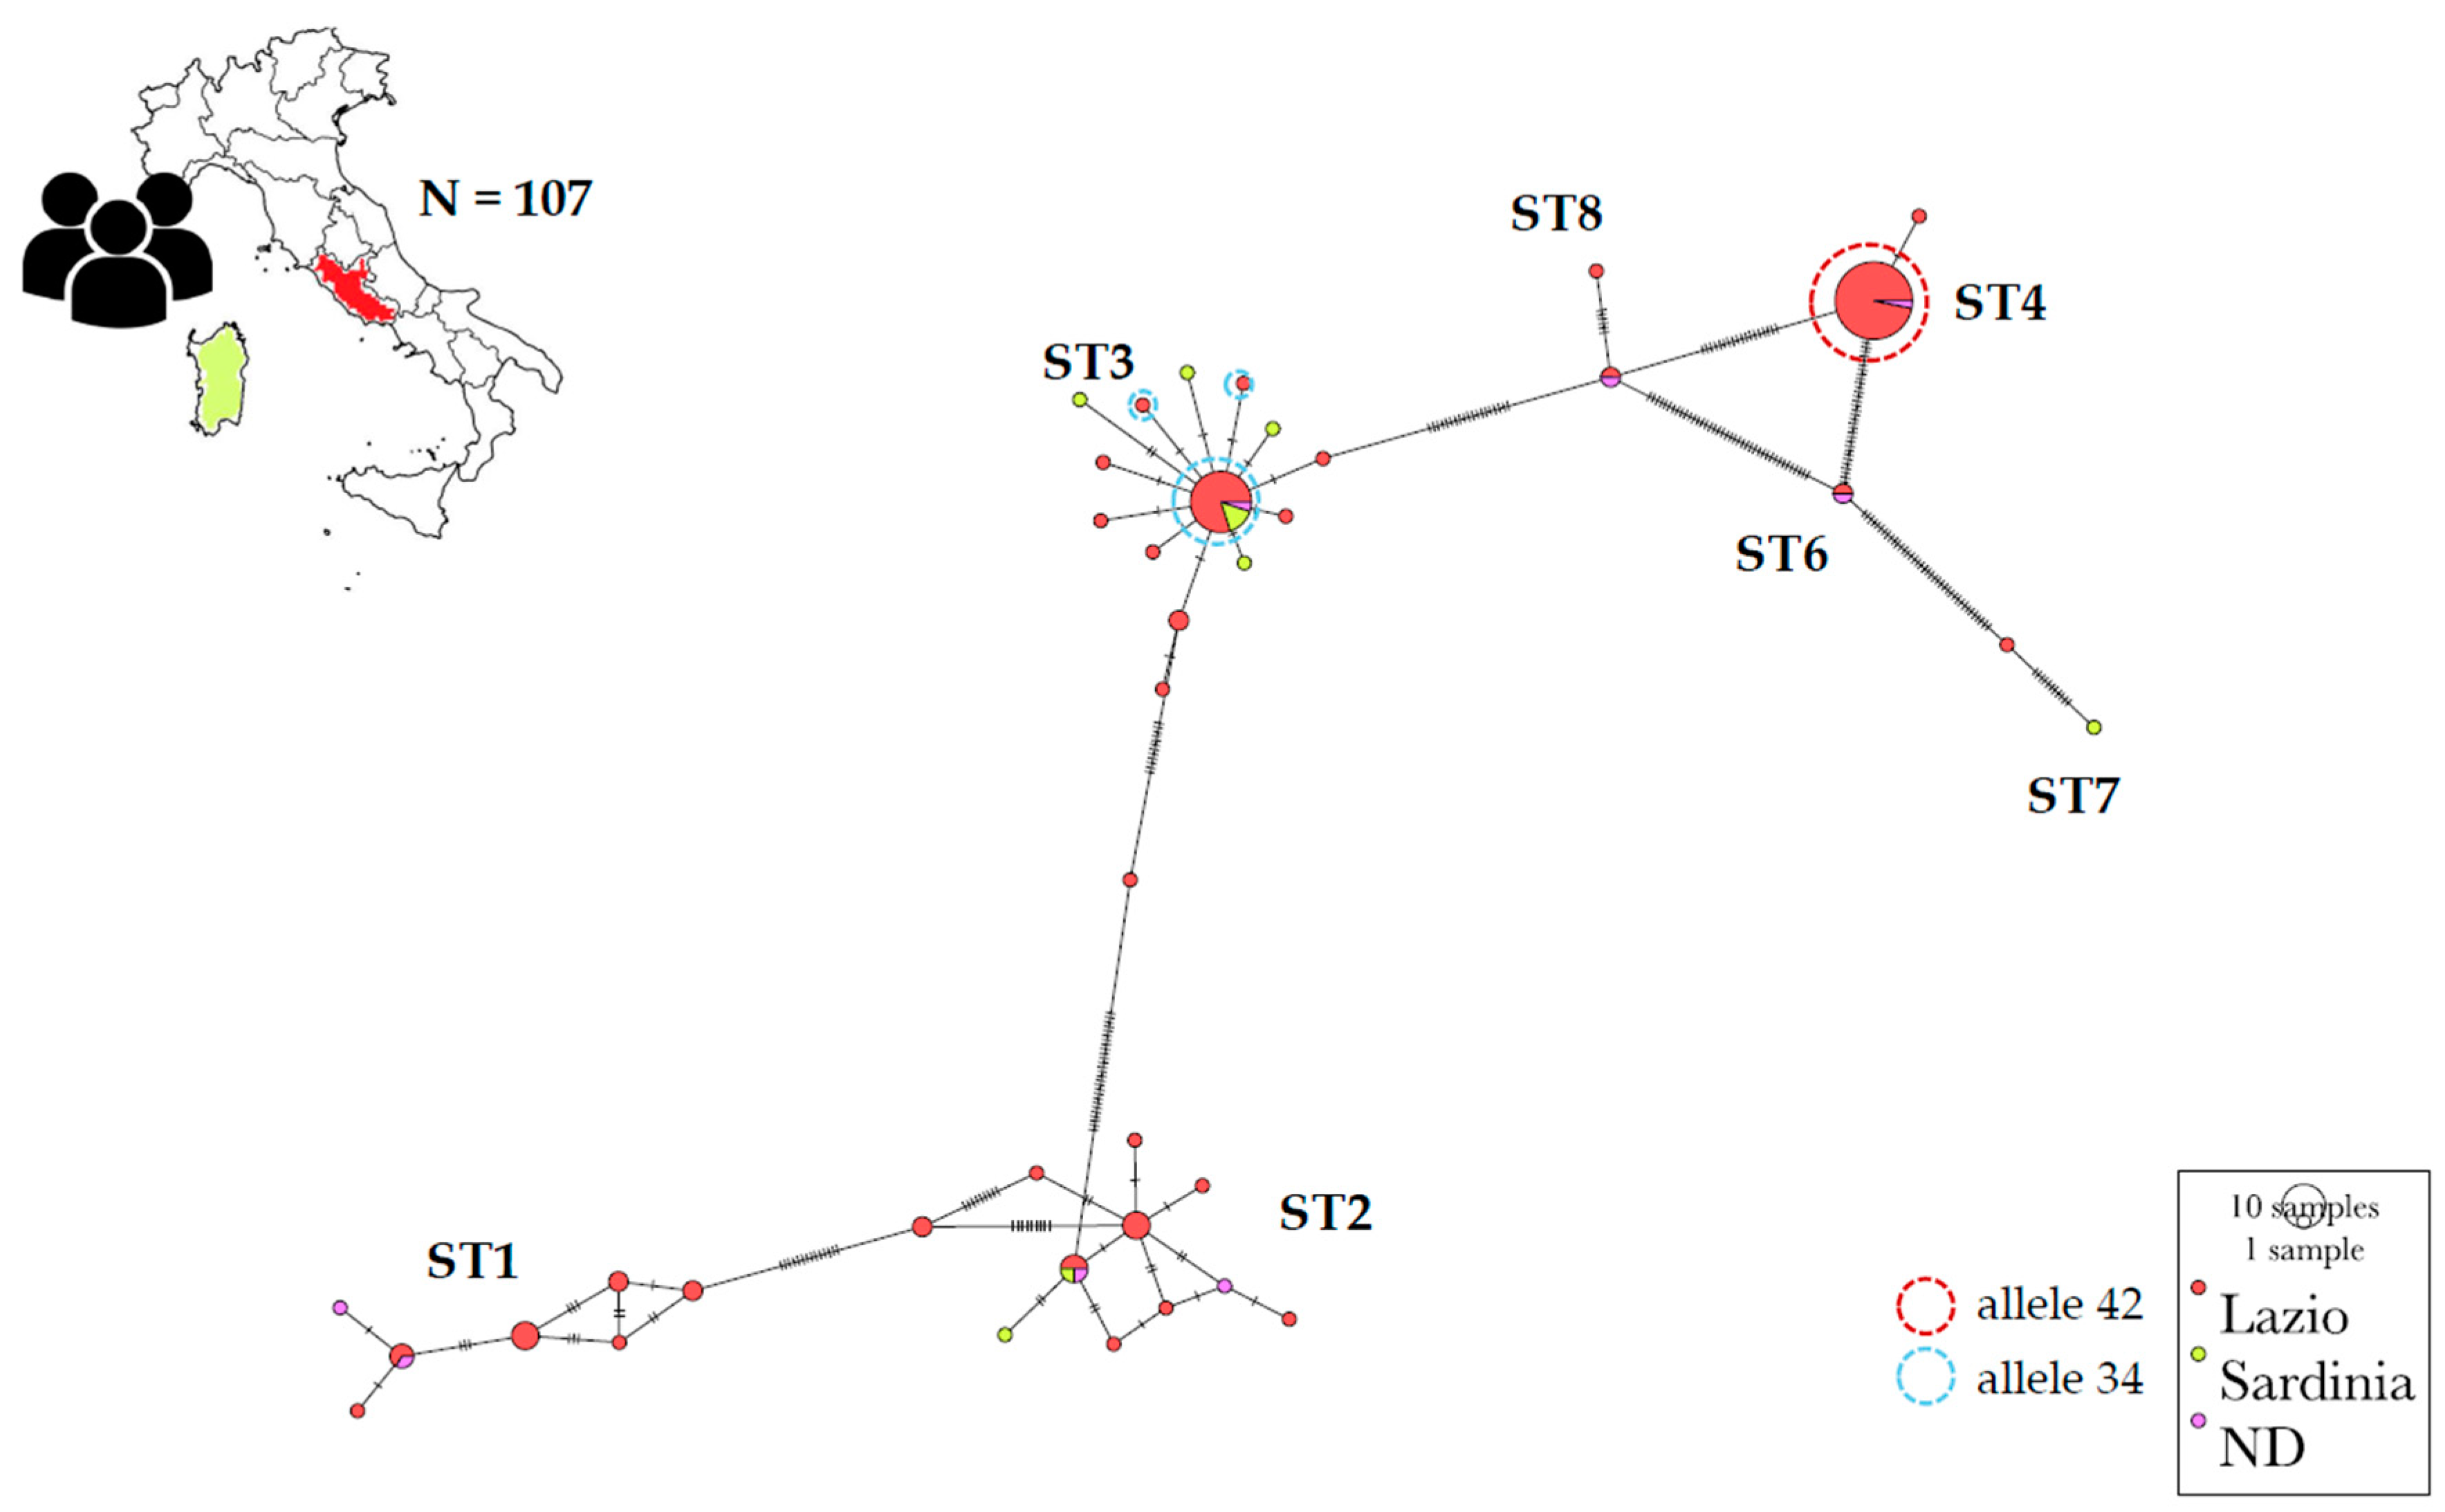

Table 1.
Subtypes correlated with age classes and gender for DATASET1; data were available for 50 over 55 patients.
Table 1.
Subtypes correlated with age classes and gender for DATASET1; data were available for 50 over 55 patients.
| Age Class | ST1 | ST2 | ST3 | ST4 | ST6 | ST7 |
| 0-15 | - | 2 | 3 | 2 | - | - |
| 16-32 | 2 | - | 1 | 1 | - | 1 |
| 33-49 | 2 | 2 | 4 | 8 | 1 | - |
| 50-66 | 1 | - | - | 3 | - | - |
| 67-85 | 3 | 2 | 2 | 9 | - | - |
| 86-99 | - | - | - | 1 | - | - |
| Gender | ST1 | ST2 | ST3 | ST4 | ST6 | ST7 |
| F | 4 | 4 | 6 | 16 | 1 | 1 |
| M | 4 | 2 | 4 | 8 | - | - |
Table 2.
Allele distribution among the subtypes obtained from the 55 sequences present in DATASET1.
| Subtype | N of isolates | Alleles Detected |
| ST1 | 9 | 4 |
| ST2 | 4 | 9 |
| “ | 3 | 12 |
| ST3 | 10 | 34 |
| “ | 1 | 36 |
| ST4 | 26 | 42 |
| ST6 | 1 | 123 |
| ST7 | 1 | 137 |
Disclaimer/Publisher’s Note: The statements, opinions and data contained in all publications are solely those of the individual author(s) and contributor(s) and not of MDPI and/or the editor(s). MDPI and/or the editor(s) disclaim responsibility for any injury to people or property resulting from any ideas, methods, instructions or products referred to in the content. |
© 2024 by the authors. Licensee MDPI, Basel, Switzerland. This article is an open access article distributed under the terms and conditions of the Creative Commons Attribution (CC BY) license (https://creativecommons.org/licenses/by/4.0/).
Copyright: This open access article is published under a Creative Commons CC BY 4.0 license, which permit the free download, distribution, and reuse, provided that the author and preprint are cited in any reuse.


