Preprint
Article

Legacy Effect of Drought on Soil Nitrogen Availability and Wheat Growth Before and After Rewetting

Submitted:

15 November 2024

Posted:

19 November 2024

You are already at the latest version

Abstract

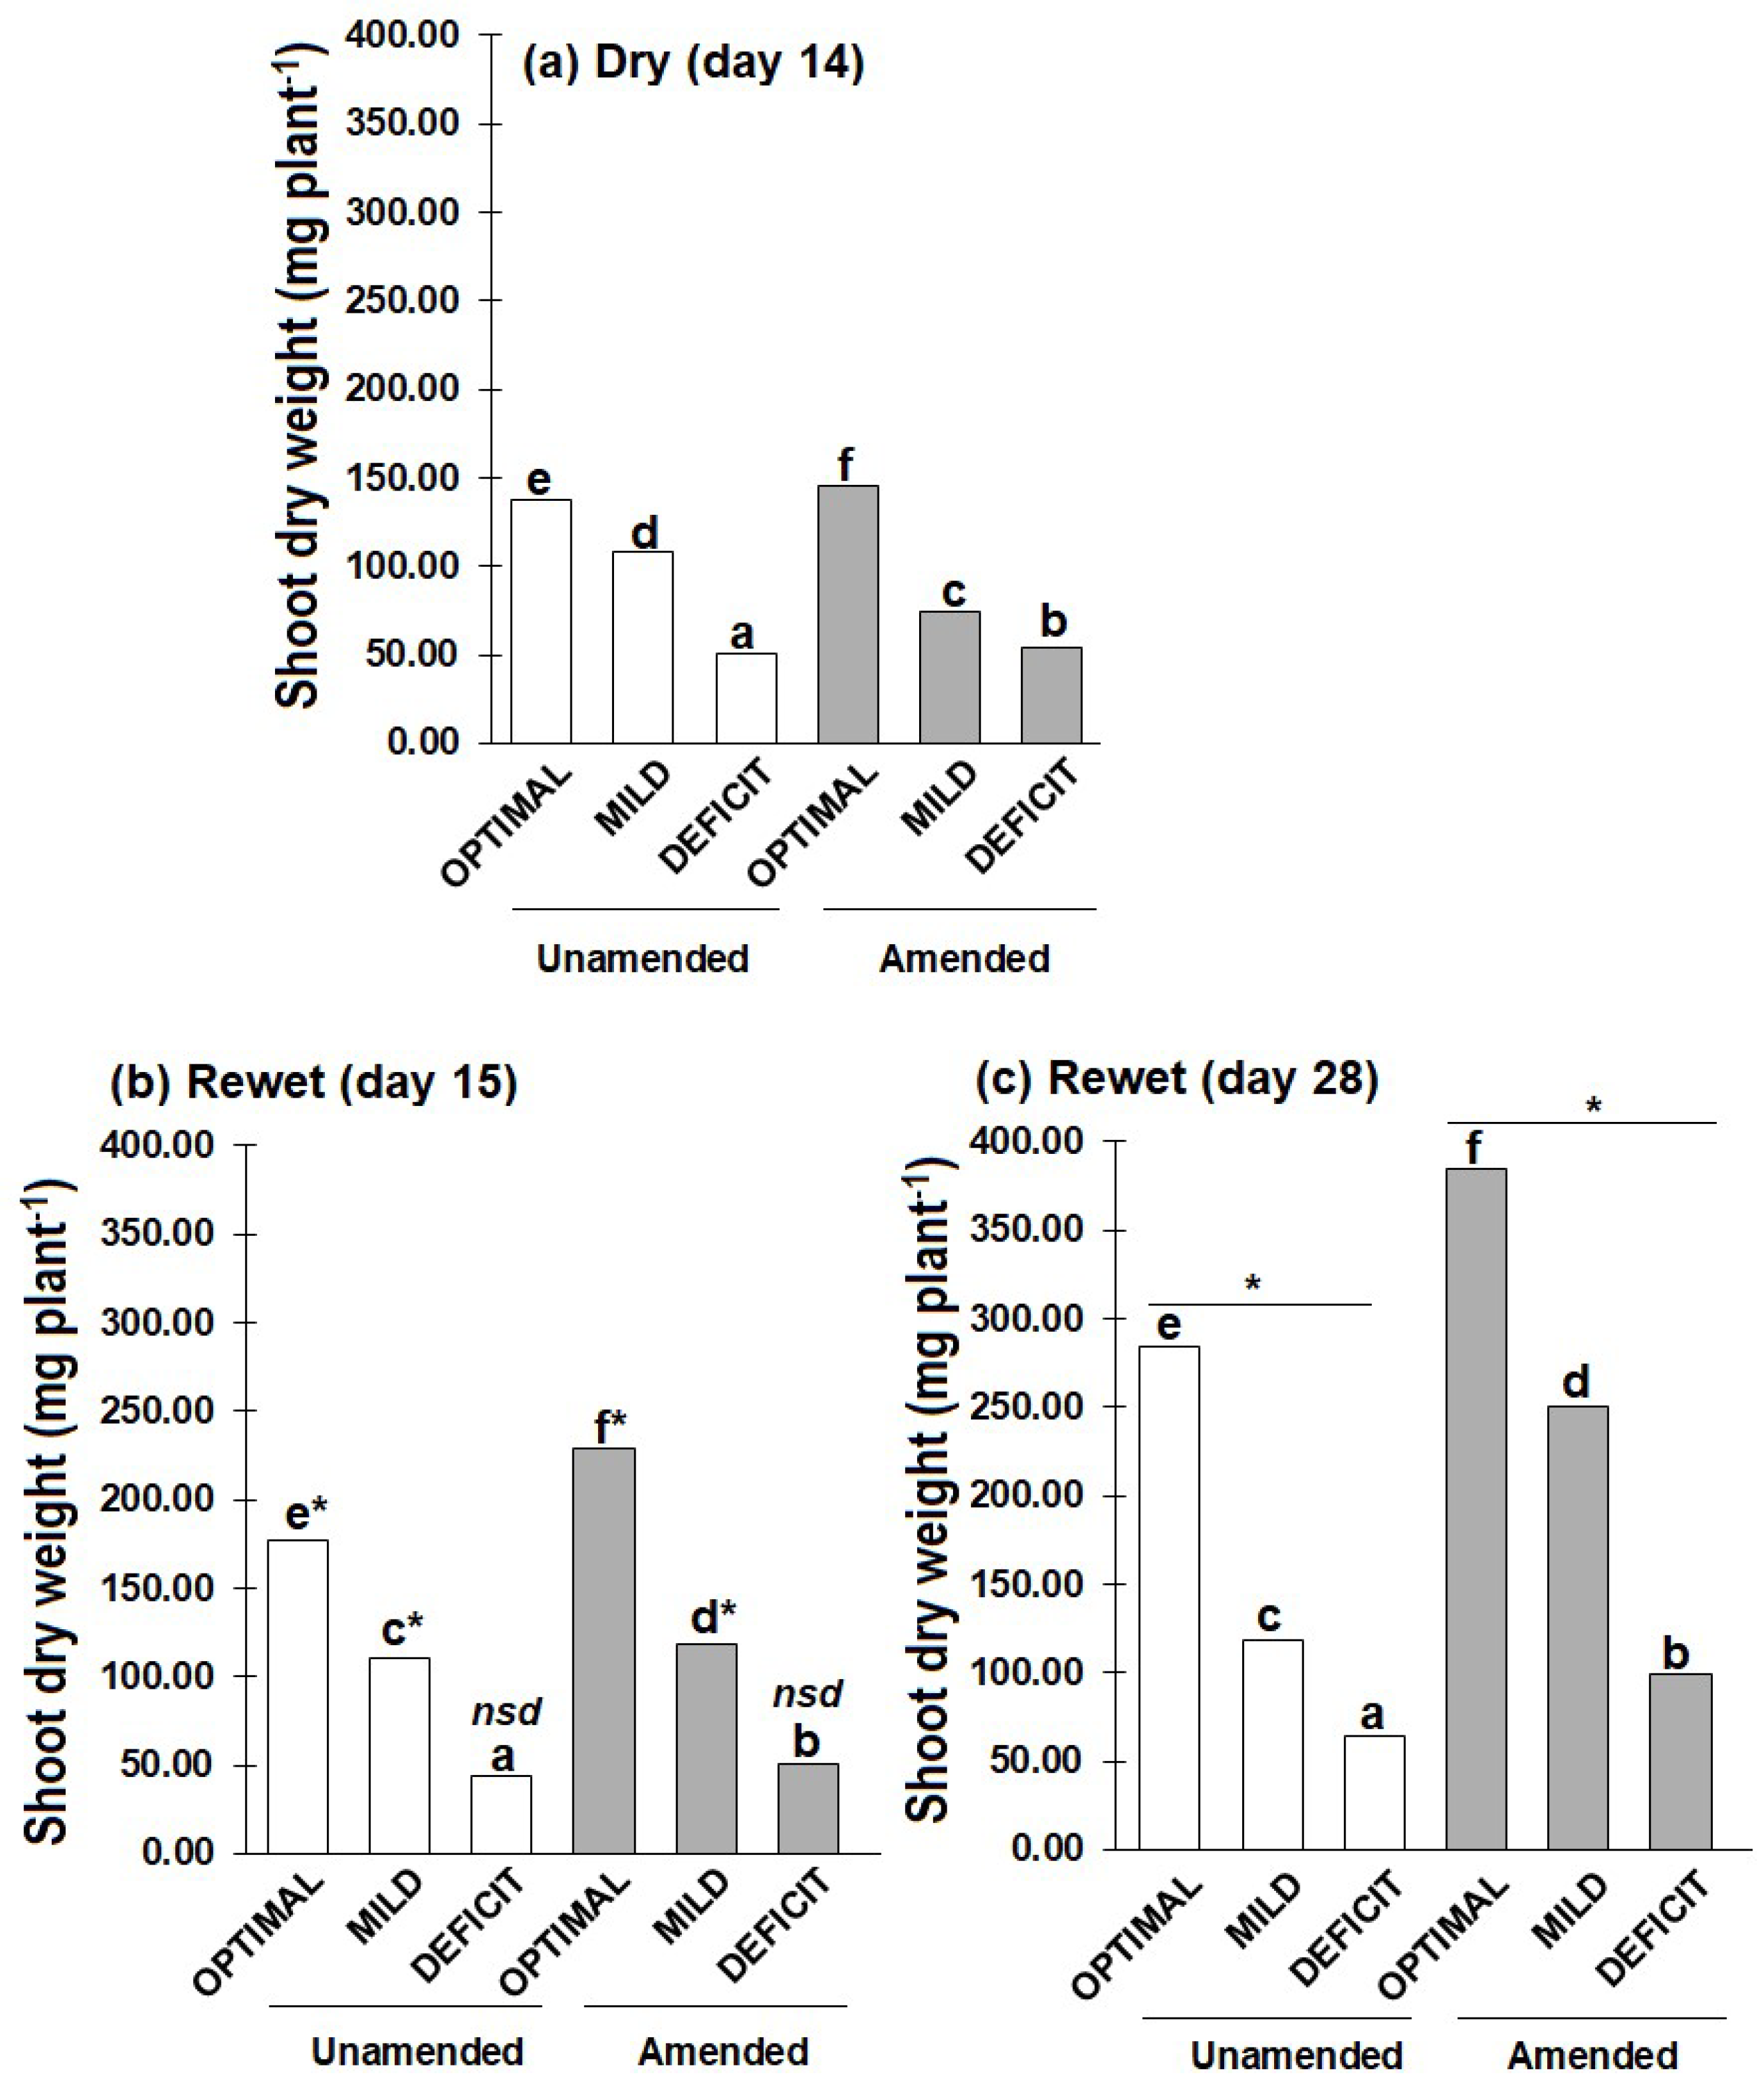
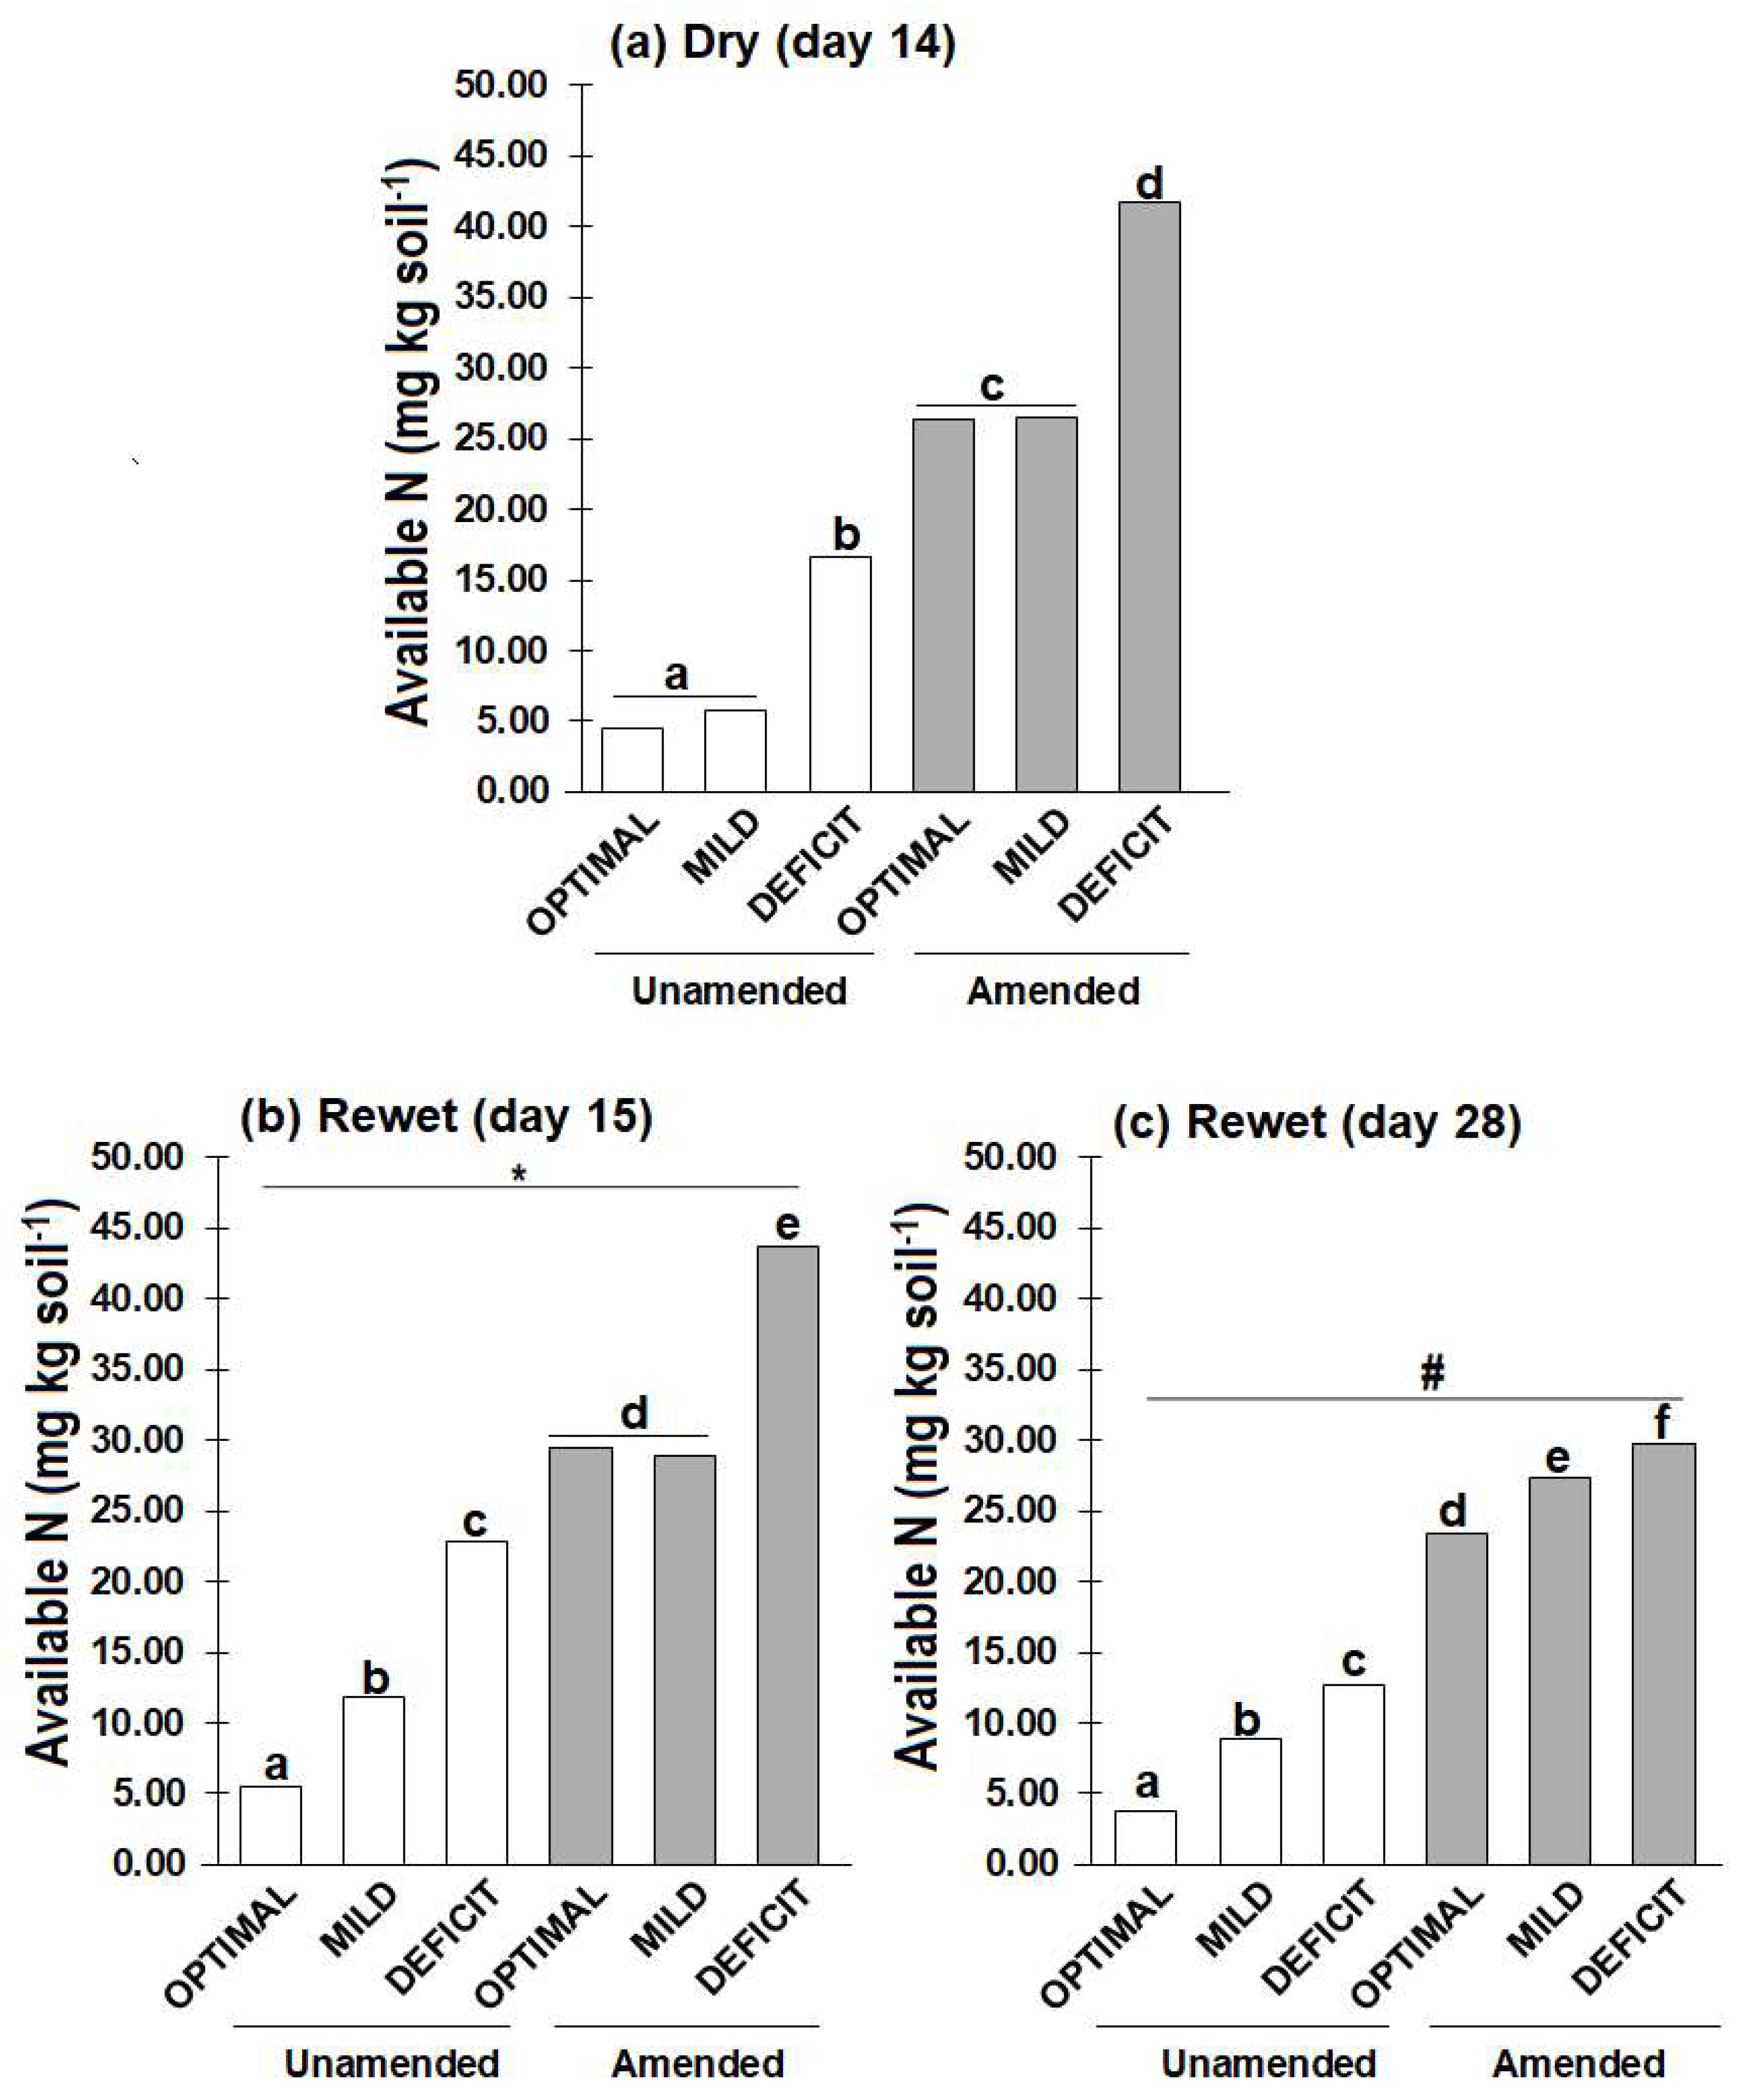
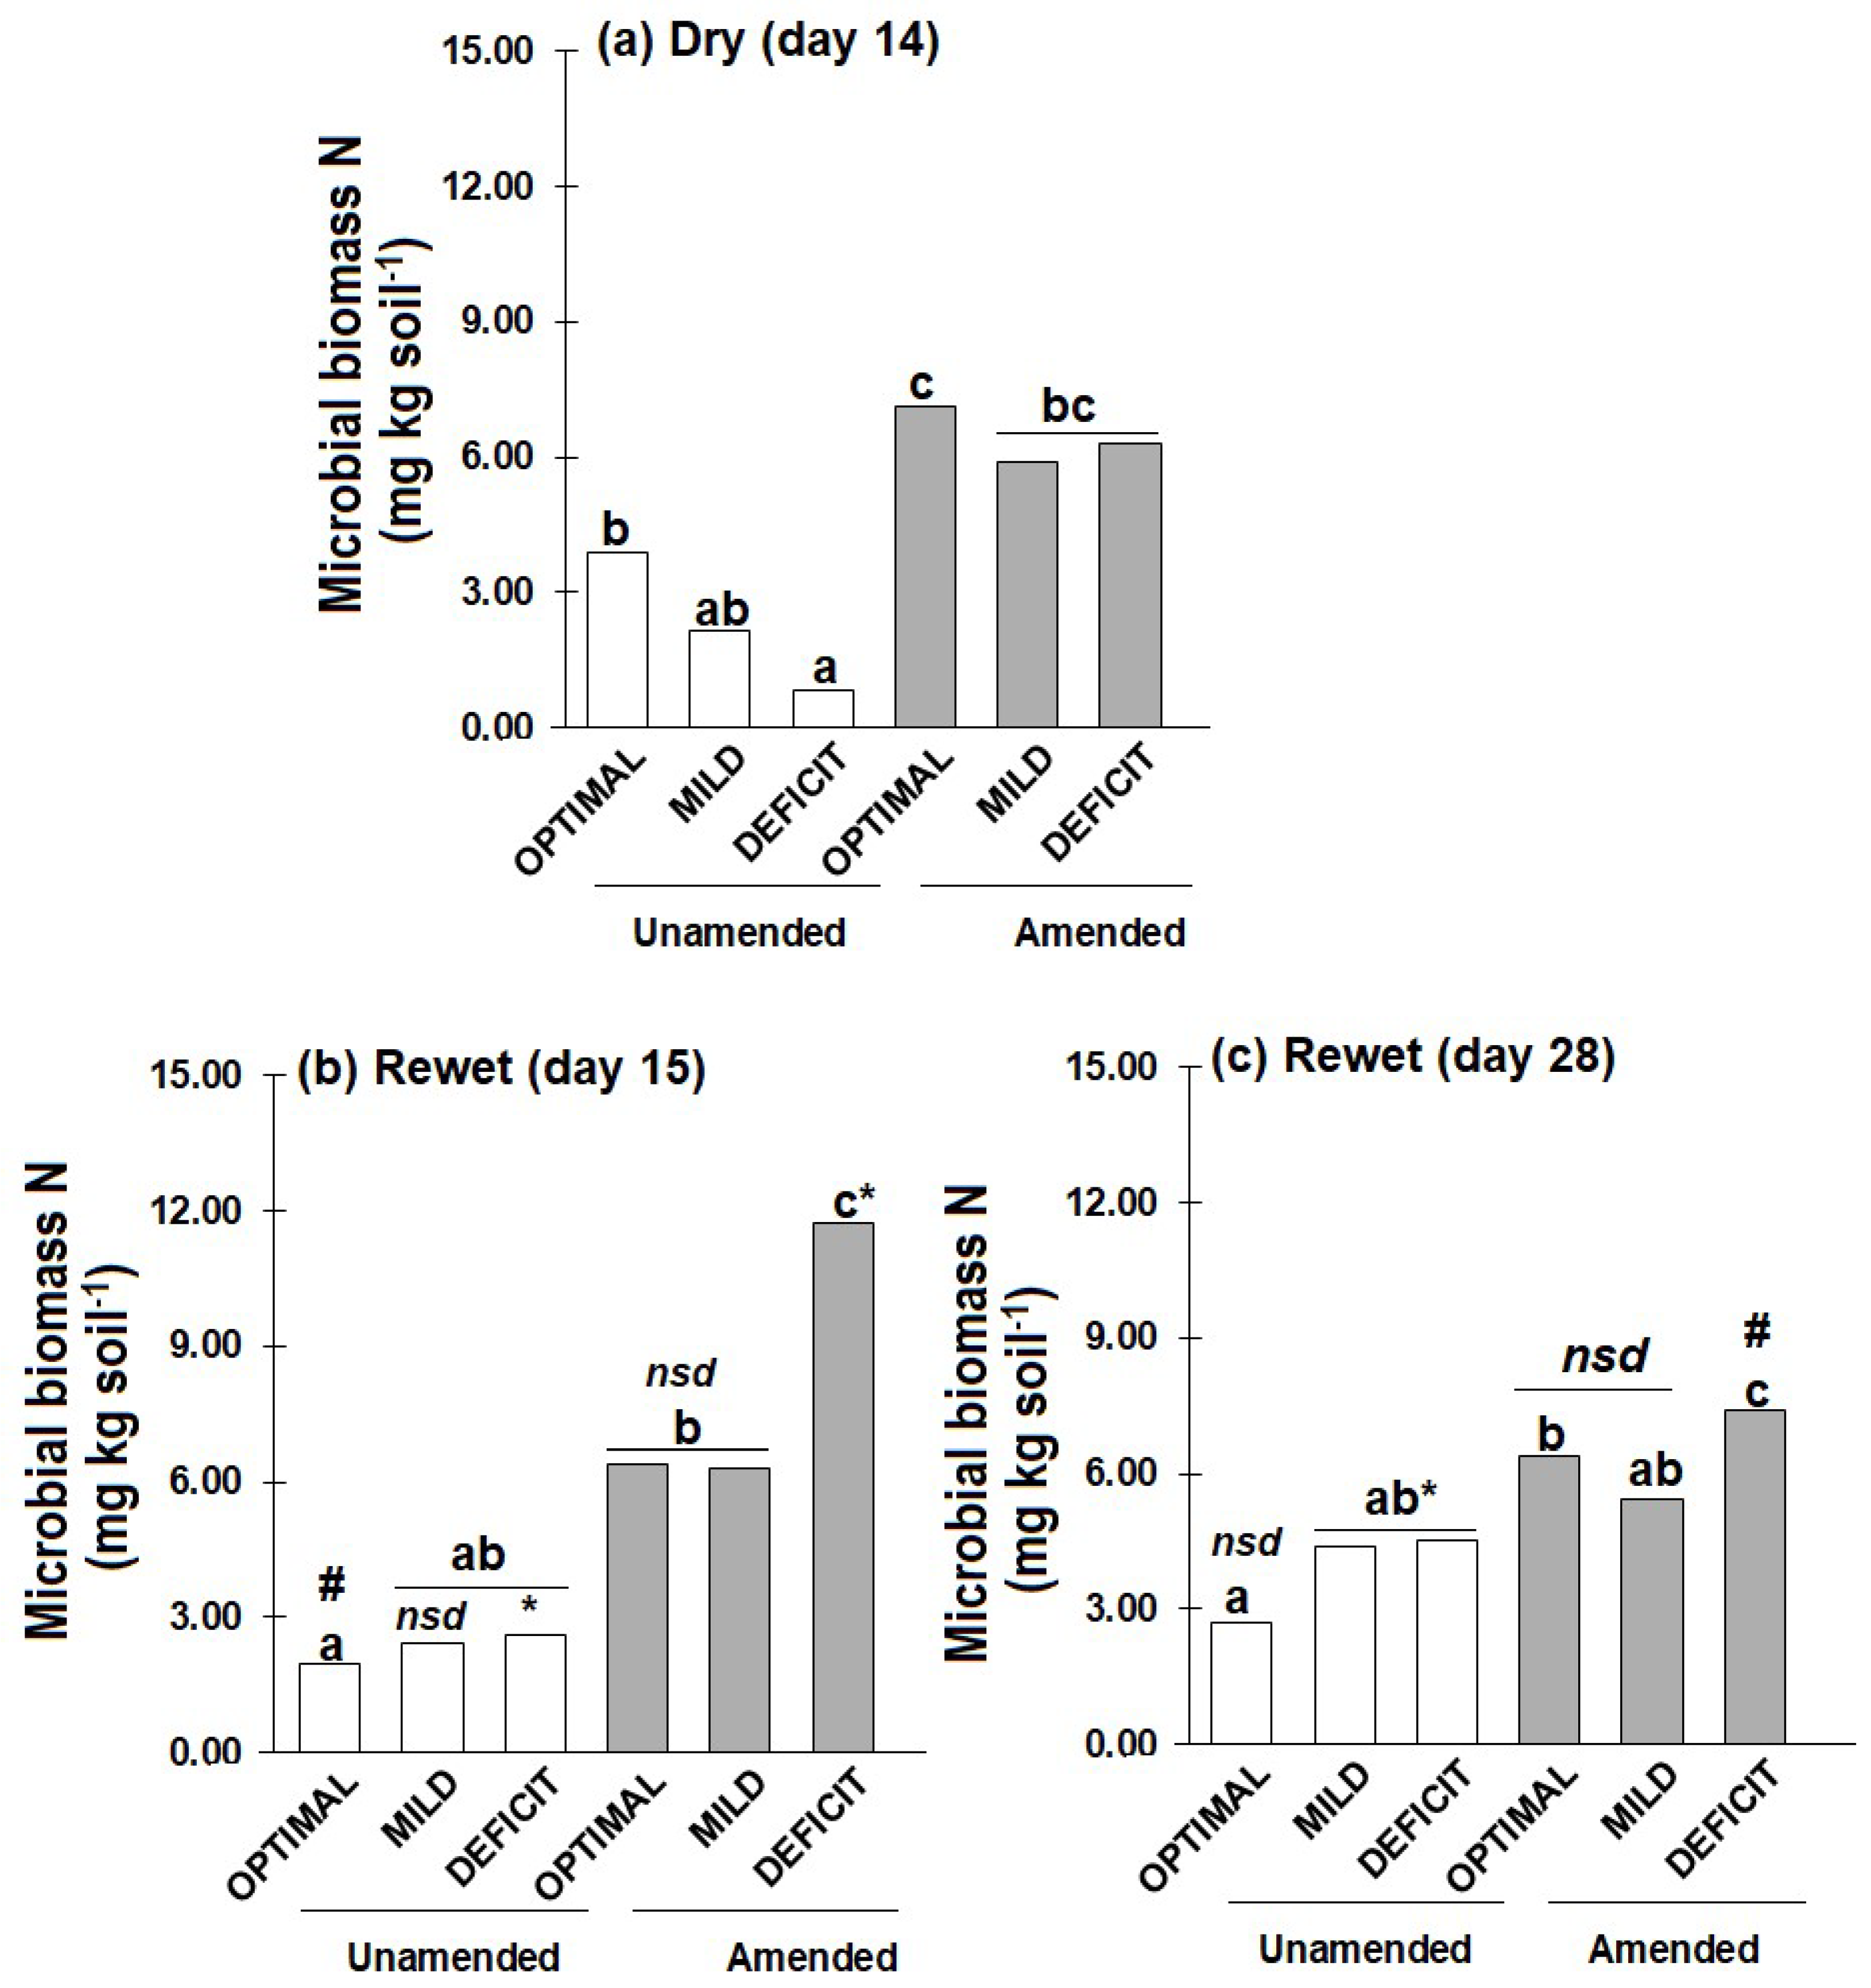
With predicted increase in the intervals between rainfall events becoming more apparent, little is known about how short-term (few weeks) drought events influence plant growth and nitrogen (N) uptake after rewetting, and how this legacy effect is modulated by drought intensity and soil amendment. Methods: Soil (50% water holding capacity, WHC) unamended or amended with faba bean residue (C/N 9) was planted with wheat for two weeks. Thereafter, drought was imposed by reducing soil water content to 10% (DEFICIT) or 30% (MILD) WHC and maintained for two weeks (days 0 to 14). Thereafter, soils (deficit and mild) were rewetted to 50% WHC and maintained at this water content for additional two weeks. Control soils were maintained at 50% WHC (OPTIMAL) throughout the experiment. Results: At the end of the dry period, shoot dry weight was about 60% lower in DEFICIT than OPTIMAL. Contrarily, soil available N was higher in DEFICIT (16.65-41.72 mg kg-1) than OPTIMAL (4.57-26.42 mg kg-1). While MBN did not differ with amendment, it was about 80% lower in DEFICIT than OPTIMAL without amendment. During the two-weeks after rewetting (days 15 to 28), shoot dry weight, N concentration and available N changed little without amendment. But in the amended soil particularly in DEFICIT treatments, shoot dry weight nearly doubled, shoot N concentration increased by about 40%, plant N uptake increased by about 70%, and MBN decreased by about 40%. However, shoot dry weight and plant N uptake were still lower than the OPTIMAL. Conclusion: The reduced plant growth, shoot N concentration and plant N uptake induced by a short period of drying (<30% WHC) is not compensated by increased growth and N uptake after rewetting.

Keywords: 
;  ;  ;  

1. Introduction

According to the Intergovernmental Panel on Climate Change [1], climate change will alter the periodicity and intensity of rainfalls in many regions of the world. In many areas, longer dry periods (i.e., drought) and more intense rainfall events are already occurring [2]. Such a shift in precipitation pattern is expected to impact soil water availability, particularly during the growing season [3,4].
As soils dry, water films become thinner and semi-soluble materials precipitate, reducing water availability and the rate of nutrient diffusion, resulting in resource limitation for plants and soil microbes [5]. Plant growth will also decrease due to restricted water uptake and thus stomata closure. Canarini and Dijkstra [4] posited that as the soil dries, a drop in water potential around the roots resulting in the decrease in soil hydraulic conductivity is the primary driver of stomata closure.
Depending on the length of the dry period, prolonged soil drying (several days) has been suggested to lead to a long-term suppression of stomatal conductance, possibly leading to turgor loss (i.e., wilting) as a strategy to limit continued tissue damage [6,7,8]. Further, restricted root growth in dry soil resulting in limited access to nutrients could be explained by the reduced nutrient diffusion and mass flow in the soil solution, decreased root nutrient uptake capacity due to low root water potential, and an increase in mechanical impedance of the dry soil that limits root growth and ability to explore soil volume for nutrients [9,10,11].
The effects of low soil water on microbial activities that contribute to nutrient availability has been well studied [2,12,13,14,15]. According to Schimel [15], water potential controls the survival and functions (e.g., nutrient mineralisation) of soil microbes. As soil water potential decreases, cellular water potential also drops resulting in reduced metabolic functions and ultimately death of soil microbes [10,15,16].
The impact of drought on plant growth and soil microbes depends on the intensity of soil dryness [17]. For example, Xue, et al. [11] found that plant and microbial biomass were lower in soil maintained at 10% water holding capacity (WHC) compared to 30% - 50% WHC, because plant and microbial nutrient uptake were water-limited [18]. Taken together, the effects of low soil water on soil and plant growth are expected to negatively impact global food production.
When dry soils are rewetted, the flush of nutrients upon rewetting has been shown to be a significant source of plant available nutrients [19,20,21]. Canarini and Dijkstra [4] noted that while soil drying reduced gaseous nitrogen (N) loss in wheat grown soil, possibly due to reduced denitrification supported by lower soil moisture content, N mineralisation was increased after rewetting. However, the amplitude of the nutrient flush caused by rewetting may differ depending on how dry the soil was before the rewetting. For example, Chowdhury [22] found that a flush of respiration only occurred if the water potential of the soils was previously at least 3-fold lower than in constantly moist soil at 50% WHC. While there exist numerous studies on the influence of drying-rewetting on soil processes, many have not considered the influence of the presence of plants. Zhu and Cheng [23] found that severe drying-rewetting conditions significantly reduced Sunflower (Helianthus annuus L.) shoot (32%) and root (52%) biomasses and soil organic matter decomposition (22%), compared to the constantly moist treatment. Similarly, Canarini and Dijkstra [4] confirmed that drying and rewetting reduced rhizodeposition and stabilization of new carbon, primarily through biomass reduction.
Increased nutrient supply through the application of mineral fertilisers or organic amendments may mitigate the effect of drying and rewetting on plants and microbes by increasing the nutrient concentration in the soil solution. For example, Li, et al. [24] found highest water use efficiency under reduced irrigation and high N fertilization. Hammad, et al. [25] also reported that plant biomass and total N uptake in maize plants increased with increase in N supply under water deficit conditions (50% of full irrigation) and were lowest in unamended soil with deficit irrigation.
The effect of longer dry periods on plants and microbes has been extensively studied [15,26,27,28]. However, little is known about how the soil water content influences plant growth and microbial N uptake during shorter dry periods and after rewetting early in plant development. It is also not clear how this legacy effect is modulated by crop residue amendment.
The aim of this study was to determine the effects of a previous low soil water content on wheat growth, crop N content and microbial N uptake after a second rewetting event in crop residue amended and unamended soils. In this glasshouse experiment, soil was amended with low C/N residue or left unamended and planted with wheat. Low C/N faba bean residue (C/N = 9) was added to the soil to increase substrate availability and provide an additional N source. The soil was then kept at optimal soil water content (i.e., 50% of maximum water holding capacity, WHC) for two weeks before drying to 10% (DEFICIT) or 30% (MILD) WHC, then kept at this water content for 2 weeks and then rewetted to optimal level and maintained thus for another two weeks. Constantly moist soil was maintained at the optimal water level throughout the experiment.
We hypothesised that in dry soil, (1) plant biomass and N concentration will be lower than in soil maintained at optimal water status, this effect will be more pronounced without residue amendment than with residues, due to lower nutrient availability in unamended treatments, also (2) microbial biomass N (MBN) will be lower than in soil maintained at optimal water status due to lower microbial activity. But after rewetting in dry soil, (3) shoot biomass and N concentration will increase compared to the end of the dry period, particularly in soil previously at deficit water level, due to the increase in available N after rewetting.

2. Results

2.1. Plant Growth, shoot N Concentration and N Uptake

At day 14 of the dry period, shoot dry weight in unamended treatments was about 50-60% lower in DEFICIT soil water condition than in MILD and OPTIMAL conditions and about 20% higher in OPTIMAL than MILD (Figure 1a). In soil amended with faba been residue, shoot dry weight was about two-fold greater in OPTIMAL than MILD and about three-fold greater than DEFICIT. It was about 30% greater in MILD than in DEFICIT. At the end of the dry period, some of the wheat plants, particularly of DEFICIT treatments without amendment, were almost wilting (photo or data unavailable).
Shoot dry weight one day after rewetting (referred to as day 15) was about 20-40% higher in OPTIMAL and MILD than at the end of the dry period. In DEFICIT treatments, shoot dry weight did not differ compared to the end of the dry period. After rewetting (day 15 to day 28), shoot dry weight in OPTIMAL was about 30% to two-fold higher than MILD and about four-fold higher than DEFICIT (Figure 1b-c). In unamended treatments from day 15 to 28, shoot dry weight increased by about 40% in OPTIMAL, about 10% in MILD and about 30% in DEFICIT. But in amended treatments, it increased about 40% to two-folds in all treatments.
At the end of the dry period (day 14), the shoot N concentration was 10-20% higher in soil amended with faba been residue than unamended treatments with the smallest differences between amendment treatments in DEFICIT. In OPTIMAL it was about 20% higher than MILD, but up to 40% higher than DEFICIT (Table 1). After rewetting (day 15 to day 28), the shoot N concentration was 30% to two-fold higher in amended than unamended treatments with a greater difference in rewetted treatments than plants maintained OPTIMAL throughout (Table 1). Differences among treatments varied with time after rewetting. One day after rewetting (day 15), the shoot N concentration was about 10-30% higher in OPTIMAL than in the rewetted treatments, but after two weeks (day 28) it was lowest in OPTIMAL, particularly it was two-fold higher in DEFICIT than in OPTIMAL but was 40% or more lower in OPTIMAL and MILD on day 28 than on day 15.
Shoot N uptake at the end of the dry period (day 14), was about four-fold higher in OPTIMAL than in DEFICIT and up to two-fold higher than in MILD (Table 1). In OPTIMAL and DEFICIT, shoot N uptake was up to 30% higher in the faba bean residue amended than the unamended treatments. However, in the MILD treatments, amendment had no effect on shoot N uptake during the dry period. After rewetting, shoot N uptake decreased from day 15 to 28 in OPTIMAL, but it increased in rewetted treatments, particularly in the amended treatments where it was about 30% higher in MILD and up to three-fold higher in DEFICIT on day 28 than day 15.

2.2. Soil Available N and Microbial Biomass N

At the end of the dry period (day 14), available N was about three to six-fold higher in faba bean residue amended than unamended treatments. In both amendment treatments, available N was about 40% to two-fold higher in DEFICIT than both OPTIMAL and MILD, which were not different (Figure 2a). One day after rewetting (day 15), available N was about 10% to two-fold higher than at the end of the dry period (Figure 2b). Available N on day 15 was about two to five-fold higher in amended than in unamended treatments.
In both amendment treatments, available N was about 30% to four-fold higher in DEFICIT than both OPTIMAL and MILD. In unamended treatments, available N in MILD was about 50% higher than in OPTIMAL, but they did not differ in the amended group. Available N was about 10-45% lower on day 28 (14 days after rewetting) than day 15 (Figure 2c). Available N on day 28 was about two to 6-fold higher in faba bean residue amended than in unamended treatments. In both amendment treatments, available N was about 10% to 3-fold higher in DEFICIT than both OPTIMAL and MILD, and up to 50% higher in MILD than OPTIMAL.
At the end of the dry period (day 14), MBN was about two to 8-fold higher in amended than unamended treatments. MBN was not influenced by moisture in the amended treatments, but in unamended treatments, it was about 80% lower in DEFICIT than OPTIMAL (Figure 3a). One day after rewetting (day 15) compared to the end of the dry period, MBN increased by about 20-40% in rewetted treatments but changed little in the OPTIMAL (Figure 3b). One day after rewetting (day 15), MBN was three-fold and four-fold higher in OPTIMAL and DEFICIT with amendment than in unamended. From day 15 to day 28, MBN decreased in DEFICIT with amendment by 50%, but increased in DEFICIT without amendment by 40%. On day 28, MBN was about two-fold higher in OPTIMAL and about 40% higher in DEFICIT with amendment than in unamended (Figure 3c). In the unamended treatments, MBN was not affected by water treatment, and was about 50% higher in DEFICIT than OPTIMAL and MILD in the treatments with amendment.

3. Discussion

This study showed that plant growth, soil N availability and microbial biomass N are influenced by water content during the dry period and that this effect is carried into the period after rewetting. It also showed that the effect of soil water content during the dry period is modulated by amendment with low C/N residues.

3.1. Dry Period

The first part of the first hypothesis (in dry soil, plant biomass and N concentration will be lower than in soil maintained at optimal water status) can be accepted. Drying of soil reduced shoot growth and shoot N concentration, particularly drying to 10% WHC as in the DEFICIT soil water treatments. A reduction in plant growth in dry soil has been shown before and can be explained by low water uptake, which causes stomata to close, and by low nutrient diffusion to the roots [10,11,29]. The difference in shoot dry weight and shoot N concentration compared to OPTIMAL was greater in DEFICIT treatments than in MILD, indicating that at 30% WHC with little moisture content, the plants were still able to take up some nutrients and assimilate CO2. However, the second part of the first hypothesis (this effect will be more pronounced without than with residue amendment, due to lower nutrient availability in unamended treatments) can only be accepted for OPTIMAL and MILD, whereas residue amendment had little effect on plant growth and N uptake in DEFICIT. This could be because at such very low water content, plant N uptake was impacted by water limitation. At the higher soil water content as in MILD, plants were still able to take up N.
Lower concentrations of soil available N in OPTIMAL and MILD compared to DEFICIT can be explained by greater plant and microbial N uptake due to higher soil water content. The high soil available N during the dry period in DEFICIT suggests the possibility that N mineralisation occurred in microsites where water was still present [30]. However, low MBN suggests low microbial uptake on mineralised N. A possible explanation for this apparent contradiction is that N was mineralised by extracellular enzymes and thus not linked to microbial activity [31,32,33]. However, the high concentration of available N in DEFICIT may also be a methodological artifact. Rewetting of the dry soil with the extractant KCl may have induced aggregate breakdown and microbial cell lysis releasing mineral N, which would not become available to plants and microbes with slow rewetting [34,35].
The very low water content in DEFICIT had a more pronounced negative effect on plant growth and N uptake than on MBN. This indicates that the microbes were less sensitive to the reduction in water content than plants, likely because a proportion of microbes remained active in the water films surrounding the aggregates and in small pores or survived the dry period in a dormant state [36]. The second hypothesis (during the dry period, MBN will be lower than in soil maintained at optimal water status due to lower microbial activity) can be confirmed for the unamended soils, but low water content had a limited effect on MBN in the amended soils. This indicates that the presence of easily decomposable organic material reduced the susceptibility of microbes to drying [37]. It could also be that fragments of the crop residue served as water reservoirs keeping microbes active during the dry period.

3.2. After Rewetting

Shoot dry weight in OPTIMAL continued to increase from day 15 to day 28 and remained higher in the amended treatment than without amendment. However, shoot N concentration in OPTIMAL decreased from day 15 to day 28 which is likely due to growth dilution [38]. In OPTIMAL soil water condition with faba bean residue, the decrease in shoot N concentration occurred despite N uptake as indicated by a slight decrease in available N and low MBN from day 15 onwards. This indicates that the increased N uptake did not compensate for the increased shoot growth.
The third hypothesis (shoot biomass and N concentration will increase compared to the end of the dry period, particularly in soil previously at deficit water level, due to the increase in available N after rewetting) can only be confirmed for the amended treatments. Rewetting had little effect on shoot dry weight and shoot N concentration in the unamended rewetted treatments. This is likely because nutrient limitation hampered the ability of the plants to respond to rewetting, although available N was higher in rewetted treatments than OPTIMAL from day 15 onwards. On the other hand, in the amended rewetted treatments, rewetting induced a plant growth increase which can be explained by increased nutrient availability by the amendment. In MILD soil water condition with faba bean residue, shoot dry weight increased immediately after rewetting to optimal soil water content and then more slowly until the end of the experiment. This increase in shoot growth after rewetting resulted in a declining shoot N concentration despite a higher available N concentration than in the unamended treatments.
In DEFICIT soil water condition with faba bean residue, shoot dry weight and shoot N concentration increased to nearly two-fold on day 28 (14 days after rewetting) than the end of the dry period. This suggests that the stronger drying in the first 14 days delayed the ability of the plants to quickly respond to the rewetting, which was later reversed by day 28. Further, microbial biomass N strongly increased in amended DEFICIT within the first day after rewetting, which suggests rapid immobilisation of N released upon rewetting.

4. Materials and Methods

4.1. Soil and Crop Residues

The soil was collected from the Waite Campus of The University of Adelaide, South Australia (longitude 138° 38′ E, latitude 35° 6′ S). This area has a Mediterranean climate: cool, wet winters and hot, dry summers with occasional short, heavy rainfall events. The soil is a Chromosol in Australian soil classification and a Rhodoxeralf in US Soil Taxonomy [39]. The soil properties are: 37% sand, 37% silt, 25% clay; maximum water holding capacity (WHC) 341 g kg-1; pH (1:5 soil water ratio) 6.8; EC (1:5) 0.1 dS m-1; total organic C 17 g kg-1; total organic N 1.5 g kg-1; bulk density 1.3 g cm-3; and available N 15 mg N kg-1 [39].
Young faba bean shoot (Vicia faba L.), dried at 40 °C, ground and sieved to 0.25–2-mm particle size, was used for the experiments. It has the following properties: total organic C 347 g kg−1; total N 38.5 g kg−1; and C/N ratio 9 [13].

4.2. Experimental Design

Soil was initially moistened to 50% of maximum water holding capacity (WHC) (hereafter called ‘OPTIMAL’) and mixed thoroughly with faba bean residue (15 g kg-1) or left unamended. Then, the soil was filled into pots (400 g dry soil equivalent) and sown with 10 pre-germinated wheat (Triticum aestivum L. cv. Axe) seedlings. After two weeks of plant growth at optimal soil water content, irrigation was ceased to allow the soil moisture to dry to 10% (DEFICIT) or 30% (MILD) WHC, which took about seven and three days, respectively. Thereafter, the soil moisture contents were maintained constant for additional two weeks (referred to as days 0-14). The water contents were determined and monitored by weighing the pots on an analytical balance. At the end of the two weeks (day 14), soils with low water content (DEFICIT and MILD) were rapidly rewetted back to optimal level by adding the required amount of water (27.3 g for mild treatments, and 54.6 g for deficit treatments). Control soils were maintained at OPTIMAL soil water content (68.2 g per 400g dry soil) throughout the experiment. All treatments were replicated four times. Soil available N, microbial biomass N and crop biomass and N uptake were destructively measured 14 days after reduction of watering and 1 and 14 days after rewetting to optimal soil water level (referred to as days 15 and 28).

4.3. Analyses

Measurements were carried out as described in Erinle, et al. [39]. Soil maximum water holding capacity was measured, matric potential = − 10 kPa (Wilke, 2005). Soil texture was determined according to [40]. Soil pH was determined in a 1:5 (w/v) soil to reverse osmosis (RO) water ratio [41]. Total organic C of soil and residues was determined by wet oxidation [42]. Total N in soil, crop residues and oven dried wheat crops were determined using the Kjeldahl method [43].
Total N uptake in wheat straw was calculated according to [44] with minor modification: N uptake (mg plant-1) = [Shoot N concentration (mg g-1) × shoot dry weight (g plant-1)].
Soil available N (exchangeable ammonium and nitrate) was measured after 1 h end-over-end shaking with 2 M KCl in a 1:5 soil-extractant ratio. Ammonium-N was determined after Willis, et al. [45] and nitrate-N after Miranda, et al. [46]. Microbial biomass N (MBN) was determined by chloroform fumigation extraction with 0.5 M K2SO4 according to Moore, et al. [47]. Microbial biomass N was calculated as the difference in NH4+ concentration between fumigated and non-fumigated samples divided by 0.57 [47].

4.4. Statistical Analyses

After confirming normality using the Shapiro-Wilk test, data were analysed by Completely Randomised Design in Genstat 19th edition (VSN Int. Ltd., UK) with three factors: amendment (without and with), plant (planted and unplanted) and water treatment (optimal, deficit and mild). In planted treatments, data on plant dry weight, shoot N concentration and N uptake were analysed by two-way analysis of variance (ANOVA). Tukey’s multiple comparison test at 95% confidence interval was used to determine significant differences among treatments at a given sampling time. Repeated measures ANOVA was used to determine the effect of sampling times.

5. Conclusions

It can be concluded that with the application of nitrogen-rich organic amendment such as the faba bean with C/N = 9, rewetting in dry soil induced an increase in plant and microbial N uptake which is supported by the flush of available N. However, in unamended soil, plants and microbes did not respond to rewetting because they were limited by low nutrient availability. In this experiment, the plants were young (2 weeks at onset of drying, 4 weeks at rewetting) which could have exacerbated the effect of both drying and rewetting on plants. Young plants with a relatively small root system will be more sensitive to drying of soil than older plants with an extensive root system, but they may also be able to respond to rewetting more quickly than older plants because they are in an active growth period. This suggests that amendment with nutrient-rich organic materials, such as the low C/N faba bean shoots, aids the recovery of plants after drought.

Author Contributions

Conceptualization, E.K.O., M.P. and B.P.; supervision, M.P. and B.P.; glasshouse and laboratory analyses, E.K.O. and M.P.; data analysis, E.K.O. and M.P.; writing—original draft preparation, E.K.O.; writing—review and editing, G.O.O. and E. O.O.; funding acquisition, E.K.O. All authors have read and agreed to the published version of the manuscript.

Funding

This research was funded by the Ekhagastiftelsen (Ekhaga Foundation), Sweden, grant number 2019-16 to E.K.O.; and The Swedish Research Council (2016-04710) to B.P.

Institutional Review Board Statement

Not applicable.

Informed Consent Statement

Not applicable.

Data Availability Statement

Not applicable.

Conflicts of Interest

The authors declare no conflicts of interest.

References

  1. IPCC. “Climate Change and Land: An Intergovernmental Panel on Climate Change Special Report on Climate Change, Desertification, Land Degradation, Sustainable Land Management, Food Security, and Greenhouse Gas Fluxes in Terrestrial Ecosystems.” edited by P.R. Shukla, J. Skeg, E. Calvo Buendia, V. Masson-Delmotte, H.-O. Pörtner, D.C. Roberts, P. Zhai, R. Slade, S. Connors, S. van Diemen, M. Ferrat, E. Haughey, S. Luz, M. Pathak, J. Petzold, J. Portugal Pereira, P. Vyas, E. Huntley, K. Kissick, M. Belkacemi and J. Malley, 864. Geneva, 2019.
  2. Manzoni, S., Chakrawal, A., Fischer, T., Schimel, J.P., Porporato, A., and Vico, G. Rainfall Intensification Increases the Contribution of Rewetting Pulses to Soil Heterotrophic Respiration. Biogeosciences 2020, 17, (15): 4007-4023. [CrossRef]
  3. Borken, W., and Matzner, E. Reappraisal of Drying and Wetting Effects on C and N Mineralization and Fluxes in Soils. Glob. Chang. Biol. 2009, 15, (4): 808-824. [CrossRef]
  4. Canarini, A., and Dijkstra, F.A. Dry-Rewetting Cycles Regulate Wheat Carbon Rhizodeposition, Stabilization and Nitrogen Cycling. J. Soil Biol. Biochem. 2015, 81: 195-203. [CrossRef]
  5. Tecon, R., and Or, D. Biophysical Processes Supporting the Diversity of Microbial Life in Soil. FEMS Microbiol. Rev. 2017, 41, (5): 599-623. [CrossRef]
  6. Bartlett, M.K., Klein, T., Jansen, S., Choat, B., and Sack, L. The Correlations and Sequence of Plant Stomatal, Hydraulic, and Wilting Responses to Drought. J. Proc. Natl. Acad. Sci. 2016, 113, (46): 13098-13103. [CrossRef]
  7. Scoffoni, C., and Sack, L. The Causes and Consequences of Leaf Hydraulic Decline with Dehydration. J. Exp. Bot. 2017, 68, (16): 4479-4496. [CrossRef]
  8. Verslues, P.E., and Longkumer, T. Size and Activity of the Root Meristem: A Key for Drought Resistance and a Key Model of Drought--Related Signaling. Physiol. Plant. 2022, 174, (1): e13622. [CrossRef]
  9. García, I., Mendoza, R., and Pomar, M.C. Deficit and Excess of Soil Water Impact on Plant Growth of Lotus Tenuis by Affecting Nutrient Uptake and Arbuscular Mycorrhizal Symbiosis. Plant Soil 2008, 304: 117-131. [CrossRef]
  10. He, M., and Dijkstra, F.A. Drought Effect on Plant Nitrogen and Phosphorus: A Meta--Analysis. New Phytol. 2014, 204, (4): 924-931. [CrossRef]
  11. Xue, R., Shen, Y., and Marschner, P. Low Soil Water Content During Plant Growth Influences Soil Respiration and Microbial Biomass after Plant Removal and Rewetting. J. Soil Sci. Plant Nutr. 2016, 16, (4): 955-966. [CrossRef]
  12. Bogati, K., and Walczak, M. The Impact of Drought Stress on Soil Microbial Community, Enzyme Activities and Plants. Agronomy 2022, 12, (1): 189. [CrossRef]
  13. Erinle, K.O., Doolette, A., and Marschner, P. Changes in Phosphorus Pools in the Detritusphere Induced by Removal of P or Switch of Residues with Low and High C/P Ratio. Biol. Fert. Soils 2020, 56, (1): 1-10. [CrossRef]
  14. Lund, V., and Goksøyr, J.J. Effects of Water Fluctuations on Microbial Mass and Activity in Soil. Microb. Ecol. 1980, 6: 115-123. [CrossRef]
  15. Schimel, J.P. Life in Dry Soils: Effects of Drought on Soil Microbial Communities and Processes. Annu. Rev. Ecol. Evol. Syst. 2018, 49, (1): 409-432. [CrossRef]
  16. Erinle, K.O., and Marschner, P. Soil Water Availability Influences P Pools in the Detritusphere of Crop Residues with Different C/P Ratios. J. Soil Sci. Plant Nutr. 2019, 19, (4): 771-779. [CrossRef]
  17. Bista, D.R., Heckathorn, S.A., Jayawardena, D.M., Mishra, S., and Boldt, J.K. Effects of Drought on Nutrient Uptake and the Levels of Nutrient-Uptake Proteins in Roots of Drought-Sensitive and-Tolerant Grasses. Plants 2018, 7, (2): 28. [CrossRef]
  18. Kolter, R., Siegele, D.A., and Tormo, A. The Stationary Phase of the Bacterial Life Cycle. Annu. Rev. Microbiol. 1993, 47: 855-875. [CrossRef]
  19. Bünemann, E.K., Keller, B., Hoop, D., Jud, K., Boivin, P., and Frossard, E. Increased Availability of Phosphorus after Drying and Rewetting of a Grassland Soil: Processes and Plant Use. Plant Soil 2013, 370: 511-526. [CrossRef]
  20. Butterly, C.R. Drying/Rewetting Cycles in Southern Australian Agricultural Soils: Effects on Turnover of Soil Phosphorus, Carbon and the Microbial Biomass. Ph.D, The University of Adelaide, South Australia, 2008.
  21. Sardans, J., and Peñuelas, J. Increasing Drought Decreases Phosphorus Availability in an Evergreen Mediterranean Forest. Plant Soil 2004, 267: 367-377. [CrossRef]
  22. Chowdhury, N. Soil Microbial Activity and Community Structure as Affected by Osmotic and Matric Potential. Ph.D, University of Adelaide, South Australia, 2011.
  23. Zhu, B., and Cheng, W. Impacts of Drying–Wetting Cycles on Rhizosphere Respiration and Soil Organic Matter Decomposition. J. Soil Biol. Biochem. 2013, 63: 89-96. [CrossRef]
  24. Li, L., Ma, H., Xing, J., Liu, F., and Wang, Y. Effects of Water Deficit and Nitrogen Application on Leaf Gas Exchange, Phytohormone Signaling, Biomass and Water Use Efficiency of Oat Plants. J. Plant Nutr. Soil Sci. 2020, 183, (6): 695-704. [CrossRef]
  25. Hammad, H.M., Farhad, W., Abbas, F., Fahad, S., Saeed, S., Nasim, W., and Bakhat, H.F. Maize Plant Nitrogen Uptake Dynamics at Limited Irrigation Water and Nitrogen. Environ. Sci. Pollut. Res. 2017, 24: 2549-2557. [CrossRef]
  26. Jensen, K.D., Beier, C., Michelsen, A., and Emmett, B.A. Effects of Experimental Drought on Microbial Processes in Two Temperate Heathlands at Contrasting Water Conditions. Appl. Soil Ecol. 2003, 24, (2): 165-176. [CrossRef]
  27. Wang, M., Shi, S., Lin, F., Hao, Z., Jiang, P., and Dai, G. Effects of Soil Water and Nitrogen on Growth and Photosynthetic Response of Manchurian Ash (Fraxinus Mandshurica) Seedlings in Northeastern China. PloS one 2012, 7, (2): e30754. [CrossRef]
  28. Zhou, X., Zhang, Y., Ji, X., Downing, A., and Serpe, M. Combined Effects of Nitrogen Deposition and Water Stress on Growth and Physiological Responses of Two Annual Desert Plants in Northwestern China. Environ. Exp. Bot. 2011, 74: 1-8. [CrossRef]
  29. Buckley, T.N. How Do Stomata Respond to Water Status? J New Phytol 2019, 224, (1): 21-36.
  30. Schimel, J.P., and Bennett, J. Nitrogen Mineralization: Challenges of a Changing Paradigm. Ecology 2004, 85, (3): 591-602.
  31. Ali, S., Dongchu, L., Jing, H., Ahmed, W., Abbas, M., Qaswar, M., Anthonio, C.K., Lu, Z., Boren, W., and Yongmei, X. Soil Microbial Biomass and Extracellular Enzymes Regulate Nitrogen Mineralization in a Wheat-Maize Cropping System after Three Decades of Fertilization in a Chinese Ferrosol. J. Soil Sediment 2021, 21: 281-294. [CrossRef]
  32. Geisseler, D., and Horwath, W.R. Relationship between Carbon and Nitrogen Availability and Extracellular Enzyme Activities in Soil. Pedobiologia 2009, 53, (1): 87-98. [CrossRef]
  33. Li, X., Hou, L., Liu, M., Lin, X., Li, Y., and Li, S. Primary Effects of Extracellular Enzyme Activity and Microbial Community on Carbon and Nitrogen Mineralization in Estuarine and Tidal Wetlands. Appl. Microbiol. Biotechnol. 2015, 99: 2895-2909. [CrossRef]
  34. Barnard, R.L., Osborne, C.A., and Firestone, M.K. Responses of Soil Bacterial and Fungal Communities to Extreme Desiccation and Rewetting. The ISME J. 2013, 7, (11): 2229-2241. [CrossRef]
  35. Fierer, N., and Schimel, J.P. Effects of Drying–Rewetting Frequency on Soil Carbon and Nitrogen Transformations. J. Soil Biol. Biochem. 2002, 34, (6): 777-787. [CrossRef]
  36. Ebrahimi, A., and Or, D. Hydration and Diffusion Processes Shape Microbial Community Organization and Function in Model Soil Aggregates. J Water Resour. Res. 2015, 51, (12): 9804-9827. [CrossRef]
  37. Jiang, Z., Bian, H., Xu, L., Li, M., and He, N. Pulse Effect of Precipitation: Spatial Patterns and Mechanisms of Soil Carbon Emissions. Front. Ecol. Evol. 2021, 9: 673310. [CrossRef]
  38. Cousins, O.H., Garnett, T.P., Rasmussen, A., Mooney, S.J., Smernik, R.J., Brien, C.J., and Cavagnaro, T.R. Variable Water Cycles Have a Greater Impact on Wheat Growth and Soil Nitrogen Response Than Constant Watering. J. Plant Sci. 2020, 290: 110146. [CrossRef]
  39. Erinle, K.O., Li, J., Doolette, A., and Marschner, P. Soil Phosphorus Pools in the Detritusphere of Plant Residues with Different C/P Ratio—Influence of Drying and Rewetting. Biol. Fert. Soils 2018, 54: 841-852. [CrossRef]
  40. Ge, G., and Or, D. “Particle Size Analysis.” In Methods of Soil Analysis. Part 4. Physical Methods, edited by J. Dane and G. Topp, 255-294. Madison, USA: Soil Science Society of America, 2002.
  41. Rayment, G., and Higginson, F.R. Australian Laboratory Handbook of Soil and Water Chemical Methods. Melbourne: Inkata Press Pty Ltd., 1992.
  42. Walkley, A., and Black, I.A. An Examination of the Degtjareff Method for Determining Soil Organic Matter, and a Proposed Modification of the Chromic Acid Titration Method. Soil Sci. 1934, 37, (1): 29-38. [CrossRef]
  43. McKenzie, H., and Wallace, H.S. The Kjeldahl Determination of Nitrogen: A Critical Study of Digestion Conditions-Temperature, Catalyst, and Oxidizing Agent. Aust. J. Chem. 1954, 7, (1): 55-70. [CrossRef]
  44. Sharma, N., Singh, R.J., and Kumar, K. Dry Matter Accumulation and Nutrient Uptake by Wheat (Triticum Aestivum L.) under Poplar (Populus Deltoides) Based Agroforestry System. Int. Sch. Res. Notices. 2012, 2012, (1): 359673.
  45. Willis, R.B., Montgomery, M.E., and Allen, P.R. Improved Method for Manual, Colorimetric Determination of Total Kjeldahl Nitrogen Using Salicylate. J. Agric. Food Chem. 1996, 44, (7): 1804-1807. [CrossRef]
  46. Miranda, K.M., Espey, M.G., and Wink, D.A. A Rapid, Simple Spectrophotometric Method for Simultaneous Detection of Nitrate and Nitrite. Nitric oxide 2001, 5, (1): 62-71. [CrossRef]
  47. Moore, J., Klose, S., and Tabatabai, M. Soil Microbial Biomass Carbon and Nitrogen as Affected by Cropping Systems. Biol. Fert. Soils 2000, 31: 200-210. [CrossRef]
Figure 1. Shoot dry weight (mg plant-1) of wheat plants in soil dried to 10% (DEFICIT) or 30% (MILD) of soil water holding capacity (WHC) and maintained dry for 14 days (a), and (b) 1 day and (c) 14 days after rewetting (referred to as days 15 and 28 after onset of the drying) of previously dry soil to 50% of WHC, or maintained constantly moist (OPTIMAL) throughout, unamended or amended with faba bean residue. At a given sampling day, different letters indicate significant differences among treatments (P ≤ 0.05, n = 3 ± standard error). The * indicates an increase and nsd indicates ‘no significant difference’ in shoot dry weight compared to previous sampling time.
Preprints 139716 g001
Figure 2. Available N (mg kg soil-1) in soil dried to 10% (DEFICIT) or 30% (MILD) of soil water holding capacity (WHC) and maintained dry for 14 days (a), and (b) 1 day and (c) 14 days after rewetting (referred to as days 15 and 28 after onset of the drying) of previously dry soil to 50% of WHC, or maintained constantly moist (OPTIMAL) throughout, unamended or amended with faba bean residue and sown with wheat. Columns with different letters are significantly different for the plant treatment × amendment × moisture treatment interaction (P ≤ 0.05, n = 3 ± standard error). The * indicates an increase, # indicates a decrease and nsd indicates ‘no significant difference’ in concentration compared to previous sampling time.
Preprints 139716 g002
Figure 3. Microbial biomass N (mg kg soil-1) in soil dried to 10% (DEFICIT) or 30% (MILD) of soil water holding capacity (WHC) and maintained dry for 14 days (a), and (b) 1 day and (c) 14 days after rewetting (referred to as days 15 and 28 after onset of the drying) of previously dry soil to 50% of WHC, or maintained constantly moist (OPTIMAL) throughout, unamended or amended with faba bean residue and sown with wheat. Columns with different letters are significantly different for the plant treatment × amendment × moisture treatment interaction (P ≤ 0.05, n = 3 ± standard error). The * indicates an increase, # indicates a decrease and nsd indicates ‘no significant difference’ in concentration compared to previous sampling time.
Preprints 139716 g003
Table 1. Shoot nitrogen concentration (mg g-1) and nitrogen uptake (mg plant-1) of wheat plants (a) grown in soil dried for two weeks to 10% (DEFICIT) or 30% (MILD) of soil water holding capacity (WHC), and (b) after rewetting of previously dry soil to 50% WHC (OPTIMAL), or maintained constantly moist (OPTIMAL) throughout, unamended or amended with faba bean residue.
Amendment Moisture treatment (a) Dry period (b) After rewetting
Day 14 Day 15 Day 28
Shoot N concentration (mg g-1)
Unamended OPTIMAL 26.94±0.17cC 21.03±0.10dB 7.76±0.99aA
MILD 22.07±0.25bC 19.11±0.04cB 12.03±0.05bA
DEFICIT 17.25±0.16aB 15.57±0.58aA 16.85±0.11dB
Amended OPTIMAL 30.05±0.18eC 26.41±0.31fB 14.19±0.23cA
MILD 29.03±0.03dC 24.00±0.21eB 15.87±0.04dA
DEFICIT 22.52±0.13bB 17.33±0.09bA 28.55±0.22eC
N uptake (mg plant-1)
Unamended OPTIMAL 3.69±0.03eB 3.71±0.03eB 2.21±0.28cA
MILD 2.40±0.03dA 2.11±0.00cA 1.43±0.01bA
DEFICIT 0.87±0.01aB 0.69±0.03aA 1.09±0.01aC
Amended OPTIMAL 4.38±0.04fA 6.04±0.08fC 5.46±0.09fB
MILD 2.16±0.00cA 2.85±0.02dB 3.98±0.01eC
DEFICIT 1.23±0.00bB 0.88±0.01bA 2.82±0.02dC
Means within a column followed by different lower-case letters are significantly different for the amendment × moisture treatment interaction (P ≤ 0.05, n = 3 ± standard error). Upper case letters indicate significant difference across sampling times for each treatment.
Disclaimer/Publisher’s Note: The statements, opinions and data contained in all publications are solely those of the individual author(s) and contributor(s) and not of MDPI and/or the editor(s). MDPI and/or the editor(s) disclaim responsibility for any injury to people or property resulting from any ideas, methods, instructions or products referred to in the content.
Copyright: This open access article is published under a Creative Commons CC BY 4.0 license, which permit the free download, distribution, and reuse, provided that the author and preprint are cited in any reuse.

Downloads

47

Views

47

Comments

0

Subscription

Notify me about updates to this article or when a peer-reviewed version is published.

Email

Prerpints.org logo

Preprints.org is a free preprint server supported by MDPI in Basel, Switzerland.

Subscribe

© 2025 MDPI (Basel, Switzerland) unless otherwise stated