
Submitted:
19 November 2024
Posted:
19 November 2024
You are already at the latest version
Abstract
Alkaline stress is one of the major abiotic constraints limiting the plant growth and development. The alkaline tolerance in crop plants is a complex trait regulated by many genes. The genetic basis of alkaline tolerance is largely unknown in soybean. In this study, an integrated strategy of genomic analysis was utilized to elucidate the genetic architecture of alkaline tolerance across the panel of 326 diverse soybean cultivars. Our study revealed 28 SNPs was significantly associated with alkaline tolerance through association mapping using seven GWAS models. By considering the detection of SNPs in multiple environments and GWAS models, the genomic regions of five consistent SNPs were depicted as stable QTLs viz., qAT1, qAT4, qAT14, qAT18 and qAT20. All these five alkaline tolerance QTLs are reported for the first time. By using the in silico analysis, we detected 17 genes within physical intervals of five QTLs as putative candidates. Haplotype alleles of four candidate genes showed significant differences in the regulation of alkaline tolerance-related traits varying from two to four regulating alkaline tolerance from lowest to highest through moderate levels. The outcome of the current investigation can be used in soybean breeding programs for producing cultivars with enhanced alkaline tolerance.
Keywords:
Soybean
; alkaline tolerance
; GWAS
; haplotype
; candidate genes
1. Introduction
Soybean [Glycine max (L.) Merr.] is cultivated and consumed globally because its seeds possess abundant quantity of edible oil and protein [1]. Moreover, the importance of soybean in the improvement of soil fertility, as well as its significance in human health has been well recognized [2]. Globally, the soybean consumption is maximum in China; however, the country is heavily reliant on soybean imports [3,4]. However, there are many environmental challenges including both biotic and abiotic stresses which limit the soybean production in China. Among, these challenges, alkaline stress has been considered as a major detrimental factor for soybean productivity [5,6]. It has been documented that China possesses around 100 million ha of salt-alkaline soil, and there is a need to bring this land under crop cultivation [7]. Hence, production of the alkaline-tolerant cultivars of soybean is an important breeding objective. Studies have documented the significant correlation of the alkaline stress with the shoot and root biomass related traits in soybean [8]. However, the production of alkaline-tolerant cultivars of soybean needs the detailed information of genetic basis that regulates the alkaline tolerance in soybean. Comprehensive understanding of the genetic elements and genes controlling the alkaline tolerance in soybean will allow their use in the production of alkaline-tolerant cultivars of soybean through molecular breeding [7,9].
Previously, the efforts put forward on unraveling the genetic elements and genes governing the alkaline tolerance in soybean was negligible, and only four QTLs associated with alkaline stress tolerance have been documented in SoyBase (https://www.soybase.org/). However, the traditional QTL mapping involving low-throughput markers were utilized to identify these QTLs [5]. The traditional genetic mapping possessing the demerit of low-resolution has restricted the use of these genetic elements in the breeding of alkaline tolerance in soybean [10]. In this context, the association mapping approach possessing high resolution and precision has emerged the practical approach in marker-assisted breeding applications [11,12]. Recent breakthrough seen in the genome sequencing and high-throughput genotyping has allowed the routine application of association mapping in crop plants [13,14]. Multiple studies have documented the use of GWAS for different abiotic stresses in multiple plant species, such as drought tolerance in rice [15], salinity tolerance in wheat [16], alkaline tolerance in maize [17], drought tolerance in chickpea [18], salinity tolerance in mungbean [19], heat stress tolerance in Faba bean [20] and pea [21].
In the crop germplasm, every gene has multiple alleles and these all alleles cannot be identified by using the biallelic SNP markers. Some of these alleles can be rare and superior resulting their loss in the GWAS identification process [12]. In this context, the emergence of haplotype markers that are multi-allelic can capture the rare and superior alleles in the crop germplasm. The performance of haplotype markers has been observed better than the SNP markers by both empirical and simulation methods [22,23,24]. The better efficiency of haplotype markers compared to SNPs in association mapping and genomic selection (GS) analyses can be attributed to the multi-allelic nature of the haplotype markers [12]. The desirable haplotypes for abiotic stress tolerance have been identified in different crop species salinity tolerance in soybean [25], salt tolerance in wheat [26], drought tolerance in wheat [27].
In soybean, GWAS has been performed for different traits, including abiotic stress related traits. For example, GWASs have been performed for salt tolerance using the 305 diverse soybean accessions that were genotyped with the Illumina Infinium SoySNP50K BeadChip [28]. Similarly, GWAS analysis of the salt tolerance trait was carried out in a global soybean panel using the SoySNP50K BeadChip for genotyping [29]. GWAS mapping has been carried out for drought tolerance using diverse of panel of 259 released Chinese soybean cultivars genotyping with the Illumina SoySNP6k iSelect BeadChip [30]. The GWAS analysis has been performed for seed-flooding tolerance in soybean by using the Yangtze-Huai soybean breeding germplasm (YHSBG) population consisting of 347 diverse soybean accessions genotyping with the RAD-seq method [31]. GWAS analysis was also carried out for cold tolerance in the soybean at the germination stage using 260 soybean accessions genotyped with the 30,799 SNPs [32]. However, very limited studies of GWAS have been reported for the alkaline stress tolerance in soybean [10,33]. Hence, concerted efforts are needed to identify highly consistent and stable genetic elements as well as true functional genes governing alkaline tolerance in soybean.
To discover the alkaline tolerance at the genetic level, the association mapping panel of 326 diverse soybean accessions were used to perform genetic mapping, haplotype, and candidate gene analyses. The outcome of the present study involves the major QTLs, haplotypes, and candidate genes linked to soybean alkaline tolerance. These genetic elements can be incorporated in the breeding of alkaline tolerance in soybean, and the candidate genes can be validated for their further deployment in soybean breeding.
2. Results
2.1. Determination of Optimum Alkaline Treatment
To determine the optimum level of alkaline treatment that can be used for the evaluation of alkaline stress tolerance in the GWAS panel of 326 soybean accessions, we tested the performance of the two soybean cultivars viz., DS118 and JY86 under the different alkaline treatments viz., 50 nmol/L, 100 nmol/L, 150 nmol/L and 200 nmol/L. The DS118 is a well-known alkaline-tolerant cultivar, whereas JY 86 is a local model soybean cultivar in the Jilin province, China. Our results revealed that the above-ground shoot of DS118 cultivar grows well under the alkaline treatments of 50 mmol/L, 100 mmol/L and 150 mmol/L (Figure 1). However, the plant height of DS118 cultivar gradually decreased with the increase in the alkaline treatment concentration from 50 mmol/L to 200 mmol/L (Figure 1); besides at the alkaline concentration of 200 mmol/L, the leaves of the plant turned yellow as well as are mildly wilted. The underground root growth was also inhibited to different degrees with the increase in the alkaline treatment concentration, and the inhibition was more obvious when the concentration of alkaline treatment was increased beyond 150 mmol/L (Figure 1). However, in the case of JY86 cultivar the phenotype of the shoot growth seems good at the alkaline treatment of 50 mmol/L, but the plant leaves began to turn yellow as the concentration of alkaline treatment reached 100 mmol/L (Figure 1). Moreover, at the alkaline treatment of 150 mmol/L the leaves were wrinkled and curled as well as leaf number was reduced (Figure 1). The underground root of JY86 cultivars was obviously inhibited under 150 mmol/L alkaline treatment, and the roots are dying at the alkaline treatment of 200 mmol/L. Based on the phenotypic characterization, it become evident that local soybean cultivar viz., JY86 are more sensitive to alkaline stress relative to the DS118 cultivar. By considering our results, the 150 mmol/L was considered as an optimum concentration for the evaluation of GWAS panel of soybean accessions for alkaline stress tolerance.
2.2. Phenotypic Analysis of Alkaline Tolerance-Related Traits
The alkaline tolerance of 326 soybean accessions of GWAS panel was evaluated using eight traits of alkaline tolerance-related traits viz., seedling fresh weight (SFW), seedling dry weight (SDW), root dry weight (RDW), root fresh weight (RFW), relative chlorophyll content (CC), root number (RN), root tips number (RTN) and root length (RL). The phenotypic appearance of the four representative cultivars under control (CK) and alkaline treatment (AT) are present in the Figure S1. The values of descriptive statistics paramaters for all the eight studied traits are presented in Table 1. The ANOVA (F-value) analysis showed that genotype (G), environment (E) and G × E interaction were highly significant (P<0.0001) for all the eight studied traits, expect that G and G × E varaition were non-significant for the RFW trait (Table S1).
2.3. Population Structure and LD Analysis
By applying the quality control measures viz., MAF<0.05 and a missing genotype at 0.01, we obtained a total of 3,311,166 high-quality SNPs (Table S2). These SNPs were distributed across all the 20 chromosomes in soybean; the lowest number of SNPs were located on the Chr.11 (62,554), whereas the highest number of SNPs were present on the Chr.15 (254,495) (Figure 2A; Table S2). Markers density across the different chromosomes varies considerably, and the highest marker density were observed on the Chr.15 (4916.83 SNPs/Mb), and lowest marker density were observed on the Chr.11 (1799.08 SNPs/Mb) (Figure 2B; Table S2).
The analysis of population structure also revealed no distinct structure with a continuous distribution (Figure 3A; Table S3). In addition, the kinship matrix represented by the dendrogram and heatmap does not showed the clear clustering of the soybean accessions (Figure 3B). The linkage disequilibrium (LD) characteristic was also studied for the association mapping panel of 326 accessions, and the results are shown in the graph (Figure 3C). The mean value of r2 in the soybean genome was 0.68, and at the 0.68 the decay of LD started and at the 0.34 the half decay is reached. At the 71.6 kb the LD decay curve and half decay intersected, and this distance determines the linkage across the whole soybean genome. The genomic interval of ±71.6 kb in the upstream and downstream of the stable significant SNPs are considered as QTL.
2.4. Association Mapping Analysis of Alkaline Tolerance
In the current study, we identified a total of 28 SNPs significantly associated with the six alkaline tolerance-related traits viz., RDW, RFW, SFW, CC, SDW and RTN across the two environments (Table 2; Figure 4 & Figure 5). These significant SNPs include one, one, four, seventeen, four and one for the traits viz., RDW, RFW, RTN, SDW, SFW and CC, respectively. Besides, twenty and eight significant SNPs were identified in the AT and ACR environments, respectively. These significant SNPs identified in the AT and ACR environments for different alkaline tolerance-related traits are associated with alkaline tolerance in soybean. Among these 28 significant SNPs, the Chr04_51929177 was identified by all the seven GWAS models viz., BLINK, FarmCPU, MLMM, super, GLM, MLM and CMLM in the ACR environment. The significant SNPs viz., Chr20_25660093 was identified by the five GWAS models viz., MLMM, super, GLM,
MLM and CMLM as well as in both environments viz., AT and ACR. Moreover, the SNPs viz., Chr18_27591088, Chr04_52367033, Chr04_51934424 and Chr04_52131534 were identified by four out of total seven GWAS models in the ACR environment. The Chr01_38897254 was identified by three GWAS models viz., MLMM, super and CMLM in the ACR environment. The remaining 21 significant SNPs identified in the AT or ACR environments were detected by either two or one GWAS models.
Based on the above results, the significant SNPs viz., Chr01_38897254, Chr18_27591088, and Chr20_25660093 are identified through multiple GWAS models and environments (AT & ACR), and thus considered as stable marker-trait associations (MTAs) regulating the alkaline tolerance in soybean. By considering the upstream and downstream distances within the linkage disequilibrium (LD) decay (±71.6 kb) around these three stable significant SNPs, we delineated these three genomics regions as stable QTLs viz., qAT1, qAT18 and qAT20, respectively. Besides, 15 significant SNPs falling within the LD decay distance of ±71.6 kb are identified on the Chr.14 to be associated with SDW in the AT environment across two GWAS models, this region can be also considered as the stable genomic loci/QTL associated with alkaline tolerance in soybean, and are named as qAT14. Moreover, the four significant SNPs viz., Chr04_51929177, Chr04_52367033, Chr04_51934424 and Chr04_52131534 that are associated with the SFW in the ACR environment are identified within the LD decay distance of ±71.6 kb on Chr.04 across the all seven GWAS models, this genomic region can be also delineated as QTL named as qAT4. Overall, we identified a total of five stable QTLs viz., qAT1, qAT4, qAT14, qAT18 and qAT20 associated with the alkaline tolerance in soybean.
2.5. Candidate Genes Identification
A total of 39 model genes were identified within the physical genomic interval of five major QTLs viz., qAT1, qAT4, qAT14, qAT18 and qAT20, which consisted of four, 14, 11, one and nine genes, respectively (Table 3). Furthermore, based on the in-silico analysis, gene annotations and literature survey, we defined a total of 17 genes underlying the genomic interval of five QTLs, that include one, eight, three, one and four genes within the physical interval of qAT1, qAT4, qAT14, qAT18 and qAT20. The selection of these candidate genes was based on gene function annotation such as genes governing salt tolerance, drought tolerance, protein phosphorylation, heat shock proteins, basic helix-loop-helix (bHLH) transcription factors, heat shock transcription factor, S-ribonuclease binding protein 1, GRAS family transcription factor, pentatricopeptide repeat (PPR-like) superfamily protein, C2H2-like zinc finger protein, abiotic stress tolerance, auxin signaling, kinase activity, ethylene signaling and salicylic acid signaling. These 14 genes possess one of the above function, thus were considered as putative candidate genes regulating alkaline tolerance in soybean.
2.6. Haplotypes Identification for Alkaline Tolerance
Our results showed that the four significant SNPs identified on Chr.04 associated with the SFW in the ACR environment were present within the LD decay range of ±71.6 kb, and these SNPs thus form haplotype blocks viz., Hap4 on Chr.04 (Figure 6A). Besides, the 15 significant SNP identified on the Chr.14 are associated with SDW in the AT environment fall within the the LD decay range of ±71.6 kb, thus form another haplotype block viz., Hap14 (Figure 6B). The haplotype block Hap4 possesses three haplotype alleles viz., Hap4_1, Hap4_2 and Hap4_3 (Figure 6A). The Hap4_2 regulates the higher value of SFW under the ACR environment, thus regulates the higher alkaline tolerance; whereas the Hap4_1 regulates the lowest value of SFW under the ACR environment and regulates the lower alkaline toerlance, besides, the Hap4_3 regulates the intermediate value of SFW under the ACR environment, thus regulates the moderate alkaline tolerance in soybean. The haplotype block Hap14 possesses two haplotype alleles viz., Hap14_1 and Hap14_2 (Figure 6B). Haplotype allele viz., Hap14_1 regulates the lowest value of SDW under the AT environment, thus are regulating the lower alkaline tolerance in soybean; whereas the Hap14_2 regulates highest value of the SDW under the AT environment, thus are regulating the higher alkaline tolerance in the soybean.
Moreover, the haplotype analysis of the 17 candidate genes revealed that haplotype alleles of the four candidate genes viz., Glyma.04G252300, Glyma.04G253100, Glyma.14G083700 and Glyma.20G072500 showed signigicant difference in the regualation of alkaline tolerance-related traits viz., RDW, RFW, SDW, SFW, RTN & CC under the treatments of either AT or ACR or both (Figure 7). The haplotype alleles underlying these four candidate genes across the GWAS panel of accessions varies from two to four. These haplotype alleles governs the alkaline tolerance from the lowest to highest through moderate levels.
The immobile nature of plants has exposed them to environmental constraints; however, the alkaline stress has emerged one of important constraint that negatively affects the plant growth and development as well as productivity and overall production. Therefore, production of alkaline-tolerant cultivars of soybean has received increased attention among the soybean researchers. In the present study, eight traits related to alkaline stress tolerance viz., seedling fresh weight (SFW), seedling dry weight (SDW), root dry weight (RDW), root fresh weight (RFW), relative chlorophyll content (CC), root number (RN), root tips number (RTN) and root length (RL) were evaluated in the GWAS panel of 326 accessions of soybean under alkaline treatment. The highly significant correlation was observed among these eight alkaline tolerance-related traits in the GWAS panel under all three environments viz., CK, AT and ACR. Overall, the comprehensive analysis of RDW, RFW, SFW, CC, SDW, RN, RTN and RL is an effective way for the evaluation of alkaline tolerance at the seedling stage.
Almost negligible efforts have been put forward to elucidate the genetic basis of alkaline tolerance in soybean. Till data only one study has attempted to identify the QTLs for alkaline tolerance in soybean [5], and this study has identified only four QTLs viz., pH sensitivity 1-1, pH sensitivity 1-2, pH sensitivity 1-3 and pH sensitivity 1-4. These QTLs have been detected through traditional mapping approach involving low-throughput markers, which has resulted their low resolution as well as prevent their use in the soybean breeding [9]. Recent breakthroughs in the genome sequencing, genotyping platforms and GWAS approach has provided the avenues for the high-resolution mapping of genetic loci and underlying genes for the particular trait of interest [34]. In soybean GWAS approach has been used to explore the genetic basis of multiple traits [1,35]; however, negligible efforts of GWAS study have been attempted to unravel the genetic architecture of alkaline tolerance in soybean. By keeping the above into consideration, the GWAS approach involving the high-throughput marker system were used to determine the genetic architecture of alkaline tolerance in soybean. We identified a total of 28 SNPs significantly linked with alkaline tolerance-related traits. In agreement to our findings, the earlier studies have documented the similar results for salinity/alkaline tolerance in soybean [5,10,33].
The identification of candidate genes followed by their proper validation of function is the extreme objective of the researchers [36,37]. Previously, efforts to detect the genes for alkaline tolerance in soybean has been negligible. In our study, an in silico analysis detected 17 candidate genes underlying five QTLs viz., of qAT1, qAT4, qAT14, qAT18 and qAT20, and these genes were defined as possible candidates modulating alkaline tolerance in soybean. Based on the available information the gene functions related to salt tolerance, abiotic stress tolerance, protein phosphorylation, heat shock proteins, basic helix-loop-helix (bHLH) transcription factors, S-ribonuclease binding protein 1, GRAS family transcription factor, pentatricopeptide repeat (PPR-like) superfamily protein, C2H2-like zinc finger protein, abiotic stress tolerance, auxin signaling, kinase activity, ethylene signaling and salicylic acid signaling directly or indirectly govern related to alkaline tolerance. Hence, among the 17 identified genes, the functions of six genes, viz., Glyma.01G113400, Glyma.14G084500, Glyma.04G252100, Glyma.20G072600, Glyma.20G072700 and Glyma.20G072900 were found to be related to salt stress (Table 2). Alkali stress is often associated with salt stress, and alkaline stress is caused by excess of alkaline salts (NaHCO3, Na2CO3) [38,39]. The Glyma.04G252300 function is related to auxin signaling, and studies in Arabidopsis showed that under saline-alkaline stress, the increase in the transcript level of AUX1 and auxin biosynthesis-related genes promoted auxin accumulation, and relieved the inhibition of root elongation under saline-alkaline stress [40,41]. The Glyma.04G253000 function is involved in ethylene signaling, and it has been demonstrated that H+-ATPase is involved in ethylene-mediated inhibition of rice growth under alkaline stress. Role of the protein phosphorylation and kinase activity in the alkaline stress response has been well documented [41,42], and the function of genes viz., Glyma.18G150300, Glyma.04G252700, Glyma.04G253100 and Glyma.20G072500 has been related to protein phosphorylation and kinase activity. The Glyma.14G083700 function as the heat shock protein (HSP), and the peroxisome-localized small heat shock protein Hsp17.6CII activates catalase by interacting with CAT2 and thus confers alkaline and salt stress tolerance in plants [43]. The Glyma.04G251900 is a GRAS family protein, and the GRAS protein has been reported to regulate salt tolerance in Melilotus albus [8] and kiwifruit [44]. The Glyma.14G083900 functions as E3 ubiquitin ligase, and the plant E3 ligases are involved in abiotic stress tolerance that negatively regulates salt/alkaline stress response [45]. The Glyma.04G252500 function as Pentatricopeptide repeat protein, and this protein has been reported in the Arabidopsis to regulate the salt/alkaline stress [25]. Thus, utilization of the above genes in the soybean breeding requires the verification of their function first either through overexpression or knockout experiments; after successful functional validation these genes can be used in the soybean breeding. Besides, we also identified haplotype alleles varying from two-four underlying the four candidate genes viz., Glyma.04G252300, Glyma.04G253100, Glyma.14G083700 and Glyma.20G072500. These haplotypes alleles govern the different phenotypes of alkaline tolerance ranging from lowest to highest through moderate levels, thus providing an opportunity to improve soybean alkaline tolerance. The use of these haplotypes in soybean breeding will generate alkaline-tolerant cultivars of soybean, and these cultivars will substantially influence the soybean productivity in the soils affected by alkaline stress.
4. Materials and Methods
4.1. Plant Materials and Experimental Design
In the present study, the plant material used for the GWAS analysis are a set of 326 diverse soybean germplasms collected from different agro-ecological regions of China (Table S3). To optimize the alkaline stress used for the evaluation of the GWAS panel, we selected two soybean cultivars viz., DS118 (alkaline-tolerant cultivar) and JY 86 (alkaline-sensitive cultivar) that are subjected to different levels of alkaline stresses [NaHCO₃: Na₂CO₃ in a 5:1 ratio (pH 9.0 ± 0.1)] viz., 50 nmol/L, 100 nmol/L, 150 nmol/L and 200 nmol/L in the seedlings that are two-week old after germination.
The soybean germplasms were cultivated in a controlled conditions using vermiculite for pot culture (8 cm × 8 cm × 8 cm). The growth conditions were set to a photoperiod of 16 light hours and 8 dark hours; the temperature of the light-phase and dark-phase is 28°C and 22°C, respectively, and a relative humidity was maintained at 80%. Uniform, full, and intact soybean seeds were selected for planting. A total of 18 pots were used for each soybean cultivar, with one seed sown per pot. After one week of germination, seedlings with similar growth vigor were selected for alkaline stress treatment (AT) using a solution of Murashige and Skoog (MS) medium supplemented with NaHCO₃: Na₂CO₃ in a 5:1 ratio (pH 9.0 ± 0.1). However, standard MS medium (pH 7.0 ± 0.1) was used as the control (CK). For each cultivar, the three pot plants under both the CK and AT were used. For each treatment, three liters of the corresponding solution were added to a fixed tray in which the pots are put, and the solution was replaced every three days. After seven days, the seedlings of both the CK and AT were used for the collection of the phenotypic parameters. Statistical design of complete randomized design (CRD) with three replications were used for the planting of germplasm.
4.2. Phenotypic Data Analysis
In the present study, we collected the phenotypic information of eight alkaline tolerance-related traits viz., seedling fresh weight (SFW), seedling dry weight (SDW), root dry weight (RDW), root fresh weight (RFW), relative chlorophyll content (CC), root number (RN), root tips number (RTN) and root length (RL) under both CK and AT. The RN, RTN and RL were measured using the Intelligence Root Analysis System (Zhejiang Top Cloud-Agri root analyzer GXY-B, China). The CC was estimated for the terminal leaflet of the first trifoliate leaf of soybean seedlings using the Konica Minolta SPAD-502Plus Portable Chlorophyll Meter (Soil and Plant Analyzer Development, SPAD, Japan). Measurements for CC were taken at the top, middle, and bottom of the leaflet, and the average of these three values was considered the CC of the leaf. For the measurement of fresh weights viz., SFW and RFW, the seedlings at the seventh day of AT were cut at the cotyledonary node to separate the shoot and root tissues. A precision electric balance (Model JA203H, Changzhou Xingyun Electronic Equipment Co., Ltd., China) was used to estimate the RFW and SFW for both CK and AT samples. These samples were then dried in an oven at 65°C for five days to obtain the RDW and SDW using the precision electric balance (Model JA203H, Changzhou Xingyun Electronic Equipment Co., Ltd., China).
The individual environmental data control (CK), alkaline stress (AT) and AT/CK (ACR) were used for the estimation of the CE data, and the “lme4” package was used for the estimation of the CE data following Di et al. [46]. The predicted means (BLUPs) were calculated by following the method of Yu et al. [1]. Descriptive statistical analysis parameters for alkaline tolerance-related traits were estimated according to Yu et al. [3]. The analysis of variance (ANOVA) were estimated following Yu et al. [1].
4.3. Genotyping, Population Structure and Linkage Disequilibrium (LD)
The association mapping panel consisting of 326 accessions were re-sequenced using the Illumina HiSeq platform (Novogene Company, Ltd., China), at an average depth of 25× with a total data volume of 8.57T. The adapter sequences, low-quality reads (where bases with a quality value Q≤20 accounted for over 50% of the read), and reads with >10% N content were removed by using the fastp software [47], and only the clean reads were retained. Alignment of the sequencing data with the reference genome Wm82.a4.v1 were performed using BWA [48]. Variants including SNPs, insertions/deletions (InDels), structural variations (SVs), and copy number variations (CNVs) were identified and marked using the Genome Analysis Toolkit (GATK) [49]. Annotation of the variants were performed by comparing each sample to the reference genome, with non-standard variants removed by using the quality control measures such as QD < 4.0, FS > 50.0, MQ < 40.0, and SOR > 3.0, resulting the 25,442,248 genetic variants. By using the further quality control measures viz., MAF<0.05 and a missing genotype at 0.01 to filtering out low-quality SNPs, we obtained a total of 3,311,166 high-quality SNPs.
To estimate genome-wide linkage disequilibrium (LD) the PopLDdecay software [50] was utilized to calculate the squared correlation coefficient (r2) between SNPs at known genomic positions. This software was also employed to estimate the expected r2 under drift equilibrium, and to depict the same results over physical distance (kb). LD decay curves were fitted to scatter plots at the genomic level using smoothing spline regression lines [51], thereby illustrating the relationship between LD and physical distance.
4.4. GWAS Analysis
The GAPIT3 package [52] was utilized to conduct the GWAS. Seven GWAS models viz., CML [53], MLM [54], CMLM [55], SUPER [56], FarmCPU [57], MLMM and BLINK [58] fitted in the GAPIT3 package—were used in the present study. The CLM, MLM and CMLM are the single-locus model, whereas the remaining four models are multilocus models. To correct the population structure, the optimal number of principal component analyses (PCAs) was estimated using PLINK [59]. The visualization of the population structure was performed in the R environment using the “ggplot2” package. Significant SNP associations were determined utilizing the default parameters in GAPIT3 following Yu et al. [1].
4.5. Candidate Genes Identification
For candidate genes identification, we downloaded all the model genes within the physical interval of five major QTLs from SoyBase (https://www.soybase.org/) using the Williams 82 (Wm82.a4.v1) gene model. The annotations of these genes were also downloaded from SoyBase (https://www.soybase.org/). Based on the gene function annotation and literature search, the candidate genes underlying the physical interval of ±71.6 kb of the stable QTLs were selected [3].
4.6. Haplotype Analysis
Haploview 4.2 software were used to calculate the level of LD among the SNPs pairs [60]. The closest SNPs within the ±71.6 kb genomic interval form the haplotype block [4]. The “confidence intervals” algorithm were used to define the haplotype blocks [61]. The haplotype allele analysis and their phenotypic effect analysis was carried out by following the method as described by Yu et al. [1].
5. Conclusions
In this study, an integrated strategy of GWAS, QTL analysis, candidate gene and haplotype analysis was utilized to elucidate the genetic architecture of alkaline tolerance in soybean. Our study identified 28 significant SNPs and five QTLs viz., qAT1, qAT4, qAT14, qAT18 and qAT20 associated with alkaline tolerance. All the five QTLs identified were novel detected for the first time. The 17 genes lying within the physical interval of the five QTLs were regarded as putative candidates based on the in silico analysis. The results of haplotype analysis revealed that haplotype alleles of four genes viz., Glyma.04G252300, Glyma.04G253100, Glyma.14G083700 and Glyma.20G072500 showed significant difference in the regulation of alkaline tolerance. Hence, these four genes are regarded as the most probable candidate genes governing alkaline tolerance. Besides, two haplotypes blocks were identified on the Chr.04 and Chr.14. The haplotype alleles of the haplotypes identified in the present study varies from two to four regulating the alkaline tolerance from lowest to highest through moderate levels. Overall, the outcome of the present study such as significant SNPs, stable QTLs, candidate genes and haplotypes will be an efficient genetic resource for the enhancement of alkaline tolerance in soybean. The identified SNPs and QTLs will be further validated in the multiple genetic backgrounds for their direct utilization in the soybean breeding. Besides, the gene validation tests should be performed for the functional confirmation of the candidate genes before their direct deployment in the soybean improvement. In conclusion, the current study performed the detailed investigation of diverse soybean germplasms, and novel genetic/genomic resources for the improvement of soybean alkaline tolerance were identified.
Supplementary Materials
The following supporting information can be downloaded at the website of this paper posted on Preprints.org.
Author Contributions
X.F., S.Y. designed the project and provided resources, X.Y., M.W. and H.Z. completed the experiments, Y.Z. and J.A.B. wrote manuscripts, M.B and B.Z. analyzed the data, X.F., S.Y. revised the manuscript. All authors have read and agreed to the published version of the manuscript.
Funding
This work was funded by National Key Research and Development Project from the Ministry of Science and Technology of China (Grant number: 2022YFD1500503), and Hainan Yazhou Bay Seed Lab (Grant number: B23YQ1502).
Data Availability Statement
Resequencing data generated in this study has been deposited in the VCF format at the Genome Variation Map (GVM) database in BIG Data Center (http://bigd.big.ac.cn/gvm) under the accession number GVM000764.
Conflicts of Interest
The authors declare no competing interests.
References
- Yu, H.; Bhat, J.A.; Li, C.; Zhao, B.; Bu, M.; Zhang, Z.; Guo, T.; Feng, X. Identification of superior and rare haplotypes to optimize branch number in soybean. Theor Appl Genet 2024, 137, 93. [Google Scholar] [CrossRef] [PubMed]
- Thapa, S.; Bhandari, A.; Ghimire, R.; Xue, Q.; Kidwaro, F.; Ghatrehsamani, S.; Maharjan, B.; Goodwin, M. Managing Micronutrients for Improving Soil Fertility, Health, and Soybean Yield. Sustainability 2021, 13. [Google Scholar] [CrossRef]
- Yu, H.; Bhat, J.A.; Li, C.; Zhao, B.; Guo, T.; Feng, X. Genome-wide survey identified superior and rare haplotypes for plant height in the north-eastern soybean germplasm of China. Mol Breeding 2023, 43, 22. [Google Scholar] [CrossRef] [PubMed]
- Bhat, J.A.; Adeboye, K.A.; Ganie, S.A.; Barmukh, R.; Hu, D.; Varshney, R.K.; Yu, D. Genome-wide association study, haplotype analysis, and genomic prediction reveal the genetic basis of yield-related traits in soybean (Glycine max L.). Frontiers in genetics 2022, 13, 953833. [Google Scholar] [CrossRef] [PubMed]
- Tuyen, D.; Lal, S.; Xu, D. Identification of a major QTL allele from wild soybean (Glycine soja Sieb. & Zucc.) for increasing alkaline salt tolerance in soybean. Theor Appl Genet 2010, 121, 229–236. [Google Scholar]
- Qiao, Y.; Wang, Y.; Li, X.; Nisa, Z.U.; Jin, X.; Jing, L.; Yu, L.; Chen, C. Transcriptional profiling of alkaline stress-induced defense responses in soybean (Glycine max).
- Cai, X.; Jia, B.; Sun, M.; Sun, X. Insights into the regulation of wild soybean tolerance to salt-alkaline stress. Front Plant Sci 2022, 13, 1002302. [Google Scholar] [CrossRef]
- Wang, G.; Shen, W.; Zhang, Z.; Guo, S.; Hu, J.; Feng, R.; Zhao, Q.; Du, J.; Du, Y. The Effect of Neutral Salt and Alkaline Stress with the Same Na+ Concentration on Root Growth of Soybean (Glycine max (L.) Merr.) Seedlings. Agronomy 2022, 12, 2708. [Google Scholar] [CrossRef]
- Bhat, J.A.; Yu, D. High-throughput NGS-based genotyping and phenotyping: Role in genomics-assisted breeding for soybean improvement. Legume Science 2021, 3, e81. [Google Scholar] [CrossRef]
- Cao, Y.; Zhang, X.; Jia, S.; Karikari, B.; Zhang, M.; Xia, Z.; Zhao, T.; Liang, F. Genome-wide association among soybean accessions for the genetic basis of salinity-alkalinity tolerance during germination. Crop and Pasture Science 2021, 72, 255–267. [Google Scholar] [CrossRef]
- Zargar, S.M.; Raatz, B.; Sonah, H.; MuslimaNazir; Bhat, J.A.; Dar, Z.A.; Agrawal, G.K.; Rakwal, R. Recent advances in molecular marker techniques: insight into QTL mapping, GWAS and genomic selection in plants. Journal of crop science and biotechnology 2015, 18, 293–308.
- Bhat, J.A.; Yu, D.; Bohra, A.; Ganie, S.A.; Varshney, R.K. Features and applications of haplotypes in crop breeding. Communications biology 2021, 4, 1266. [Google Scholar] [CrossRef] [PubMed]
- Hu, D.; Zhao, Y.; Zhu, L.; Li, X.; Zhang, J.; Cui, X.; Li, W.; Hao, D.; Yang, Z.; Wu, F. Genetic dissection of ten photosynthesis-related traits based on InDel-and SNP-GWAS in soybean. Theor Appl Genet 2024, 137, 96. [Google Scholar] [CrossRef] [PubMed]
- Zhang, C.; Shao, Z.; Kong, Y.; Du, H.; Li, W.; Yang, Z.; Li, X.; Ke, H.; Sun, Z.; Shao, J. High-quality genome of a modern soybean cultivar and resequencing of 547 accessions provide insights into the role of structural variation. Nat Genet 2024, 1–12. [Google Scholar] [CrossRef]
- Wang, N.; Gao, Z.; Zhang, W.; Qian, Y.; Bai, D.; Zhao, X.; Bao, Y.; Zheng, Z.; Wang, X.; Li, J. Genome-Wide association analysis reveals the gene loci of yield traits under drought stress at the rice reproductive stage. Agronomy 2023, 13, 2096. [Google Scholar] [CrossRef]
- Shan, D.; Ali, M.; Shahid, M.; Arif, A.; Waheed, M.Q.; Xia, X.; Trethowan, R.; Tester, M.; Poland, J.; Ogbonnaya, F.C. Genetic networks underlying salinity tolerance in wheat uncovered with genome-wide analyses and selective sweeps. Theor Appl Genet 2022, 135, 2925–2941. [Google Scholar] [CrossRef]
- Li, C.; Jia, Y.; Zhou, R.; Liu, L.; Cao, M.; Zhou, Y.; Wang, Z.; Di, H. GWAS and RNA-seq analysis uncover candidate genes associated with alkaline stress tolerance in maize (Zea mays L.) seedlings. Front Plant Sci 2022, 13, 963874. [Google Scholar] [CrossRef]
- Istanbuli, T.; Nassar, A.E.; Abd El-Maksoud, M.M.; Tawkaz, S.; Alsamman, A.M.; Hamwieh, A. Genome-wide association study reveals SNP markers controlling drought tolerance and related agronomic traits in chickpea across multiple environments. Front Plant Sci 2024, 15, 1260690. [Google Scholar] [CrossRef]
- Breria, C.M.; Hsieh, C.-H.; Yen, T.-B.; Yen, J.-Y.; Noble, T.J.; Schafleitner, R. A SNP-based genome-wide association study to mine genetic loci associated to salinity tolerance in mungbean (Vigna radiata L.). Genes-Basel 2020, 11, 759. [Google Scholar] [CrossRef]
- Maalouf, F.; Abou-Khater, L.; Babiker, Z.; Jighly, A.; Alsamman, A.M.; Hu, J.; Ma, Y.; Rispail, N.; Balech, R.; Hamweih, A. Genetic dissection of heat stress tolerance in faba bean (Vicia faba L.) using GWAS. Plants 2022, 11, 1108. [Google Scholar] [CrossRef]
- Tafesse, E.G.; Gali, K.K.; Lachagari, V.R.; Bueckert, R.; Warkentin, T.D. Genome-wide association mapping for heat stress responsive traits in field pea. International journal of molecular sciences 2020, 21, 2043. [Google Scholar] [CrossRef]
- Lu, Y.; Xu, J.; Yuan, Z.; Hao, Z.; Xie, C.; Li, X.; Shah, T.; Lan, H.; Zhang, S.; Rong, T. Comparative LD mapping using single SNPs and haplotypes identifies QTL for plant height and biomass as secondary traits of drought tolerance in maize. Mol Breeding 2012, 30, 407–418. [Google Scholar] [CrossRef]
- N’Diaye, A.; Haile, J.K.; Cory, A.T.; Clarke, F.R.; Clarke, J.M.; Knox, R.E.; Pozniak, C.J. Single marker and haplotype-based association analysis of semolina and pasta colour in elite durum wheat breeding lines using a high-density consensus map. Plos One 2017, 12, e0170941. [Google Scholar]
- Luján Basile, S.M.; Ramírez, I.A.; Crescente, J.M.; Conde, M.B.; Demichelis, M.; Abbate, P.; Rogers, W.J.; Pontaroli, A.C.; Helguera, M.; Vanzetti, L.S. Haplotype block analysis of an Argentinean hexaploid wheat collection and GWAS for yield components and adaptation. Bmc Plant Biol 2019, 19, 1–16. [Google Scholar] [CrossRef] [PubMed]
- Patil, G.; Do, T.; Vuong, T.D.; Valliyodan, B.; Lee, J.-D.; Chaudhary, J.; Shannon, J.G.; Nguyen, H.T. Genomic-assisted haplotype analysis and the development of high-throughput SNP markers for salinity tolerance in soybean. Sci Rep-Uk 2016, 6, 19199. [Google Scholar] [CrossRef] [PubMed]
- Yu, S.; Wu, J.; Wang, M.; Shi, W.; Xia, G.; Jia, J.; Kang, Z.; Han, D. Haplotype variations in QTL for salt tolerance in Chinese wheat accessions identified by marker-based and pedigree-based kinship analyses. The Crop Journal 2020, 8, 1011–1024. [Google Scholar] [CrossRef]
- Koua, A.P.; Siddiqui, M.N.; Heß, K.; Klag, N.; Kambona, C.M.; Duarte-Delgado, D.; Oyiga, B.C.; Léon, J.; Ballvora, A. Genome-wide dissection and haplotype analysis identified candidate loci for nitrogen use efficiency under drought conditions in winter wheat. The Plant Genome 2024, 17, e20394. [Google Scholar] [CrossRef]
- Do, T.D.; Vuong, T.D.; Dunn, D.; Clubb, M.; Valliyodan, B.; Patil, G.; Chen, P.; Xu, D.; Nguyen, H.T.; Shannon, J.G. Identification of new loci for salt tolerance in soybean by high-resolution genome-wide association mapping. BMC genomics 2019, 20, 1–16. [Google Scholar] [CrossRef]
- Zeng, A.; Chen, P.; Korth, K.; Hancock, F.; Pereira, A.; Brye, K.; Wu, C.; Shi, A. Genome-wide association study (GWAS) of salt tolerance in worldwide soybean germplasm lines. Mol Breeding 2017, 37, 1–14. [Google Scholar] [CrossRef]
- Liu, Z.; Li, H.; Gou, Z.; Zhang, Y.; Wang, X.; Ren, H.; Wen, Z.; Kang, B.-K.; Li, Y.; Yu, L. Genome-wide association study of soybean seed germination under drought stress. Molecular Genetics and Genomics 2020, 295, 661–673. [Google Scholar] [CrossRef]
- Yu, Z.; Chang, F.; Lv, W.; Sharmin, R.A.; Wang, Z.; Kong, J.; Bhat, J.A.; Zhao, T. Identification of QTN and candidate gene for seed-flooding tolerance in soybean [Glycine max (L.) Merr.] using genome-wide association study (GWAS). Genes-Basel 2019, 10, 957. [Google Scholar]
- Chen, Y.; Liu, Z.; Han, D.; Yang, Q.; Li, C.; Shi, X.; Zhang, M.; Yang, C.; Qiu, L.; Jia, H. Cold tolerance SNPs and candidate gene mining in the soybean germination stage based on genome-wide association analysis. Theor Appl Genet 2024, 137, 178. [Google Scholar] [CrossRef] [PubMed]
- Zong, C.; Zhao, J.; Wang, Y.; Wang, L.; Chen, Z.; Qi, Y.; Bai, Y.; Li, W.; Wang, W.; Ren, H. Identification of Gene–Allele System Conferring Alkali-Tolerance at Seedling Stage in Northeast China Soybean Germplasm. International Journal of Molecular Sciences 2024, 25, 2963. [Google Scholar] [CrossRef] [PubMed]
- Alqudah, A.M.; Sallam, A.; Baenziger, P.S.; Börner, A. GWAS: fast-forwarding gene identification and characterization in temperate cereals: lessons from barley–a review. Journal of advanced research 2020, 22, 119–135. [Google Scholar] [CrossRef] [PubMed]
- Bhat, J.A.; Karikari, B.; Adeboye, K.A.; Ganie, S.A.; Barmukh, R.; Hu, D.; Varshney, R.K.; Yu, D. Identification of superior haplotypes in a diverse natural population for breeding desirable plant height in soybean. Theor Appl Genet 2022, 135, 2407–2422. [Google Scholar] [CrossRef]
- Ganie, S.A.; Ahammed, G.J. Dynamics of cell wall structure and related genomic resources for drought tolerance in rice. Plant cell reports 2021, 40, 437–459. [Google Scholar] [CrossRef]
- Ganie, S.A.; Wani, S.H.; Henry, R.; Hensel, G. Improving rice salt tolerance by precision breeding in a new era. Current Opinion in Plant Biology 2021, 60, 101996. [Google Scholar] [CrossRef]
- Sagervanshi, A.; Geilfus, C.-M.; Kaiser, H.; Mühling, K.H. Alkali salt stress causes fast leaf apoplastic alkalinization together with shifts in ion and metabolite composition and transcription of key genes during the early adaptive response of Vicia faba L. Plant Science 2022, 319, 111253. [Google Scholar] [CrossRef]
- Li, J.; Yang, Y. How do plants maintain pH and ion homeostasis under saline-alkali stress? Front Plant Sci 2023, 14, 1217193. [Google Scholar] [CrossRef]
- Li, J.; Xu, H.-H.; Liu, W.-C.; Zhang, X.-W.; Lu, Y.-T. Ethylene inhibits root elongation during alkaline stress through AUXIN1 and associated changes in auxin accumulation. Plant Physiology 2015, 168, 1777–1791. [Google Scholar] [CrossRef]
- Cao, Y.; Song, H.; Zhang, L. New insight into plant saline-alkali tolerance mechanisms and application to breeding. International Journal of Molecular Sciences 2022, 23, 16048. [Google Scholar] [CrossRef]
- Fang, S.; Hou, X.; Liang, X. Response mechanisms of plants under saline-alkali stress. Front Plant Sci 2021, 12, 667458. [Google Scholar] [CrossRef] [PubMed]
- Li, G.; Li, J.; Hao, R.; Guo, Y. Activation of catalase activity by a peroxisome-localized small heat shock protein Hsp17. 6CII. Journal of Genetics and Genomics 2017, 44, 395–404. [Google Scholar] [CrossRef] [PubMed]
- Zhu, L.; Yin, T.; Zhang, M.; Yang, X.; Wu, J.; Cai, H.; Yang, N.; Li, X.; Wen, K.; Chen, D. Genome-wide identification and expression pattern analysis of the kiwifruit GRAS transcription factor family in response to salt stress. BMC genomics 2024, 25, 12. [Google Scholar] [CrossRef] [PubMed]
- Al-Saharin, R.; Hellmann, H.; Mooney, S. Plant E3 ligases and their role in abiotic stress response. Cells 2022, 11, 890. [Google Scholar] [CrossRef]
- Di, Q.; Dong, L.; Jiang, L.; Liu, X.; Cheng, P.; Liu, B.; Yu, G. Genome-wide association study and RNA-seq identifies GmWRI1-like transcription factor related to the seed weight in soybean. Front Plant Sci 2023, 14, 1268511. [Google Scholar] [CrossRef]
- Chen, S.; Zhou, Y.; Chen, Y.; Gu, J. fastp: an ultra-fast all-in-one FASTQ preprocessor. Bioinformatics 2018, 34, i884–i890. [Google Scholar] [CrossRef]
- Li, H. Aligning sequence reads, clone sequences and assembly contigs with BWA-MEM. arXiv preprint 2013, arXiv:1303.3997. [Google Scholar]
- McKenna, A.; Hanna, M.; Banks, E.; Sivachenko, A.; Cibulskis, K.; Kernytsky, A.; Garimella, K.; Altshuler, D.; Gabriel, S.; Daly, M.; et al. The Genome Analysis Toolkit: a MapReduce framework for analyzing next-generation DNA sequencing data. Genome Res 2010, 20, 1297–1303. [Google Scholar] [CrossRef]
- Zhang, C.; Dong, S.-S.; Xu, J.-Y.; He, W.-M.; Yang, T.-L. PopLDdecay: a fast and effective tool for linkage disequilibrium decay analysis based on variant call format files. Bioinformatics 2019, 35, 1786–1788. [Google Scholar] [CrossRef]
- Remington, D.L.; Thornsberry, J.M.; Matsuoka, Y.; Wilson, L.M.; Whitt, S.R.; Doebley, J.; Kresovich, S.; Goodman, M.M.; Buckler IV, E.S. Structure of linkage disequilibrium and phenotypic associations in the maize genome. Proceedings of the national academy of sciences 2001, 98, 11479–11484. [Google Scholar] [CrossRef]
- Wang, J.; Zhang, Z. GAPIT version 3: boosting power and accuracy for genomic association and prediction. Genomics, Proteomics and Bioinformatics 2021, 19, 629–640. [Google Scholar] [CrossRef] [PubMed]
- Price, A.L.; Patterson, N.J.; Plenge, R.M.; Weinblatt, M.E.; Shadick, N.A.; Reich, D. Principal components analysis corrects for stratification in genome-wide association studies. Nat Genet 2006, 38, 904–909. [Google Scholar] [CrossRef] [PubMed]
- Yu, J.; Pressoir, G.; Briggs, W.H.; Vroh Bi, I.; Yamasaki, M.; Doebley, J.F.; McMullen, M.D.; Gaut, B.S.; Nielsen, D.M.; Holland, J.B. A unified mixed-model method for association mapping that accounts for multiple levels of relatedness. Nat Genet 2006, 38, 203–208. [Google Scholar] [CrossRef] [PubMed]
- Zhang, Z.; Ersoz, E.; Lai, C.-Q.; Todhunter, R.J.; Tiwari, H.K.; Gore, M.A.; Bradbury, P.J.; Yu, J.; Arnett, D.K.; Ordovas, J.M. Mixed linear model approach adapted for genome-wide association studies. Nat Genet 2010, 42, 355–360. [Google Scholar] [CrossRef]
- Wang, Q.; Tian, F.; Pan, Y.; Buckler, E.S.; Zhang, Z. A SUPER powerful method for genome wide association study. Plos One 2014, 9, e107684. [Google Scholar] [CrossRef]
- Liu, X.; Huang, M.; Fan, B.; Buckler, E.S.; Zhang, Z. Iterative usage of fixed and random effect models for powerful and efficient genome-wide association studies. PLoS genetics 2016, 12, e1005767. [Google Scholar] [CrossRef]
- Huang, M.; Liu, X.; Zhou, Y.; Summers, R.M.; Zhang, Z. BLINK: a package for the next level of genome-wide association studies with both individuals and markers in the millions. Gigascience 2019, 8, giy154. [Google Scholar] [CrossRef]
- Purcell, S.; Neale, B.; Todd-Brown, K.; Thomas, L.; Ferreira, M.A.; Bender, D.; Maller, J.; Sklar, P.; De Bakker, P.I.; Daly, M.J. PLINK: a tool set for whole-genome association and population-based linkage analyses. The American journal of human genetics 2007, 81, 559–575. [Google Scholar] [CrossRef]
- Barrett, J.C.; Fry, B.; Maller, J.; Daly, M.J. Haploview: analysis and visualization of LD and haplotype maps. Bioinformatics 2005, 21, 263–265. [Google Scholar] [CrossRef]
- Gabriel, S.B.; Schaffner, S.F.; Nguyen, H.; Moore, J.M.; Roy, J.; Blumenstiel, B.; Higgins, J.; DeFelice, M.; Lochner, A.; Faggart, M. The structure of haplotype blocks in the human genome. science 2002, 296, 2225–2229. [Google Scholar] [CrossRef]
Figure 1.
Alkaline treatment concentration optimization of the two-week old seedlings of the soybean cultivars. The effects of varying alkaline treatment concentrations viz., 50, 100, 150, and 200 mmol/L on the shoot and root growth of two soybean cultivars viz., DS118 (alkaline-tolerant) and JY86 (alkaline-sensitive). DS118-S: shoot growth phenotype of DS118; DS118-R: root growth phenotype of DS118; JY86-S: shoot growth phenotype of JY86; JY86-R: shoot growth phenotype of JY86. Scale bars:5 cm.
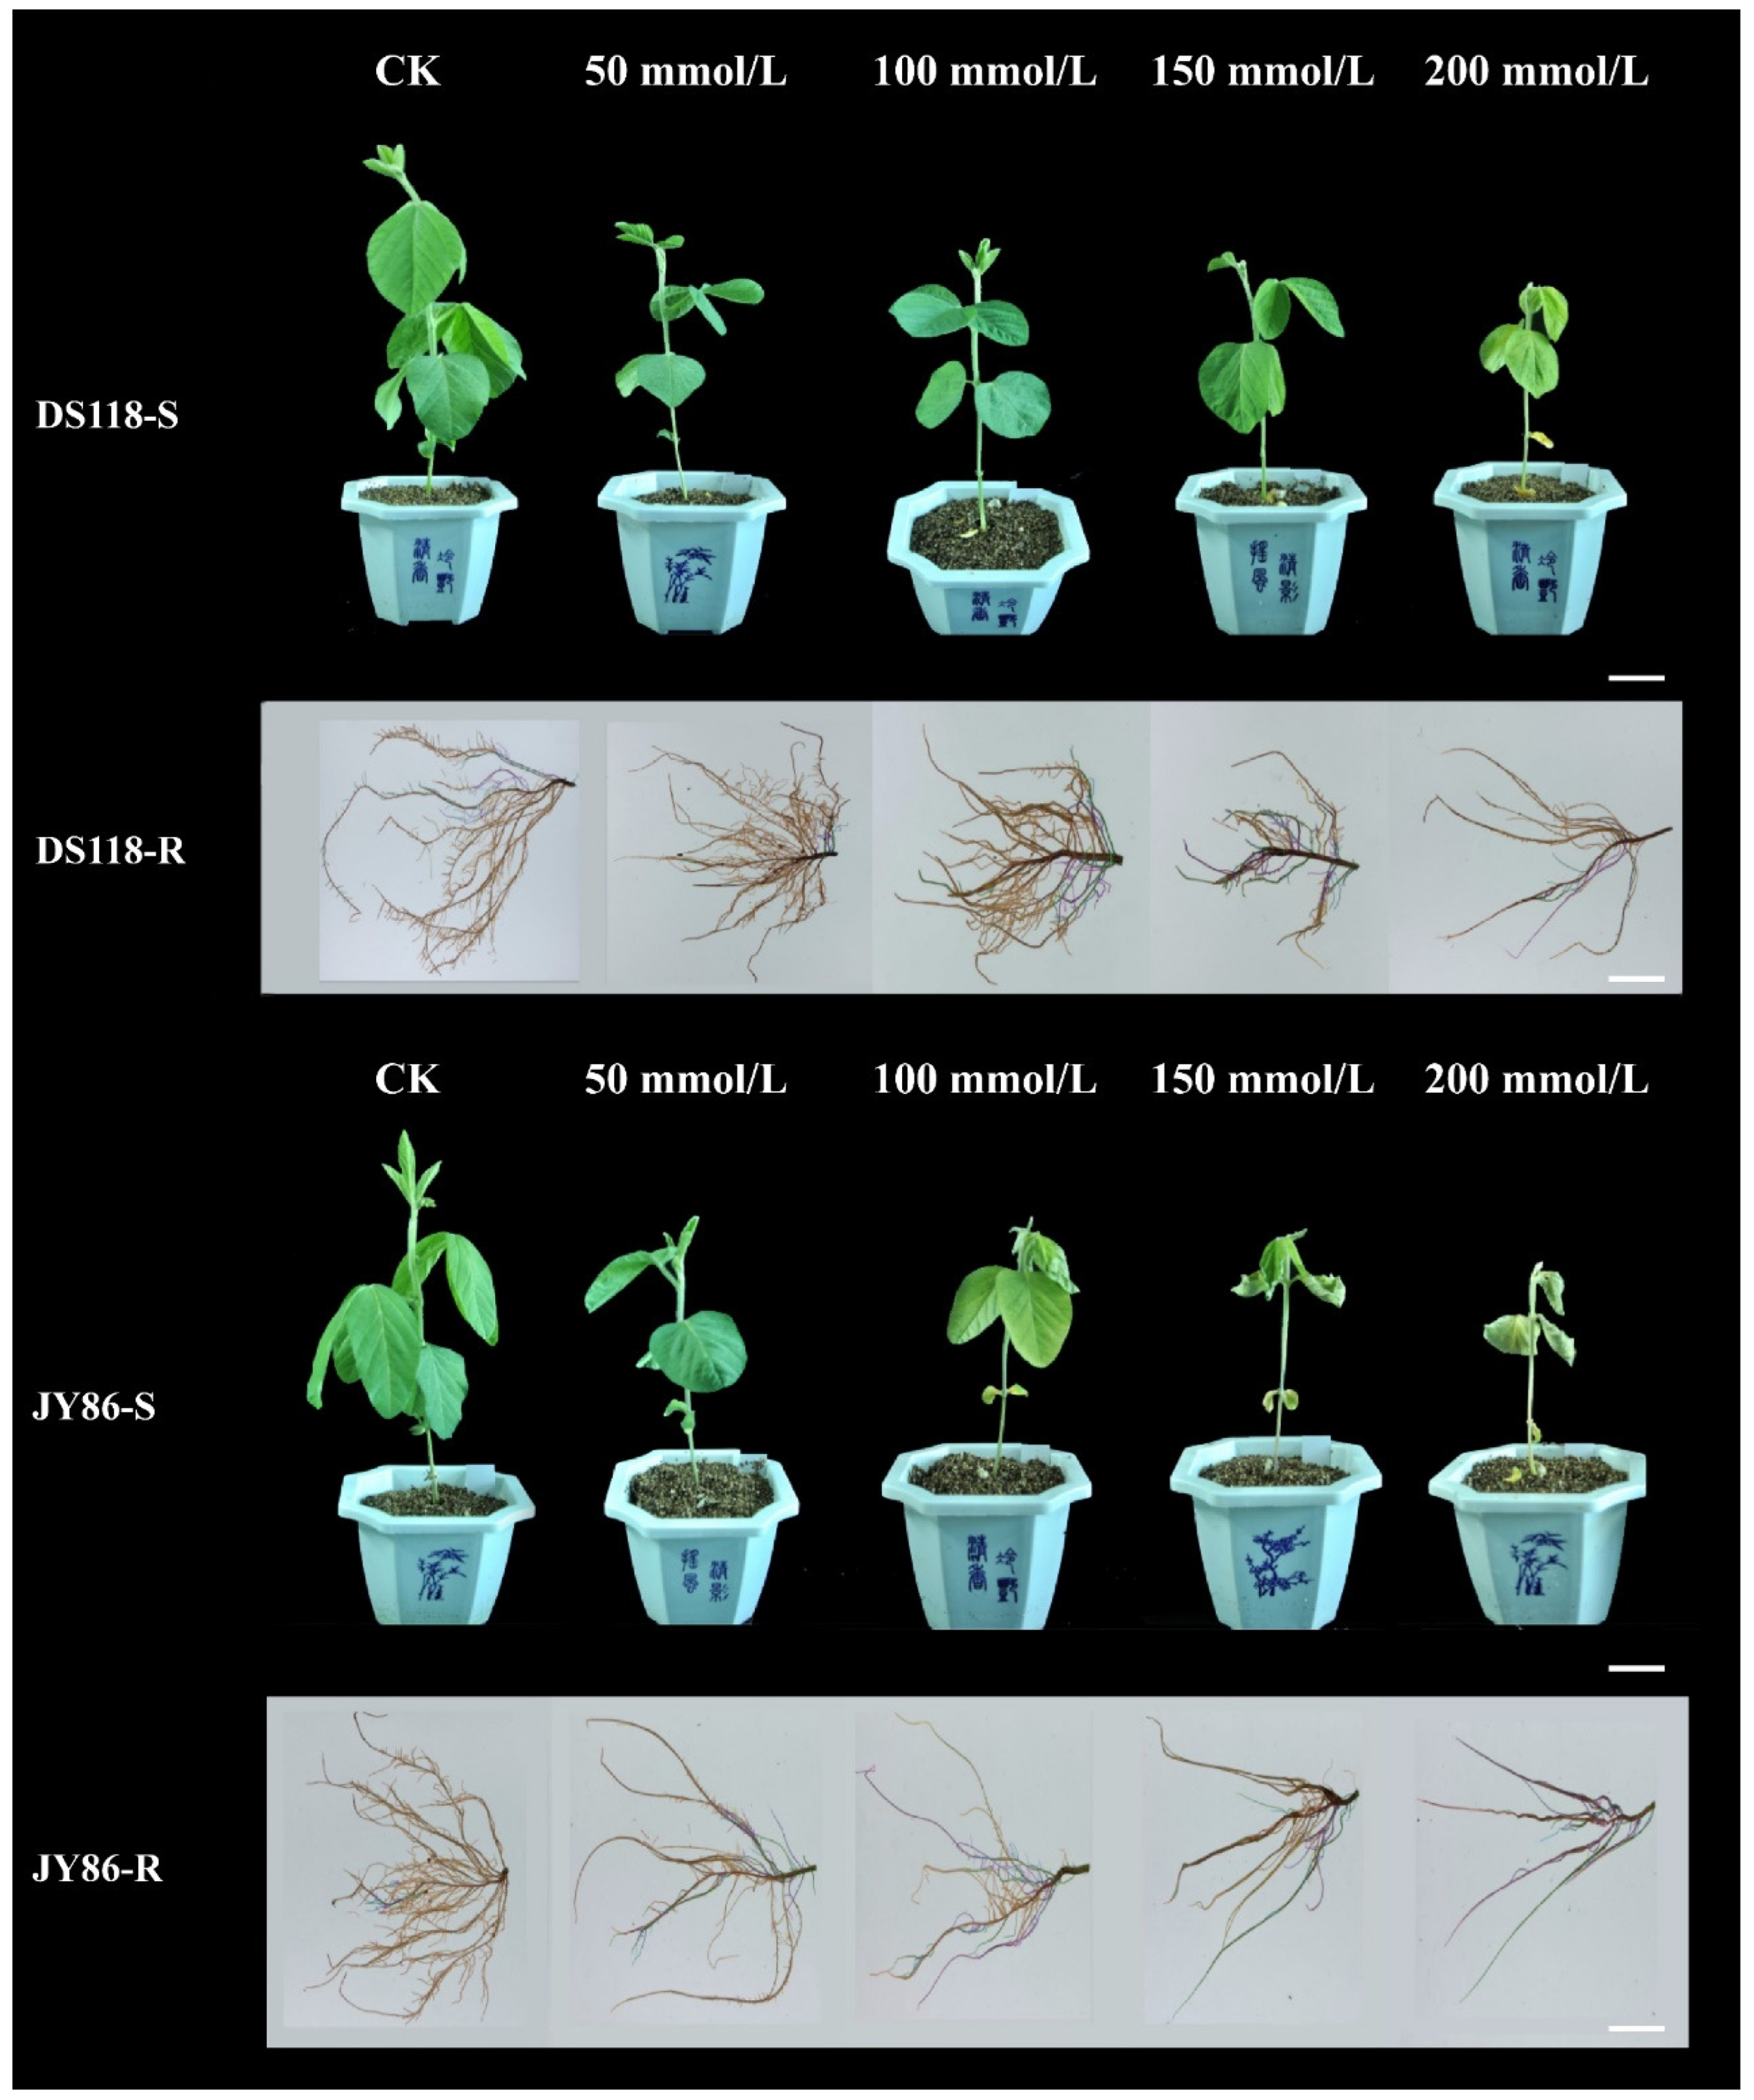
Figure 2.
Diagram showing the SNPs distribution across all the 20 chromosomes in soybean. (A) The 3,311,166 SNPs present on the soybean genome. Horizontal axis refers to length of chromosomes (Mb), vertical refers to chromosome number, and different colors describe the SNP density (number of SNPs per window); (B) The 3,311,166 SNP markers distribution across the soybean genome that are used for GWAS.
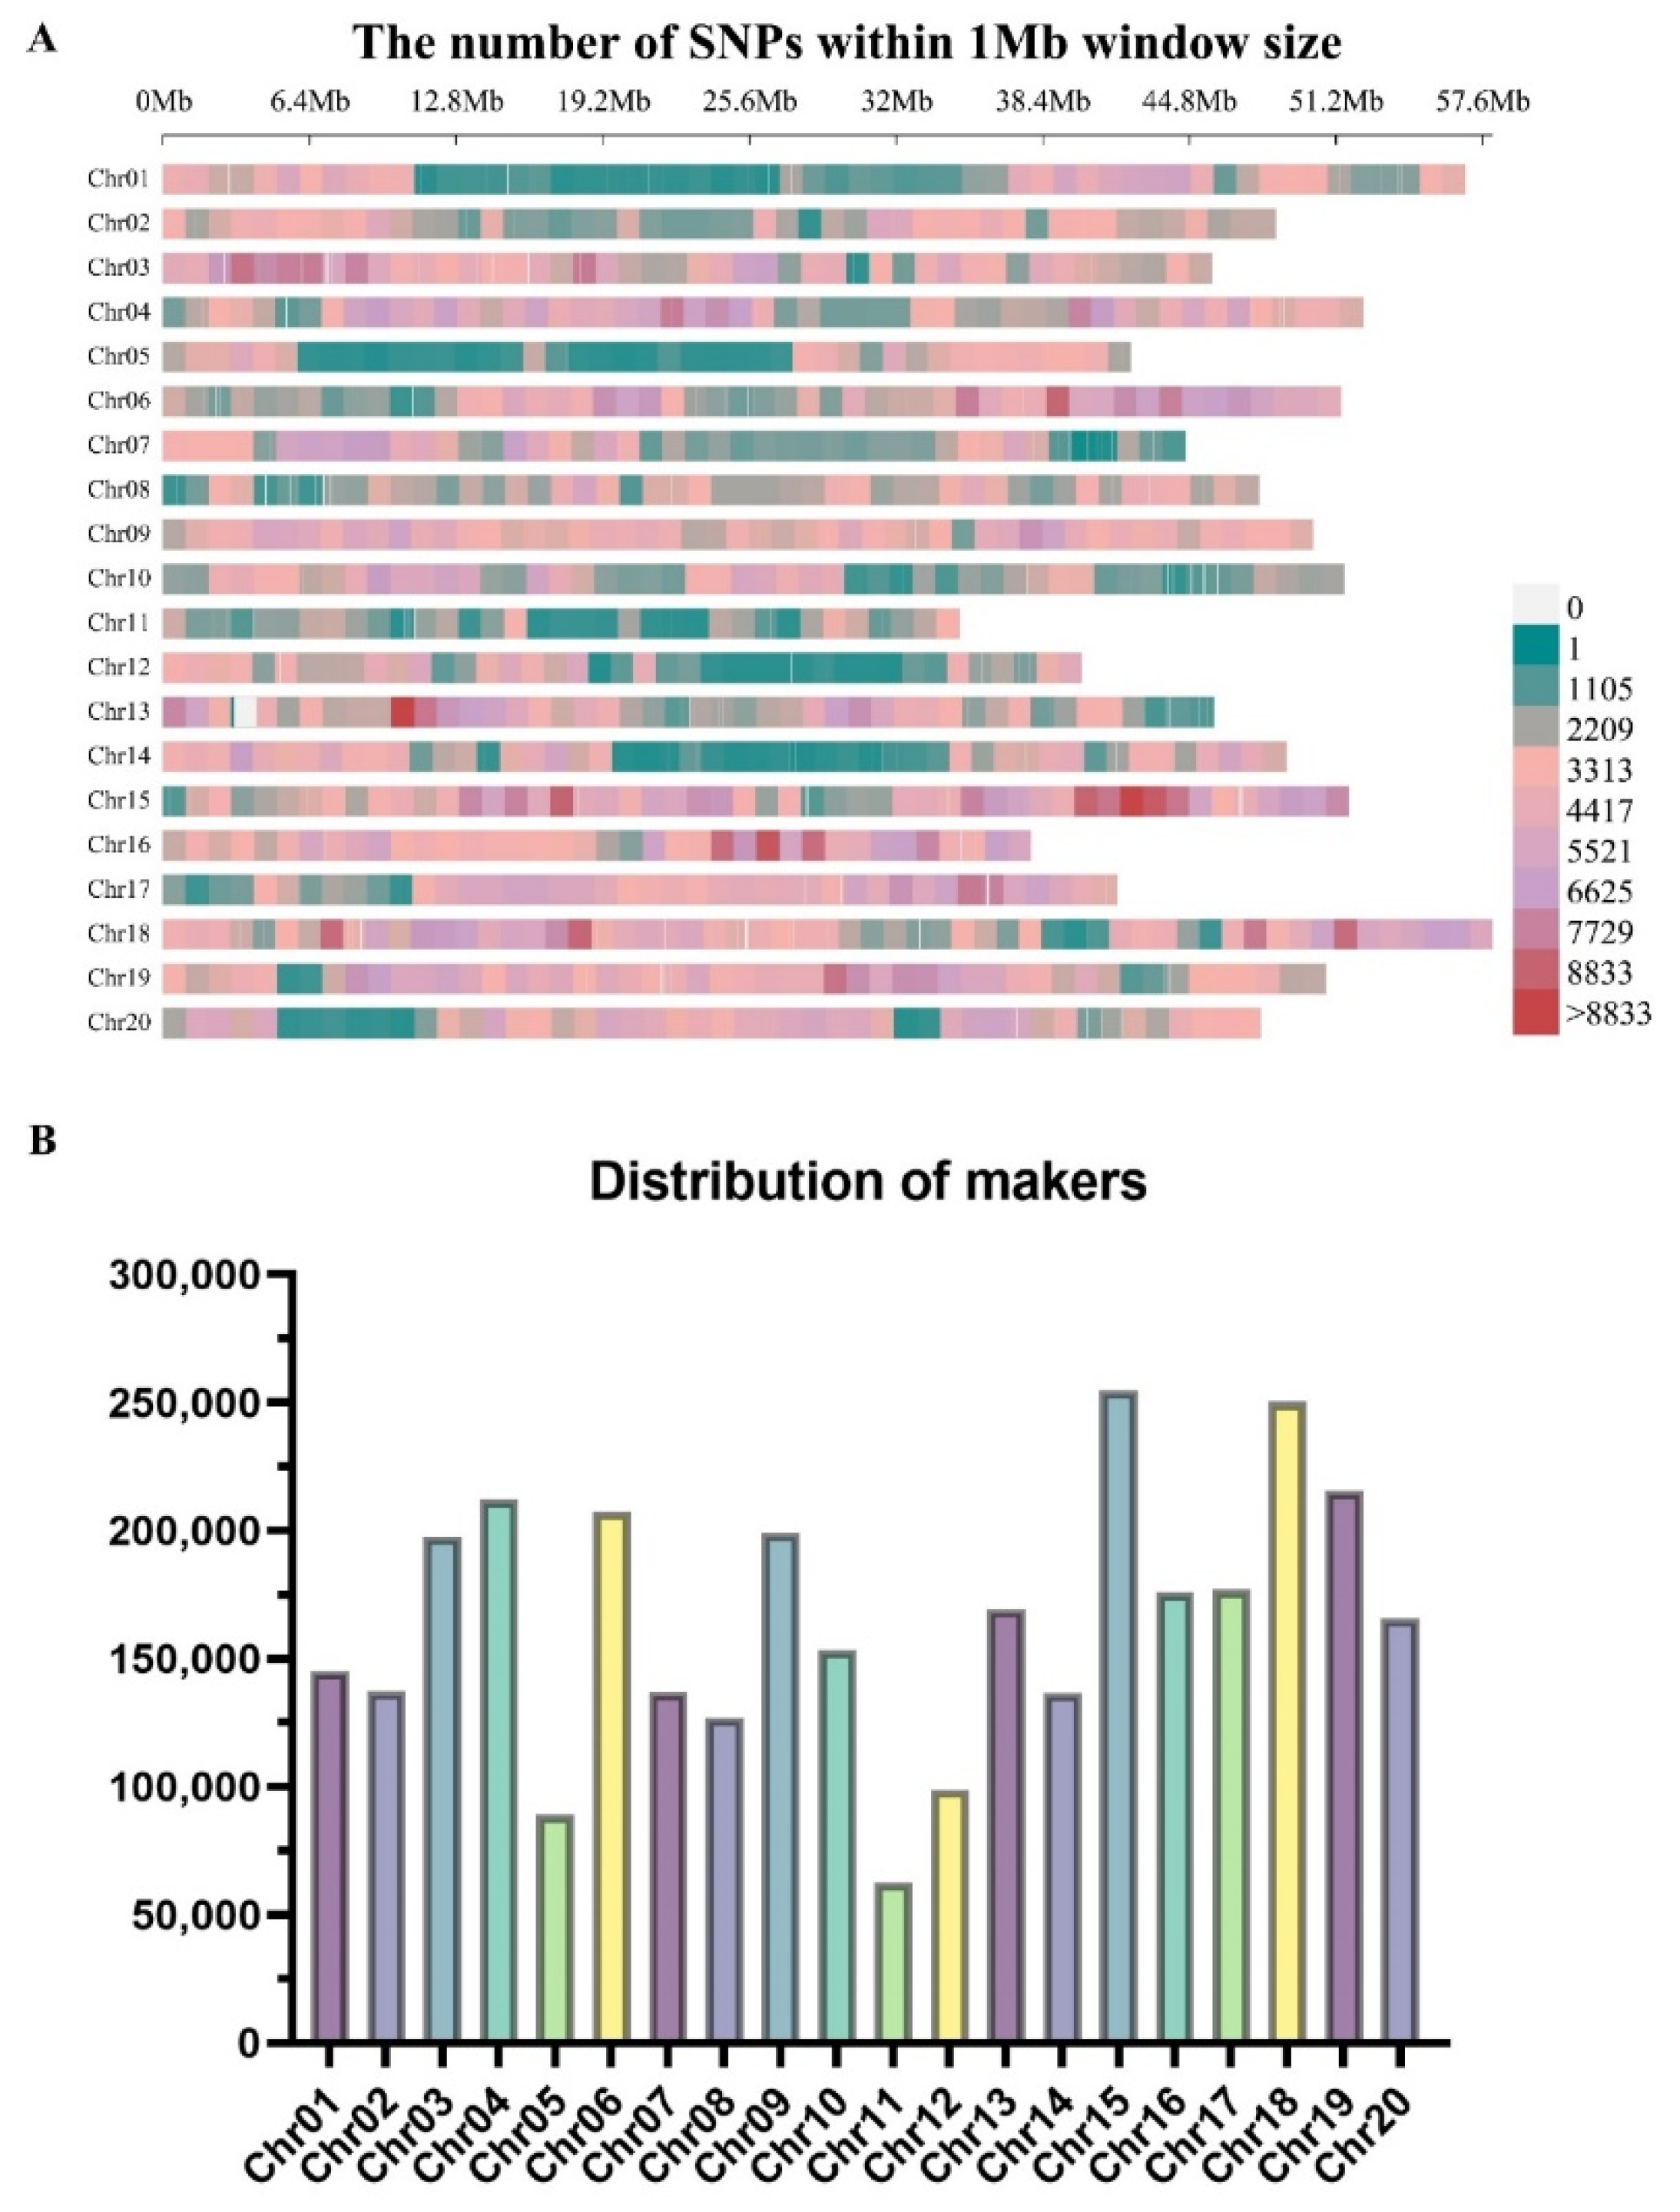
Figure 3.
The population structure and linkage disequilibrium (LD) analysis of 326 soybean accessions. (A) Population structure analysis of soybean accessions. (B) Relationship of soybean accessions depicted by a kinship plot; (C) LD decay plot of soybean cultivars using 3,311,166 SNP markers. The LD decay fitted with a smoothing spline regression model is represented by the curve line. The green vertical line intersection with the horizontal green line represents the half-decay of LD (r.2= 0.34), and the genetic distance at this point corresponds to LD decay distance (71.6 kb).
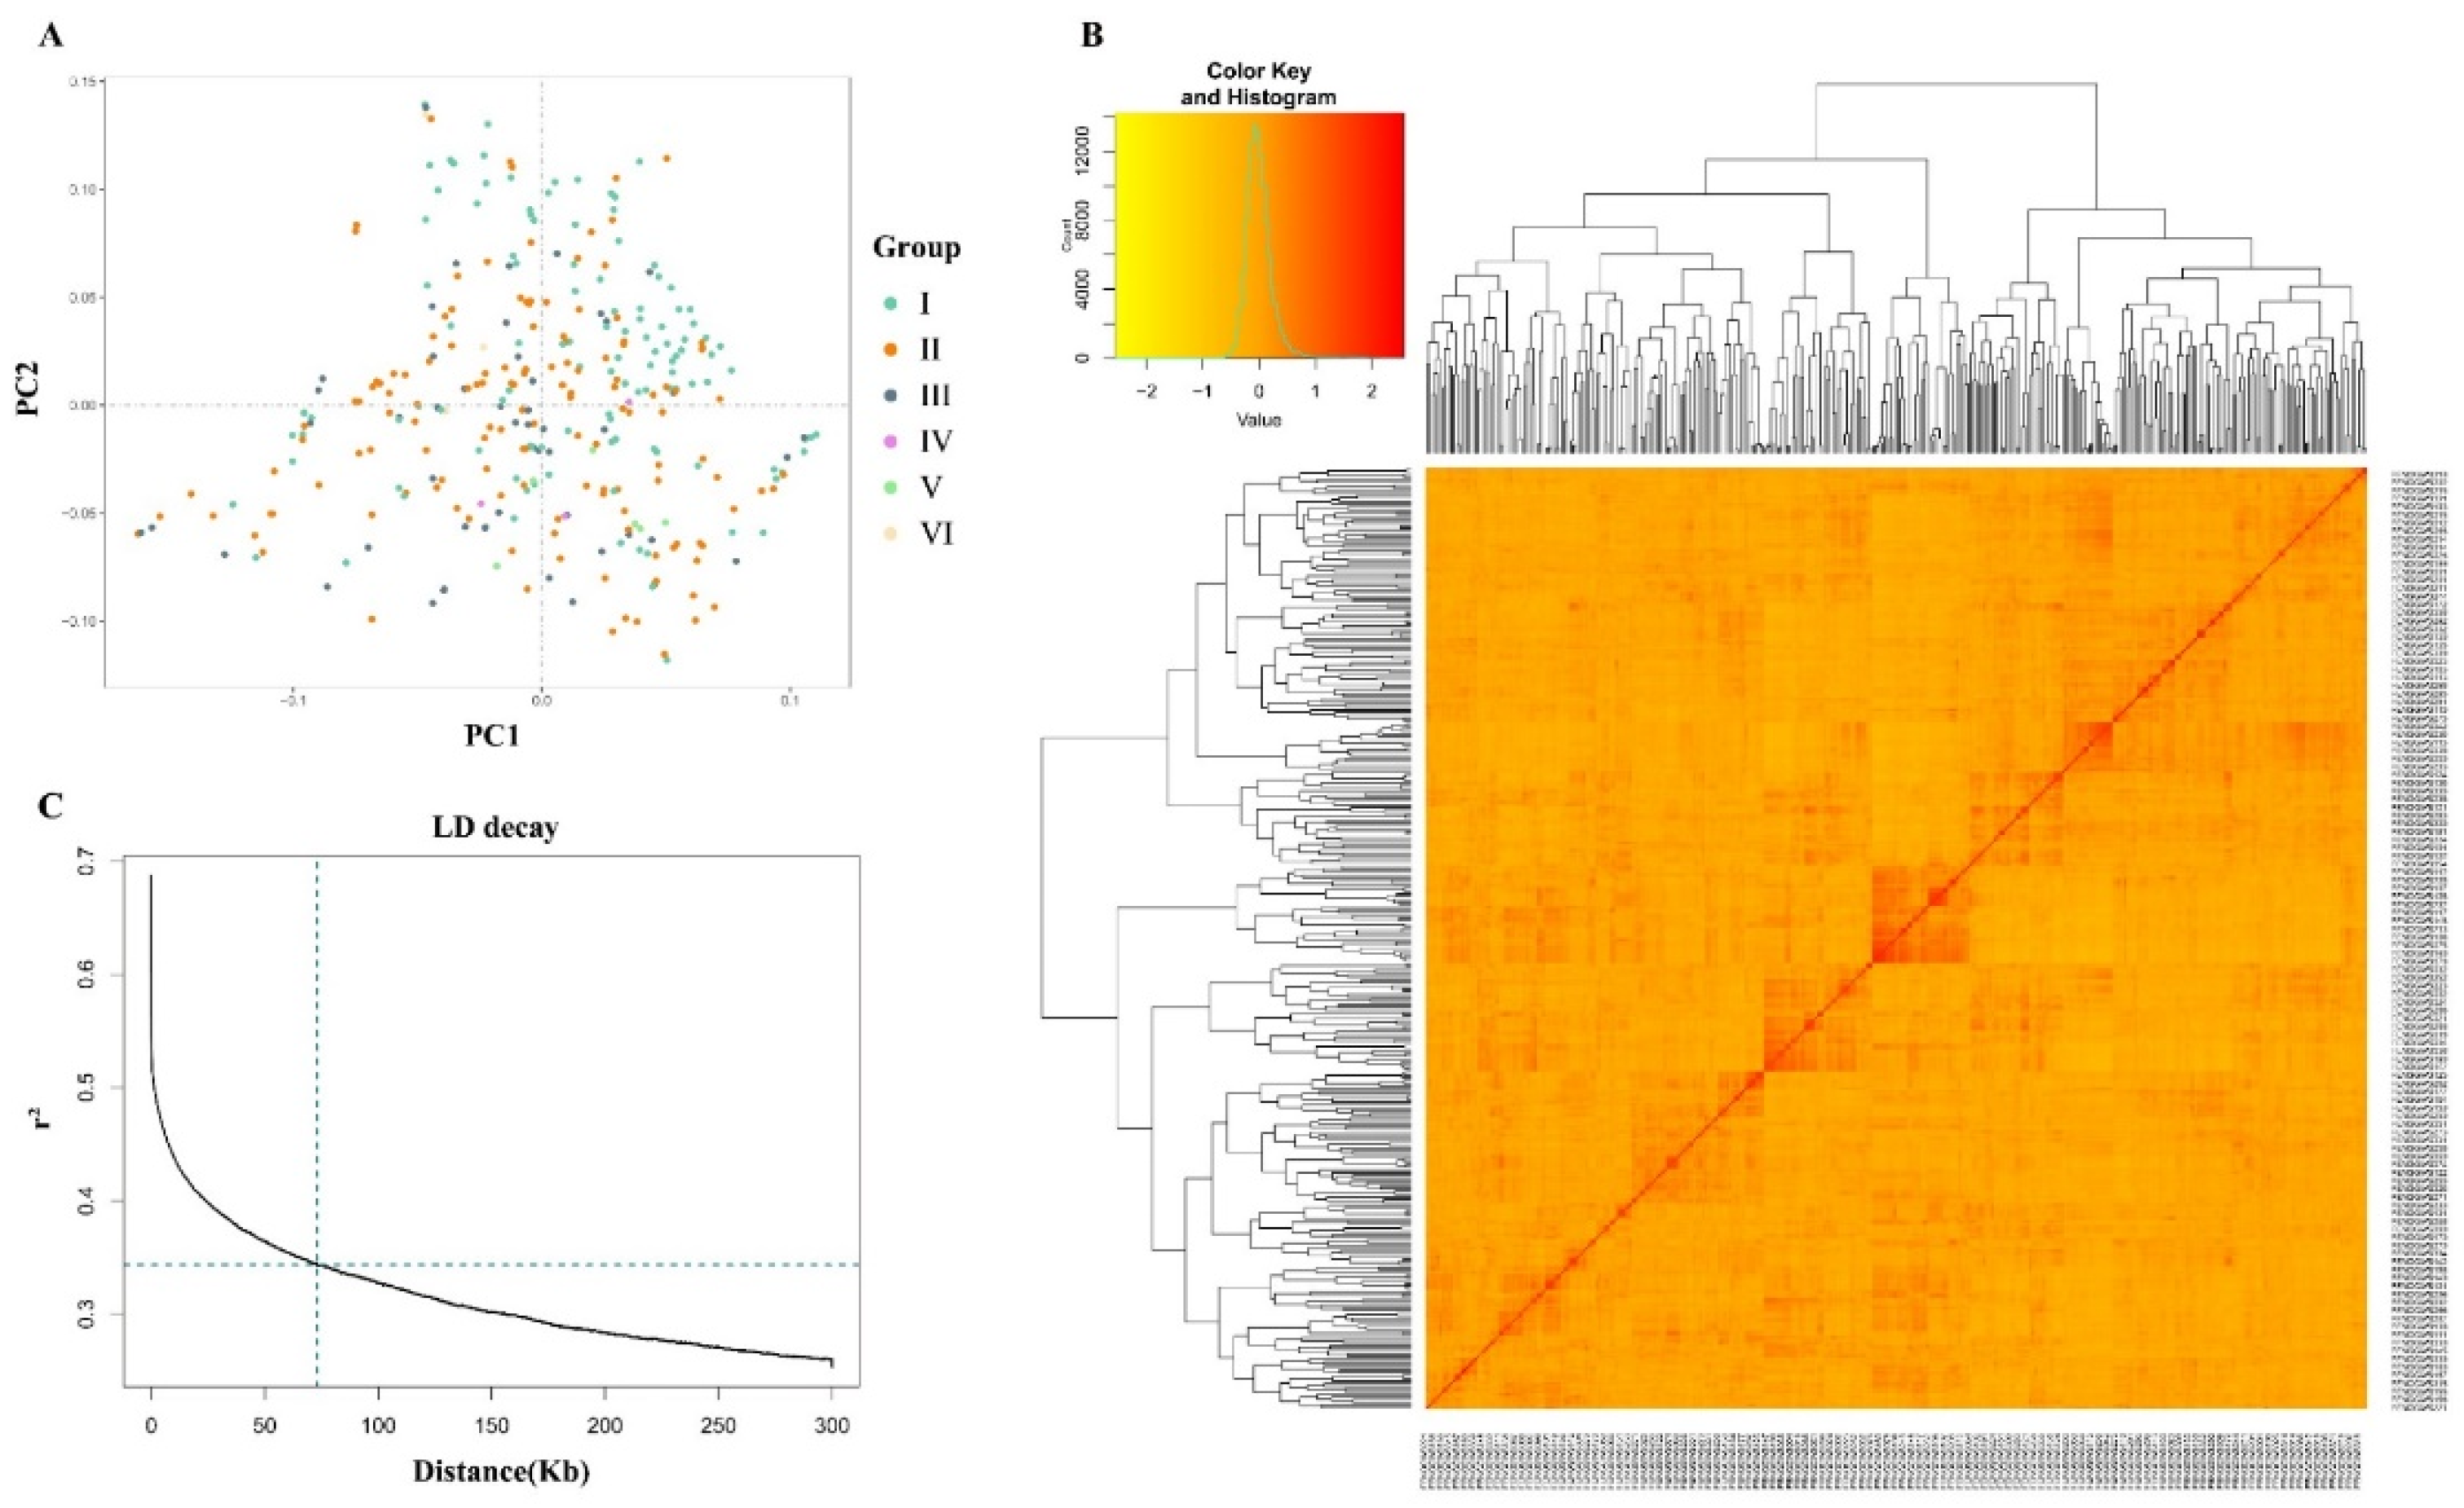
Figure 4.
GWAS analysis of alkaline stress-related traits in the diverse panel of 326 soybean accessions under alkaline treatment (AT) environment. (A) Manhattan and QQ plot for root tips number (RTN) in the AT environment. (B) Manhattan and QQ plot for SDW in the AT environment. (C) Manhattan and QQ plot for CC in the AT environment. The horizontal dotted black line represents the threshold level of significance (-log10P> 6.67), and the soybean chromosomes are represented on the X-axis.
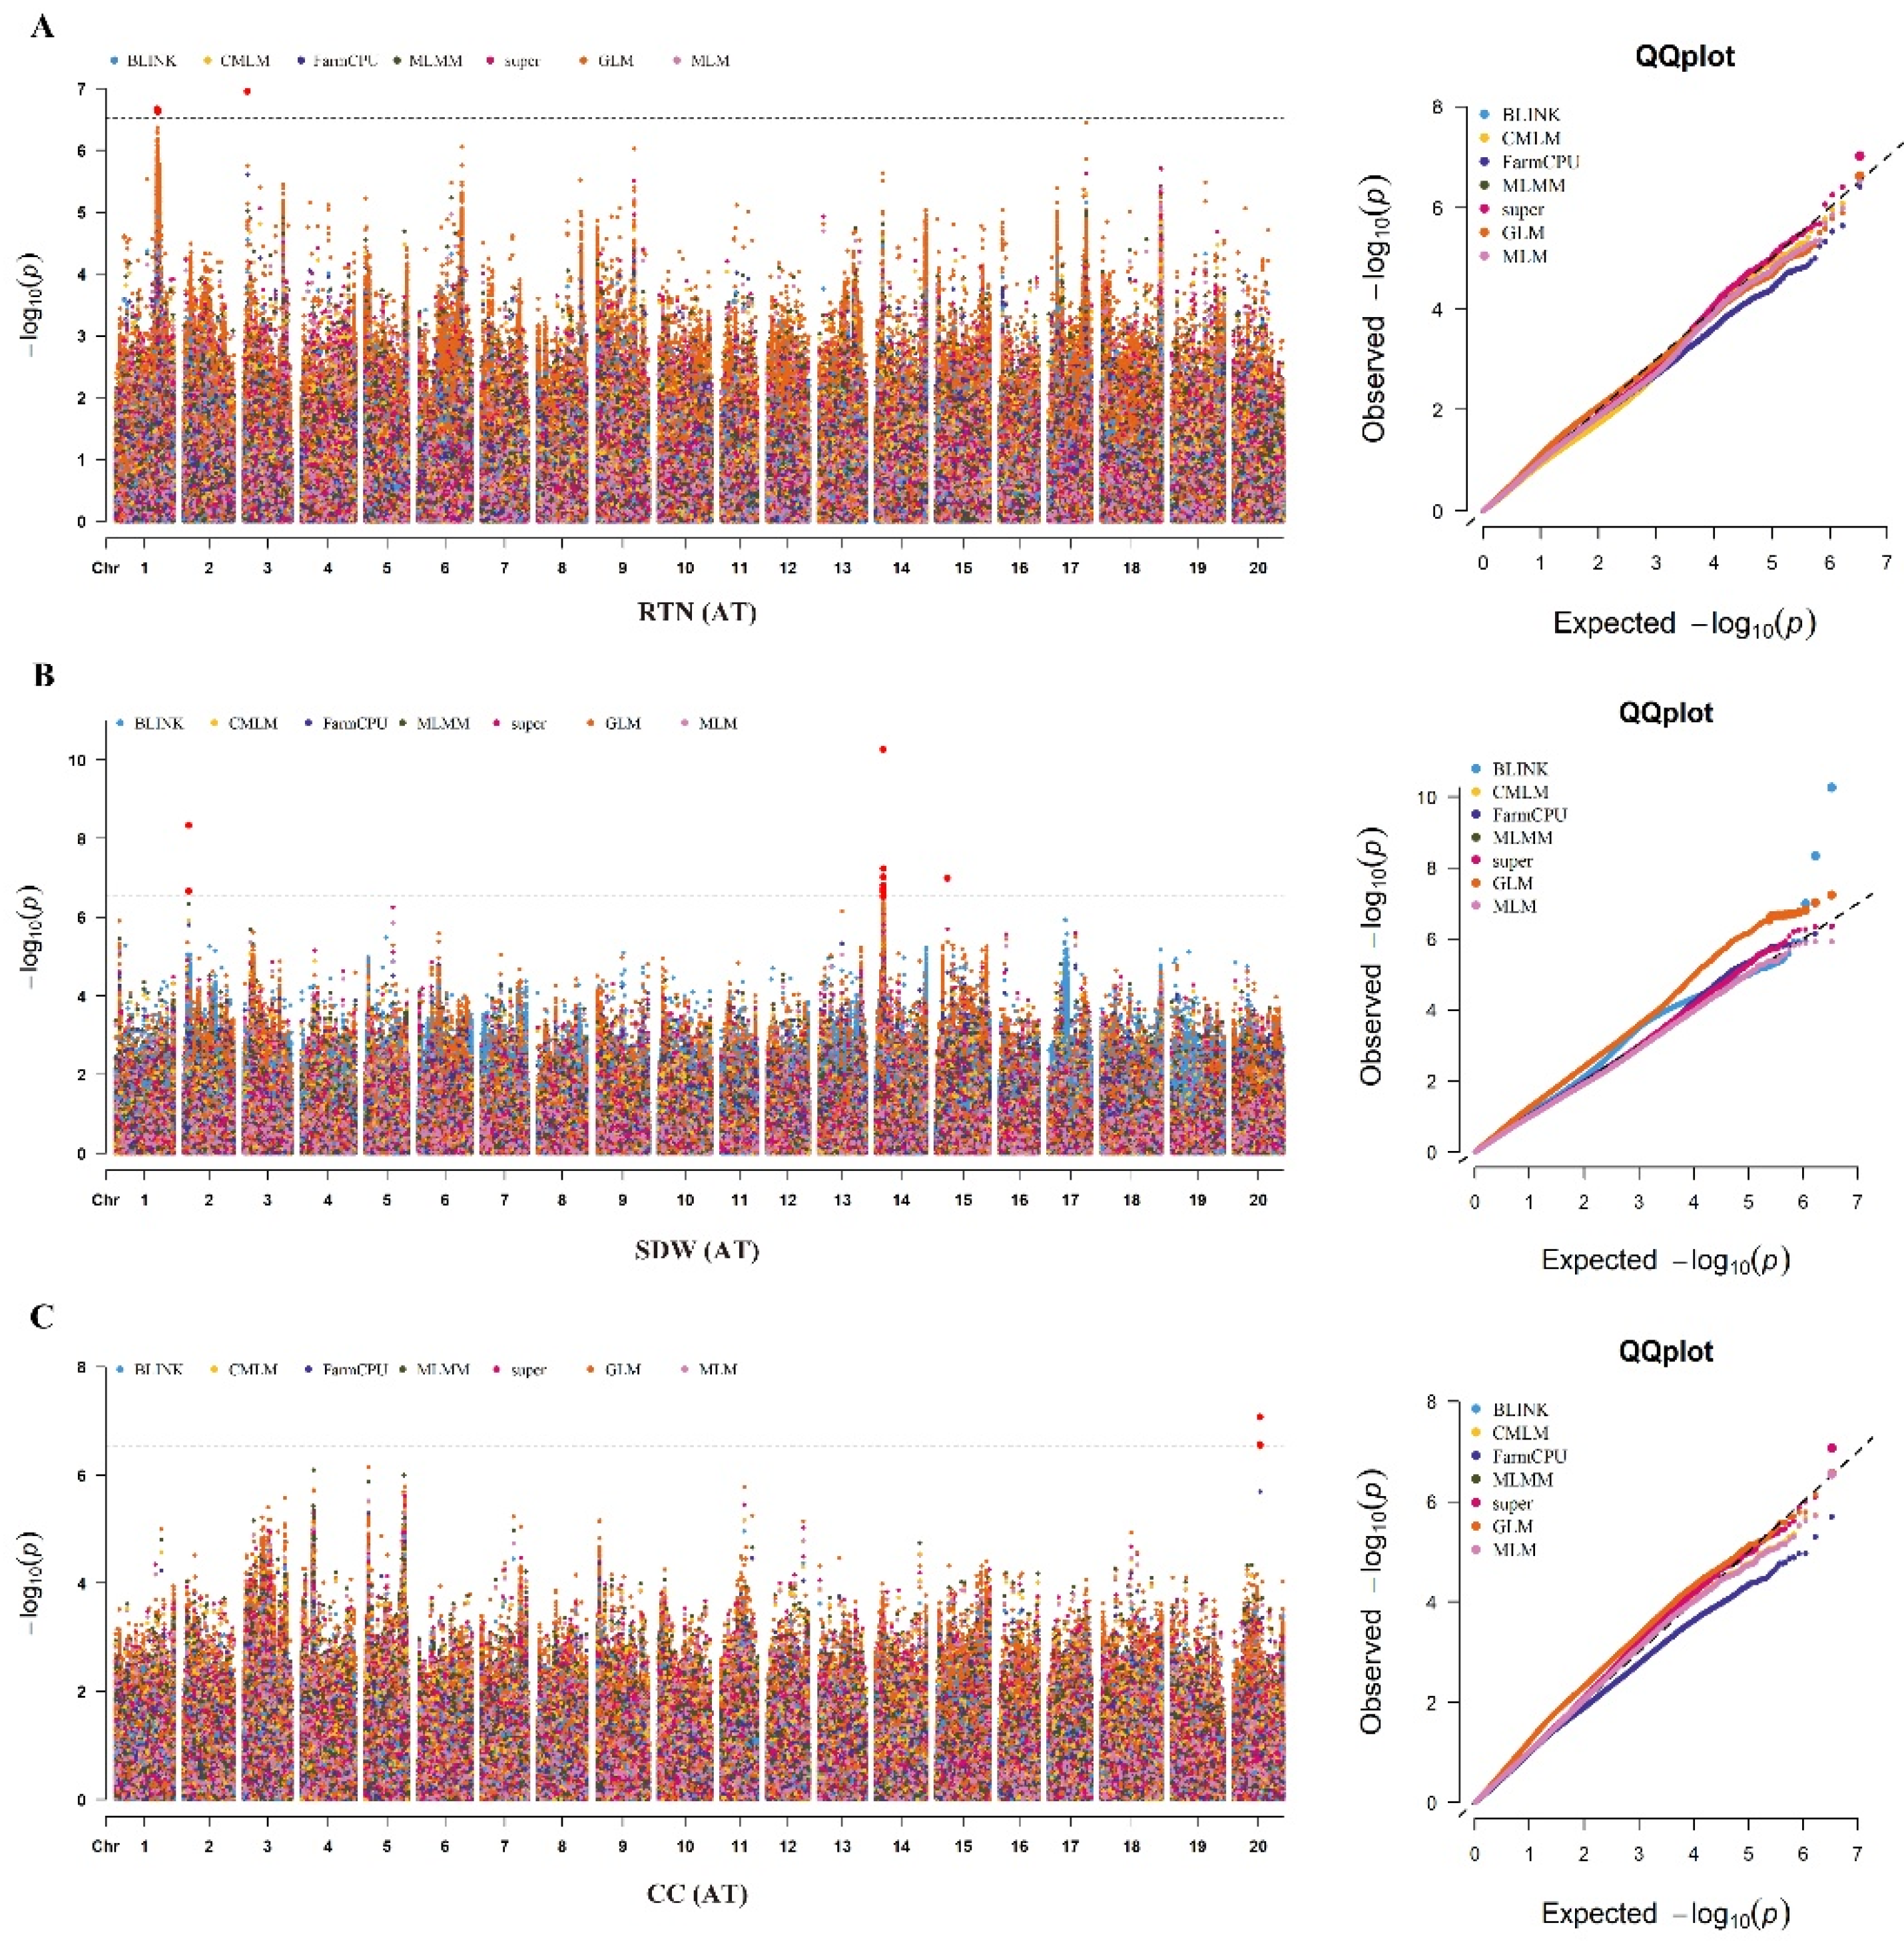
Figure 5.
GWAS analysis of alkaline stress-related traits in the diverse panel of 326 soybean accessions under ACR environment. (A) Manhattan and QQ plot for RDW in the ACR environment. (B) Manhattan and QQ plot for RFW in the ACR environment. (C) Manhattan and QQ plot for RTN in the ACR environment. (D) Manhattan and QQ plot for SFW in the ACR environment. (E) Manhattan and QQ plot for CC in the ACR environment. The horizontal dotted black line represents the threshold level of significance (-log10P> 6.67), and the soybean chromosomes are represented on the X-axis.
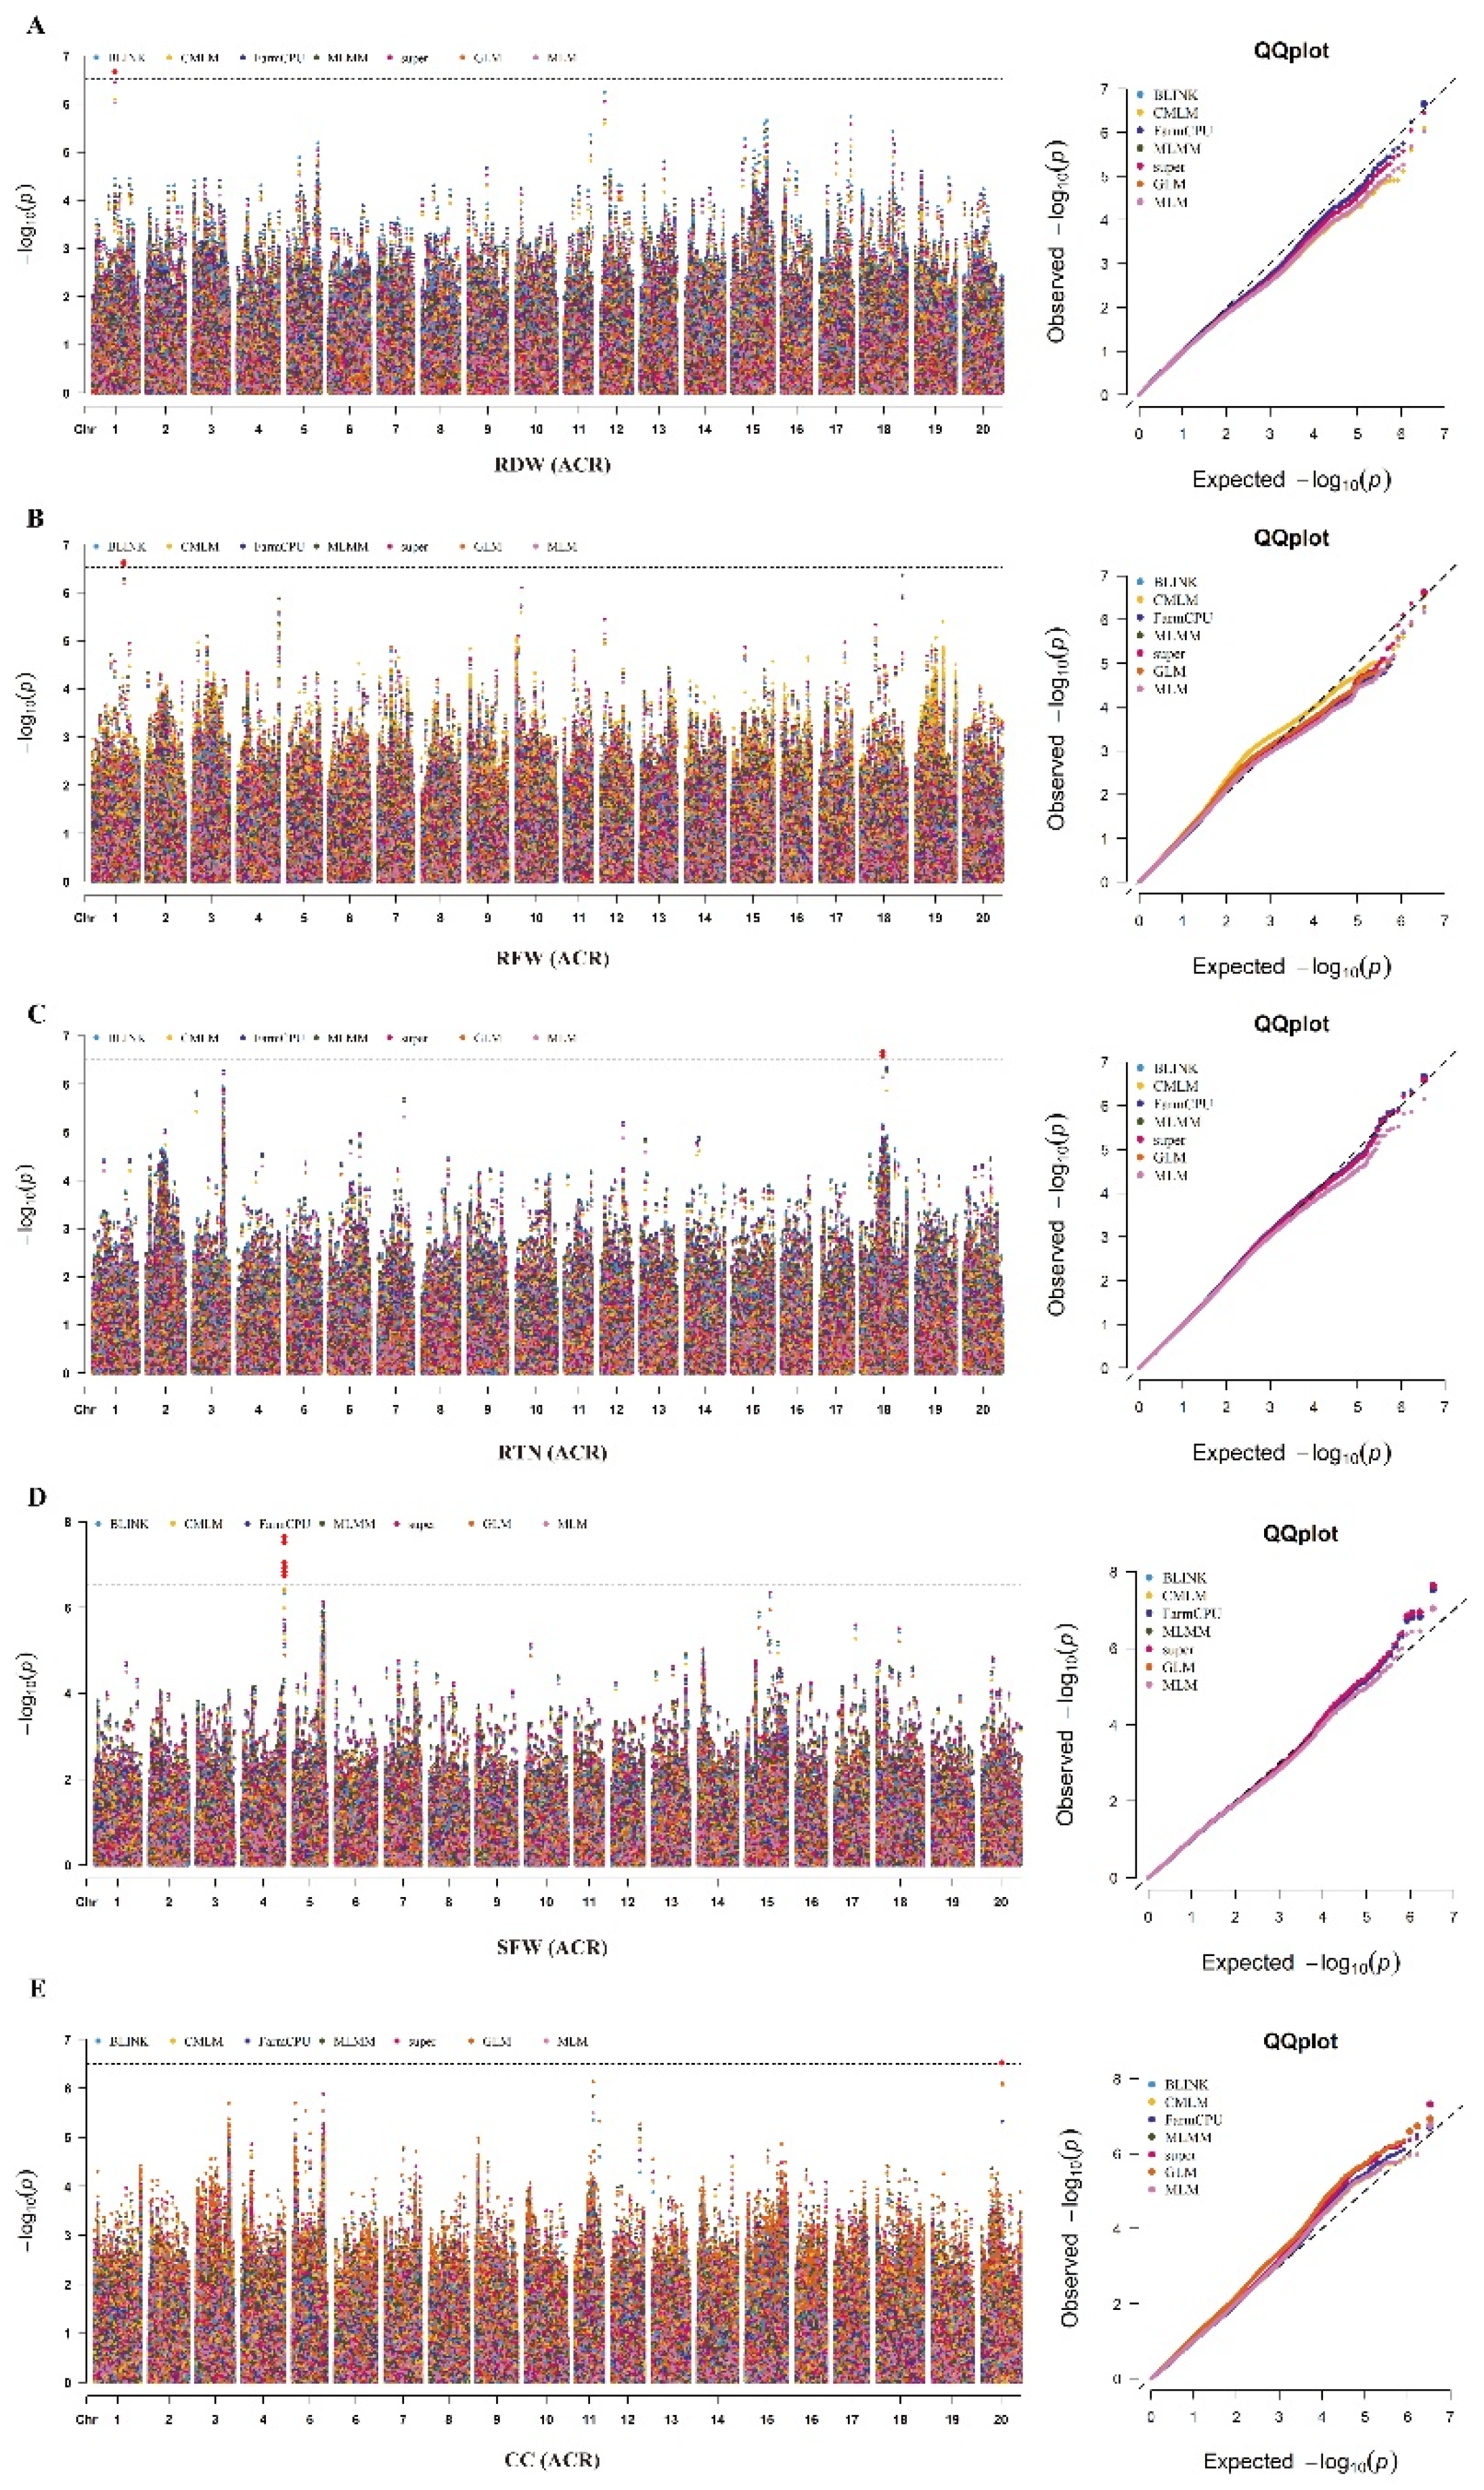
Figure 6.
Haplotype allele analysis underlying two haplotype blocks viz., Hap4 (identified on Chr.04) and Hap14 (identified on Chr.14). (A) Phenotypic effects of different haplotype alleles of Hap4 block on shoot fresh weight (SFW); (B) Phenotypic effects of different haplotype alleles within the Hap14 block on shoot dry weight (SDW). Grouping of genotypes and pairwise comparisons of genotypes was performed by using Tukey’s HSD test at P < 0.05. Common letters above the boxes represent the non-significant differences, whereas different letters represent significant differences.
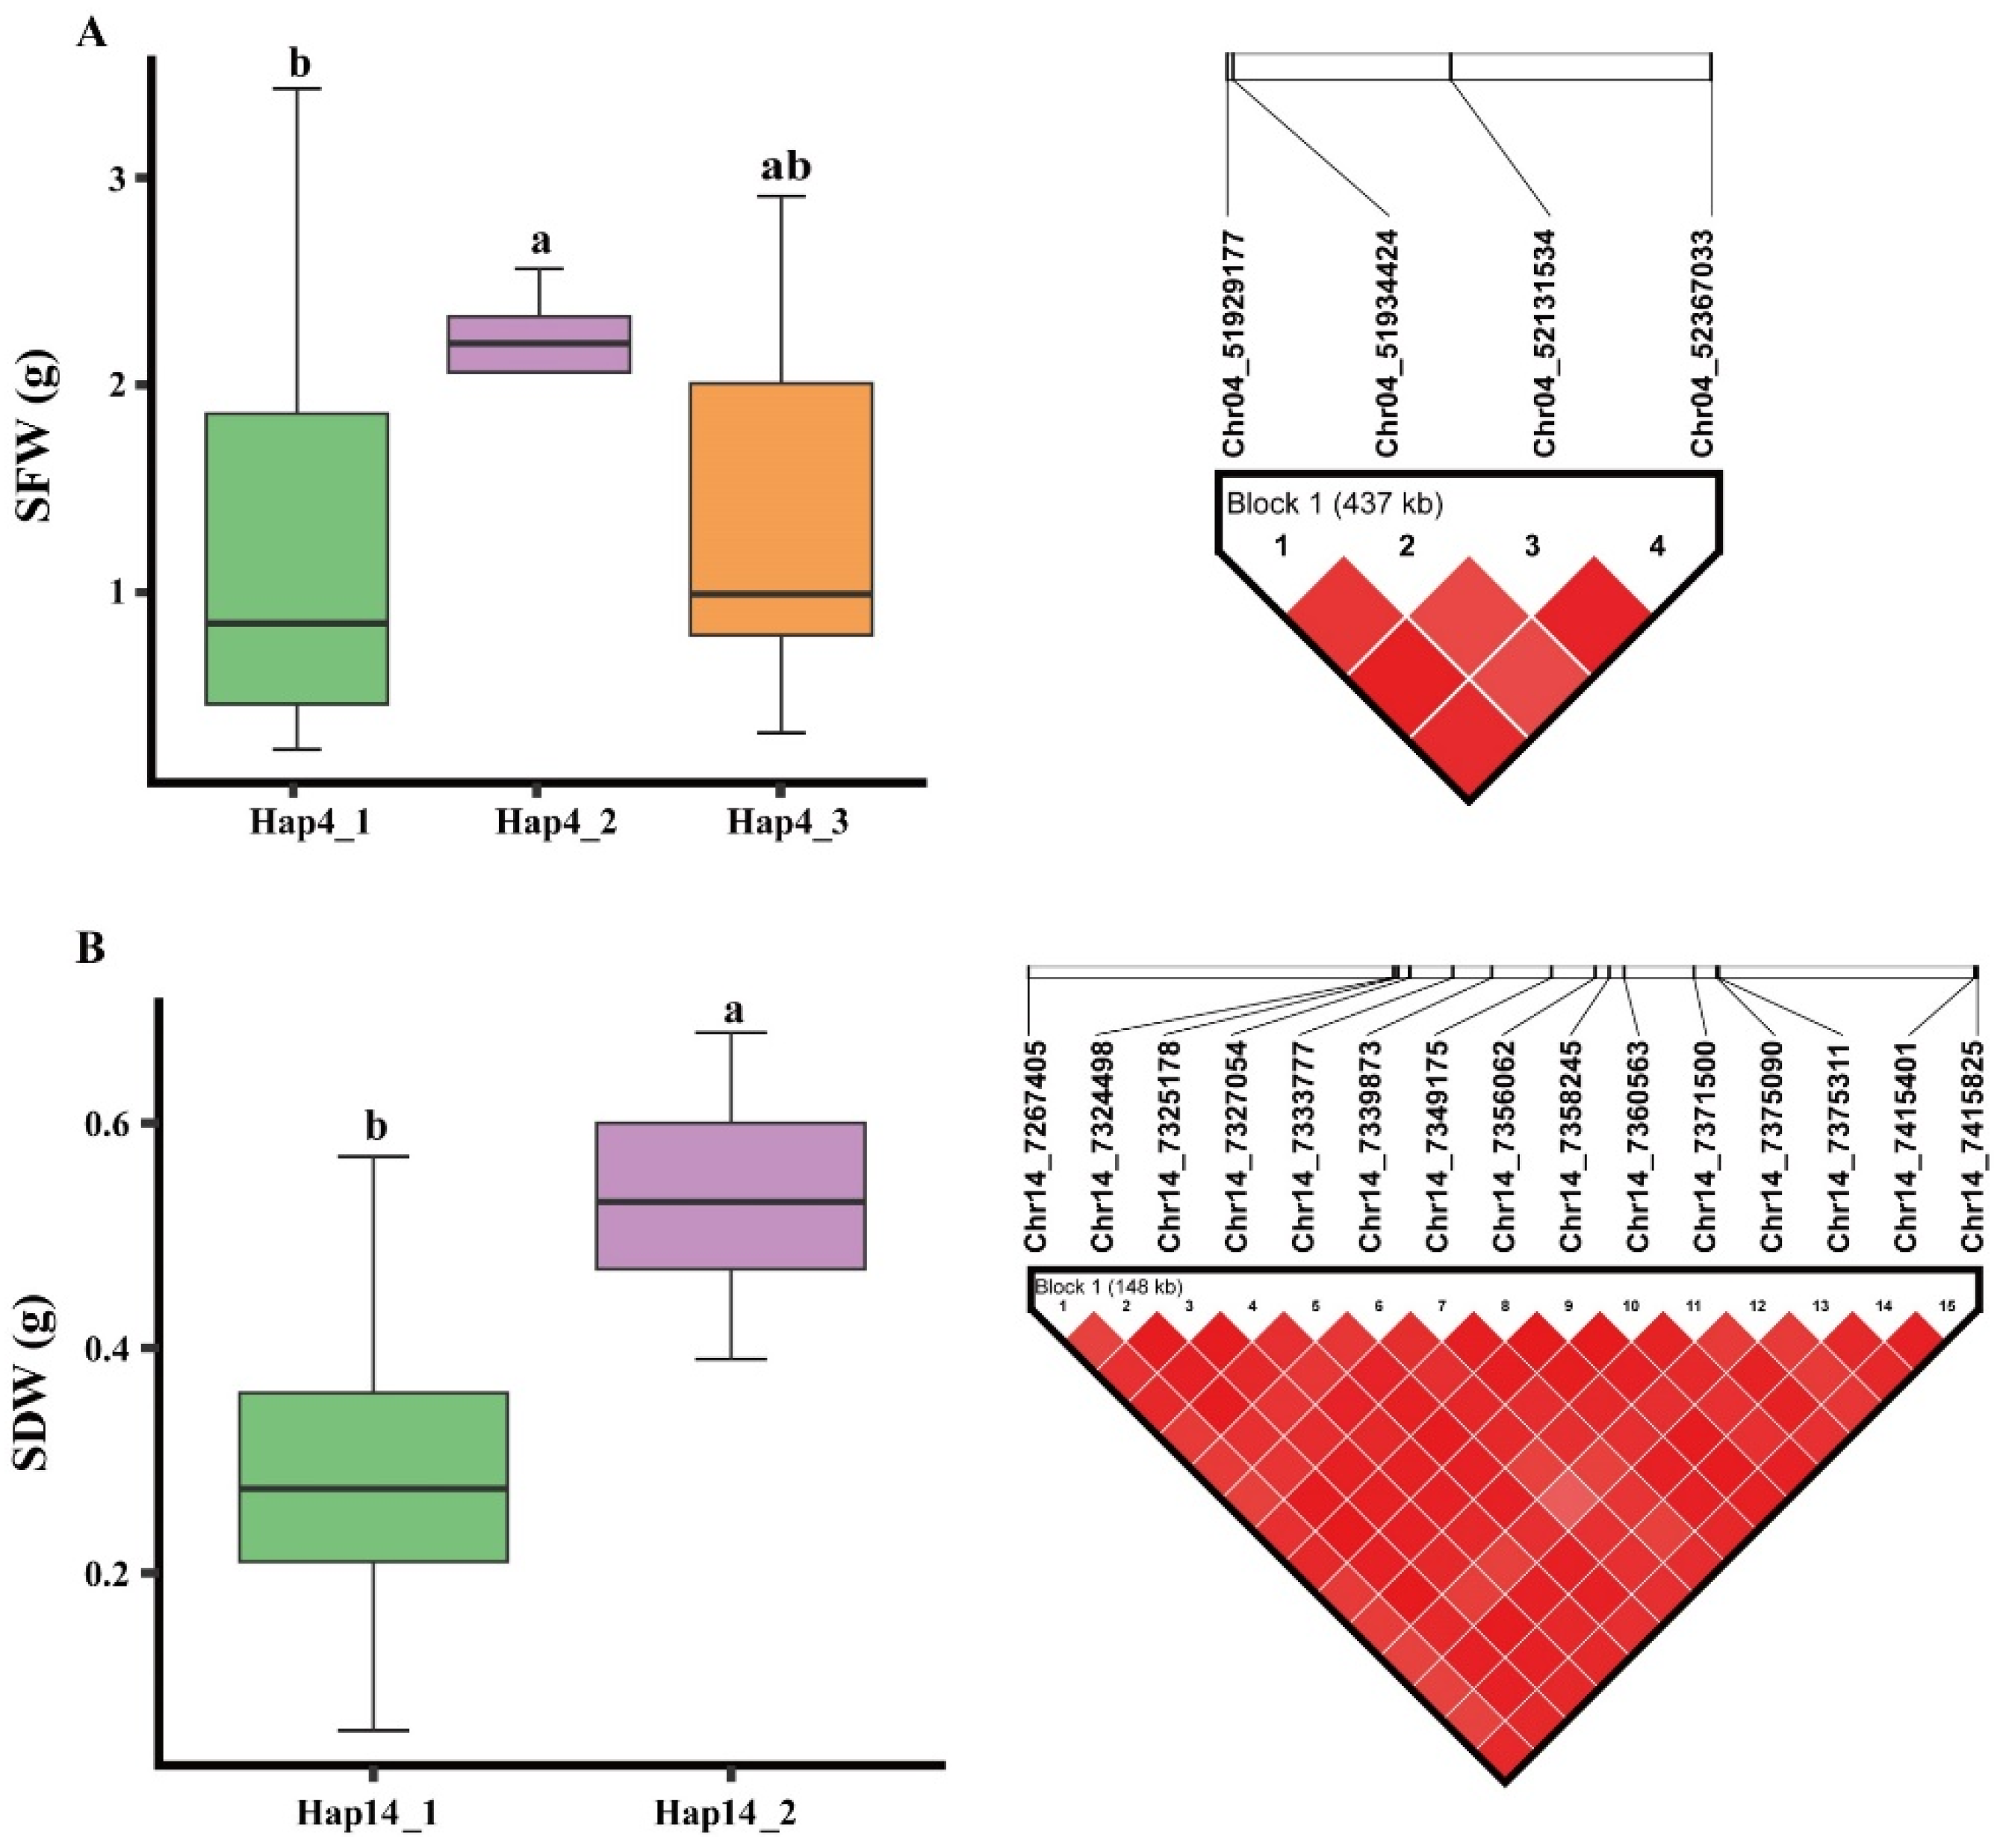
Figure 7.
Haplotype analysis of candidate genes in the GWAS panel of 326 soybean accessions. (A-E) Phenotypic effects of different haplotype alleles of Glyma.04G252300 gene associated with five different alkaline tolerance-related traits viz., root dry weight (RDW), root fresh weight (RFW), root length (RL) and shoot dry weight (SDW) in ACR environment; (F) Phenotypic effects of different haplotype alleles of Glyma.04G253100 gene associated with root tip number (RTN) in ACR environment; (G-H) Phenotypic effects of different haplotype alleles of Glyma.14G083700 gene associated with RDW and RFW in AT environment; and (I) Phenotypic effects of different haplotype alleles of Glyma.20G072500 gene associated with CC in both AT and ACR environments. Grouping of genotypes and pairwise comparisons of genotypes was performed by using Tukey’s HSD test at P < 0.05. Common letters above the boxes represent the non-significant differences, whereas different letters represent significant differencesDiscussion.
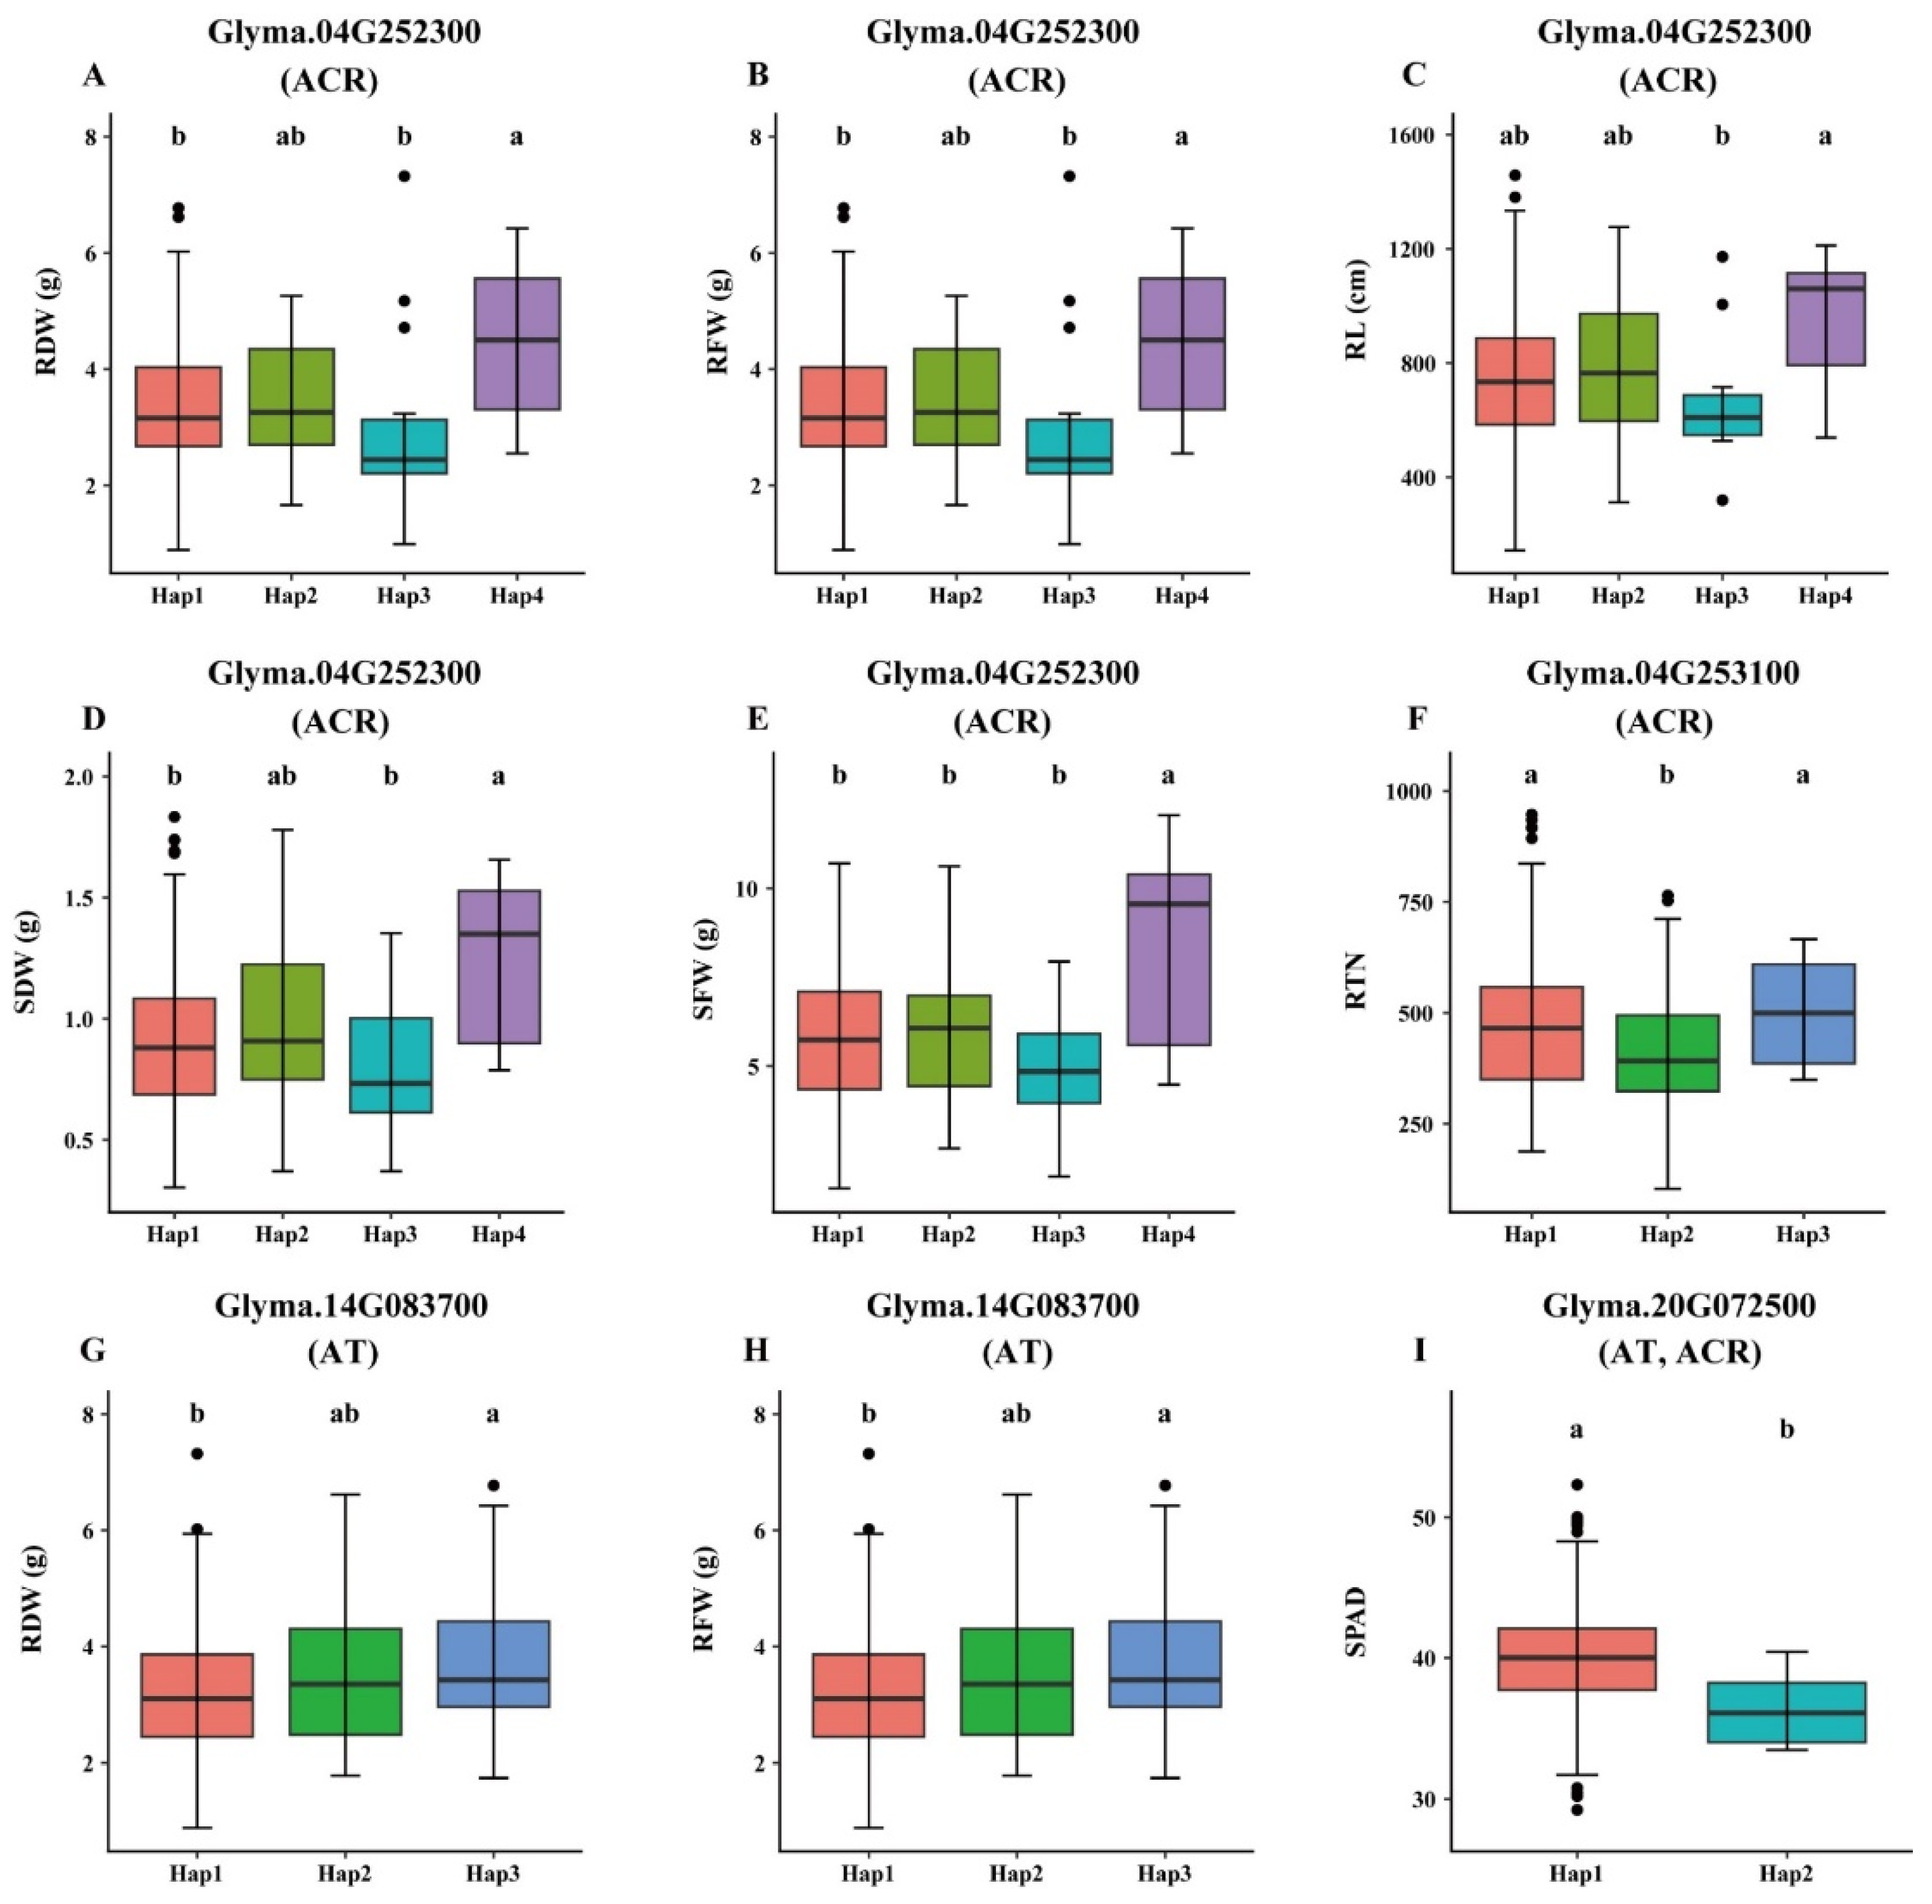

Table 1.
Phenotypic analysis of alkaline tolerance-related traits evaluated in 326 soybean accessions.
Table 1.
Phenotypic analysis of alkaline tolerance-related traits evaluated in 326 soybean accessions.
| Trait | Treatment | Min | Max | Mean±SE | Median | SD | CV% | Skewness | Kurtosis |
|---|---|---|---|---|---|---|---|---|---|
| RFW | CK | 0.89 | 7.32 | 3.35±0.06 | 3.16 | 1.09 | 32.54 | 0.56 | 0.28 |
| AT | 0.15 | 3.47 | 1.36±0.03 | 1.28 | 0.66 | 48.53 | 0.50 | -0.31 | |
| ACR | 0.04 | 1.33 | 0.42±0.01 | 0.40 | 0.20 | 47.62 | 0.98 | 1.57 | |
| RDW | CK | 0.08 | 2.07 | 0.27±0.01 | 0.26 | 0.13 | 48.15 | 7.98 | 106.01 |
| AT | 0.01 | 0.31 | 0.10±0.03 | 0.10 | 0.06 | 60.00 | 0.57 | -0.31 | |
| ACR | 0.04 | 2.38 | 0.41±0.01 | 0.37 | 0.26 | 63.41 | 2.24 | 10.48 | |
| SFW | CK | 1.56 | 12.06 | 5.90±0.11 | 5.77 | 1.95 | 33.05 | 0.49 | -0.12 |
| AT | 0.24 | 3.43 | 1.26±0.04 | 1.03 | 0.82 | 65.08 | 0.51 | -1.04 | |
| ACR | 0.04 | 1.04 | 0.22±0.01 | 0.18 | 0.14 | 63.64 | 1.29 | 2.77 | |
| SDW | CK | 0.3 | 1.83 | 0.91±0.02 | 0.88 | 0.30 | 32.97 | 0.58 | 0.13 |
| AT | 0.06 | 0.75 | 0.31±0.01 | 0.29 | 0.12 | 38.71 | 0.71 | 0.04 | |
| ACR | 0.10 | 1.11 | 0.36±0.01 | 0.34 | 0.15 | 41.67 | 1.34 | 3.33 | |
| RN | CK | 406.33 | 4269.33 | 2108.10±39.78 | 2030.50 | 718.17 | 34.07 | 0.29 | -0.26 |
| AT | 79.00 | 1666.33 | 587.59±18.58 | 505.16 | 335.61 | 57.12 | 0.78 | -0.08 | |
| ACR | 0.03 | 1.41 | 0.29±0.01 | 0.26 | 0.17 | 58.62 | 1.86 | 6.58 | |
| RL | CK | 143.85 | 1457.82 | 742.17±12.58 | 734.00 | 227.12 | 30.60 | 0.25 | -0.20 |
| AT | 41.37 | 621.99 | 248.98±6.72 | 226.25 | 121.32 | 48.73 | 0.59 | -0.36 | |
| ACR | 0.04 | 1.52 | 0.35±0.01 | 0.32 | 0.17 | 48.57 | 1.56 | 5.66 | |
| RTN | CK | 103.33 | 947.00 | 449.18±8.35 | 434.83 | 150.85 | 33.58 | 0.65 | 0.43 |
| AT | 61.00 | 534.00 | 204.29±4.26 | 199.83 | 77.06 | 37.72 | 0.55 | 0.33 | |
| ACR | 0.09 | 1.82 | 0.49±0.01 | 0.47 | 0.22 | 44.90 | 1.35 | 4.54 | |
| CC | CK | 29.22 | 52.33 | 39.95±0.21 | 39.98 | 3.87 | 9.69 | 0.11 | 0.19 |
| AT | 1.49 | 39.74 | 14.75±0.56 | 15.07 | 10.17 | 68.95 | 0.20 | -1.32 | |
| ACR | 0.04 | 0.98 | 0.36±0.01 | 0.38 | 0.24 | 66.67 | 0.19 | -1.30 |
Min: minimum value; Max: maximum value; SE: standard error; SD: standard deviation; CV: coefficient of variation; SFW: seedling fresh weight; SDW: seedling dry weight; RDW: root dry weight; RFW: root fresh weight; CC: relative chlorophyll content; RN: root number; RTN: root tips number; RL: root length; CK: control environment; AT: alkaline stress treatment; ACR: the ratio of AT/CK.
Table 2.
Significant SNP markers associated with alkaline tolerance-related traits.
| No. | Trait name | Significant SNPs | Chr | Pos | P Value | -log10(P) | Environment | Model |
|---|---|---|---|---|---|---|---|---|
| 1 | RDW | Chr01_27555224 | 1 | 27555224 | 2.1839E-07 | 6.660769 | ACR | BLINK, FarmCPU |
| 2 | RFW | Chr01_38897254 | 1 | 38897254 | 2.3509E-07 | 6.628773 | ACR | MLMM, super, CMLM |
| 3 | RTN | Chr01_40473337 | 1 | 40473337 | 2.15E-07 | 6.667484 | AT | GLM |
| 4 | RTN | Chr01_41287221 | 1 | 41287221 | 2.40E-07 | 6.620192 | AT | GLM |
| 5 | RTN | Chr03_3442272 | 3 | 3442272 | 1.12E-07 | 6.952593 | AT | GLM |
| 6 | RTN | Chr18_27591088 | 18 | 27591088 | 2.1329E-07 | 6.671026 | ACR | BLINK, FarmCPU, MLMM, super |
| 7 | SDW | Chr02_4704111 | 2 | 4704111 | 4.56E-09 | 8.340861 | AT | BLINK, GLM |
| 8 | SDW | Chr14_7267405 | 14 | 7267405 | 2.15E-07 | 6.66829 | AT | GLM |
| 9 | SDW | Chr14_7324498 | 14 | 7324498 | 3.07E-07 | 6.513436 | AT | GLM |
| 10 | SDW | Chr14_7325178 | 14 | 7325178 | 3.02E-07 | 6.519871 | AT | GLM |
| 11 | SDW | Chr14_7327054 | 14 | 7327054 | 1.81E-07 | 6.7432 | AT | GLM |
| 12 | SDW | Chr14_7333777 | 14 | 7333777 | 2.96E-07 | 6.528176 | AT | GLM |
| 13 | SDW | Chr14_7339873 | 14 | 7339873 | 2.20E-07 | 6.6578 | AT | GLM |
| 14 | SDW | Chr14_7349175 | 14 | 7349175 | 5.78E-08 | 7.238409 | AT | GLM, BLINK |
| 15 | SDW | Chr14_7356062 | 14 | 7356062 | 2.29E-07 | 6.639446 | AT | GLM |
| 16 | SDW | Chr14_7358245 | 14 | 7358245 | 3.14E-07 | 6.502806 | AT | GLM |
| 17 | SDW | Chr14_7360563 | 14 | 7360563 | 2.09E-07 | 6.680071 | AT | GLM |
| 18 | SDW | Chr14_7371500 | 14 | 7371500 | 2.24E-07 | 6.649972 | AT | GLM |
| 19 | SDW | Chr14_7375090 | 14 | 7375090 | 9.43E-08 | 7.025661 | AT | GLM |
| 20 | SDW | Chr14_7375311 | 14 | 7375311 | 1.91E-07 | 6.720077 | AT | GLM |
| 21 | SDW | Chr14_7415401 | 14 | 7415401 | 1.55E-07 | 6.808744 | AT | GLM |
| 22 | SDW | Chr14_7415825 | 14 | 7415825 | 2.04E-07 | 6.69001 | AT | GLM |
| 23 | SDW | Chr15_10563710 | 15 | 10563710 | 1.02E-07 | 6.991182 | AT | BLINK |
| 24 | SFW | Chr04_51929177 | 4 | 51929177 | 2.2452E-08 | 7.648745 | ACR | BLINK, FarmCPU, MLMM, super, GLM, MLM, CMLM |
| 25 | SFW | Chr04_51934424 | 4 | 51934424 | 1.1781E-07 | 6.928811 | ACR | MLMM, super, BLINK, FarmCPU |
| 26 | SFW | Chr04_52131534 | 4 | 52131534 | 1.4328E-07 | 6.843804 | ACR | MLMM, super, BLINK, FarmCPU |
| 27 | SFW | Chr04_52367033 | 4 | 52367033 | 1.1385E-07 | 6.943677 | ACR | MLMM, super, BLINK, FarmCPU |
| 28 | CC | Chr20_25660093 | 20 | 25660093 | 8.432E-08 | 7.07407 | AT, ACR | MLMM, super, GLM, MLM, CMLM |
Table 3.
Candidate genes underlying the identified QTLs, and their Arabidopsis orthologs as well as gene annotations.
Table 3.
Candidate genes underlying the identified QTLs, and their Arabidopsis orthologs as well as gene annotations.
| No. | Gene ID | Arabidopsis ortholog | Gene function Annotation |
|---|---|---|---|
| 1 | Glyma.01G113400 | AT4G00430 (plasma membrane intrinsic protein 1B) | Response to salt stress, response to temperature stimulus, response to water deprivation and water transport |
| 2 | Glyma.04G251900 | AT4G08250 (GRAS family transcription factor) | Regulation of transcription, DNA-dependent |
| 3 | Glyma.04G252100 | AT4G36020 (cold shock domain protein 1) | Response to cold, response to salt stress and response to water deprivation |
| 4 | Glyma.04G252300 | AT1G77690 (like AUX1 3) | Response to UV light, auxin polar transport, brassinosteroid biosynthetic process, response to auxin stimulus, response to cyclopentenone, root cap development and root hair elongation. |
| 5 | Glyma.04G252500 | AT4G08210 (Pentatricopeptide repeat (PPR-like) superfamily protein) | Biological process |
| 6 | Glyma.04G252600 | AT1G75710 (C2H2-like zinc finger protein) | NA |
| 7 | Glyma.04G252700 | AT1G77720 (PPK1, putative protein kinase 1) | DNA methylation, protein autophosphorylation and protein phosphorylation |
| 8 | Glyma.04G253000 | AT4G08180 (OSBP(oxysterol binding protein)-related protein 1C) | Abscisic acid mediated signaling pathway, response to cold, response to ethylene stimulus and systemic acquired resistance |
| 9 | Glyma.04G253100 | AT1G21980 (phosphatidylinositol-4-phosphate 5-kinase 1) | Phosphatidylinositol metabolic process |
| 10 | Glyma.14G083700 | AT1G46264 (heat shock transcription factor B4) | Response to abiotic stress and response to heat |
| 11 | Glyma.14G083900 | AT1G45976 (S-ribonuclease binding protein 1) | biological process; hormone-mediated signaling pathway; photoperiodism, flowering; signal transduction |
| 12 | Glyma.14G084500 | AT4G34110 (poly(A) binding protein 2) | Response to salt stress |
| 13 | Glyma.18G150300 | AT5G10530 (Concanavalin A-like lectin protein kinase family protein) | Protein phosphorylation |
| 14 | Glyma.20G072500 | AT5G55830 (Concanavalin A-like lectin protein kinase family protein) | Protein phosphorylation |
| 15 | Glyma.20G072600 | AT5G03540 (exocyst subunit exo70 family protein A1) | Auxin transport, hyperosmotic response, protein localization involved in auxin polar transport, response to salt stress, response to temperature stimulus, root development and root hair elongation |
| 16 | Glyma.20G072700 | AT5G03540 (exocyst subunit exo70 family protein A1) | Auxin transport, hyperosmotic response, protein localization involved in auxin polar transport, response to salt stress, response to temperature stimulus, root development and root hair elongation |
| 17 | Glyma.20G072900 | AT5G03540 (exocyst subunit exo70 family protein A1) | Auxin transport, hyperosmotic response, protein localization involved in auxin polar transport, response to salt stress, response to temperature stimulus, root development and root hair elongation |
Disclaimer/Publisher’s Note: The statements, opinions and data contained in all publications are solely those of the individual author(s) and contributor(s) and not of MDPI and/or the editor(s). MDPI and/or the editor(s) disclaim responsibility for any injury to people or property resulting from any ideas, methods, instructions or products referred to in the content. |
© 2024 by the authors. Licensee MDPI, Basel, Switzerland. This article is an open access article distributed under the terms and conditions of the Creative Commons Attribution (CC BY) license (https://creativecommons.org/licenses/by/4.0/).
Copyright: This open access article is published under a Creative Commons CC BY 4.0 license, which permit the free download, distribution, and reuse, provided that the author and preprint are cited in any reuse.


