Submitted:
19 November 2024
Posted:
19 November 2024
You are already at the latest version
Abstract
Determining match pairs among disordered images is a prerequisite for constructing tie points and control networks for the bundle adjustment of planetary remote sensing images. The efficiency and accuracy of determining image match pairs greatly affect the performance of generating planetary mapping products and three-dimensional models. However, existing methods for determining image match pairs in the field of planetary mapping generally use exhaustive methods (such as the USGS ISIS software), which are extremely inefficient when processing a large number of images. This paper proposes an efficient method of image overlapping relationship analysis based on the spatial index of KD tree fast search for disordered and large-scale asteroid images. The algorithm first calculates the three-dimensional coordinates of the image center point, constructs a KD tree data structure based on the three-dimensional coordinates of each image center, and then uses the KD tree fast search algorithm to quickly find the image overlapping relationships within the spec-ified spatial range. For situations where the entire celestial body only occupies a local area of the remote sensing image during the approach stage of asteroids, the center of the effective pixels in the image is calculated by the ray intersection of sampling points. In this study, the image data from asteroid exploration missions such as Bennu, Vesta, and Ryugu are used for experiments, and the proposed image match pairs determination algorithm is systematically compared with the corre-sponding modules of USGS ISIS in order to evaluate its performance in terms of efficiency and accuracy. The results show that when processing more than a thousand images, the proposed method is two to three orders of magnitude higher in efficiency than the corresponding module in USGS ISIS while ensuring the correctness of the image overlapping relationships and the accuracy of bundle adjustment, with the advantage becoming clearer as the amount of data increases. At the same time, according to the obtained image match pairs, images that meet the requirements of Stereo Photoclinometry can be quickly and preferably selected, effectively improving the quality of 3D reconstruction models of asteroid images.
Keywords:
Asteroid exploration
; photogrammetry
; image matching
; KD tree
; image match pairs
1. Introduction
In recent years, asteroid exploration missions have gradually become the hotspot and key tasks in the field of global deep space exploration [1,2,3]. High-precision mapping products of an asteroid’s surface are important basic data for asteroid exploration mission implementation and scientific research [4,5]. Multiple asteroid exploration missions, such as OSIRIS-Rex for Bennu in the United States [6], Hayabusa-2 for Ryugu in Japan[3] and DAWN for vesta in the United States [7], have achieved fruitful mapping products [8,9,10,11]. These missions have acquired a large number of high-resolution remote sensing images, which provide rich data resources for scientific research and require higher requirements for mapping products as well as mapping challenges [12].
In the process of making planetary mapping products, using photogrammetry to perform geometric processing is the main technical means [13,14]. However, with the increase in the number of missions, the amount of image data grows exponentially. Actual planetary photogrammetry projects may consist of tens of thousands or even millions of unordered images, significantly increasing the processing difficulty [15,16,17,18]. Due to the complex topography and irregular shape of the asteroid surface and the complexity of the planetary photogrammetric processing process itself, the efficient processing of massive asteroid remote sensing images has become a technical bottleneck in the current field of asteroid remote sensing mapping. For massive asteroid remote sensing images, obtaining accurate and effective image match pairs becomes an important step in photogrammetry processing. If only simple brute-force matching is used to obtain image match pairs, the efficiency will be very low when processing massive images, which will affect the accuracy and efficiency of subsequent photogrammetry processing results. Therefore, the method by which to efficiently and accurately obtain overlapping image match pairs of large-scale unordered images has become one of the key issues in asteroid remote sensing mapping.
Regarding the determination of overlapping relationships for unordered images, a large amount of research has been carried out in the field of Earth observation. For example, in the field of unmanned aerial vehicle (UAV) photogrammetry, Liang YB et al. used existing geospatial data and prior knowledge about data acquisition to generate accurate match pairs, which has high efficiency and accuracy for large-scale UAV photogrammetry [19]. Jiang S et al. proposed a method to provide efficient matching pair selection for oblique UAV images [20]. This method includes designing image and feature selection strategies to reduce redundancy, implementing an adaptive threshold selection method to determine the number of candidates match pairs, and proposing the adaptive vocabulary tree expansion algorithm for selecting and simplifying match pairs. Subsequently, in 2023, Jiang S et al. optimized this matching pair selection method [21]. This optimization aggregates local features of images and converts them into high-dimensional global descriptors, thereby effectively reducing the number of features and the burden of nearest neighbor search. At the same time, global descriptors are indexed through a specific graph structure, and an adaptive threshold selection strategy is used to efficiently retrieve match pairs. However, the images they use (such as vegetation) have similar textures, which may lead to incorrect match pairs. Rupnik E et al. provided an efficient and accurate solution for the automatic orientation of large-scale oblique images based on a connection graph method [22]. By constructing and optimizing the connection graph, the overlapping relationships between images can be quickly determined. In the field of computer vision, Chen XYL et al. developed a modified Siamese network Overlap Net, which can be used to predict the overlap of images at a certain distance generated by 3D lidar scanning [23,24]. Although these methods have made significant progress in their respective fields, these methods are mainly for aerial remote sensing images in the field of Earth observation and cannot be directly used for the processing of planetary remote sensing images. Moreover, these methods have not fully combined the initial position and attitude information of remote sensing images.
The Integrated System for Imagers and Spectrometers (ISIS) software developed by the United States Geological Survey (USGS) provides modules such as footprint and findimageoverlaps for calculating image overlapping relationships, which is a prerequisite for subsequently establishing a control network of tie points and performing bundle adjustment. This algorithm first uses the initial camera position and attitude information to calculate the ground point coordinates of the image, and then uses the ground point coordinates to form a polygon in two-dimensional space. The overlapping relationships between images is determined by judging the overlap of polygons. Although this method combines the initial pose information of the image, the computational complexity is exponentially related to the number N of ground point coordinates on the image, O(N2). When calculating a large number of unordered remote sensing images (for example, thousands), it usually takes several hours or even days, and the efficiency is extremely low [25]. Although the Ames Stereo Pipeline (ASP) developed by the National Aeronautics and Space Administration (NASA) has accelerated the parallel computation of the planetary remote sensing image matching process, it lacks a module similar to the USGS ISIS for calculating image overlapping relationships. Therefore, it can only construct the control networks by brute-force matching or utilize the third-party software to calculate the image match pairs in advance [26,27].
In addition, in the field of planetary photogrammetry, the Stereo Photoclinometry (SPC) method, as an approach of reconstructing more detailed three-dimensional terrains, has opened a new avenue for obtaining more elaborate remote sensing mapping products [28]. During the process of planetary exploration, factors such as the complexity of spacecraft observation environments, illumination conditions, and the irregular shape of the planets, result in the acquired image data exhibiting characteristics of high complexity, multiple overlaps, and disorder. Moreover, SPC reconstruction has relatively high requirements for the observation and illumination conditions of the images, and it also has a strong dependence on the overlapping relationships between the images. The method by which to efficiently select the images suitable for SPC reconstruction from the vast and complex image data has become a crucial issue.
In this context, a fast and efficient method for determining image overlapping relationships becomes particularly important. This paper proposes a fast and accurate method for determining image match pairs based on the KD tree. The core idea of the method is based on the high efficiency of spatial search of the KD tree [29], selecting the three-dimensional coordinates of the center point of the image to construct the KD tree and performing range search according to the specified search radius, to determine image overlapping relationships between the image to be searched and its surrounding images. The main contributions of this study include the following:
(1) The proposed method can quickly obtain the image match pairs through the KD tree spatial search algorithm based on the calculation of the space rectangular coordinates of the center point of the image, and different methods are used for determining the actual center point according to different image data. For the images with invalid pixels, we adopt the method of the ray intersection of sampling points to determine the center point of images. For normal asteroid remote sensing images, we extract their image center points directly.
(2) According to the image match pairs obtained by the KD tree, we can optimally select the images that meet the SPC requirements.
(3) By determining the image match pairs in advance, we can effectively reduce invalid match pairs and significantly shorten the image matching time during bundle adjustment.
We believe that the proposed method in this paper will provide strong support for calculating the overlapping relationships of massive unordered planetary remote sensing images, and lay a good data foundation for subsequent photogrammetry processing.
2. Materials and Methods
2.1. Basic Principle of Determining Image Match Pairs
The proposed method in this paper mainly determines the match pairs of massive asteroid remote sensing images by combining the KD tree structure and R radius range search. The KD tree is an efficient binary tree data structure that divides points in k-dimensional space by recursively selecting different dimensions to achieve efficient data organization and search [30]. Although the performance of the KD tree will decline in high-dimensional space, it performs best when processing low-dimensional space [31]. In addition, the proposed algorithm constructs a three-dimensional KD tree based on the space rectangular coordinates of the center point of the image, which is exactly in a low-dimensional space. After constructing the KD tree, R radius range search is conducted to determine the overlapping images through computing the Euclidean distance of different center points of images [32,33]. Compared with K-nearest neighbor search, R radius range search recursively traverses nodes in the KD tree and determines whether a point is within a specified radius. Thus, R radius search based on the KD tree structure is suitable for quickly determining the overlapping relationships of the target image [34].
Figure 1 shows a flowchart of the R range search process based on the KD tree structure. The following gives specific details of the processing steps.
- (1)
- Data preprocessing: extract the center points of asteroid images and construct a three-dimensional KD tree with the three-dimensional coordinates of the image center points as the point set.
- (2)
- Set the radius threshold for R range search. The principle is to use the distance between the centers of two images with camera size (1024×1024/pixel) as the farthest overlapping pixel of the search radius; that is, the distance of the central point in the three-dimensional space is estimated by utilizing the minimum overlap degree of the two images. Then, the search radius is determined in combination with the image resolution. The calculation formula is as follows:
- (3)
- Define each point in the entire point set as a point to be searched and place it in the KD tree for search.
- (4)
- (Calculate the spatial distance between the point to be searched and other three-dimensional points in the point set. Then, compare it with the search radius threshold. Points with a spatial distance less than the search radius are all kept as neighboring points of the point to be searched.
When constructing the KD tree and R radius searches, the input data used are the three-dimensional coordinates of the center points of asteroid images. Next, we discuss in detail the method for determining the center points of images.
2.2. Determination of the Actural Center Point of the Images
Data preprocessing is first required to determine the center point coordinates of the image. The method adopted in this paper is as follows: First, raw asteroid images in Planetary Data System (PDS) formats are converted into ISIS-cube format (.cub) based on the corresponding software tools provided in USGS ISIS. For example, dawnfc2isis is used to convert the raw DAWN frame camera images into ISIS cube images. Then, the geometric coordinates (i.e., latitude, longitude coordinates and elevation) of the center point of the image are extracted from the ISIS .cub image and converted into space rectangular coordinates. However, since the asteroid image data obtained from different exploration stages have large differences in resolution and image quality, it is still uncertain whether the actual center point of the image is located at the center of the image. Therefore, targeted preprocessing needs to be carried out on image data in different exploration stages.
For high-resolution images obtained by close-distance, such images can usually clearly display the detailed features of the asteroid surface and there is no invalid black area (as shown in Figure 2). In this case, the center of the image is its image center. This paper refers to such images as normal asteroid remote sensing images. Relatively speaking, low-resolution images obtained by the approach phase may only contain part of the asteroid surface or one side of the full view, and there is an invalid black area (usually the starry sky background) at the same time. This leads to the fact that the actual effective center point of the image is not located at the image center. This paper refers to such images as the abnormal asteroid remote sensing images containing invalid pixels. For this situation, this study uses the ray intersection of sampling points to determine its image center, which is described in Section 2.2.2.
2.1.1. Normal Asteroid Remote Sensing Images
For these image data, such as Bennu data obtained in the detailed survey (DS) stage [8,36] and Vesta data obtained in the high-altitude-mapping orbit (HAMO) stage (as shown in Figure 2) [7], we first extract the latitude and longitude coordinates and elevation of the image center point and convert them into spatial Cartesian coordinates. The specific process is shown in Figure 3.
2.1.2. Abnormal Asteroid Remote Sensing Images Containing Invalid Pixels
For asteroid remote sensing images containing invalid pixels, such as Bennu image data obtained in the preliminary survey (PS) stage [8,36] and Ryugu image data obtained in the asteroid characterization phase [9], the center point of the valid pixels is not located at the center of the image (as shown in Figure 4). When directly using the image center point for determining the space rectangular coordinates, there may be no intersection with the small celestial body surface. Thus, it is necessary to recalculate the center point of the valid pixels. This study designs a method for calculating the actual center point of valid pixels based on the ray intersection of sampling points. The core idea of the proposed method is to preset an effective gray threshold for the asteroid remote sensing images. This threshold is determined according to the grayscale histogram of the observed image. Then, the entire image is sampled every 10 pixels in both row and column directions. Each sampling point has its own gray value. We compare the gray value of the sampling point with the specified gray threshold. If the gray value of the sample point is greater than the gray threshold, the sampling point is considered an effective sampling point; otherwise, it is considered an invalid sampling point. Finally, we calculate the average pixel coordinates of all effective sampling points, and take them as the virtual center point of the asteroid image. Then, this virtual center point is used to determine the pixel coordinates of the center point of the image (see Figure 4). Next, combining the information of the exterior orientation parameters and the constructed camera model, we calculate a spatial three-dimensional direction vector and a three-dimensional point on the image. Using the parametric equation (i.e., point-direction form), a three-dimensional spatial straight line passing through the image center is determined. Finally, we calculate the intersection point of this straight line with a low-resolution 3D model or Digital Elevation Model (DEM) of the target small celestial body. Generally, there will be two intersection points. We select the intersection point closer to the image as the final space rectangular coordinates of the virtual center point of the image. A schematic diagram of the ray intersection of sampling points is shown in Figure 5, and its specific process is shown in Figure 6.
2.3. Complexity of the Algorithm
In the previous discussion, we introduced the basic principle of determining the match pairs based on the KD tree structure and the valid image center point. Next, we analyze the complexity of the algorithm.
KD tree search can efficiently organize and query multi-dimensional spatial data by using spatial division and partitioning. The proposed algorithm’s complexity contains construction complexity and query complexity. When constructing a KD tree, the insertion operation of each node requires O (log N) comparisons in a balanced case. Therefore, its average time complexity is O (log N) (N represents the number of images). When querying a KD tree, the query process is similar to the search process of a binary tree. Therefore, the average time complexity of nearest neighbor search using a KD tree is O (log N) [35]. In contrast, the findimageoverlaps software tool provided in USGS ISIS adopts the brute-forcing search method, but it also needs to use the camera model to calculate the footprint coordinates of each image. Indeed, it determines the overlapping relationships of images by analyzing whether polygons composed of footprint coordinates intersect. Indeed, when determining a potential image matching pair, it is necessary to use all footprint coordinates of an image to form a footprint polygon. Therefore, the time complexity of the software tool provided in USGS ISIS is O(N×M)2 (N represents the number of images and M represents the number of footprints on the image). The details are shown in Figure 7 (Figure 7a represents the images and Figure 7b represents the number of foot-points of these images).
For an asteroid remote sensing image, the number of footprints it contains may be several hundred or even thousands, which depends on the parameter settings when processed by USGS ISIS. Moreover, the images at high latitudes are more stretched, resulting in a larger number of footprints, which leads to longer computation time when calculating the overlapping relationships (as shown in Figure 8c). However, the obtained foot points are the footprints on the projected Digital Orthophoto Map (DOM) image. Therefore, existing methods for calculating the image match pairs still have shortcomings in high-latitude regions. When the number of images N increases, the complexity of the existing methods (e.g., USGS ISIS) rapidly increases, resulting in low efficiency. In contrast, the proposed algorithm only needs to calculate the spatial distance to determine the image overlapping relationships, and it is not affected by different latitudes. Moreover, the time complexity of the proposed algorithm is much lower than the corresponding modules of ISIS software. It is obviously more efficient in processing large-scale data and can significantly improve the speed of determining image match pairs.
2.4. Optimal Image Selection for SPC Reconstruction
SPC is a method that uses images with different illumination conditions, observation geometries, and pixel scales to generate elaborate three-dimensional terrain which is consistent with the resolution of the original image. It combines stereophotogrammetry (SPG) and photoclinometry. The generated products have the accuracy of SPG and the resolution of photoclinometry without being subject to the common limitations of both [36]. The following standards are suggested to meet the ideal reconstruction requirements of SPC:
(1) At least four images are required, and the detector should be photographed from the east, south, west, and north directions relative to the target area. The precise orientation of the azimuth does not have to be in the axial direction, but the ideal value is about 90°. The actual minimum value of any two observations is 60 degrees.
(2) These four images should have different incidence angles to supplement the shadow area.
(3) The fifth image needs to be obtained as close as possible to local noon (i.e., low incidence angle), without the need to be close to zero azimuth. When the sun is at local noon, topographic features are minimized and albedo features are maximized [37,38].
That is, the four images focus on topography, and the fifth image focuses on albedo. Combined with the literature [28,39,40] and preliminary practical experience, the ideal illumination and observation conditions for SPC reconstruction are shown in Table 1. Indeed, the returned asteroid remote sensing images may cover situations taken on different dates, different orbits, and at different times, resulting in problems such as irregular overlap, disorder, and excessive redundancy of the images. In order to ensure the best three-dimensional reconstruction quality, optimal image selection is essential to meet the requirements of SPC.
During the process of selecting images, the proposed algorithm can offer extremely effective assistance. Due to the large number of images worldwide, when conducting SPC reconstruction experiments, we usually first identify an experimental area. Then, from all the images within this area, we select the ones that best meet the SPC requirements for 3D reconstruction. Specifically, first, through the KD tree algorithm, we can quickly determine the overlapping relationships among all the images. Then, we can arbitrarily select an area for SPC reconstruction. According to the latitude and longitude ranges of this area, we can locate a certain number of images located in this area. Then, according to the image match pairs obtained based on the KD tree, we can quickly determine all the images located in this area. Finally, in combination with the requirements of SPC reconstruction, we can rapidly select the images which best meet the requirements of SPC reconstruction according to information such as the incidence angle, emission angle, spacecraft azimuth angle, and solar azimuth angle of the images. Therefore, the proposed algorithm can provide reliable technical support when selecting images for SPC reconstruction.
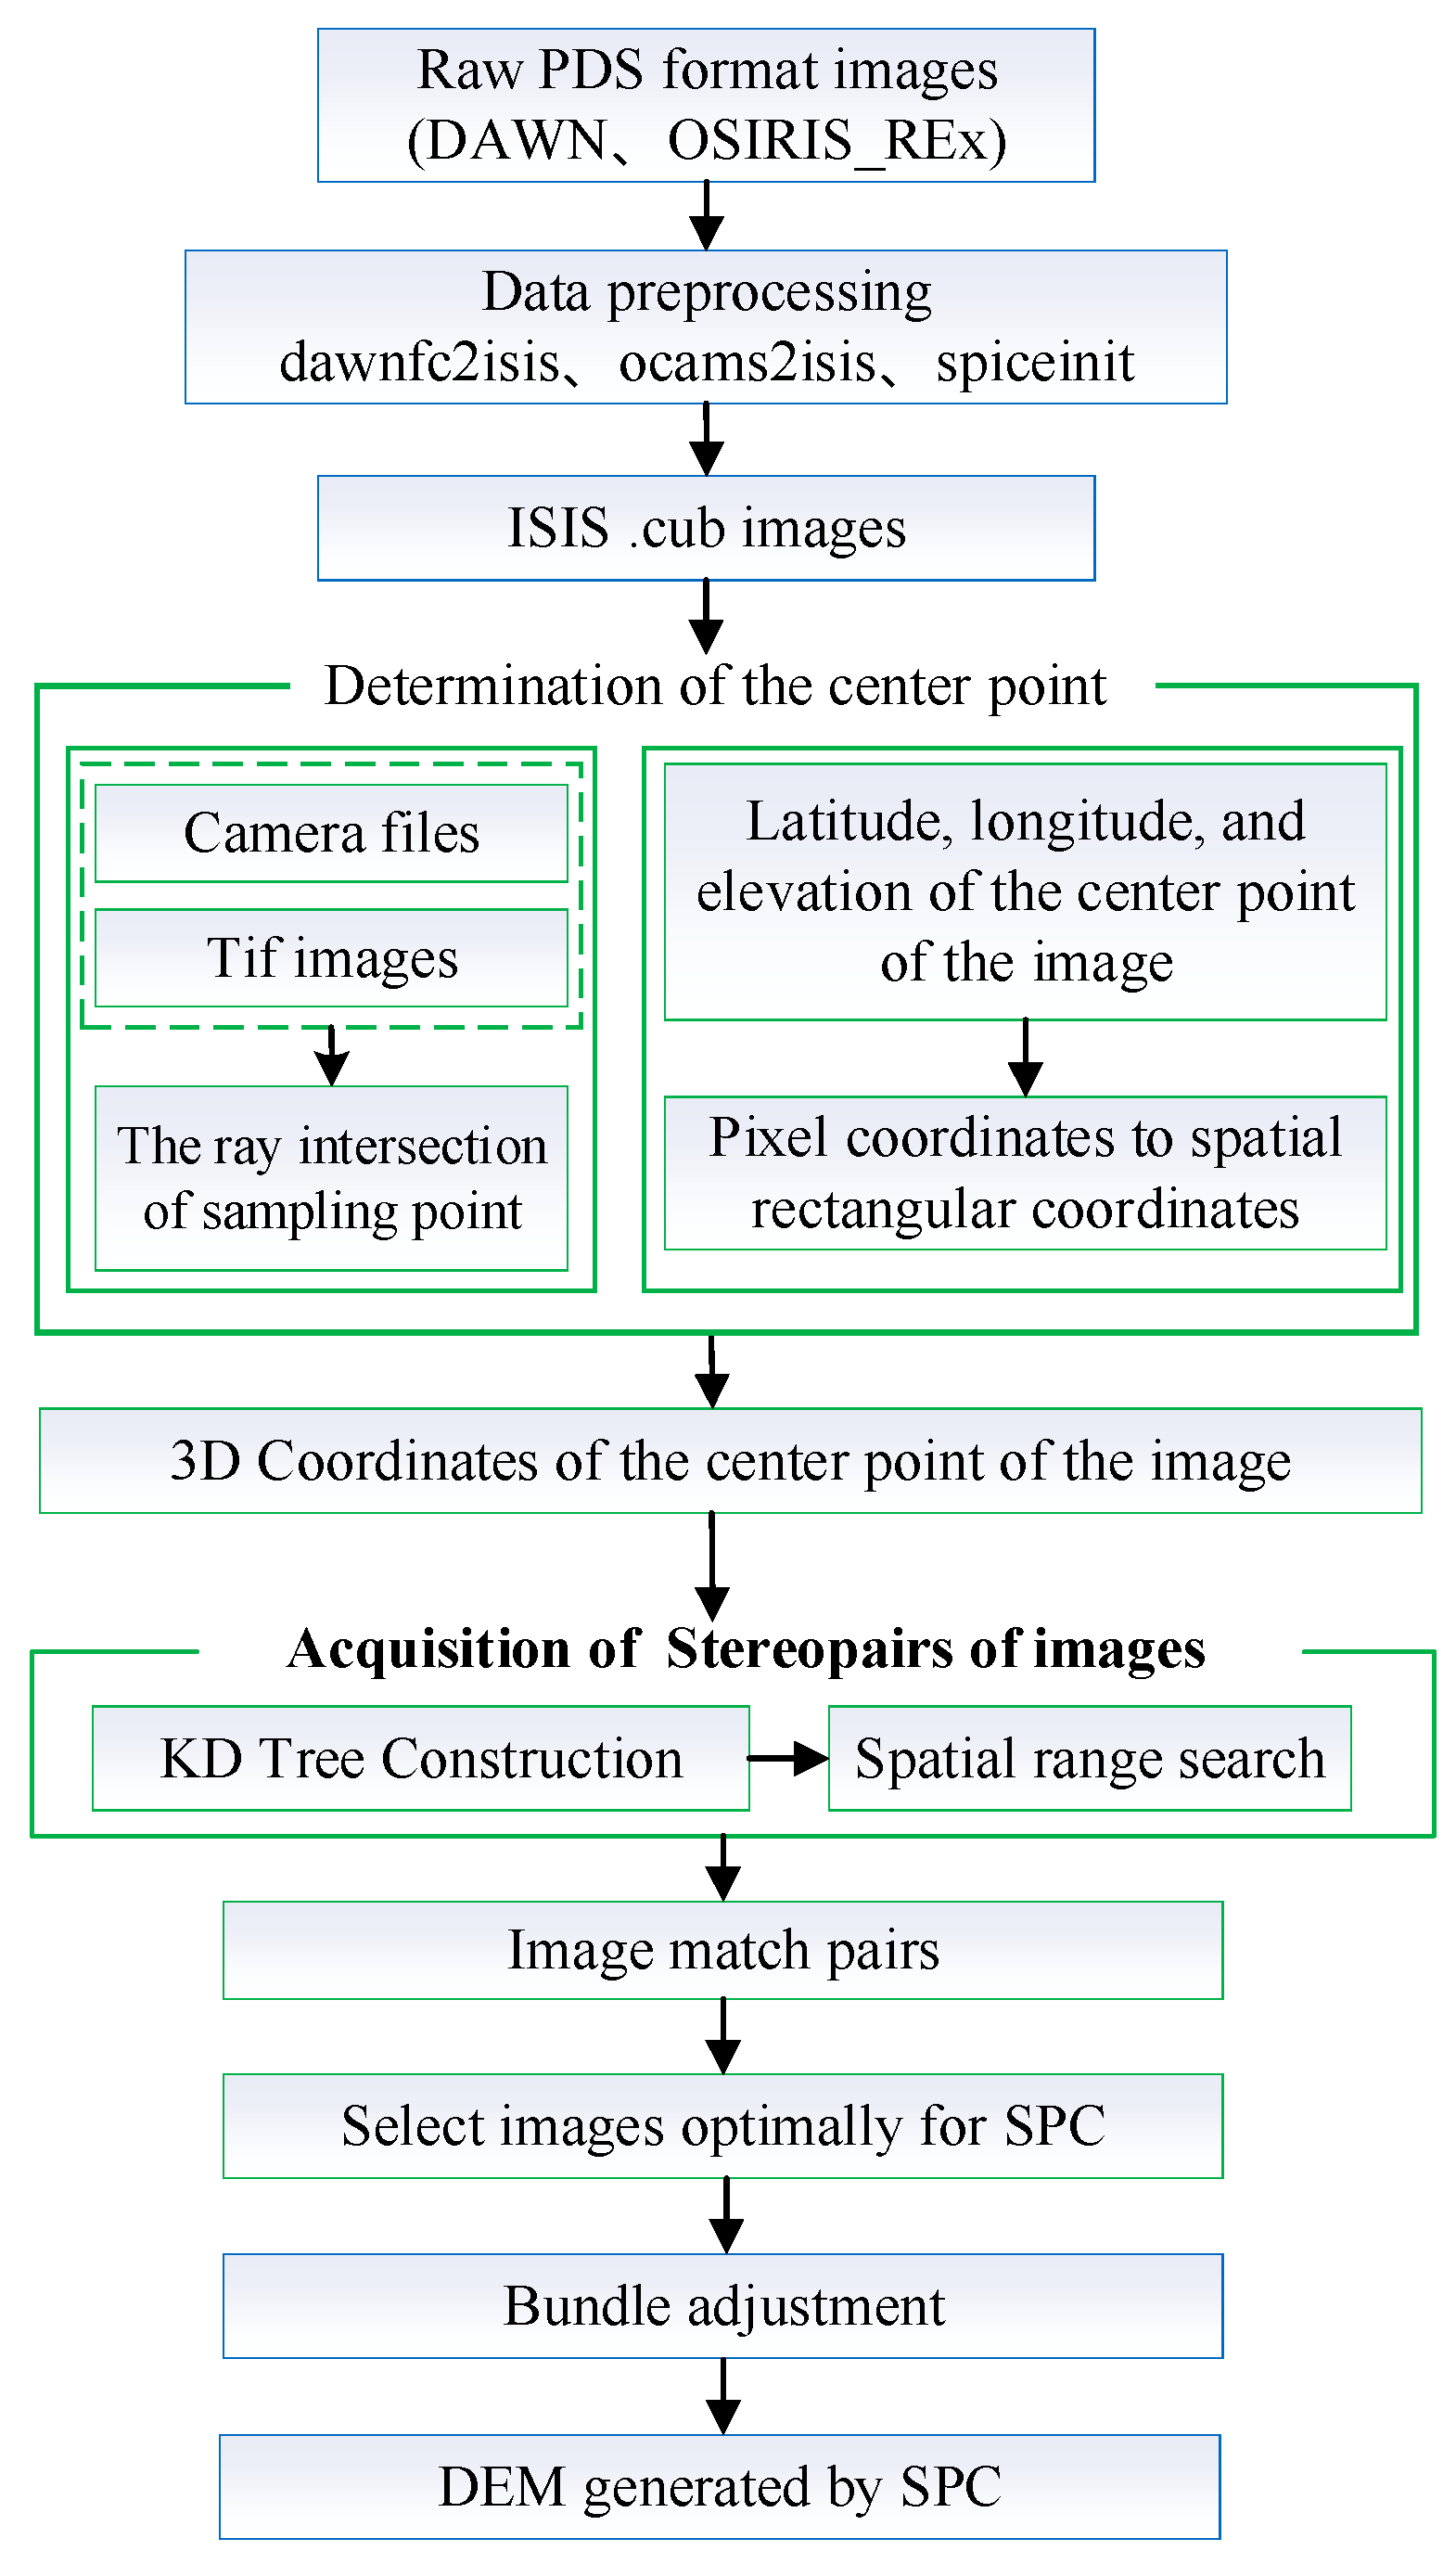
2.5. Overall Algorithm Process
To solve the problem of calculating the match pairs of massive asteroid remote sensing images, this paper proposes an efficient method based on the KD tree and R range search. This process combines SPC and image match pairs. The main steps are as follows:
(1) First, the image data are preprocessed. ISIS software is used to convert the raw PDS format image data to an ISIS .cub format image.
(2) Then, the latitude, longitude, and elevation information of the image center is extracted. For normal images, the center pixel of the original image can be directly used to calculate the three-dimensional coordinates of the image. However, for images with invalid pixels, we first calculate the virtual center point using the method described in Section 2.1.2 and then calculate the corresponding three-dimensional coordinates for the virtual center point. The geographic coordinates (i.e., latitude, longitude, and elevation) are then converted into space rectangular coordinates.
(3) A KD tree is constructed based on the obtained three-dimensional coordinates of the image center points, and an R range search is performed according to the search radius threshold. The spatial distance between the center points and the radius threshold is evaluated to determine the match pairs for each image.
(4) Based on the image match pairs, image matching is carried out and the control network is constructed. Then, the jigsaw module of ISIS is used to perform bundle adjustment.
(5) The method described in Section 2.4 is described to select the images for SPC reconstruction.
(6) The SPC terrain reconstruction process is constructed, and a high-resolution DEM is derived.
This method not only avoids the influence of factors such as image quality and illumination angle, but can also significantly improve the processing efficiency, so the match pairs of thousands of images can be determined in a few seconds. The correctness of this method has been verified by the qmos tool of ISIS, proving its high efficiency and practicability in the processing of large-scale area array images.
Figure 9.
Overall flowchart (the blue parts of the figure show the corresponding modules of ISIS and the green boxes show the methods for determining the image centroid in different stages of detection).
Figure 9.
Overall flowchart (the blue parts of the figure show the corresponding modules of ISIS and the green boxes show the methods for determining the image centroid in different stages of detection).
3. Experiment and Analysis
3.1. Test Data
For normal images, we select the image data of Bennu obtained in the detailed survey stage and the image data of Vesta obtained in the HAMO stage. For images containing invalid pixels, we select the image data of Bennu obtained in the preliminary survey stage and the image data of Ryugu obtained in the asteroid characterization phase for processing. These four sets of data are used to evaluate the performance of the proposed algorithm for calculating image match pairs.
In addition, we also use the ISIS software to calculate match pairs for the same data, and conduct a comparative analysis of the time efficiency as well as accuracy. Subsequently, we use the obtained overlapping relationships to extract tie points and construct the control network. Then, we use the ISIS jigsaw module to perform bundle adjustment. In this study, all experiments are performed on a laptop with 32GB of RAM, an Intel 13th generation i7 CPU, and an Ubuntu 22.04 operating system. The ISIS software version is 8.0.0. Specific information about the experimental data is shown in Table 2.
3.2. Experimental Results and Analysis of Determining Image Match Pairs
3.2.1. Experimental Results and Analysis of Normal Images
First, after determining the space rectangular coordinates of the image center point, we used the algorithm described in Section 2.1.1 to obtain the image match pairs of data from Tests 1 and 2. For Test 1 data, we conducted experiments with 32, 255, 1365, and 5453 images in ascending order. For comparison, we also used the findimageoverlaps method of USGS ISIS to conduct experiments on the same data. Table 3 shows the statistical results of the time taken by different methods to calculate image match pairs.
As can be clearly seen from the table, when the amount of data are small, there is not much difference in efficiency between the two methods. However, as the number of images increases, the time taken by the ISIS method increases even exponentially. For example, when processing more than five thousand images of Bennu, the proposed algorithm only takes less than 4 seconds, while ISIS fails to complete this task. This shows that the proposed algorithm is clearly superior to the ISIS method when processing a large amount of image data. Note that the asteroid remote sensing images have the characteristics of multiple overlaps, disorder, and irregular overlaps, and these disorderly asteroid remote sensing images include images in various latitude and longitude ranges. The images in the polar or high latitude regions have a large stretching problem, resulting in a single image that may span the entire longitude range. Thus, the findimageoverlaps module will produce incorrect match pairs, significantly increasing the computation time. Therefore, the existing algorithm adopted in USGS ISIS is not suitable for asteroid images in polar or high-latitude regions. In contrast, the proposed algorithm uses the space rectangular coordinates of the valid center point and is not affected by latitudes. Therefore, the proposed algorithm has better applicability for processing a large number of unordered remote sensing images in practical applications.
To check the correctness of the obtained image match pairs, we open the corresponding images in qmos. Figure 10 and Figure 12 show the comparison diagrams of the match pairs obtained by the proposed method and the ISIS method. For a better display result, Figure 11 and Figure 13 show the detailed display diagrams using five images. Figure 11a and Figure 13a show schematic diagrams of the match pairs of the five selected images, and Figure 11b and Figure 13b show the original images corresponding to these five images. The red image in the figures represents the target image, and the images of other colors represent the overlapping images.
As can be seen from Figure 10 and Figure 13, the image match pairs obtained by the proposed algorithm are basically the same as the results obtained by USGS ISIS. Although we used the spatial distance of the image center point to determine the overlapping relationships, its accuracy is as precise as the result obtained by ISIS. This is due to the fact that there are errors in the initial spacecraft’s position and attitude information. Consequently, the footprint coordinates derived from findimageoverlaps have limited accuracy. The proposed algorithm deals with the influence of the above error factors by appropriately increasing the search distance threshold.
3.2.2. Abnormal Asteroid Remote Sensing Images Containing Invalid Pixels
The images from Tests 3 and 4 are low-resolution remote sensing images acquired at the approach state of the exploration. Since these low-resolution images contain invalid pixels, ISIS cannot be used to complete the calculation of footprint coordinates. Consequently, ISIS failed to determine the image overlapping relationship. In contrast, the proposed algorithm can calculate the image overlapping relationship for these images based on the space rectangular coordinates of the virtual center point of the images.
The experimental results of the computation time used by the proposed algorithm are shown in Table 4. As can be seen, the proposed method shows high efficiency. Figure 14 and Figure 15, respectively, show the image match pairs of the asteroids Bennu and Ryugu. The right half of the figure shows the local detail of an image pair. This study chooses to use ISIS’s qview for display. The first image on the left half of the figure is the reference image, and the other images are the images with overlapping relationships. The red dot in the figure is a homologous point for the image pairs, which facilitates showing the local details of the overlapping images. It demonstrates that the proposed algorithm can derive the correct image match relationship.
3.3. Photogrammetric Processing Results
3.3.1. Construction of Control Network
A high-quality control network is crucial for bundle adjustment. Here, we use NASA ASP’s software tools, namely ipfind and ipmatch, to obtain the tie points. Specifically, ipfind is first used to detect feature points, and then ipmatch is used to match conjugate points. Then, the image matching files generated by ipmatch are converted into a PVL (Parameter Value Language) format control network file, which can be directly used by the ISIS’s bundle adjustment software tool jigsaw. Tests 3 and 4 are low-resolution images obtained in the approach stage. Because these low-resolution images always cover one side of the entire asteroid and have a large longitude span, they show irregular footprint coordinates (see Figure 16). This makes it impossible to accurately calculate the image overlap relationship.
We conducted experiments on the four datasets, and the specific bundle adjustment result is shown in Table 5.
The distribution of the tie points for Tests 1 and 2 are shown in Figure 17 and Figure 18, respectively. A total of 445,565 control points are extracted for Test 1, with 122,002 obtained for Test 2. According to the figures, we observe that these tie points are evenly distributed. This indicates the effectiveness of the image overlap relationships determined by the proposed method.
3.3.2. Bundle Adjustment
The effectiveness of bundle adjustment largely depends on the accuracy of the determination of the image overlapping relationship. If there is a mismatched image pair, it will lead to incorrect tie points, thereby affecting the refinement of the position and attitude of the spacecraft and reducing the accuracy of the bundle adjustment results. Indeed, the quality of the bundle adjustment results also provides a basis for verifying the correctness of the image match pairs. If the adjustment results show high accuracy, it indicates that the proposed method is effective in obtaining image match pairs.
This study uses the jigsaw application provided by USGS ISIS for bundle adjustment. Because jigsaw has high computational efficiency and relatively good support for different sensors in deep space exploration missions, one difficulty in bundle adjustment is the setting of the weights for different types of observations, including the weights of the spacecraft’s position and camera’s attitude. Here, the weights of observations are mainly specified based on experiences and the accuracy of the orbit and attitude determination. In the generation of the control network, there will inevitably be some outliers. They should be eliminated during the adjustment process, so multiple iterations of the adjustment process are usually required. It is generally considered that when the residual value of the image observation (i.e., tie point) is less than 1 pixel and the adjustment result’s index, namely the Sigma0 value, is less than 0.5, a satisfactory adjustment result can be considered obtained.
As can be seen from Table 5, the Sigma0 values of the four datasets are all less than 0.3, indicating that satisfactory bundle adjustment results are obtained for all cases. The root-mean-square error (RMSE) of the image observation for each image after bundle adjustment is shown in Figure 19, Figure 20, Figure 21 and Figure 22. For Test 1, most of the residual values of Bennu images in the detailed survey stage are within 0.2 pixels, and a small part are within 0.4 pixel. For Test 2 the Vesta images in the HAMO stage most of the image residual values are within half a pixel, and a small part are between half a pixel and one pixel. In the case of Test 3, namely the Bennu images in the preliminary survey stage, most of the image residual values of the bundle adjustment are within 0.3 pixels, and a small part are within half a pixel. Since Test 4 contains Ryugu images with different resolutions, the image residual values are larger, but basically within one pixel. The small image residual values of bundle adjustment indirectly indicate the correctness of the image match pairs.
The geometric positioning accuracy of tie points is shown in Figure 23, Figure 24, Figure 25 and Figure 26. Considering the image resolutions of test data, the Bennu images in the detailed survey stage (i.e., Test 1) can achieve an average positioning accuracy of better than 0.25 pixels in the plane direction and about 0.5 pixels in the elevation direction; the Vesta images in Test 2 can achieve a positioning accuracy of about better than 0.3 pixels in the plane direction and about 0.8 pixels in the elevation direction; the Bennu images in the preliminary survey stage (i.e., Test 3) can achieve an average positioning accuracy of about 0.5 pixel for both plane and elevation directions; and the Ryugu images in Test 4 can achieve an average positioning accuracy of about 1 pixel for both plane and elevation directions. For Tests 3 and 4, we use 1 and 1.5 m as the average resolutions, respectively. Such geometric positioning accuracy is basically the same as the geometric positioning accuracy of remote sensing images of Earth observation satellites.
3.3.3. Orthophoto Mosaic
The accuracy of the orthophoto mosaic can truly reflect the geometric positioning accuracy of adjacent images. This can also demonstrate the effectiveness of the determination of the image match pairs. If the overlapping images are not calculated correctly, the geometric errors between overlapping images cannot be removed by bundle adjustment. Then, it may lead to the geometric misalignment of overlapping orthophotos. After bundle adjustment, we used cam2map provided by USGS ISIS for orthorectification. We used Test1 data to generate a global low-resolution (20 cm/pixel) orthophoto mosaic with longitudes ranging from 0 to 360° and latitudes ranging from -60 to 60° (part a in Figure 27) and a local area high-resolution (5 cm/pixel) orthophoto mosaic (part b in Figure 27). The orthophoto mosaic of asteroid Vesta with longitudes ranging from 0 to 360° and latitudes ranging from -60 to 50° generated using Test2 data is shown in part a of Figure 28. Note that the remote sensing images returned by the DAWN asteroid exploration mission lack effective image coverage in the North Pole. It can be seen that the discrepancies in adjacent DOMs are less than one pixel in part b of Figure 28. In particular, the effect of the DOM mosaic can be visualized in the adjacent image areas with steeper terrain within the red frame in the figure. This indicated that the generated DOMs showed high relative accuracy. It also demonstrated that the bundle adjustment delivered a good result, and the discrepancies between the adjacent images were removed. The updated external orientation (EO) parameters derived from the bundle adjustment provided consistent geometric accuracy for adjacent images. It can be seen that the accuracy of the orthophoto mosaic is high, which also proves the correctness and effectiveness of the image overlapping relationship determined by the proposed algorithm.
3.3.2. SPC Reconstruction
The data we used were a total of 2553 images (Test 2) covering the globe, which were obtained by Vesta on different orbits. First, we arbitrarily selected an area for SPC reconstruction. In order to obtain all the images within the test area, we selected all the images within a range larger than the test area. The longitude range of this area is 105 to 135°, and the latitude range is -25 to 5° (see part a of Figure 29). Then, according to the proposed method, we obtained the overlapping relationships of all images. Then, we used these relationships to filter out all the images located in this test region (as shown in Figure 29b). Finally, combined with the illumination and observation requirements of SPC, five images that met the optimal requirements were selected to generate the DEM (as shown in Figure 29c). The area for the SPC experiment in this study was 500 × 500 pixels.
Figure 30 shows the observation and illumination conditions of the selected Vesta images. Figure 30a shows the distribution of the solar ground azimuth and incidence angle, and Figure 30b shows the distribution of the spacecraft ground azimuth and emission angle. These two figures are plotted in polar coordinates because this can intuitively represent the observation and illumination conditions. The polar angle in Figure 30a corresponds to the solar ground azimuth, and the polar radius corresponds to the solar incidence angle (0° indicates close to the center). As can be seen from the figure, the incidence angles of the first four selected images are different, which can provide complementarity for the terrain. The polar angle and polar radius in part b of Figure 30 correspond to the azimuth and emission angle of the spacecraft, respectively. As can be seen from the figure, the spacecraft’s azimuth angles of the five selected images are roughly distributed in all directions, which can improve the terrain reconstruction quality and supplement the shadow areas.
Using the five selected images, we generated a DEM with a size of 500×500 pixels by SPC (as shown in Figure 31). The DEM has a grid spacing of 100 m. From the results, it can be seen that the DEM generated by SPC has a spatial resolution that is essentially the same as the original image, which indicates that the proposed method can provide good support for optimal image selection for SPC reconstruction.
In order to analyze the absolute elevation accuracy of the DEM generated by SPC, we compared the DEM generated by SPC with the officially provided DEM (referred to as the reference DEM). Specifically, we calculated the elevation values of sample points in the DEM generated by SPC and the reference DEM, and then we calculated the differences between them. The results are shown in Figure 32. It can be seen that the DEM generated by SPC is very consistent with the reference DEM. The RMSE values of the height difference is 61.16 meters, and the average error is 49.71 meters. Both are less than one pixel (65m/pixel).
4. Conclusions
In photogrammetric processing, accurately and efficiently determining the match pairs among massive images is a fundamental and crucial step, which is of great significance for generating high-precision planetary remote sensing mapping products. However, existing image match pair determination methods (e.g., USGS ISIS) in planetary mapping have problems such as low efficiency and limited adaptability. Specifically, in determining the image overlapping relationship for thousands of asteroid images, the USGS ISIS method will consume a lot of time or even fail to generate a valid image overlapping relationship file. This will result in the inability to conduct subsequent control network construction and bundle adjustment. Moreover, existing methods cannot handle low-resolution images containing invalid pixels that were acquired in the approach stage, since the footprint coordinates of the images are unable to be derived. Consequently, existing methods cannot meet the needs of processing large-scale, unordered asteroid remote sensing images. This paper proposes an efficient image match pair determination method based on KD tree fast search. The algorithm first calculates the three-dimensional space rectangular coordinates of the image center point. Then, it constructs a spatial KD tree data structure based on the three-dimensional space rectangular coordinates of each image center. Then, it quickly finds the image match pairs within the specified spatial range based on the fast search algorithm of the KD tree. Additionally, we also design a method to calculate the virtual image center for low-resolution images containing invalid pixels that are acquired in the approach stage. Based on the comprehensive experimental evaluation results, we draw the following conclusions:
(1) The proposed image match pair determination method is applicable to massive asteroid remote sensing images and has the advantages of high efficiency and accuracy;
(2) The proposed method can be used to determine the image match pairs for asteroid remote sensing images containing invalid pixels, for those images where ISIS software failed to calculate the image footprints coordinates and the image overlapping relationship;
(3) According to the image match pairs determined by the proposed method, it can effectively facilitate the selection of the optimal images for SPC reconstruction.
Additionally, the proposed method is not affected by factors such as image quality, illumination and observation conditions, latitude regions, etc. It calculates the distance of the valid image center point in the three-dimensional space. As a comparison, the USGS ISIS’s method (i.e., findimageoverlaps) needs to use the footprint polygon, which show limitations in high-latitude or polar regions due to the inaccurate or irregular polygon shape composed of two-dimensional footprint coordinates. When processing a large number of asteroid remote sensing images, the efficiency of the proposed method is two to three orders of magnitude higher than that of the corresponding module in ISIS software (i.e., findimageoverlaps).
However, the proposed method also has some shortcomings. First, this algorithm is more suitable for frame images and needs further optimization for long strip push-broom images such as the Lunar Reconnaissance Orbiter (LRO)’s narrow angle camera (NAC). Additionally, although ISIS software shows low efficiency in determining the image match pairs, its accuracy is relatively high due to the use of the footprint polygon. However, in actual engineering, due to the inaccuracy of the initial EO of images and initial shape model of the asteroid, there is still a certain error in the footprints’ polygon. Therefore, considering both accuracy and efficiency, the proposed method has high application value in practical engineering projects for the photogrammetric processing of massive asteroid remote sensing images.
Author Contributions
Zhang Jiujiang proposed the methodology and wrote the manuscript. Geng Xun contributed to improving the methodology and was the corresponding author. The other authors helped edit and improve the manuscript. All authors have read and agreed to the published version of the manuscript.
Funding
This research was funded by the Space Optoelectronic Measurement and Perception Lab, Beijing Institute of Control Engineering, grant number LabSOMP-2023-07, the National Natural Science Foundation of China, grant number 42241147; the State Key Laboratory of Geo-Information Engineering, grant number SKLGIE2021-Z-3-1; and the Open Program of Collaborative innovation Center of Geo-information, Technology for Smart Central Plains Henan Province, grant number 2023C002.
Data Availability Statement
The data presented in this study are available upon reasonable request from the corresponding author.
Acknowledgments
We thank the developers of the open-source planetary remote sensing image processing software (i.e., USGS ISIS 8.0.0 and NASA ASP 3.3.0). Special thanks also go to the OSIRIS-REx mission team for their efforts in acquiring and publicizing the Bennu asteroid images; the DAWN mission team for their efforts in acquiring and publicizing the Vesta asteroid images; the Hayabusa2 mission team for their efforts in acquiring and publicizing the Ryugu asteroid images.
Conflicts of Interest
The authors declare no conflicts of interest.
References
- Wei, T. Orbit Determination of the asteroid (469219) Kamoòalewa and its error analysis. Chin. Astron. Astrophys. 2021, 45, 402–411. [Google Scholar] [CrossRef]
- March, R.E. OSIRIS-REx: a NASA Asteroid Space Mission. Int. J. Mass Spectrometry. 2021, 469, 116677. [Google Scholar] [CrossRef]
- Yada, T.; Abe, M.; Okada, T.; Nakato, A.; Yogata, K.; Miyazaki, A.; Hatakeda, K.; Kumagai, K.; Nishimura, M.; Hitomi, Y.; et al. Preliminary analysis of the Hayabusa2 samples returned from C-type asteroid Ryugu. Nat. Astron. 2022, 6, 214–220. [Google Scholar] [CrossRef]
- Seabrook, J.A.; Daly, M.G.; Barnouin, O.S.; Palmer, E.E.; Gaskell, R.W.; Nair, H.; Lauretta, D.S. Building a high-resolution digital terrain model of Bennu from laser altimetry data. Planet. Sci. J. 2022, 3, 265. [Google Scholar] [CrossRef]
- Bennett, C.A.; DellaGiustina, D.N.; Becker, K.J.; Becker, T.L.; Edmundson, K.L.; Golish, D.R.; Bennett, R.J.; Burke, K.N.; Cue, C.N.U.; Clark, B.E.; et al. A high-resolution global basemap of (101955) Bennu. Icarus. 2021, 357, 113690. [Google Scholar] [CrossRef]
- Lauretta, D.S.; Balram-Knutson, S.S.; Beshore, E.; Boynton, W.V.; et al. OSIRIS-Rex: sample return from asteroid (101955) Bennu. Space Sci. Rev. 2017, 212, 925–984. [Google Scholar] [CrossRef]
- Russell, C.T.; Raymond, C.A. The dawn mission to Vesta and Ceres. Space Sci Rev. 2011, 163, 3–23. [Google Scholar] [CrossRef]
- Barnouin, O.S.; Daly, M.G.; Palmer, E.E.; Johnson, C.L.; Gaskell, R.W.; Al Asad, M.; Bierhaus, E.B.; Craft, K.L.; Ernst, C.M.; Espiritu, R.C.; et al. Digital terrain mapping by the OSIRIS-Rex mission. Planet. Space Sci. 2020, 180, 104764. [Google Scholar] [CrossRef]
- Preusker, F.; Scholten, F.; Elgner, S.; Matz, K.-D.; Kameda, S.; Roatsch, T.; Jaumann, R.; Sugita, S.; Honda, R.; Morota, T.; et al. The MASCOT landing area on asteroid (162173) Ryugu: stereo-photogrammetric analysis using images of the ONC onboard the Hayabusa2 spacecraft. Astron. Astrophys. 2019, 632, L4. [Google Scholar] [CrossRef]
- Roatsch, Th.; Kersten, E.; Matz, K.-D.; Preusker, F.; Scholten, F.; Jaumann, R.; Raymond, C.A.; Russell, C.T. High resolution Vesta high altitude mapping orbit (HAMO) atlas derived from dawn framing camera images. Planet. Space Sci. 2012, 73, 283–286. [Google Scholar] [CrossRef]
- Roatsch, Th.; Kersten, E.; Matz, K.-D.; Preusker, F.; Scholten, F.; Elgner, S.; Jaumann, R.; Raymond, C.A.; Russell, C.T. High resolution Vesta low altitude mapping orbit atlas derived from dawn framing camera images. Planet. Space Sci. 2013, 85, 293–298. [Google Scholar] [CrossRef]
- DellaGiustina, D.N.; Bennett, C.A.; Becker, K.; Golish, D.R.; Le Corre, L. Overcoming the challenges associated with image-based mapping of small bodies in preparation for the OSIRIS-Rex mission to (101955) Bennu. Earth. Space Sci. 2018, 5, 929–949. [Google Scholar] [CrossRef]
- Edmundson, K.L.; Becker, K.J.; Becker, T.L.; Bennett, C.A.; DellaGiustina, D.N.; Golish, D.R.; Porter, N.A.; Rizk, B.; Drouet d’Aubigny, C.; Daly, M.G.; et al. Photogrammetric processing of Osiris-Rex images of asteroid (101955) Bennu. ISPRS Ann. Photogramm. Remote Sens. Spat. Inf. Sci. 2020, V-3–2020, 587–594. [Google Scholar] [CrossRef]
- Scholten, F.; Preusker, F.; Elgner, S.; Matz, K.-D.; Jaumann, R.; Hamm, M.; Schröder, S.E.; Koncz, A.; Schmitz, N.; et al. The Hayabusa2 lander MASCOT on the surface of asteroid (162173) Ryugu: Stereo-photogrammetric analysis of MAS-Cam image data. Astron. & Astrophysics. 2019, 632, L5. [Google Scholar] [CrossRef]
- Kirk, R.L.; Archinal, B.A.; Gaddis, L.R.; Rosiek, M.R. Lunar cartography: progress in the 2000s and prospects for the 2010s. Int. Arch. Photogramm. Remote Sens. Spat. Inf. Sci. 2012, 39-B4, 489–494. [Google Scholar] [CrossRef]
- Robbins, S.J.; Kirchoff, M.R.; Hoover, R.H. Fully controlled 6 meters per pixel mosaic of Mars’s south polar region. Earth. Space Sci. 2020, 7, e2019EA001054. [Google Scholar] [CrossRef]
- Geng, X.; Xu, Q.; Wang, J.; Lan, C.; Qin, F.; Xing, S. Generation of large-scale orthophoto mosaics using MEX HRSC images for the candidate landing regions of China's first Mars mission. IEEE Trans. Geosci. Remote Sens. 2022, 60, 1–20. [Google Scholar] [CrossRef]
- Robbins, S.J.; Kirchoff, M.R.; Hoover, R.H. Fully controlled 6 meters per pixel equatorial mosaic of Mars from Mars reconnaissance orbiter context camera images, Version 1. Earth. Space Sci. 2023, 10, e2022EA002443. [Google Scholar] [CrossRef]
- Liang, Y.B.; Li, D.Q.; Feng, C.Y.; Mao, J.; Cui, T.J. Efficient match pair selection for matching large-scale oblique UAV images using spatial priors. Int. J. Remote Sens. 2021, 42, 8878–8905. [Google Scholar] [CrossRef]
- Jiang, S.; Jiang, W.S. Efficient match pair selection for oblique UAV images based on adaptive vocabulary tree. ISPRS J. Photogramm. Remote Sens. 2020, 161, 61–75. [Google Scholar] [CrossRef]
- Jiang, S.; Ma, Y.C.; Liu, J.H.; Li, Q.Q.; Jiang, W.S.; Guo, B.X.; Li, LL. .; Wang, LZ. Efficient match pair retrieval for large-scale UAV images via graph indexed global descriptor. IEEE J. Sel. Top. Appl. Earth Obs. Remote Sens. 2023, 16, 9874–9887. [Google Scholar] [CrossRef]
- Rupnik, E.; Nex, F.; Remon Dino, F. Automatic orientation of large blocks of oblique images. Int. Arch. Photogramm. Remote Sens. Spat. Inf. Sci. 2013, 40-1, 299–304. [Google Scholar] [CrossRef]
- Chen, X.Y.L. , Läbe, T., Milioto, A., Röhling, T., Vysotska, O., Haag, A., Behley, J., Stachniss, C. OverlapNet: Loop closing for LiDAR-based SLAM. Auton. Robots. 2020. [Google Scholar] [CrossRef]
- Chen, X.Y.L.; Läbe, T.; Milioto, A.; Röhling, T.; Behley, J.; Stachniss, C. OverlapNet: A siamese network for computing LiDAR scan similarity with applications to loop closing and localization. Auton. Robots. 2022, 46. [Google Scholar] [CrossRef]
- Edmundson, K.L.; Cook, D.A.; Thomas, O.H.; Archinal, B.A.; Kirk, R.L. Jigsaw: The ISIS3 bundle adjustment for extraterrestrial photogrammetry. ISPRS Ann. Photogramm. Remote Sens. Spat. Inf. Sci. 2012, 1, 203–208. [Google Scholar] [CrossRef]
- Beyer, R.A.; Alexandrov, O.; McMichael, S. The Ames Stereo Pipeline: NASA’s open-source software for deriving and processing terrain data. Earth. Space Sci. 2018, 5, 537–548. [Google Scholar] [CrossRef]
- Shean, D.E.; Alexandrov, O.; Moratto, Z.M.; Smith, B.E.; Joughin, I.R.; Porter, C.; Morin, P. An Automated, Open-source pipeline for mass production of digital elevation models (DEMs) from very-high-resolution commercial stereo satellite imagery. ISPRS J. Photogramm. Remote Sens. 2016, 116, 101–117. [Google Scholar] [CrossRef]
- Palmer, E.E.; Gaskell, R.; Daly, M.G.; Barnouin, O.S.; Adam, C.D.; Lauretta, D.S. Practical Stereophotoclinometry for modeling shape and topography on planetary missions. Planet. Sci. J. 2022, 3, 102. [Google Scholar] [CrossRef]
- Silpa-Anan, C.; Hartley, R. Optimised KD trees for fast image descriptor matching. Proc. IEEE Int. Conf. Image Process. 2010; IEEE: Anchorage, AK, USA, June 2008; pp. 1–8.
- Huang, K.-Y.; Tsai, Y.-M.; Tsai, C.-C.; Chen, L.-G. Video stabilization for vehicular applications using SURF-like descriptor and KD tree. Proc. IEEE Int. Conf. Image Process. 2010; September 2010; pp. 3517–3520.
- Muja, M.; Lowe, D.G. Scalable nearest neighbor algorithms for high dimensional data. IEEE Trans. Pattern Anal. Mach. In tell. 2014, 36, 2227–2240. [Google Scholar] [CrossRef]
- Tiwari, V. Developments in KD tree and KNN searches. Int. J. Computer. Appl. 2023, 185, 17–23. [Google Scholar] [CrossRef]
- Behley, J.; Steinhage, V.; Cremers, A.B. Efficient radius neighbor search in three-dimensional point clouds. Proc. - IEEE Int. Conf. Robot. Autom.; May 2015; pp. 3625–3630.
- Chen, X.Y.; Güttel, S. Fast and exact fixed-radius neighbor search based on sorting. Peer J Computer. Sci. 2024, 10:1929. [CrossRef]
- Brown, R.A. Building a balanced KD tree in o (kn log n) time. J. Computer. Graph. Tech. 2015, 4(2): 50-68.
- Al Asad, M.M.; Philpott, L.C.; Johnson, C.L.; Barnouin, O.S.; Palmer, E.; Weirich, J.R.; Daly, M.G.; Perry, M.E.; Gaskell, R.; Bierhaus, E.B.; et al. Validation of Stereophotoclinometric shape models of asteroid (101955) Bennu during the OSIRIS-Rex mission. Planet. Sci. J. 2021, 2, 82. [Google Scholar] [CrossRef]
- Gaskell, R.W.; Barnouin, O.S.; Daly, M.G.; Palmer, E.E.; Weirich, J.R.; Ernst, C.M.; Daly, R.T.; Lauretta, D.S. Stereophotoclinometry on the OSIRIS-Rex mission: mathematics and methods. Planet. Sci. J. 2023, 4, 63. [Google Scholar] [CrossRef]
- Adam, C.D.; McCarthy, L.K.; Leonard, J.M.; Gaskell, R.; Antreasian, P.G.; Liounis, A.J.; Getzandanner, K.; Moreau, M.C.; Palmer, E.E.; Weirich, J.; et al. Stereophotoclinometry for OSIRIS-Rex spacecraft navigation. Planet. Sci. J. 2023, 4, 167. [Google Scholar] [CrossRef]
- Weirich, J.; Palmer, E.E.; Daly, M.G.; Barnouin, O.S.; Getzandanner, K.; Kidd, J.N.; Adam, C.D.; Gaskell, R.; Lauretta, D.S. Quality assessment of Stereophotoclinometry as a shape modeling method using a synthetic asteroid. Planet. Sci. J. 2022, 3, 103. [Google Scholar] [CrossRef]
- Liu, W.C.; Wu, B. Influence of solar incidence angle on single-image photoclinometry for precision lunar topographic mapping. ISPRS J. Photogramm. Remote Sens. 2021, 182, 208–227. [Google Scholar] [CrossRef]
Figure 1.
Flowchart of the R range search process based on KD tree structure.
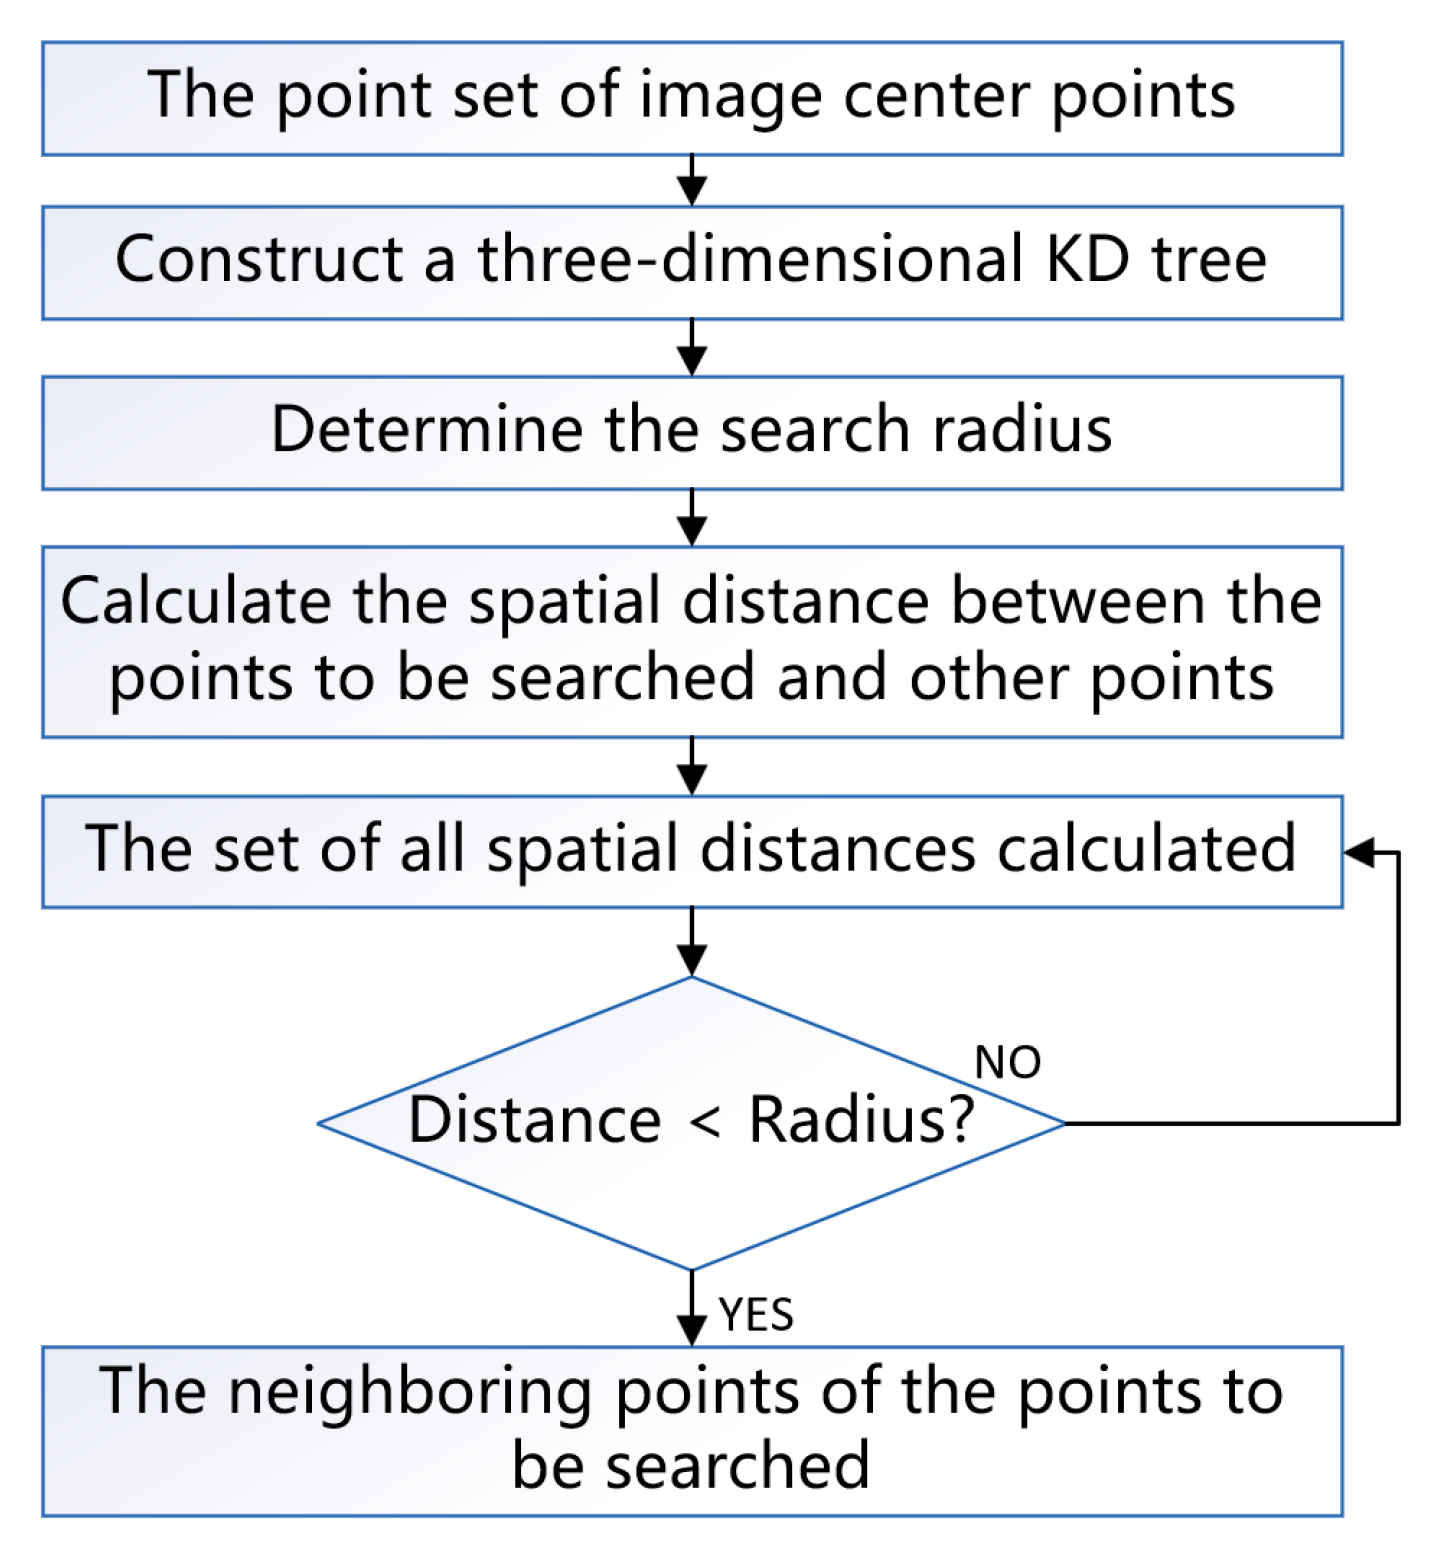
Figure 2.
Display diagram of normal asteroid remote sensing images. (a) The raw images of Bennu and (b) Vesta.
Figure 2.
Display diagram of normal asteroid remote sensing images. (a) The raw images of Bennu and (b) Vesta.
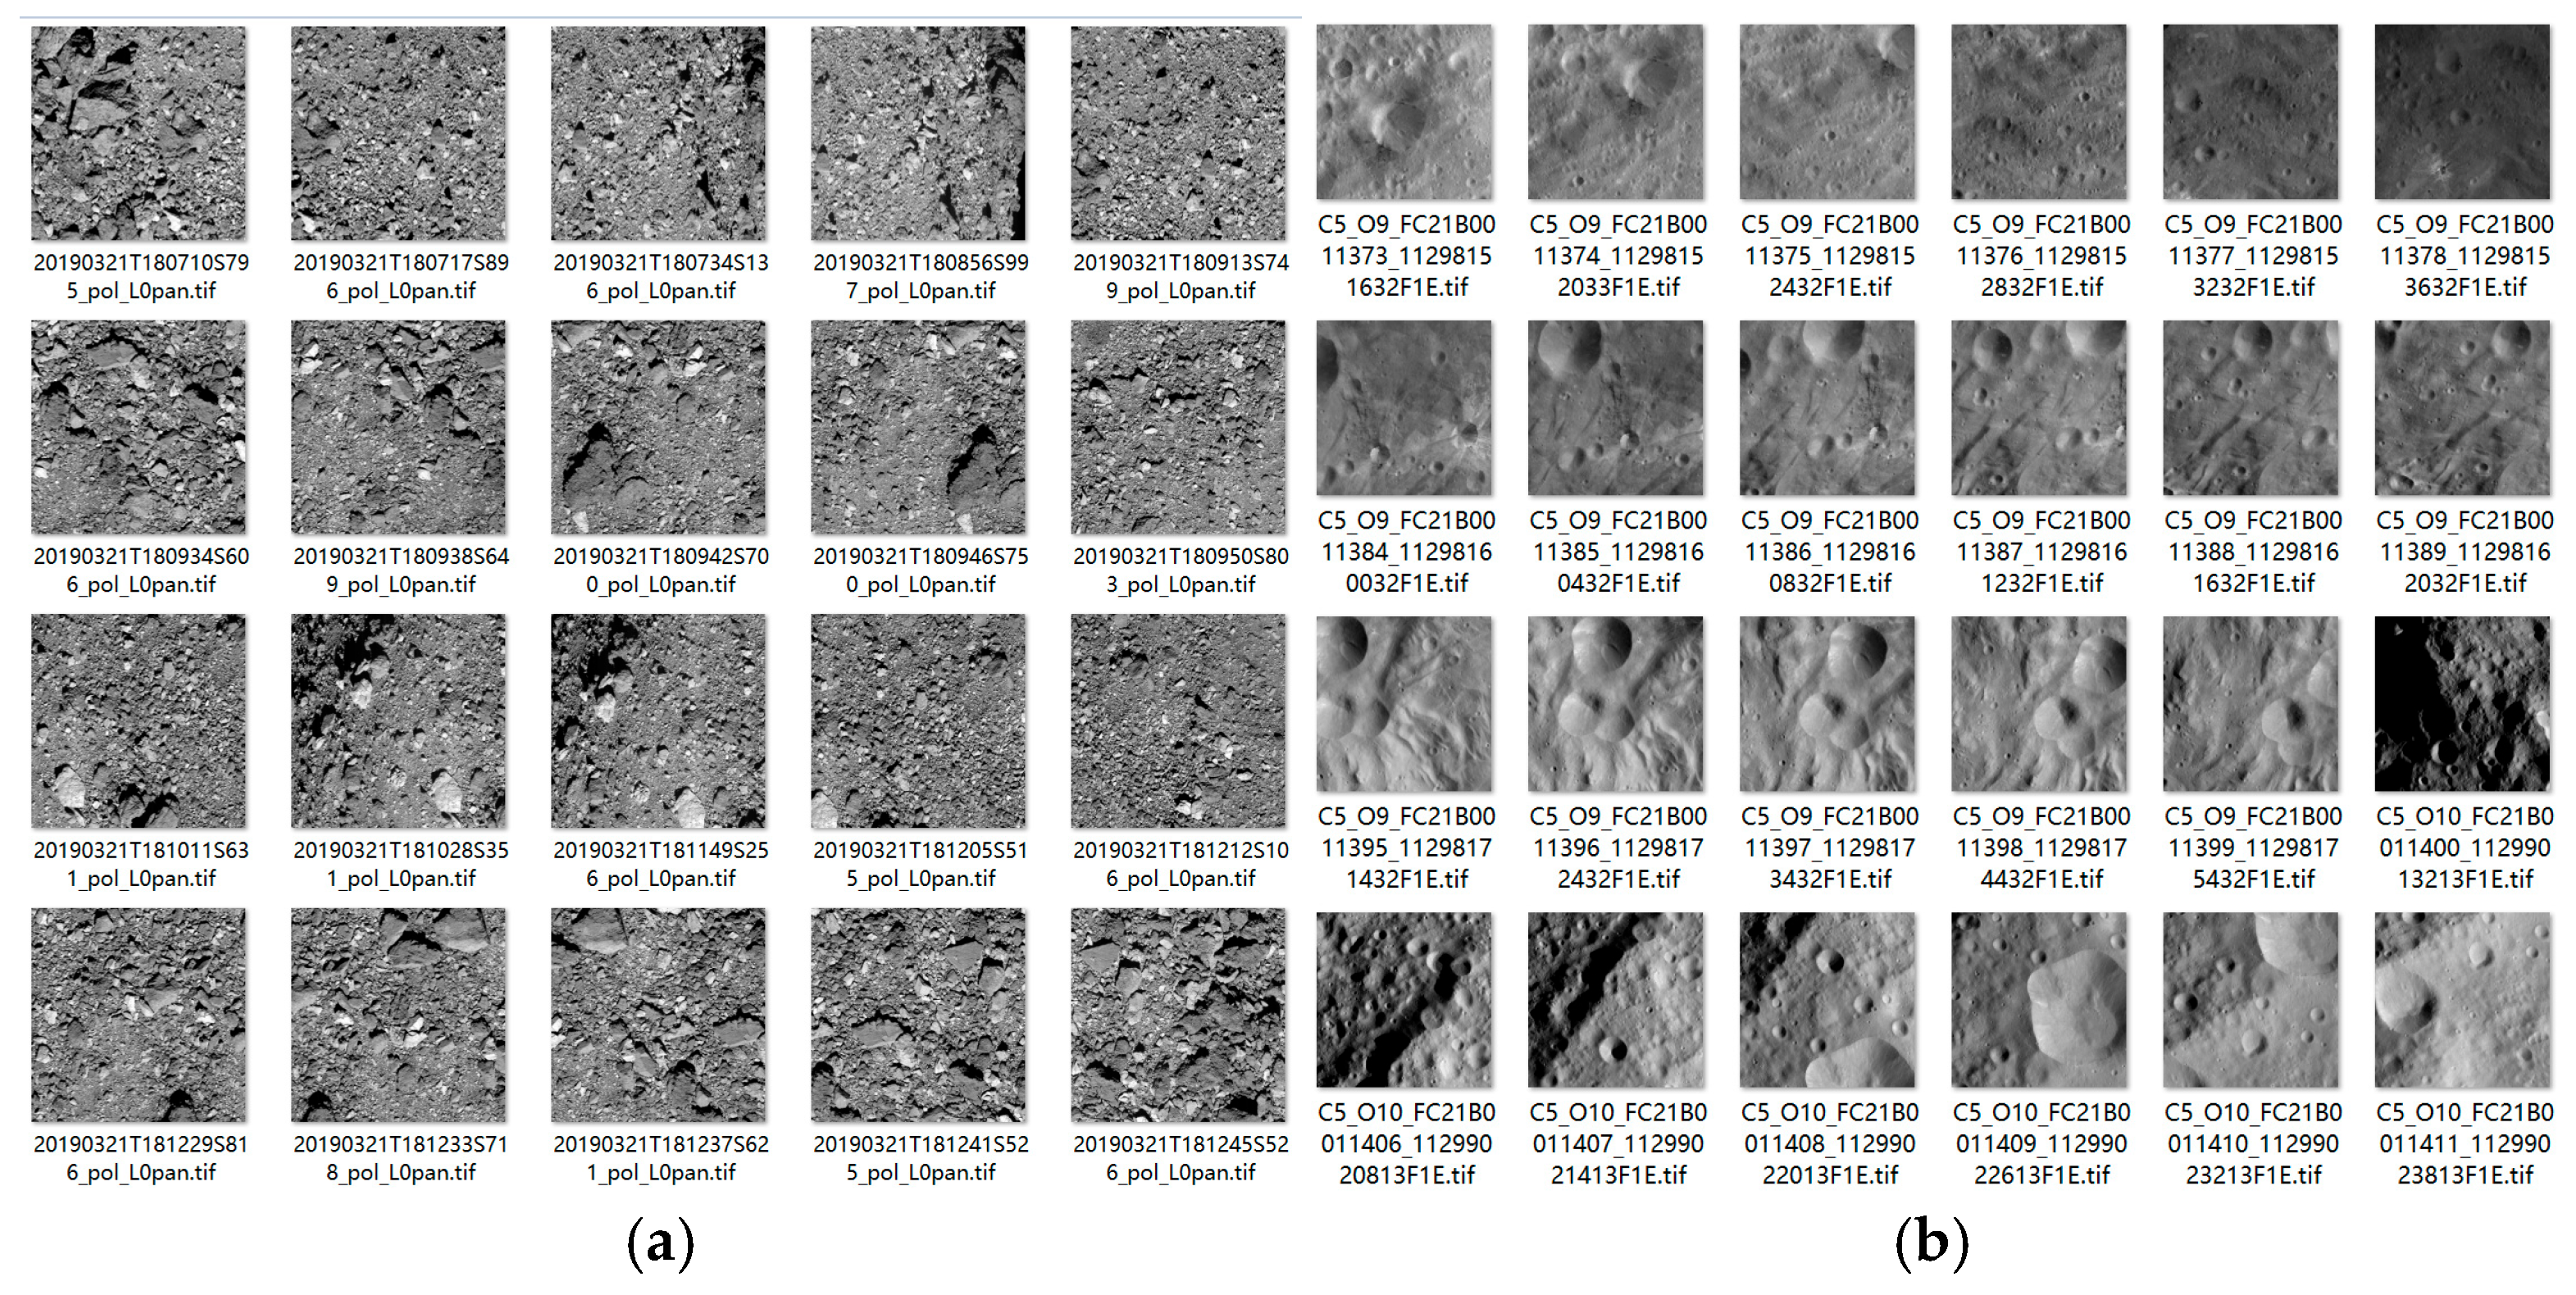
Figure 3.
Flowchart for determining the center point of the image.
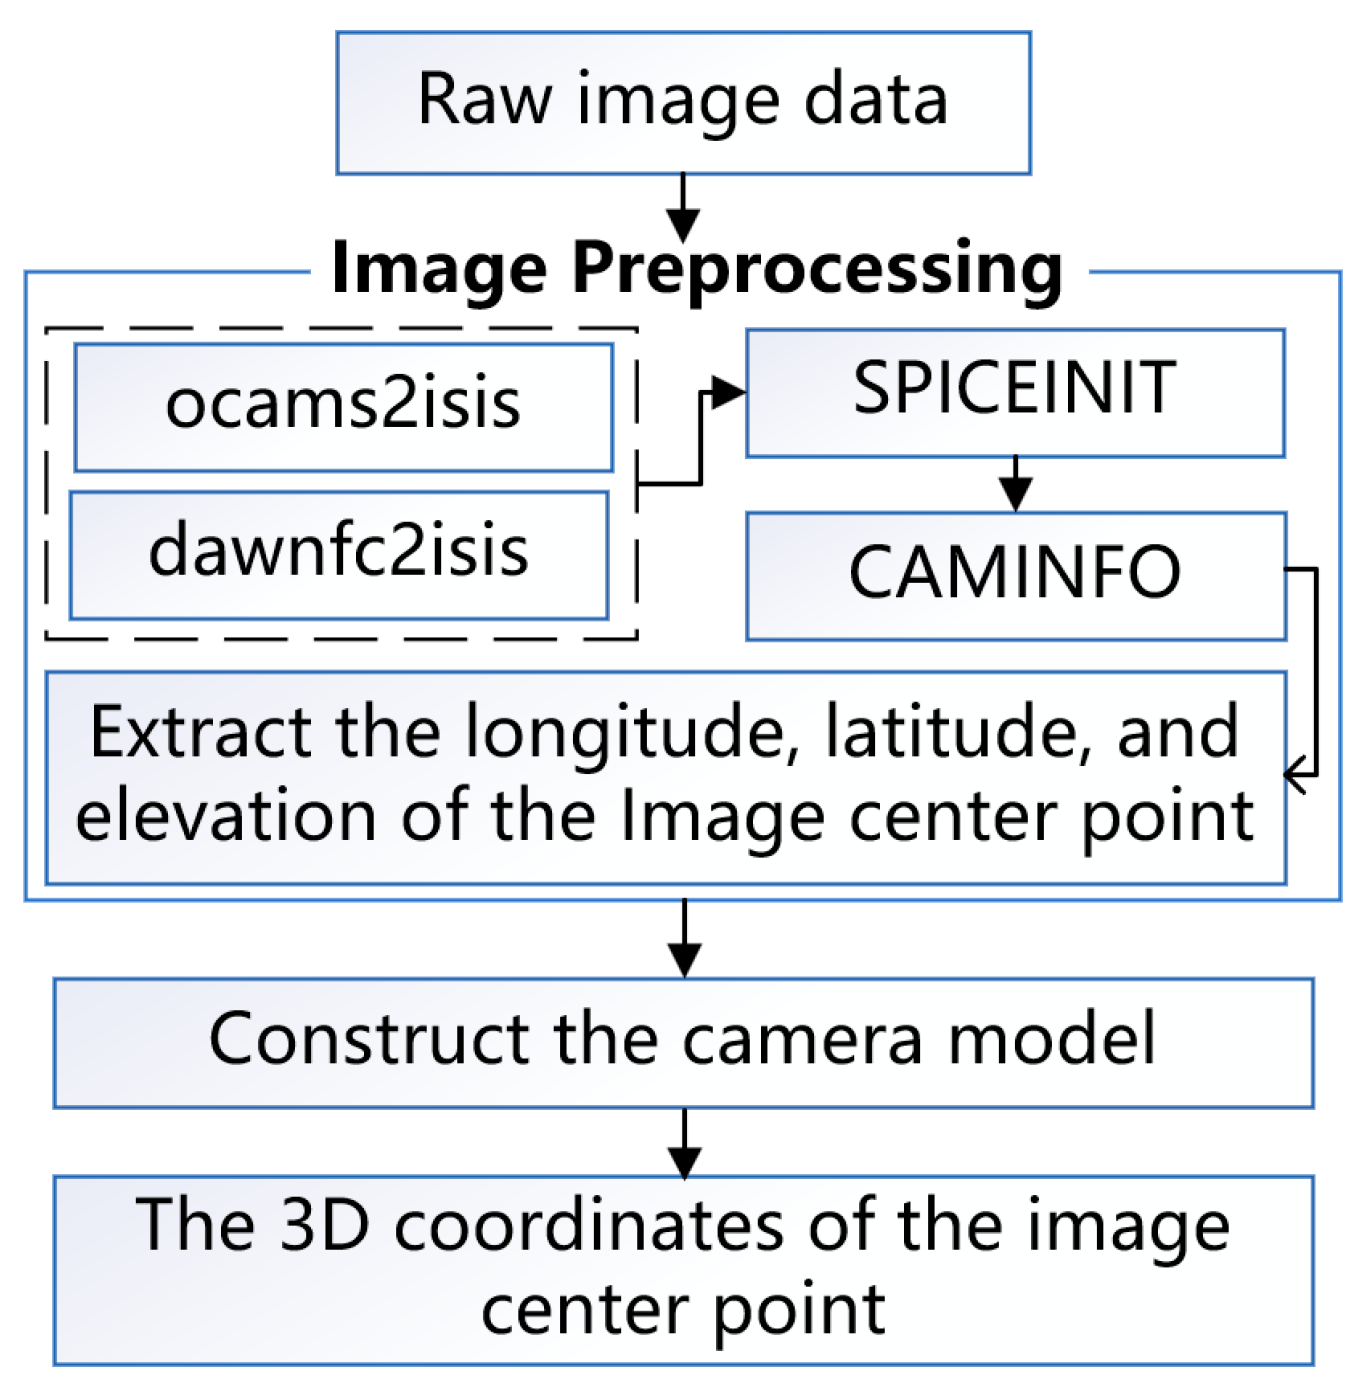
Figure 4.
Effective pixel sampling process diagram (red points are effective sampling points, the green circle is the center of the image, and the blue triangle is the valid pixel center of the image). (a) Sampling maps of Bennu and (b) Ryugu images.
Figure 4.
Effective pixel sampling process diagram (red points are effective sampling points, the green circle is the center of the image, and the blue triangle is the valid pixel center of the image). (a) Sampling maps of Bennu and (b) Ryugu images.
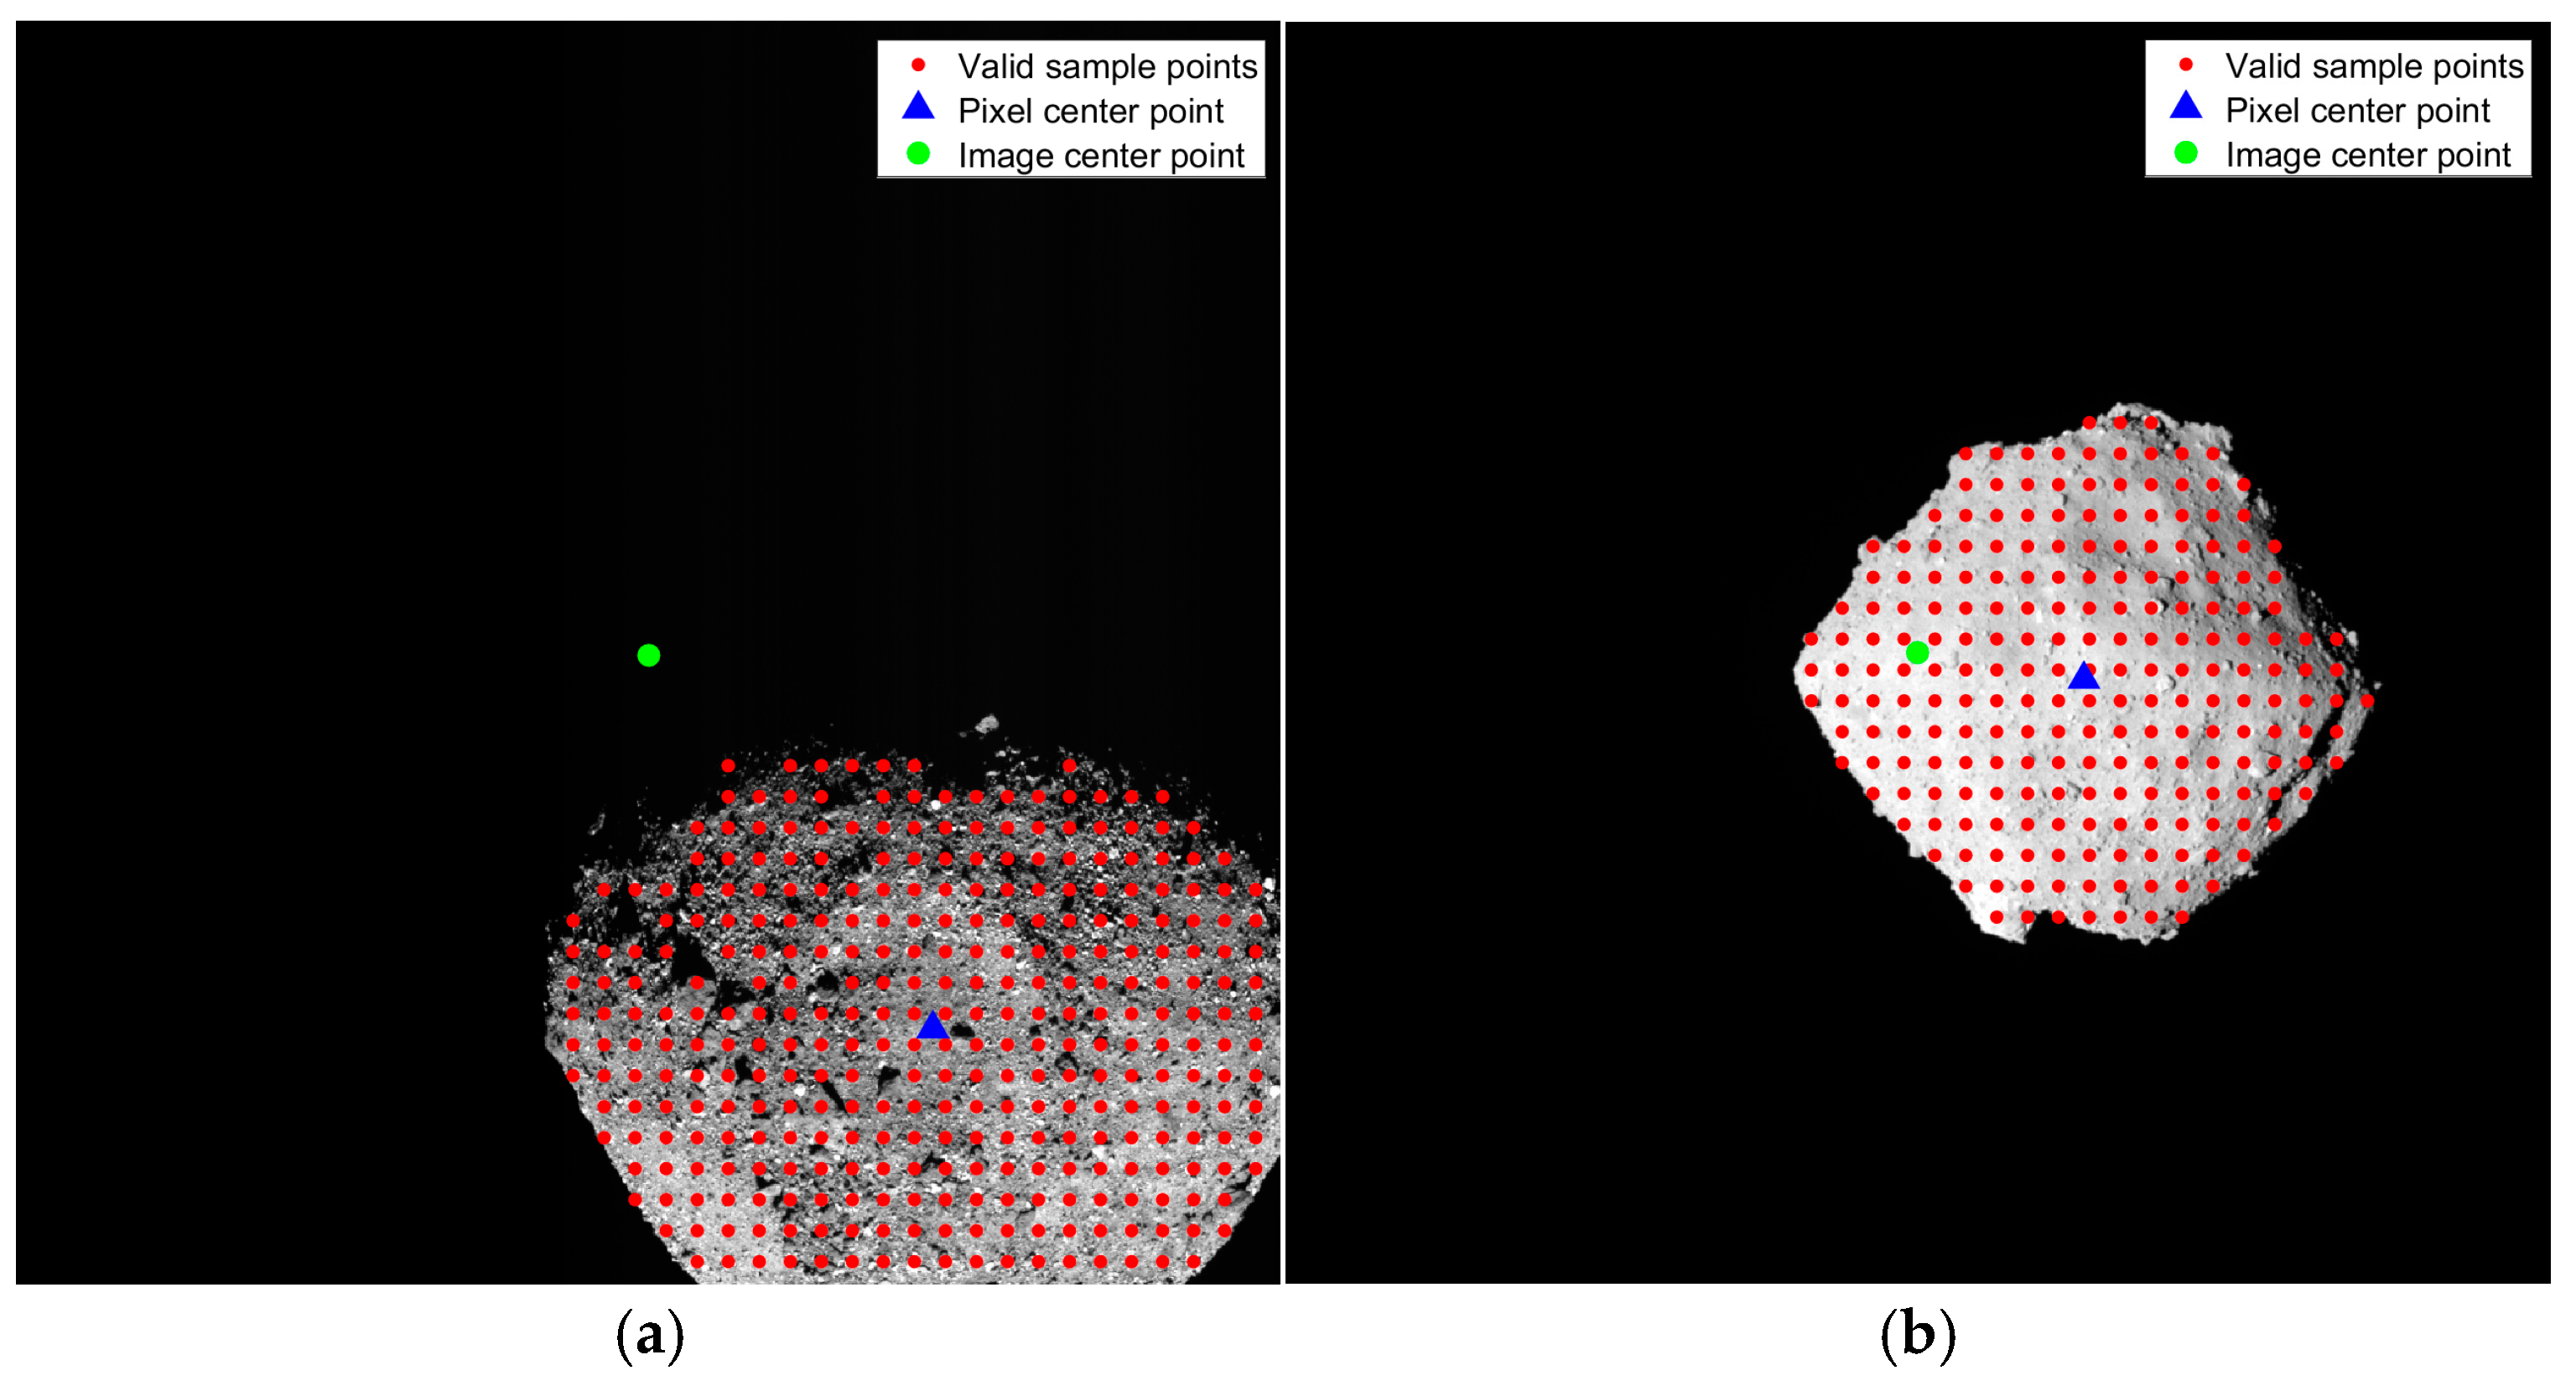
Figure 5.
Schematic diagram of the ray intersection of sampling point method.
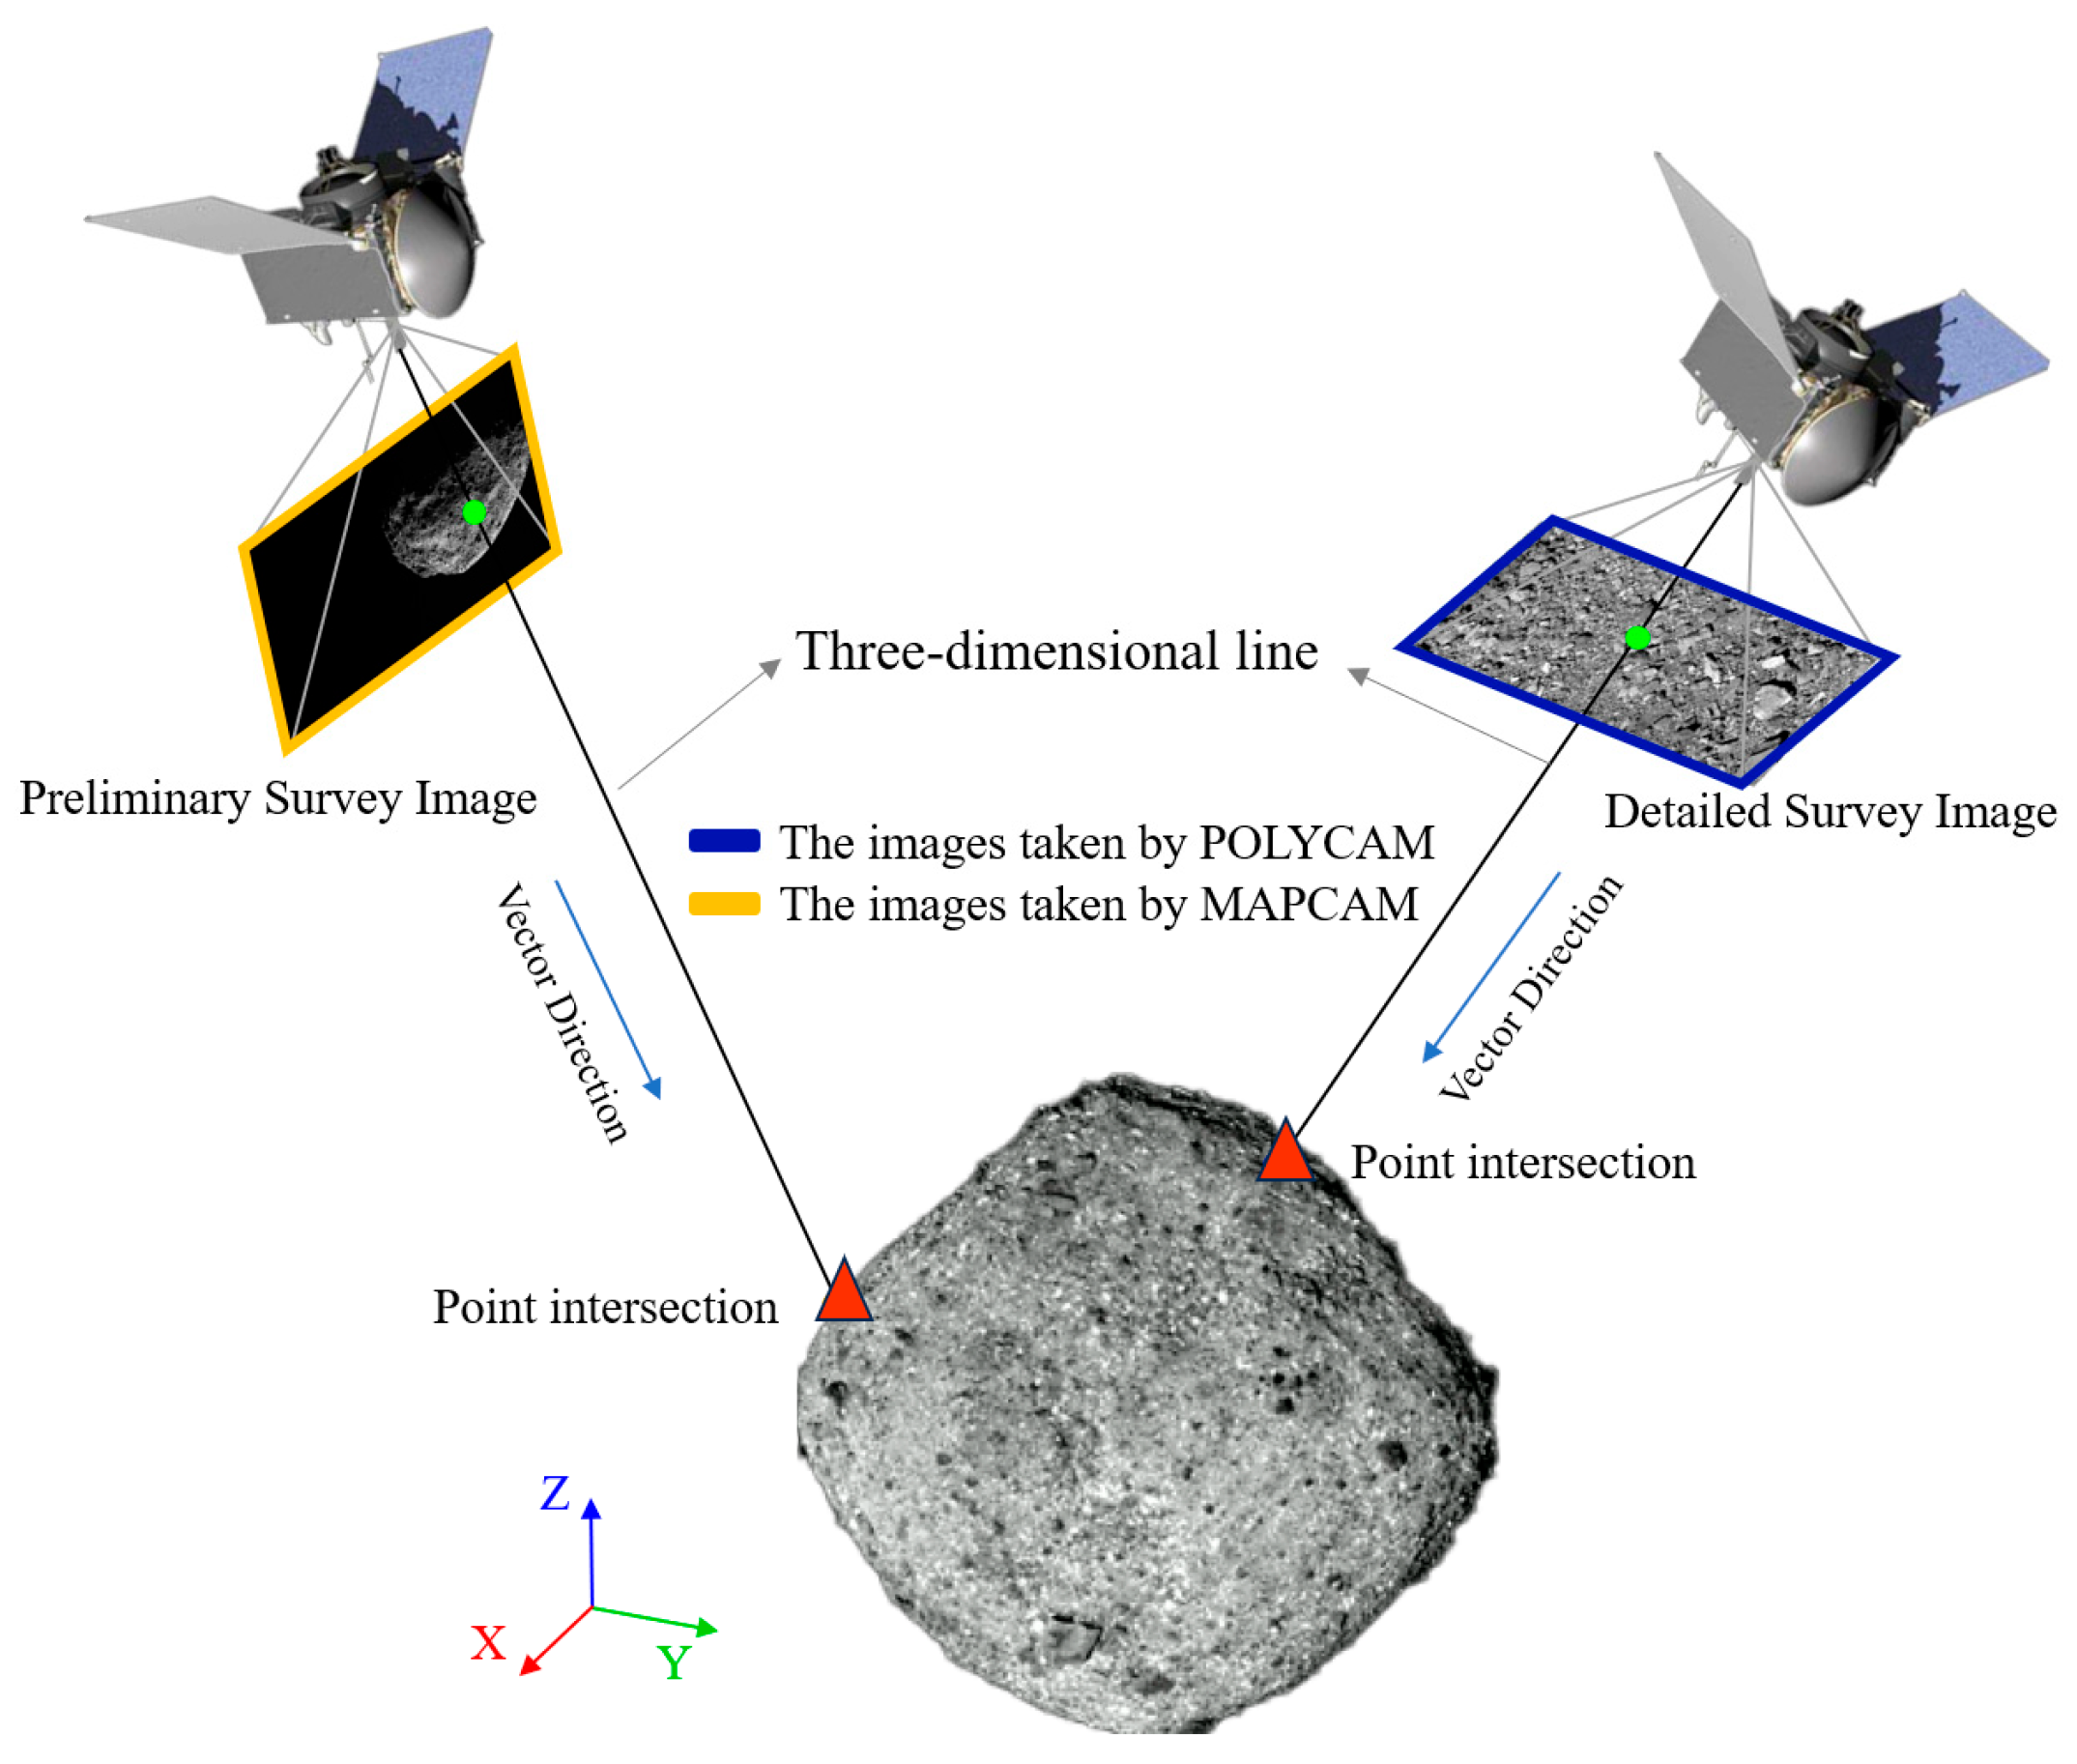
Figure 6.
Flowchart of the ray intersection of sampling point method.
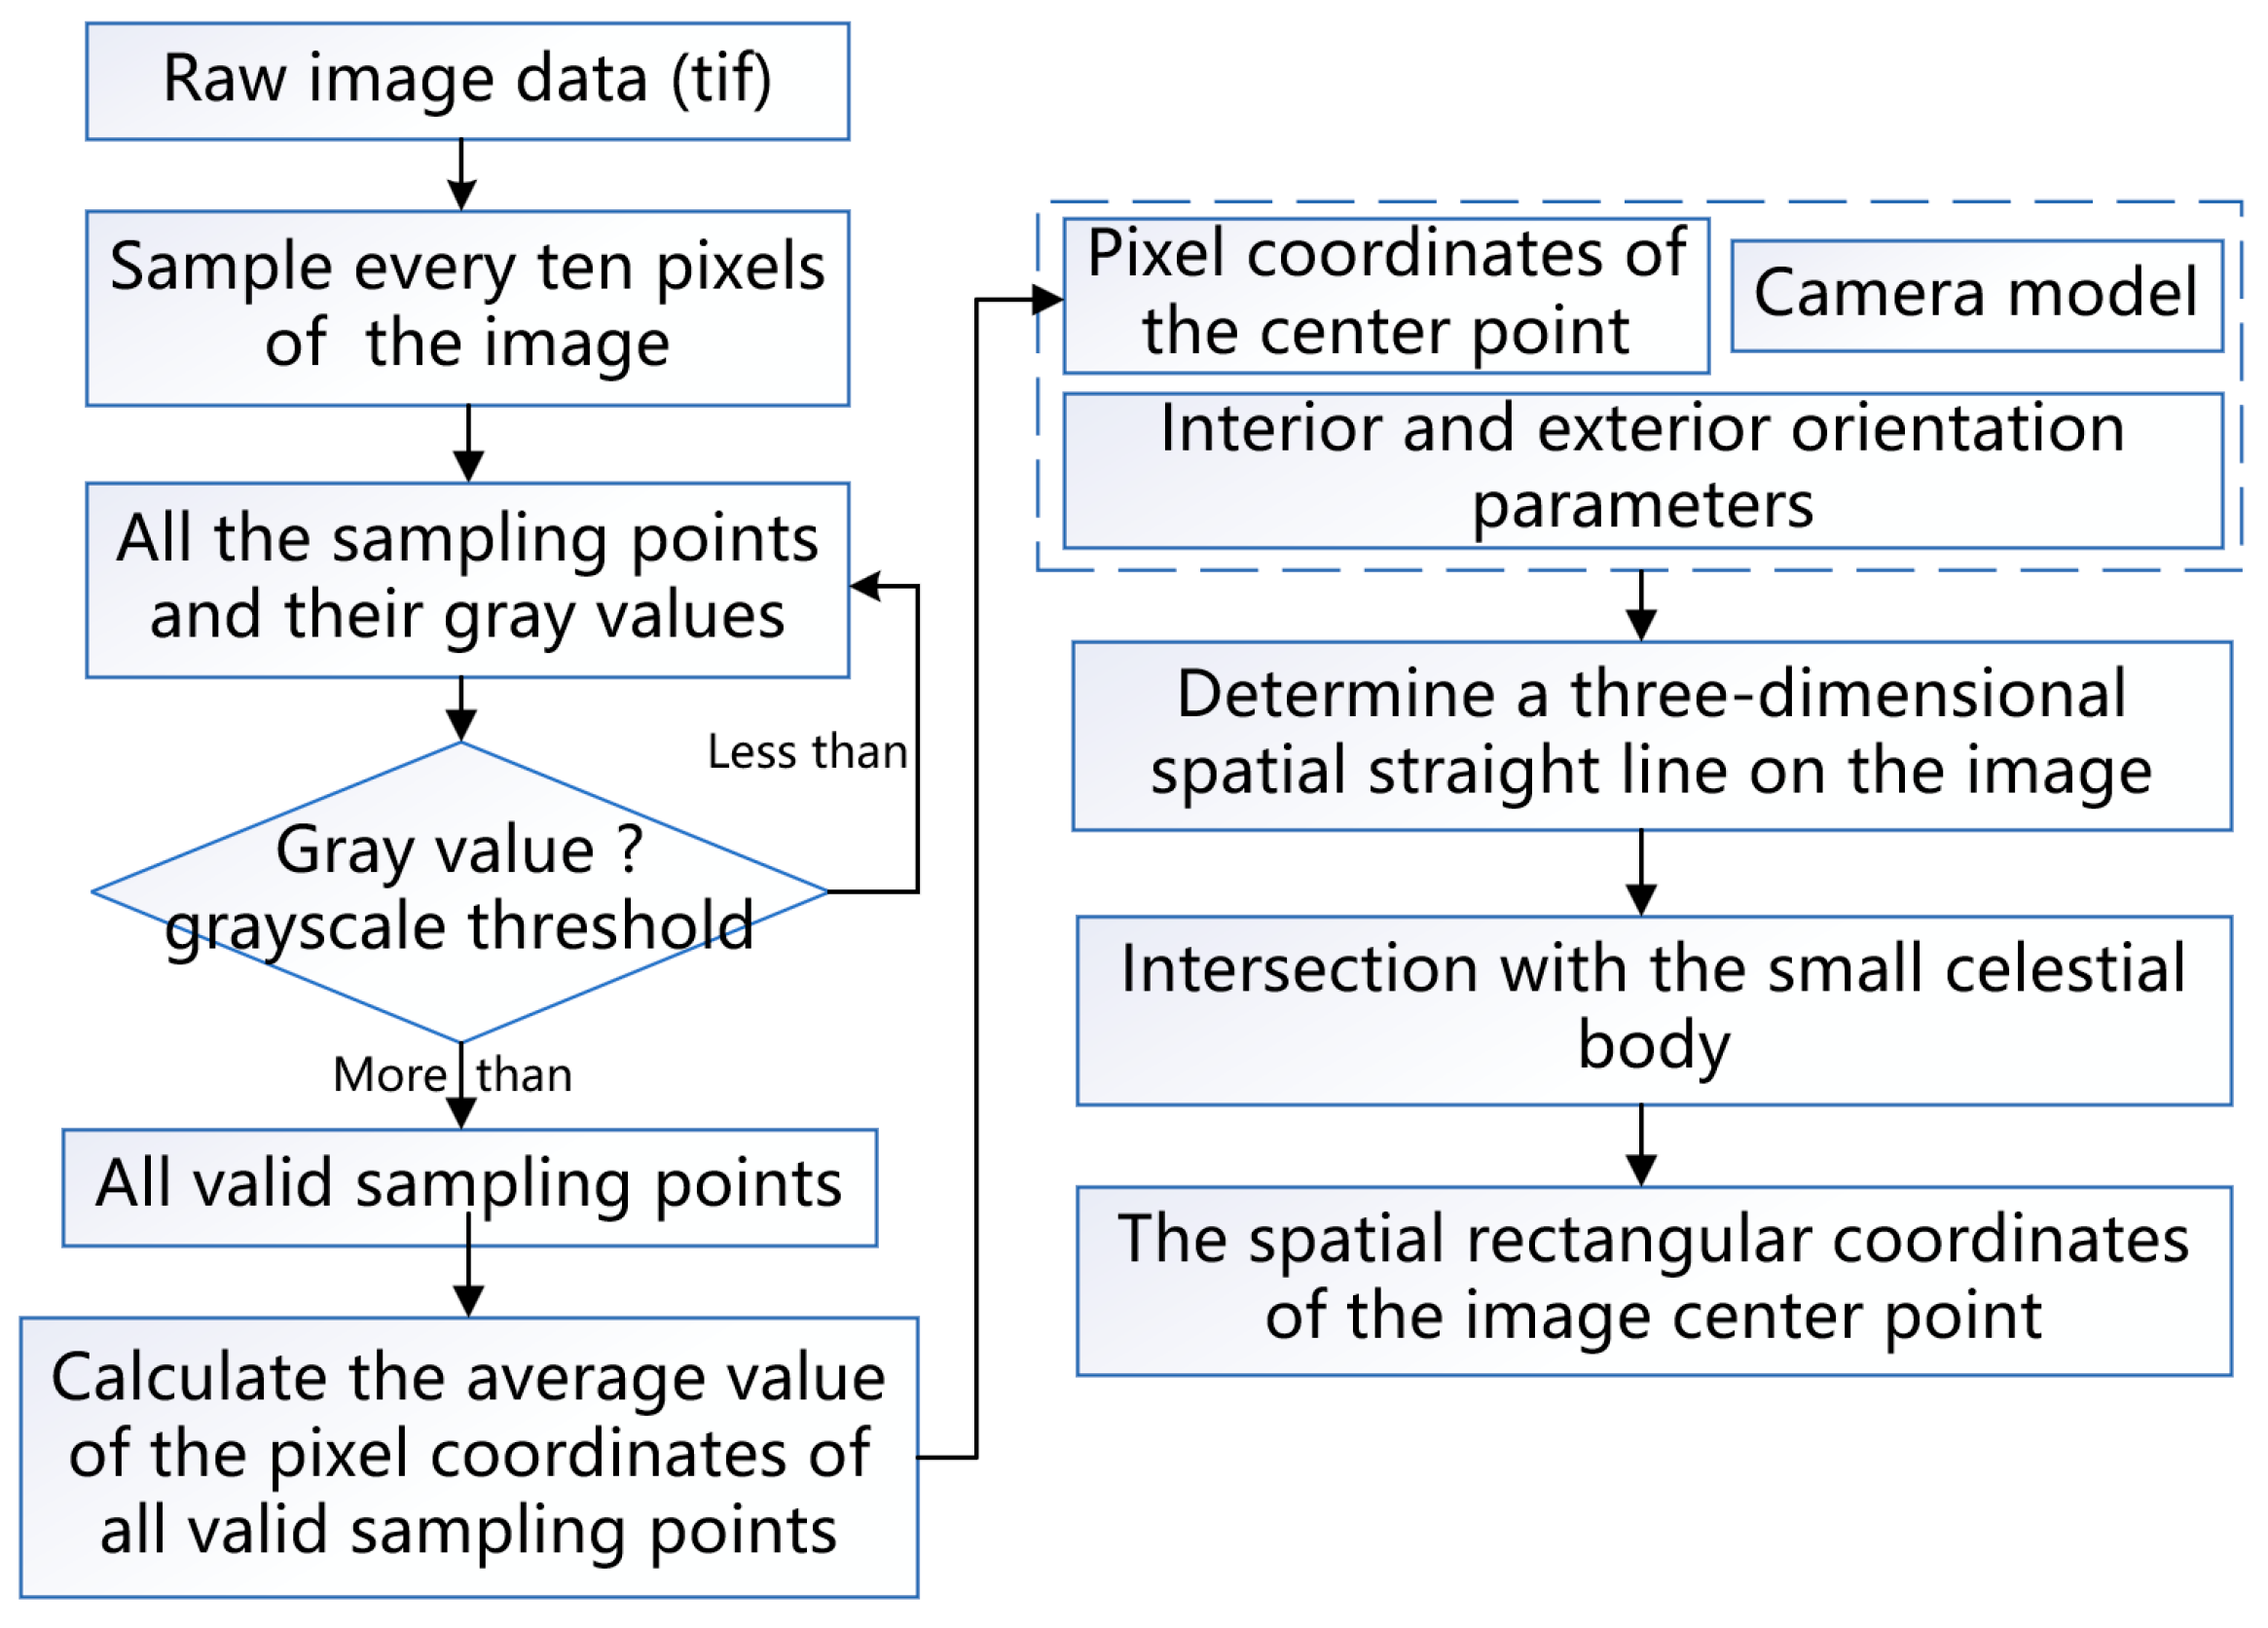
Figure 7.
Diagram for determining the image match pairs using USGS ISIS’s software tool findimageoverlaps. (a) The DOM images of Vesta; (b) the footprint coordinates of these images (the dots represent the foot points).
Figure 7.
Diagram for determining the image match pairs using USGS ISIS’s software tool findimageoverlaps. (a) The DOM images of Vesta; (b) the footprint coordinates of these images (the dots represent the foot points).
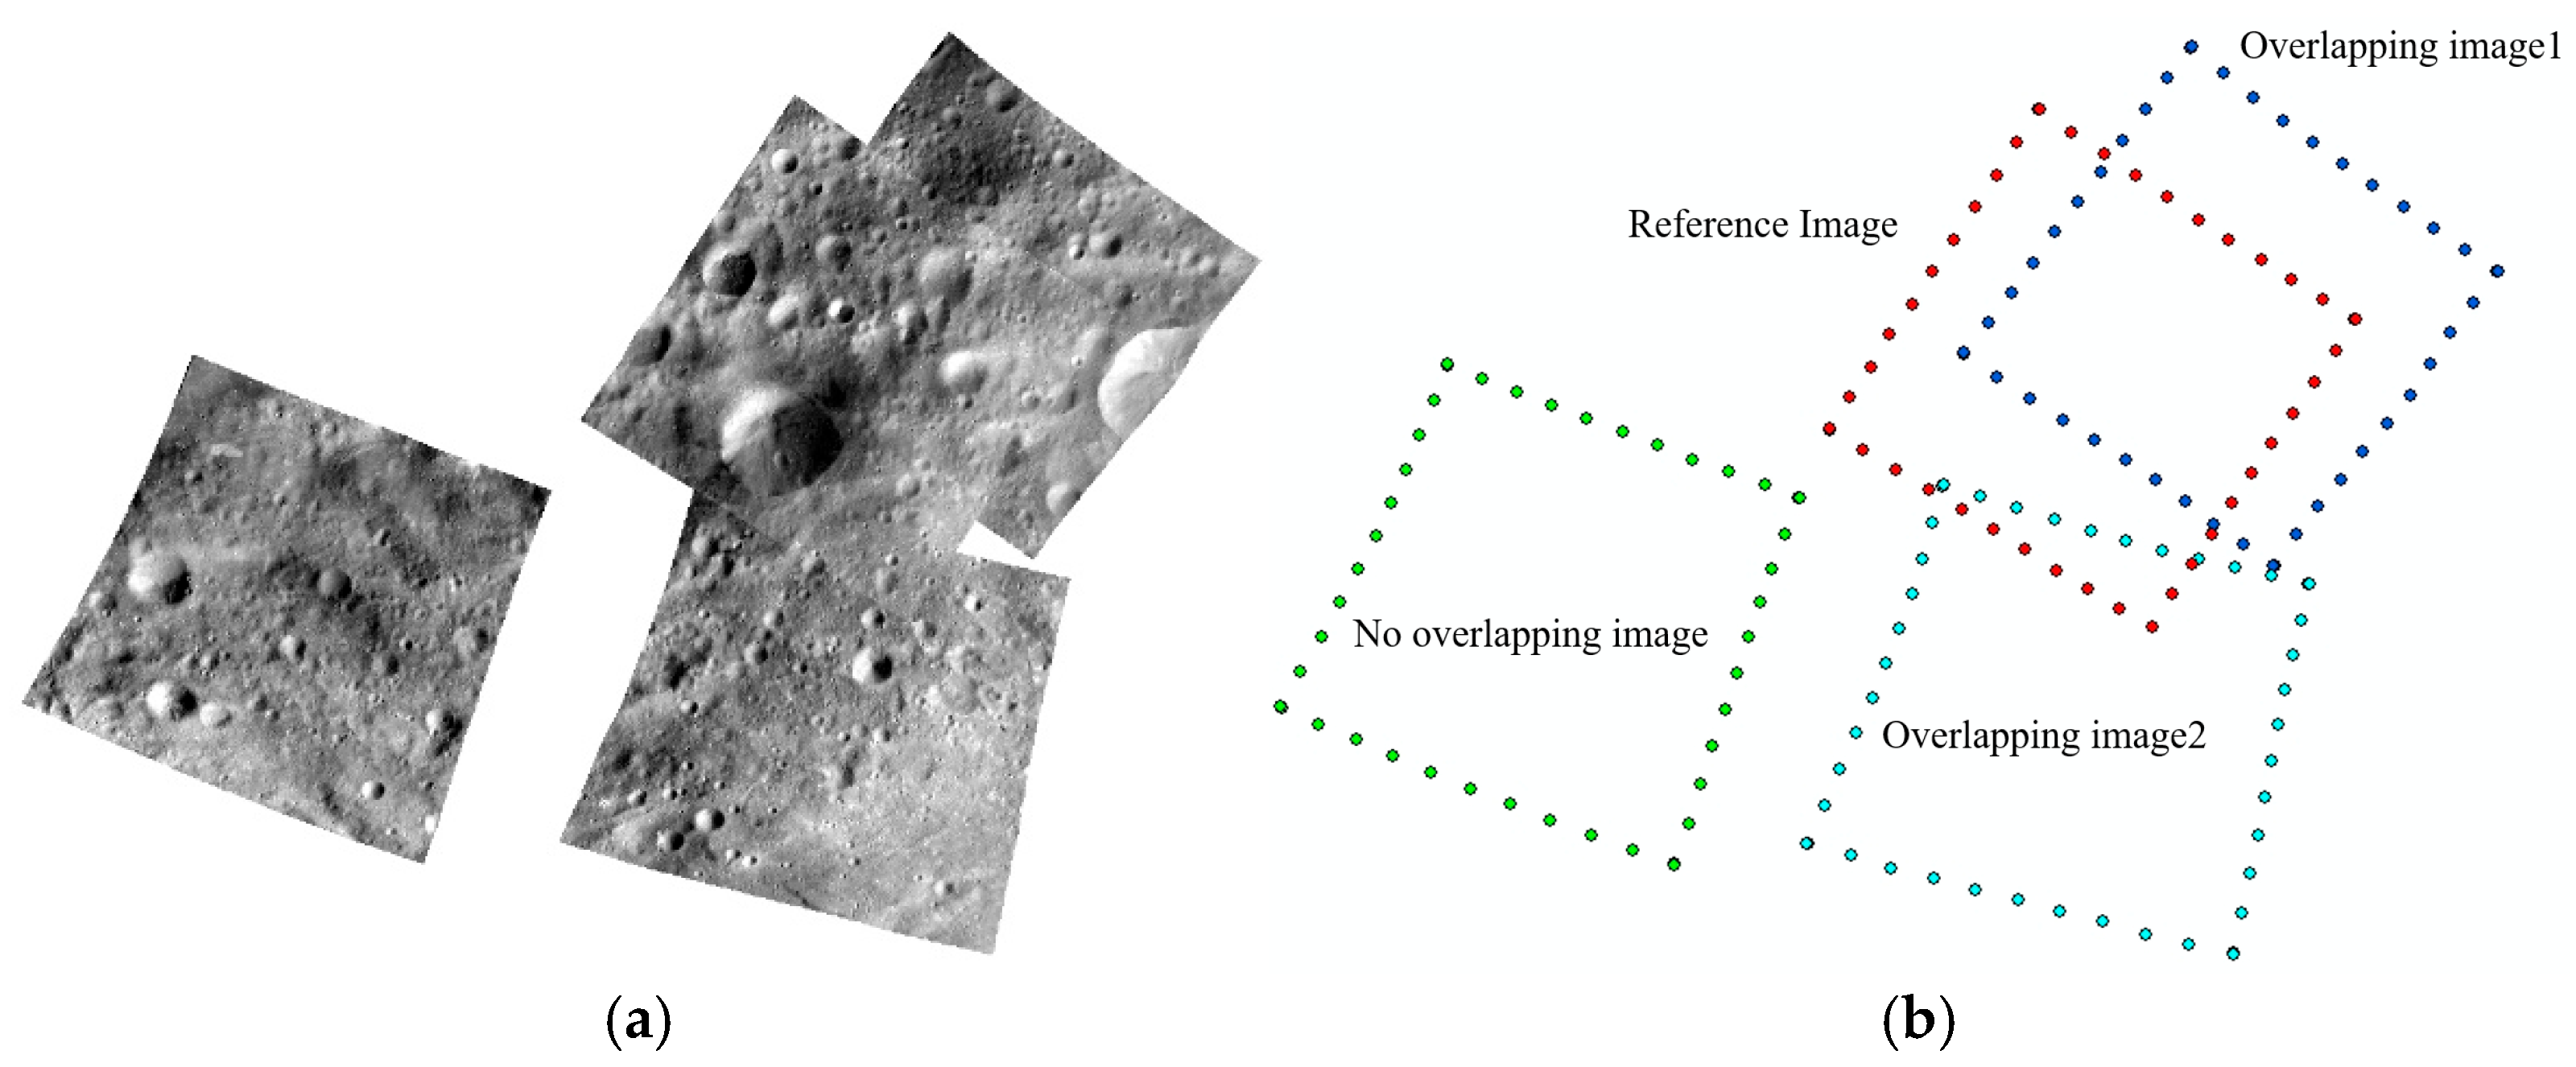
Figure 8.
The images of Vesta at different latitudes. (a) Raw images at different latitudes; (b) the DOM corresponding to the raw images; (c) comparison of the number of image footprints at different latitudes.
Figure 8.
The images of Vesta at different latitudes. (a) Raw images at different latitudes; (b) the DOM corresponding to the raw images; (c) comparison of the number of image footprints at different latitudes.
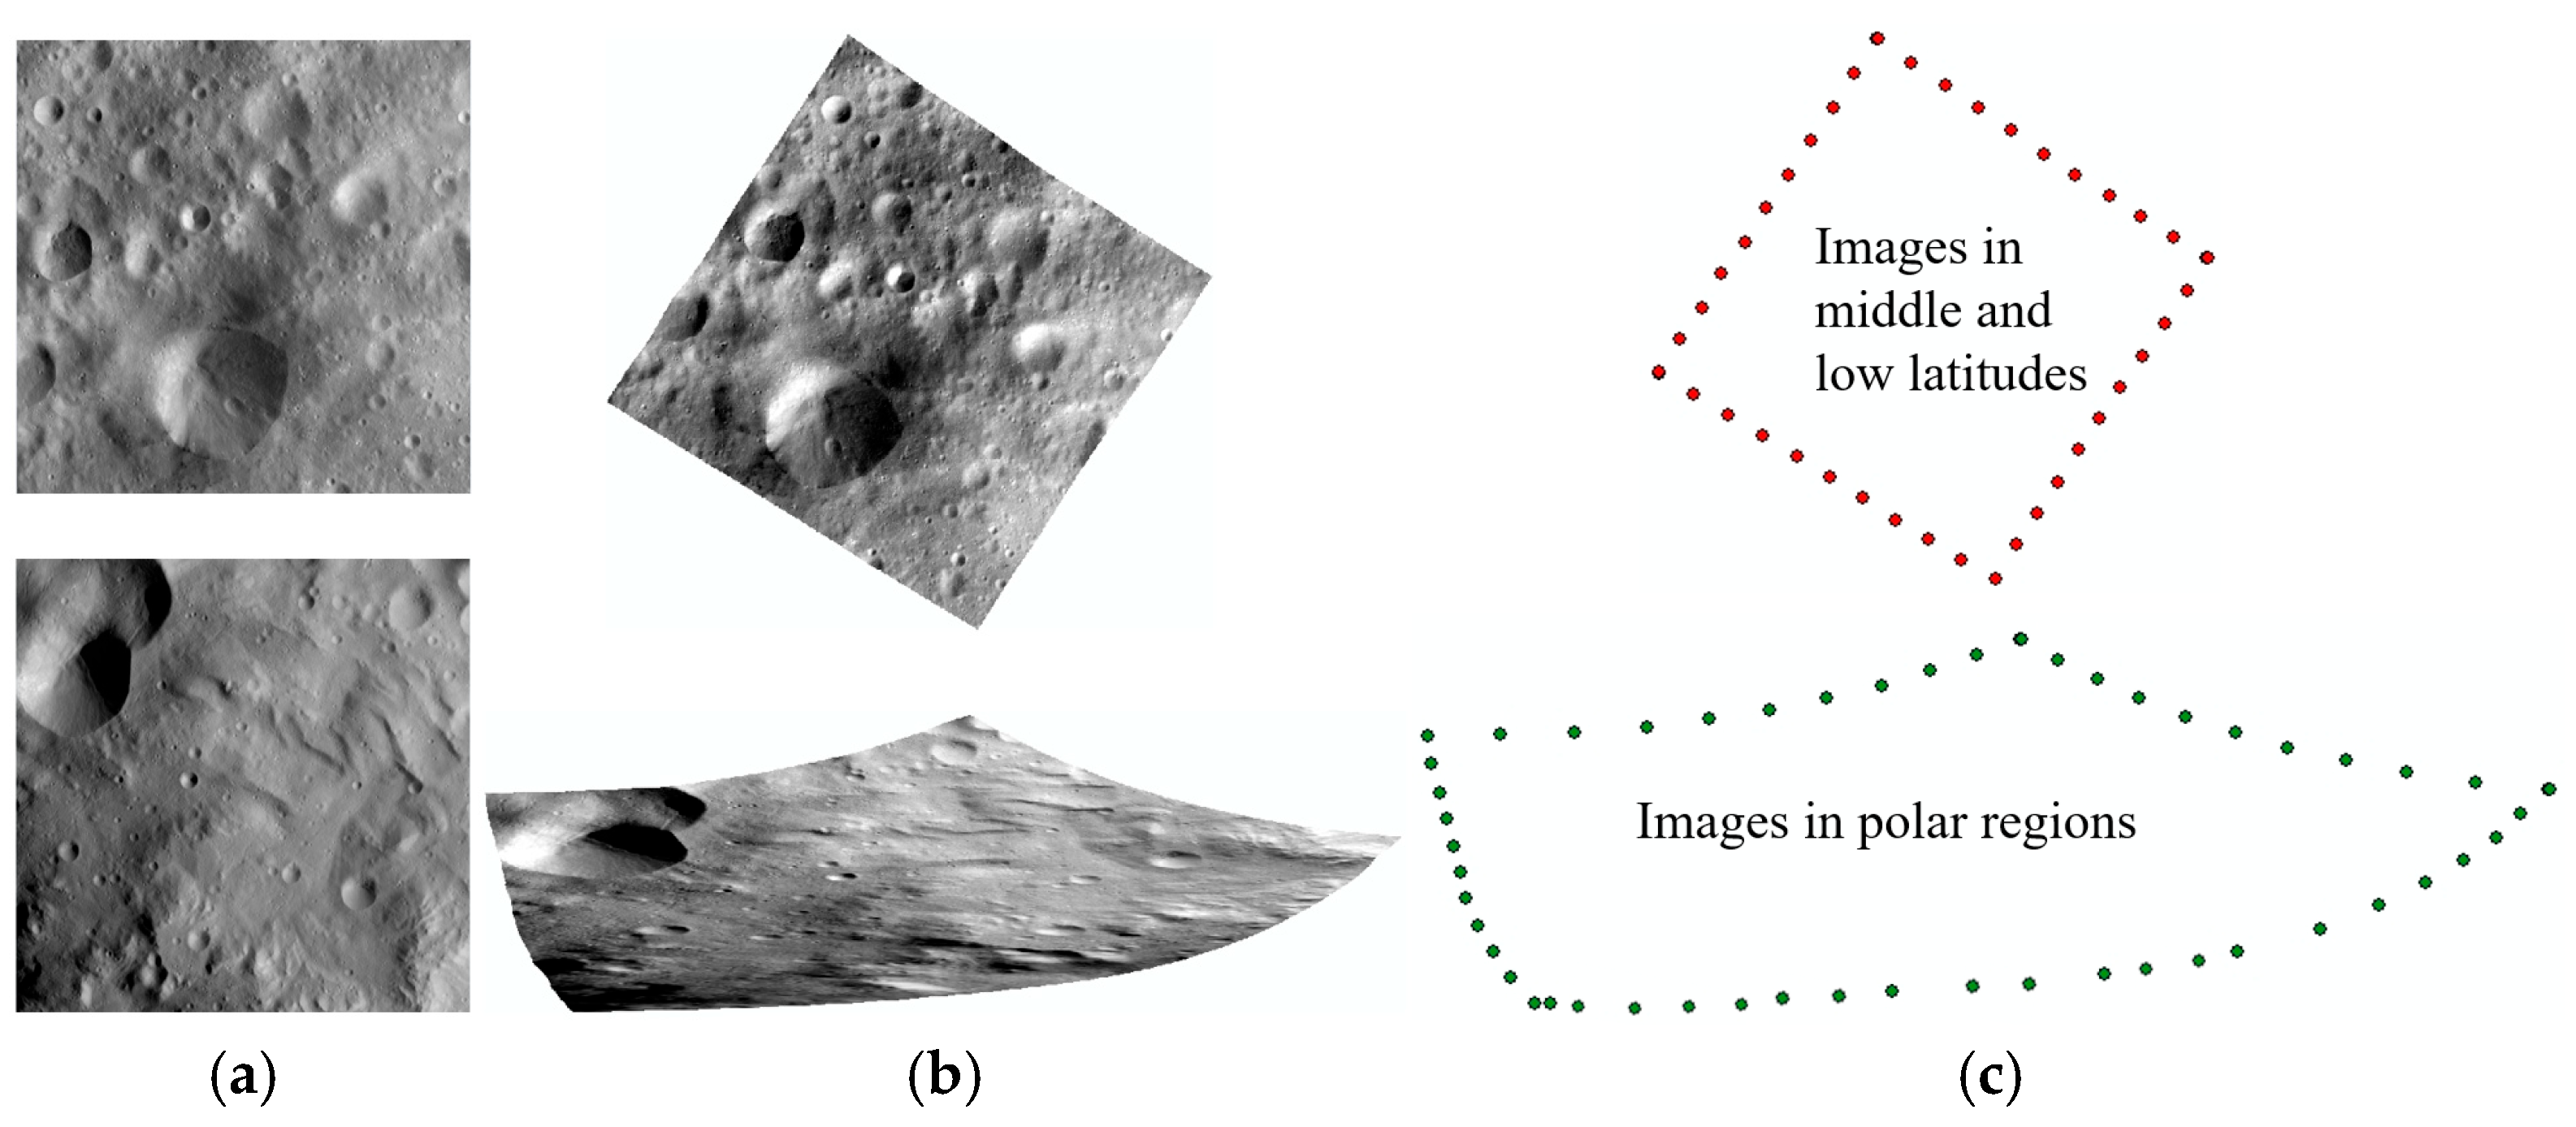
Figure 10.
Comparison of the determined image match pairs for Vesta images in the HAMO phase.
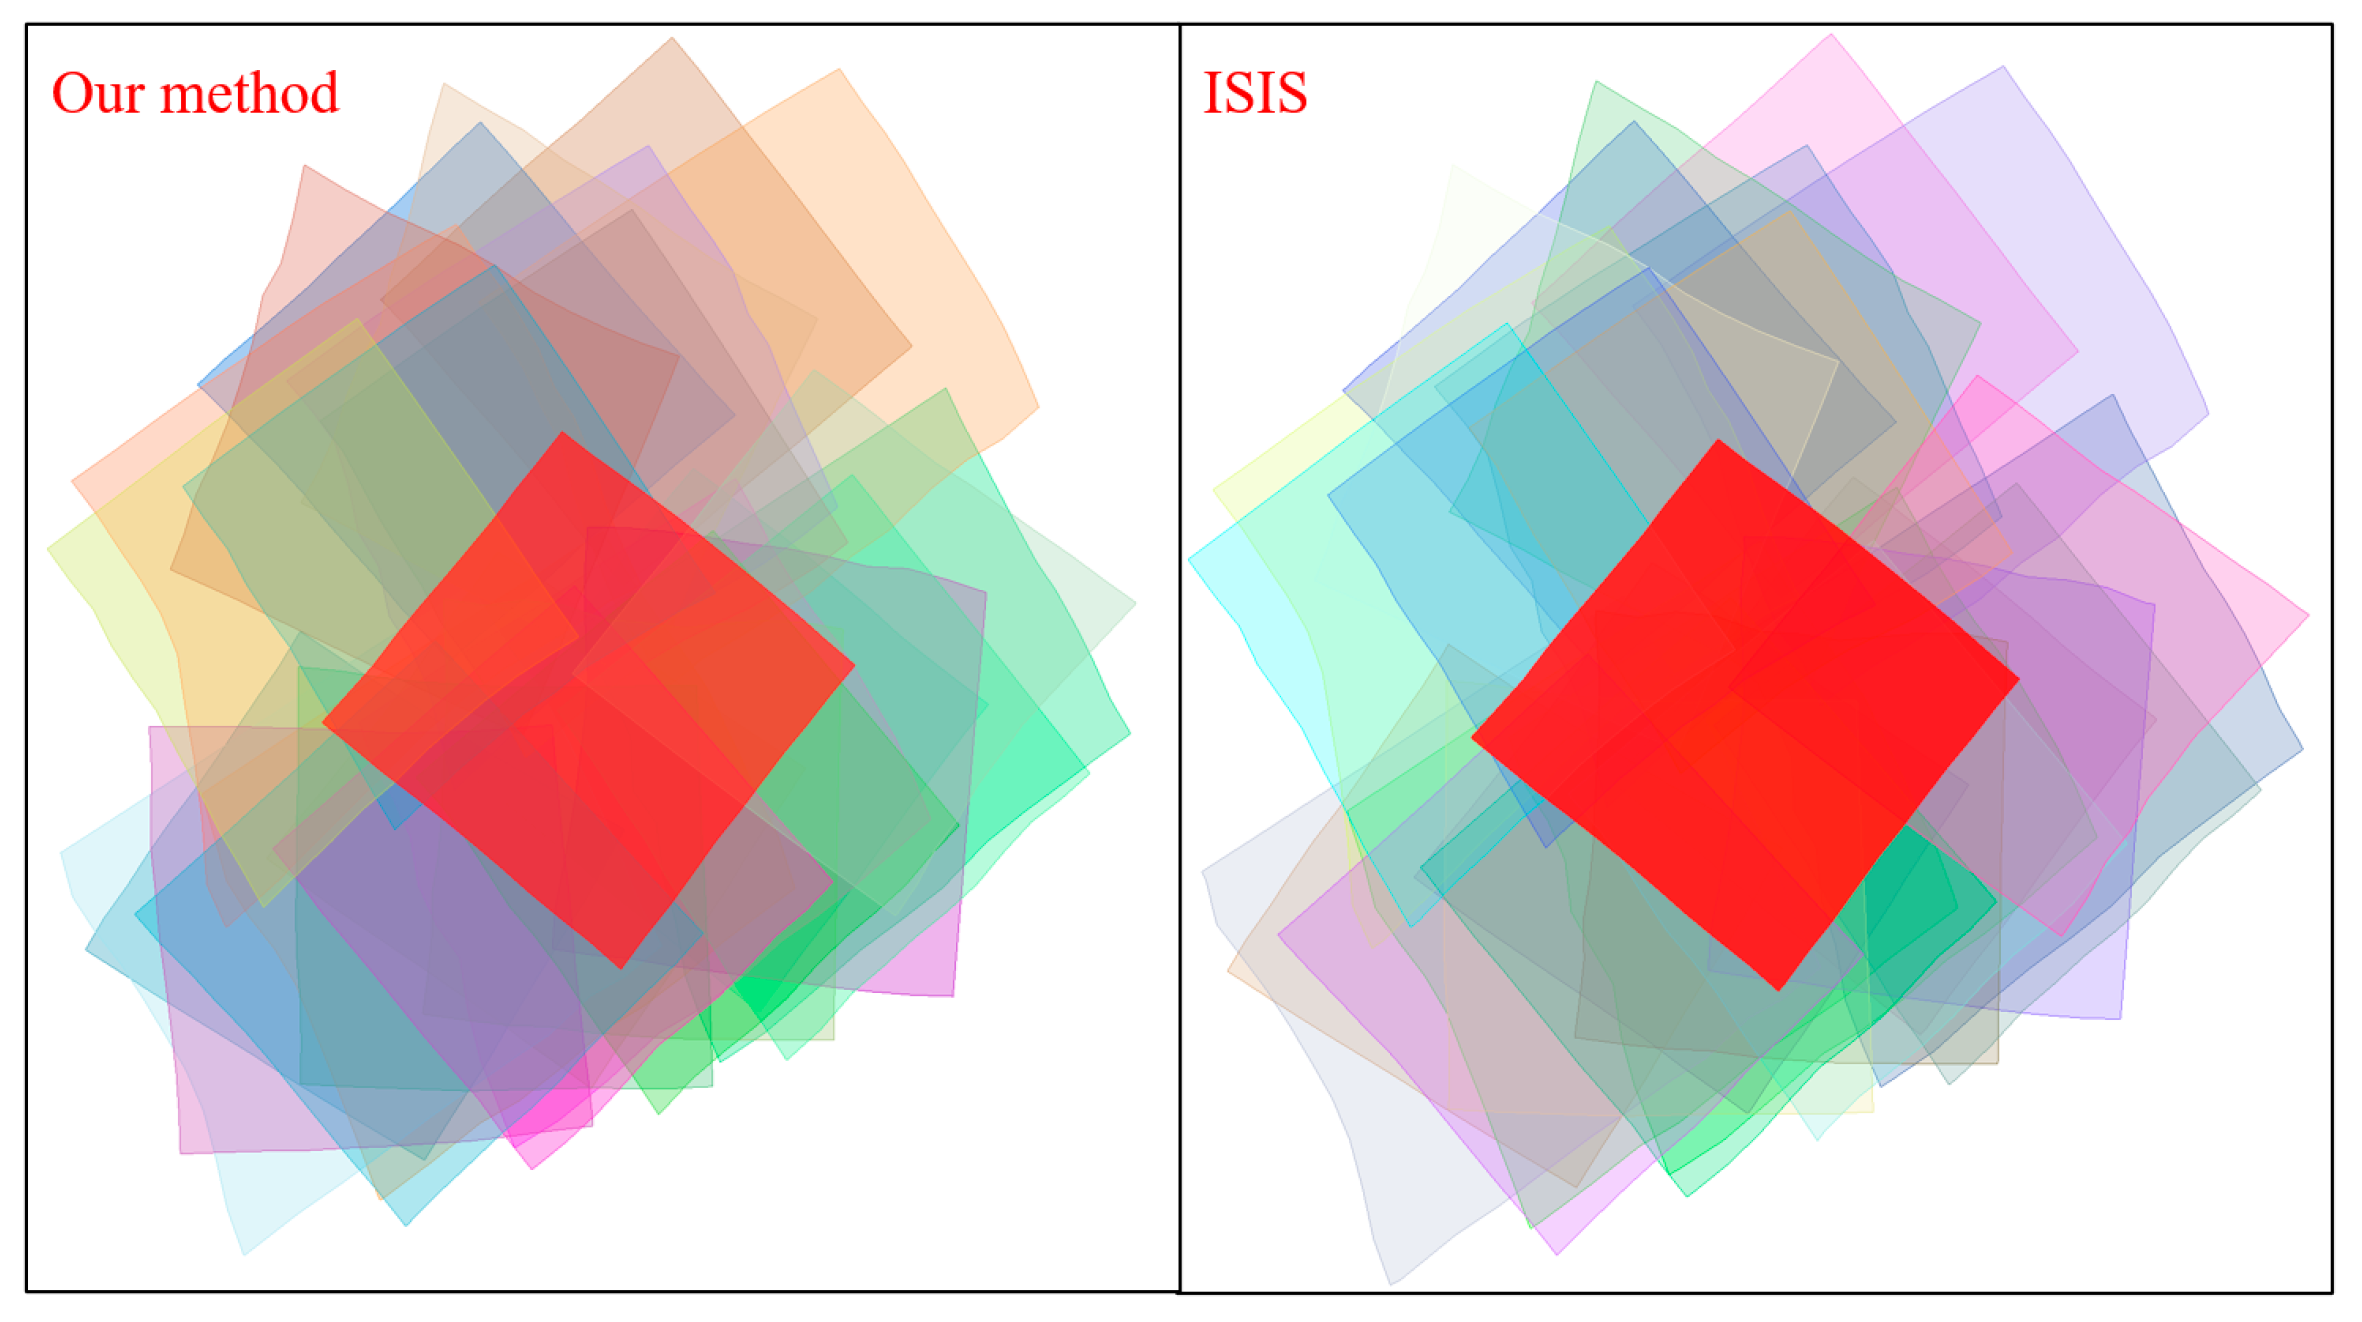
Figure 11.
Local result of Vesta image match pairs for the HAMO phase.
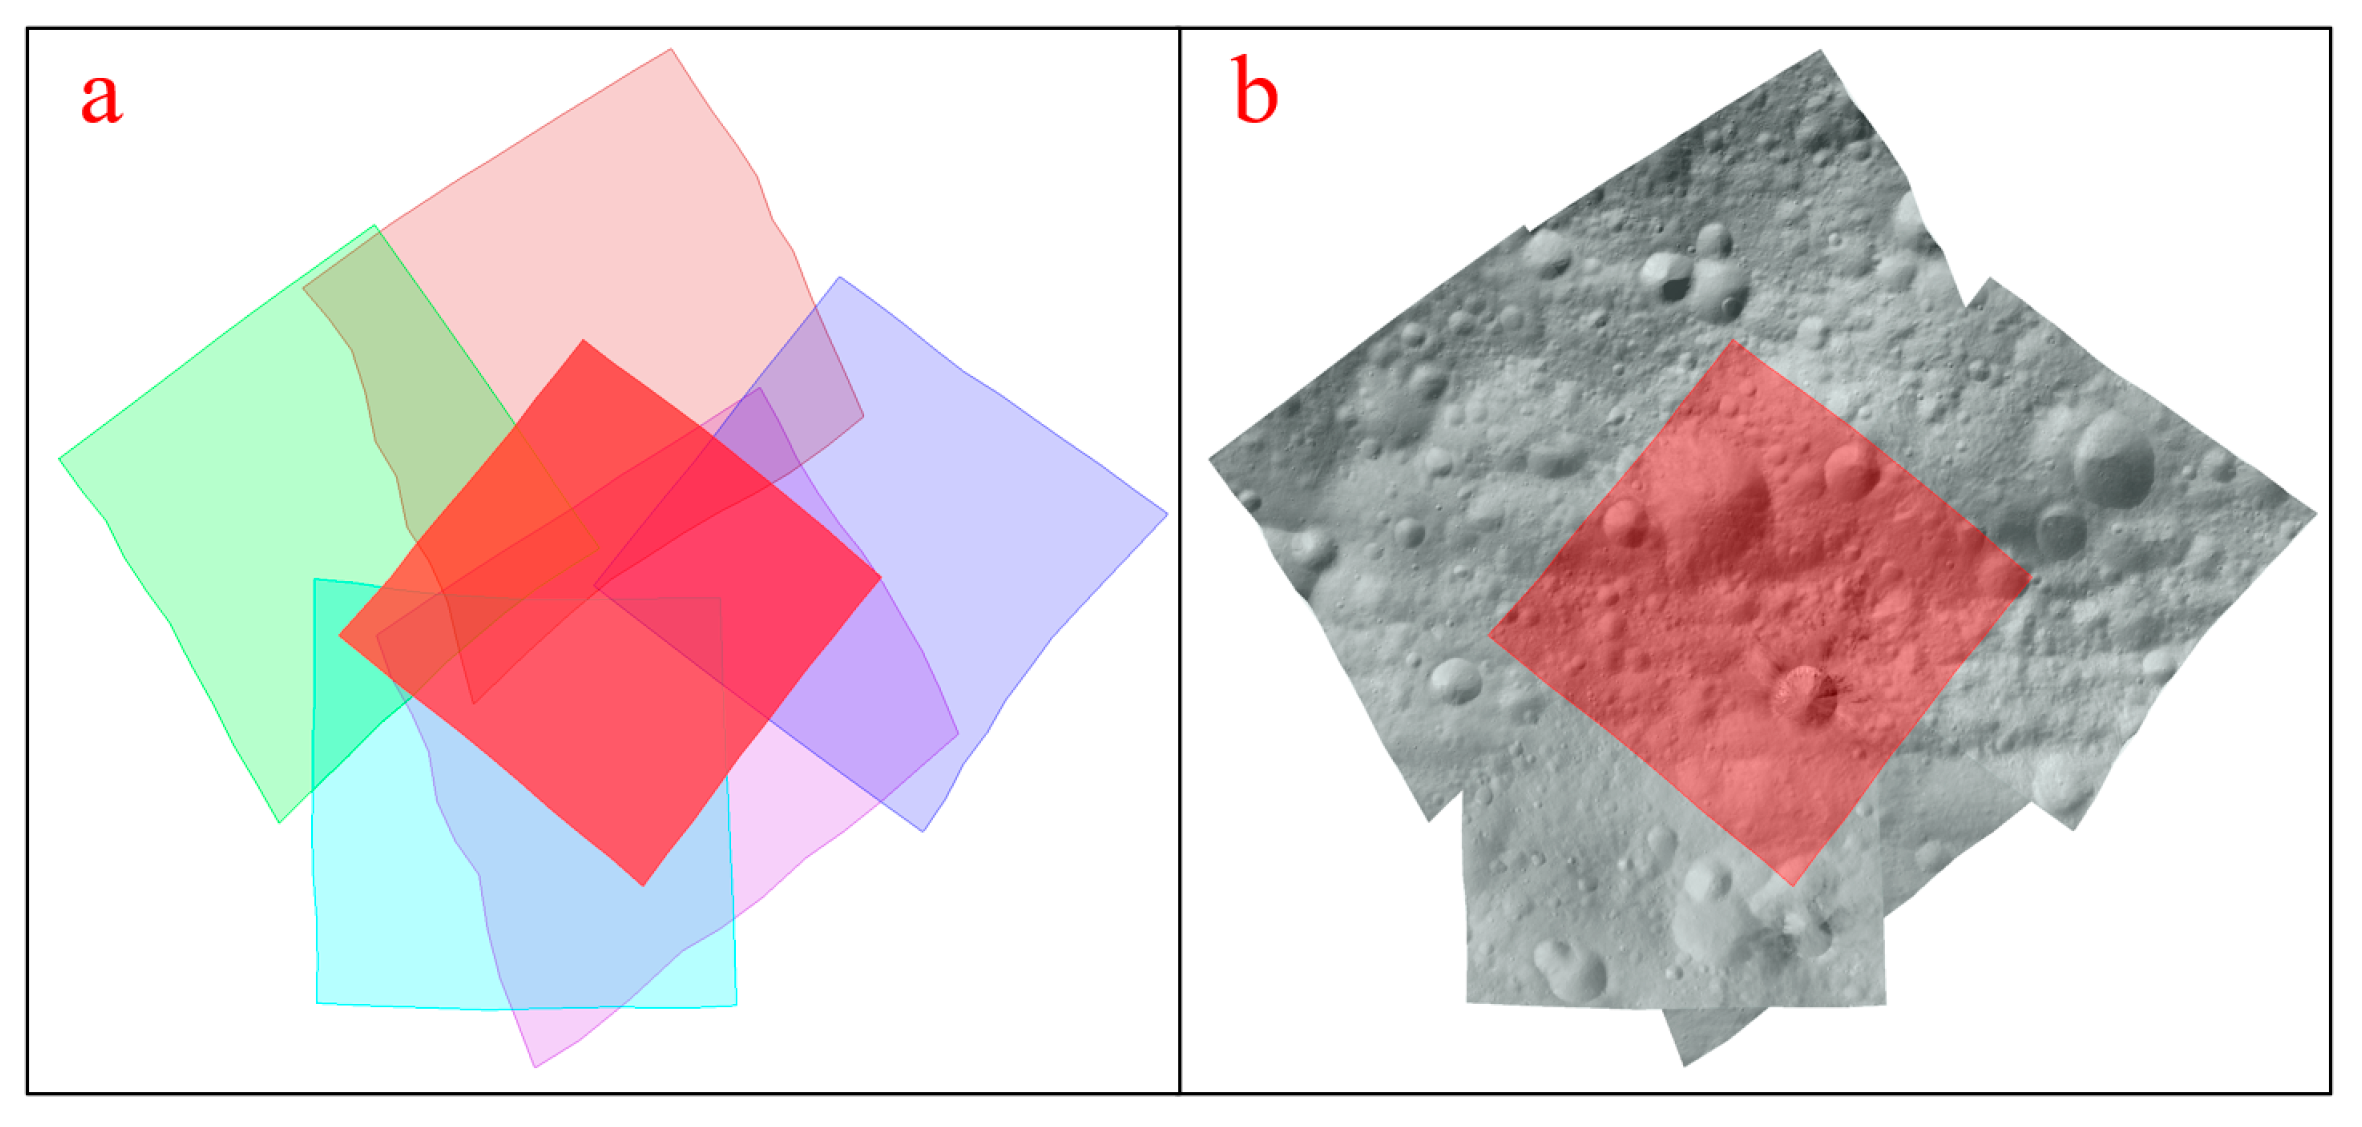
Figure 12.
Comparison of the determined image match pairs for Bennu images in the detail survey phase.
Figure 12.
Comparison of the determined image match pairs for Bennu images in the detail survey phase.
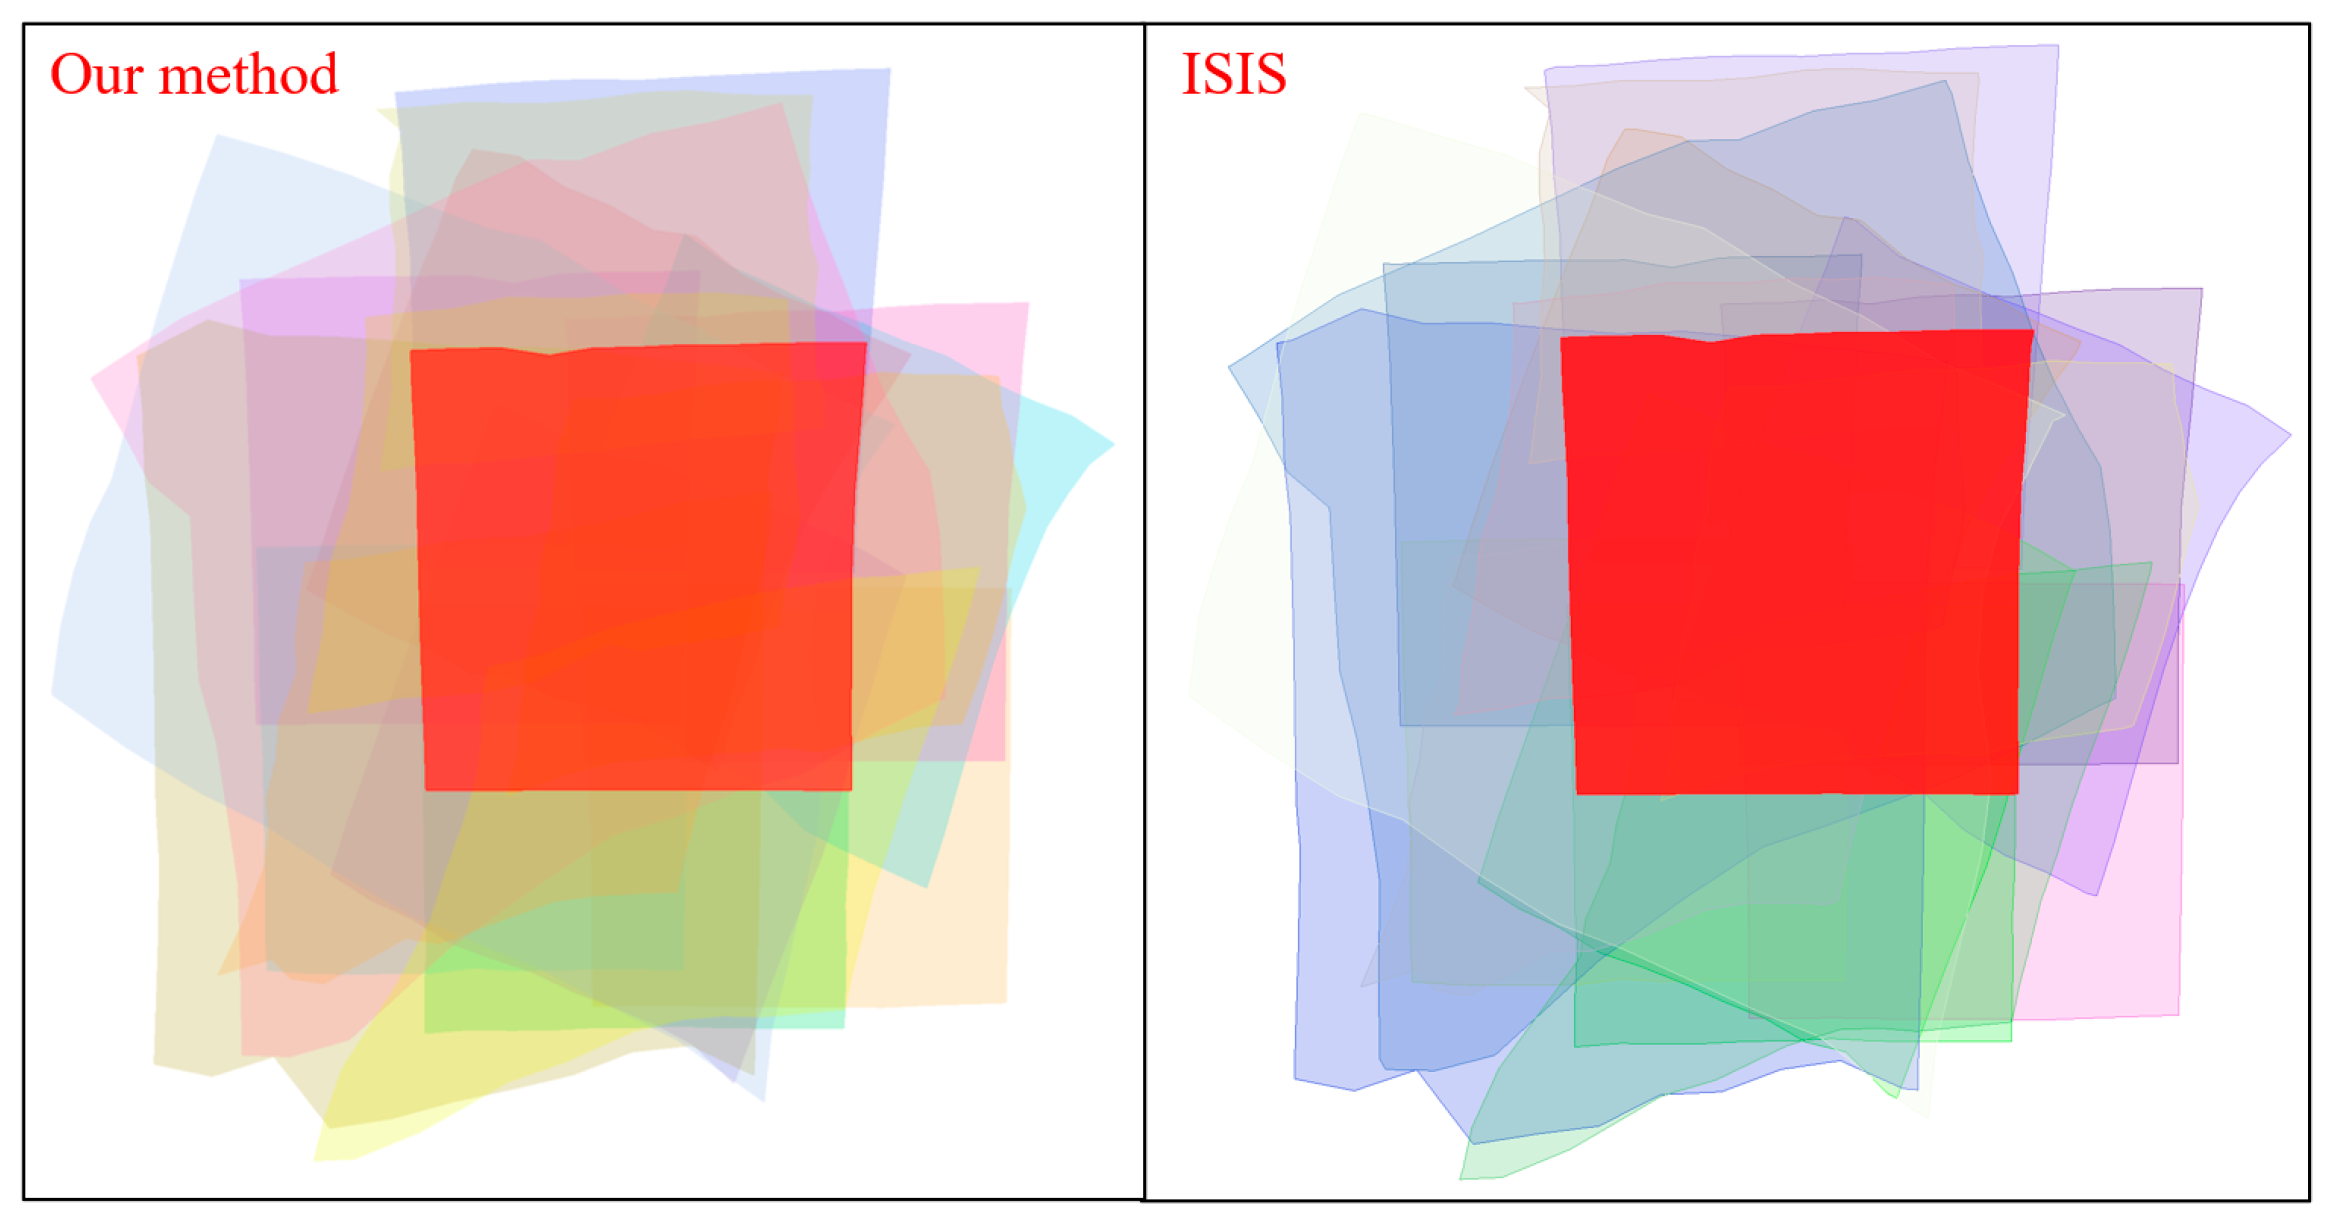
Figure 13.
Local result of Bennu image match pairs for the detailed survey phase.
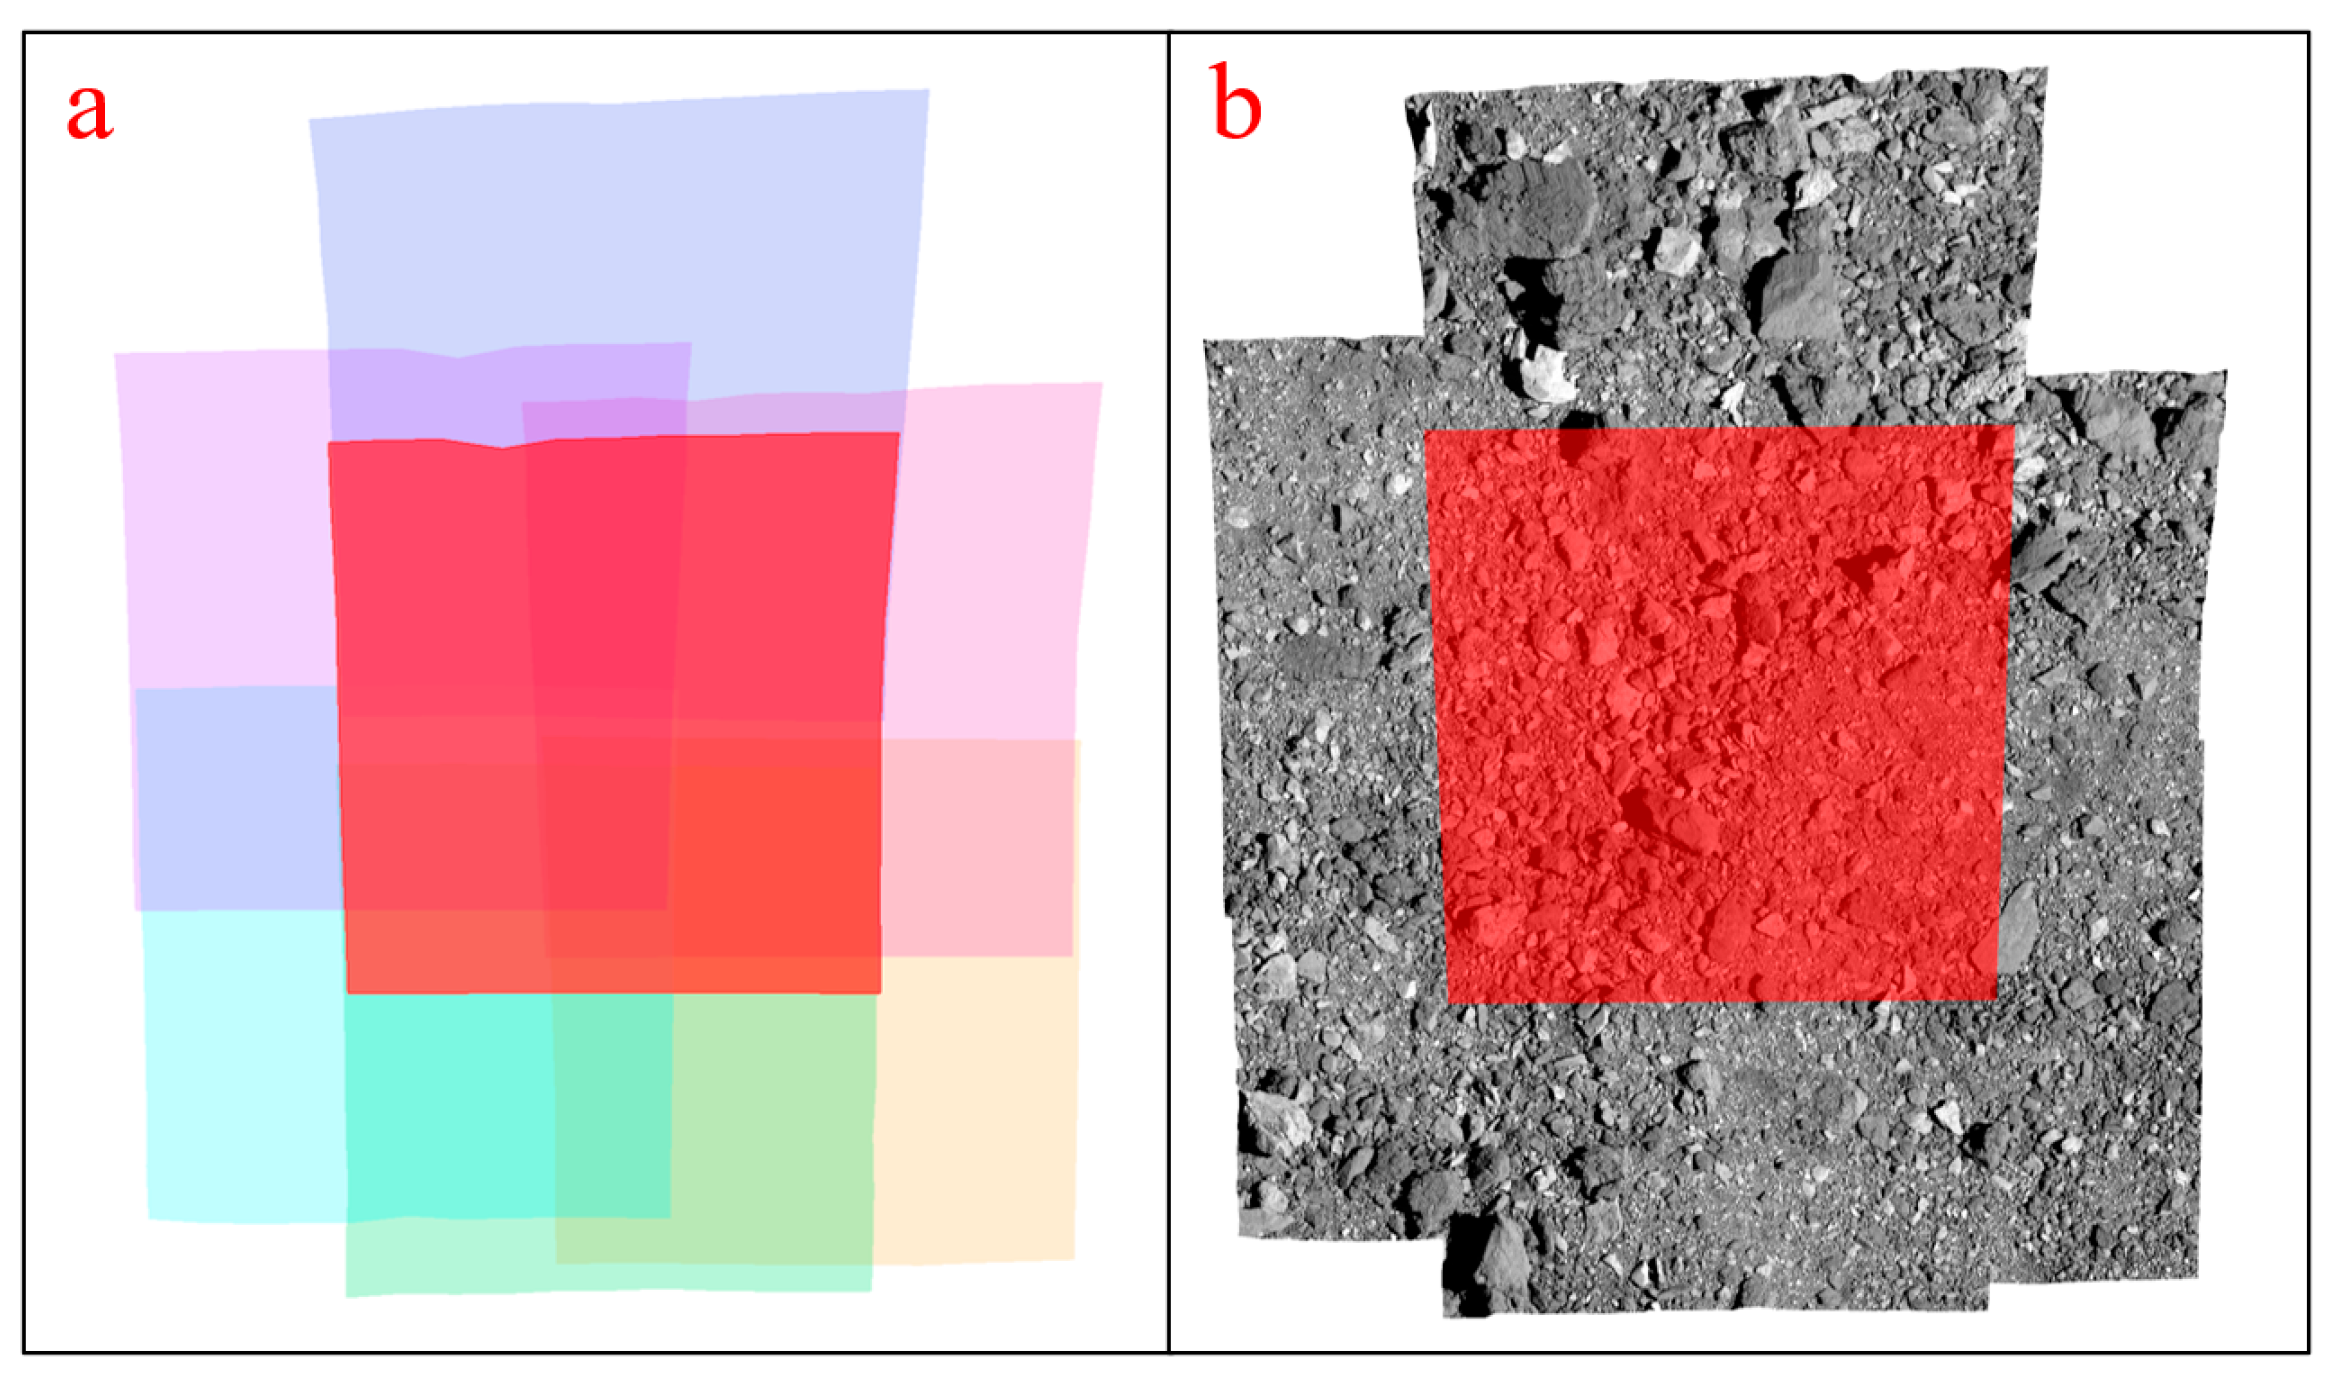
Figure 14.
Image match pairs for the preliminary survey phase of Bennu. (the red point in the figure is a homologous point).
Figure 14.
Image match pairs for the preliminary survey phase of Bennu. (the red point in the figure is a homologous point).
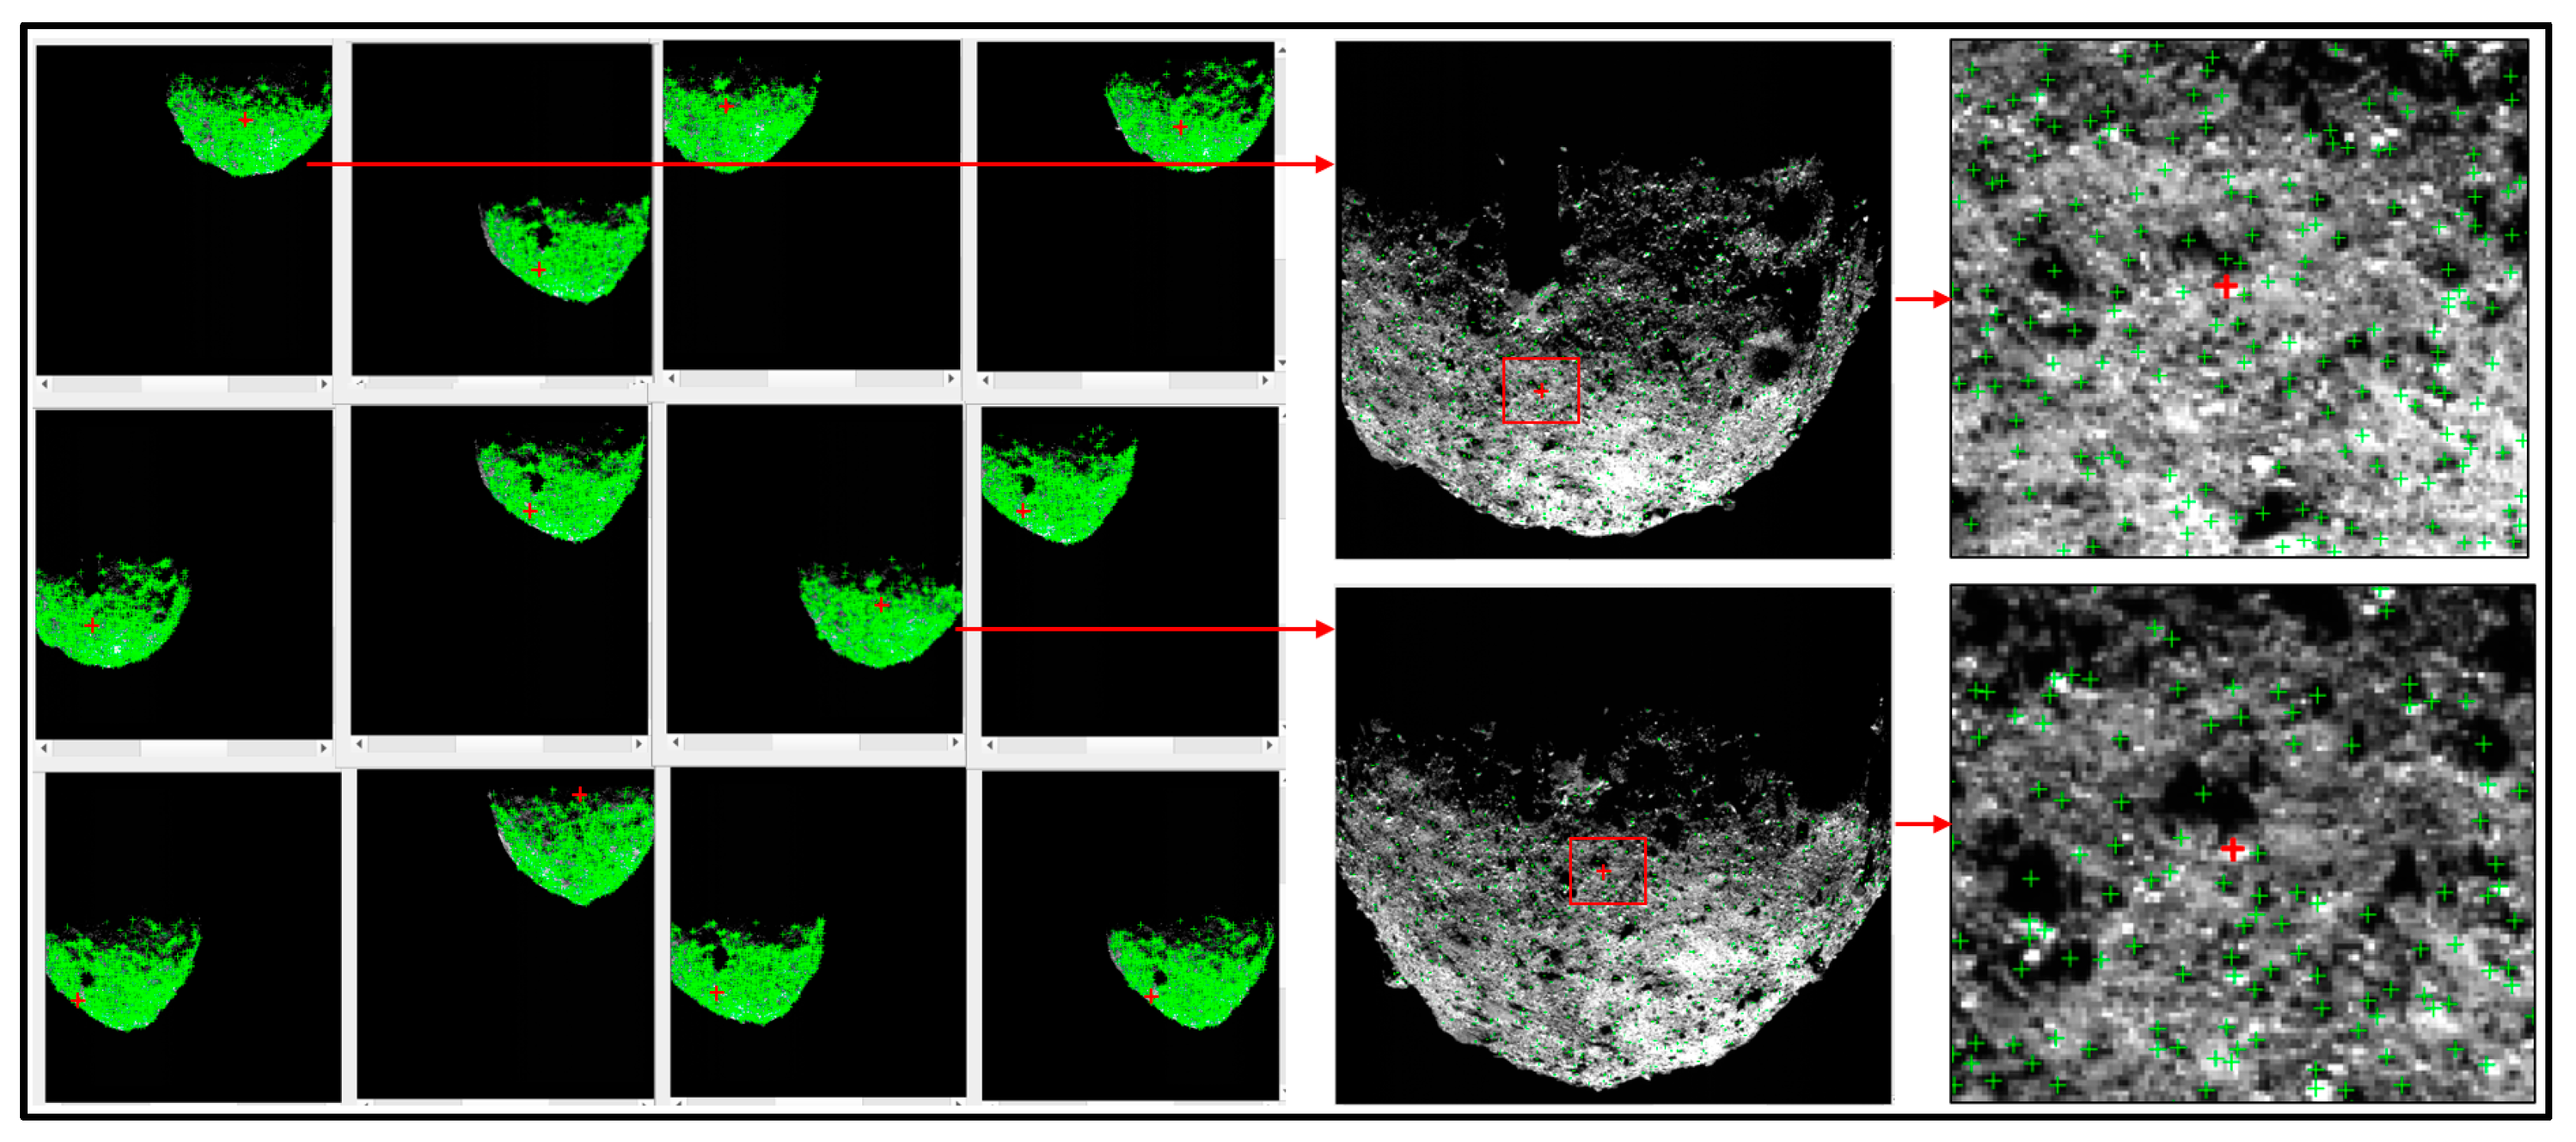
Figure 14.
Image match pairs for the characterization phase of Ryugu. (the red point in the figure is a homologous point).
Figure 14.
Image match pairs for the characterization phase of Ryugu. (the red point in the figure is a homologous point).
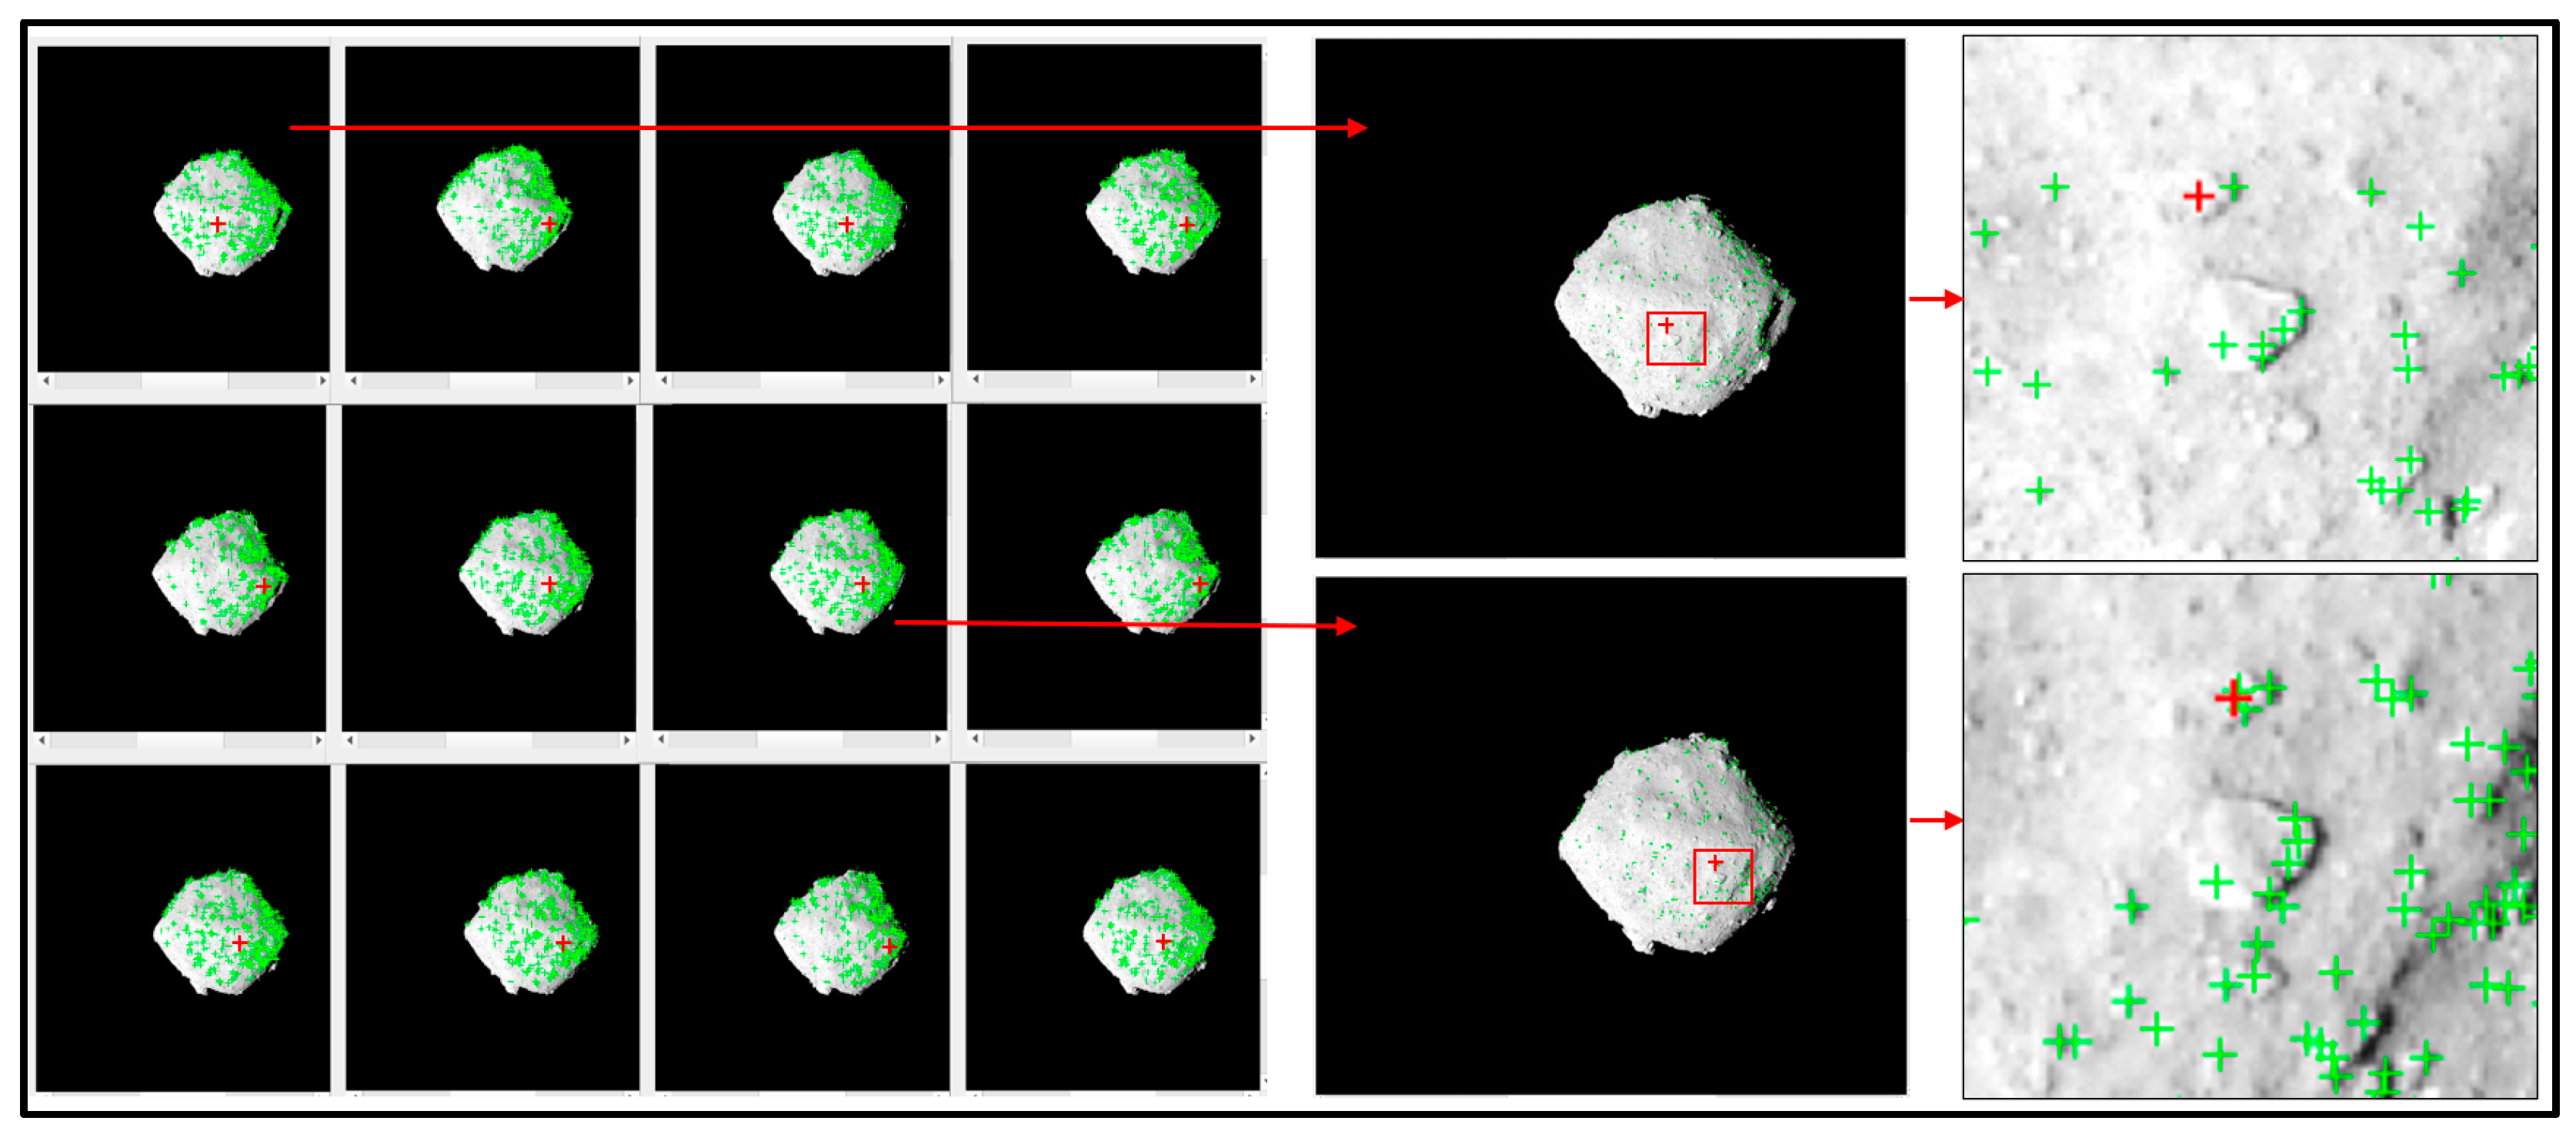
Figure 16.
Display diagram of the abnormal image of Bennu obtained in preliminary survey stage. (a is raw image, b is an orthorectified image.).
Figure 16.
Display diagram of the abnormal image of Bennu obtained in preliminary survey stage. (a is raw image, b is an orthorectified image.).
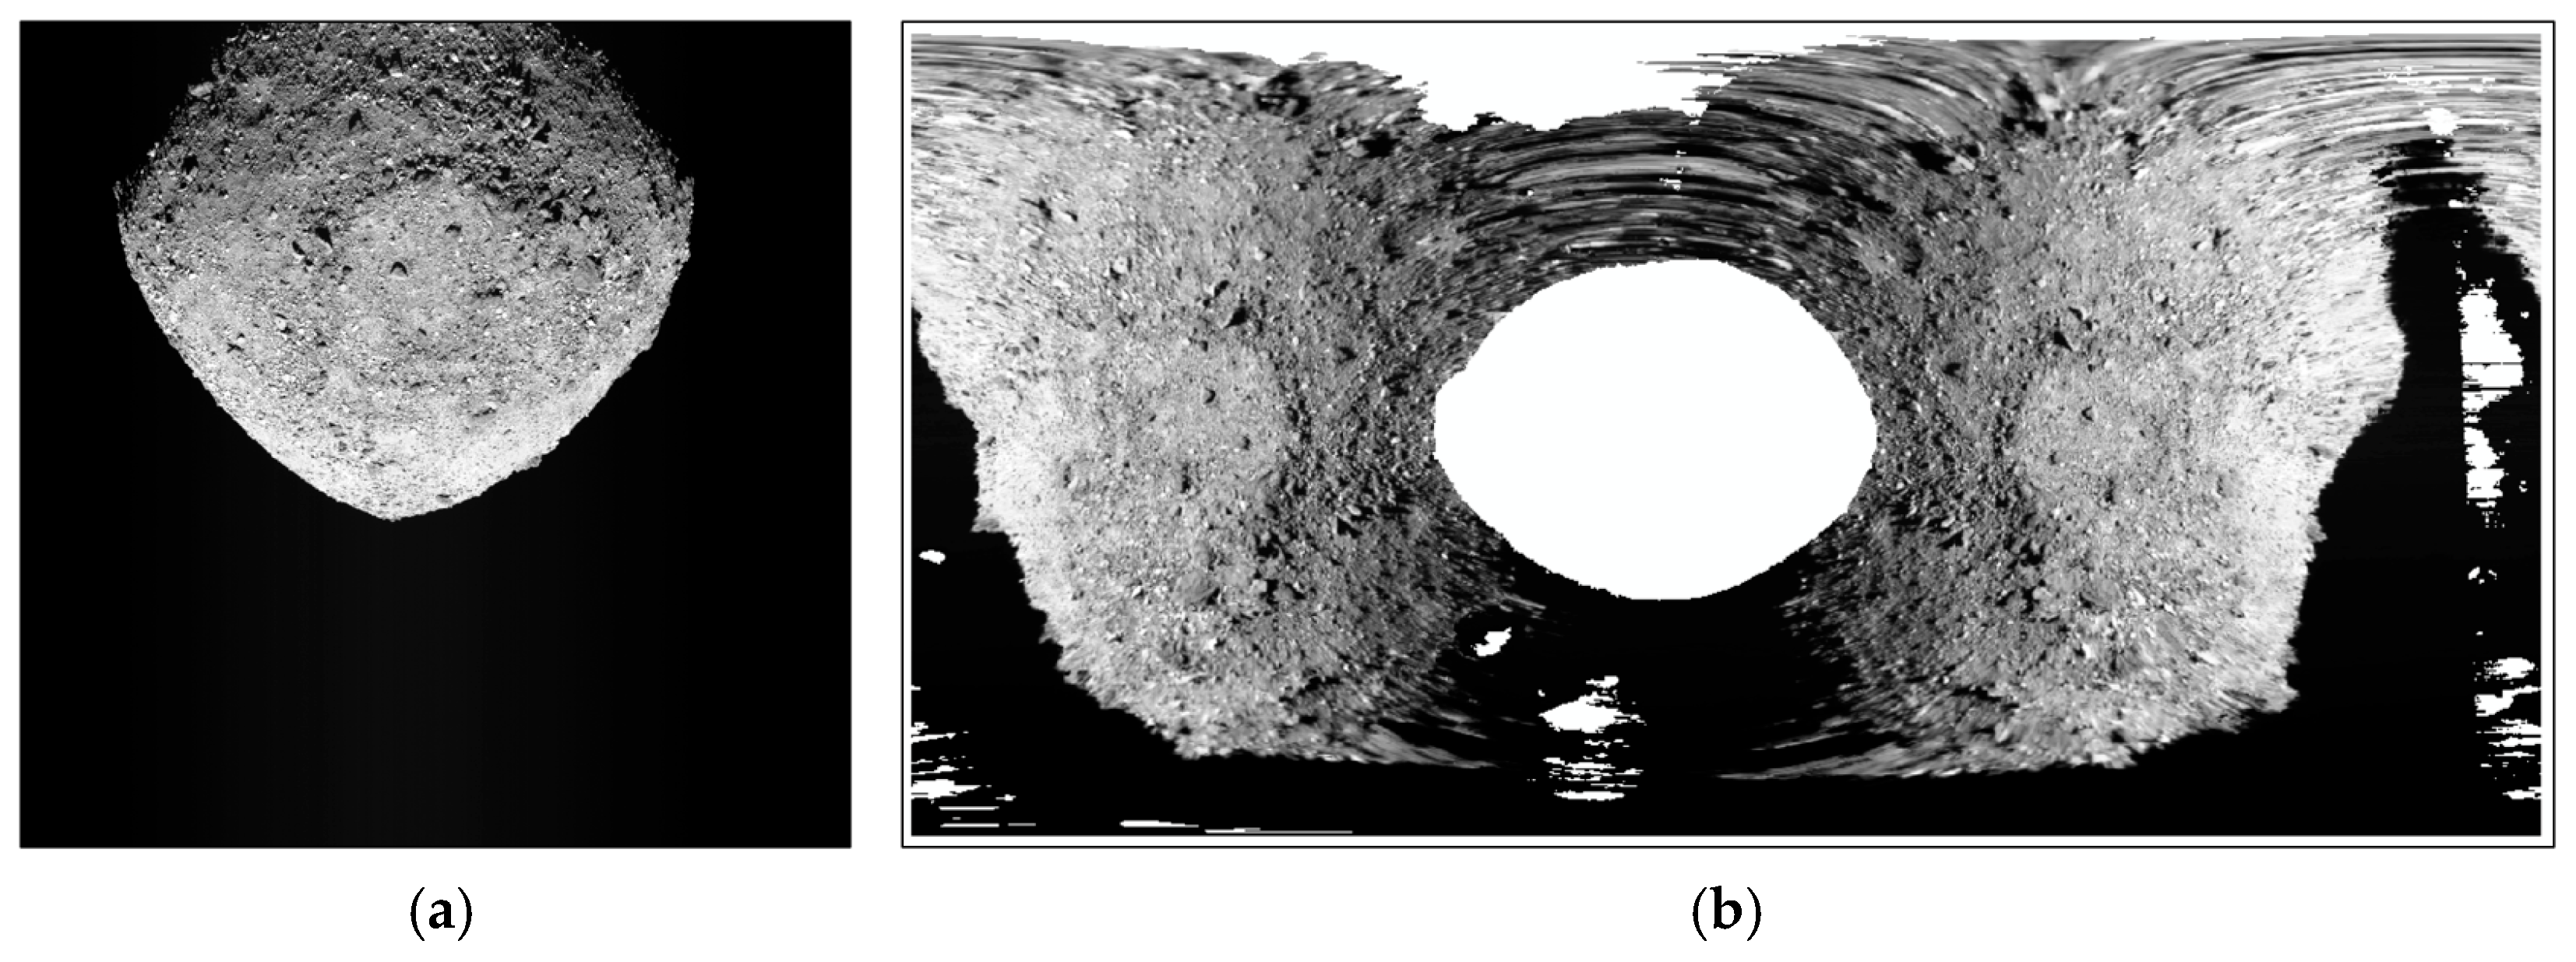
Figure 17.
Tie point distribution for the Bennu images of Test 1. The green crosses represent tie points. There are no points around the position with a longitude of 120° and a latitude of about 55° in the figure, because there is a large boulder here, which is not conducive to feature point matching.
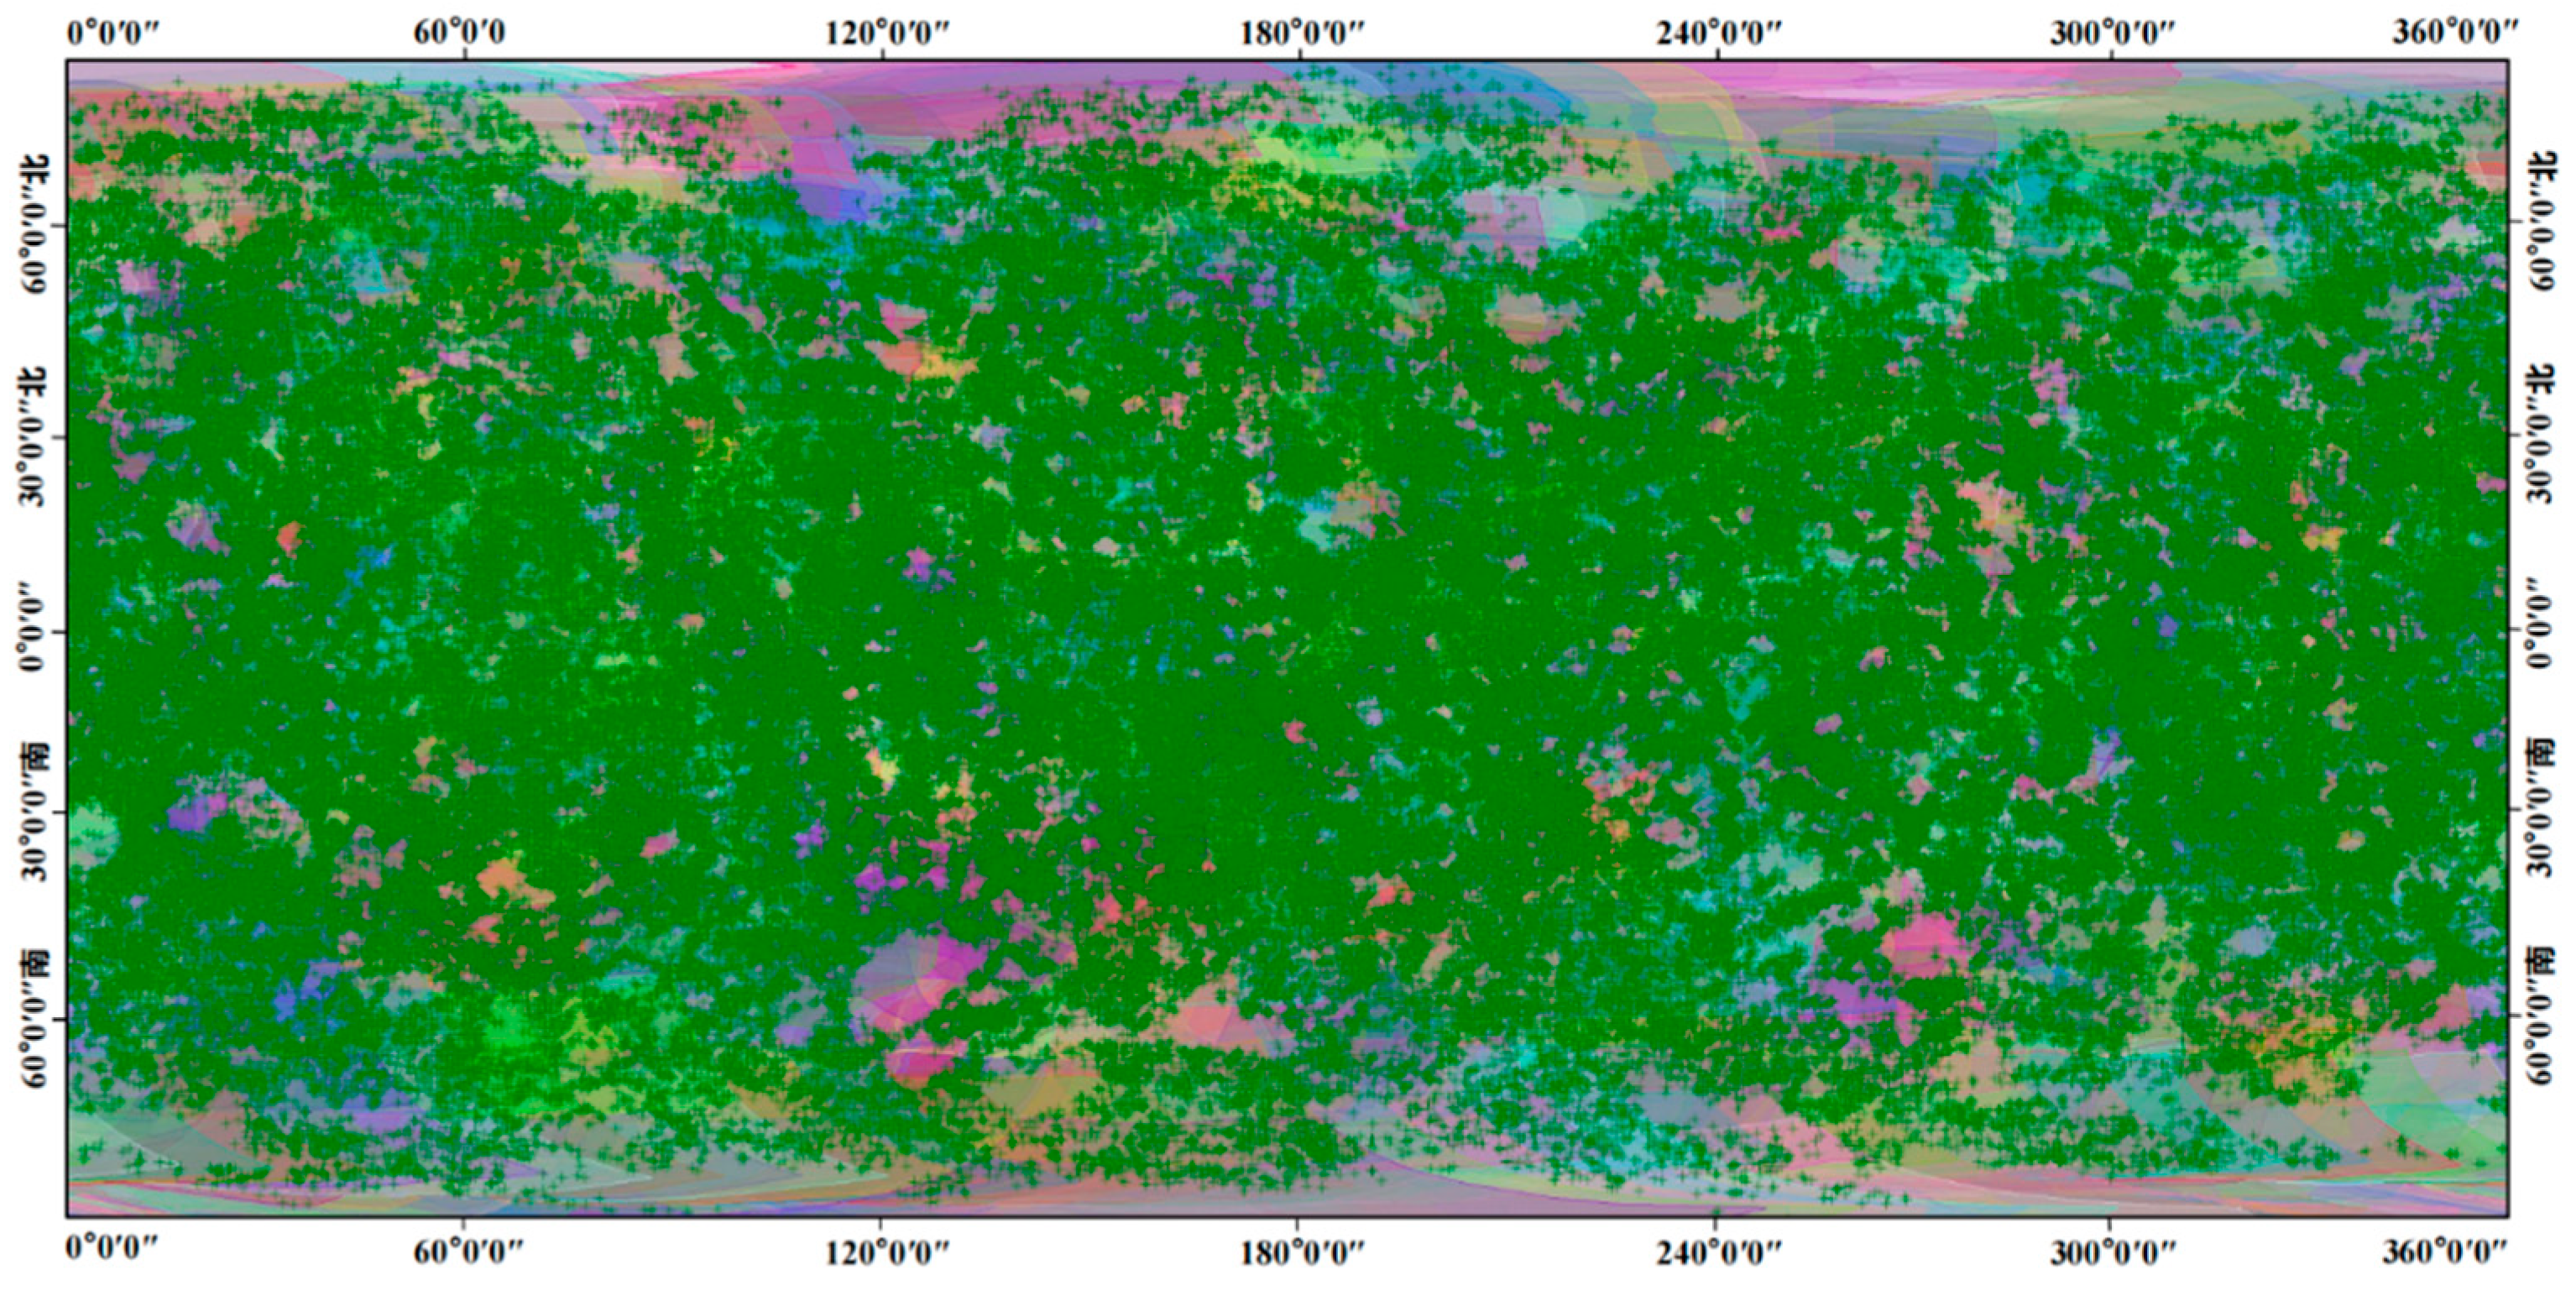
Figure 18.
Tie point distribution for the Vesta images of Test 2. The green crosses represent tie points.
Figure 18.
Tie point distribution for the Vesta images of Test 2. The green crosses represent tie points.
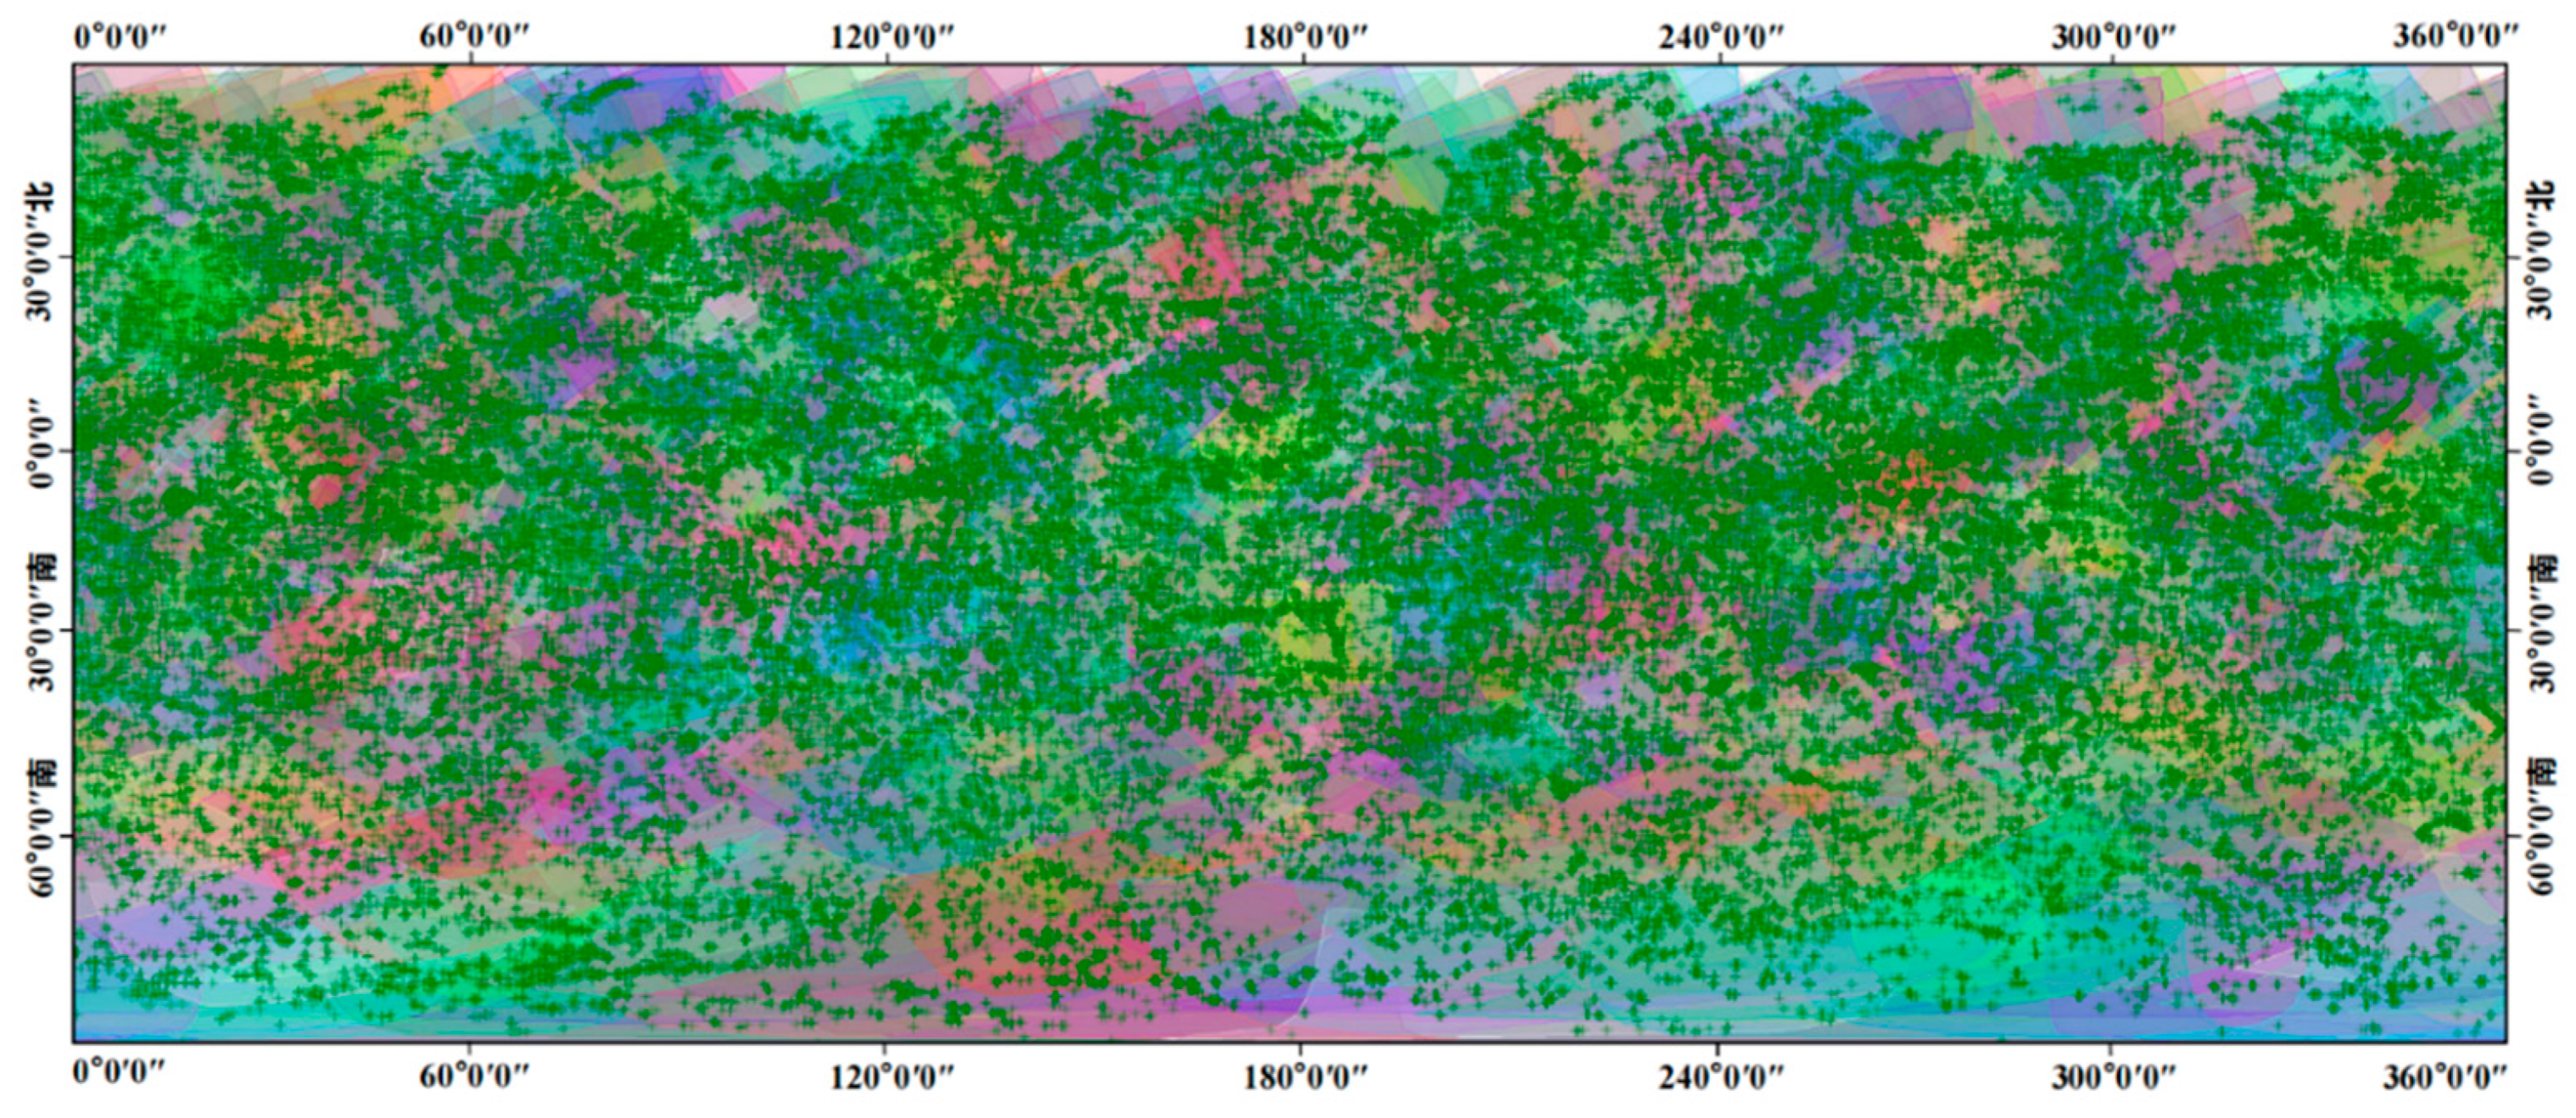
Figure 19.
RMSE values of the control measure residuals for each image of Test 1 data.
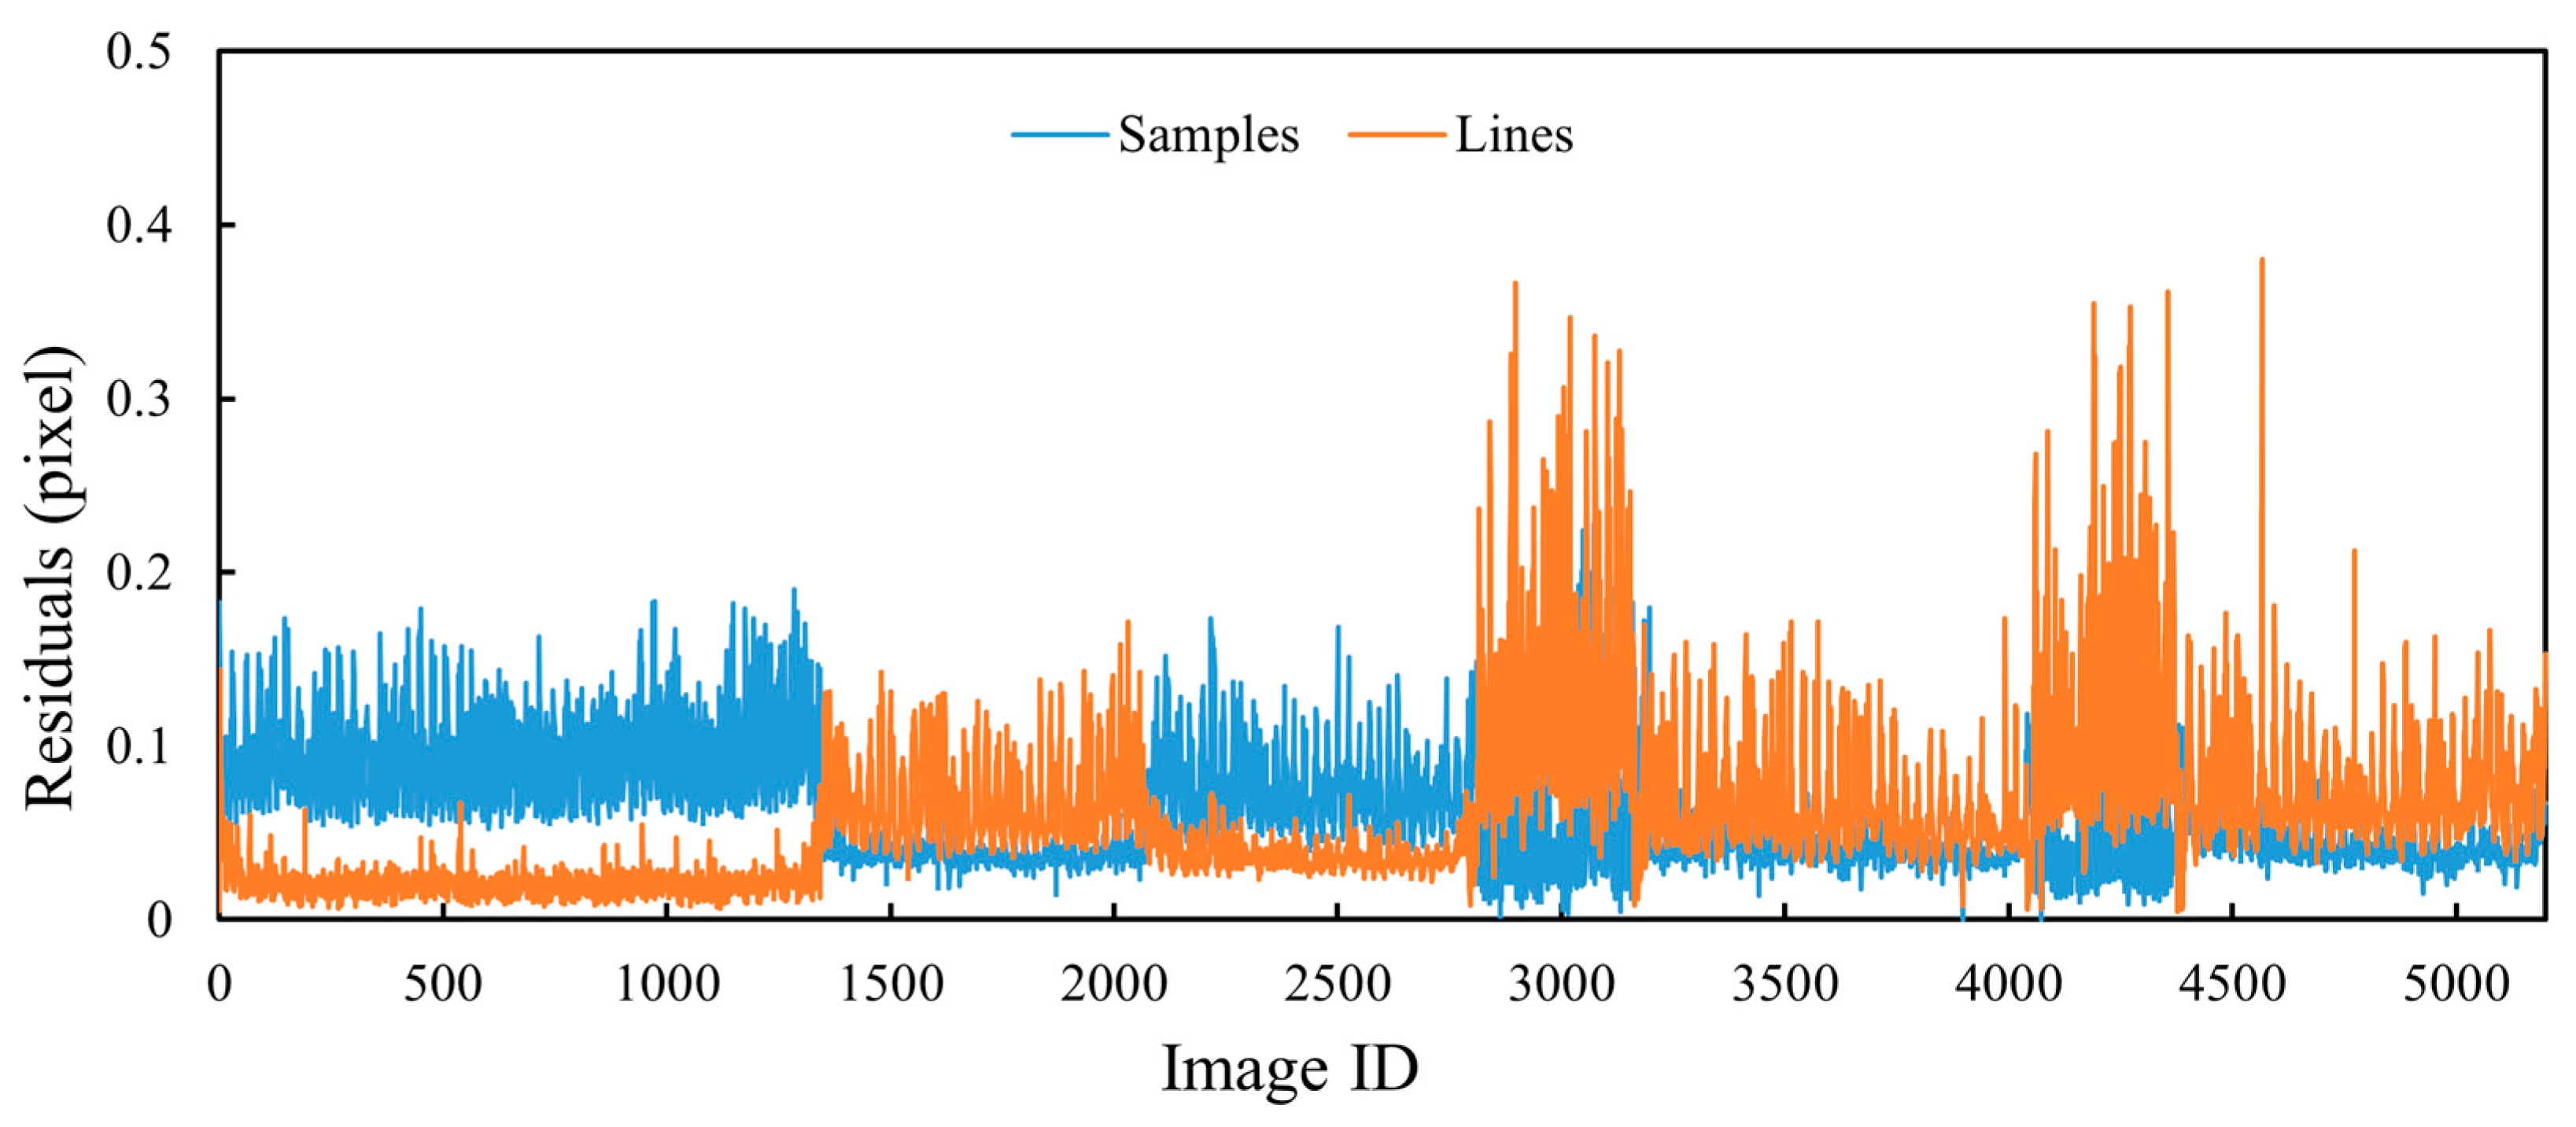
Figure 20.
The same as Figure 19 but for Test 2 data.
Figure 20.
The same as Figure 19 but for Test 2 data.
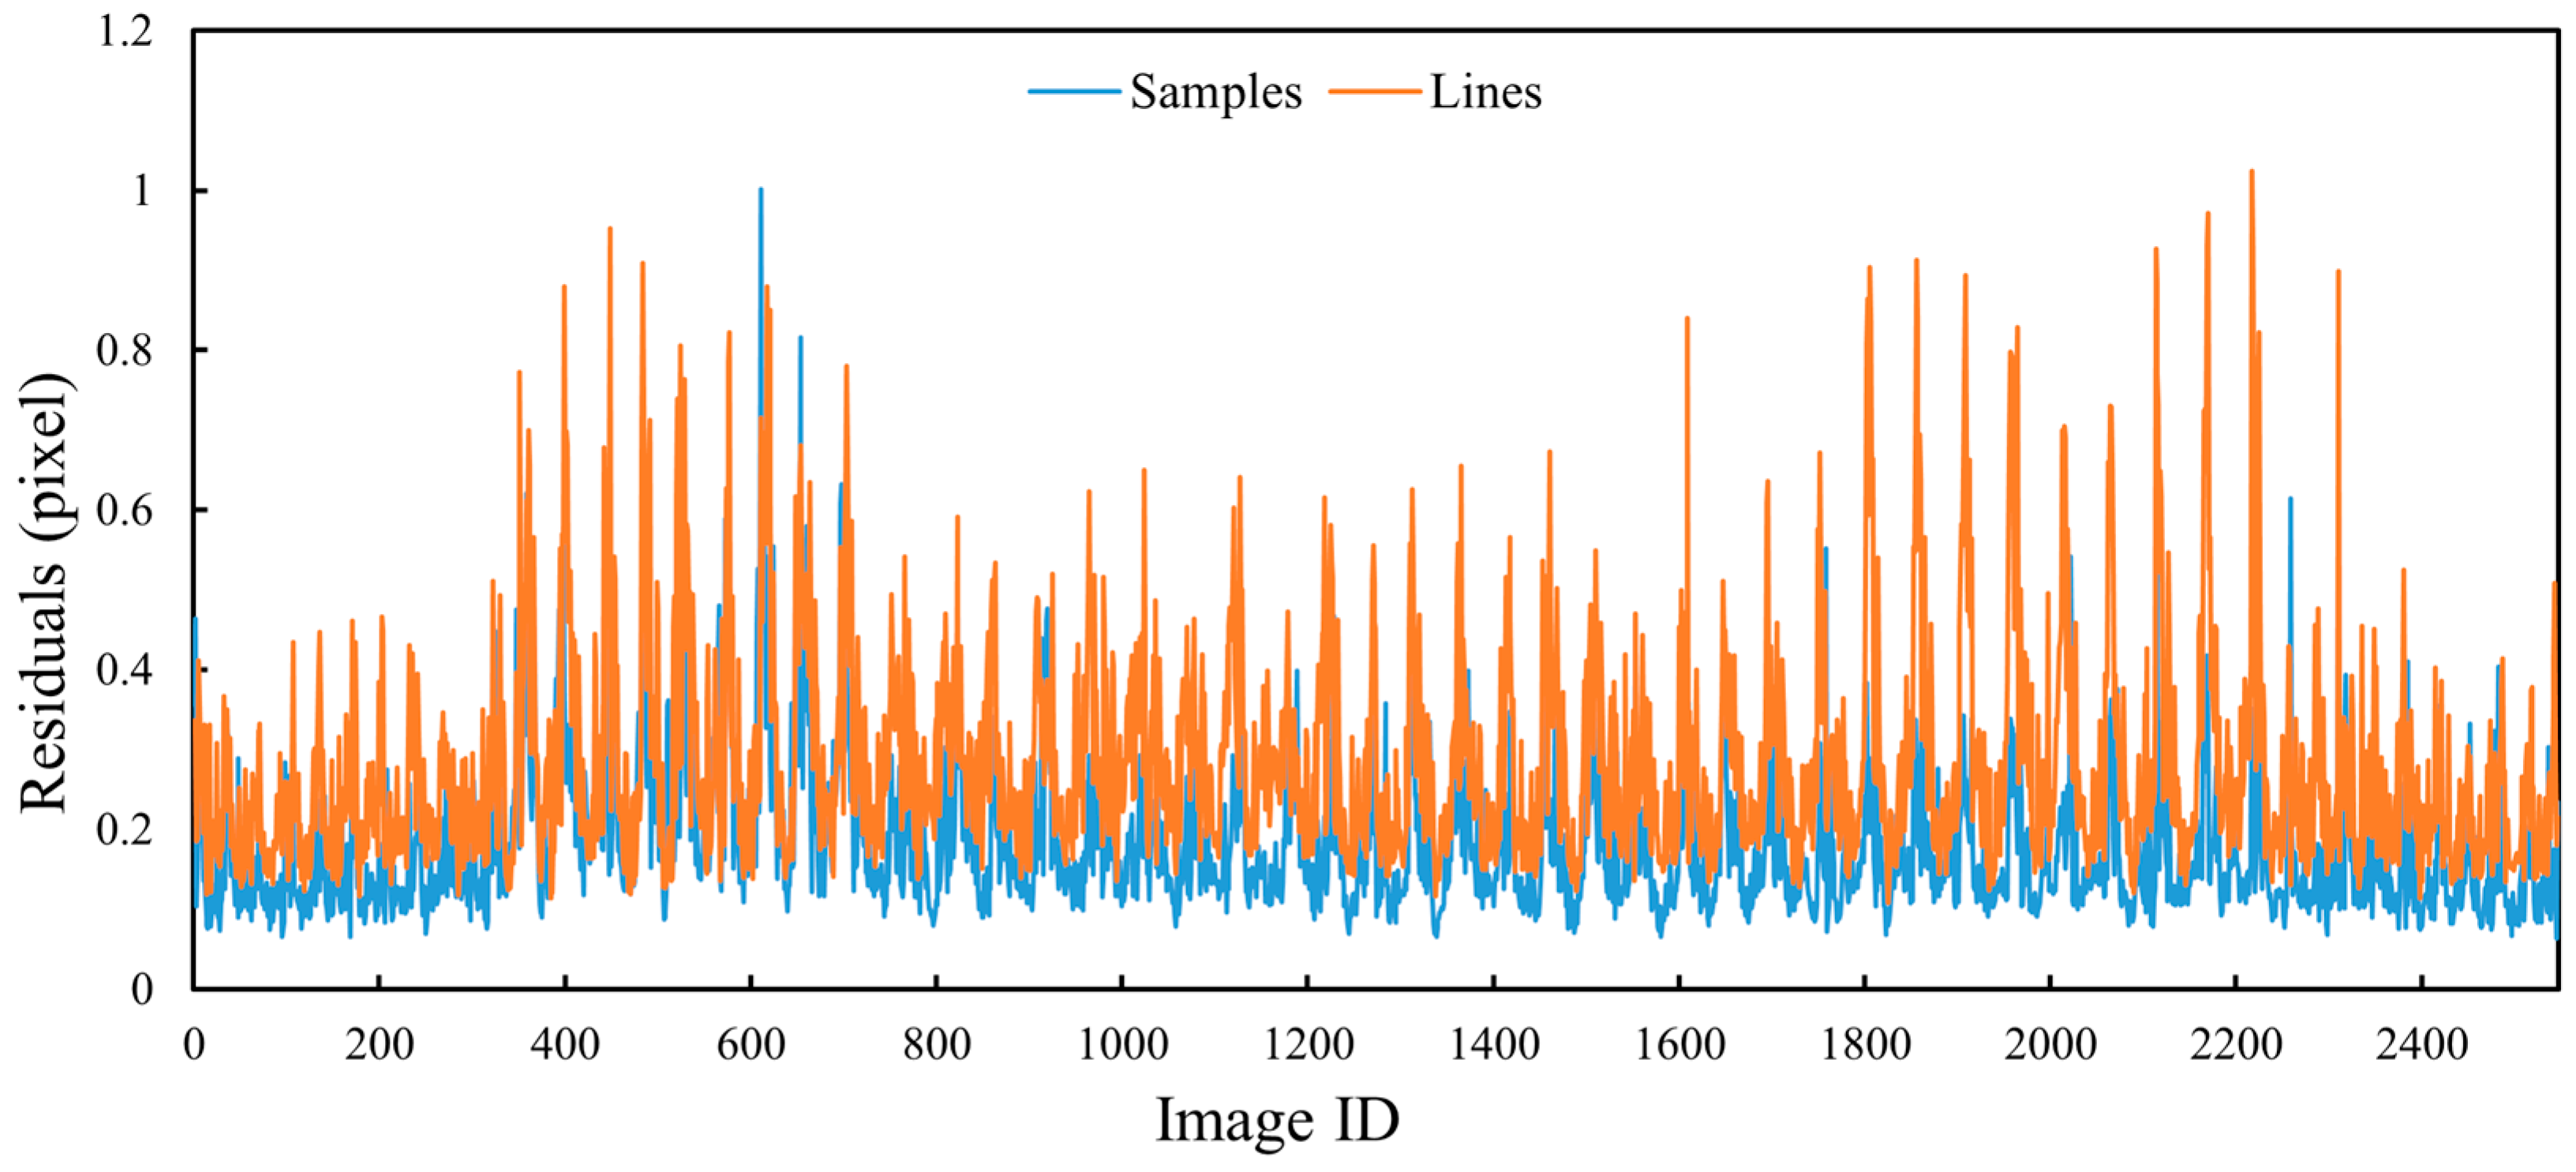
Figure 21.
The same as Figure 19 but for Test 3 data.
Figure 21.
The same as Figure 19 but for Test 3 data.
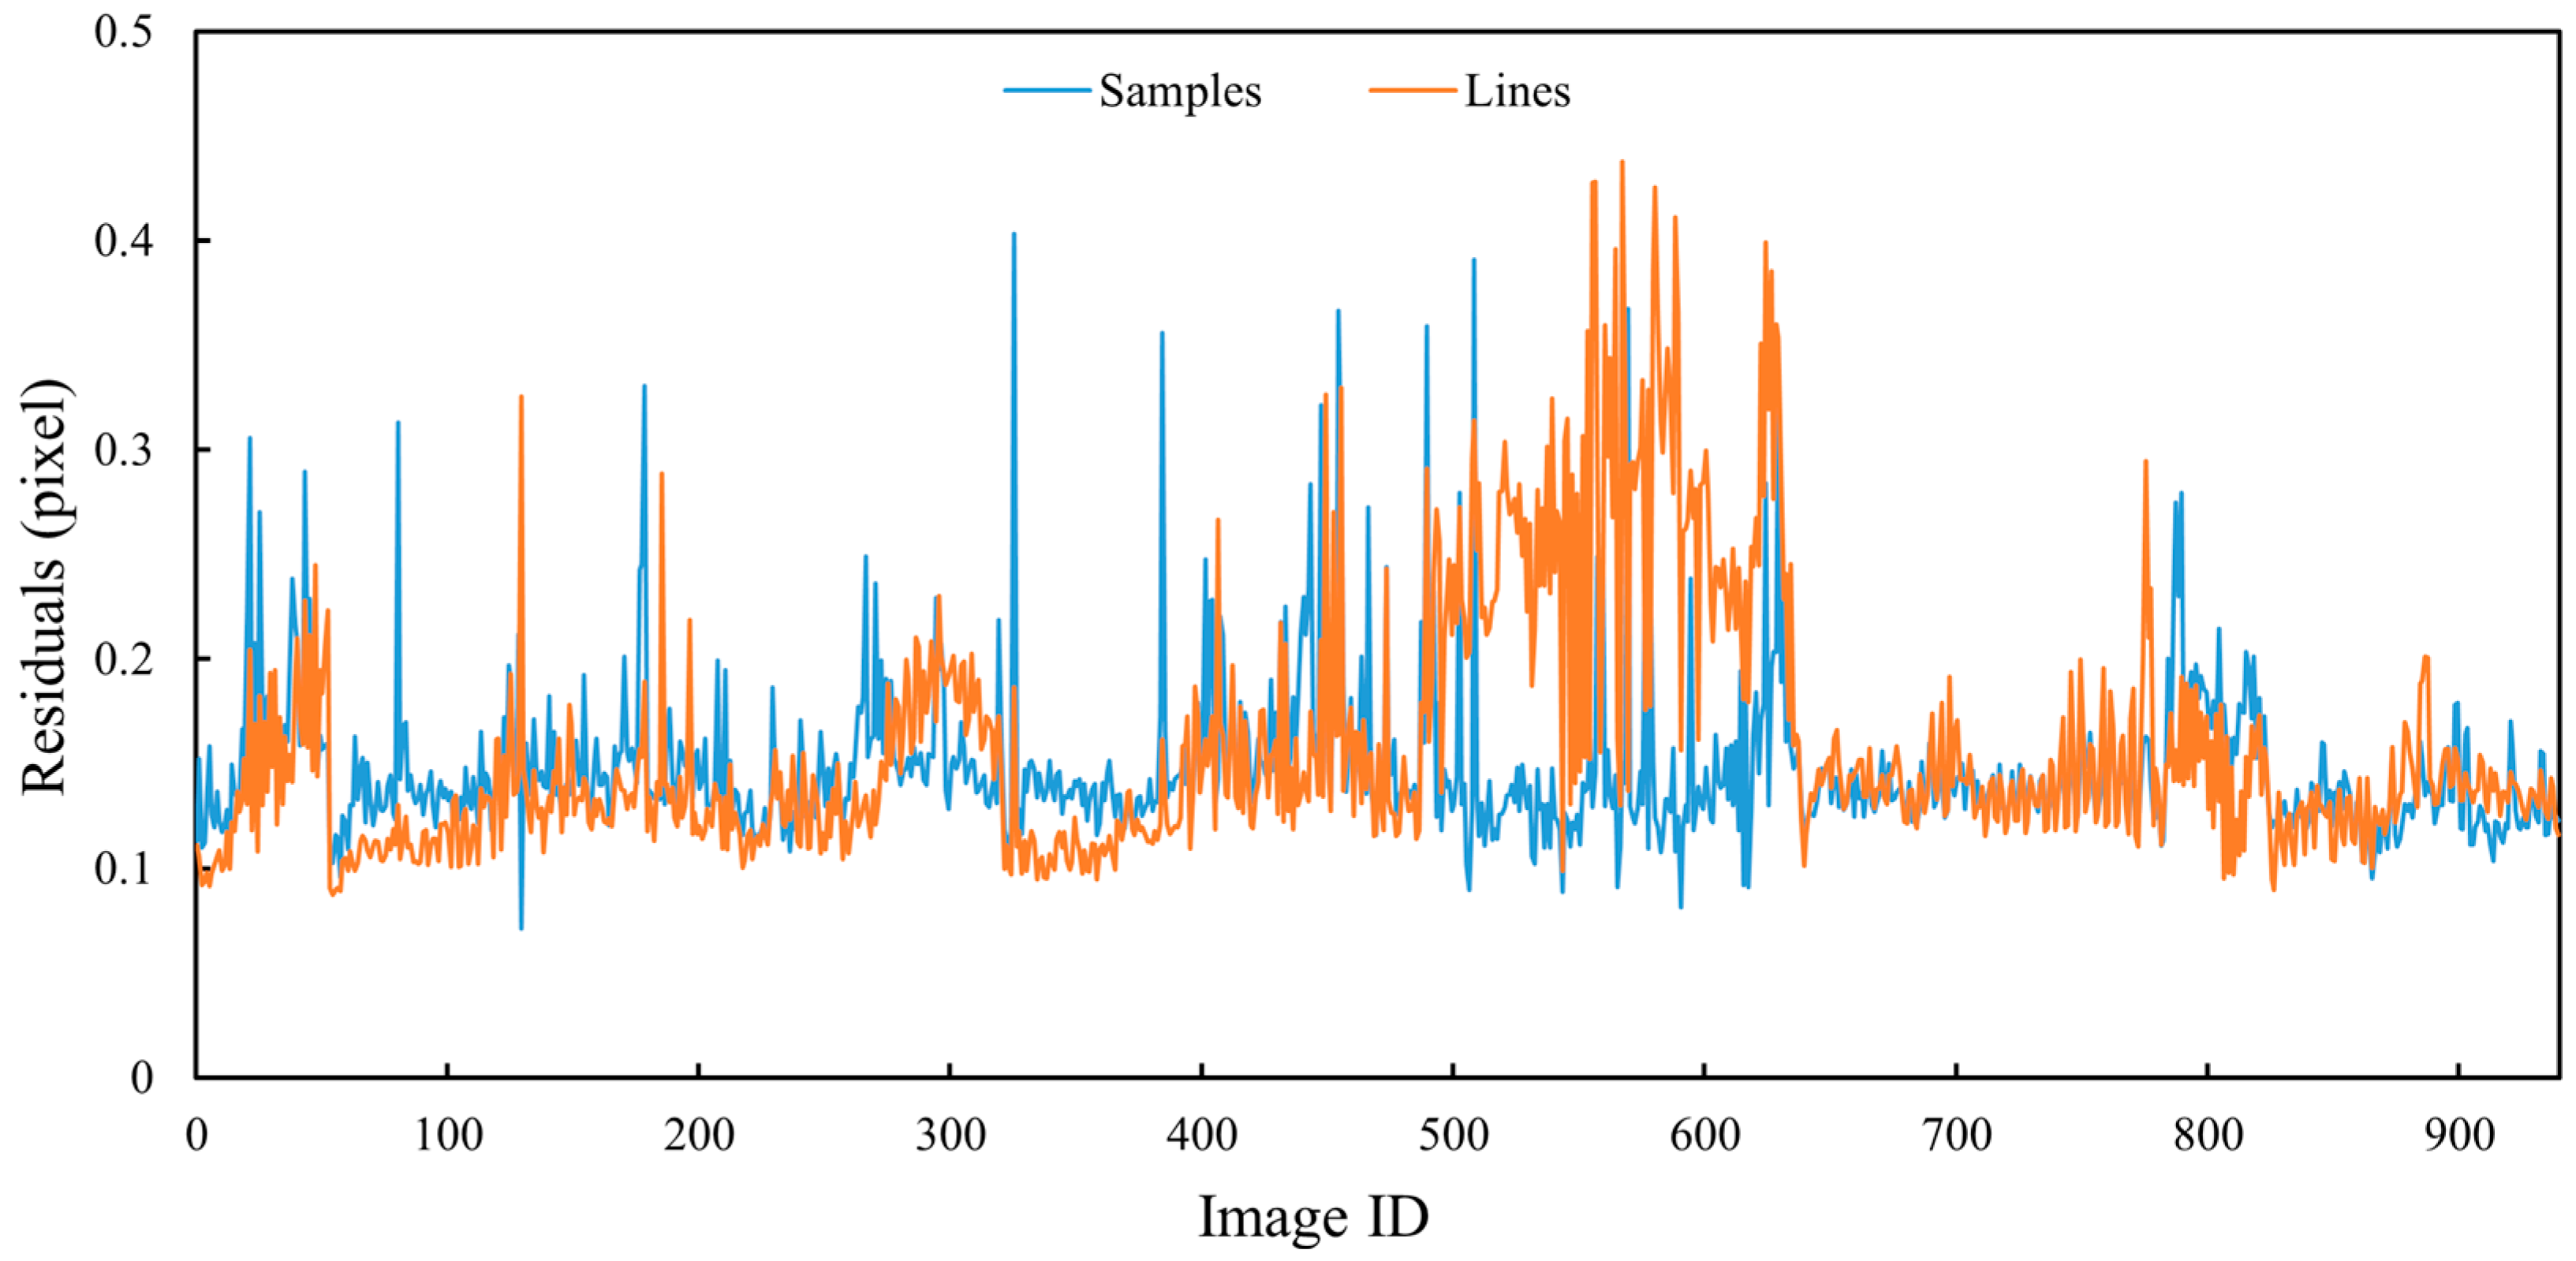
Figure 22.
The same as Figure 19 but for Test 4 data.
Figure 22.
The same as Figure 19 but for Test 4 data.
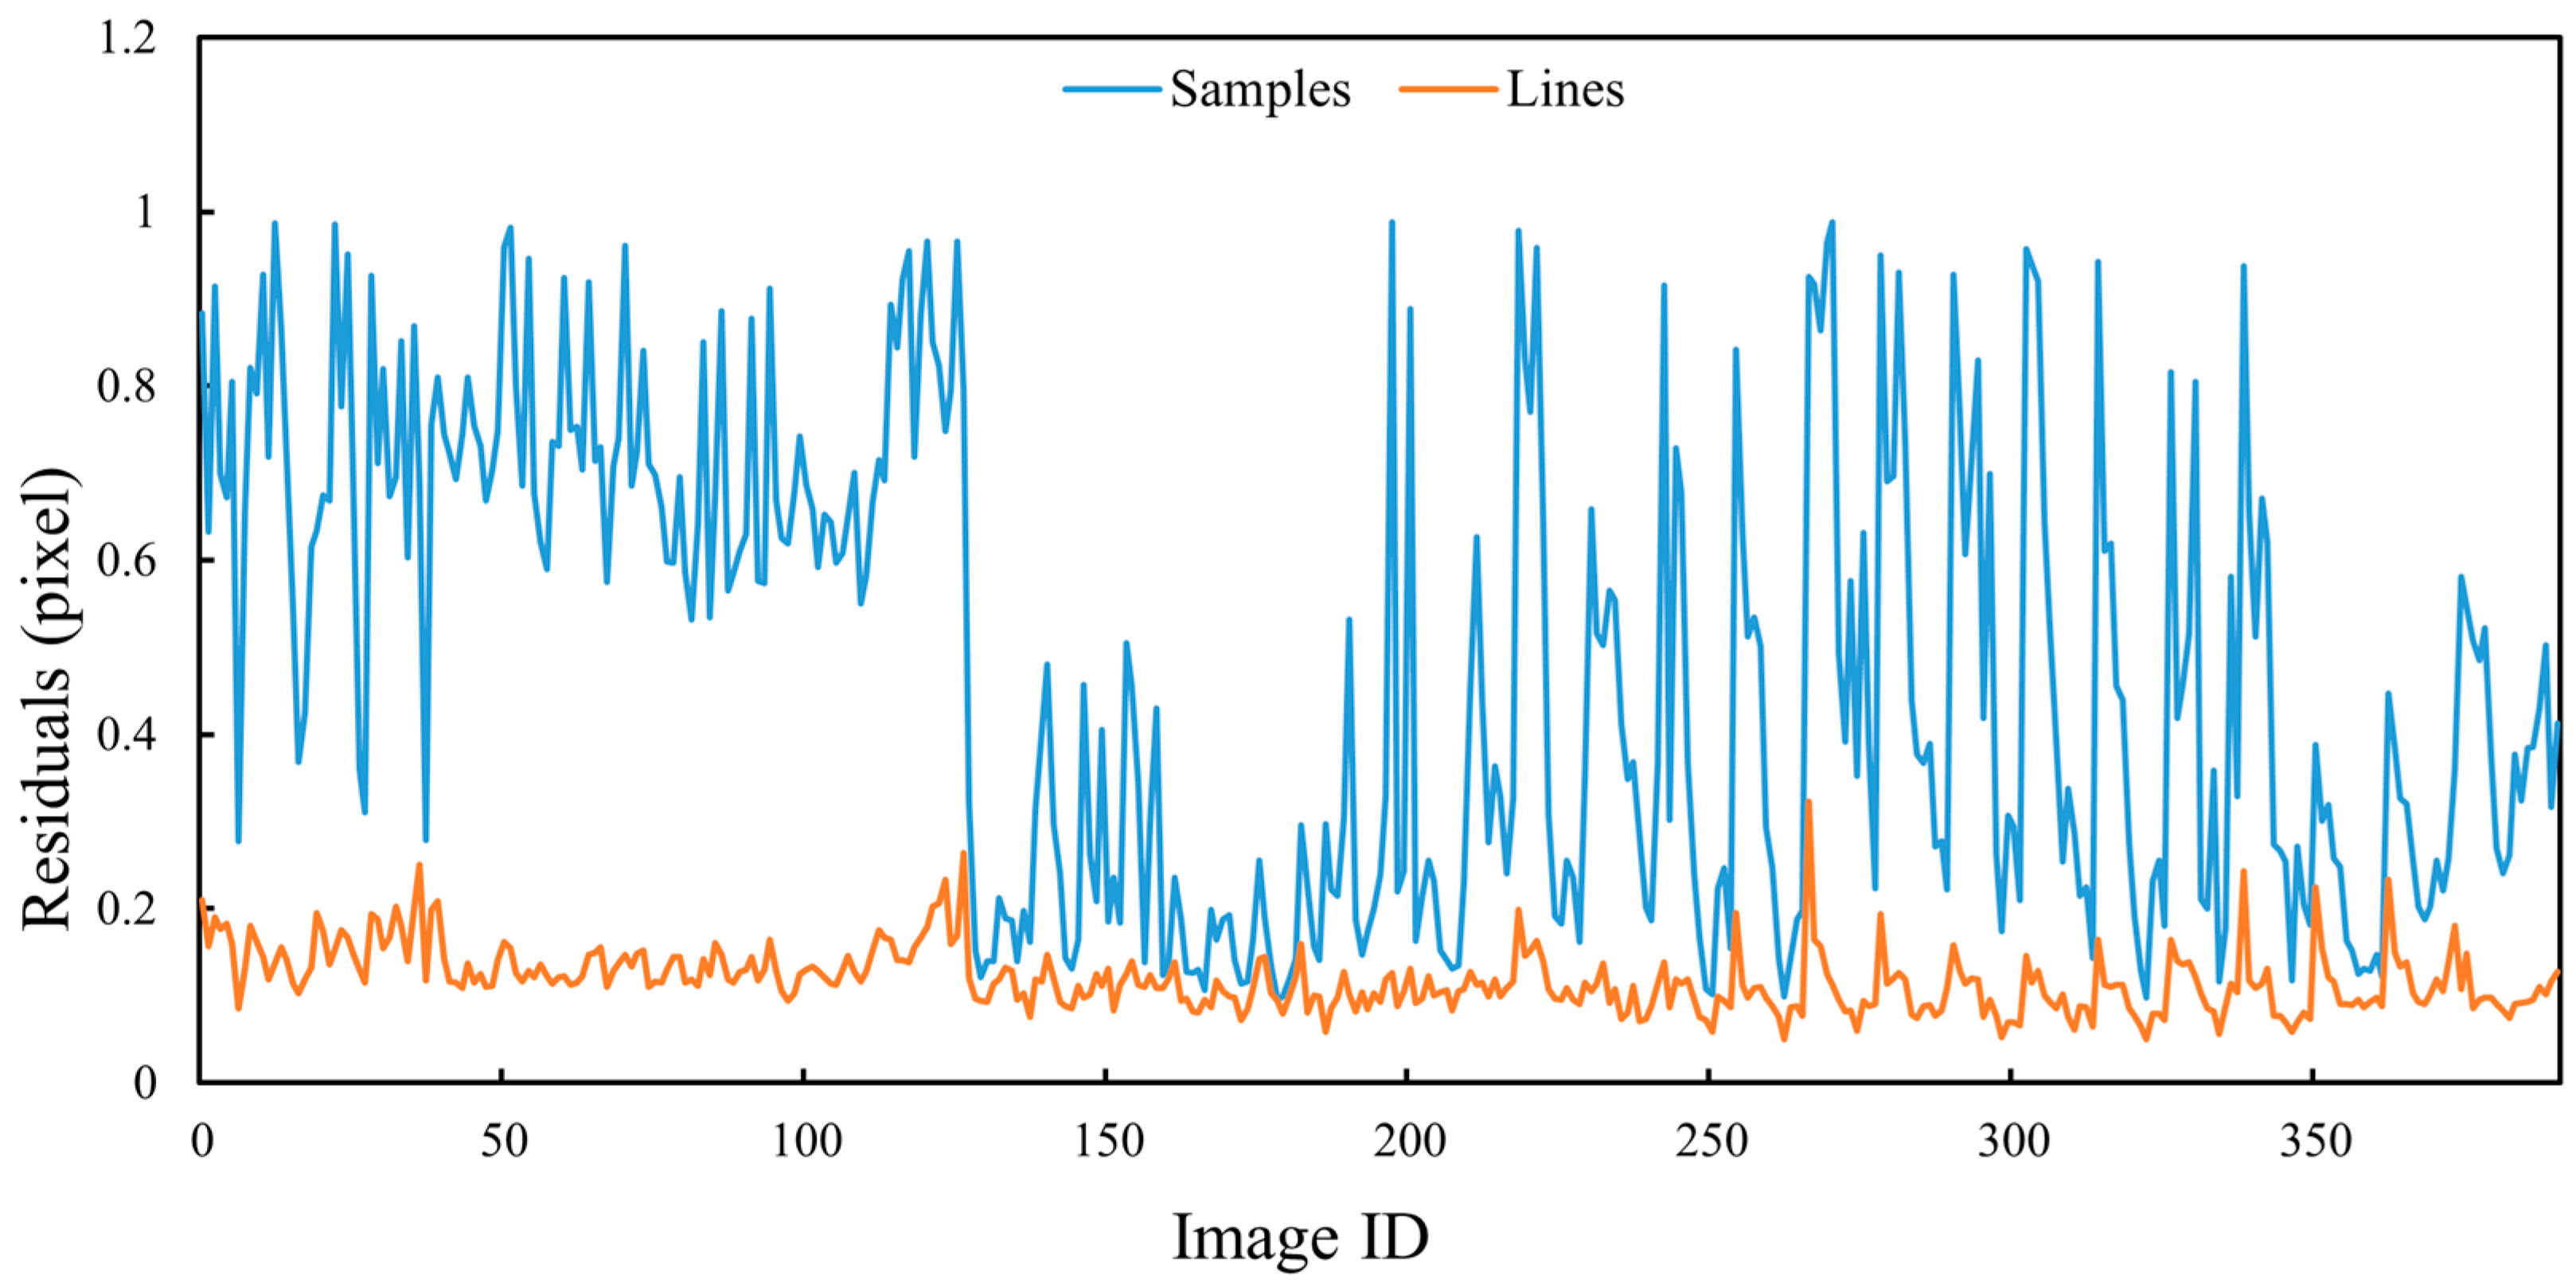
Figure 23.
The geometric positioning accuracy of control points for Test 1 data.
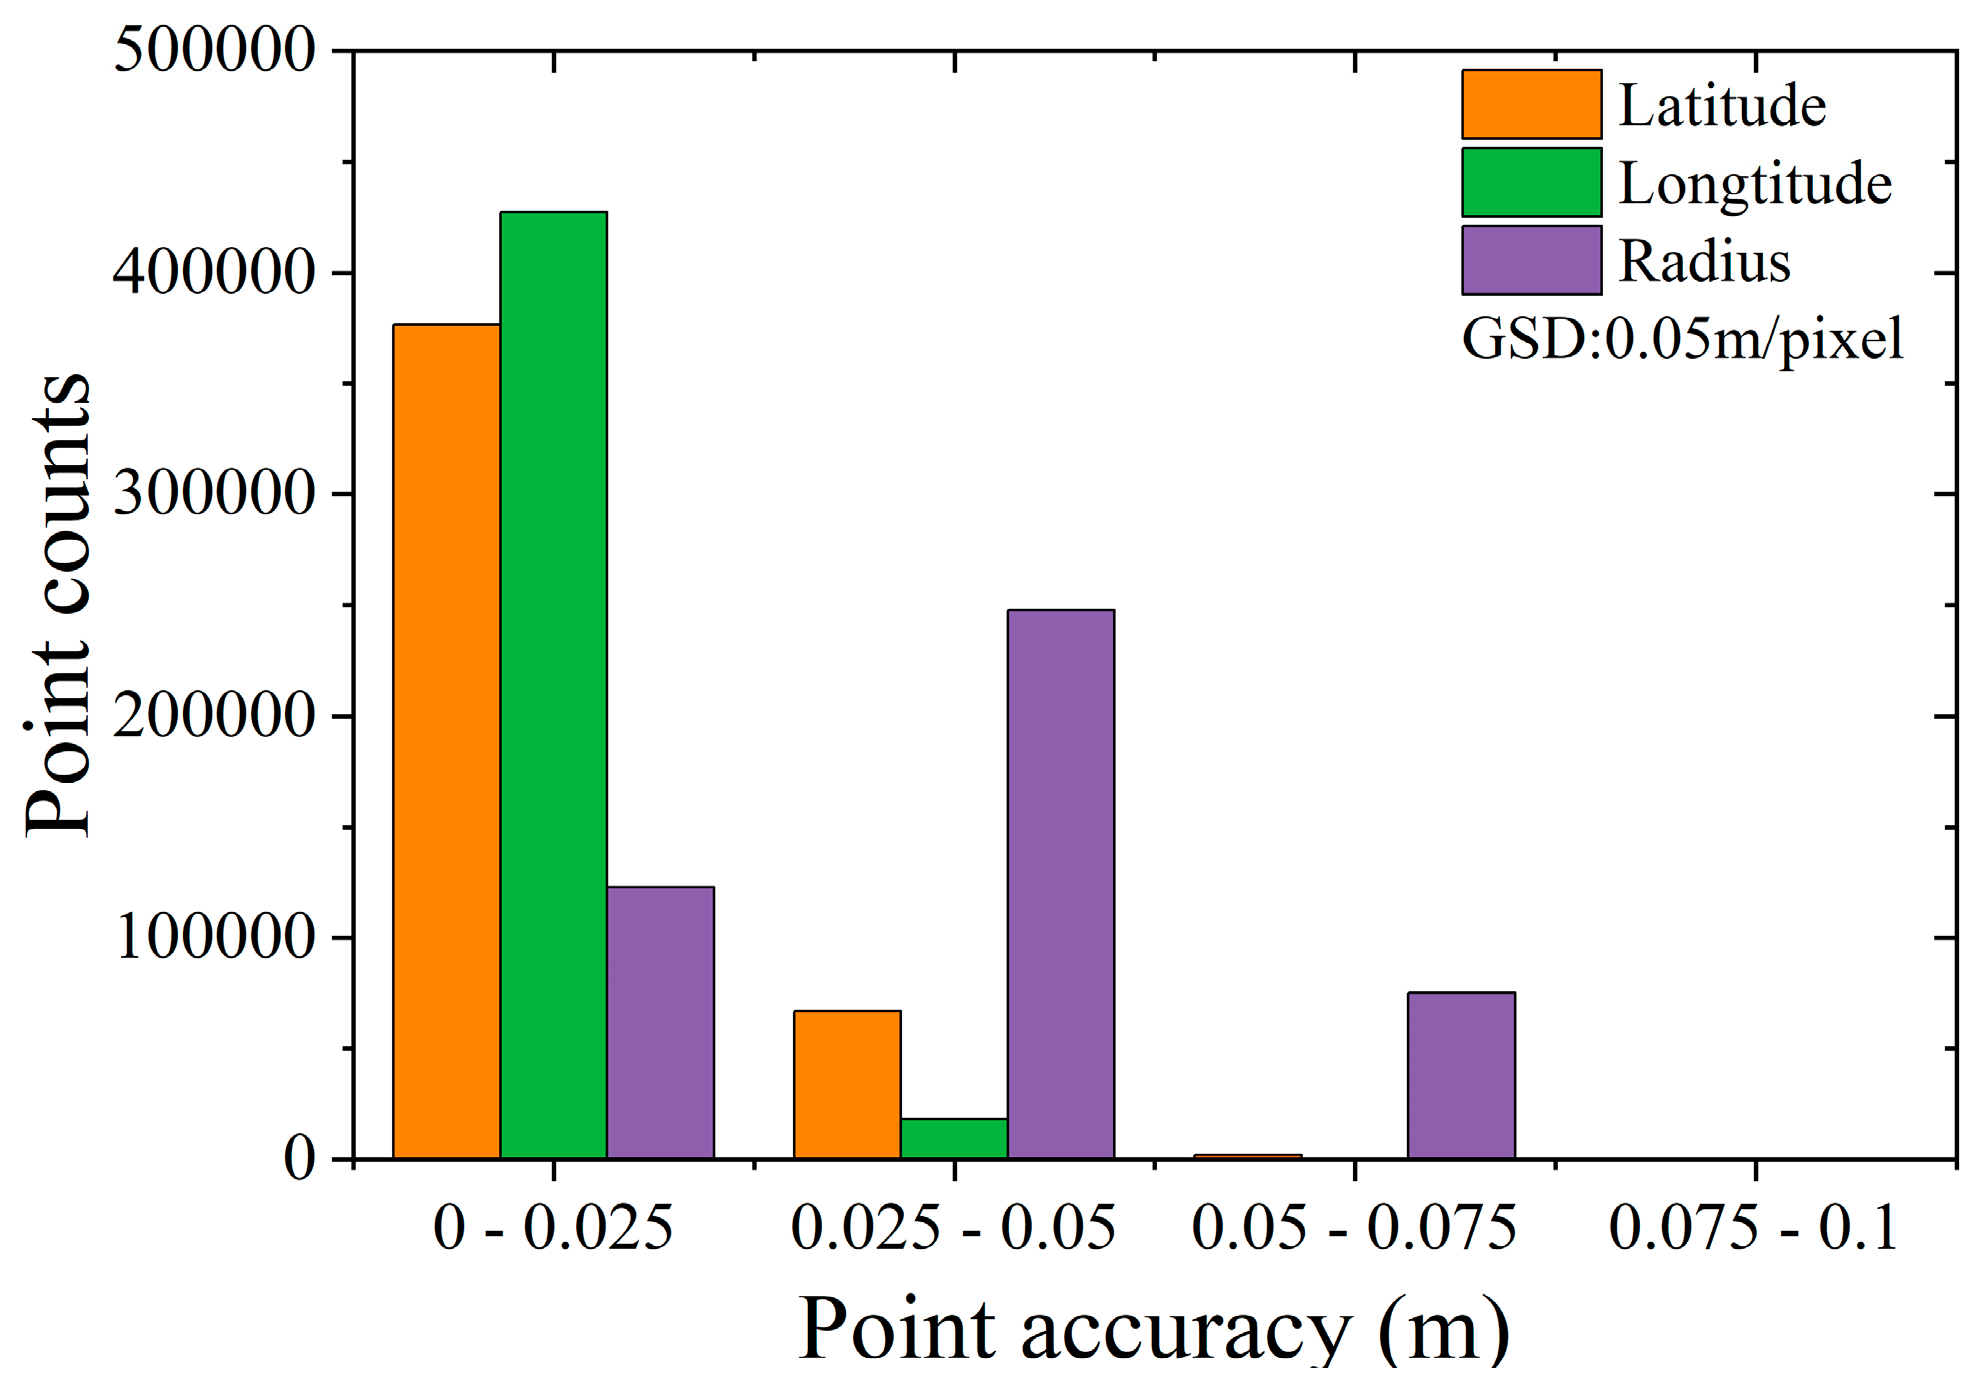
Figure 24.
The same as Figure 23 but for Test 2 data.
Figure 24.
The same as Figure 23 but for Test 2 data.
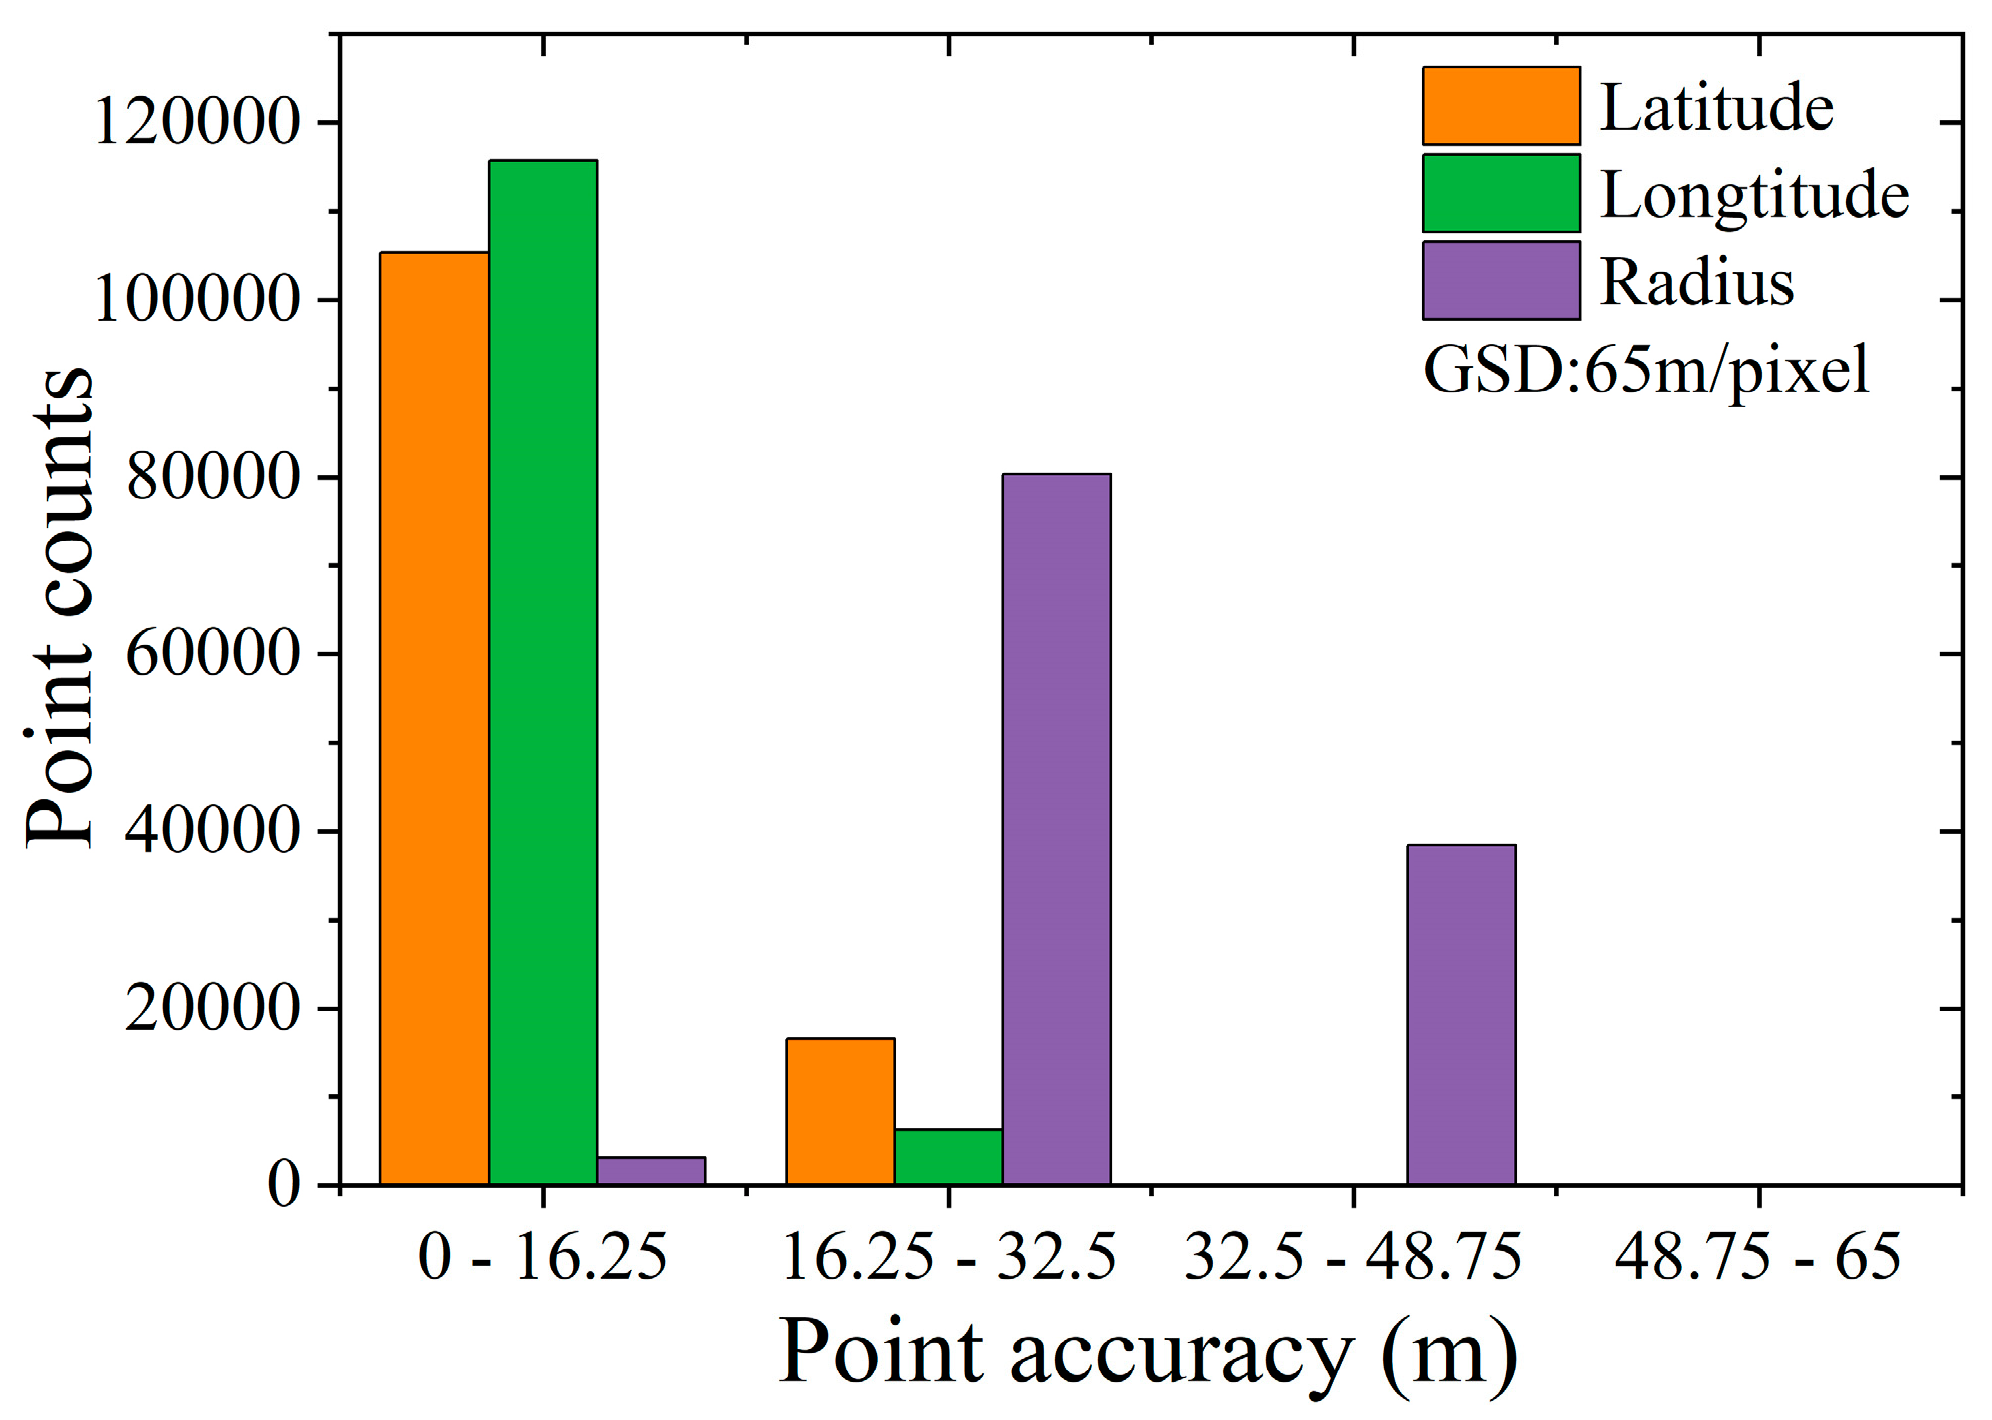
Figure 25.
The same as Figure 23 but for Test 3 data. We use 1m as the average resolution.
Figure 25.
The same as Figure 23 but for Test 3 data. We use 1m as the average resolution.
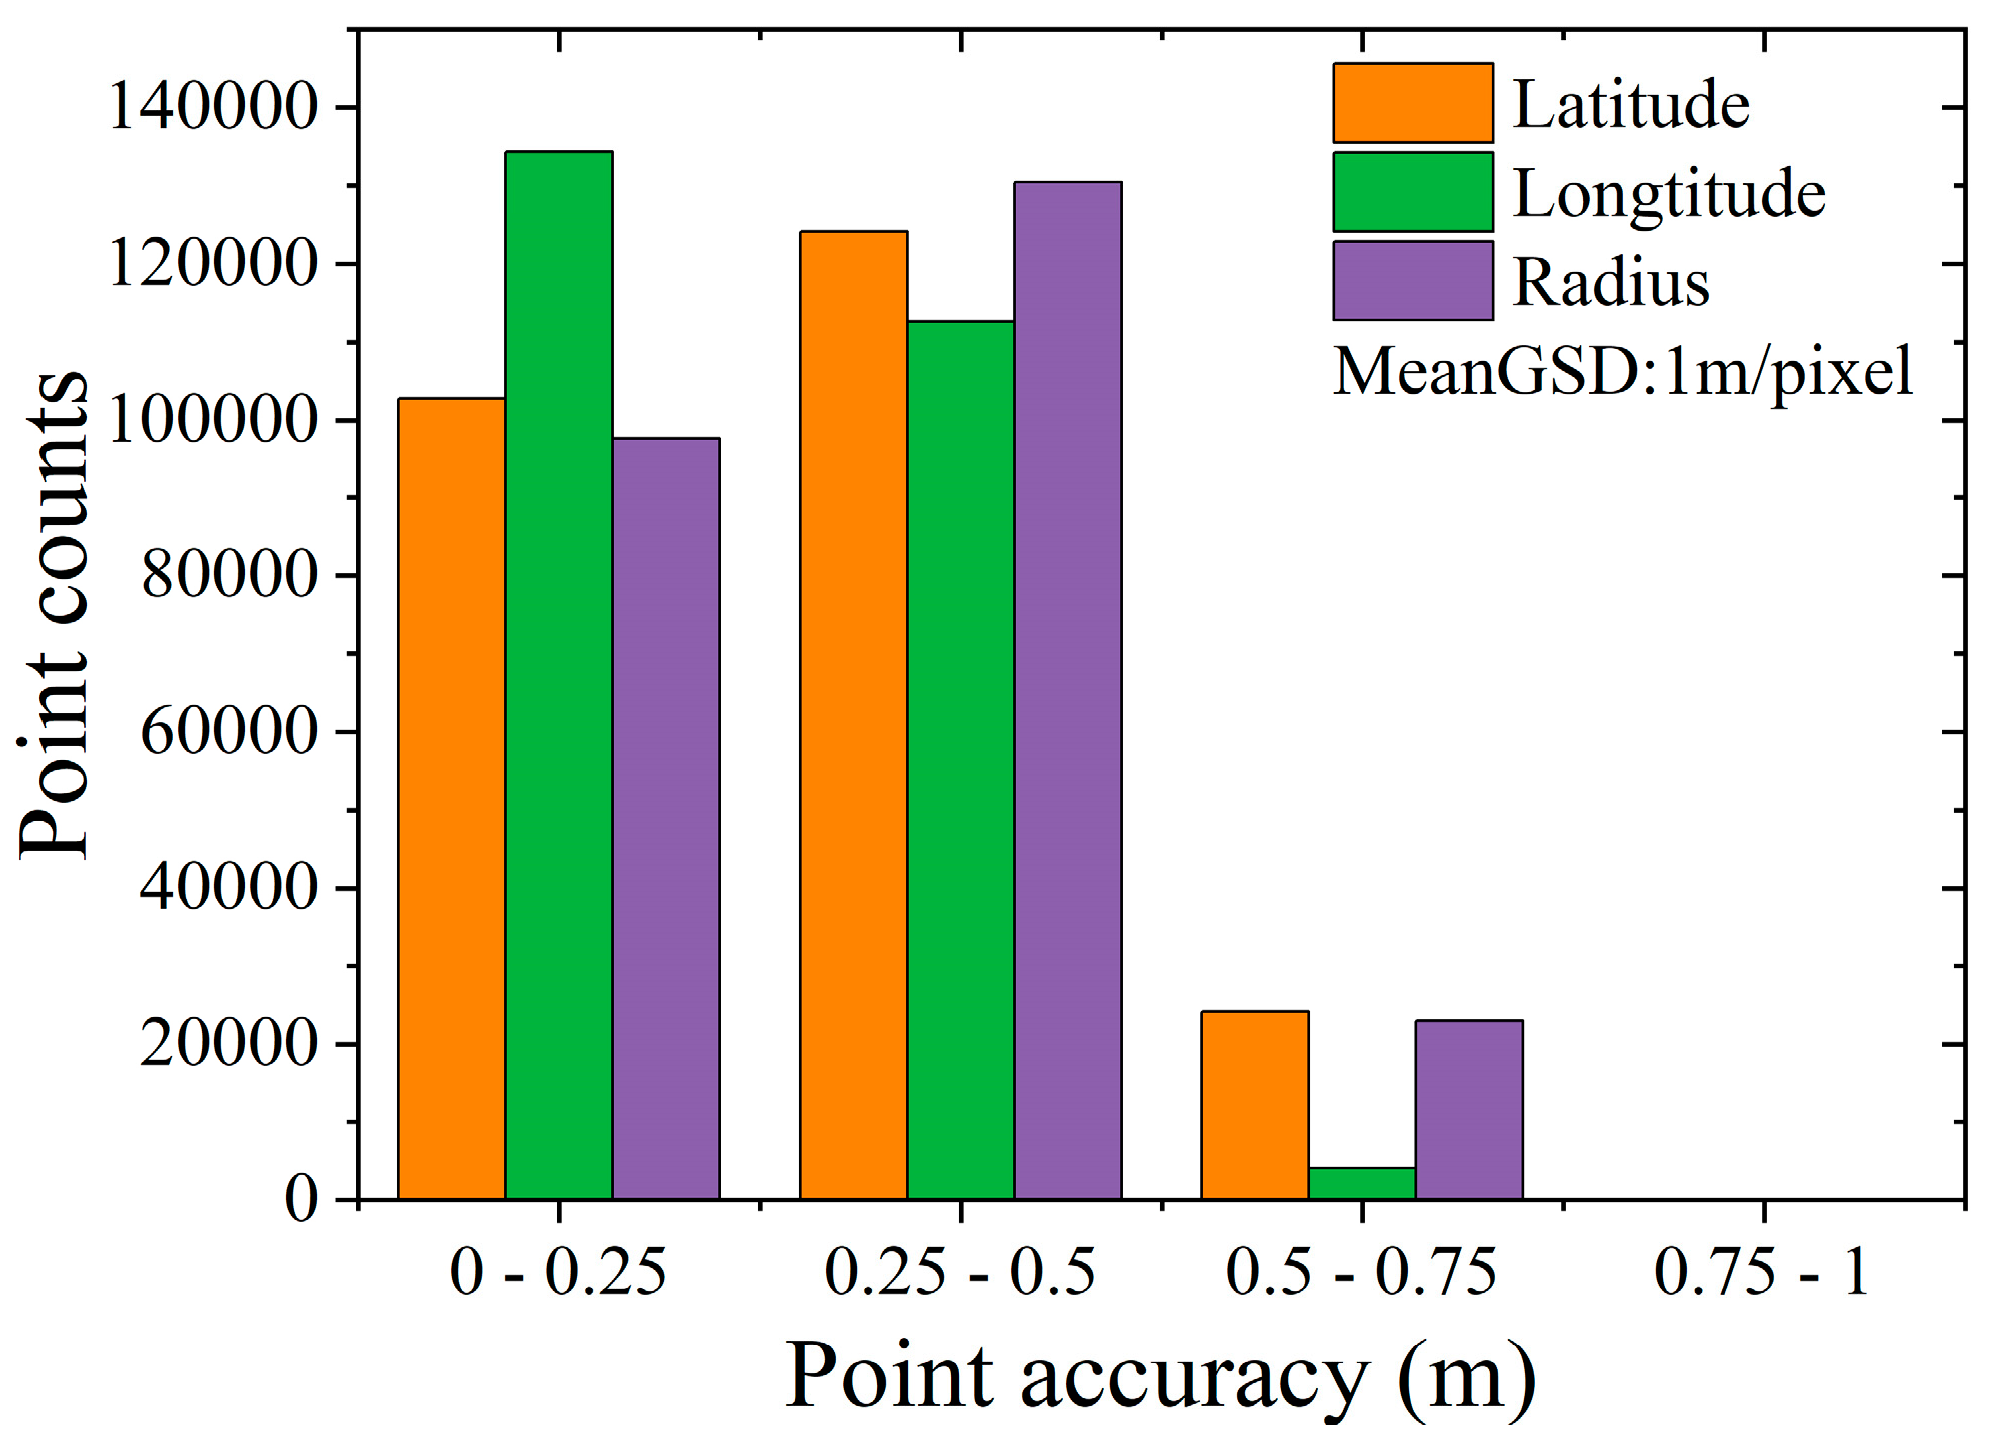
Figure 26.
The same as Figure 23 but for Test 4 data. We use 1.5m as the average resolution.
Figure 26.
The same as Figure 23 but for Test 4 data. We use 1.5m as the average resolution.
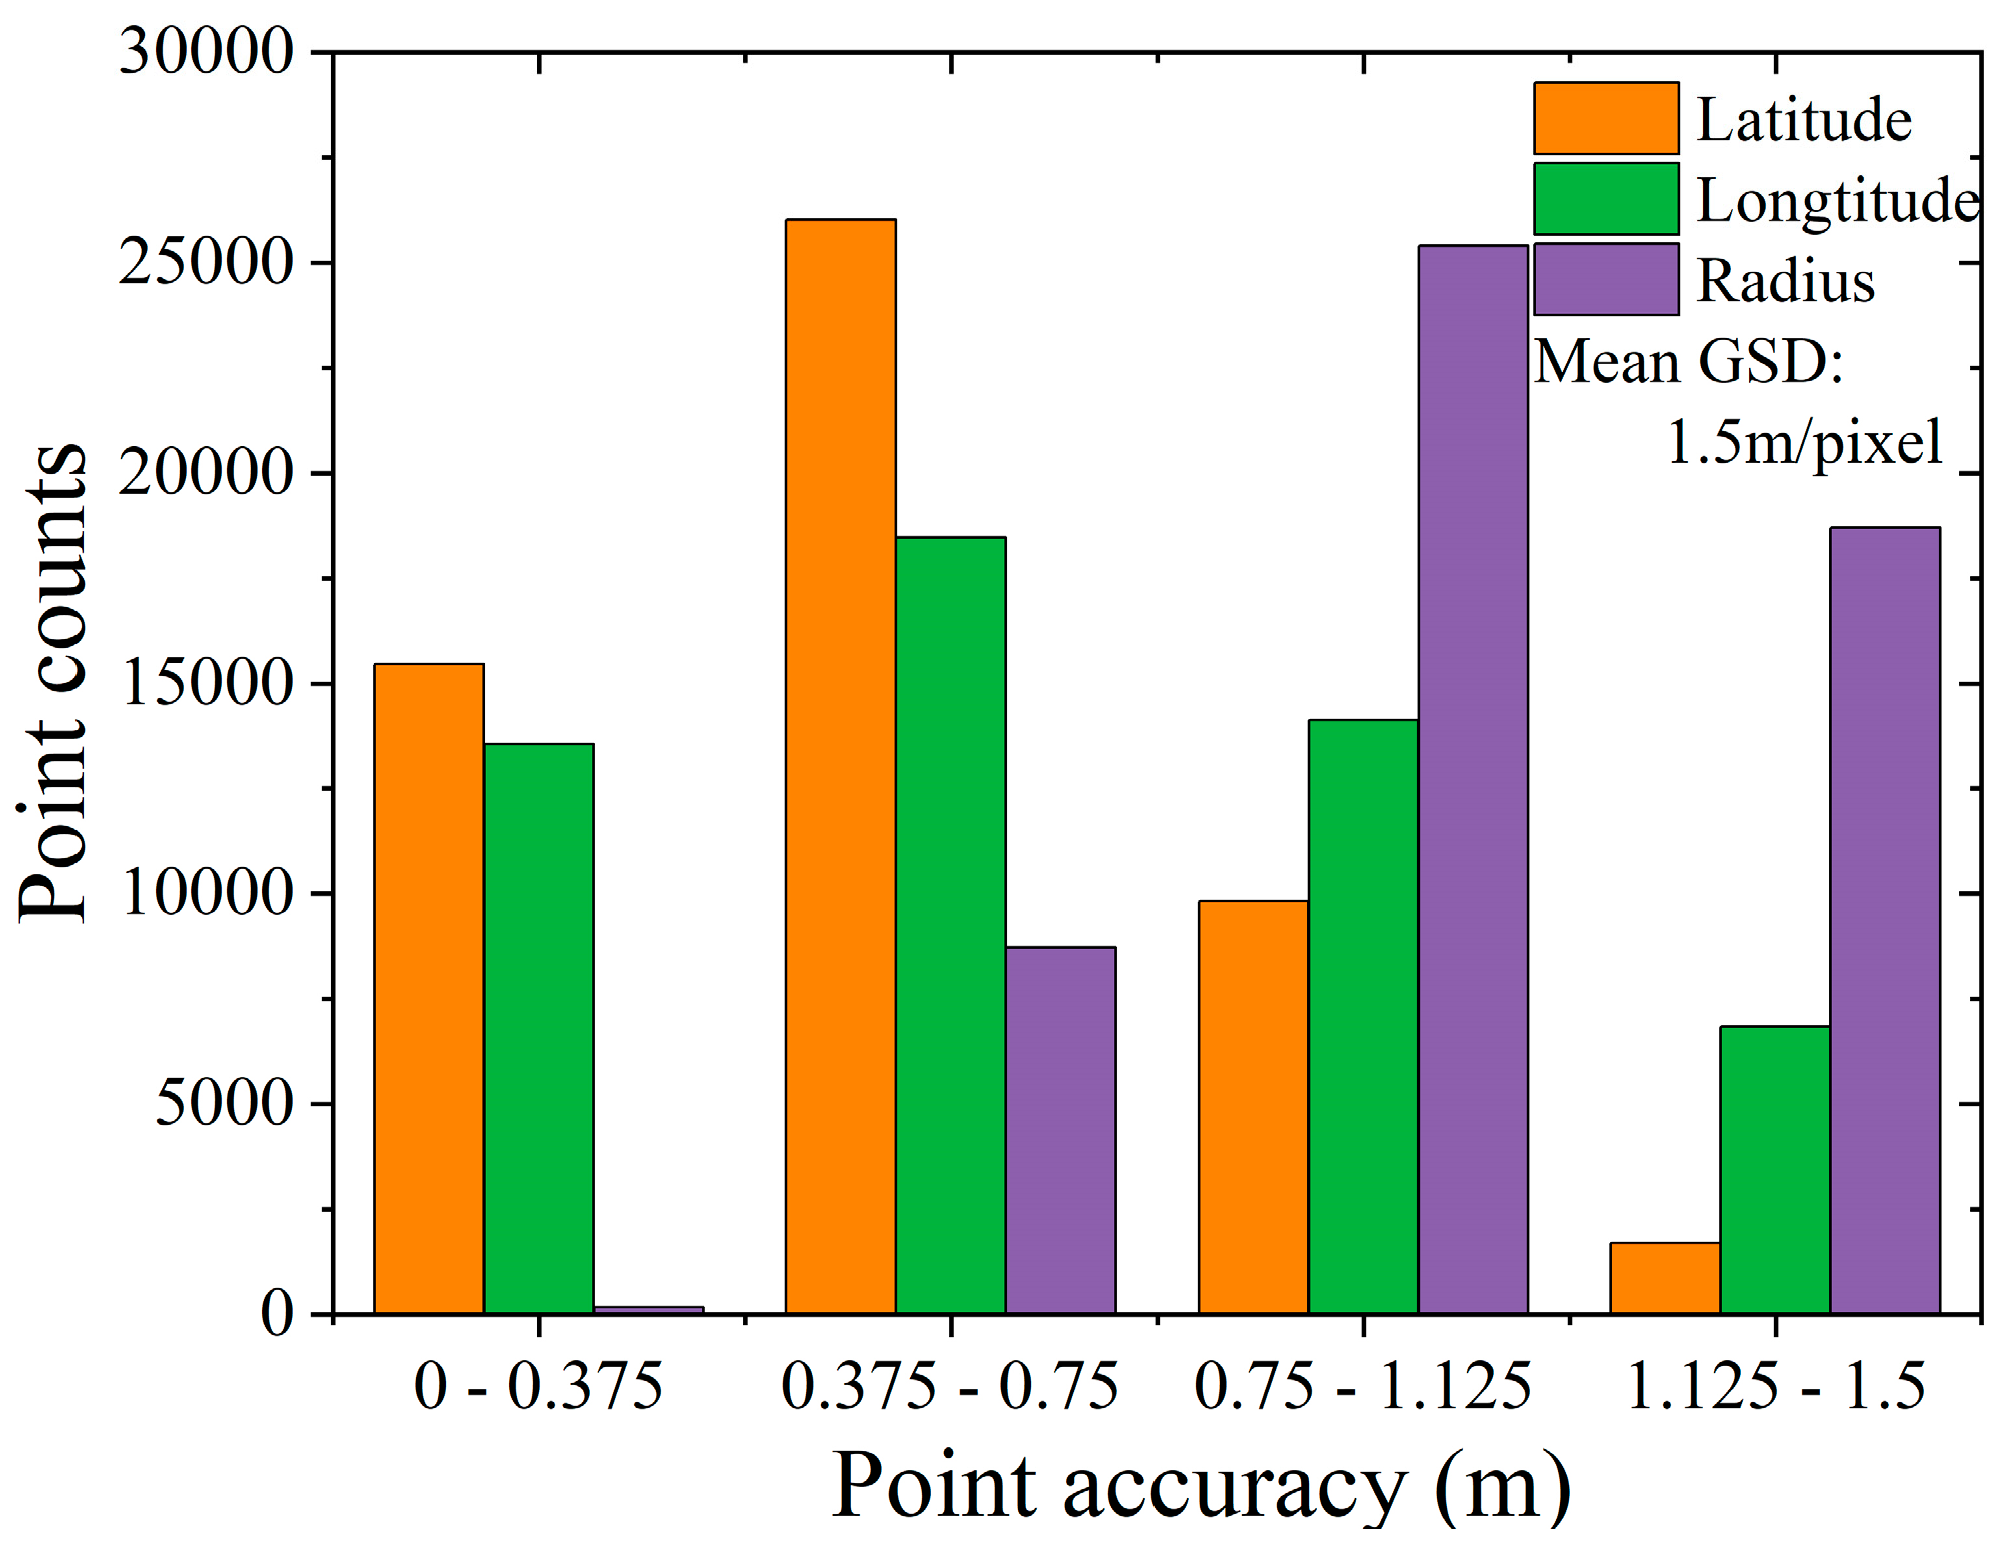
Figure 27.
DOM mosaic effect of Bennu. (a) Global low-resolution orthophoto mosaic of Bennu. (b) Local high-resolution orthophoto mosaic of Bennu.
Figure 27.
DOM mosaic effect of Bennu. (a) Global low-resolution orthophoto mosaic of Bennu. (b) Local high-resolution orthophoto mosaic of Bennu.
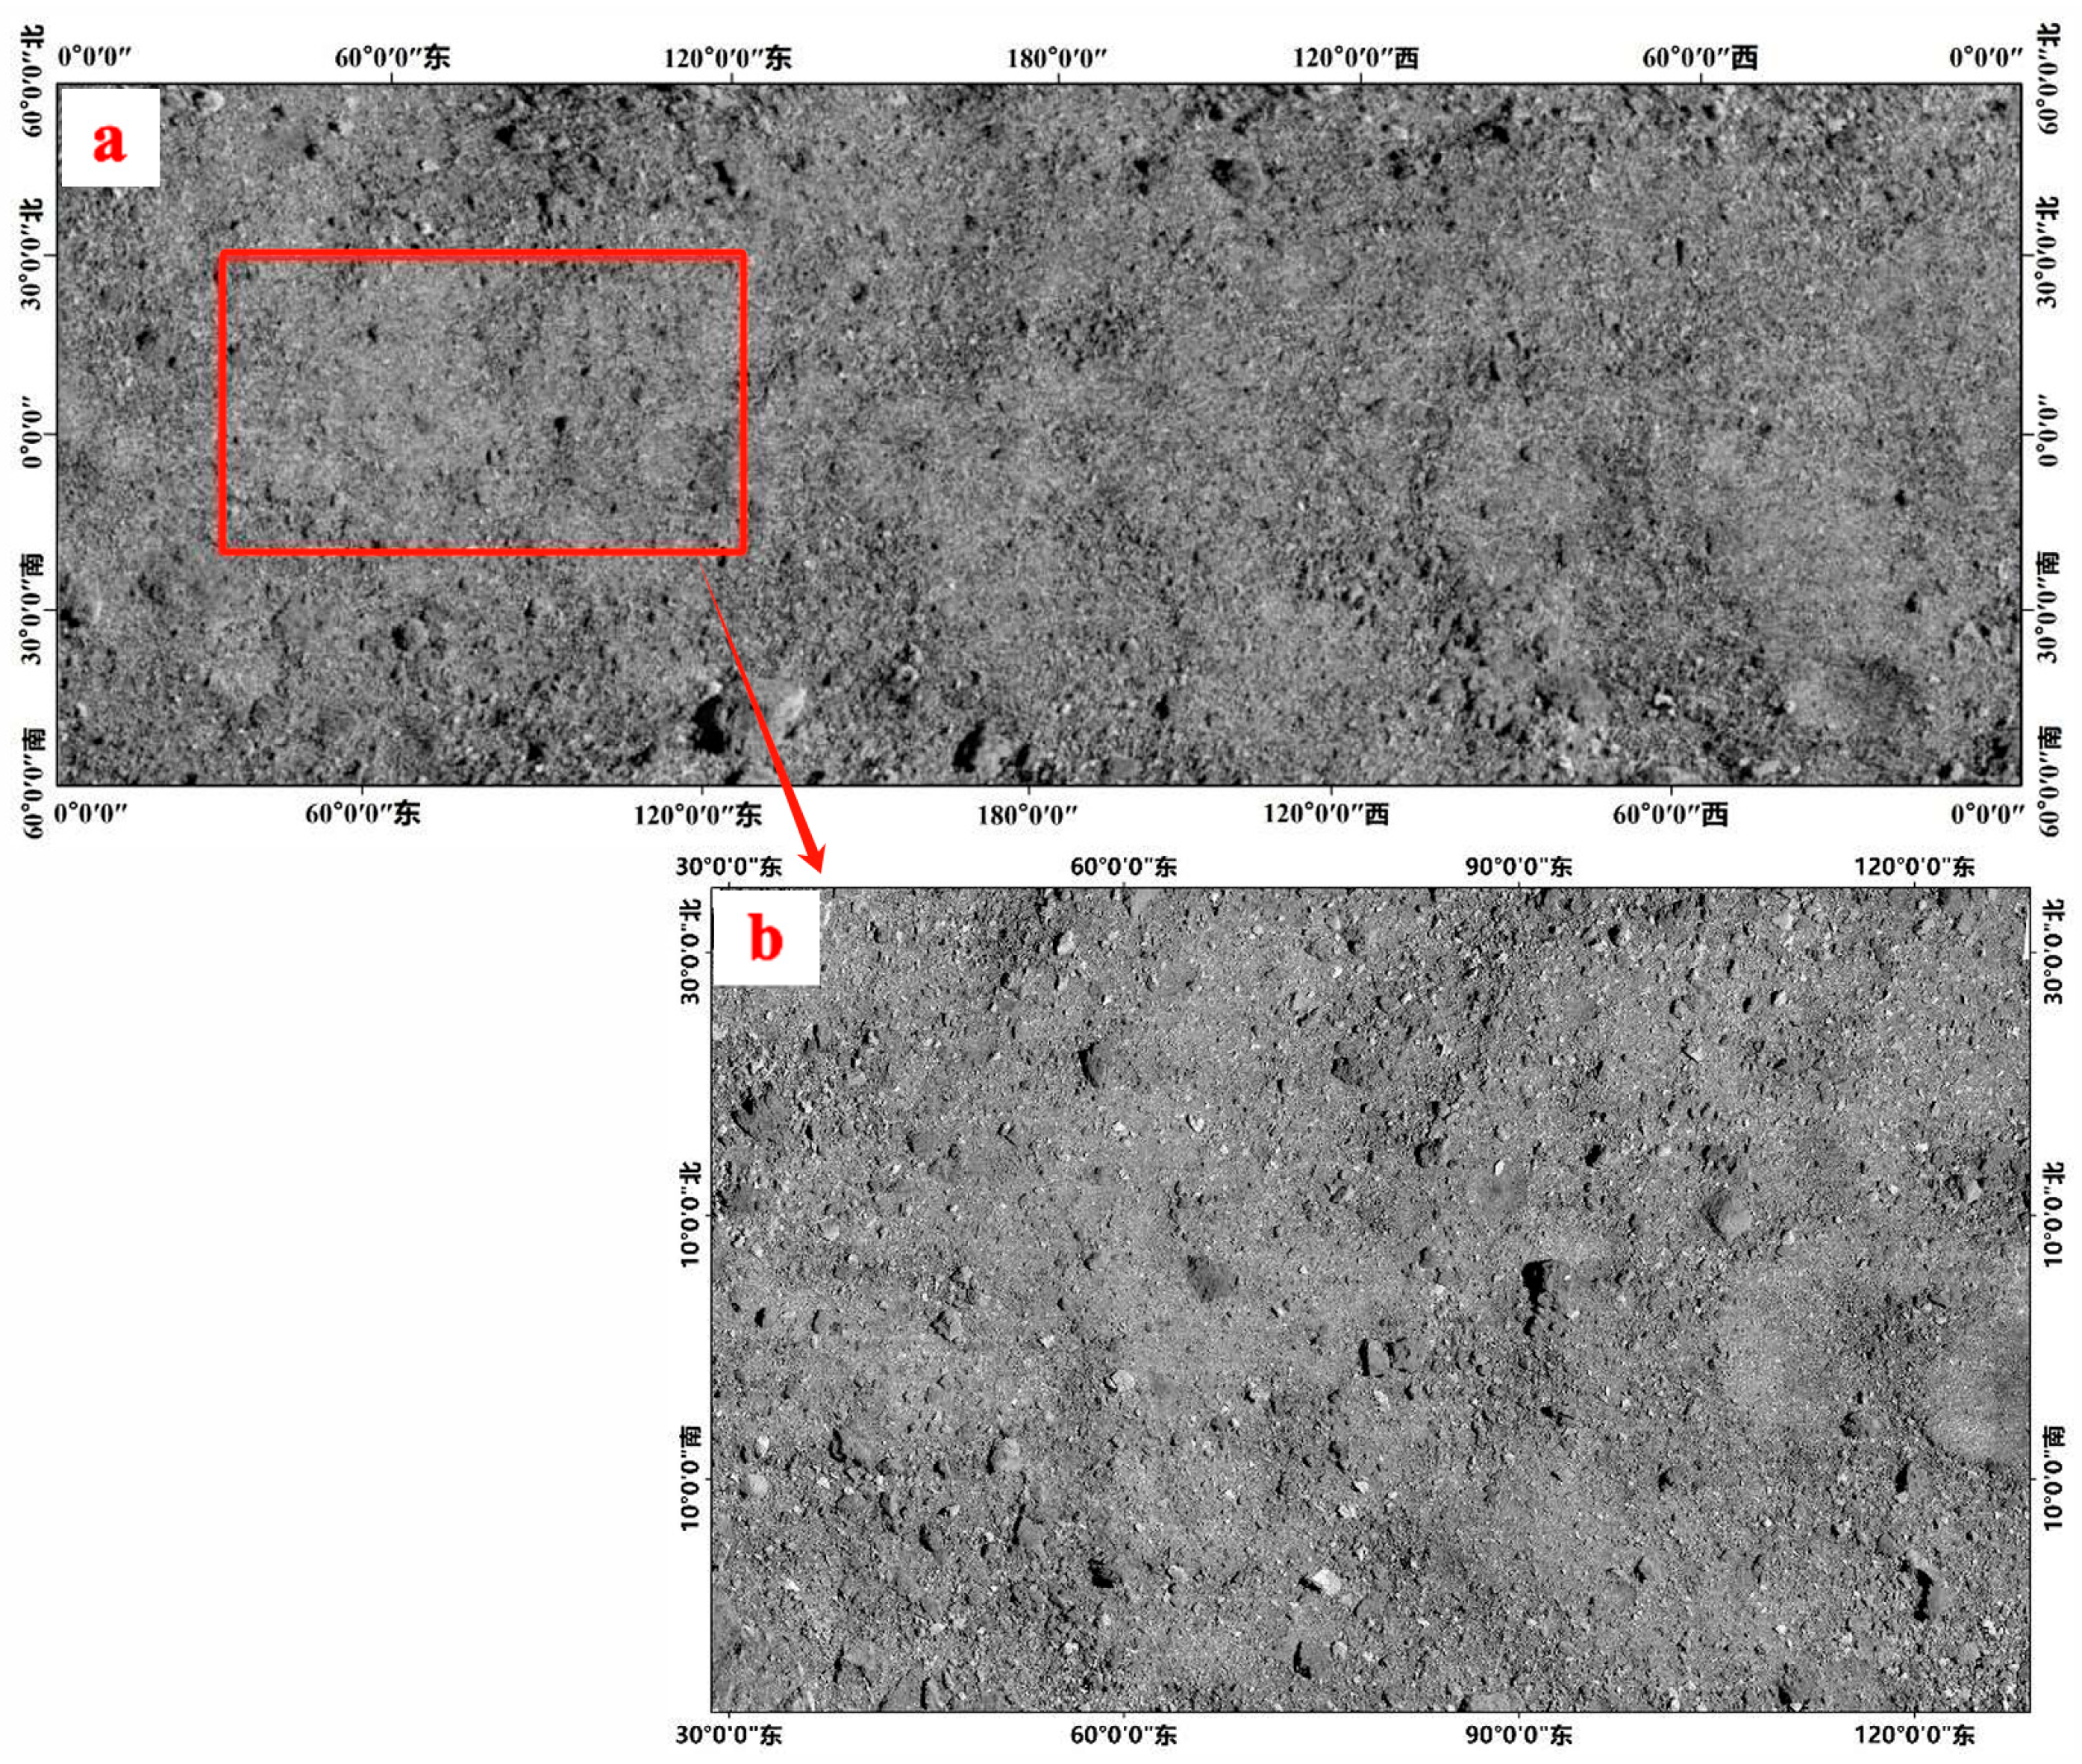
Figure 28.
DOM mosaic effect of Vesta. (a) DOM of the whole of Vesta. (b) Splicing results of different DOMs of the same area.
Figure 28.
DOM mosaic effect of Vesta. (a) DOM of the whole of Vesta. (b) Splicing results of different DOMs of the same area.

Figure 29.
The process of selecting optimal images for SPC reconstruction. (a) Original images for the large test area (70 images). (b) The preliminary selected overlapping images using the proposed KD tree-based method (22 images). (c) Selected optimal images that meet the illumination and observation requirements of SPC (5 images). The black box in the figure is the experimental area for SPC reconstruction.
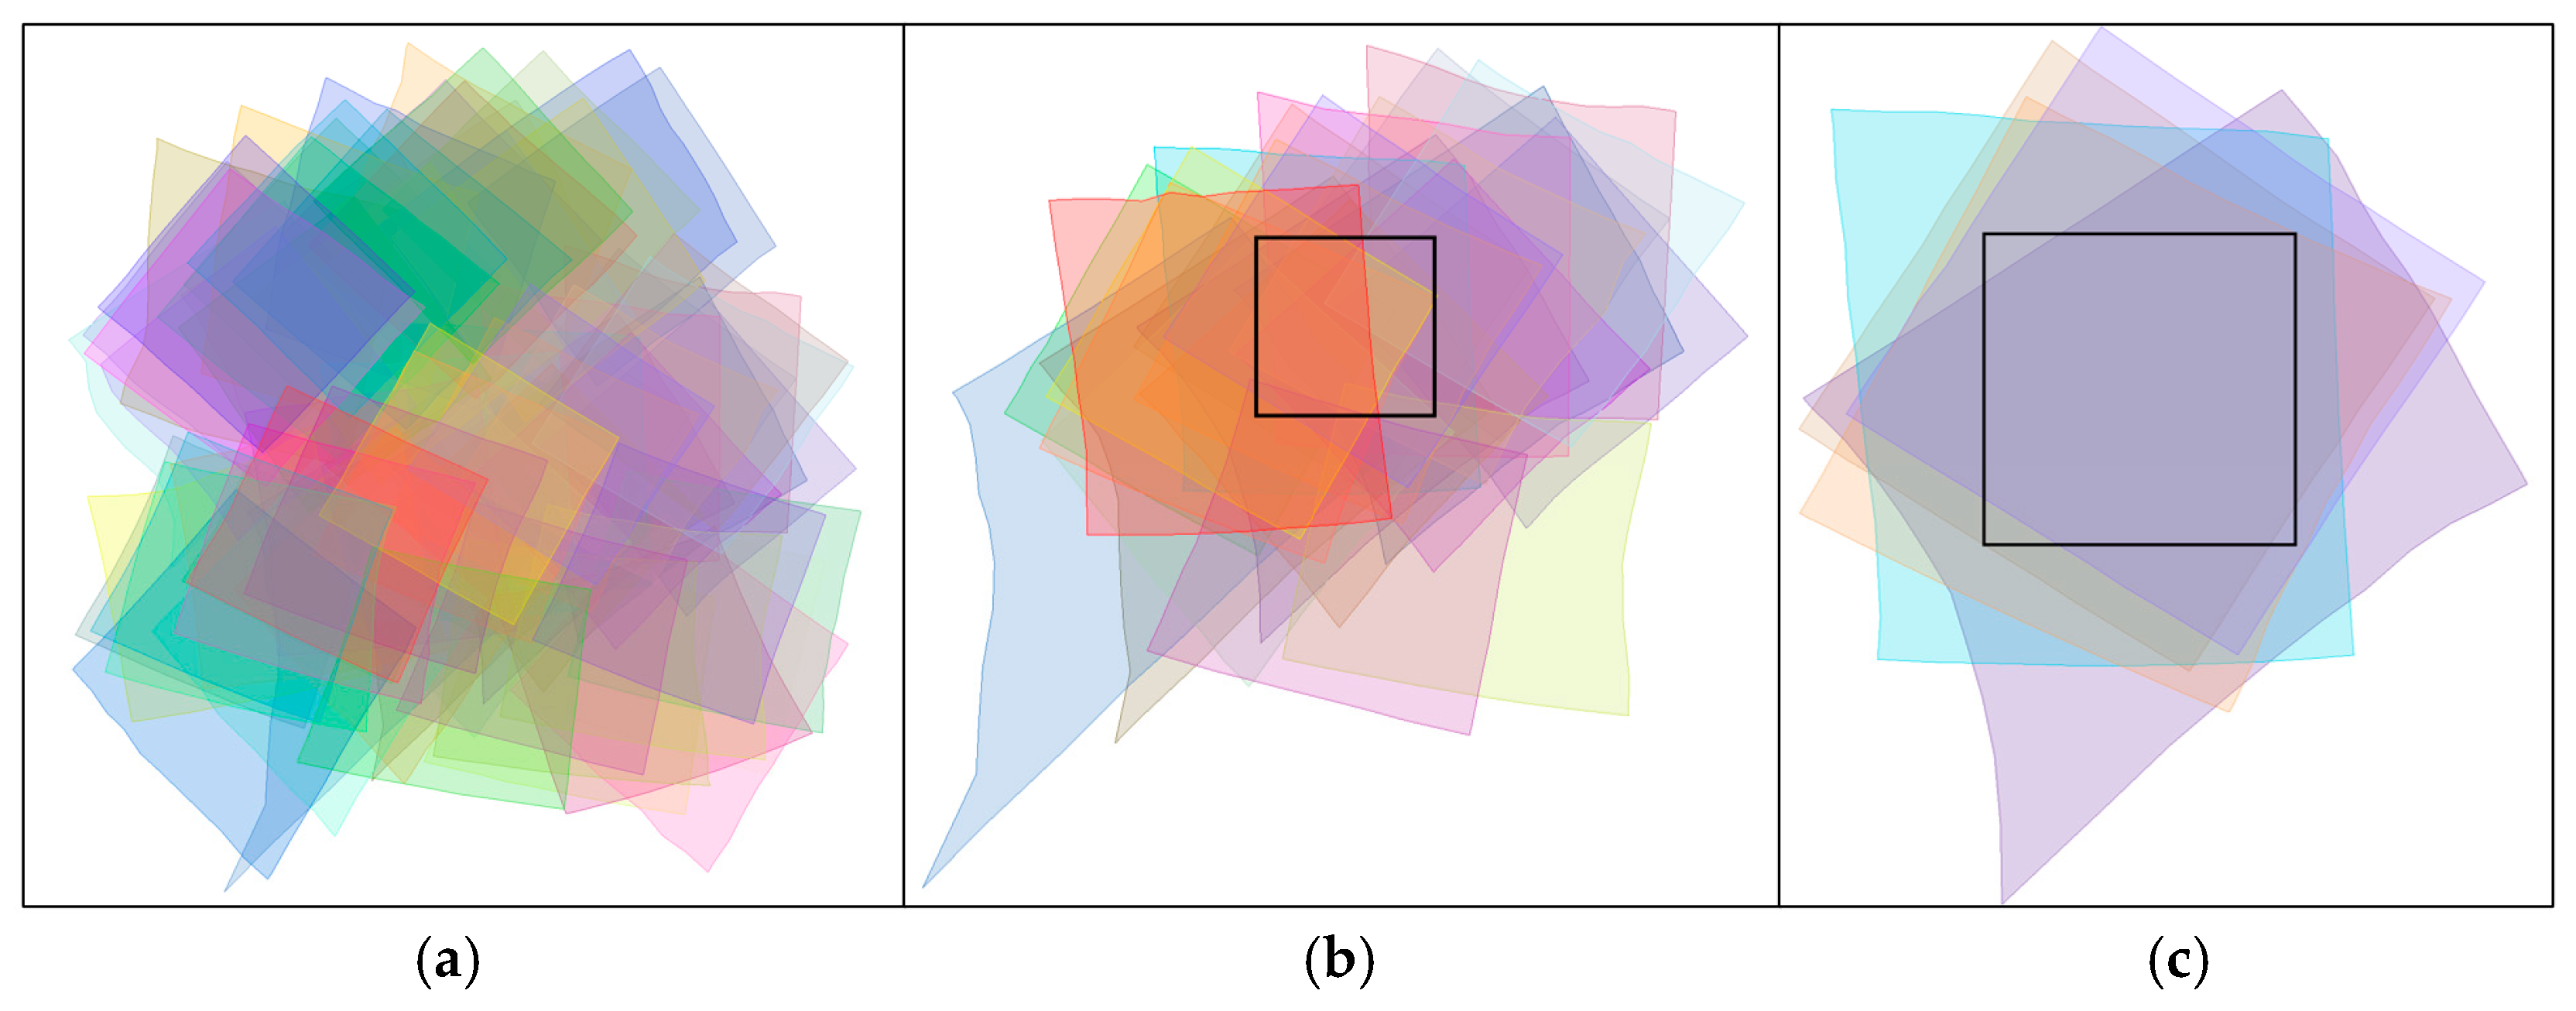
Figure 30.
Illumination and observation and conditions of Vesta images for SPC reconstruction. The green circles in the figure represent the five images that are finally selected and basically meet the requirements of SPC. (a) Solar azimuth and incidence angle. (b) spacecraft azimuth and emission angle.

Figure 31.
SPC reconstruction results. (a) original image of the test area, (b) reference DEM (with a resolution of 100 m/pixel), and (c) SPC-generated DEM.
Figure 31.
SPC reconstruction results. (a) original image of the test area, (b) reference DEM (with a resolution of 100 m/pixel), and (c) SPC-generated DEM.
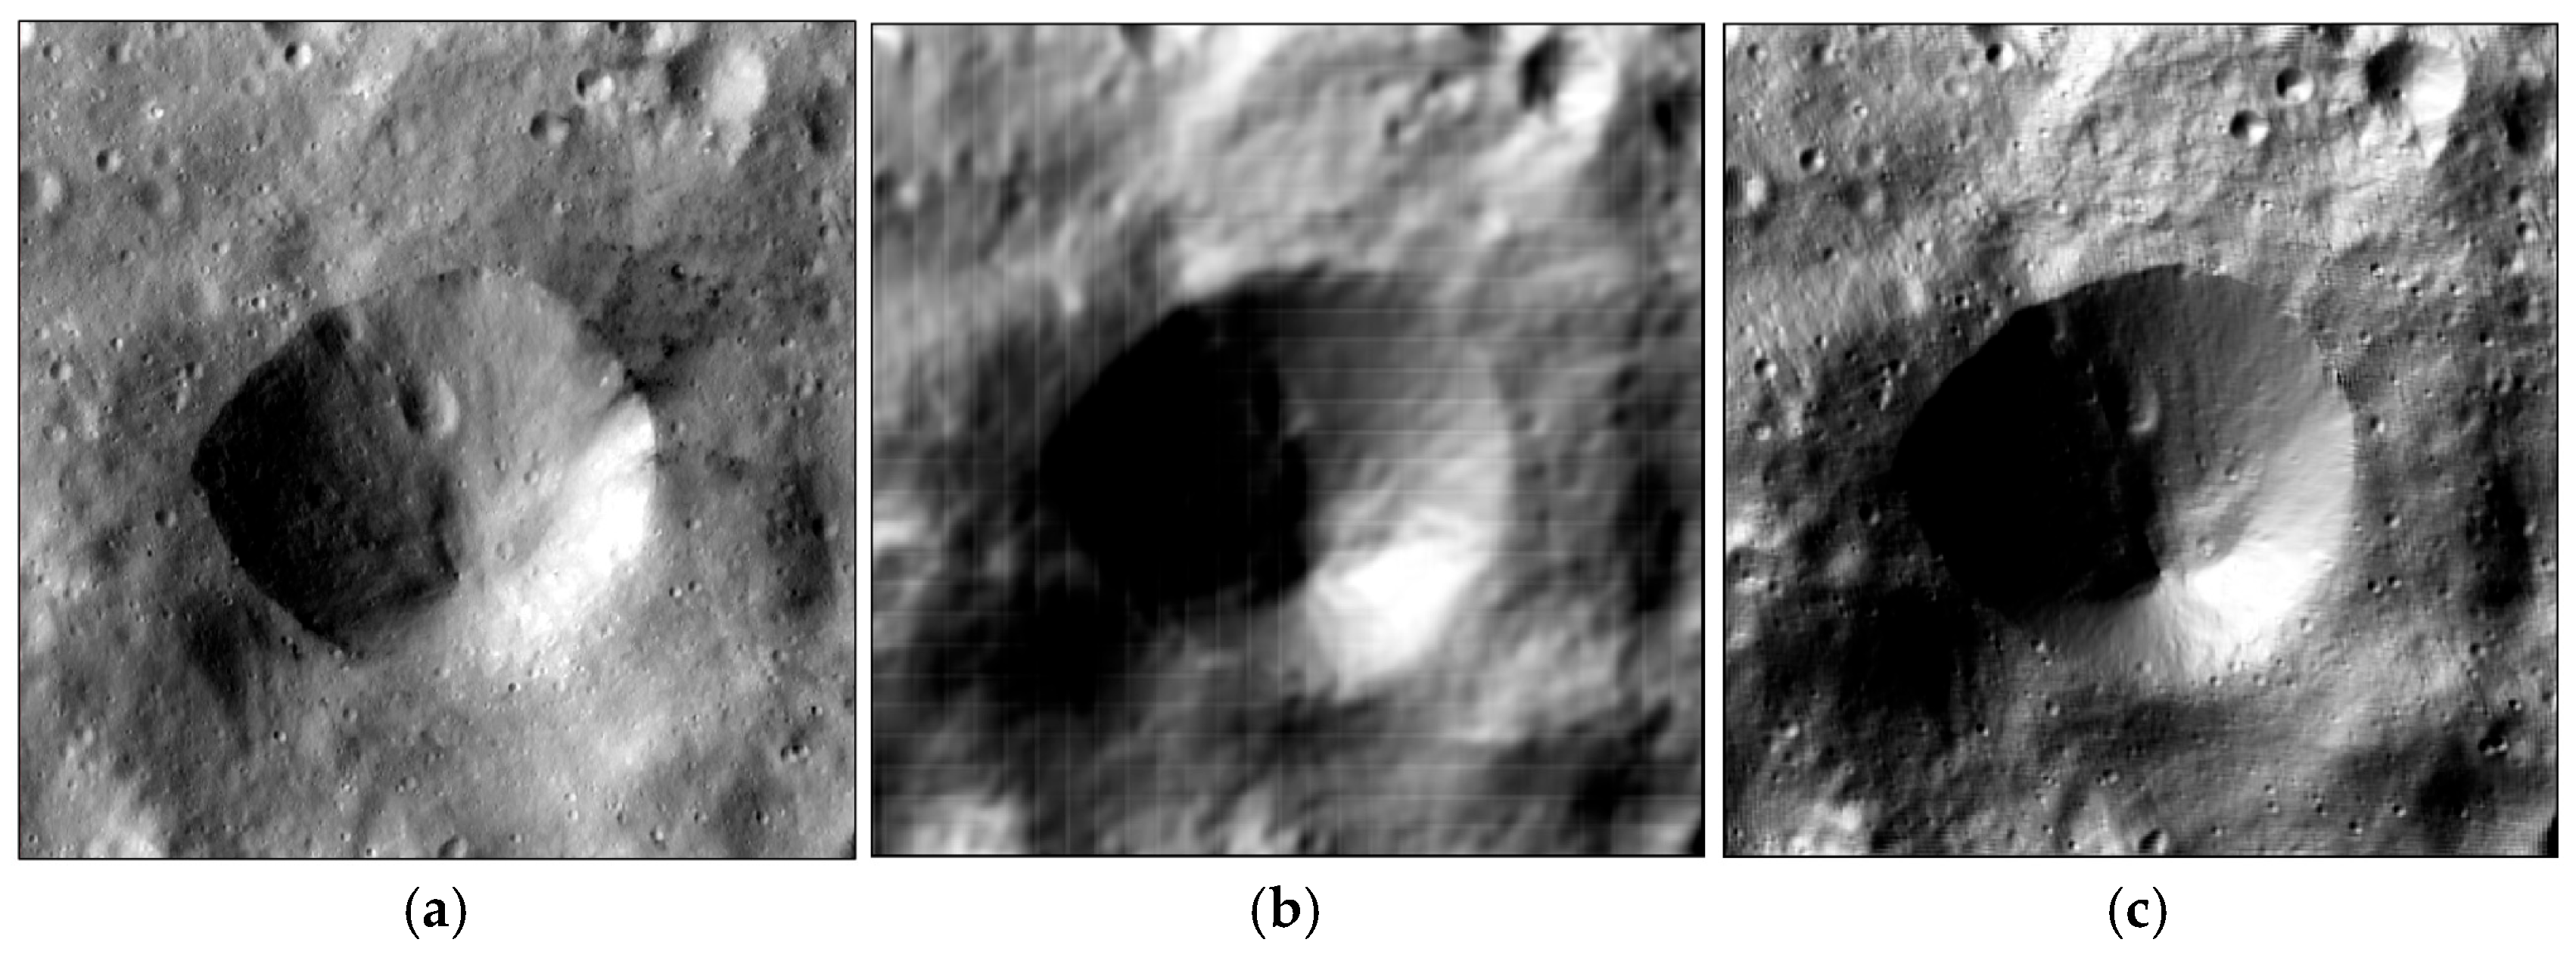
Figure 32.
Comparison results of SPC-generated DEMs with reference DEM. The red line in the lower left corner indicates the location of the sample points.
Figure 32.
Comparison results of SPC-generated DEMs with reference DEM. The red line in the lower left corner indicates the location of the sample points.
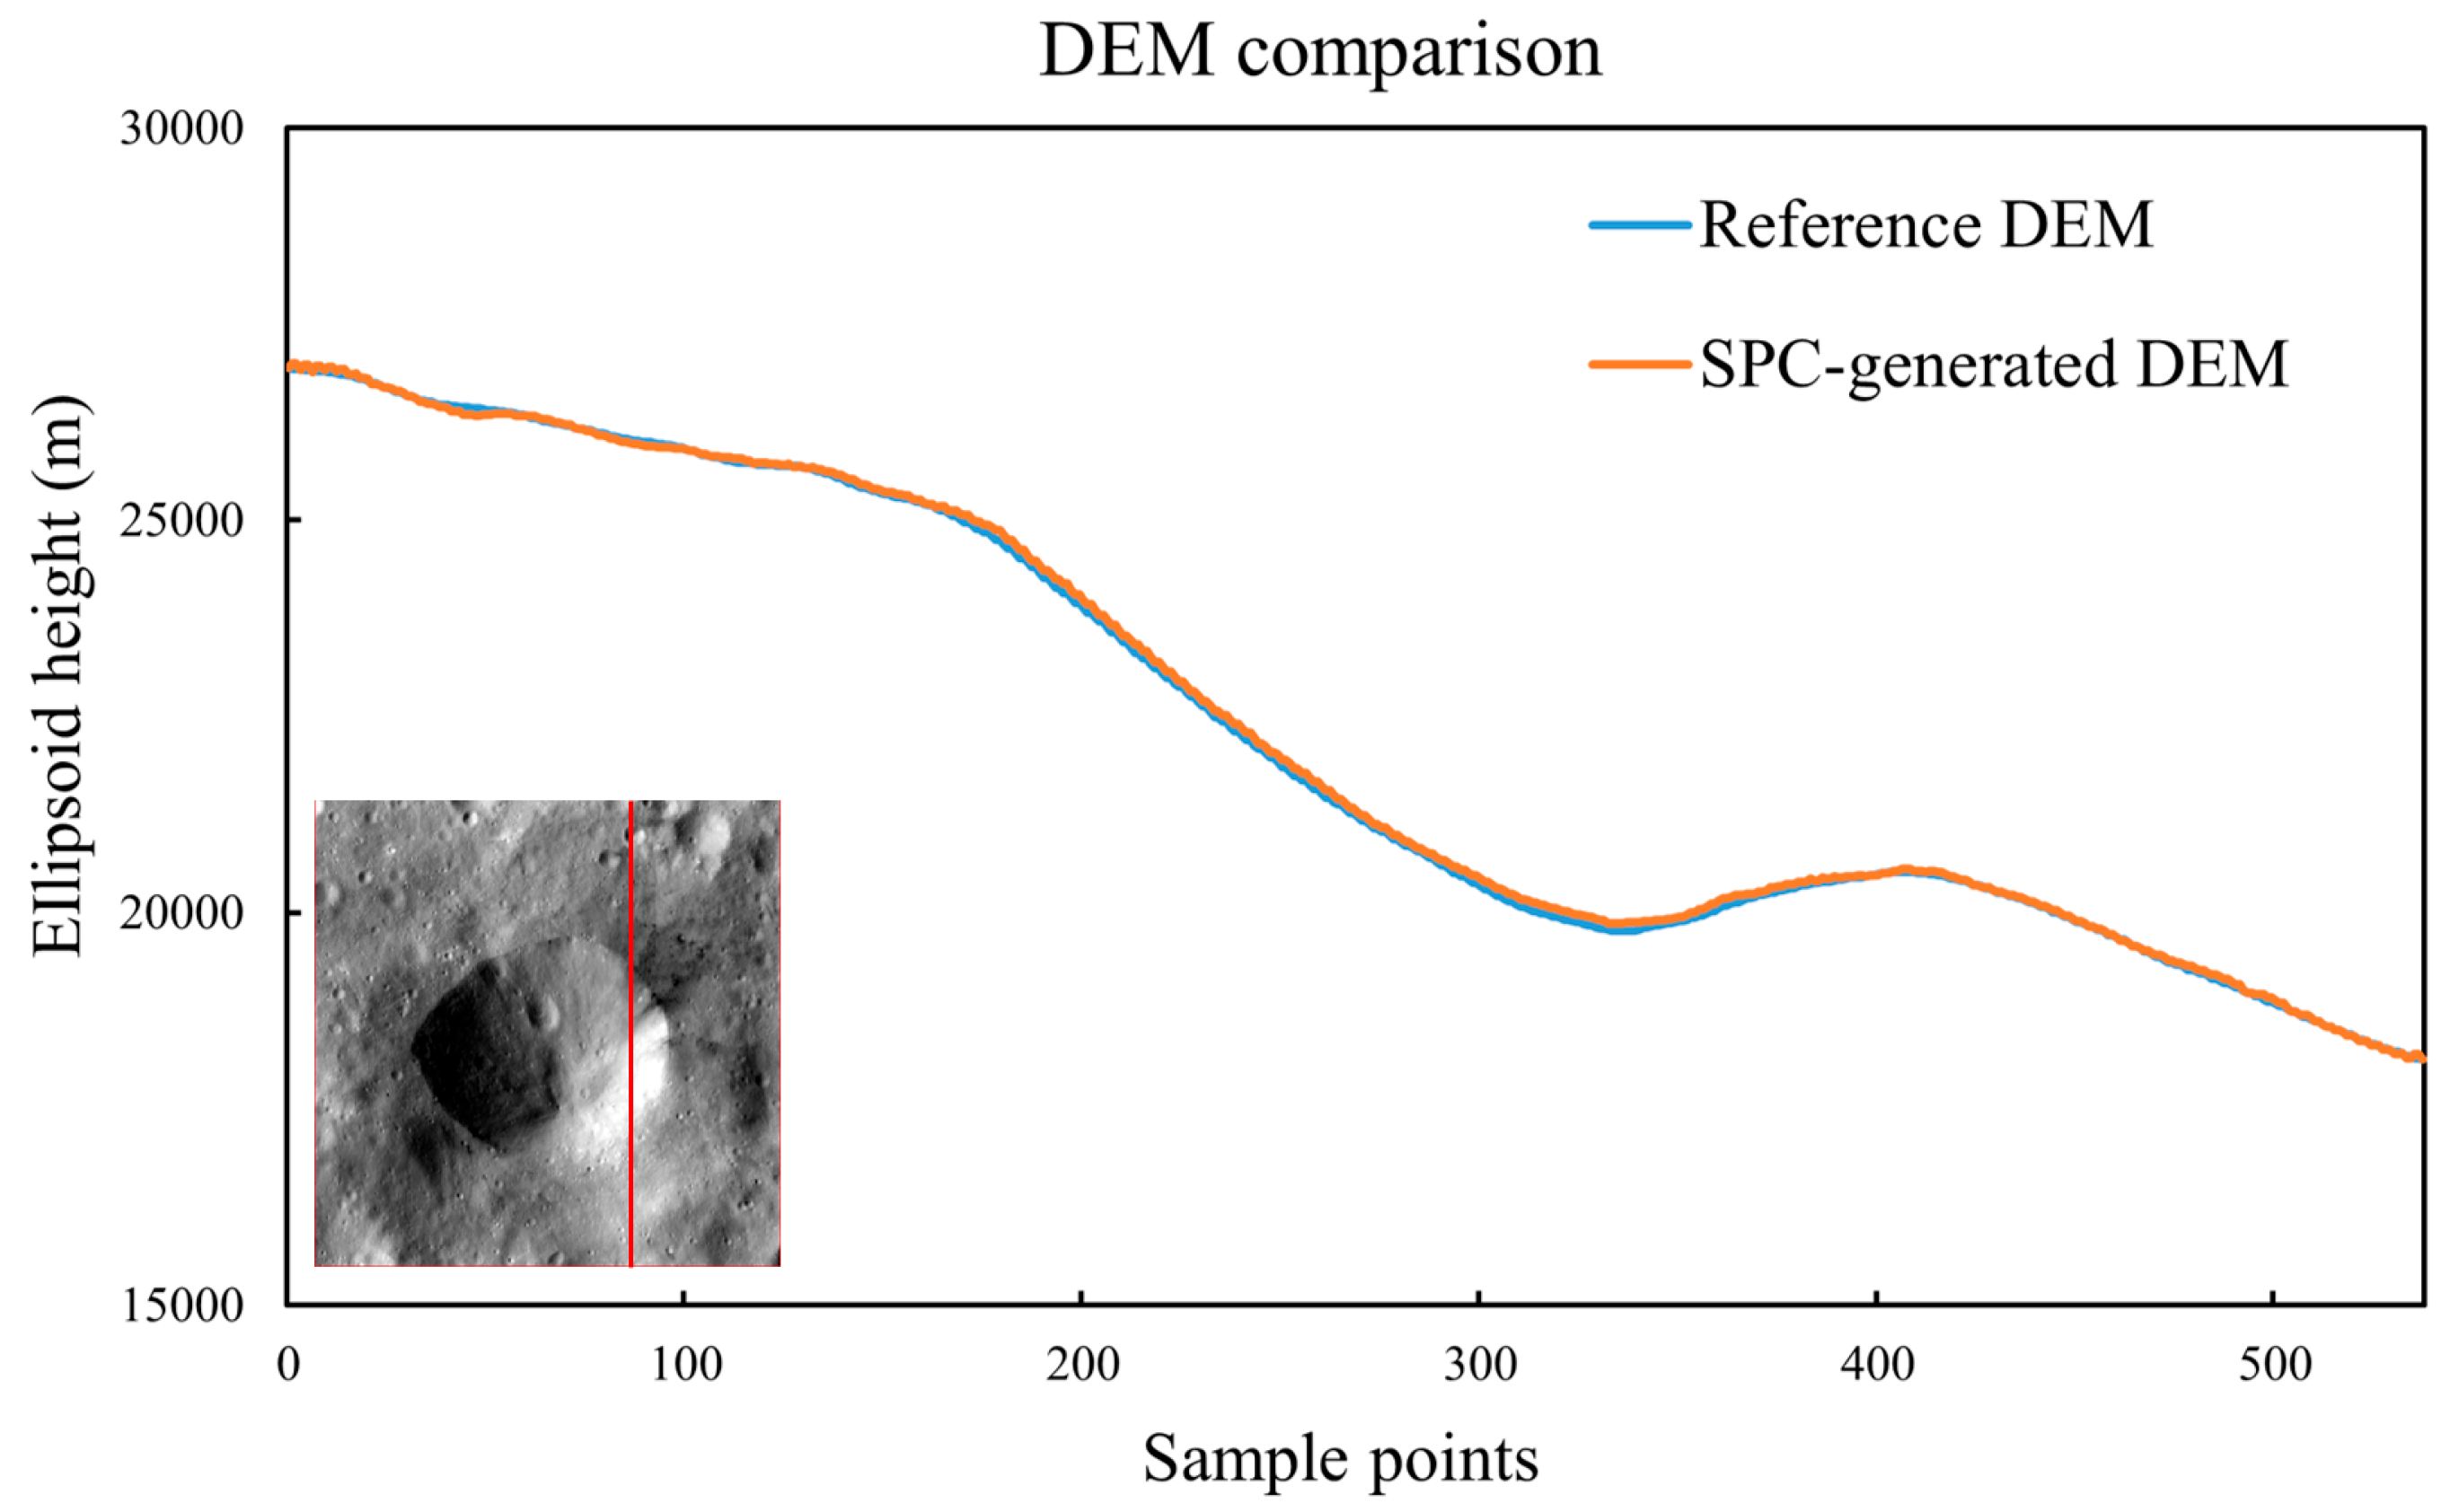

Table 1.
Optimal illumination and observation conditions for SPC reconstruction.
| Image | Technical Indicators | Parameter Range |
|---|---|---|
| Images focusing on terrain | Incidence | 30~50° |
| Spacecraft azimuth | Shooting in four directions, east, south, west and north, relative to the target area | |
| Images focusing on albedo | Incidence | Close to 0° |
| Solar azimuth | 0~20° |
Table 2.
Basic information of the test data.
| Data | Cameras | Asteroid | Number of Images | Date | Mean GSD(m) | Image Size (Samples×Lines) |
|---|---|---|---|---|---|---|
| Test 1 | POLYCAM | Bennu | 5453 | 2019.03.21~04.12 | 0.05 | 1024×1024 |
| Test 2 | FC | Vesta | 2553 | 2011.09.29~10.31 | 65 | 1024×1024 |
| Test 3 | MAPCAM | Bennu | 942 | 2018.12.03~12.17 | 1 | 1024×1024 |
| Test 4 | ONC | Ryugu | 391 | 2018.07.10、07.12、08.01 | 1.5 | 1024×1024 |
* GSD refers to ground sample distance. Since the resolutions of the images are not strictly uniform, this study calculates their average values. FC refers to Framing Camera. ONC refers to Optical Navigation Camera.
Table 3.
Test data for detailed survey images.
| Bennu (2019) | Vesta | ||||
|---|---|---|---|---|---|
| Number of images | 32 | 255 | 1365 | 5453 | 2553 |
| Time spent on KD tree | <1s | 1s | 2s | 3.84 | 2~3s |
| Time spent on ISIS | 8s | 40s | 300s | -- | -- |
* “--” indicates that the experiment could hardly be completed.
Table 4.
Test data for asteroid remote sensing images containing invalid pixels.
| Bennu (2018) | Ryugu | |||
|---|---|---|---|---|
| Number of images | 133 | 417 | 942 | 391 |
| Time spent on KD tree | <1s | <1s | 1~2s | <1s |
| Time spent on ISIS | -- | -- | -- | -- |
* “--” means unable to process.
Table 5.
Bundle adjustment results of the test data.
| Test Data | Total Images in Control Network | Total Match Pairs | Total Control Points | Total Control Measures | Sigma0 |
|---|---|---|---|---|---|
| Test 1 | 5453 | 48940 | 445565 | 1506597 | 0.17 |
| Test 2 | 2553 | 34143 | 122002 | 459977 | 0.18 |
| Test 3 | 942 | 15527 | 251067 | 920735 | 0.15 |
| Test 4 | 391 | 4086 | 52989 | 199027 | 0.27 |
Disclaimer/Publisher’s Note: The statements, opinions and data contained in all publications are solely those of the individual author(s) and contributor(s) and not of MDPI and/or the editor(s). MDPI and/or the editor(s) disclaim responsibility for any injury to people or property resulting from any ideas, methods, instructions or products referred to in the content. |
© 2024 by the authors. Licensee MDPI, Basel, Switzerland. This article is an open access article distributed under the terms and conditions of the Creative Commons Attribution (CC BY) license (http://creativecommons.org/licenses/by/4.0/).
Copyright: This open access article is published under a Creative Commons CC BY 4.0 license, which permit the free download, distribution, and reuse, provided that the author and preprint are cited in any reuse.


