
Submitted:
19 November 2024
Posted:
20 November 2024
You are already at the latest version
Abstract
Climate change has increased the risk of snow drought, which is associated with the deficit in snowfall and snowpack. The objectives of this research are to improve drought identification in warming climate by developing a new snow-based hydroclimatic aggregate drought index (SHADI) and to assess the impacts of snowpack and snowmelt in drought analyses. To derive the SHADI, an R-mode principal component analysis is performed on precipitation, snowpack, surface runoff, and soil water storage. Then, a joint probability distribution function of drought frequencies and drought classes, conditional expectation, and k-means clustering are used to categorize droughts. The SHADI was applied to the Red River of the North Basin (RRB), a typical cold climate region, to characterize droughts in a mostly dry period from 2003 to 2007. The SHADI was compared with the hydroclimatic aggregate drought index (HADI) and the U.S. drought monitor (USDM) data. Cluster analysis was also utilized as a benchmark to compare the results of HADI and SHADI. SHADI showed better alignment with cluster analysis results than HADI, closely matching the identified dry/wet conditions in the RRB. The major differences between SHADI and HADI were observed in cold seasons and in transition periods (dry-to-wet or wet-to-dry). The derived variable threshold levels for different categories of drought based on the SHADI were close to, but different from those of HADI. SHADI can be used for short-term lead prediction of droughts in cold climate regions and, in particular, can provide an early warning for drought in the warming climate.
Keywords:
Snow drought
; Snowpack
; Cold climate
; Short-term lead prediction of drought
1. Introduction
Climate change and global warming have caused a shrinkage in average snow cover and montane snowpack (Marty et al. 2017, Sproles et al. 2017, Huning and Aghakouchak, 2018). The function of snowpack is similar to a seasonal natural reservoir, where snowmelt leads the equivalent stored water to be released by an increase in temperature. Shifts in temperature and precipitation patterns due to climate change have heightened the risk of snow drought (National Integrated Drought Information System 2022 and Climate Signals 2018).
Snow drought and its impact on water resources availability were introduced by Schneider & Matson (1977) and Wiesnet (1981). Snow drought occurs in a period characterized by unusually low snowpack, resulting from either below-average cold-season precipitation or insufficient snow accumulation despite near-normal precipitation levels, typically due to warm temperatures causing rain instead of snow or early snowmelt (American Meteorological Society 2019). Based on the definition of snow drought, the drought drivers include (1) quantity and (2) timing. The first drought driver is associated with the deficit in the amount of precipitation and/or high or low levels of temperatures, while the second drought driver is characterized by an early or late occurrence of hydroclimatic processes such as snowfall and snowmelt. Snow drought can also be divided into temperature-driven or precipitation-driven categories (Harpold et al. 2012; Van Loon et al. 2015; Cooper et al. 2016). Harpold et al. (2017) also classified snow drought into dry snow drought and warm snow drought based on these climatic drivers. Dry snow droughts are caused by a deficit in winter precipitation. While above-normal winter temperatures (consequently, late onset of snow season), midseason snowmelt or rainfall events, and early spring snowmelt cause warm snow drought (Dierauer et al. 2019). For instance, a temperature threshold of -3.1 °C - 1.4 °C led to a rapid increase in the risk of warm snow drought in southwestern Canada (Dierauer et al. 2019). Therefore, the first step of drought identification is to understand the dominant hydroclimatic processes and drought drivers and types (Mote 2003). This essential step ensures to use the right tools or drought indices (Staudinger et al. 2011).
Each region has its own distinct drought drivers (Van Loon et al. 2015). For example, low precipitation, high temperature, and low initial soil moisture caused a considerable reduction in snowmelt runoff in the Canadian prairies (Fang and Pomeroy 2007). Generally, a low amount of precipitation (snowfall and rainfall) because of high temperature in winter may bring about “warm snow season drought.” Moreover, in regions where the winter temperatures normally are far below zero for a long time (e.g., more than 6 months of a year), a mild anomaly in winter temperature may affect snow accumulation, snow water equivalent, and streamflow. In such areas, a lack of snow accumulation due to snowfall deficit or high temperature in winter provokes a shift in the timing of snowmelt and causes “snowmelt drought” (Van Loon and Van Lanen 2012; Van Loon et al. 2015). These drought classes accentuate the necessity of consideration of snow storage and release (snowmelt) in identification of drought in the regions with snow accumulation and snowmelt processes.
Snow drought can cause some challenges for water resource management in cold climate regions. On the one hand, the lack of snowpack causes a reduction in available water resources in warm seasons and, on the other hand, a substitution of rain for snow in unusually warm winters leads to a higher risk of flood in mountainous regions. Correspondingly, snow drought can cause serious ecological and socioeconomic impacts (Dierauer et al. 2019). For example, the agricultural losses of the 2015 dry snow drought in the Sierra Nevada region of the U.S. were estimated to be about $1.84 billion for a reduction of 20 - 60% in the normal precipitation (Howitt et al. 2015). In this region, extreme early season precipitation, frequent rain-on-snow events, and low-precipitation years were the main causes of snow drought (Hatchett and McEvoy 2018). Therefore, understanding the mechanisms of droughts and their drivers in cold climate regions is important to identify snow droughts and mitigation of their impacts.
To mitigate the impacts of droughts in the changing climate, a special drought index for the identification of snow droughts is essential. There exist a few drought indices, which account for the anomalies of snowpack. Huning and Aghakouchak, (2020) developed a standardized snow water equivalent index (SWEI) by considering snow water equivalent (SWE) to assess global snow drought. Since a below normal SWE in cold seasons can be compensated by a high antecedent soil water storage or an upcoming rainfall event in warm seasons, consideration of other hydroclimatic variables can provide more information about drought. The surface water supply index (SWSI) (Shafer and Dezman 1982) and aggregate drought index (ADI) (Keyantash and Dracup 2004) account for snowpack amounts in addition to other hydroclimatic variables. In contrast, there are some other indices, which account for available water, instead of the stored water sources. For example, the standardized snowmelt and rainfall index (SMRI) (Staudinger et al. 2014) and hydroclimatic aggregate drought index (HADI) (Bazrkar et al. 2020) consider snowmelt and rainfall. Some studies demonstrated the critical roles of snow-based drought indices (Huning and Aghakouchak, 2020) and their capabilities for short-term lead prediction of drought (Abel et al. 2018) in a changing climate. However, some researchers (e.g., Livneh and Badger 2020) found drought less predictable by using snow-based approaches under declining future snowpack in a warming climate. The objectives of this research are (1) to improve drought identification in cold climate regions and in the warming climate by developing a new snow-based hydroclimatic aggregate drought index (SHADI) and (2) to assess the impacts of snowpack and snowmelt in drought analyses by comparing SHADI with HADI.
2. Methodology
2.1. Study Area
The Red River of the North Basin (RRB) (Figure 1), located in the Northern Great Plains, covers over 90,000 km2 in the States of Minnesota, North Dakota (ND), and South Dakota. In the RRB, cold and dry winters are common due to a strong continental climate, a very low amount of air moisture, and cold intrusions from the polar and arctic regions (NDAWN, 2014). Remarkably, the precipitation in the six cold months from October through March accounts for only about 22% of the annual precipitation. In contrast, a slow transition in low-level wind flow brings about a high amount of moisture from the Gulf of Mexico in spring. Therefore, springs and summers are generally warm and wet (NDAWN, 2014). The climate divisions (CDs) in the RRB are shown in Figure 1. In addition to climate factors, the CDs were organized based on geographic features, drainage basins, river districts, and/or designated forecast responsibility areas (Guttman and Quayle 1996). A divisional dataset has been assembled, containing year-monthly averages (daily averages for each year and month) of temperature and water-equivalent precipitation for each division in the contiguous United States, dating back to 1895. From this foundational dataset, statistics on drought, prolonged wet weather events (moisture anomalies), and heating/cooling degree days have been derived. The National Climatic Data Center (NCDC) uses this dataset in its monthly Climate Variations Bulletin (Guttman and Quayle 1996).
According to the 118-year data (1901 - 2019), the mean discharge of the Red River is 12.77 m3/s and the minimum and maximum discharges at the Fargo Station are 0.045 m3/s (1937, known as the Great Drought) and 226.8 m3/s (1998), respectively (USGS 2020). The lowest precipitation and the highest temperature in the cold seasons occurred in the 1990’s, which can be referred to as snow drought. The precipitation in the cold seasons in the last two decades was relatively low. Therefore, a drought index with the capability of addressing snow drought is required. To test the performance of the SHADI, it was applied to the RRB for a period from 2003 to 2007, the longest dry period after 2000 in the area (USDM 2019).
2.2. SHADI
Precipitation, snowpack, surface runoff, and soil water storage of the root zone are used to derive the SHADI. Snowpack is the primary variable in the identification of snow drought. Thus, the SHADI can potentially address the anomalies in stored water as a snow drought index. The other hydroclimatic variables (i.e., precipitation, surface runoff, and soil water storage) are also integrated to address other types of droughts. Similar to the HADI (Bazrkar et al. 2020), the SHADI accounts for the impacts of available water or stored water on drought characterization. However, the SHADI uses precipitation and snowpack, instead of rainfall and snowmelt in the HADI. The daily snowpack, surface runoff, and soil water storage simulated by a grid-based hydrologic model (GHM) (Chu et al. 2019) are used after being converted to monthly values. The GHM model simulates key hydroclimatic processes in cold climate regions, including snow, snow accumulation, frozen soil, and snowmelt at a spatial resolution of 4 km. The GHM models rainfall-runoff and snowfall-snowmelt processes based on a daily mean temperature threshold. In a snow-covered area, snowmelt is simulated using the degree-day method, where melting begins when the daily mean temperature exceeds a specified base temperature. The curve number (CN) is adjusted to account for frozen soil conditions. Moreover, as the RRB is a region dominated by surface depressions, the model includes a component of surface depression storage, which is identified by a delineation algorithm (Chu et al., 2019). Figure 2 presents the flowchart for calculating HADI and SHADI and categorizing droughts.
To overcome the high covariance of these variables, they are standardized by:
where , , , and are the standardized values of precipitation, snowpack, surface runoff, and soil water storage of grid j in month i, respectively; , , , and are the precipitation, snowpack, surface runoff, and soil water storage of grid j in month i, respectively; , , , and are the mean values of precipitation, snowpack, surface runoff, and soil water storage of grid j in the entire period, respectively; and , , , and are the standard deviation values of precipitation, snowpack, surface runoff, and soil water storage of grid j in the entire period, respectively. By performing a correlation-based R-mode principal component analysis (PCA) (Cattell, 1952) on the standardized variables, the SHADI is estimated for grid j and month i. The principal components (PCs) are given by (Cattell, 1952):
where () to () are the first to fourth PCs for grid j in month i; and to , to , to , and to are respectively the normalized eigenvectors of the first, second, third, and forth PC in month i. The elements of the eigenvector are unequal weights in the PCs for month i. The drought types can be determined by these unequal weights, which are based on the highest variances among the variables. The drought type is defined by the highest absolute values of loadings of the first PC, since the effect of the corresponding hydroclimatic variable on the PC values is greater. If the absolute value of the loading of precipitation is the highest, the drought is classified as a meteorological drought. Since the anomalies in snowpack, snowmelt, and surface runoff represent hydrologic drought, if the absolute values of the loadings of one of these variables are among the highest, the drought is classified as a hydrologic drought. If the absolute value of the loading of soil water storage is the highest, agricultural drought is determined.
The PCs should be standardized to be independent of time and space, and thus comparable for any normal conditions. The mean and standard deviation values of the first PCs throughout the study period in each grid are calculated. The SHADI is computed by standardization of the first PCs for each grid and month or the ratio of the difference between each first PC value and its mean to its standard deviation:
where is the SHADI of grid j in month i; is the first PC of grid j in month i; and and are the mean and standard deviation of the first PC of grid j. The first PC is selected for estimation of the SHADI since a high proportion of information is found in the first PC.
To categorize droughts, a customized drought categorization based on variable threshold levels (Bazrkar et al. 2020) is implemented. According to the range of the SHADI values, they are divided into a defined number of classes. To estimate the spatial and temporal frequencies of the SHADI, a cell-by-cell based analysis is performed. The frequency of each drought class during the study period is estimated for each cell and the temporal frequencies of all drought classes for all cells are also estimated. The frequency and class of droughts form a bivariate function. Thus, a joint probability distribution function (JPDF) is determined. To find the probability of the occurrence of each class of drought, the conditional expectation is calculated. The lower the conditional expectation, the lower the probability of occurrence and the higher risk of rare drought. The conditional expectation for each class of drought is given by (Hogg and Craig 1978):
in which
where is the JPDF of frequency f and drought class c; is the probability distribution function of drought class c; and is the conditional probability. The conditional expectation of different frequencies for each associated class, or can be expressed as:
To derive the threshold levels for different drought categories, the k-means clustering method (MacQueen, 1967) is used. The k-means clustering employs a partitioning approach, in which the observations are separated into n clusters without using a hierarchical method. Partitioning is the most commonly used method among nonhierarchical methods of clustering. The specific procedures for determining the variable threshold levels using k-means include (MacQueen, 1967): (1) select n items to serve as seeds (i.e., initial cluster centroids); (2) assign each observation in the dataset to the cluster with the nearest seed/centroid based on the squared Euclidean distance; (3) recalculate the centroid for each cluster (i.e., the mean vector of all observations in the cluster); and (4) repeat steps 2 and 3 until no observations move to different clusters.
To account for the slow emergence and recession of drought, Svoboda et al. (2002) used six categories (exceptional, extreme, severe, moderate, abnormal, and normal) in the U.S. drought monitor (USDM, Svoboda et al. 2002). The same numbers of drought categories in the USDM are used in this study. Four wet classes (including exceptional, extreme, severe, moderate wet) are also considered to categorize the wet conditions. Thus, the customized drought categorization is based on these ten dry and wet clusters. Ten points that are mutually farthest apart are selected as initial seeds in the k-means clustering. The observation vector can be expressed as:
where is the representative of lower class limit for class 1 of the SHADI; and is the expected value of probability of occurrence of class 1. The k-means method clusters these n observations into ten groups. The initial centroids are the ten observations that are farthest apart. The procedure starts by calculating the squared Euclidean distance between each pair of observations:
where is squared Euclidean distance between and observation vectors for k (k=1, …, n). Ten points with the longest pairwise distances are selected as the initial seeds. The distances from each observation to the initial seeds are calculated. Then, the centroid of each cluster and the distance from each observation to each centroid are calculated. These processes are repeated until the cluster assignments in the last step are the same as those in the previous step.
2.3. Assessment of SHADI in Identification and Categorization of Droughts
To assess the performance of SHADI in identification of droughts, it was compared with HADI and USDM. After the assessment of SHADI, the new customized drought categorization was applied to the RRB. The results based on SHADI and HADI were further compared, and their performances were evaluated for the entire RRB and separately for CDs 2101, 3203, and 3206 (Figure 1).
The SHADI, HADI, and USDM (Svoboda et al. 2002; USDM 2019) were compared in the form of drought severity and coverage index (DSCI) (Akyuz, 2017). DSCI turned the USDM categorical drought into one value. The DSCI is used to compare both severity and coverage of droughts in the USDM, SHADI, and HADI. The DSCI is given by (Akyuz, 2017):
where ACD (i) is the percentage of area coverage of drought in category i. The USDM (Svoboda et al. 2002) is “a composite product” based on the Objective Drought Indicator (ODI) Blends. The USDM product is a blend of six main drought indicators and other objectively-selected ancillary indices including the Palmer drought severity index (PDSI) (Palmer 1965), CPC soil moisture model (percentiles), USGS weekly streamflow (percentiles), percent of normal, SPI, and satellite vegetation (Svoboda et al. 2002). Additional information about the conditions of soil moisture and snowpack is added by other ancillary indices (e.g., SWSI).
There are some differences in the derivations of USDM, HADI, and SHADI. Soil moisture and observed streamflow are used in the USDM, while the simulated surface runoff and soil water storage in the root zone are used in the SHADI and HADI. Although precipitation and snowpack are considered in the derivation of the USDM products, separation of rainfall and snowfall and snowmelt are ignored in the USDM. In contrast, the SHADI and HADI account for these dominant hydroclimatic processes in cold climate regions (precipitation and snowpack in SHADI and rainfall and snowmelt in HADI).
Finally, the outputs of the cluster analysis for precipitation, rainfall, snowpack, snowmelt, surface runoff, and soil water storage (i.e., inputs of the HADI and SHADI) were compared with their corresponding indices. In the k-means clustering for these hydroclimatic variables, to avoid complexity, only two clusters (dry/wet) were defined.
3. Results and Discussion
3.1. Categorization and Classification of Droughts by SHADI and HADI
The droughts in the study period were characterized by using the customized drought categorization method for both SHADI and HADI. The threshold levels for different categories of drought based on the SHADI and HADI were close (Table 1). Since the study period and the study area remained unchanged, the threshold levels did not alter. This similarity can confirm the variability of the derived threshold levels by time and geographic locations.
3.2. Comparison of the Results of SHADI and HADI in the RRB
Figure 3 shows the comparison of temporal and spatial distributions of HADI and SHADI. Notable dissimilarities were observed in the cold seasons and in the dry-wet or wet-dry transitions (Figure 3a). The maximum difference between the HADI (1.73) and SHADI (-0.46) was observed in April 2004, featuring a transition from wet to dry conditions. Another transition period from dry to wet occurred in January 2006 (HADI = -0.46; SHADI = 0.23). In this month, the HADI remained negative, while the SHADI preidentified the upcoming wet condition. Moreover, in the middle of the long dry period (2004-2006), the HADI (1.41) identified a high-intensity wet condition in February 2005 (Figure 3c and 3e). In contrast, the SHADI (0.47) showed a wet condition with a considerably less intensity in this month (Figure 3a and 3d), indicating that the SHADI exhibited fewer fluctuations than the HADI.
The Pearson and Spearman correlation coefficients of the SHADI and HADI were 0.75 and 0.78, respectively. The Spearman correlation coefficient indicated that the intensities of dry or wet conditions identified by the HADI and SHADI and their corresponding ranks among different months in the study period were close in the warm seasons. The Pearson correlation coefficient also showed the similarity between the HADI and SHADI values in the warm seasons. In fact, the differences were negligible from May to September in all years.
The analysis of the dissimilarities in the spatial distributions of the HADI and SHADI helps determine the sensitivity of the indices to drought drivers (e.g., temperature-driven or precipitation-driven droughts). There was a minor difference between HADI and SHADI for 2003 (Figure 4a and 4f) and 2007 (Figure 4e and 4j). However, major differences were observed between HADI and SHADI in 2004 (Figure 4b and 4g), 2005 (Figure 4c and 4h), and 2006 (Figure 4d and 4i). These significant differences were in the upper RRB in 2004, the lower RRB in 2005, as well as the upper and northeast part of the RRB in 2006.
As shown in Figure 5, the HADI and SHADI had similar values in 2003 (Figure 5a and 5f) and 2007 (Figure 5e and 5j). However, the SHADI indicated more intense droughts in the upper RRB in 2003 (Figure 5b and 5g) and in the lower RRB in 2004 (Figure 5c and 5h). By the end of the 2004 - 2006 drought (Figure 5d and 5i), the SHADI identified a wetter condition in the upper and northeast part of the RRB. The lowest annual precipitation occurred in 2003 (Figure 5k) and 2006 (Figure 5n). In addition, the western side of the RRB had a lower amount of precipitation than that of the eastern side. Figure 5p - 5t show the spatial distribution of the mean annual temperatures from 2003 to 2007. The lowest and the highest temperatures occurred in 2004 and 2006, respectively. 2004 was the coldest year in the study period. However, the high temperature in the upper RRB caused rainfall, instead of snow. Thus, the SHADI identified a dry condition with higher drought intensity due to the lack of snowpack (Figure 5b and 5g). Both precipitation and temperature in the lower RRB in 2005 were relatively low and the intensity of drought based on the SHADI was higher (Figure 5c and 5h). The low precipitation and high temperature in the upper and northeast part of the RRB in 2006 led to high-intensity drought based on the HADI (Figure 5d and 5i). Therefore, it can be concluded that the SHADI is more sensitive to low temperatures and the intensity of droughts identified by the SHADI can be higher in cold climate conditions.
3.3. Comparison of SHADI, HADI, and USDM in the Form of DSCI
To compare the DSCIs of the SHADI, HADI, and USDM, the dry span in the study period was divided into three short dry spells: (1) from the end of 2003 to the end of 2004, (2) from the beginning of 2005 until the end of 2005, and (3) from the beginning of 2006 to the beginning of 2007. As shown in Figure 6, despite the differences in the values of DSCI of the USDM, SHADI, and HADI, they identified the first dry spell at the same time in all CDs. The DSCIs of the USDM were higher than those of the HADI in all CDs. In contrast, the DSCIs of the SHADI were higher than those of the USDM in CDs 2101 and 3203. The peak DSCIs of the HADI and SHADI occurred with a shorter delay than the DSCI of the USDM in the second dry spell. The DSCI of the SHADI was higher than those of the USDM and HADI in CDs 2101 and 3203. The DSCIs of the USDM and HADI were close to or higher than the DSCI of the SHADI in CD 3206. The DSCI of the USDM was noticeably higher than those of the SHADI and HADI in the third dry spell.
The dissimilarities among the results of the SHADI, HADI, and USDM can be associated with three main reasons. First, different numbers and types of inputs were used for the derivation of these indices. The SHADI accounted for snowpack and snow drought and the HADI considered snowmelt and rainfall. However, the USDM did not consider the separation of rainfall and snowfall, snow accumulation, and snowmelt as the dominant hydroclimatic processes in cold climate regions. Second, the approach of one-weight-fits-all can be a limitation of the USDM in weighting coefficients of the involved indices and in the representation of seasonal changes. However, by using the PCA, the weighting coefficients for different hydroclimatic variables in the HADI were derived based on the employed time series, instead of the fixed coefficients used in the USDM. Third, in this research, the variable threshold levels were used in drought categorization for the HADI and SHADI, instead of the fixed threshold levels based on the percentages for the USDM. Since a dry period was intentionally chosen to test the SHADI and HADI, these discrepancies in the results were expected. The main purpose for the derivation and utilization of variable threshold levels in drought categorization is to fulfil the necessity of consideration of both spatial and temporal distributions of droughts (Mishra and Singh 2010). Hence, different thresholds for each drought category would be expected if different periods were selected. Therefore, the properties of the HADI and SHADI, which were incorporated to improve drought identification and categorization, resulted in these discrepancies among the indices.
3.4. Cluster Analyses of the Inputs of HADI and SHADI
Figure 7 shows the HADI and SHADI and the clustering analysis results based on their associated inputs in CD 2101 (7a and 7b), CD 3203 (7c and 7d), and CD 3206 (7e and 7f). The SHADI and cluster analysis identified the same dry/wet conditions in 47%, 72%, and 68% of times for CDs 2101, 3203, and 3206, respectively. Results of the HADI and cluster analysis for identification of dry/wet conditions agreed in 43%, 53%, 52% of times for CDs 2101, 3203, and 3206, respectively. The longest similarity between the indices and the clustering results on their inputs was observed from January to December of 2005 in CD 3206 for the SHADI (Figure 7f). Thus, the results of the SHADI were closer to those from the cluster analysis especially for CD 3203. It can be concluded that despite some discrepancies, the results of cluster analysis verified the results of the HADI and SHADI in most cases.
4. Conclusions
To enhance drought identification in cold climate regions and assess the impacts of precipitation, snowpack, and snowmelt in drought analysis, a new snow-based hydroclimatic aggregate drought index (SHADI) was developed. It was applied to the RRB, and the results were compared with those of HADI. Discrepancies were specifically observed between these two drought indices in cold seasons and in dry-wet or wet-dry transitions, which can be attributed to the effects of consideration of available water (rainfall and snowmelt) in HADI and stored water sources (precipitation and snowpack) in SHADI. Cluster analysis was performed as a benchmark to compare the results of HADI and SHADI. SHADI outperformed HADI in aligning with the cluster analysis results, matching the identified dry/wet conditions with 47%, 72%, and 68% of the time for three selected CDs (2101, 3203, and 3206, respectively). Thus, SHADI is particularly suitable for identification of snow droughts.
The anomalous snowpack and snow-based drought indices can provide early warning of droughts. Accounting for the snowpack impact in SHADI facilitated short-term lead predictions of droughts, which also was demonstrated by Abel’s et al. (2018) and Modi et al. (2022). Thus, SHADI can be used for identifying snow droughts and providing short-term lead predictions of upcoming droughts to mitigate the drought impacts.
As a result of the use of the customized drought categorization, SHADI and HADI yielded similar DSCI values, which were different from those of the USDM. These discrepancies can be attributed to the incorporation of effective hydroclimatic variables in cold climate regions, implementation of different methods for derivation of weighting coefficients, and application of the customized drought categorization approach and variable threshold levels in SHADI and HADI for drought identification and categorization.
The GHM model was chosen for this study as it was the available tool specifically designed to simulate hydroclimatic processes in depression-dominated, cold climate regions like the RRB. However, it does not account for certain snow processes, such as snowpack sublimation and redistribution. To address these limitations, Tahmasebi Nasab and Chu (2020) developed an enhanced version, Macro-HyProS, which incorporated a snowfall correction factor for sublimation and redistribution losses.
Author Contributions
Mohammad Hadi Bazrkar: Conceptualization, Methodology, Software, Validation, Formal analysis, Investigation, Writing – original draft, Writing – review & editing, Visualization. Negin Zamani: Validation, Formal analysis, Investigation, Writing – review & editing, Visualization. Xuefeng Chu: Conceptualization, Methodology, Investigation, Writing – review & editing, Data curation, Supervision, Project administration, Funding acquisition.
Funding
This material is based upon work supported by the National Science Foundation under Grant No. NSF EPSCoR Award IIA-1355466. The North Dakota Water Resources Research Institute also provided partial financial support in the form of a graduate fellowship for the first author.
Institutional Review Board Statement
Not applicable, because this article does not contain any studies with human or animal subjects.
Informed Consent Statement
Not applicable.
Data Availability Statement
The datasets for this research are available at the NOAA’s National Centers for Environmental information (NOAA’s NCEI): https://www.ncdc.noaa.gov/cag/, and the United States Drought Monitor (USDM): https://droughtmonitor.unl.edu/Data/Timeseries.aspx.
Conflicts of Interest
The authors declare that they have no conflict of interest.
Code Availability
The modeling data generated from this study will be eventually uploaded to the UND Scholarly Commons and will be available for any interested readers.
References
- Akyuz, F. A. 2017. Drought Severity and Coverage Index. United States Drought Monitor. https://droughtmonitor.unl.edu/AboutUSDM/AbouttheData/DSCI.aspx.
- American Meteorological Society (2019). Snow Drought. Glossary of Meteorology. [Available online at http://glossary.ametsoc.org/wiki/Snow_drought].
- Bazrkar, M. H., J. Zhang, and X. Chu. (2020). Hydroclimatic aggregate drought index (HADI): A new approach for identification and categorization of drought in cold climate regions. Stochastic Environmental Research and Risk Assessment, 34(11), 1847-1870. [CrossRef]
- Chu, X., Lin, Z., Tahmasebi Nasab, M., Zeng, L., Grimm, K., Bazrkar, M. H., Wang, N., Liu, X., Zhang, X., Zheng, H. (2019). “Macro-scale grid-based and subbasin-based hydrologic modeling: joint simulation and cross-calibration.” Journal of Hydroinformatics. jh2018026. [CrossRef]
- Climate Signals. (2018). Western U.S. snow drought: Winter 2018. Climate Signals. https://www.climatesignals.org/events/western-us-snow-drought-winter-2018.
- Cooper, M. G., Nolin, A. W., & Safeeq, M. (2016). Testing the recent snow drought as an analog for climate warming sensitivity of Cascades snowpacks. Environmental Research Letters, 11(8), 084009. [CrossRef]
- Dierauer, J. R., Allen, D. M., & Whitfield, P. H. (2019). Snow drought risk and susceptibility in the western United States and southwestern Canada. Water Resources Research, 55. [CrossRef]
- Fang, X., Pomeroy, W. (2007). Snowmelt runoff sensitivity analysis to drought on the Canadian prairies, Hydrological Processes, 21, 2594-2609. [CrossRef]
- Guttman, N. B., & Quayle, R. G. (1996). A Historical Perspective of U.S. Climate Divisions. Bulletin of the American Meteorological Society, 77(2), 293-304. [CrossRef]
- Harpold, A. A., Dettinger, M., & Rajagopal, S. (2017). Defining snow drought and why it matters. Eos Transactions American Geophysical Union, 98. [CrossRef]
- Harpold, A., et al. (2012), Changes in snowpack accumulation and ablation in the intermountain west, Water Resour. Res., 48, W11501. [CrossRef]
- Hatchett, B.J. and McEvoy, D.J. (2018). Exploring the Origins of Snow Drought in the Northern Sierra Nevada, California. Earth Interact., 22, 1–13. [CrossRef]
- Hogg, R.V. and Craig AT (1978). Introduction to mathematical statistics, 4th edn. Macmillan Publishing Co., Inc., New York.
- Howitt, R., MacEwan, D., Medellín-Azuara, J., Lund, J., &Sumner, D. (2015). Economic analysis of the 2015 drought for California agriculture. UC Davis Center for Watershed Sciences. Retrieved March 2018 from https://watershed.ucdavis.edu/files/biblio/Final_Drought%20Report_08182015_Full_Report_WithAppendices.pdf.
- Huning, S. L. and Aghakouchak, A. (2018). Mountain snowpack response to different levels of warming, Proceedings of the National Academy of Sciences, 115(43), 10932-10937. [CrossRef]
- Huning, S. L. and Aghakouchak, A. (2020). Global snow drought hot spots and characteristics, Proceedings of the National Academy of Sciences Aug 2020, 117 (33) 19753-19759. [CrossRef]
- Keyantash, J. A., and Dracup, J. A. (2004). “An aggregate drought index: Assessing drought severity based on fluctuations in the hydrologic cycle and surface water storage.” Water Resources Research, 40(9), 1–14. [CrossRef]
- Livneh, B., Badger, A.M. (2020). Drought less predictable under declining future snowpack. Nat. Clim. Chang. 10, 452–458. [CrossRef]
- MacQueen J.B. (1967). Some Methods for classification and Analysis of Multivariate Observations. Proceedings of 5-th Berkeley Symposium on Mathematical Statistics and Probability, Berkeley, University of California Press, 1, 281-297.
- Marty, C., Schlögl, S., Bavay, M., and Lehning, M. (2017). How much can we save? Impact of different emission scenarios on future snow cover in the Alps, The Cryosphere, 11, 517-529. [CrossRef]
- Mishra A.K. and Singh V.P. (2010). A review of drought concepts. Journal of Hydrology, 391(1), 202-216. [CrossRef]
- Modi, P. A., Small, E. E., Kasprzyk, J., & Livneh, B. (2022). Investigating the Role of Snow Water Equivalent on Streamflow Predictability during Drought. Journal of Hydrometeorology, 23(10), 1607-1625. [CrossRef]
- Mote, P. W. (2003), Trends in snow water equivalent in the Pacific Northwest and their climatic causes, Geophys. Res. Lett., 30, 1601. [CrossRef]
- NDAWN. (2014). “The Drought of the 1930s.” 〈https://www.ndsu.edu/ndscoblog/?p=626〉 (July 3, 2014).
- National Integrated Drought Information System. (2022, January 13). Snow drought: Current conditions and impacts in the West. Drought.gov. https://www.drought.gov/drought-status-updates/snow-drought-current-conditions-and-impacts-west-5.
- NOAA’s National Centers for Environmental information (NOAA’s NCEI) Climate at a Glance: Divisional Time Series. published November 2019, retrieved on November 9, 2019 from https://www.ncdc.noaa.gov/cag/.
- Palmer, W. C. (1965). Meteorological Drought. U.S. Weather Bureau, Res. Pap. No. 45.
- Shafer, B. A., and Dezman, L. E. (1982). “Development of a surface water supply index (SWSI) to assess the severity of drought conditions in snowpack runoff areas.” proceedings of the 50th Annual Western Snow Conference, 164–175.
- Schneider, S. R., and Matson, M. (1977). Satellite observations of snowcover in the Sierra Nevadas during the great California drought. Remote sensing of environment. No.4. Netherlands. P.327-334.
- Sproles, E. A., Roth, T. R., and Nolin, A. W. (2017). Future snow? A spatial-probabilistic assessment of the extraordinarily low snowpacks of 2014 and 2015 in the Oregon Cascades, The Cryosphere, 11, 331-341. [CrossRef]
- Staudinger M, Stahl K, Seibert J (2014) A drought index accounting for snow. Water Resources Research, 50(10), 7861–7872. [CrossRef]
- Staudinger, M., Stahl, K., Seibert, J., Clark, M. P., and Tallaksen, L. M. (2011). Comparison of hydrological model structures based on recession and low flow simulations, Hydrol. Earth Syst. Sci., 15, 3447–3459. [CrossRef]
- Svoboda M, LeComte D, Hayes M, Heim R, Gleason K, Angel J, Rippey B, Tinker R, Palecki M, Stooksbury D, Miskus D, Stephens S (2002) The drought monitor. Bulletin of the American Meteorological Society, 83(8), 1181–1190. [CrossRef]
- Tahmasebi Nasab, M., & Chu, X. (2020). Macro-HyProS: A new macro-scale hydrologic processes simulator for depression-dominated cold climate regions. Journal of Hydrology, 580, 124366. [CrossRef]
- USDM (2019) United States Drought Monitor. <https://droughtmonitor.unl.edu/Data/Timeseries.aspx> (June 27, 2019).
- Van Loon, A. F., and Laaha, G. (2015). “Hydrological drought severity explained by climate and catchment characteristics.” Journal of Hydrology, 526, 3–14. [CrossRef]
- Van Loon, A. F., and Van Lanen, H. A. J. (2012). “A process-based typology of hydrological drought.” Hydrology and Earth System Sciences, 16(7), 1915–1946. [CrossRef]
- Van Loon, A. F., Ploum, S. W., Parajka, J., Fleig, A. K., Garnier, E., Laaha, G., and Van Lanen, H. (2015). Hydrological drought types in cold climates: quantitative analysis of causing factors and qualitative survey of impacts, Hydrol. Earth Syst. Sci., 19, 1993-2016. [CrossRef]
- Van Loon, A. F., Stahl, K., Di Baldassarre, G., Clark, J., Rangecroft, S., Wanders, N., Gleeson, T., Van Dijk, A. I. J. M., Tallaksen, L. M., Hannaford, J., Uijlenhoet, R., Teuling, A. J., Hannah, D. M., Sheffield, J., Svoboda, M., Verbeiren, B., Wagener, T., and Van Lanen, H. A. J. (2016). “Drought in a human-modified world: Reframing drought definitions, understanding, and analysis approaches.” Hydrology and Earth System Sciences, 20(9), 3631–3650. [CrossRef]
- Van Loon, A.; Laaha, G.; Van Lanen, H.; Parajka, J.; Fleig, A. K.; Ploum, S. (2015). Drought and Snow: Analysis of Drivers, Processes and Impacts of Streamflow Droughts in Snow-Dominated Regions. American Geophysical Union, Fall Meeting 2015, abstract id. H13I-1699. [CrossRef]
- Wiesnet, D. (1981). Winter snow drought. Eos, Transactions American Geophysical Union, 62(14), 137-137.
Figure 1.
Red River Basin (RRB) and its associated climate divisions.
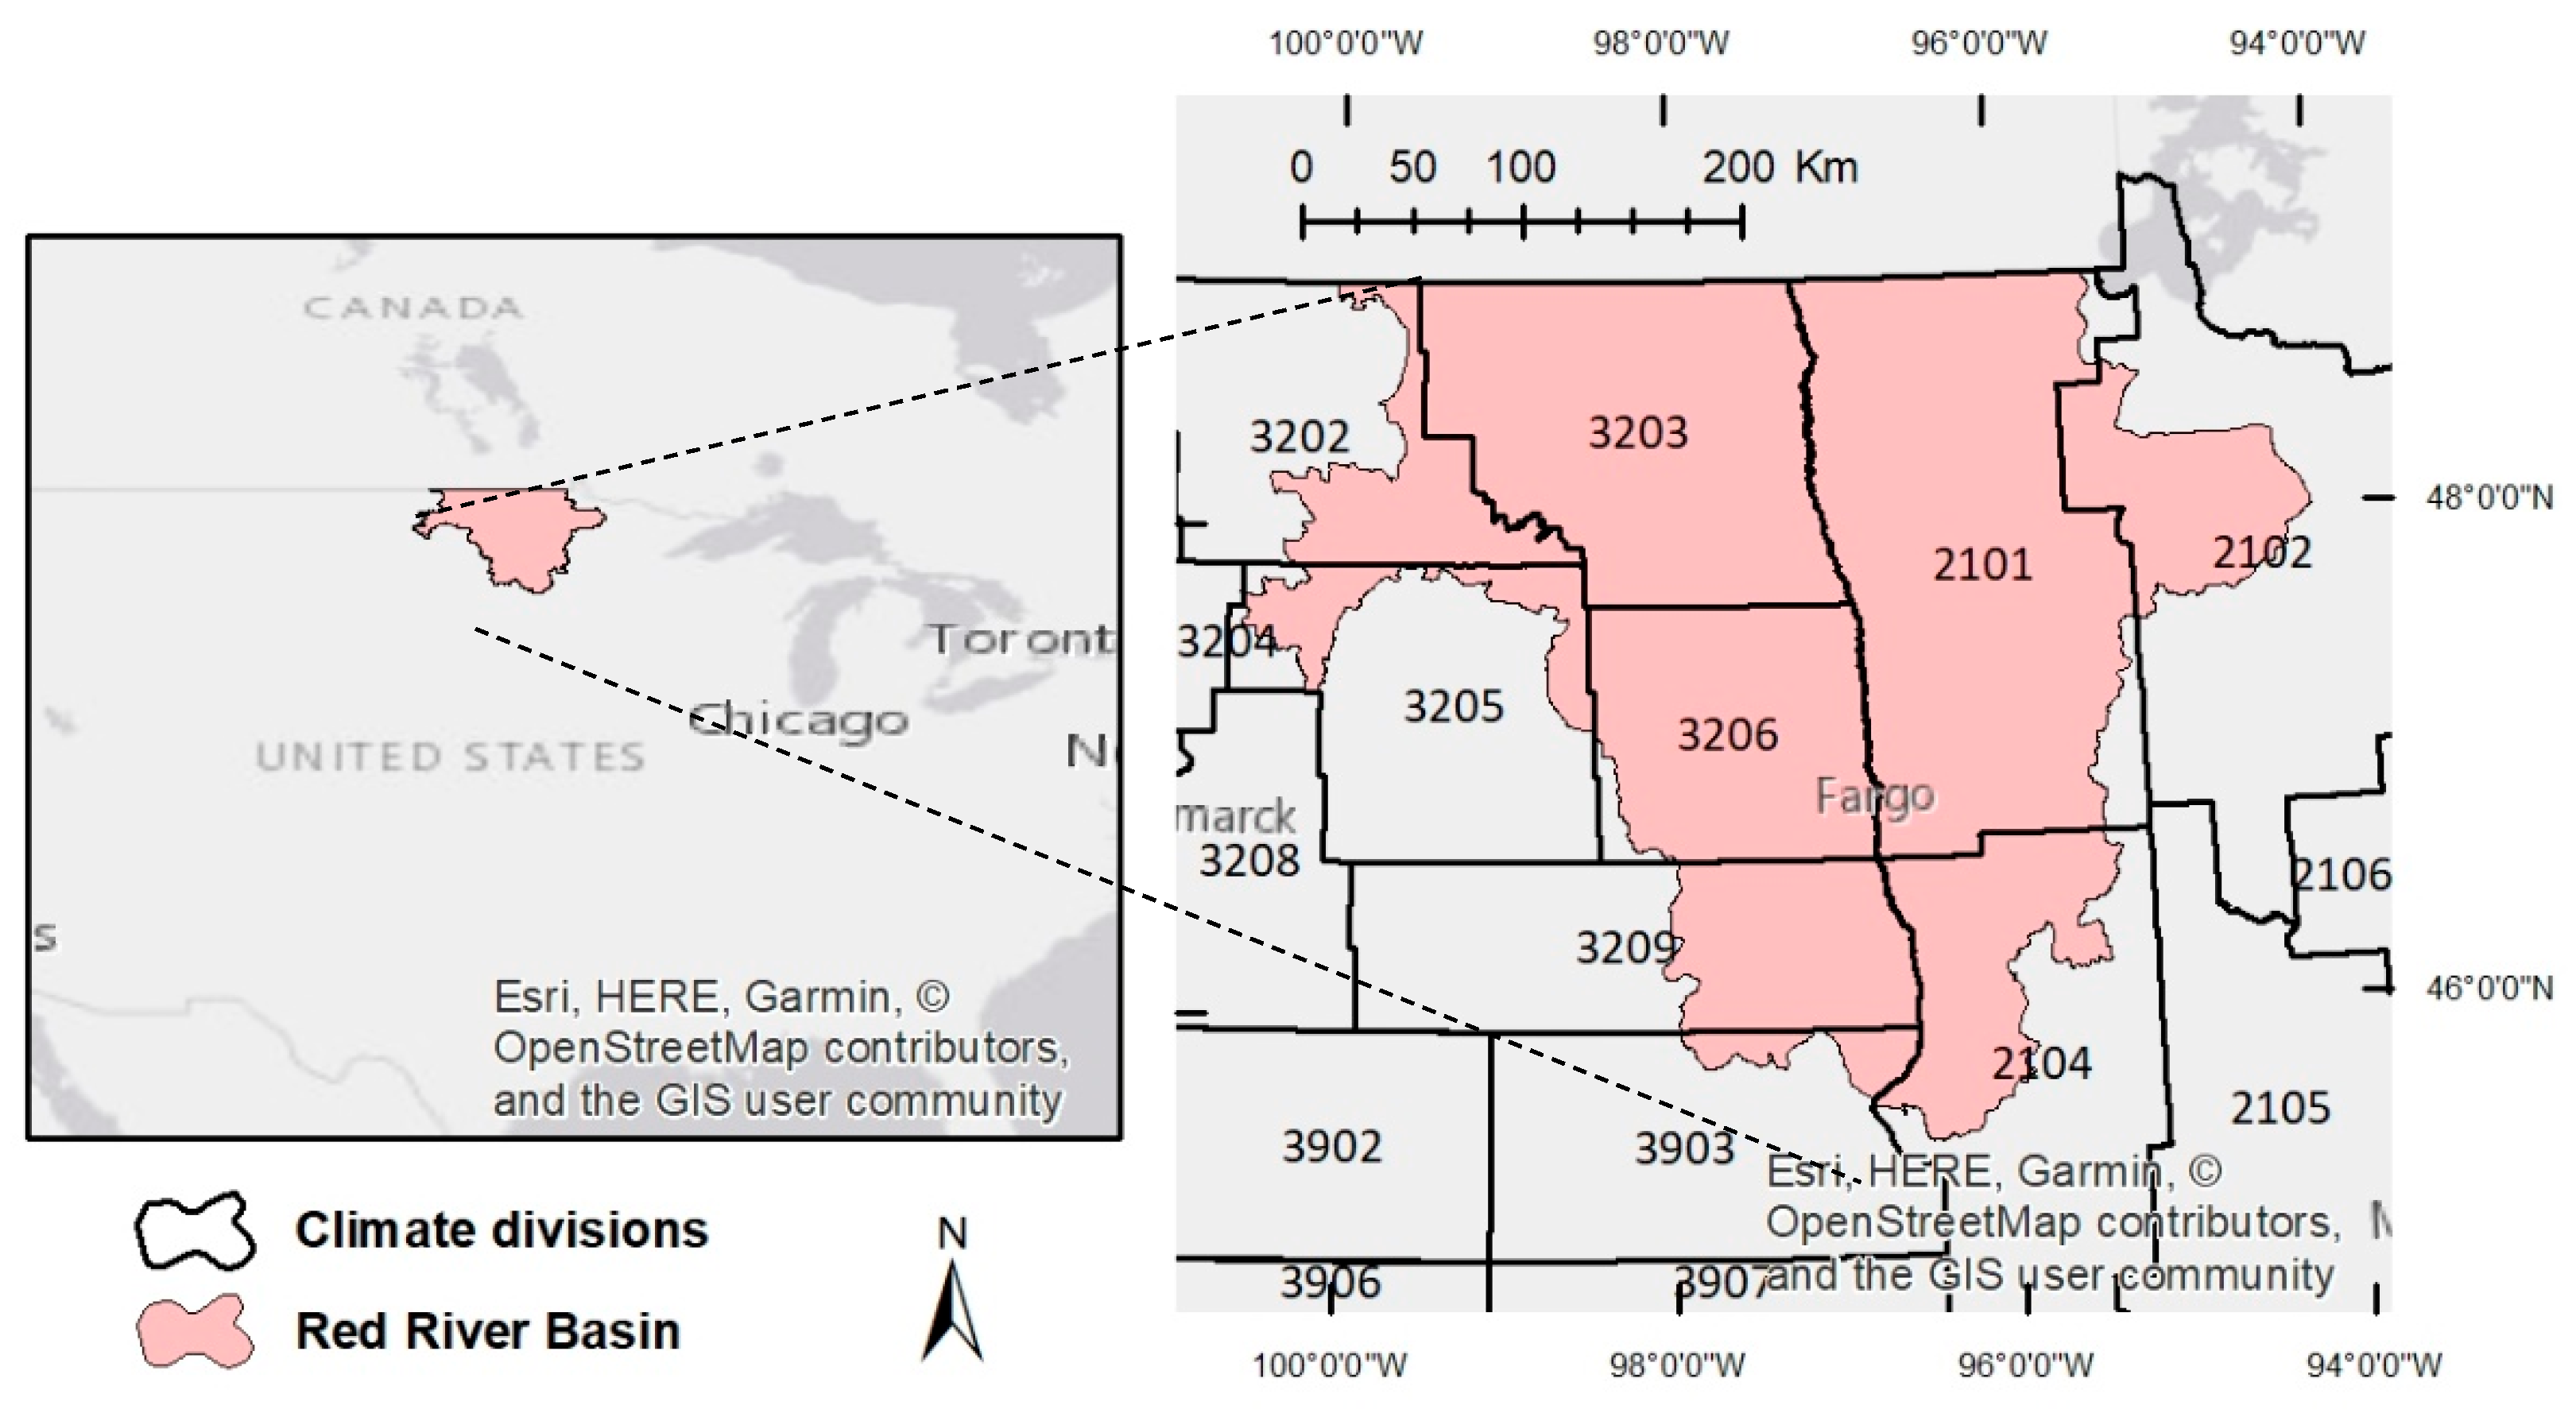
Figure 2.
Flowchart for calculating HADI and SHADI and categorizing drought.
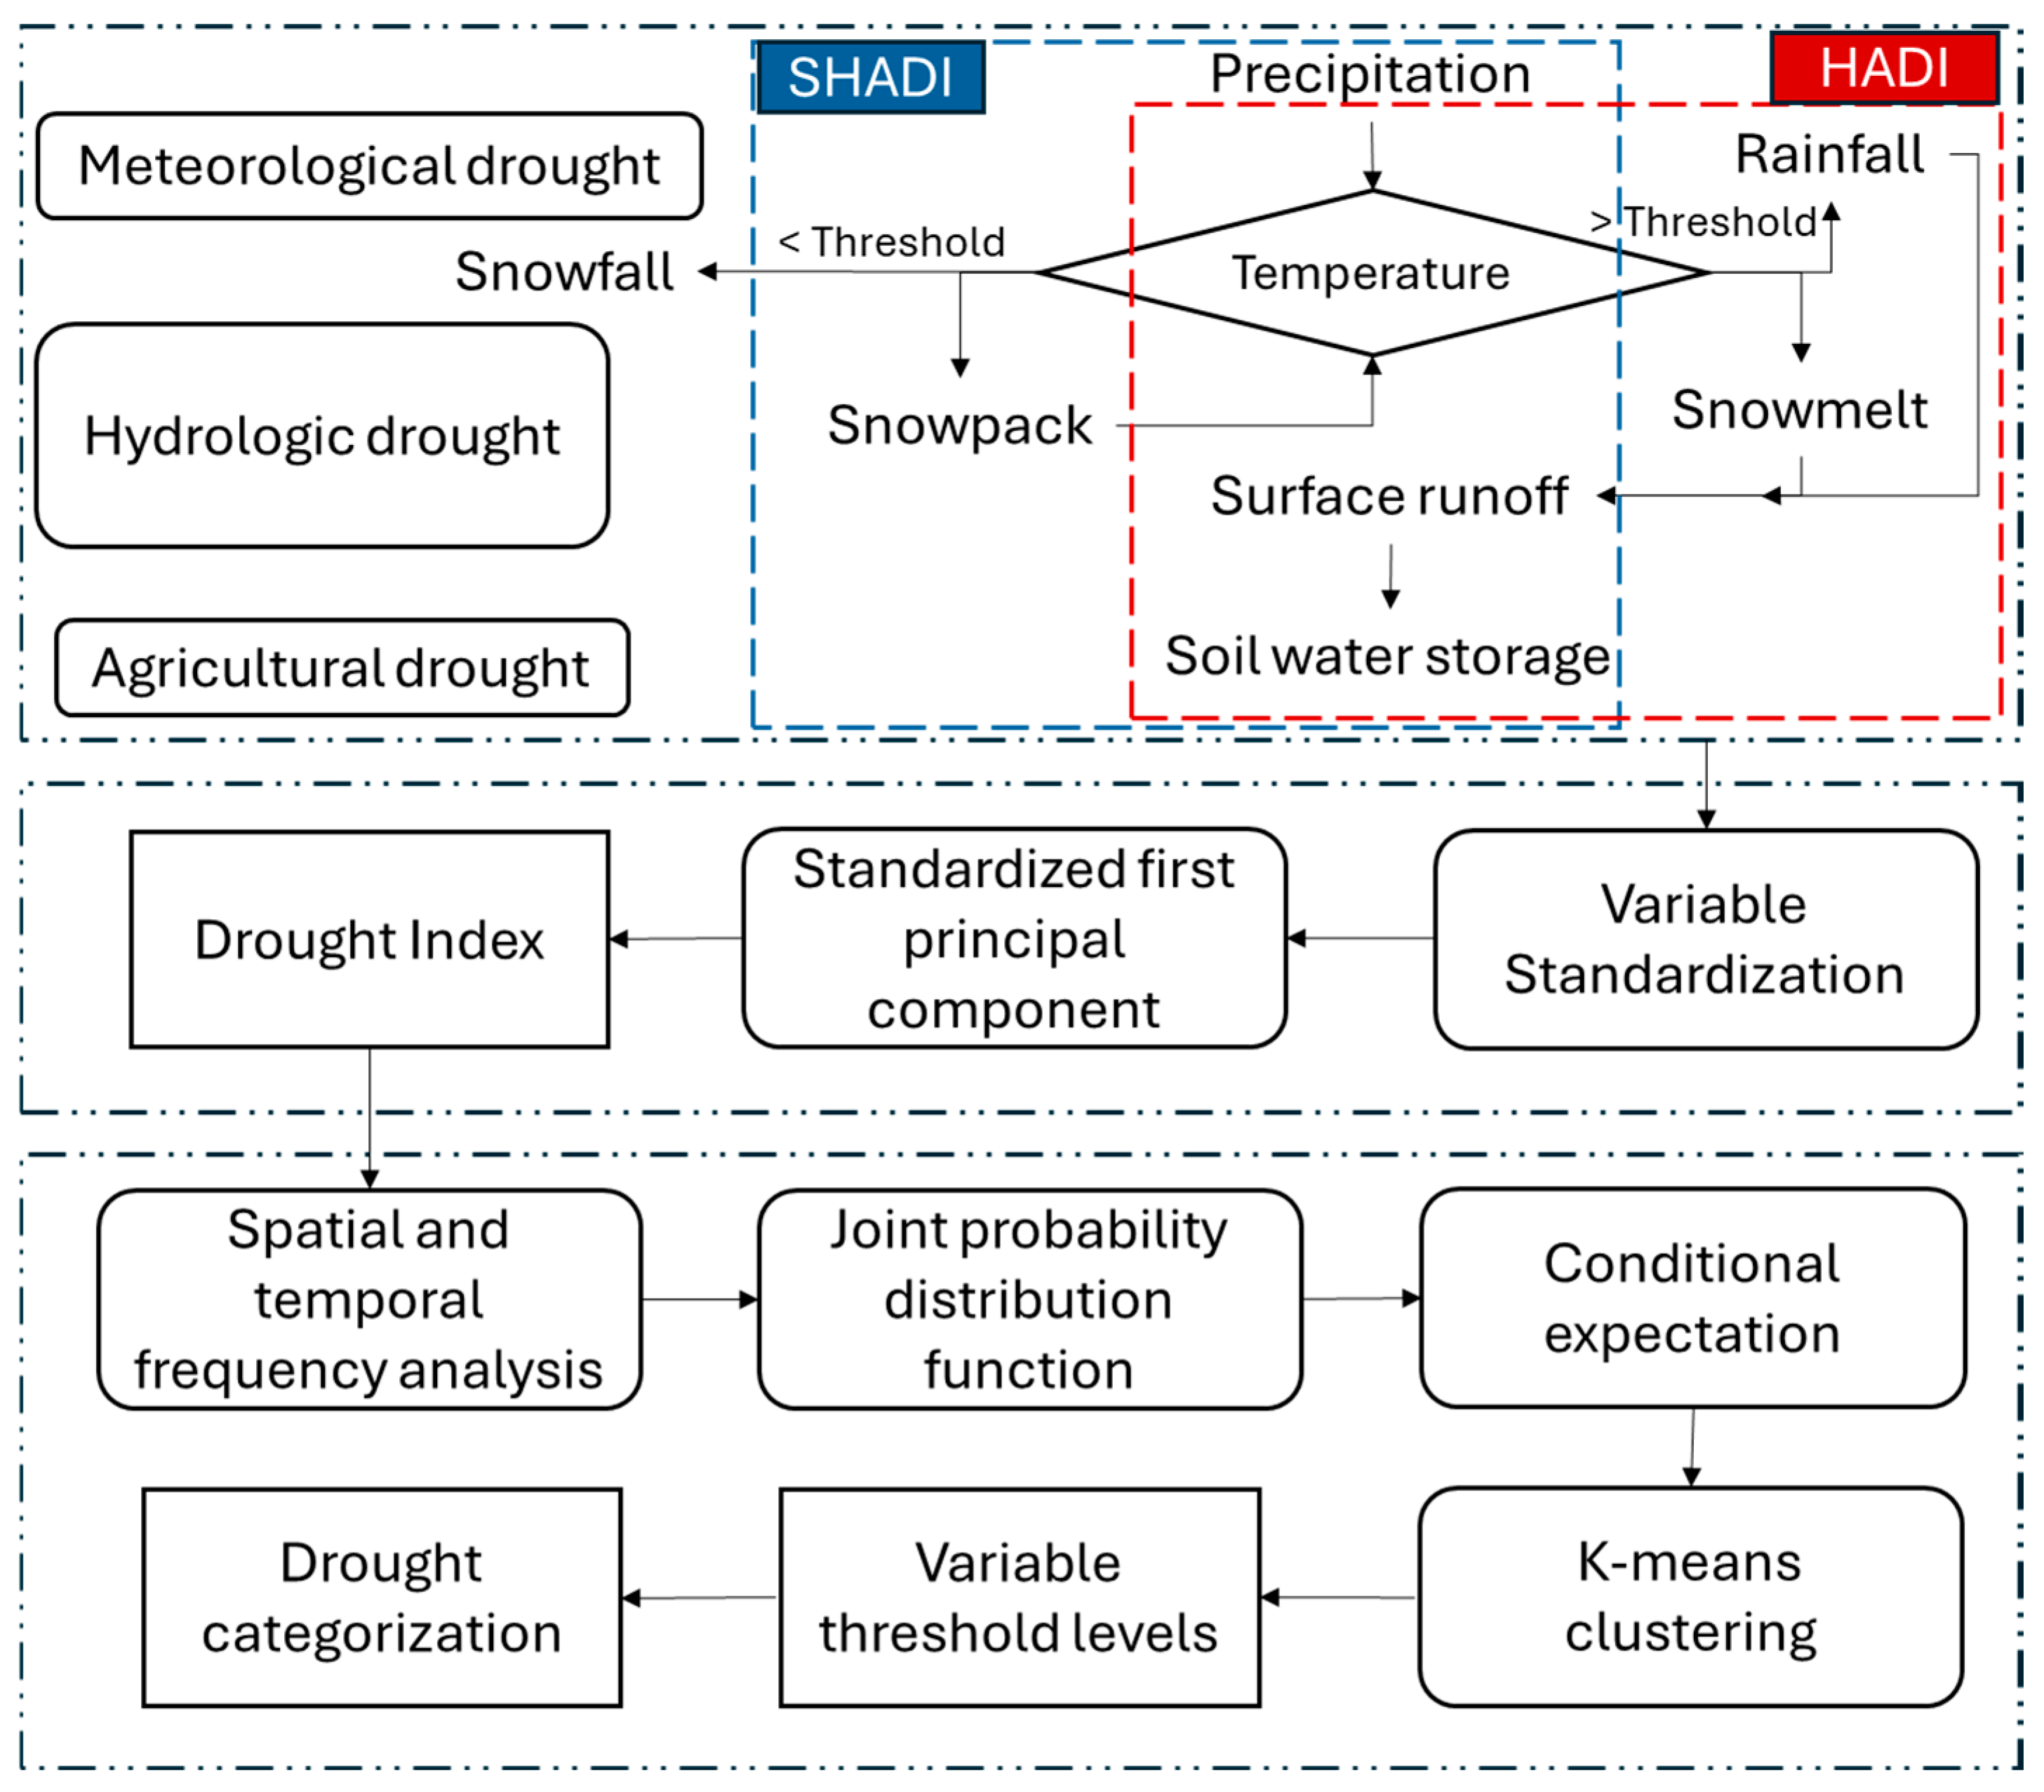
Figure 3.
Comparison of temporal and spatial distributions of HADI and SHADI.
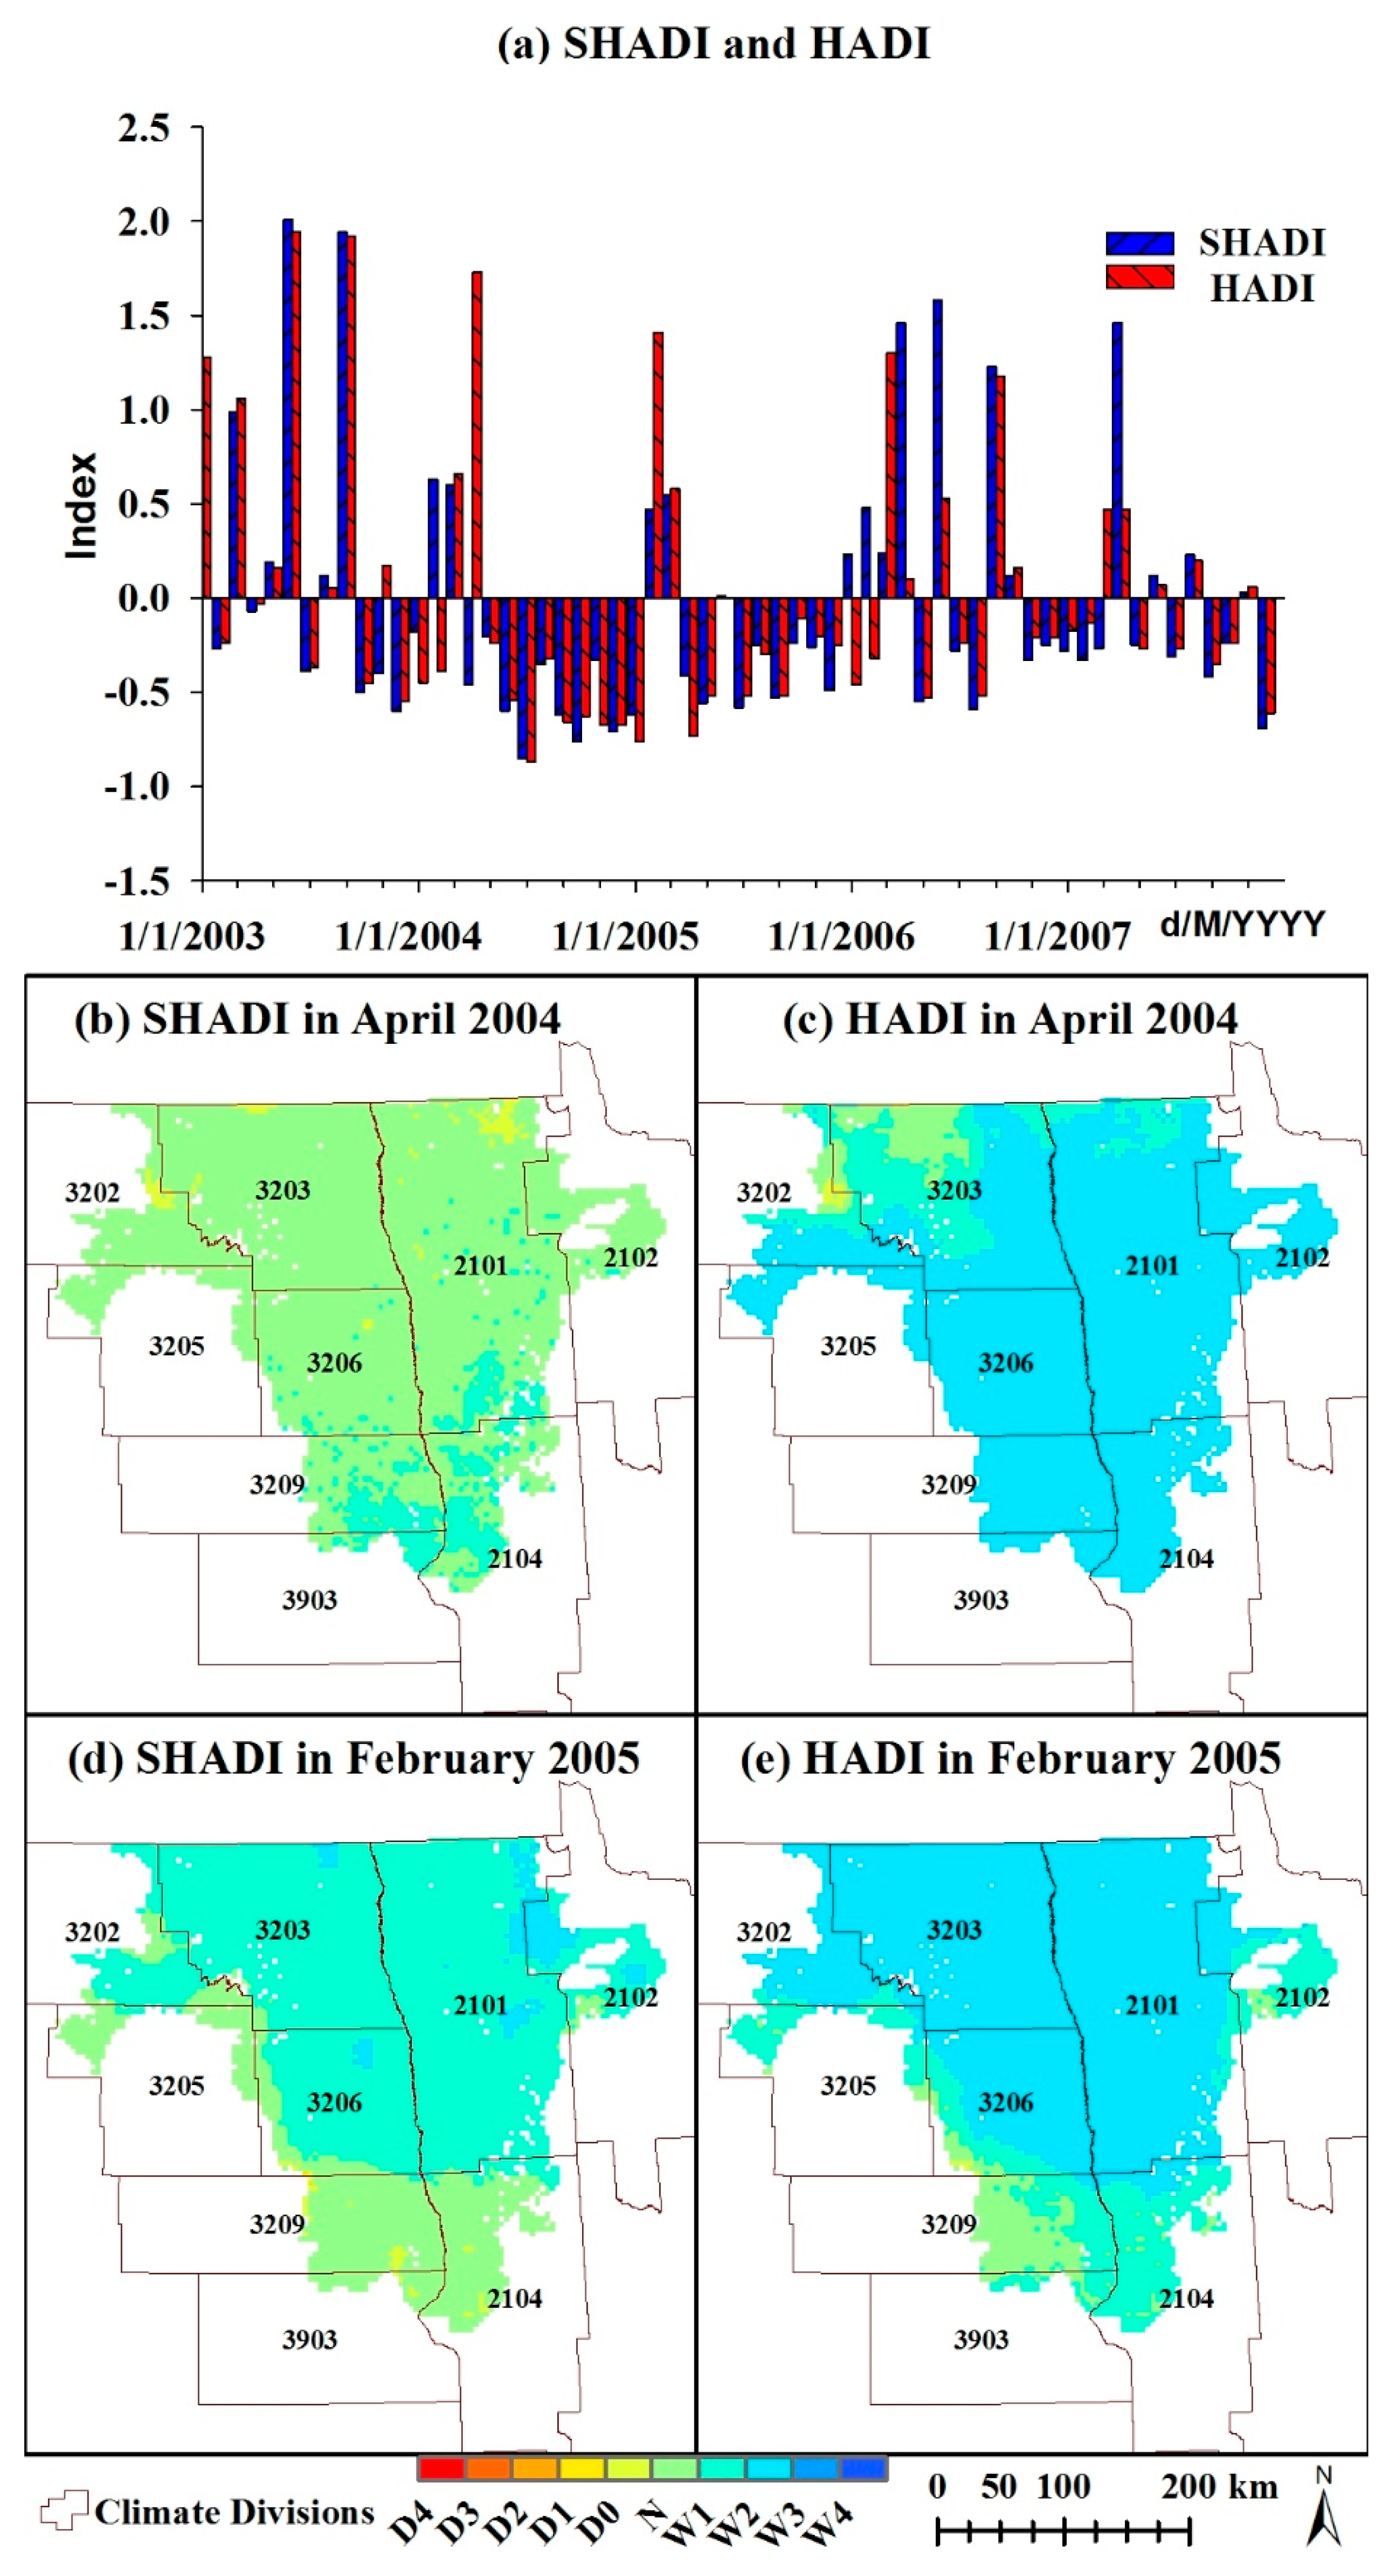
Figure 4.
Differences between HADI and SHADI in the RRB.
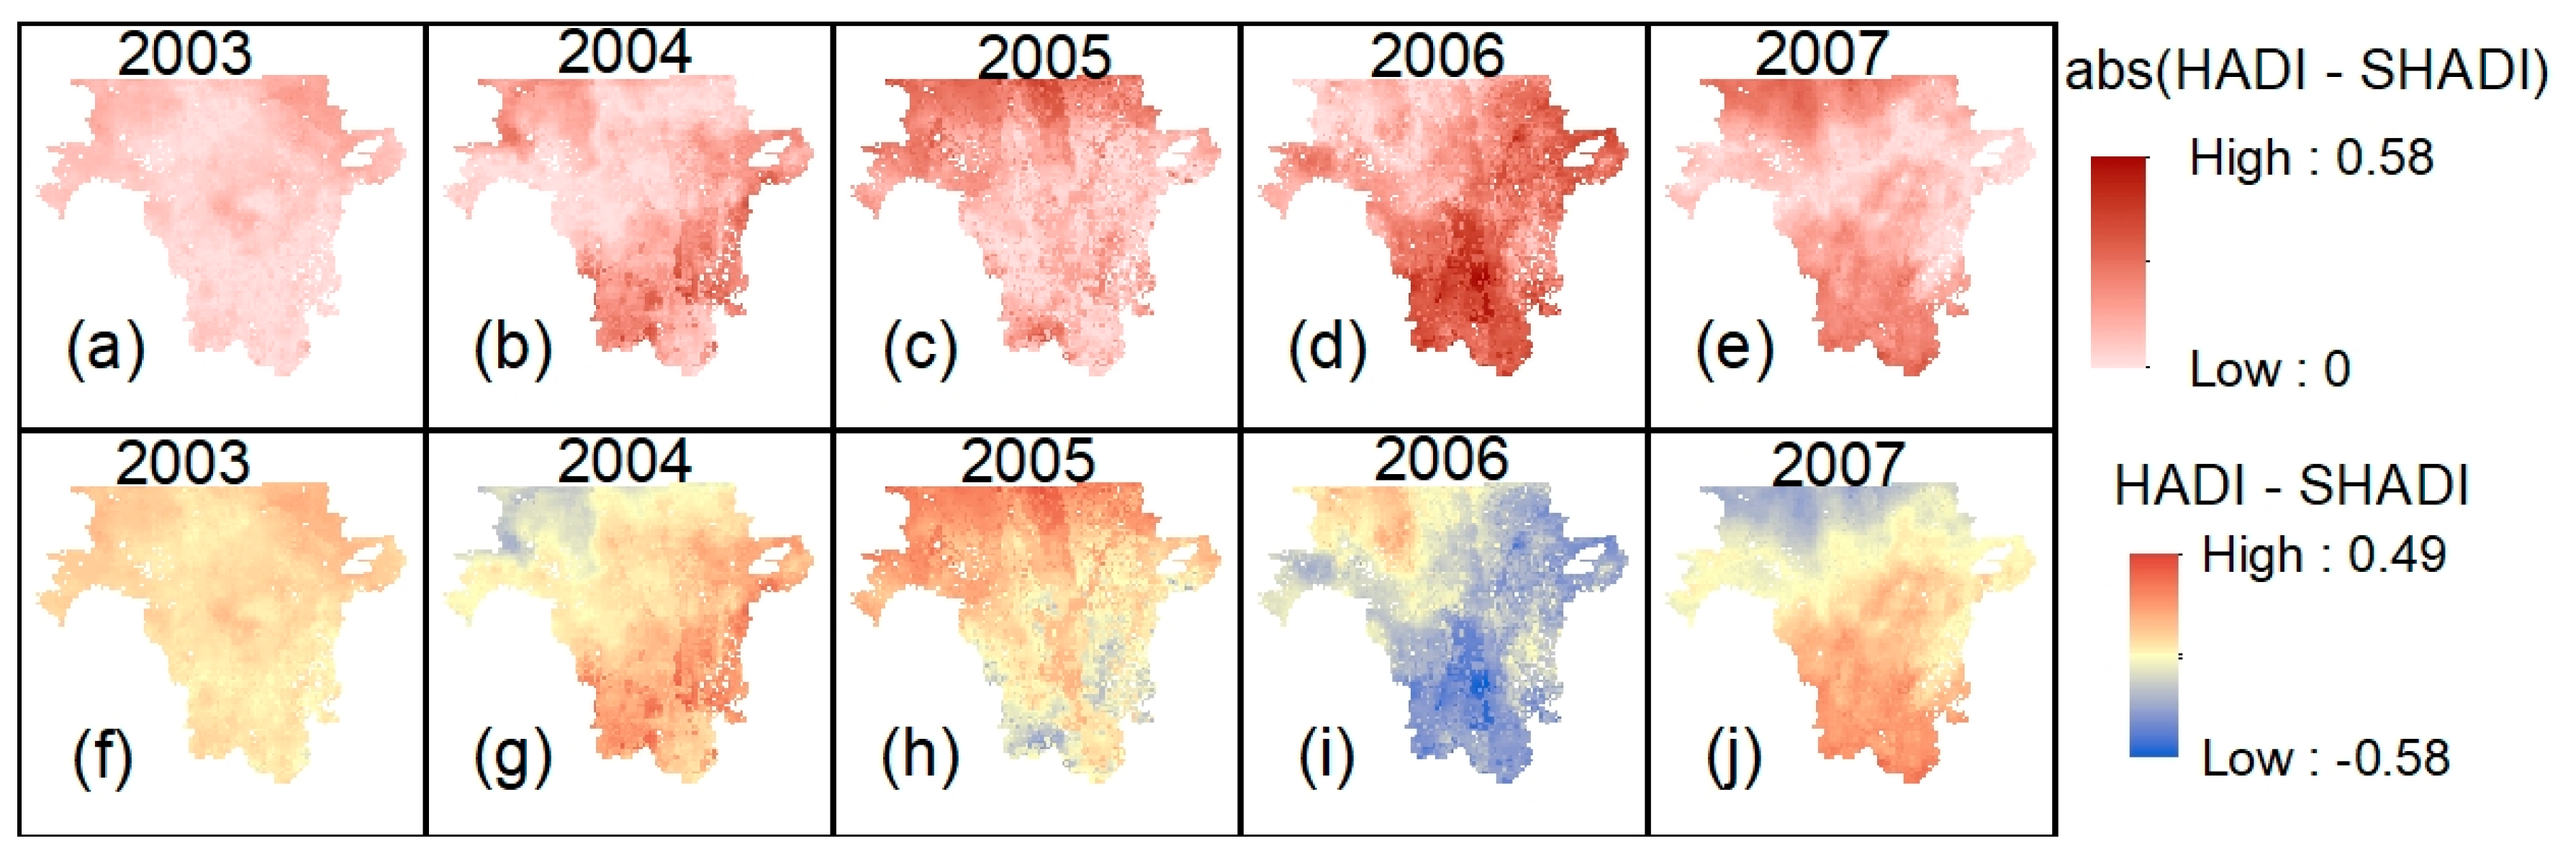
Figure 5.
Spatial and temporal distributions of HADI, SHADI, temperature, and precipitation in the RRB.
Figure 5.
Spatial and temporal distributions of HADI, SHADI, temperature, and precipitation in the RRB.
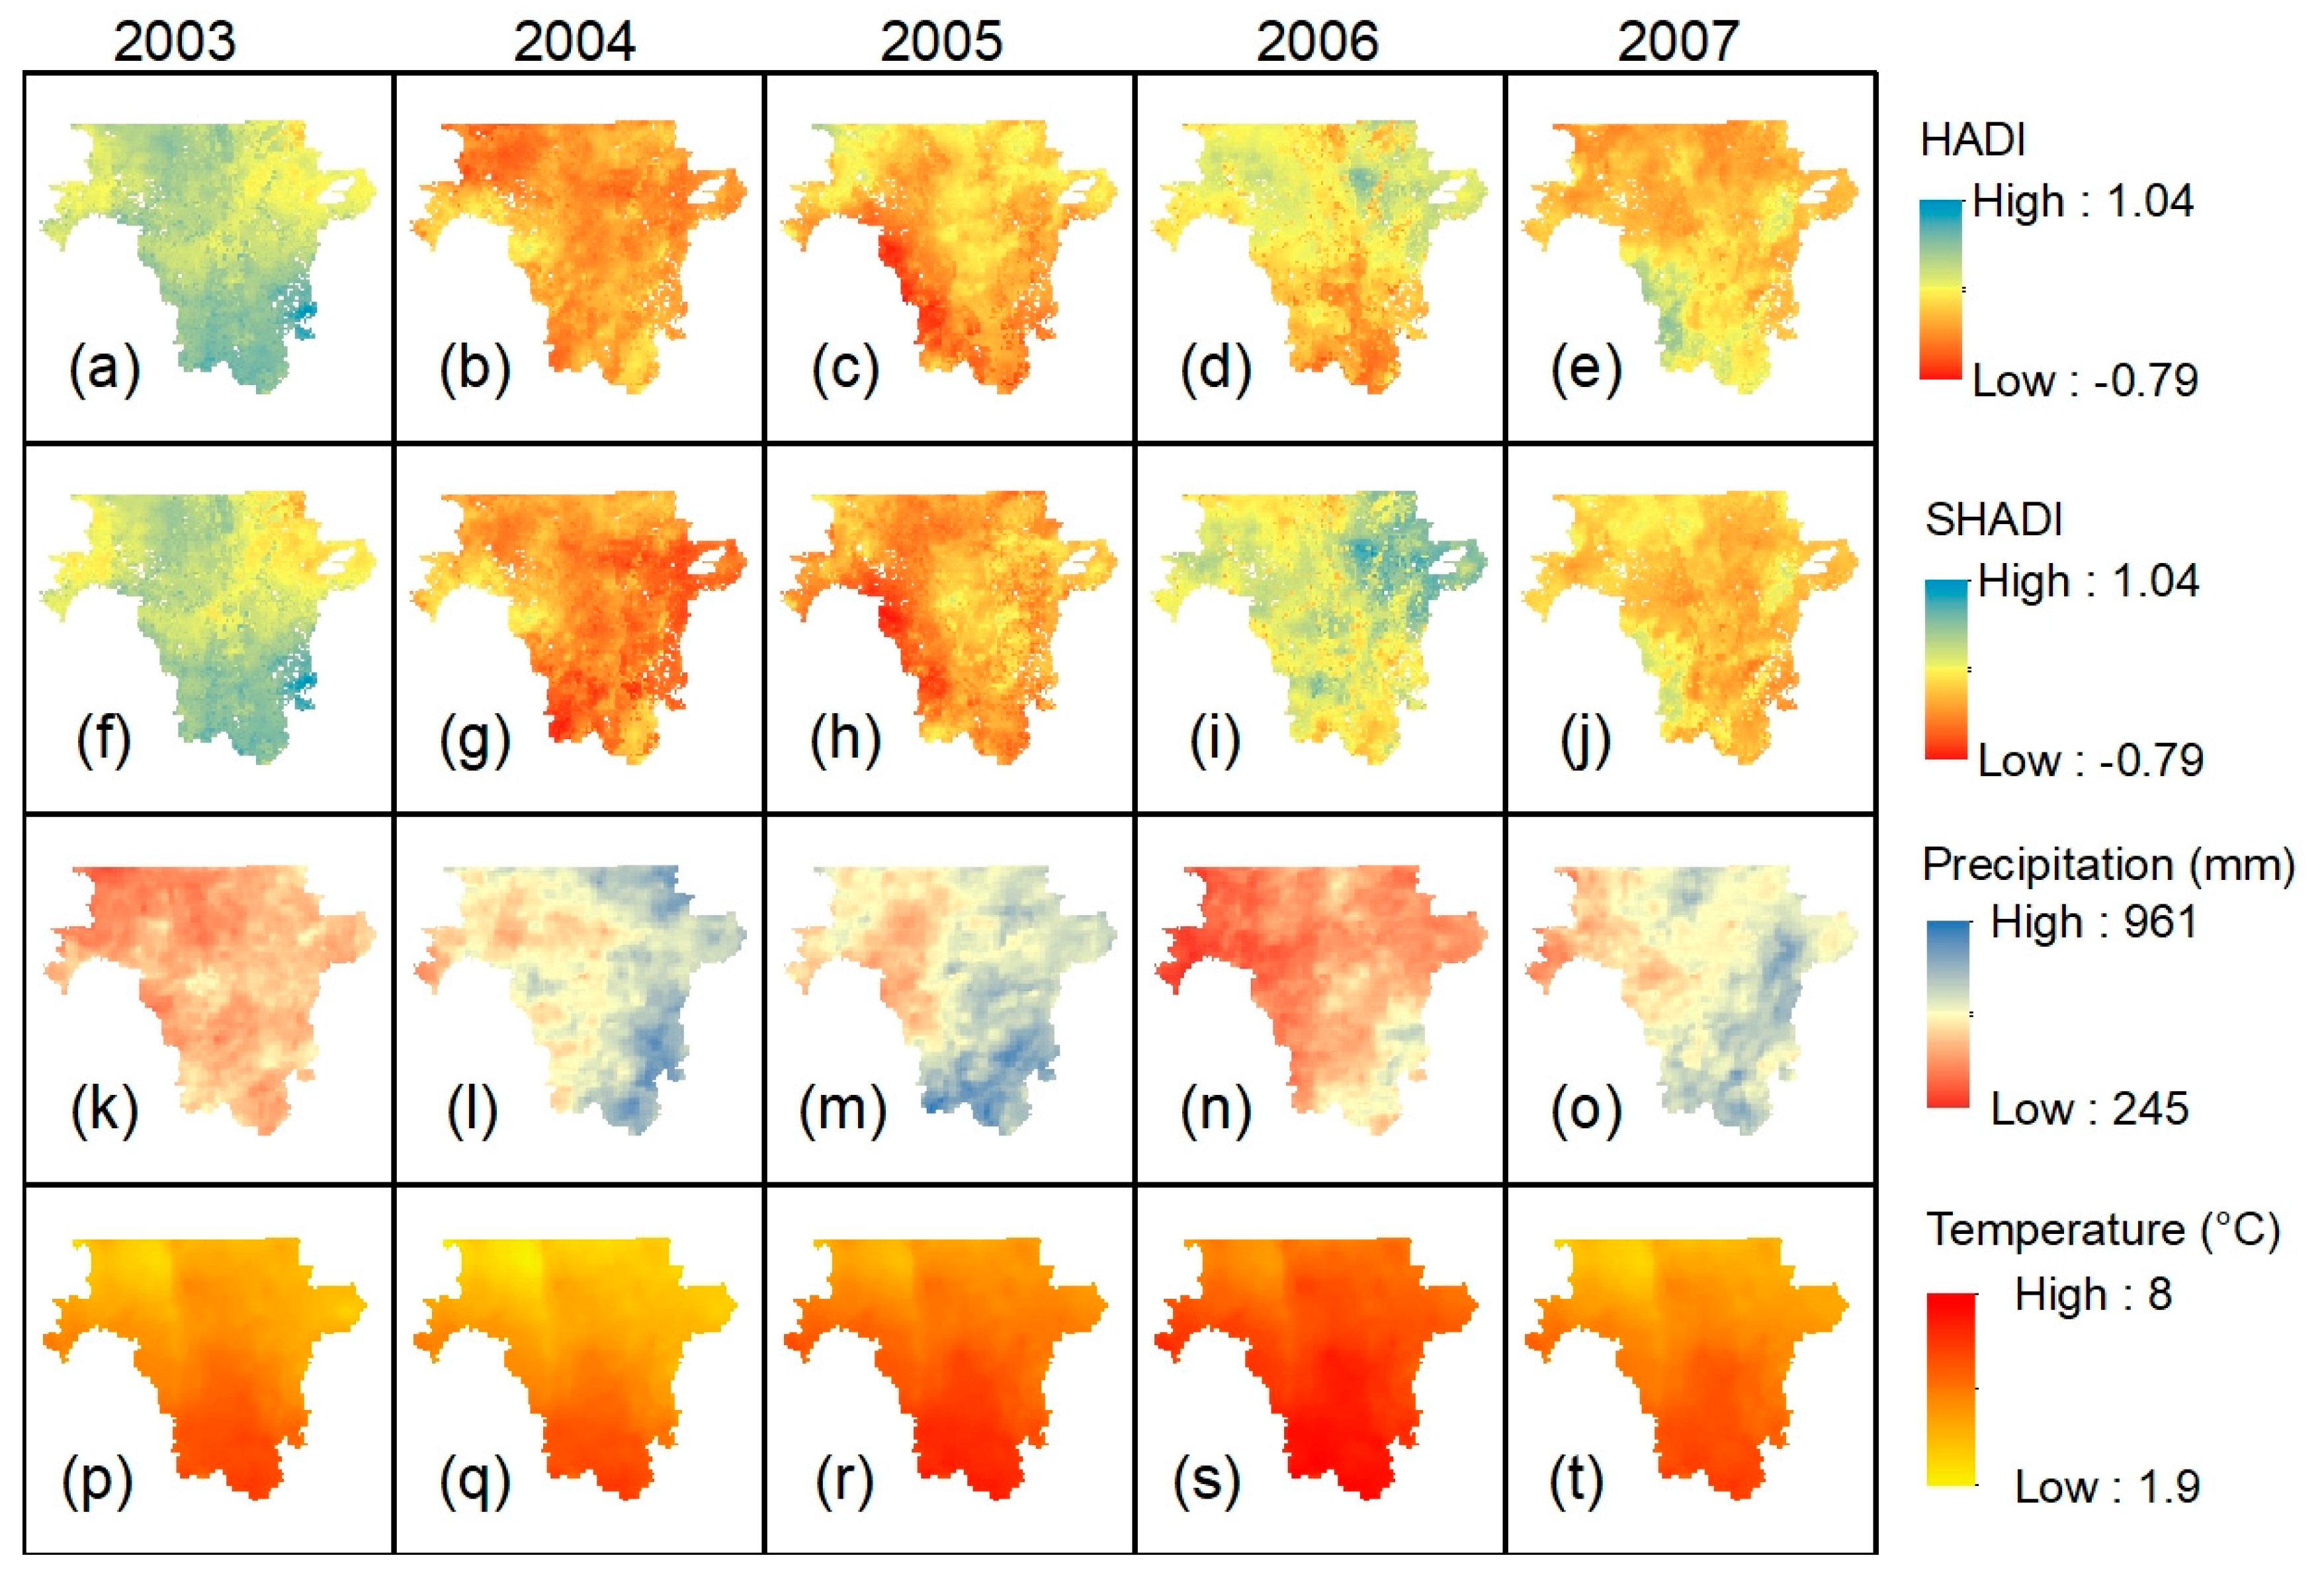
Figure 6.
Severity and coverage drought index of the USDM, SHADI, and HADI in climate divisions (a) 2101, (b) 3203, and (c) 3206.
Figure 6.
Severity and coverage drought index of the USDM, SHADI, and HADI in climate divisions (a) 2101, (b) 3203, and (c) 3206.
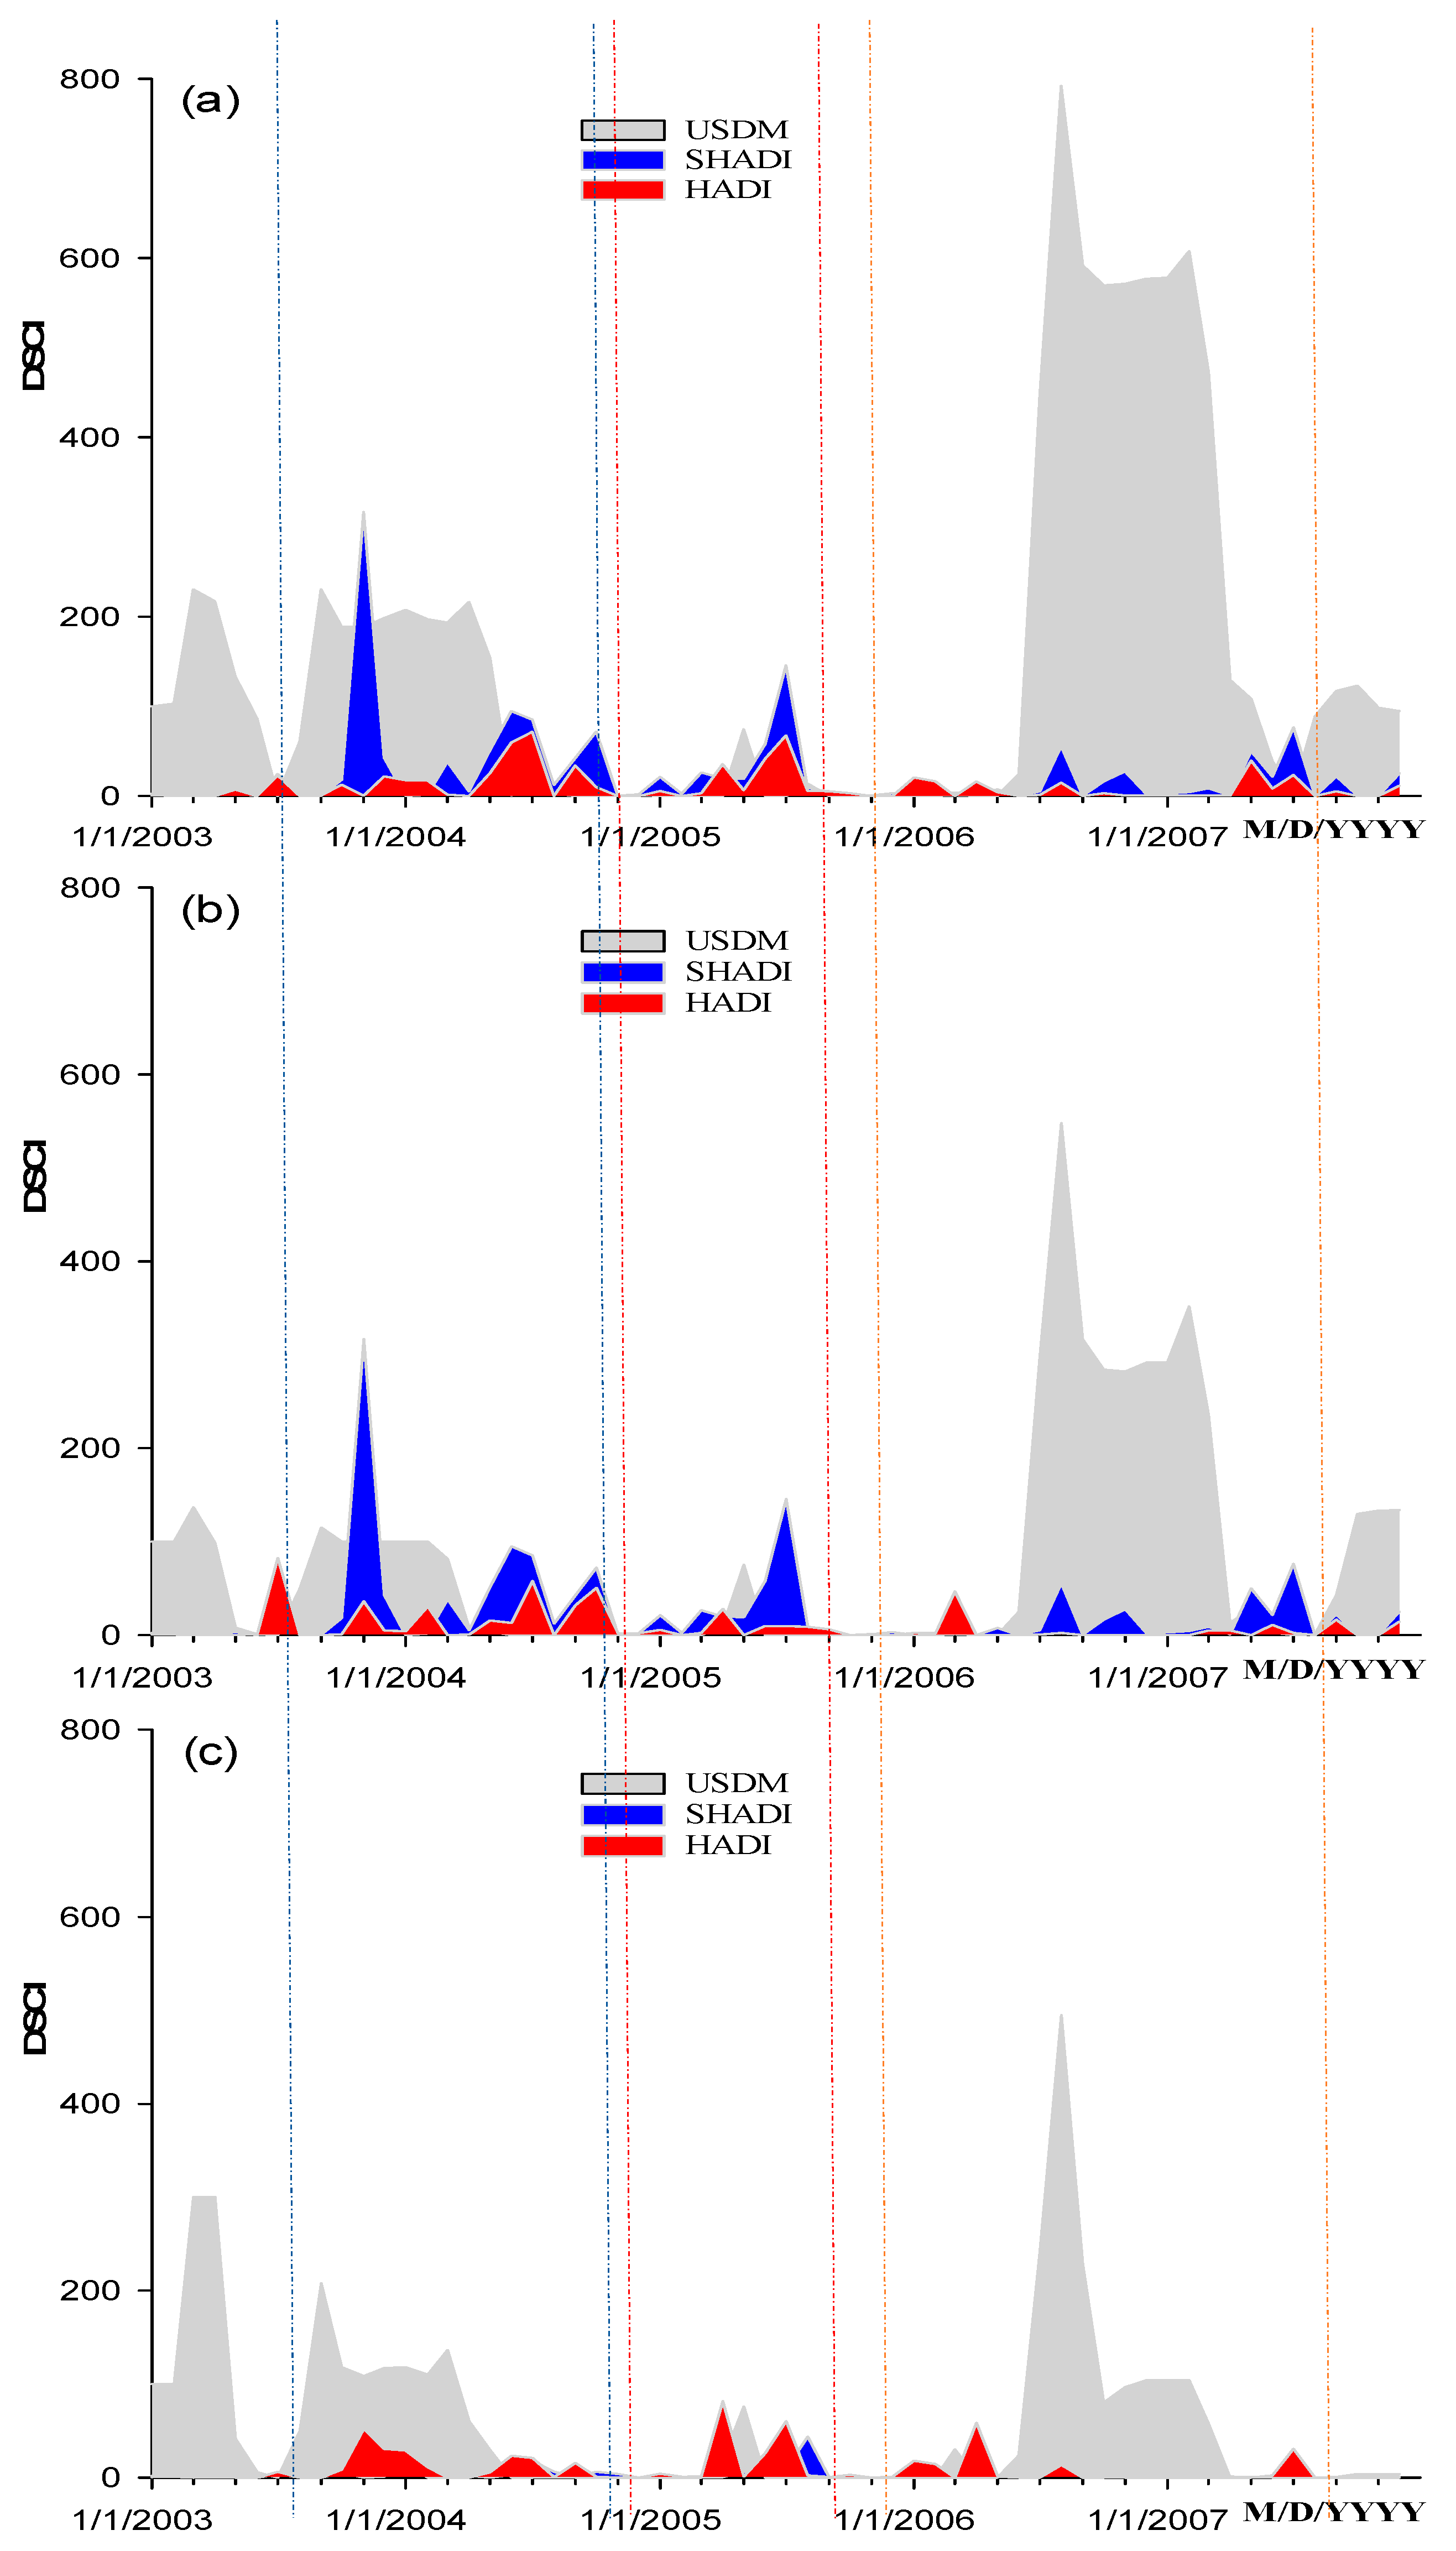
Figure 7.
Clustering results based on the inputs of the HADI and SHADI and their comparisons with their associated indices in climate divisions (a and b) 2101, (c and d) 3203, and (e and f) 3206.
Figure 7.
Clustering results based on the inputs of the HADI and SHADI and their comparisons with their associated indices in climate divisions (a and b) 2101, (c and d) 3203, and (e and f) 3206.
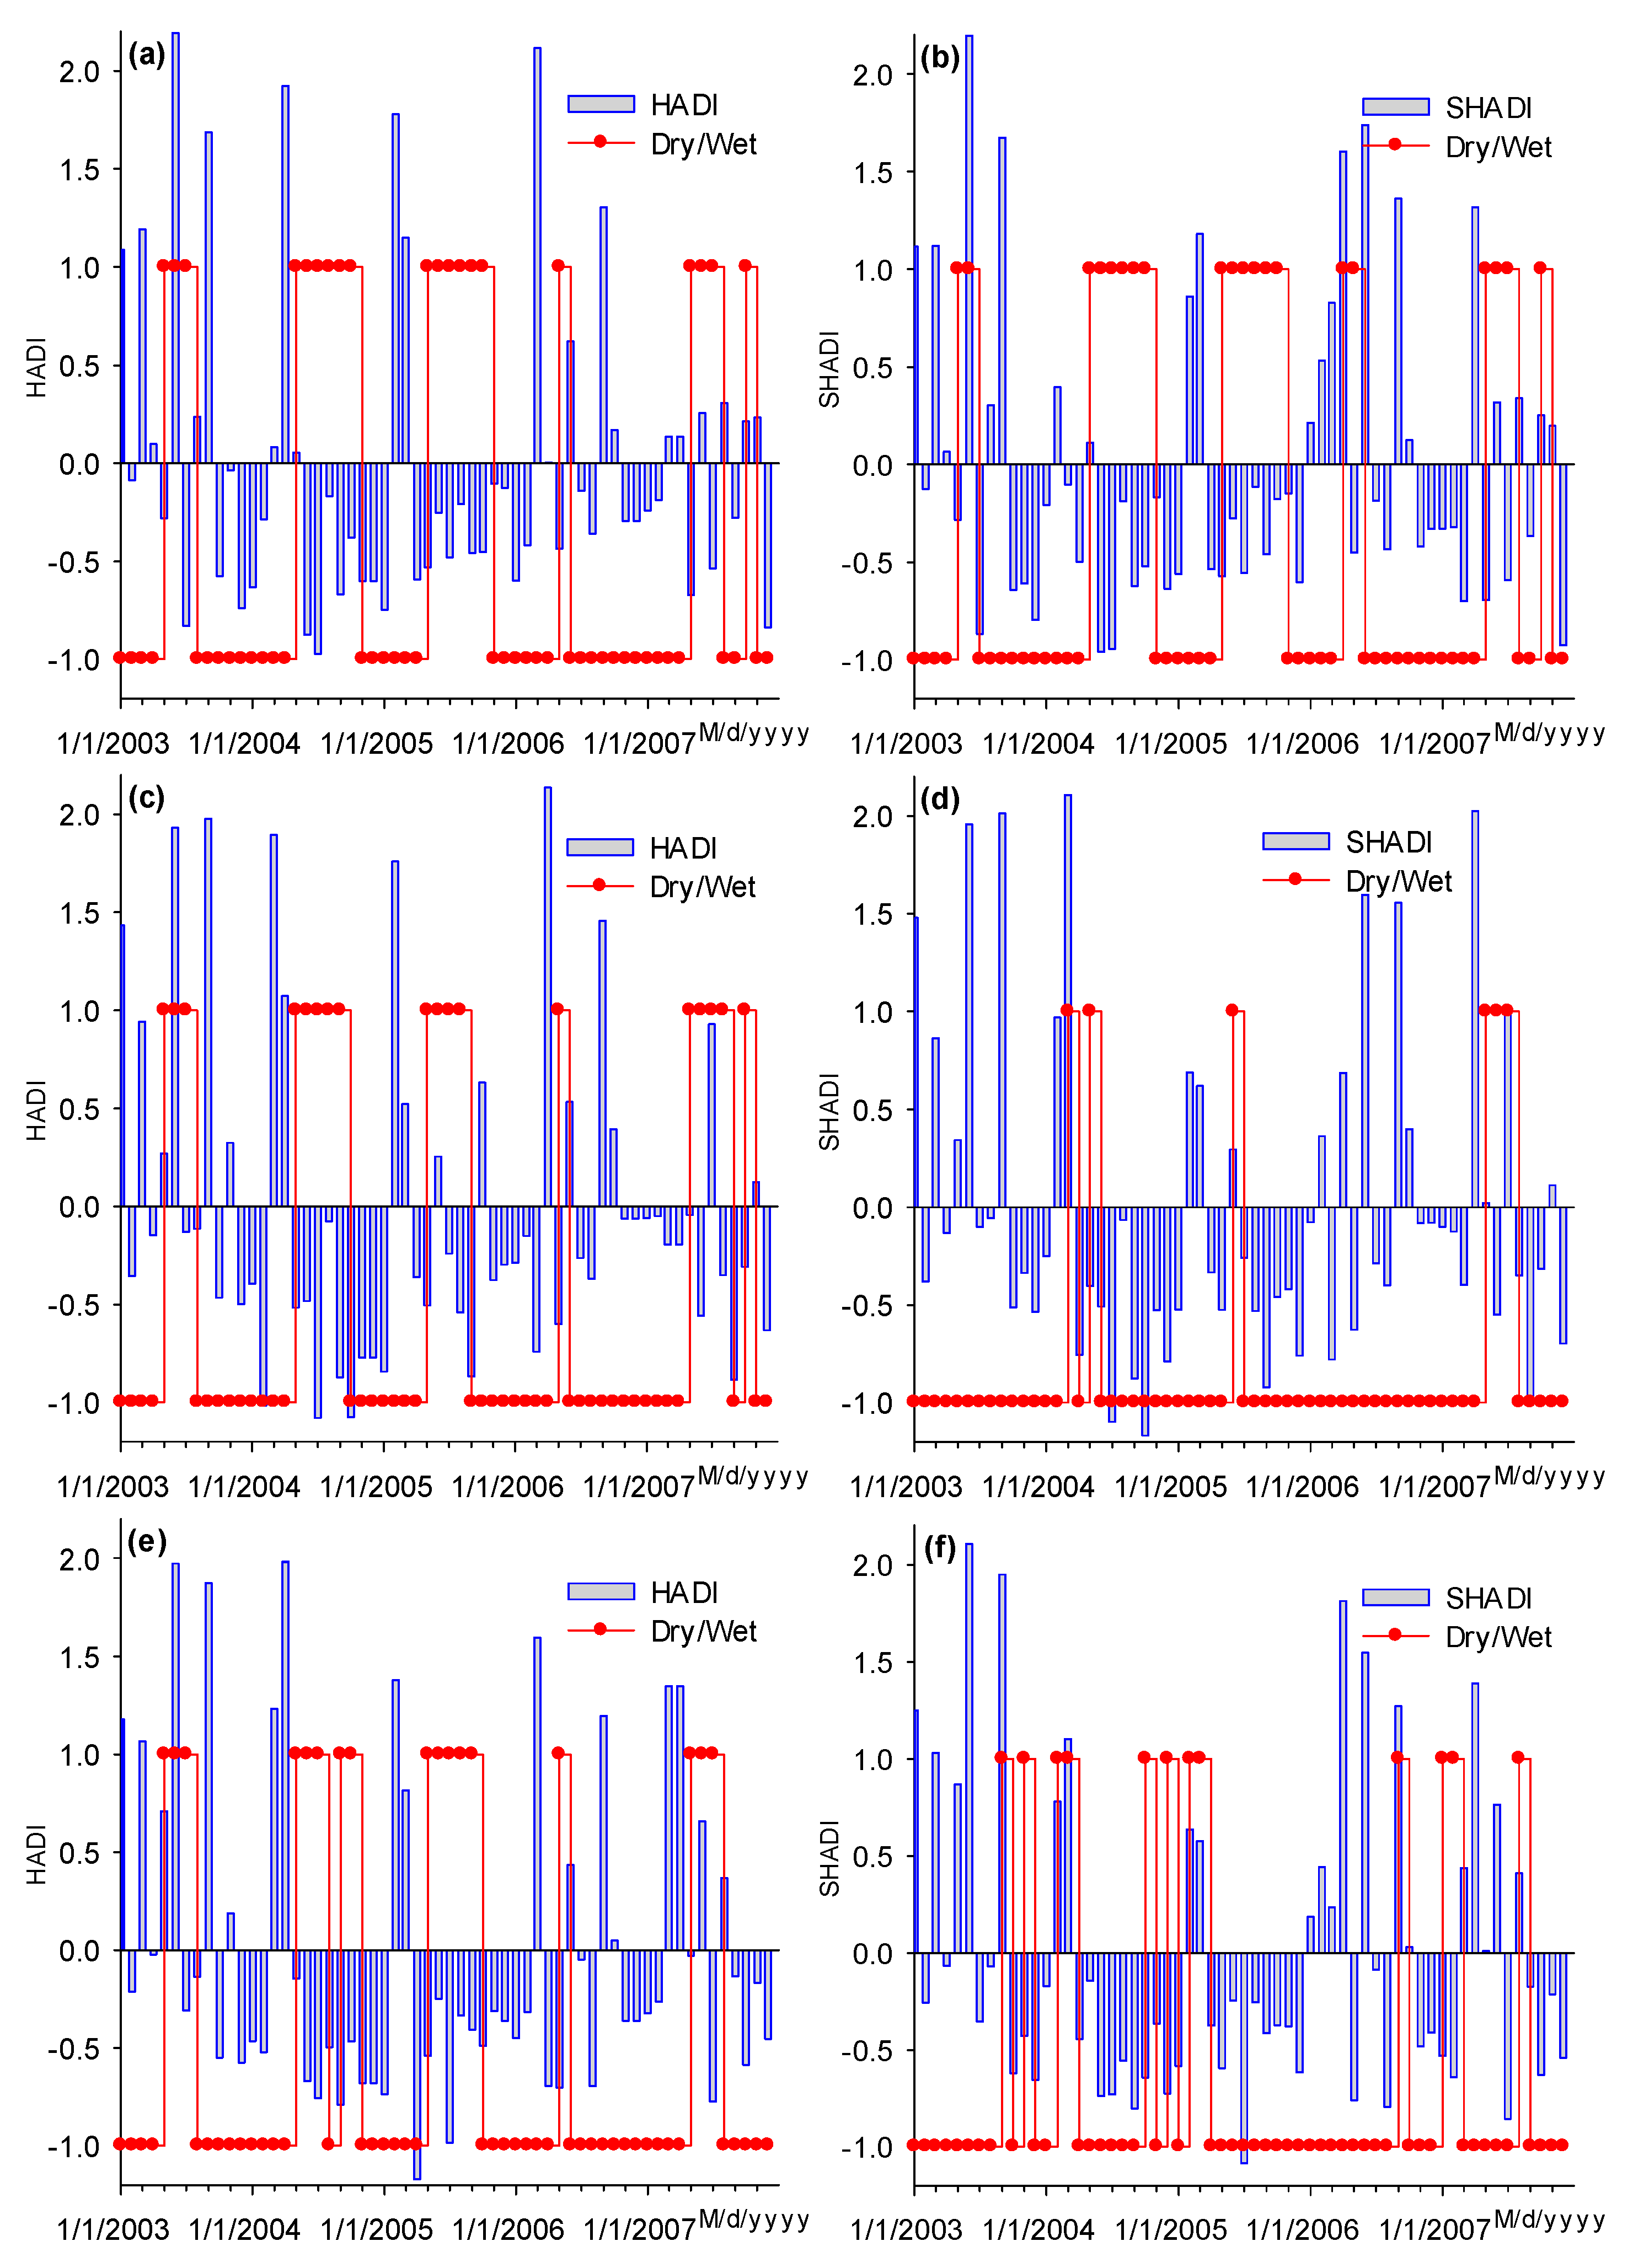

Table 1.
Variable threshold levels and drought categories based on the SHADI.
| SHADI values | HADI values | Category | Symbol |
|---|---|---|---|
| SHADI > 4.7 | HADI > 4.6 | Exceptional wet | W4 |
| 2.9 < SHADI < 4.7 | 2.9 < HADI < 4.6 | Extreme wet | W3 |
| 1.3 < SHADI < 2.9 | 1.3 < HADI < 2.9 | Severe wet | W2 |
| 0.2 < SHADI < 1.3 | 0.2 < HADI < 1.3 | Moderate wet | W1 |
| ─ 1.2 < SHADI < 0.2 | ─ 1.1 < HADI < 0.2 | Normal condition | N |
| ─ 1.5 < SHADI < ─ 1.2 | ─ 1.4 < HADI < ─ 1.1 | Abnormal drought | D0 |
| ─ 1.6 < SHADI < ─ 1.5 | ─ 1.5 < HADI < ─ 1.4 | Moderate drought | D1 |
| ─ 1.8 < SHADI < ─ 1.6 | ─ 1.7 < HADI < ─ 1.5 | Severe drought | D2 |
| ─ 1.9 < SHADI < ─ 1.8 | ─ 1.8 < HADI < ─ 1.7 | Extreme drought | D3 |
| SHADI < ─1.9 | HADI < ─1.8 | Exceptional drought | D4 |
Disclaimer/Publisher’s Note: The statements, opinions and data contained in all publications are solely those of the individual author(s) and contributor(s) and not of MDPI and/or the editor(s). MDPI and/or the editor(s) disclaim responsibility for any injury to people or property resulting from any ideas, methods, instructions or products referred to in the content. |
© 2024 by the authors. Licensee MDPI, Basel, Switzerland. This article is an open access article distributed under the terms and conditions of the Creative Commons Attribution (CC BY) license (https://creativecommons.org/licenses/by/4.0/).
Copyright: This open access article is published under a Creative Commons CC BY 4.0 license, which permit the free download, distribution, and reuse, provided that the author and preprint are cited in any reuse.


