
Submitted:
16 November 2024
Posted:
20 November 2024
You are already at the latest version
Abstract
Small object detection has always been a challenging task in the field of remote sensing image detection. Due to the small proportion and limited pixel size of small objects in images, especially when using Convolutional Neural Networks (CNNs), the downsampling operation in traditional algorithms often leads to the loss of detailed information of small objects, causing missed detection issues. To address this problem, this paper proposes an improved YOLOv8 algorithm. We designed an adaptive feature extraction and multi-scale fusion module, which enhances the expressive ability of features and effectively extracts the detailed information of small objects. We incorporated the AFGCAttention attention mechanism to strengthen the network's focus on key regions, suppress irrelevant background information, and improve the model's ability to recognize small objects. To overcome the resolution loss problem in small object detection, we adopted the CARAFE (Content-Aware ReAssembly of FEatures) upsampling operator. By reorganizing feature maps with content-awareness, it avoids the blurriness and information loss commonly found in traditional upsampling methods, especially showing significant advantages in the reconstruction of small object details, making their boundaries clearer and more accurate. Meanwhile, to improve the accuracy of bounding box regression, we combined the GIoU loss function to optimize the geometric shape matching between the target and predicted boxes, solving the issue of inaccurate bounding box localization in small object detection and improving localization precision. Experimental results show that the proposed algorithm achieves significant accuracy improvement in small object detection tasks, maintaining high detection robustness in complex background scenes. The improved model reaches a mean average precision (mAP) of 83.0% and an accuracy of 85.0%, which is an increase of 2.0% and 5.0%, respectively, compared to the baseline model. Compared with existing methods, this approach has significant advantages in detection accuracy, localization precision, and model computational efficiency, especially demonstrating outstanding performance in small object detection.
Keywords:
YOLOv8
; Remote Sensing Image Object Detection
; CARAFE Upsampling OperatorCARAFE
; C2f-DCNv2-MPCA Optimization Modulempca
; AFGCAttention Module AFGCAttention
; GIoU Loss Function GIoU
1. Introduction
Small target detection in remote sensing images plays a crucial role in various fields, such as environmental monitoring [1], urban planning [2], and disaster assessment [3]. High-resolution images obtained from remote sensing platforms (e.g., satellites, drones) provide rich surface information, which helps monitor the Earth’s surface and its dynamic changes. However, in these remote sensing images, the target objects are often small, such as vehicles, ships, and boarding ladders. Especially in high-altitude imaging and large-area scenarios, small targets occupy a very low proportion of pixels, typically accompanied by complex background information and strong noise interference. This makes accurate identification and localization of small targets a core challenge in remote sensing applications. Compared to large target detection, small target detection has unique difficulties: first, the contrast between the target and background is often low, making it easy to be obscured by complex background information; second, the appearance details of small targets are blurry, and traditional feature extraction methods struggle to effectively distinguish between the target and background; third, the small size of the target makes it difficult for conventional convolutional neural networks to maintain the integrity of target features at deeper layers. Additionally, remote sensing images typically have multispectral, hyperspectral, and temporal sequence characteristics, further increasing the data dimensionality and processing complexity.
To address these challenges, researchers have proposed various small target detection methods. Traditional feature-based methods, which rely on low-level features such as edges, textures, and shapes, can achieve certain results in specific scenarios. However, they perform poorly when faced with complex background variations. For example, Lin et al. [4] proposed a method for detecting buildings from a single image. By extracting line features, generating roof hypotheses, and validating them using shadows and walls, they ultimately create a three-dimensional model of the building. This method has shown good performance in practical tests. Kim et al. [5] combined the least squares method with template matching, using rectangular templates to replace profile maps in remote sensing images for detecting urban highways. However, this method heavily relies on prior knowledge of the templates, limiting its flexibility in remote sensing object detection. Low et al. [6] proposed a method called Scale-Invariant Feature Transform (SIFT) for extracting distinctive features from images with scale and rotation invariance. This method generates matchable features by detecting keypoints in the image. It performs well under conditions such as complex backgrounds, occlusion, and lighting changes, and is widely used in object recognition, robot navigation, and image stitching. Although SIFT can handle scale changes, in small targets, there are fewer and more blurred feature points, making it difficult for SIFT to stably extract keypoints, resulting in suboptimal detection performance. Ok et al. [7] proposed an automatic building detection method based on shadow recognition, analyzing the spatial relationship between buildings and shadows using a probabilistic landscape model, enabling automatic detection of buildings with different shapes.
With the rapid development of deep learning, target detection methods based on deep learning can be primarily divided into two categories: two-stage detection and single-stage detection. Among two-stage detection algorithms, the most representative are Region-based Convolutional Neural Networks (R-CNN) [8] and its derivative algorithms, such as Fast R-CNN [9] and Faster R-CNN [10]. Two-stage detection algorithms first use a Region Proposal Network (RPN) to quickly locate candidate regions, and then perform precise object classification and bounding box regression within these regions. The advantage of this method is that it achieves high detection accuracy, but since it requires processing in two stages, its speed is relatively slower. In contrast, single-stage detection algorithms, such as Single Shot MultiBox Detector (SSD) [11] and the YOLO (You Only Look Once) [12,13,14,15,16,17,18,19,20,21,22] series, directly predict bounding boxes and class probabilities from the image without the need for generating region proposals. The advantage of this method is its fast detection speed, making it suitable for real-time processing scenarios, though its detection accuracy is typically slightly lower than that of two-stage detection algorithms. Convolutional Neural Networks (CNN) and their variants have demonstrated powerful feature learning capabilities in object detection tasks, especially in automatically extracting multi-level features for objects in complex scenes, which significantly improves the accuracy of small target detection. However, the application of deep learning methods in small target detection still faces challenges. Due to the small proportion and fewer pixels of small targets in the image, CNNs are prone to neglect or lose key information about these targets during convolution operations, resulting in insufficient feature extraction and, subsequently, poor detection performance.
In recent years, to overcome the aforementioned challenges, many scholars have made significant contributions. For example, Liu et al. [23] proposed an improved Faster R-CNN algorithm to enhance object detection in remote sensing images. This method improves detection accuracy by enhancing the feature extraction network to accommodate multi-scale targets and optimizing the Region Proposal Network (RPN). However, the algorithm is relatively slow, and still faces challenges in detecting small targets. Wang et al. [24] proposed the CDE-DETR method for real-time object detection in high-resolution remote sensing images. By optimizing the Transformer architecture of RT-DETR and introducing a multi-scale feature enhancement module, detection accuracy is improved, and end-to-end real-time detection is achieved. However, the algorithm is relatively complex, and when processing large-scale high-resolution images, it may lead to computational bottlenecks, limiting its efficiency in resource-constrained environments. The YOLOv4 algorithm proposed by Bochkovskiy et al. [25] uses the CSPDarknet53 backbone network and an improved Feature Pyramid Network (FPN) to improve detection accuracy. However, the model still shows insufficient detection accuracy for small targets, especially in scenes with complex backgrounds and dense targets, where the false positive and false negative rates are high. Patil et al. [26] optimized the YOLOv5 algorithm by incorporating a more efficient feature fusion strategy, improving detection accuracy in remote sensing images. However, when processing high-resolution images, small target detection still suffers from missed detections, and the model’s adaptability to scene changes remains limited. Qi et al. [27] introduced an adaptive scale fusion method, which can dynamically adjust the feature scales to improve detection performance. However, for remote sensing images with very complex backgrounds, the detection performance is somewhat insufficient. Zhao et al. [28] proposed an improved Scale-Invariant Feature Transform (SIFT) method, combining multi-scale detection and feature fusion techniques to enhance object detection performance in high-resolution remote sensing images. Although the model performs well under moderate scale changes, detection accuracy remains unstable when facing very small targets. Duan et al. [29] proposed a hybrid attention multi-scale detection network, combining convolutional feature extraction and attention mechanisms to improve the model’s accuracy in detecting multi-scale targets. However, the detection accuracy for small targets is still low. Zhang et al. [30] proposed an improved YOLOv5 model for remote sensing image detection. By optimizing the network structure, introducing attention mechanisms, and improving feature fusion strategies, they successfully reduced the model size and computational requirements, enhancing processing speed while maintaining high detection accuracy. Despite this, the model still faces issues with false positives and false negatives in complex backgrounds. Ma et al. [31] proposed an improved version of the YOLOv8s algorithm specifically for small target detection in remote sensing images. The algorithm enhances feature extraction and detection capabilities for small targets by optimizing the network structure and introducing attention mechanisms. Despite its outstanding performance in small target detection, false positives and false negatives still occur in complex backgrounds.
Although significant progress has been made in object detection technology, there is still room for further optimization in small object detection tasks. Due to the small size of small objects, which often occupy only a few pixels, they are easily affected by background noise or occluded by larger objects, leading detection algorithms to overlook these targets. Additionally, small objects often lack prominent feature information, making it difficult for traditional feature extraction methods to effectively identify them. The main challenges that existing detection algorithms face in terms of accuracy and robustness include how to effectively address these issues. To solve these problems, this paper optimizes the YOLOv8 algorithm, with the main contributions as follows:
- 1)
- Introduced the C2f-DCNv2-MPCA optimization module to enhance the model’s multi-scale feature extraction capability, enabling better capture of small object details.
- 2)
- Added the AFGCAttention mechanism to adaptively focus on key regions of the image, reducing interference from irrelevant information and thereby improving the model’s accuracy.
- 3)
- Introduced the CARAFE (Content-Aware ReAssembly of Features) upsampling operator to adaptively reassemble feature maps with content-aware reconstruction, effectively enlarging the details of small objects, allowing the network to better restore the shape and location of small objects, thus improving small object detection accuracy.
- 4)
- Combined with the GIoU loss function to more accurately measure the matching degree between predicted and ground truth boxes, improving model training efficiency, reducing convergence time, and enhancing the accuracy of bounding box regression.
2. Related Work
2.1. Vision Transformer
The Vision Transformer (ViT) has made significant progress in the field of computer vision in recent years, particularly in tasks such as object detection and image classification. Unlike traditional Convolutional Neural Networks (CNNs), ViT captures long-range dependencies in images through global self-attention mechanisms, thereby more effectively extracting global features. This approach is particularly well-suited for tasks that require complex feature representations, such as small object detection in high-resolution images [32].
However, the Vision Transformer also faces several challenges, especially when handling high-resolution remote sensing images. High computational complexity and low training sample efficiency are the main limiting factors. To address this, researchers have proposed various improvement methods, such as using rotated window attention mechanisms to reduce computational costs while enhancing the accuracy of object representation [33].
In the field of remote sensing image processing, the advantages of ViT are particularly evident, especially in object detection tasks involving arbitrary orientations and complex backgrounds. By incorporating directional encoding techniques, ViT has shown outstanding performance in object detection within remote sensing images, significantly improving detection accuracy, particularly when handling high-resolution and complex scenes [34].
In addition, ViT has also guided smaller networks to achieve higher performance in remote sensing scene classification through knowledge distillation, further validating its broad applicability in multi-task learning [35]. These studies demonstrate that Vision Transformer has not only achieved success in academic research but also shown great potential in practical applications.
Nevertheless, ViT still has room for improvement in training efficiency and computational complexity. Future research could focus on reducing computational costs while further enhancing the model’s detection performance and adaptability to tackle more complex scenes and tasks [36].
2.2. Attention Mechanism
The attention mechanism plays a crucial role in the field of deep learning, especially in computer vision tasks such as image classification, object detection, and image segmentation. By simulating human visual attention, the attention mechanism allows the model to focus on more important feature areas, thereby improving the model’s performance and efficiency.
In recent years, many studies have focused on integrating attention mechanisms into Convolutional Neural Networks (CNNs) and Transformer architectures to enhance the model’s feature representation capability. Wang et al. [37] proposed ECA-Net, an efficient channel attention mechanism that uses 1D convolution to capture cross-channel interaction information, improving model performance without significantly increasing computational costs. Subsequently, Dosovitskiy et al. [38] introduced the Vision Transformer (ViT), which applies the Transformer directly to image patch sequences, demonstrating that a pure Transformer architecture can achieve excellent performance in image classification tasks when trained on large-scale datasets.
To address the computational complexity of Transformers in high-resolution image processing, Liu et al. [39] proposed the Swin Transformer, which effectively reduces computational costs by introducing a hierarchical structure and a shifted window mechanism, achieving state-of-the-art results in multiple vision tasks. Additionally, Carion et al. [40] developed DETR (Detection Transformer), applying the Transformer to object detection tasks and creating an end-to-end detection framework that simplifies the complex designs and post-processing steps in traditional detectors.
In terms of finer-grained feature extraction, Woo et al. [41] proposed CBAM (Convolutional Block Attention Module), which combines channel and spatial attention mechanisms to progressively refine feature representations, thereby improving the model’s performance across various vision tasks. These research advancements collectively drive the development of attention mechanisms in the field of computer vision, demonstrating their immense potential in enhancing model performance, efficiency, and generalization capability.
2.3. YOLOv8 Algorithm
YOLOv8 [42] is a model in the YOLO series that demonstrates outstanding performance in object detection. It not only achieves new heights in accuracy but also significantly improves detection speed. Based on the depth of the network and the width of the feature maps, the YOLOv8 family includes five different versions: YOLOv8-n, YOLOv8-s, YOLOv8-m, YOLOv8-l, and YOLOv8-x, to meet the demands of different scenarios. The architecture of YOLOv8 consists of three core components: Backbone, Neck, and Head. The Backbone, or the main network, is meticulously constructed with a series of convolutional modules (Conv), C2f structures, and SPPF modules to efficiently extract features of the objects. The Neck, or the neck network, integrates features from different layers of the Backbone using advanced architectures such as Feature Pyramid Networks (FPN) and Path Aggregation Networks (PAN), greatly enhancing the multi-scale feature fusion capability. Finally, the Head, or the head network, performs the final object detection tasks based on the previously extracted and fused features, including object classification and localization. The model accurately outputs the category of each object through the classification layer and predicts the position of the object through the bounding box regression layer.
3. Strategies for Improving YOLOv8
This paper improves YOLOv8, as shown in Figure 1, by introducing the C2f-DCNv2-MPCA optimization module, which effectively enhances feature extraction and representation, further improving detection accuracy. The AFGCAttention mechanism is added to increase the model’s sensitivity to key features while reducing interference from non-critical information, thus enhancing the model’s recognition accuracy. The CARAFE upsampling operator is used to reorganize features in a content-aware manner, improving image resolution and feature expression capabilities. Additionally, the GIoU loss function is incorporated to improve the similarity evaluation between predicted and ground truth boxes, accelerating model convergence and enhancing boundary box regression accuracy for more precise localization.
3.1. Improvement of the C2f Algorithm
In the YOLOv8 model, the original C2f module is replaced with the C2f-DCNv2-MPCA optimization module, primarily to address the issue of insufficient feature representation when the model encounters small and complex targets. Although the C2f module is lightweight and capable of feature fusion, its use of standard convolutions and fixed receptive fields limits the model’s ability to extract features when handling small targets, spatial transformations, and irregularly shaped objects, especially in small target detection. To improve the adaptability and detection accuracy of the YOLOv8 model, particularly for small target detection, we introduced the DCNv2 [43] module and the MPCA attention mechanism. This enhancement optimizes the model’s performance while maintaining computational efficiency.
As shown in Figure 2, the DCNv2-MPCA module first extracts basic features through convolutional layers, combining 2K offset fields and K modulation fields to achieve the flexibility of deformable convolution. It then enhances feature representation through the multi-path cross-attention mechanism of the MPCA module. Next, the Bottleneck-DCNv2-MPCA module further processes the feature map using deformable convolution and merges the input and output features through skip connections, improving the diversity of feature representation. Finally, the C2f-DCNv2-MPCA optimization module processes features using multi-path parallel convolutions and feature segmentation, merging the features from different paths after processing by the Bottleneck-DCNv2-MPCA module. This enhances feature extraction efficiency and representation capability. The overall structure, through a progressive layer-by-layer approach, combines deformable convolutions and cross-attention mechanisms to significantly improve the network’s adaptability and performance in handling spatial transformations and complex features.
3.2. AFGCAttention Module
The SPPF (Spatial Pyramid Pooling-Fast) module effectively integrates multi-scale feature information by performing multi-scale pooling operations on the input feature map. However, after integrating the information, SPPF may still contain some irrelevant or redundant features. The AFGCAttention [44] attention mechanism dynamically adjusts the weight of each channel based on its importance in the feature map, further optimizing feature selection. This allows the model to focus more on useful features for subsequent tasks, while ignoring unimportant or irrelevant background noise, as shown in Figure 3.
The n-th channel element of can be represented as the channel descriptor generated by global average pooling on the given feature map .
where: represents the pixel values of the n-th channel feature map, and is the global average pooling function. Through this function, the feature map transforms from the shape of to .
To capture local channel interactions while reducing the number of model parameters, we use an interval matrix to capture the interactions between local channels and set as follows:
where: represents the channel descriptor, represents the local information, and represents the number of adjacent channels.
In the experiment, we implement this process using Conv1D. To enhance the representation of global information and capture the dependencies between channels, we use a diagonal matrix to obtain global channel information and set as follows:
where: represents the global information, and represents the number of channels.
In the experiment, we use Conv2D to implement this process. To facilitate the interaction between global and local information, we combine the global information obtained through the diagonal matrix with the local information obtained through the band matrix. We capture their correlations at different granularities using the correlation matrix .
where: represents the correlation matrix.
Next, to accurately allocate feature weights and reduce computational complexity, we introduce an adaptive fusion strategy. We extract row and column information from the correlation matrix and its transpose as the weight vectors for global and local information. Dynamic fusion is achieved through a learnable factor, as shown below:
In which and are the fused global and local channel weights, and is the number of channels. This parameter represents the -type activation function. The strategy avoids redundant interactions between global and local information while further promoting their collaboration. Ultimately, the model is able to selectively emphasize key information and suppress irrelevant features, thereby achieving precise weight allocation for the relevant features.
Finally, the obtained weights are element-wise multiplied with the input feature map to obtain the final output feature map.
where: is the input feature map, is the output feature map, and represents the element-wise multiplication operation.
3.3. CARAFE Upsampling Operator
The YOLOv8 model uses nearest-neighbor interpolation for upsampling, which mainly relies on the geometric positions of the pixels and fails to fully exploit the potential semantic information in the feature map. This limits its receptive field, especially underperforming when handling small targets. In contrast, the CARAFE upsampling operator aggregates contextual information with a larger receptive field and can perform instance-specific processing, thereby enhancing the feature map’s ability to represent small targets.
The use of the CARAFE upsampling operator significantly improves the performance of small target detection, as it not only preserves and reconstructs the detailed features of small targets but also adds minimal computational complexity, making it easy to integrate with existing network architectures. Additionally, the large receptive field of the CARAFE upsampling operator allows it to better capture small targets in remote sensing images, improving the model’s recognition accuracy and detection precision, while maintaining efficiency in terms of computational resources. Therefore, in this paper, we replace the nearest-neighbor interpolation upsampling in the original YOLOv8 with the CARAFE upsampling operator. As shown in Figure 4, the CARAFE [45] upsampling operator consists of an upsampling kernel prediction part and a feature recombination part.
In the upsampling kernel prediction part, the feature map of size is first compressed by channel reduction, reducing channels to . The upsampling factor is , and the upsampling size is . After content encoding, the number of channels is changed from to . Then, the channels are expanded in the spatial dimension to obtain the upsampling kernel . Finally, the obtained upsampling kernel undergoes Softmax function kernel normalization to ensure that the weights of the convolutional kernel sum to 1, resulting in the output feature map .
In the feature recombination part, the output feature map is first expanded in the spatial dimension. Each position in the output feature map is mapped back to the input feature map . The original feature map region of size centered around each point is selected, and a dot product operation is performed with the predicted upsampling kernel at that point. Different channels at the same position share the same upsampling kernel. Finally, a new feature map of size is obtained.
3.4. GIoU Bounding Box Regression Loss Function
The bounding box regression loss function plays a crucial role in object detection tasks, directly affecting the model’s accuracy and convergence speed. Although the original CIoU loss function can measure bounding box regression errors to some extent, it exhibits weak generalization ability when dealing with complex backgrounds and noise interference, and has a slow convergence speed during optimization. This leads to insufficient performance in fine-grained tasks such as small target recognition. Therefore, to improve the model’s detection accuracy and robustness, we propose and adopt the GIoU (Generalized Intersection over Union) loss function [46] as a replacement for the traditional CIoU loss function. Unlike the CIoU loss, the GIoU loss function provides a more refined measurement of the difference between the predicted bounding box and the ground truth bounding box, allowing for more accurate capture of the bounding box’s shape, position, and scale variations. Based on this, the improved loss function effectively reduces the impact of background interference during bounding box regression, avoiding false detections caused by noise or irrelevant regions. By optimizing this loss function, the model’s object detection accuracy is improved.
In object detection tasks, Intersection over Union (IoU) is a key evaluation metric used to measure the overlap between the predicted bounding box and the ground truth bounding box. Specifically, the formula for calculating IoU is as follows:
where: A represents the predicted bounding box of the object, B represents the ground truth bounding box, and IoU is the Intersection over Union of the predicted and ground truth bounding boxes’ areas.
However, when the two bounding boxes do not overlap at all, the IoU value is zero, which can make training difficult, especially when there is a large gap between objects or when the bounding boxes do not overlap. To overcome this limitation, GIoU was proposed as an improved evaluation metric. GIoU improves upon IoU by providing meaningful loss information even when there is no overlap, thereby helping optimize training.
The formula for calculating GIoU is as follows:
where: A represents the predicted bounding box of the object; B represents the ground truth bounding box of the object; and C represents the area of the smallest bounding box that encloses both the predicted and ground truth bounding boxes.
Let the coordinates of the predicted bounding box be , the coordinates of the ground truth bounding box be, and let represent the coordinates of the smallest enclosing bounding box. The specific steps for GIoU as a bounding box regression loss function are as follows:
Step 1: Calculate the areas of and : .
Step 2: Calculate the area of the intersection between and : ,, , , .
Step 3: Find the smallest convex set that can enclose both and , and calculate the area of : , , , , .
Step 4: Calculate IoU and GIoU: , .
Step 5: Calculate the final loss value: .
4. Experimental Setup
4.1. Dataset
In the experimental section of this study, we used the SIMD dataset, an open-source remote sensing object detection dataset [47]. This dataset contains 5,000 high-resolution images (1024×768 pixels) and has annotated 45,096 objects across 15 different categories. These categories include various types of vehicles, such as cars, trucks, vans, long vehicles, and buses, as well as several types of aircraft, including airliners, propeller aircraft, trainer aircraft, chartered aircraft, and fighter aircraft. Additionally, the dataset includes categories for stair trucks, pushback trucks, helicopters, boats, and “others” for classifying miscellaneous objects. In practical applications, detecting small objects in remote sensing images is a highly challenging task, and the SIMD dataset contains a large number of small targets. For example, objects such as cars and stair trucks are often small in remote sensing images and may be harder to detect due to occlusion, angle variation, and other factors. To ensure stability in model training and evaluation, the dataset was split into training and testing sets in an 8:2 ratio, resulting in 4,000 training images and 1,000 test images. The diversity of targets in the SIMD dataset, particularly the complex distribution of small objects in various scenes, makes it an ideal benchmark for evaluating object detection models under real remote sensing conditions. To highlight the challenges in small object detection, sample images from the dataset are shown in Figure 5, illustrating examples of these small targets under different conditions.
As shown in Figure 6, in this experiment, the “car” category has the highest number of instances in the dataset, exceeding 16,000. The “boat” category follows with nearly 2,000 instances. Categories such as “truck” and “van” have fewer instances, while other categories like “airliner” and “bus” have more evenly distributed but relatively fewer instances. Overall, the distribution of instances across different categories is imbalanced, with cars and boats dominating the dataset.
As shown in Figure 7, this is a 2D histogram that displays the distribution density of data points along the X and Y axes. Darker areas indicate regions with a higher concentration of data points, while lighter areas represent regions with fewer data points. In the context of object detection, this histogram reflects the distribution of the center points of object bounding boxes, which helps evaluate how training data is distributed across different regions of the images.
As shown in Figure 8, this is a 2D histogram that illustrates the distribution of object widths and heights. The X-axis represents the width of the objects, and the Y-axis represents their height. Darker regions in the graph indicate higher density of data points, while lighter regions represent sparsely distributed data points. From the graph, it can be observed that most objects have smaller widths and heights (near the bottom-left corner), indicating that these objects are smaller in size. Additionally, as the width and height increase, the distribution of data points becomes more sparse, suggesting that larger objects are less common.
4.2. Experimental Environment and Parameter Settings
This study was conducted in a robust hardware and software environment to ensure efficient model training and optimal performance. The experiment utilized an NVIDIA RTX 4090 GPU with 24GB of VRAM, providing powerful parallel processing capabilities for deep learning tasks. The CPU was an AMD EPYC 7T83 64-core processor (22 vCPUs), offering ample computational resources for data preprocessing and model training. The experimental environment ran on the Ubuntu 20.04 operating system and used the CUDA 11.3 framework to fully leverage GPU acceleration and enhance computational efficiency. On the software side, the PyTorch 1.11.0 deep learning framework was employed, providing a flexible and efficient platform for building and training deep learning models. The programming language used was Python 3.8, ensuring code readability and extensibility. The dynamic computation graph and user-friendly interface of PyTorch made it an ideal choice for the experiment. In the specific setup of the experiment, the resolution of the training images was adjusted to 640×640 to meet the model input requirements. The batch size was set to 64, balancing memory optimization with training efficiency on the GPU. The number of training epochs was set to 200, ensuring sufficient iterations for learning and convergence. The number of workers was set to 4 to speed up data loading by utilizing the multi-threading capabilities of the CPU. The initial learning rate was set to 0.01, ensuring a good balance between convergence speed and model accuracy. The momentum parameter was set to 0.937 to stabilize updates during training, and the weight decay coefficient was set to 0.0005 to prevent overfitting by penalizing large weights. This combination of hardware and software resources, along with the carefully selected hyperparameter settings, provided a solid foundation for the model training and evaluation process, ensuring efficient and reliable experimental results.
4.3. Evaluation Metrics
The experiments in this study use the following evaluation metrics: Precision (P), Recall (R), Average Precision (AP), and mean Average Precision (mAP) [48]. Additionally, the parameter count (Parameters) is also considered. The calculation expressions for these metrics are shown in the following formulas:
where: represents the number of correctly detected targets; represents the number of incorrectly detected targets; represents the number of missed targets; n represents the number of classes; is the average precision of the i-th target class.
5. Experiment Analysis
5.1. Algorithm Comparison Experiment
In this study, we conducted a systematic evaluation of various mainstream object detection algorithms, including SSD, Faster R-CNN, RT-Detr-resnet18, and several versions of YOLO. By analyzing key performance metrics such as Precision, Recall, mAP@0.5, and mAP@0.5-0.95, we revealed significant differences in detection accuracy and efficiency across the algorithms. Table 1 summarizes the comparison results. Notably, our proposed improved model (Ours) not only achieved outstanding accuracy while maintaining high computational efficiency but also demonstrated strong competitiveness in the mAP@0.5-0.95 metric, highlighting its immense potential for real-time detection applications. This result provides important insights into balancing detection accuracy and computational cost and offers strong support for selecting object detection algorithms for different practical scenarios.
Table 1 shows that Ours performs exceptionally well across multiple metrics, particularly in Precision and mAP@0.5. Ours achieves a Precision of 85.0%, higher than SSD’s 81.1%, demonstrating a significant improvement in detection accuracy. Compared to Faster R-CNN, Ours has an mAP@0.5 of 83.0%, while Faster R-CNN only reaches 76.7%, indicating Ours’ stable performance in detecting both large and small scale objects. Compared to RT-Detr-ResNet18, Ours also outperforms in both accuracy and mAP. RT-Detr-ResNet18’s Precision is 72.9%, lower than Ours’ 85.0%. In mAP@0.5, RT-Detr-ResNet18 is 74.7%, far below Ours’ 83.0%. In the mAP@0.5-0.95 evaluation, RT-Detr-ResNet18 scores 59.7%, while Ours achieves 66.9%, demonstrating stronger robustness. Although RT-Detr-ResNet18 has a higher FPS of 59.1 f/s compared to Ours’ 111.1 f/s, its floating point operations (78.1 GFLOPS) and parameter count (25.47M) are much higher than Ours’ 8.3 GFLOPS and 3.24M, giving Ours an edge in inference speed and computational efficiency. In comparison with the YOLO series, Ours still performs excellently. Ours’ Precision is 85.0%, higher than YOLOv5s’ 81.4%. In mAP@0.5-0.95, Ours scores 66.9%, similar to YOLOv8n’s 66.5%. Although YOLOv5n has a much higher FPS of 454.5 f/s compared to Ours’ 111.1 f/s, Ours strikes a better balance between accuracy and resource consumption, with only 3.24M parameters and 8.3 GFLOPS, significantly lower than YOLOv8n’s 28.5 GFLOPS and 11.13M parameters, showcasing its efficiency in resource-constrained environments. Compared to YOLOv10n, Ours’ Precision of 85.0% is significantly higher than YOLOv10n’s 73.8%. In mAP@0.5, Ours scores 83.0%, outperforming YOLOv10n’s 76.1%. In mAP@0.5-0.95, Ours achieves 66.9%, while YOLOv10n only reaches 59.3%. Although YOLOv10n has a higher FPS of 123.4 f/s, its accuracy and robustness are still inferior to Ours. In the comparison with YOLOv11n, Ours leads again. YOLOv11n’s Precision is 72.7%, and mAP@0.5 is 78.9%, both lower than Ours’ 85.0% and 83.0%. Although YOLOv11n has an FPS of 94.3 f/s, close to Ours’ 111.1 f/s, its detection stability and accuracy are not as good as Ours. When compared to YOLOv7-tiny, Ours also performs better. YOLOv7-tiny’s Precision is 74.6%, lower than Ours’ 85.0%, and in mAP@0.5, YOLOv7-tiny scores 79.2%, significantly below Ours’ 83.0%. In mAP@0.5-0.95, YOLOv7-tiny is 61.8%, while Ours is 66.9%. Although YOLOv7-tiny has a higher FPS of 344.8 f/s, exceeding Ours’ 111.1 f/s, its floating point operations (13.1 GFLOPS) and parameter count (6.04M) are much higher than Ours. Ours achieves a better balance between accuracy and computational efficiency. In conclusion, Ours demonstrates superior performance across various algorithm comparisons, showcasing significant advantages in precision, robustness, and computational efficiency.
Table 2 presents a comparison of precision across different algorithms for various object categories, with the Ours algorithm showing superior performance in multiple categories. Firstly, in the Car category, Ours achieves a precision of 88.7%, surpassing YOLOv5n at 87.4%, YOLOv5s at 86.1%, and SSD at 83.2%. This result indicates that Ours is the most precise in detecting common vehicles. For the Truck category, Ours achieves a precision of 81.0%, slightly lower than YOLOv5n’s 81.3%, but still maintains strong accuracy in this category. In the Van category, Ours achieves a precision of 79.0%, outperforming YOLOv7-tiny’s 70.7% and Faster R-CNN’s 57.1%, and is comparable to YOLOv5n’s 79.2%, demonstrating excellent stability. In the Long Vehicle category, Ours achieves a precision of 77.7%, significantly leading RT-Detr-resnet18’s 60.3%, showcasing higher detection ability in complex scenarios. For the Bus category, Ours achieves a precision of 90.3%, closely approaching YOLOv5s’s 90.8%, and surpassing YOLOv5n’s 88.6%, demonstrating outstanding performance. In aircraft detection, Ours achieves 94.1% precision for the Airliner category, nearly matching YOLOv5s’s 95.7%, while in the Propeller Aircraft category, it reaches a maximum precision of 98.7%, significantly outperforming other algorithms. In the Trainer Aircraft category, Ours achieves 92.2% precision, outperforming most algorithms. For Chartered Aircraft, Ours achieves a precision of 85.7%, surpassing YOLOv11n’s 79.5% and matching YOLOv10n, showing stable performance. In the Fighter Aircraft category, Ours achieves a precision of 80.3%, with a medium-level performance, still surpassing YOLOv11n’s 60.2%. In the Others category, Ours achieves a precision of 78.5%, significantly outperforming YOLOv7-tiny’s 32.3% and RT-Detr-resnet18’s 37.2%, demonstrating excellent capability in handling irregular objects. For Stair Truck and Pushback Truck, Ours achieves precisions of 66.1% and 72.4%, respectively, maintaining solid performance in these specialized categories. In the Helicopter category, Ours achieves a precision of 92.7%, outperforming YOLOv11n’s 75.8%, and in the Boat category, Ours achieves a precision of 97.1%, surpassing all other algorithms, including YOLOv5n’s 96.4%. Overall, Ours demonstrates outstanding performance in the detection of various categories, particularly excelling in key categories such as Cars, Trucks, Long Vehicles, Aircraft, and Boats, surpassing most existing algorithms, proving its strong robustness and high efficiency in complex scenarios.
Table 3 presents a comparison of various algorithms based on Average Precision (AP) across different object categories. The Ours algorithm shows excellent overall performance across all categories, particularly achieving high precision in several key categories. Firstly, in the Car category, Ours achieves an average precision of 94.4%, the highest value, matching YOLOv7-tiny’s 94.4%, and surpassing YOLOv5n’s 93.5%, SSD’s 91.2%, and RT-Detr-resnet18’s 91.1%. In the Truck category, Ours achieves an average precision of 83.1%, significantly outperforming YOLOv5n’s 81.0% and RT-Detr-resnet18’s 74.9%. This performance indicates that Ours maintains high precision and stability in common road vehicle detection tasks. In Van detection, Ours achieves an average precision of 84.5%, comparable to YOLOv7-tiny’s 84.6%, and clearly outperforming YOLOv5n’s 82.1% and RT-Detr-resnet18’s 76.5%. For Long Vehicle detection, Ours achieves an average precision of 86.1%, performing excellently, close to YOLOv5n’s 86.6%, and far surpassing RT-Detr-resnet18’s 74.3%. In the Bus category, Ours achieves a high average precision of 92.9%, close to YOLOv5s’s 94.3%, and surpassing RT-Detr-resnet18’s 84.1%. In aircraft detection, Ours also shows outstanding performance. For Airliner detection, Ours achieves an average precision of 98.3%, higher than RT-Detr-resnet18’s 95.2%. In Propeller Aircraft detection, Ours achieves 98.4%, close to YOLOv5n’s 99.1%, and significantly surpassing RT-Detr-resnet18’s 93.5%. For Trainer Aircraft, Ours achieves 97.0%, just behind YOLOv5s’s 98.2%, and far above RT-Detr-resnet18’s 92.3%. In Chartered Aircraft detection, Ours achieves 95.5%, comparable to YOLOv7-tiny, and significantly higher than RT-Detr-resnet18’s 89.2%. In Fighter Aircraft detection, Ours achieves an average precision of 98.2%, higher than Faster R-CNN’s 97.0%. In more specialized categories, Ours achieves the highest average precision of 40.4% in the Others category, significantly outperforming other algorithms, such as YOLOv5s’s 29.7% and RT-Detr-resnet18’s 25.3%. For Stair Truck detection, Ours achieves an average precision of 43.3%, outperforming Faster R-CNN’s 45.1%. In Pushback Truck detection, Ours achieves 48.9%, significantly outperforming YOLOv5s’s 34.2%. In the Helicopter category, Ours achieves 85.3%, outperforming most algorithms, including RT-Detr-resnet18’s 59.3%. In Boat detection, Ours achieves 98.5%, comparable to YOLOv5n, and surpasses Faster R-CNN’s 91.0%. Overall, Ours demonstrates exceptional average precision in Table 3, especially excelling in Car, Truck, Aircraft, and specialized vehicle detection tasks, outperforming most of the comparative algorithms. This proves its strong robustness and accuracy in multi-category object detection tasks.
5.2. Ablation Study
To evaluate the impact of different modules on the performance of the YOLOv8 model, we designed and conducted an ablation study. We performed experimental comparisons of the YOLOv8 model and its progressively enhanced versions with various modules to analyze their effects on model performance. The experimental results cover metrics such as Precision, Recall, mAP@0.5, Frames Per Second (FPS), computational complexity (GFLOPS), and the number of parameters (Params). By gradually introducing the AFGCAttention mechanism, CARAFE upsampling operator, C2f-DCNV2-MPCA optimization module, and GIoU loss function, we were able to clearly observe the impact of these improvements on both model performance and computational overhead. The experimental results are summarized in Table 4.
Table 4 shows the following results: Initially, the baseline model YOLOv8n exhibits good performance, with a precision of 80.0%, recall of 79.4%, mAP@0.5 of 81.0%, a high FPS of 357.1 frames, computational complexity of 8.1 GFLOPS, and 3.00M parameters. Next, by adding the AFGCAttention mechanism, although precision decreased to 76.1%, recall slightly improved to 79.9%, and mAP@0.5 increased to 82.2%, FPS significantly dropped to 123.4, indicating a substantial decrease in computational speed, while computational complexity remained unchanged and the model parameters slightly increased to 3.07M. After introducing the CARAFE upsampling operator, precision increased to 78.3%, recall slightly decreased to 78.9%, mAP@0.5 remained at 82.2%, FPS rose to 131.5, computational complexity increased to 8.4 GFLOPS, and parameters increased to 3.21M, indicating improved performance, especially in computational speed. Further adding the C2f-DCNV2-MPCA optimization module resulted in a significant increase in precision to 84.0%, but recall dropped to 77.0%, mAP@0.5 slightly rose to 82.7%, FPS slightly decreased to 126.5 frames per second, GFLOPS slightly reduced to 8.3, and parameters increased to 3.24M. This shows that while maintaining high precision, the model sacrificed some computational speed. Finally, after adding the GIoU loss function, precision further increased to 85.0%, but recall decreased to 75.3%, mAP@0.5 slightly improved to 83.0%, and FPS significantly dropped to 111.1 frames per second. GFLOPS and parameters remained unchanged at 8.3 GFLOPS and 3.24M, respectively. Overall, with the gradual addition of modules, the model showed significant improvements in detection accuracy and mAP@0.5, but a decline in computational efficiency (FPS), especially after introducing the AFGCAttention and GIoU modules, where the speed decrease was more pronounced. This indicates that, while improving performance, there is a trade-off between accuracy and computational efficiency.
5.3. Result Visualization
To provide a more intuitive demonstration of the improved YOLOv8 model’s detection performance, this paper uses visualization tools such as heatmaps to analyze the detection results. By comparing the heatmaps of different improvement schemes, it is evident that the model performs more accurately in locating small and dense targets after the introduction of the AFGCAttention attention mechanism module. The application of the AFGCAttention mechanism helps the model better focus on the key areas in the image, thereby improving detection accuracy.
The heatmap examples showcase some typical detection results in complex scenarios. When handling scenes with multiple dense targets, the improved YOLOv8 model demonstrates stronger object recognition capabilities. Specifically, the heatmap clearly shows that the model can accurately locate targets such as trucks, airplanes, and cars, significantly reducing missed and false detections. These visualization results strongly validate the effectiveness of the proposed improvements in this paper and provide important reference for future research and practical applications.
As shown in Figure 9, the heatmap in (a) presents a more concentrated area, primarily focused on the center of the airplane. This indicates that the original model’s attention was more biased toward localized regions, capturing only certain prominent features in the input data while overlooking other valuable information. This localized attention results in limited performance when the model handles complex scenarios. In contrast, the heatmap in (b) displays a more uniform and extensive feature capture range. The introduction of the AFGCAttention mechanism allows the model to focus more comprehensively on different areas of the entire image, thus better balancing local and global information. This broader attention distribution not only improves the model’s ability to capture fine details but also enhances its understanding and processing of complex scenes, further improving the model’s accuracy and generalization capability.
The following figure shows the performance of RT-Dert-resnet18, YOLOv5s, YOLOv5n, YOLOv7-tiny, YOLOv8n, YOLOv10n, YOLOv11n, and the proposed improved algorithm (Ours) in the remote sensing image object detection task. Through these comparison charts, the performance differences between the various algorithms, particularly in handling complex backgrounds and small target scenarios, become more apparent.
Figure 10 shows a comparison of the performance of different algorithms in remote sensing image object detection, particularly in terms of the number and coverage of detection boxes. The algorithm labeled “Ours,” marked with yellow boxes, demonstrates outstanding performance in handling small target detection tasks. The RT-Dert-resnet18 algorithm accurately detects the location of objects but still suffers from missed detection of small targets. Additionally, it has a high computational overhead and slow convergence speed. For YOLOv5s and YOLOv5n, they maintain relatively high detection speeds while preserving a certain level of detection accuracy. As shown in the figure, these two algorithms perform reasonably well when detecting multiple targets in the image, correctly identifying objects such as cars, trucks, and vans. However, in some complex backgrounds, YOLOv5 may experience missed or false detections. For example, in dense target scenarios, the detection of small targets is not ideal. The YOLOv7-tiny algorithm performs relatively poorly, especially in handling complex scenes and detecting dense small targets. Although it has a fast detection speed, making it suitable for real-time applications, its accuracy and target recognition ability are noticeably lacking. Compared to other YOLO versions, YOLOv7-tiny performs relatively poorly overall. YOLOv8n is the lightweight version of the YOLOv8 series, characterized by its efficiency and fast speed, making it suitable for resource-limited environments. Despite the compactness of the YOLOv8n model and its lower computational resource requirements, it still shows some shortcomings in detecting small targets and handling complex scenes with dense targets. Overall, its performance is somewhat limited. For the YOLOv10n algorithm, despite its lightweight optimization, which makes it suitable for resource-constrained scenarios, its performance in complex backgrounds and small target detection is subpar. Compared to YOLOv8n, YOLOv10n shows further degradation in accuracy and stability, often resulting in missed or false detections, especially in the case of dense small targets. The YOLOv11n algorithm, while still a lightweight model, performs better than YOLOv10n. YOLOv11n shows more stable performance in detecting complex backgrounds and small targets, with improved accuracy, especially in reducing missed detections in dense scenes. The “Ours” algorithm performs the best in small target detection tasks among all the algorithms, particularly excelling in the number and coverage of detection boxes. It can accurately identify targets, especially demonstrating exceptional detection accuracy in dense small target scenarios, significantly reducing missed detections and showcasing strong robustness and stability.
Figure 11 show the Precision-Recall (P-R) curves of the YOLOv8n algorithm and the improved YOLOv8n algorithm, respectively, under different categories. These curves visually present the performance comparison of the two algorithms in various object detection tasks. Figure 11a demonstrates the performance of YOLOv8n, while Figure 11b illustrates the improvement in precision achieved by the improved YOLOv8n algorithm. These charts provide a clear perspective for comparing the detection accuracy before and after optimization, helping to further validate the effectiveness and advantages of the improved algorithm.
Figure 11 shows that in specific categories, the improved algorithm’s AP for the Car category increased from 0.932 to 0.944, demonstrating a significant improvement in detection for this category. Similarly, in the Van category, the AP increased from 0.826 to 0.845, further enhancing the classification performance for this category. In the Long Vehicle category, the AP improved from 0.856 to 0.861. Although the increase is small, the model’s performance has become more stable.
In the detection of complex categories, the improved algorithm also shows significant performance improvements across multiple categories. For example, the AP for the Pushback Truck category increased from 0.438 to 0.489, indicating a significant enhancement in the model’s detection ability for this category. Similarly, in the Stair Truck category, the AP increased from 0.407 to 0.433, demonstrating better classification accuracy. The AP for the Helicopter category improved from 0.779 to 0.853, significantly improving the detection of complex objects.
Additionally, in the Airliner category, the improved algorithm maintained stable performance, with the AP increasing from 0.982 to 0.983. In the Boat category, the AP further increased from 0.981 to 0.985, demonstrating extremely high precision. For the Chartered Aircraft category, the AP improved from 0.934 to 0.955, showing a significant enhancement in object detection for this category. In the Trainer Aircraft category, the AP increased from 0.964 to 0.970, indicating an improvement in detection accuracy for this category as well.
Overall, the improved algorithm’s mAP@0.5 increased from 0.810 to 0.830, demonstrating an overall improvement in detection performance. These charts clearly compare the performance differences between the original algorithm and the improved algorithm across different object detection tasks, proving the effectiveness of the improved algorithm, especially in the significant enhancement of both common and complex categories.
Figure 12 show the Precision-Confidence curves of the YOLOv8n algorithm and the improved YOLOv8n algorithm, respectively, for performance comparison and analysis.
Figure 12 shows that the blue thick line represents the average performance across all categories. YOLOv8n achieves a precision of 1.00 at a confidence level of 0.99, while the improved algorithm reaches the same precision at a confidence level of 0.96. From the shape of the curves, most categories (such as Car, Truck, Bus, Airliner, etc.) show a gradual increase in precision as the confidence level rises, reaching close to 1.0 in the high-confidence range. However, certain categories (such as Pushback Truck) exhibit noticeably lower detection precision, especially in YOLOv8n, where the precision is lower and fluctuates significantly at medium confidence levels.
In Figure 12b, the improved algorithm shows improved performance in some categories (such as Pushback Truck), with the curve becoming steeper. This indicates that the improved algorithm has reduced instability in detection, especially in the medium-confidence range.
Overall, the improved YOLOv8n algorithm demonstrates more stable performance across most categories and achieves precision comparable to the standard algorithm at lower confidence levels, highlighting the effectiveness of the optimization. However, it is worth noting that, despite the improvements, the precision for the Long Vehicle category has not significantly increased, indicating that this category still presents challenges in detection. In summary, the improved algorithm has made breakthroughs in reducing detection fluctuations and enhancing the detection precision for certain categories, but there are still a few difficult-to-detect categories that require further optimization.
6. Discussion
6.1. Result Analysis
In this study, through further improvements to the YOLOv8 model, we achieved significant performance gains across multiple experimental metrics. First, the improved model showed particularly strong performance in the mAP@0.5-0.95 metric, thanks to the introduction and optimization of a series of advanced modules. Below are the key modules involved in the improved model and their contributions to performance enhancement:
First, the introduction of the AFGCAttention module significantly enhanced the model’s ability to capture important features. This module adjusts the inter-channel weights adaptively, enabling the model to focus more precisely on features relevant to the object detection task. This mechanism helps reduce the interference of redundant features and improves detection accuracy, especially in complex scenes where there are significant feature differences between objects. The AFGCAttention module performs particularly well in such cases.
Next, the CARAFE upsampling operator optimized the model’s feature reconstruction ability through efficient upsampling operations. Traditional upsampling methods often lose some details when reconstructing feature maps, while CARAFE uses dynamic convolution to more accurately restore detailed information in the feature map. This is particularly effective when handling high-resolution images and dense objects. The introduction of this module enhanced the model’s performance in detecting small targets and objects with blurred boundaries, significantly improving small object detection accuracy.
Additionally, the C2f-DCNV2-MPCA optimization module further improved the model’s convolution operations. Compared to traditional convolutions, this module introduces the Dynamic Deformable Convolutional Network V2 (DCNV2), allowing the model to be more flexible in capturing changes in target shape and positional shifts. The C2f structure reduces redundancy in inter-layer connections, enhancing feature transmission efficiency, while the dynamic nature of DCNV2 enables the model to adjust the receptive field adaptively when processing targets of different shapes and sizes. This significantly enhances the robustness of object detection. Building upon C2f-DCNV2, the MPCA (Multi-Path Channel Attention) module uses parallel multi-path processing to flexibly allocate channel attention, effectively capturing subtle feature differences and improving detection accuracy in complex scenes. These combined optimizations provide the model with stronger adaptability and robustness in challenging scenarios.
Lastly, the application of the GIoU loss function was also a key factor in the model’s performance improvement. Compared to the traditional IoU loss function, GIoU provides richer gradient information, especially when bounding box overlap is small. GIoU offers more precise regression guidance, reducing the occurrence of false positives and false negatives in detecting objects with blurred boundaries or overlapping targets. This improvement is particularly suitable for object-dense remote sensing images.
In summary, by introducing the AFGCAttention attention mechanism, CARAFE upsampling operator, C2f-DCNV2-MPCA optimization module, and combining the GIoU loss function, we effectively optimized several key aspects of the YOLOv8 model, including feature extraction, feature reconstruction, and bounding box regression. These improvements significantly enhanced the model’s detection ability in complex scenarios, particularly in small object detection and multi-object recognition tasks.
6.2. Comparison and Improvement
The improved model presented in this paper shows significant advantages across multiple key metrics. First, compared to YOLOv8n, the model introduced in this study, referred to as “Ours,” achieves better performance in metrics such as mAP and Recall. This improvement is primarily attributed to the AFGCAttention attention mechanism, the CARAFE upsampling operator, the C2f-DCNV2-MPCA optimization module, and the GIoU loss function in the network structure. The AFGCAttention mechanism enhances feature focus by adaptively adjusting channel weights, enabling the model to detect targets more accurately in complex backgrounds. The CARAFE upsampling operator, with its more precise feature upsampling, improves small object detection accuracy. With these optimizations, “Ours” surpasses YOLOv8n in detection accuracy, particularly in complex scenes and small object detection tasks.
Although “Ours” shows significant improvements in accuracy, its speed performance is slightly weaker compared to some lightweight object detection models like YOLOv5s. Lightweight models, due to their simplified network structures, have a clear advantage in computation speed, making them suitable for real-time applications. In contrast, “Ours” uses more complex network structures, such as the C2f-DCNV2-MPCA optimization module, whose dynamic convolution mechanism excels in handling target position shifts and shape variations but also increases the model’s computational overhead. Therefore, in resource-constrained or high real-time-demand applications, a trade-off between accuracy and speed is still necessary.
Compared to traditional object detection methods like SSD and Faster R-CNN, “Ours” shows significant improvements in both accuracy and speed. SSD and Faster R-CNN often underperform in complex backgrounds and multi-object detection tasks due to their relatively weaker feature extraction capabilities. By introducing the GIoU loss function, “Ours” further optimizes bounding box regression, making the model more robust in scenes with low bounding box overlap or dense objects. Additionally, the application of the C2f-DCNV2-MPCA optimization module enhances the model’s ability to adapt to variations in target shape and size, greatly improving its performance in these tasks.
Although the improved model presented in this paper performs excellently in most scenarios, there are still challenges when detecting extremely small or highly overlapping targets. While the CARAFE upsampling operator and AFGCAttention attention mechanism have already brought noticeable improvements in small object detection, the model still has room for further optimization in terms of precision when handling dense or overlapping targets. This suggests that future research could explore deeper network architecture designs or introduce more advanced data augmentation techniques to enhance the model’s adaptability in these specific scenarios.
In summary, the proposed improvements in this paper show outstanding performance across multiple key metrics, particularly in complex backgrounds and multi-object detection tasks. However, with the increasing complexity of the model structure, how to improve computational efficiency without compromising accuracy will be a key challenge for future research. By optimizing the utilization of computational resources and improving the model’s practicality, it can better meet the demands of a wide range of application scenarios.
7. Conclusions
This paper aims to improve the performance of the YOLOv8 model in remote sensing image object detection tasks, primarily by introducing techniques such as the CARAFE upsampling operator, the C2f-DCNv2-MPCA optimization module, and the AFGCAttention attention mechanism. These innovations enhance the model’s ability to detect small objects, complex backgrounds, and multi-scale targets. Additionally, the GIoU loss function is used to optimize the model’s bounding box localization accuracy. An improved YOLOv8 model is proposed and thoroughly validated through experiments. The main conclusions of this study are as follows:
First, to address the YOLOv8 model’s limitations in small object detection, the CARAFE upsampling operator is introduced. This module leverages content-aware feature reorganization techniques, significantly improving the feature representation of small objects and solving the issue where traditional convolution operations tend to lose small object information. By integrating the CARAFE upsampling operator, the improved YOLOv8 model better preserves small object feature information, thereby enhancing detection accuracy.
Second, to improve the model’s ability to detect multi-scale objects, the C2f-DCNv2-MPCA optimization module is employed. This module uses dynamic convolution technology to dynamically adjust the size and shape of the convolutional kernels based on the input features, thereby capturing more detailed information of objects at different scales. Experimental results show that the C2f-DCNv2-MPCA optimization module effectively enhances the model’s multi-scale feature extraction capability, enabling it to better handle scale variation in remote sensing images.
Moreover, to address the interference caused by complex backgrounds in remote sensing images, the AFGCAttention attention mechanism is introduced. This mechanism adaptively weights feature channels and spatial dimensions, effectively increasing the model’s focus on target regions while suppressing background noise. Experimental results show that the AFGCAttention mechanism significantly improves the accuracy and effectiveness of feature extraction.
Finally, the GIoU loss function is applied to optimize the localization accuracy of the bounding boxes. Compared to the traditional IoU loss function, the GIoU loss function provides more precise gradient information when the overlap between the target box and the predicted box is small, significantly improving the bounding box localization accuracy, especially in high-resolution remote sensing images.
Overall, the improved YOLOv8 algorithm proposed in this paper has achieved significant enhancements in remote sensing image object detection, particularly excelling in complex backgrounds and small object detection. This research not only provides a fresh perspective for optimizing the YOLO model but also lays a solid technical foundation for the practical application of remote sensing image object detection. Future research can further explore more efficient network designs and optimization schemes to improve detection accuracy and inference efficiency, better meeting the higher demands for real-time performance and accuracy in practical applications.
Data Availability Statement
The datasets can be downloaded in https://github.com/ihians/simd.
References
- Ennouri, Karim, Slim Smaoui, and Mohamed Ali Triki. “Detection of urban and environmental changes via re0mote sensing.” Circular Economy and Sustainability 1.4 (2021): 1423-1437.
- Koukiou, Georgia. “SAR Features and Techniques for Urban Planning—A Review.” Remote Sensing 16.11 (2024): 1923.
- Mohan, M., et al. “Remote Sensing-Based Ecosystem Monitoring and Disaster Management in Urban Environments Using Machine Learnings.” Remote Sensing in Earth Systems Sciences (2024): 1-9.
- Lin, Chungan, and Ramakant Nevatia. “Building detection and description from a single intensity image.” Computer vision and image understanding 72.2 (1998): 101-121.
- Kim, Taejung, et al. “Tracking road centerlines from high resolution remote sensing images by least squares correlation matching.” Photogrammetric Engineering & Remote Sensing 70.12 (2004): 1417-1422.
- Low, David G. “Distinctive image features from scale-invariant keypoints.” Journal of Computer Vision 60.2 (2004): 91-110.
- Ok, Ali Ozgun. “Automated detection of buildings from single VHR multispectral images using shadow information and graph cuts.” ISPRS journal of photogrammetry and remote sensing 86 (2013): 21-40.
- Girshick, Ross, et al. “Rich feature hierarchies for accurate object detection and semantic segmentation.” Proceedings of the IEEE conference on computer vision and pattern recognition. 2014.
- Girshick, R. Fast r-cnn. arXiv preprint 2015, arXiv:1504.08083. [Google Scholar]
- Ren, Shaoqing, et al. “Faster R-CNN: Towards real-time object detection with region proposal networks.” IEEE transactions on pattern analysis and machine intelligence 39.6 (2016): 1137-1149.
- Liu, Wei, et al. “Ssd: Single shot multibox detector.” Computer Vision–ECCV 2016: 14th European Conference, Amsterdam, The Netherlands, October 11–14, 2016, Proceedings, Part I 14. Springer International Publishing, 2016.
- Redmon, J. “You only look once: Unified, real-time object detection.” Proceedings of the IEEE conference on computer vision and pattern recognition. 2016.
- Redmon, Joseph, and Ali Farhadi. “YOLO9000: better, faster, stronger.” Proceedings of the IEEE conference on computer vision and pattern recognition. 2017.
- Redmon, Joseph. “Yolov3: An incremental improvement.”. arXiv preprint 2018, arXiv:1804.02767.
- Bochkovskiy, Alexey, Chien-Yao Wang, and Hong-Yuan Mark Liao. “Yolov4: Optimal speed and accuracy of object detection. arXiv preprint 2020, arXiv:2004.10934.
- Jocher, Glenn, et al. “ultralytics/yolov5: v6. 2-yolov5 classification models, apple m1, reproducibility, clearml and deci. ai integrations.” Zenodo (2022).
- Li, Chuyi, et al. “YOLOv6: A single-stage object detection framework for industrial applications.”. arXiv preprint 2022, arXiv:2209.02976.
- Wang, Chien-Yao, Alexey Bochkovskiy, and Hong-Yuan Mark Liao. “YOLOv7: Trainable bag-of-freebies sets new state-of-the-art for real-time object detectors.” Proceedings of the IEEE/CVF conference on computer vision and pattern recognition. 2023.
- Sohan, Mupparaju, et al. “A review on yolov8 and its advancements.” International Conference on Data Intelligence and Cognitive Informatics. Springer, Singapore, 2024.
- Wang, Chien-Yao, I-Hau Yeh, and Hong-Yuan Mark Liao. “Yolov9: Learning what you want to learn using programmable gradient information.”. arXiv preprint 2024, arXiv:2402.13616.
- Wang, Ao, et al. “Yolov10: Real-time end-to-end object detection.”. arXiv preprint 2024, arXiv:2405.14458.
- Khanam, Rahima, and Muhammad Hussain. “YOLOv11: An Overview of the Key Architectural Enhancements.”. arXiv preprint 2024, arXiv:2410.17725.
- Liu, Rui, et al. “An improved faster-RCNN algorithm for object detection in remote sensing images.” 2020 39th Chinese Control Conference (CCC). IEEE, 2020.
- Wang, Anrui, et al. “CDE-DETR: A Real-Time End-To-End High-Resolution Remote Sensing Object Detection Method Based on RT-DETR.” IGARSS 2024-2024 IEEE International Geoscience and Remote Sensing Symposium. IEEE, 2024.
- Bochkovskiy, Alexey, Chien-Yao Wang, and Hong-Yuan Mark Liao. “Yolov4: Optimal speed and accuracy of object detection.”. arXiv preprint 2020, arXiv:2004.10934.
- Patil, Shefali, Sangita Chaudhari, and Puja Padiya. “Small Object Detection in Remote Sensing Images using Modified YOLOv5.” 2023 1st DMIHER International Conference on Artificial Intelligence in Education and Industry 4.0 (IDICAIEI). Vol. 1. IEEE, 2023.
- Qi, Guanqiu, et al. “Small object detection method based on adaptive spatial parallel convolution and fast multi-scale fusion.” Remote Sensing 14.2 (2022): 420.
- Zhao, Xiaolei, et al. “Multiscale object detection in high-resolution remote sensing images via rotation invariant deep features driven by channel attention.” International Journal of Remote Sensing 42.15 (2021): 5764-5783.
- Duan, Jian, Xi Zhang, and Tielin Shi. “A hybrid attention-based paralleled deep learning model for tool wear prediction.” Expert Systems with Applications 211 (2023): 118548.
- Zhang, Jiarui, et al. “Faster and Lightweight: An Improved YOLOv5 Object Detector for Remote Sensing Images.” Remote Sensing 15.20 (2023): 4974.
- Ma, Mingyang, and Huanli Pang. “SP-YOLOv8s: An improved YOLOv8s model for remote sensing image tiny object detection.” Applied Sciences 13.14 (2023): 8161.
- Zhang, Cong, et al. “Efficient inductive vision transformer for oriented object detection in remote sensing imagery.” IEEE Transactions on Geoscience and Remote Sensing (2023).
- Wang, Di, et al. “Advancing plain vision transformer toward remote sensing foundation model.” IEEE Transactions on Geoscience and Remote Sensing 61 (2022): 1-15.
- Xu, Kejie, Peifang Deng, and Hong Huang. “Vision transformer: An excellent teacher for guiding small networks in remote sensing image scene classification.” IEEE Transactions on Geoscience and Remote Sensing 60 (2022): 1-15.
- Peng, Lintao, et al. “Image-free single-pixel object detection.” Optics Letters 48.10 (2023): 2527-2530.
- Azad, Reza, et al. “Advances in medical image analysis with vision transformers: a comprehensive review.” Medical Image Analysis 91 (2024): 103000.
- Wang, Qilong, et al. “ECA-Net: Efficient channel attention for deep convolutional neural networks.” Proceedings of the IEEE/CVF conference on computer vision and pattern recognition. 2020.
- Dosovitskiy, Alexey. “An image is worth 16x16 words: Transformers for image recognition at scale.”. arXiv preprint 2020, arXiv:2010.11929.
- Liu, Ze, et al. “Swin transformer: Hierarchical vision transformer using shifted windows.” Proceedings of the IEEE/CVF international conference on computer vision. 2021.
- Carion, Nicolas, et al. “End-to-end object detection with transformers.” European conference on computer vision. Cham: Springer International Publishing, 2020.
- Woo, Sanghyun, et al. “Cbam: Convolutional block attention module.” Proceedings of the European conference on computer vision (ECCV). 2018.
- Varghese, Rejin, and M. Sambath. “YOLOv8: A Novel Object Detection Algorithm with Enhanced Performance and Robustness.” 2024 International Conference on Advances in Data Engineering and Intelligent Computing Systems (ADICS). IEEE, 2024.
- Zhu, Xizhou, et al. “Deformable convnets v2: More deformable, better results.” Proceedings of the IEEE/CVF conference on computer vision and pattern recognition. 2019.
- Sun, Hang, et al. “Unsupervised Bidirectional Contrastive Reconstruction and Adaptive Fine-Grained Channel Attention Networks for image dehazing.” Neural Networks 176 (2024): 106314.
- Wang, Jiaqi, et al. “Carafe: Content-aware reassembly of features.” Proceedings of the IEEE/CVF international conference on computer vision. 2019.
- Rezatofighi, Hamid, et al. “Generalized intersection over union: A metric and a loss for bounding box regression.” Proceedings of the IEEE/CVF conference on computer vision and pattern recognition. 2019.
- Haroon, Muhammad, Muhammad Shahzad, and Muhammad Moazam Fraz. “Multisized object detection using spaceborne optical imagery.” IEEE Journal of Selected Topics in Applied Earth Observations and Remote Sensing 13 (2020): 3032-3046.
- Kou, Renke, et al. “Infrared small target segmentation networks: A survey.” Pattern Recognition 143 (2023): 109788.
Figure 1.
Improved YOLOv8 Network Architecture Diagram.
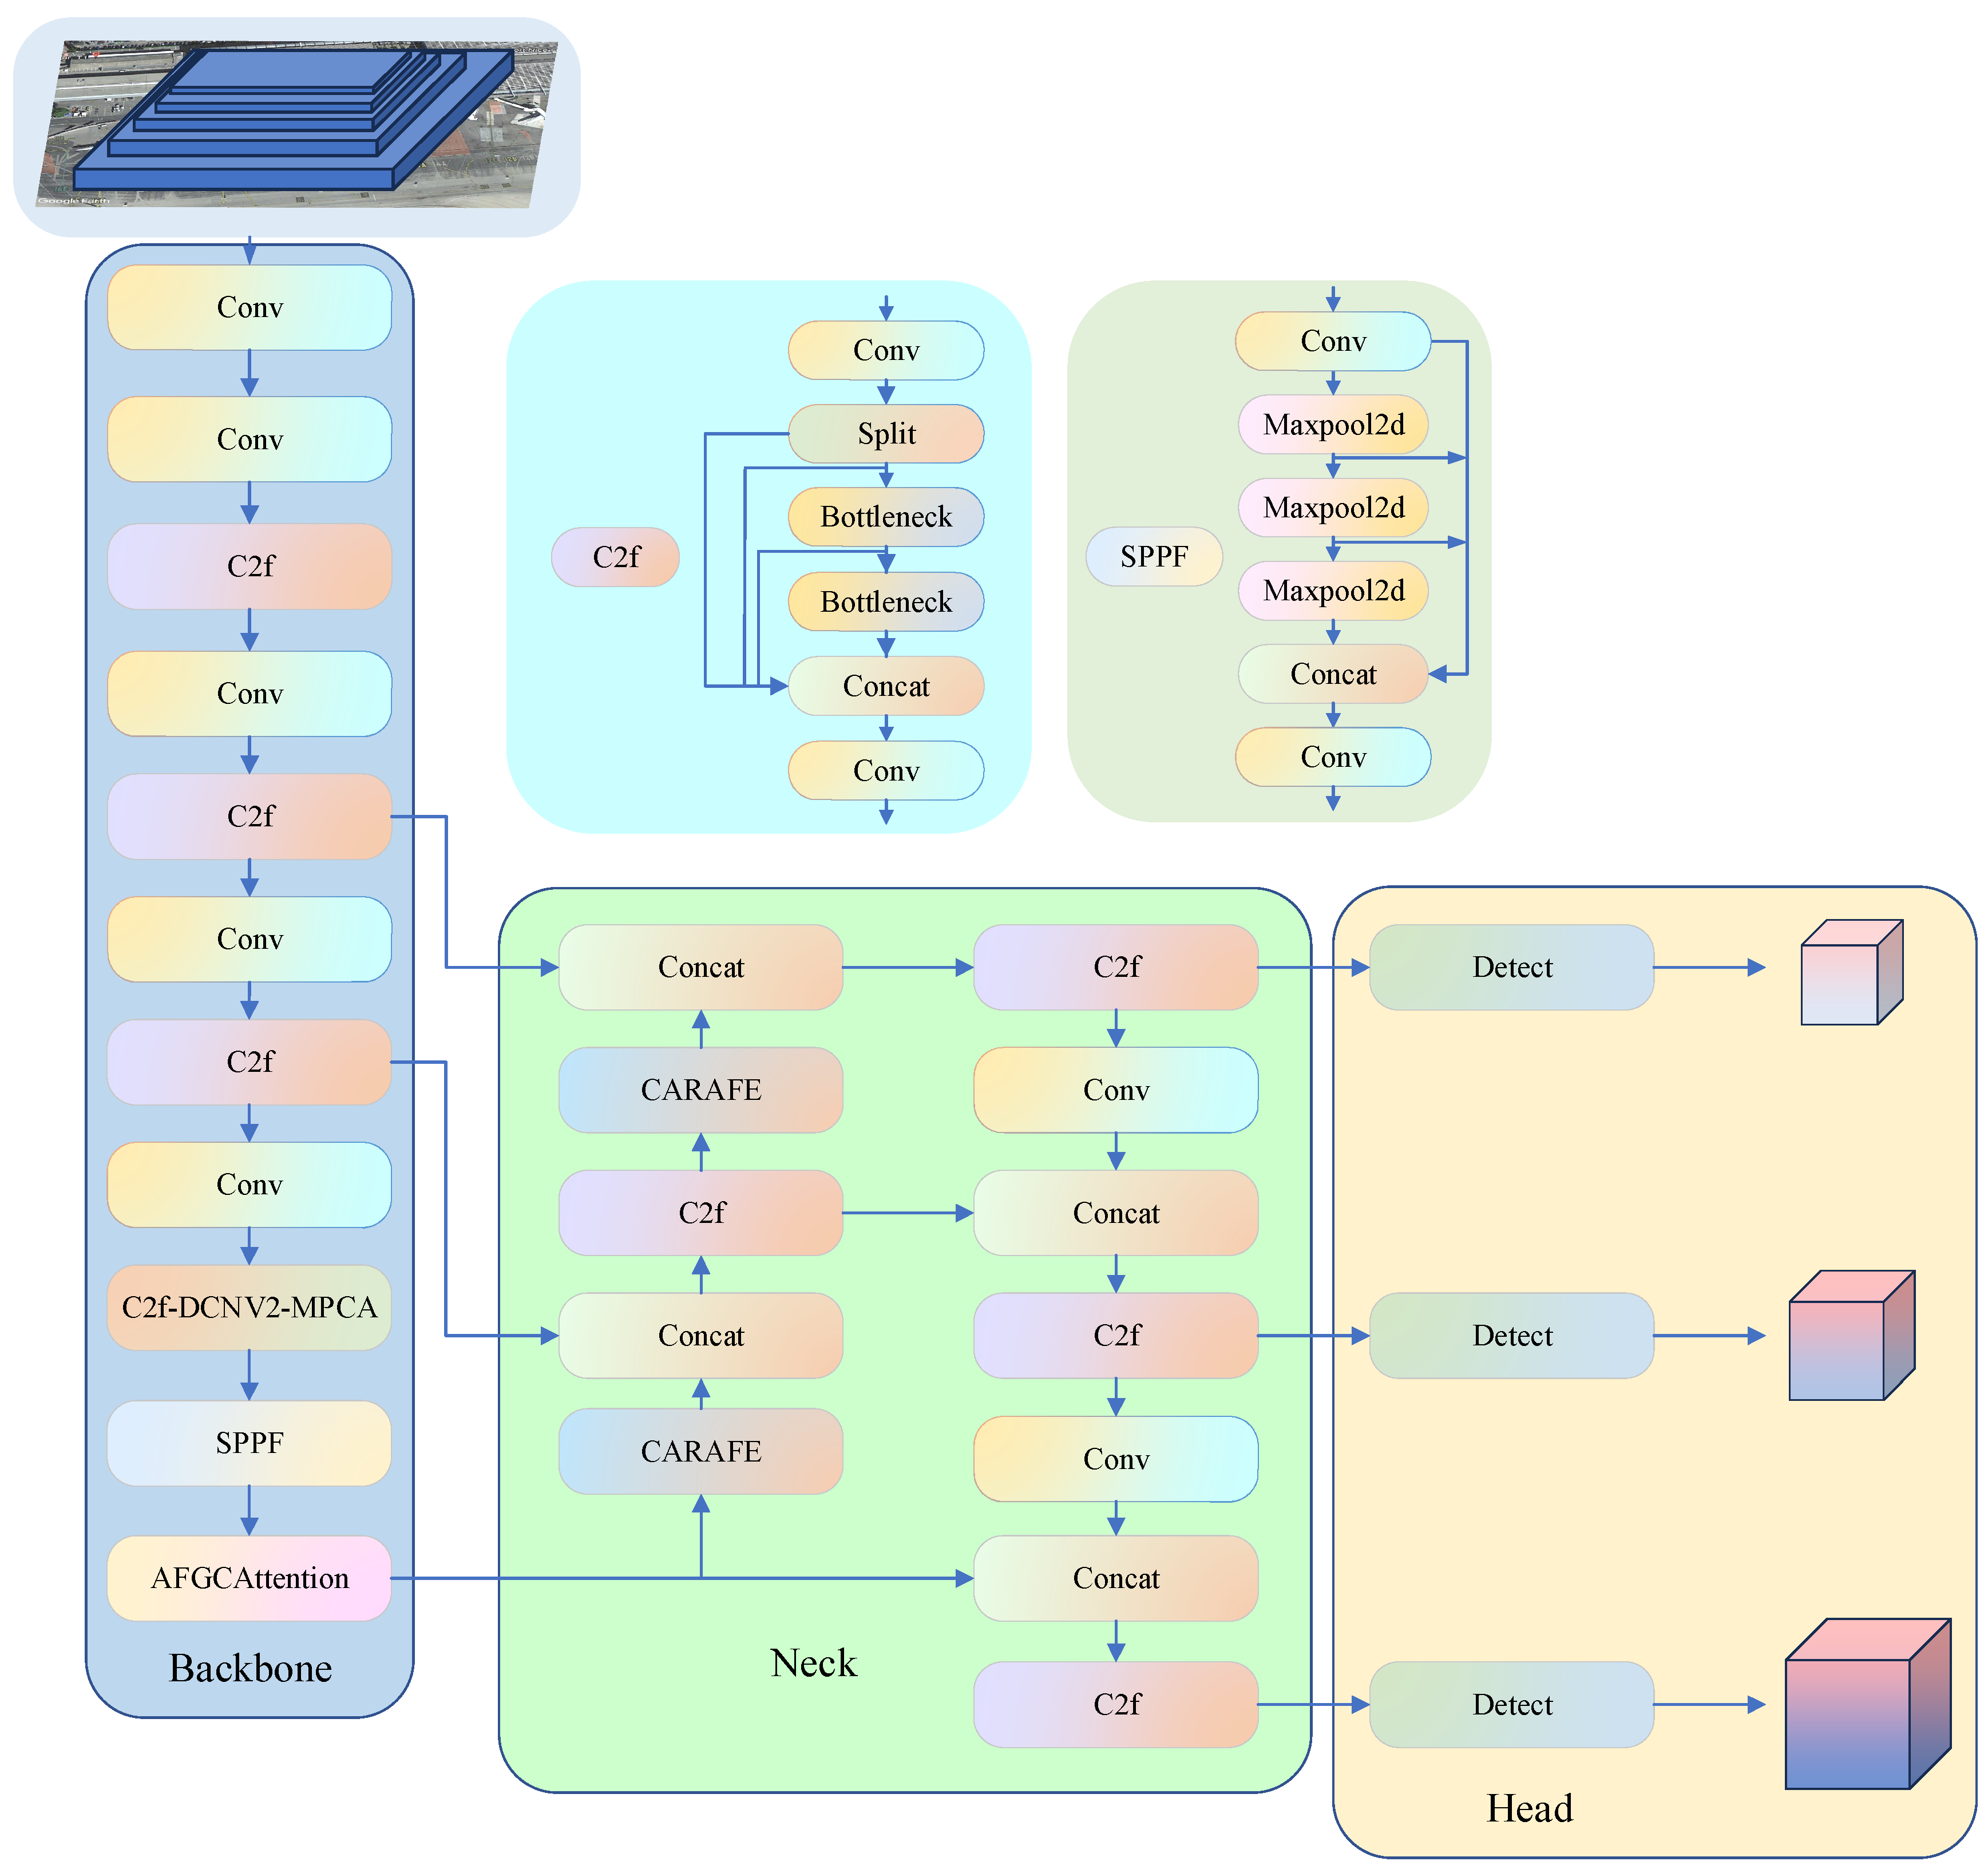
Figure 2.
C2f-DCNv2-MPCA Optimization Module.
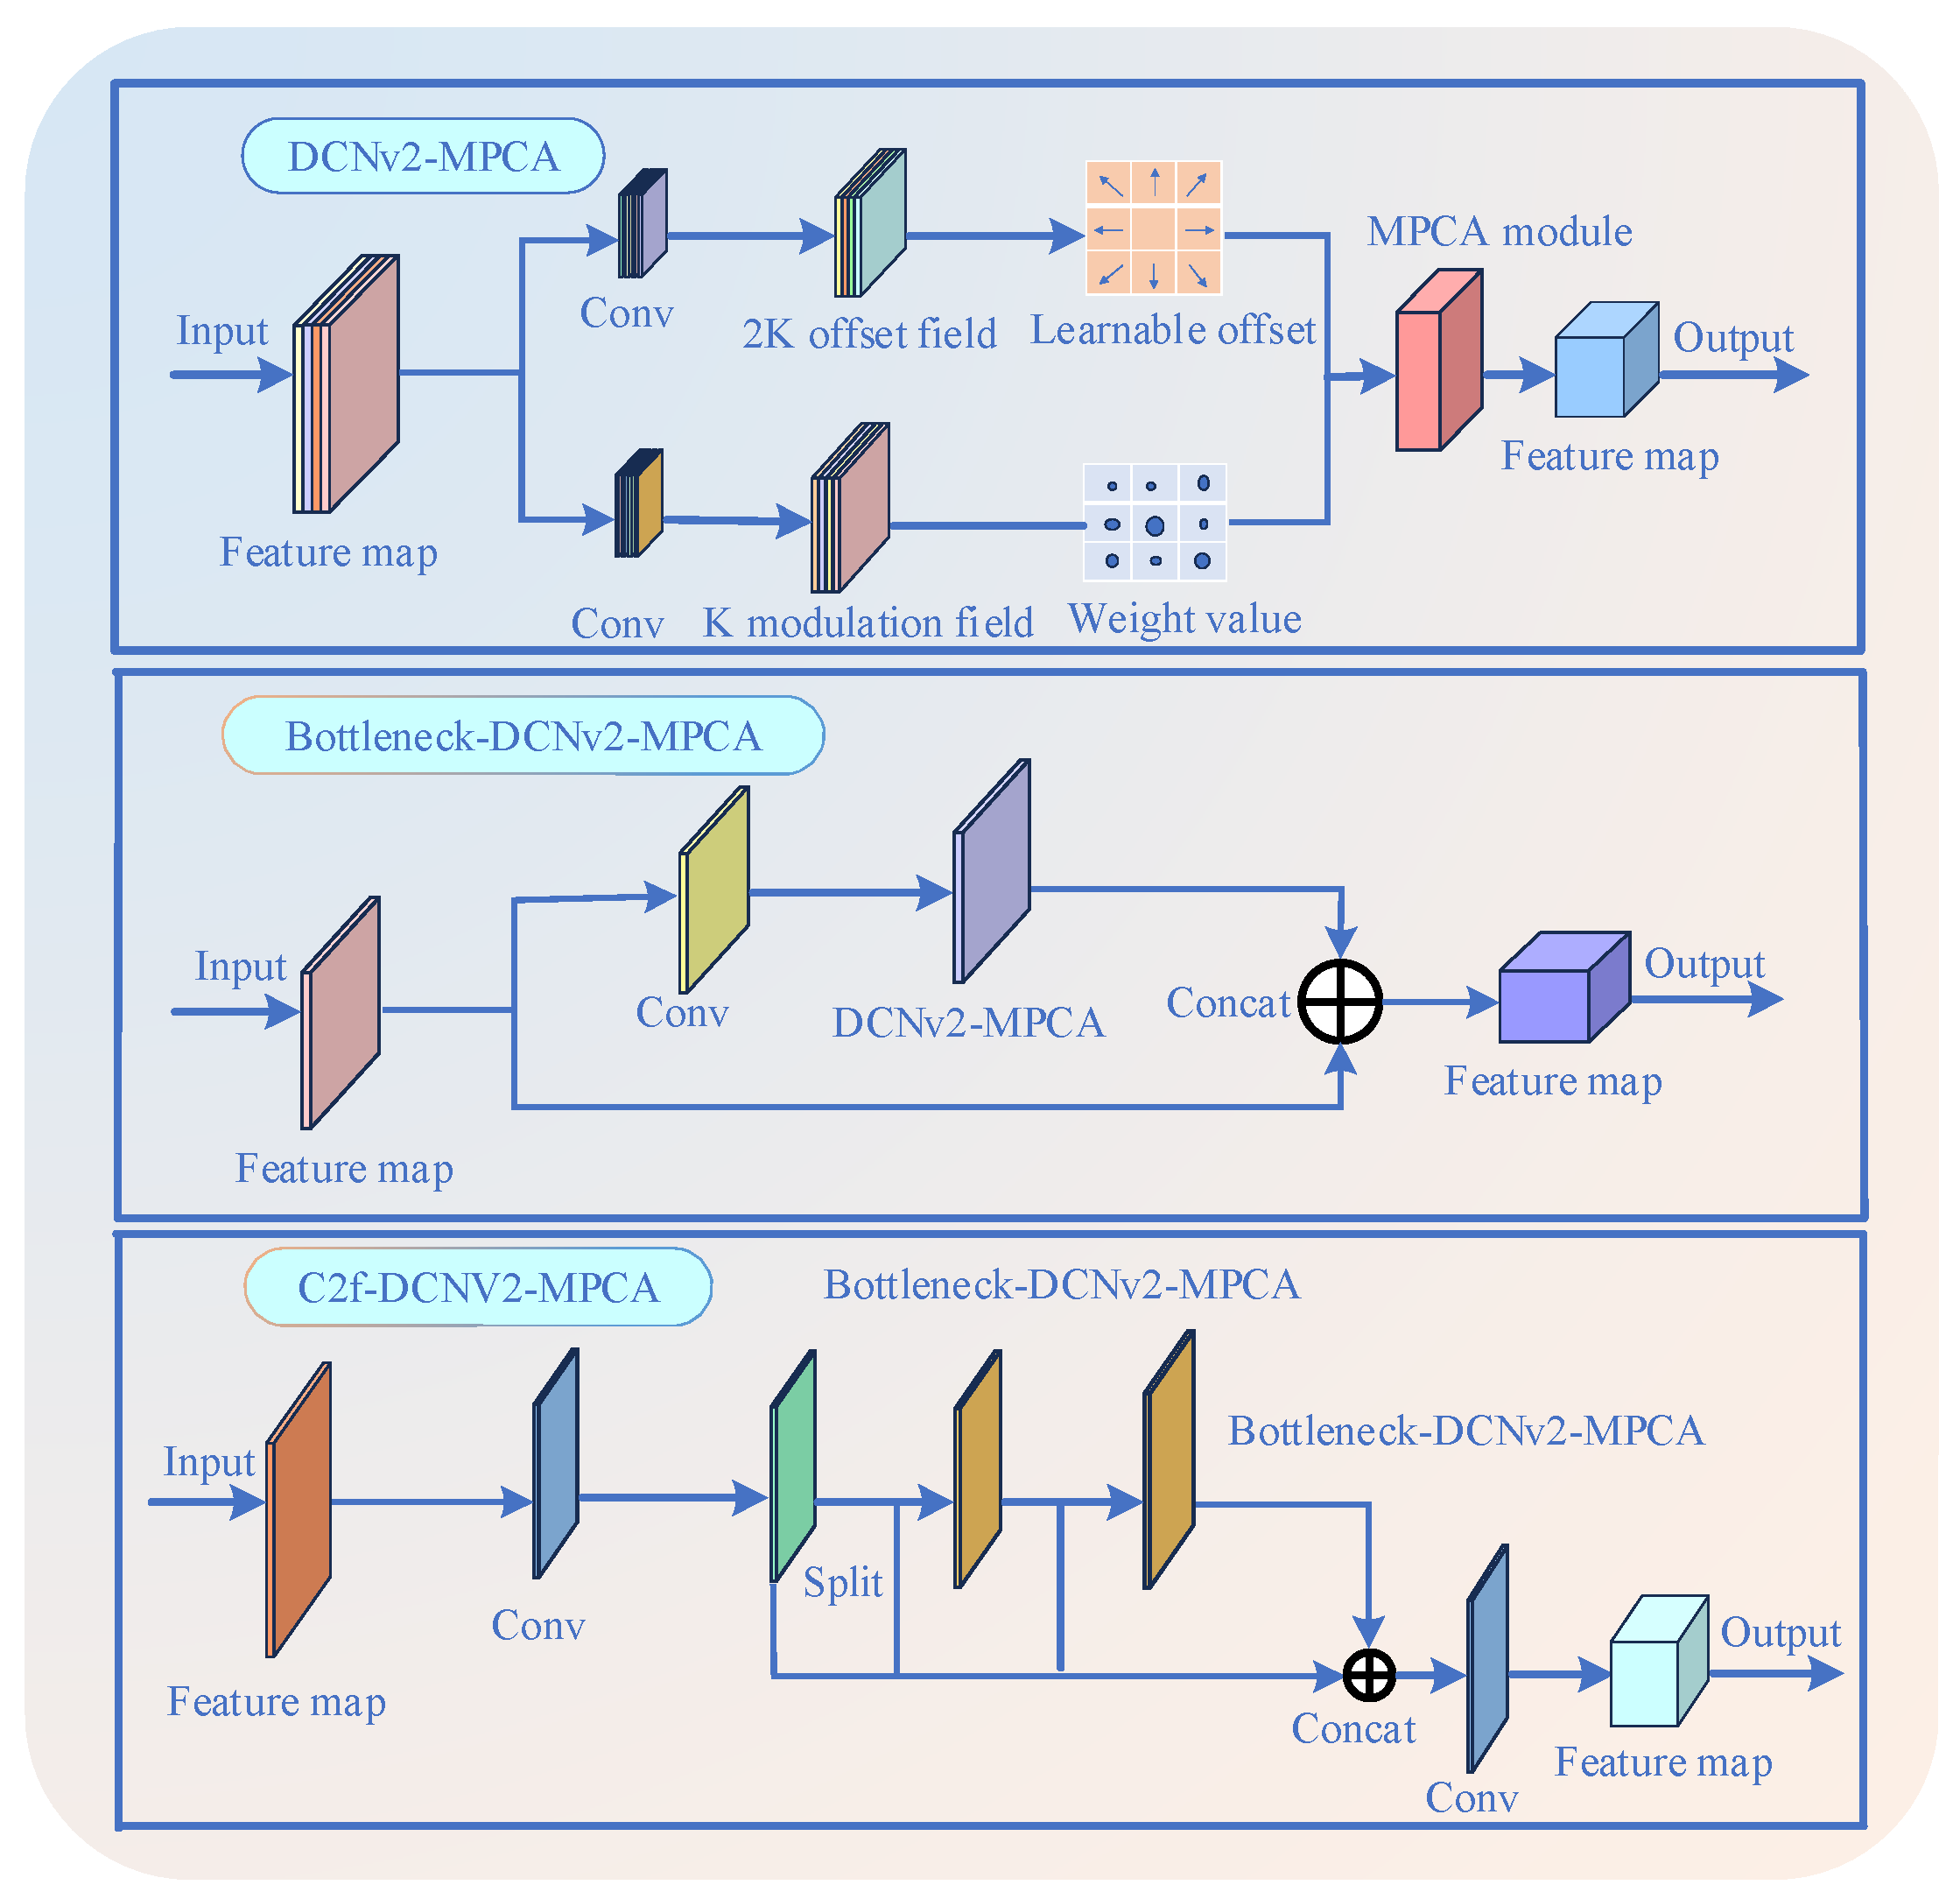
Figure 3.
AFGCAttention Module.
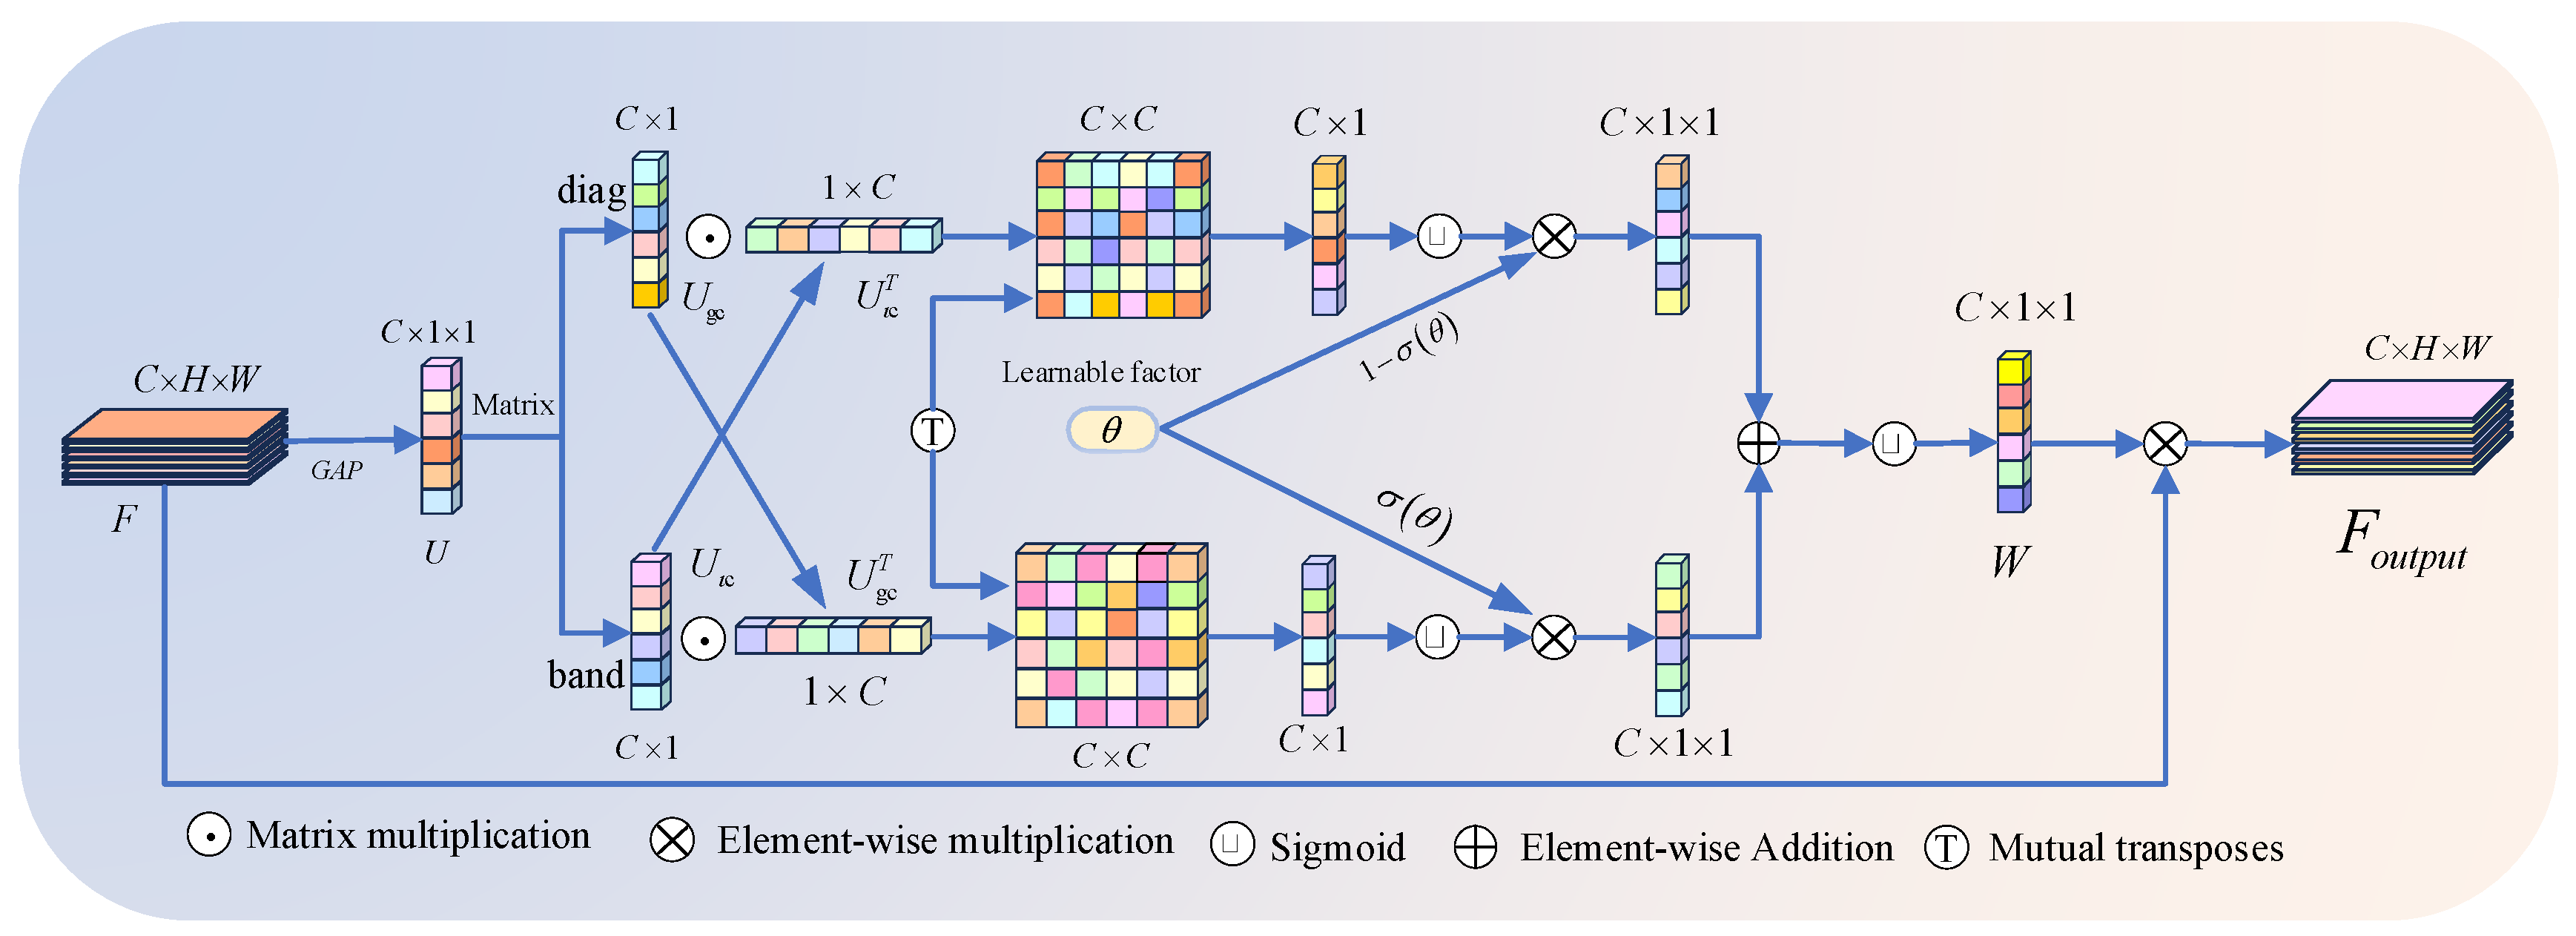
Figure 4.
CARAFE Upsampling Operator.
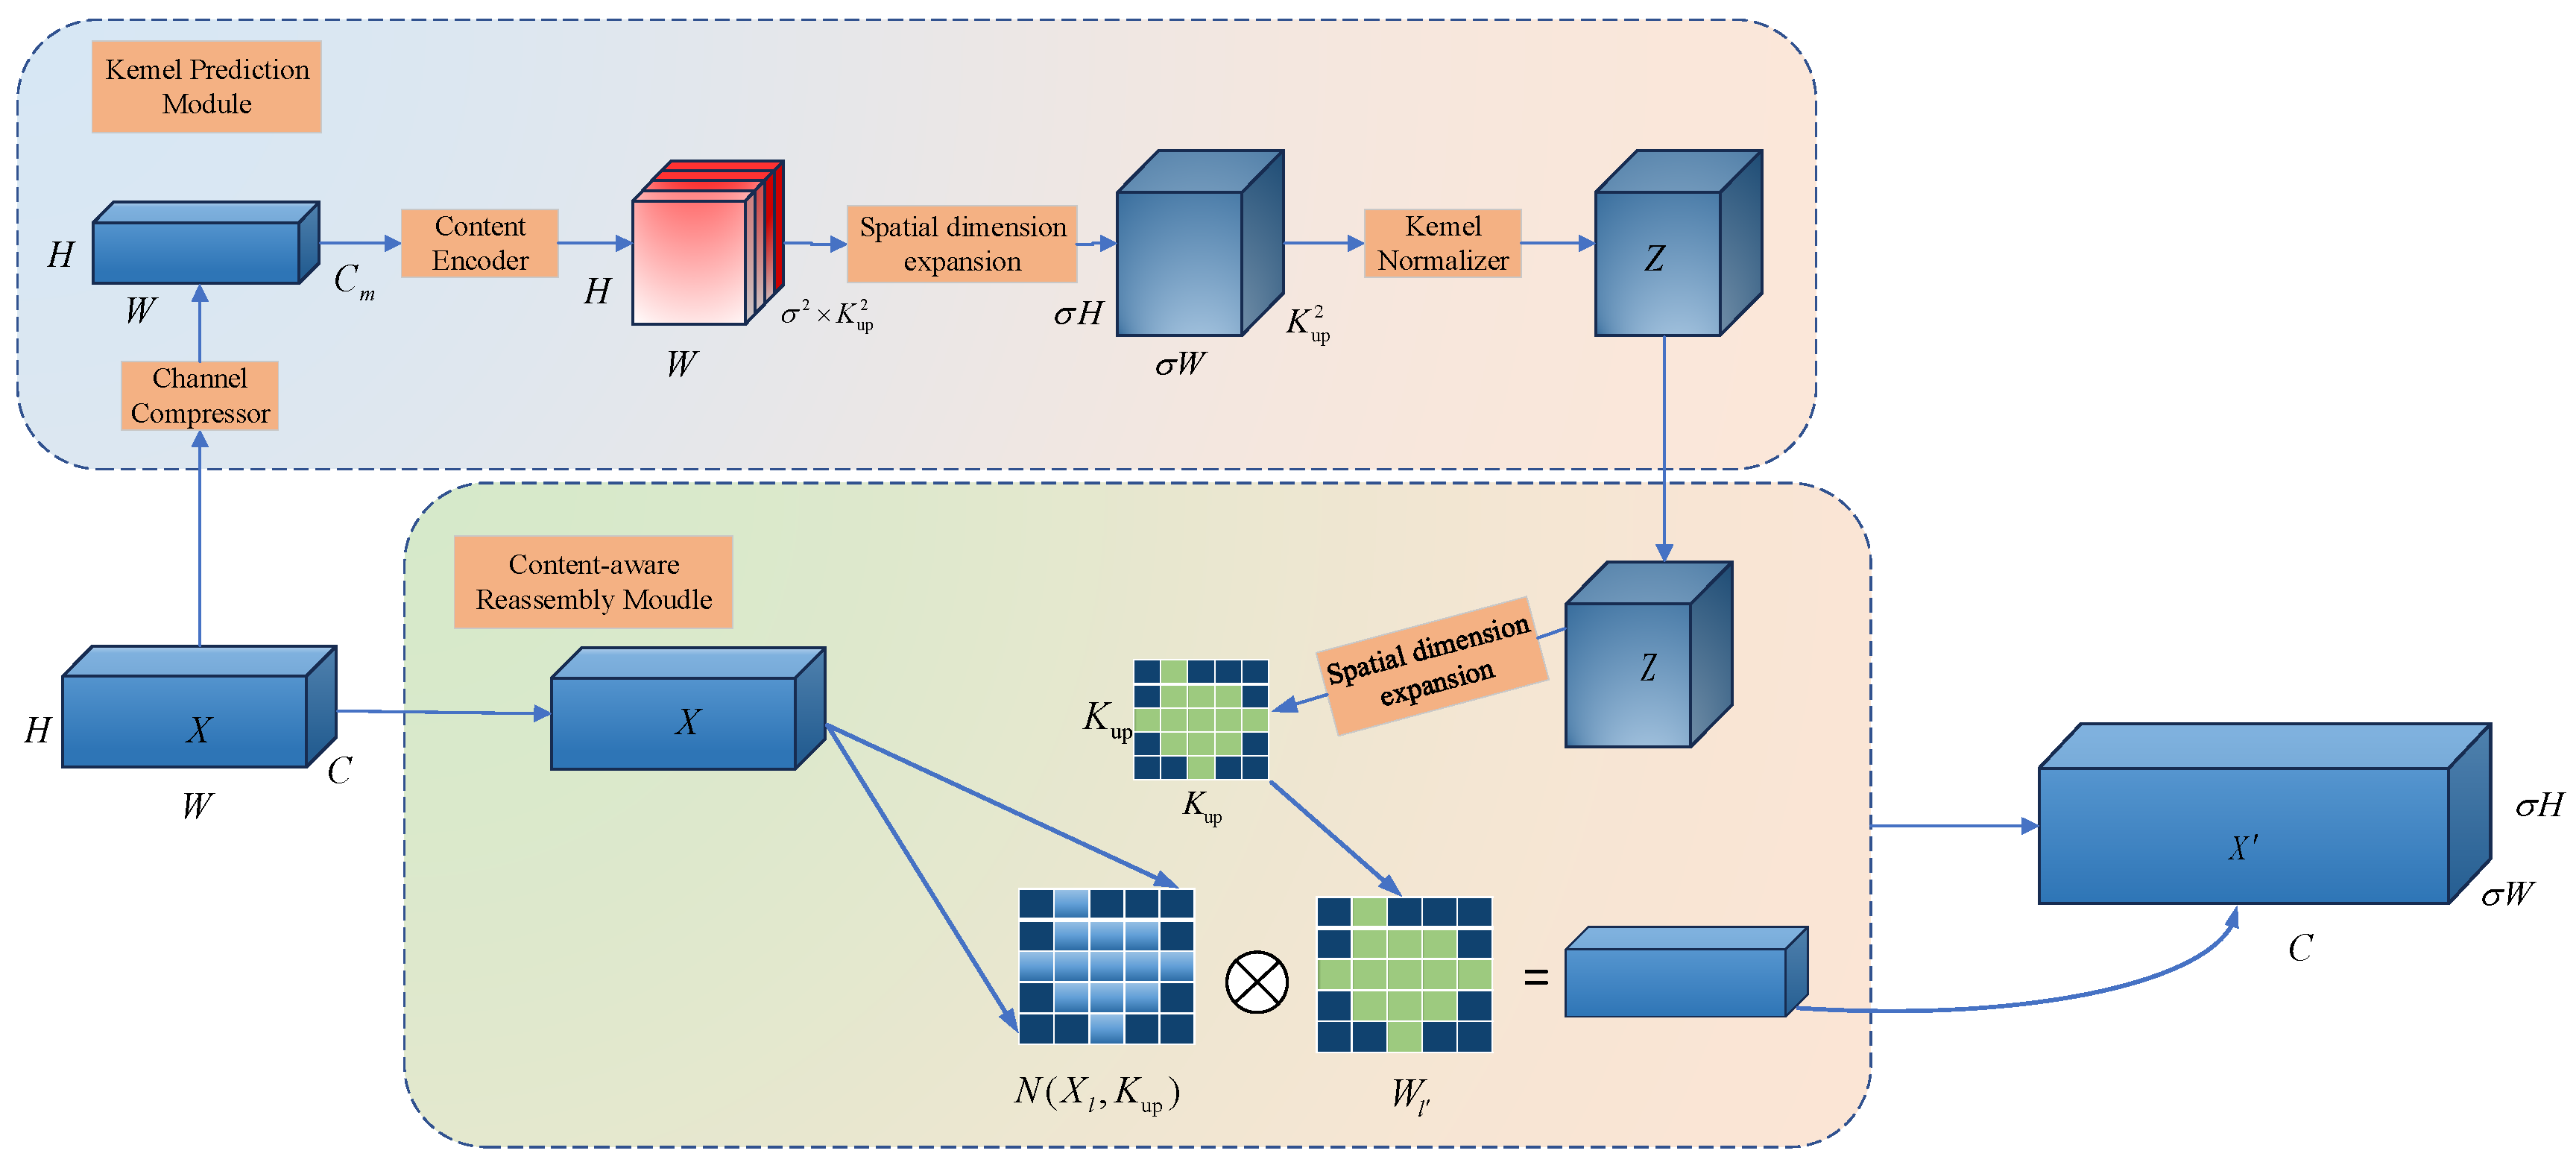
Figure 5.
Sample Images.
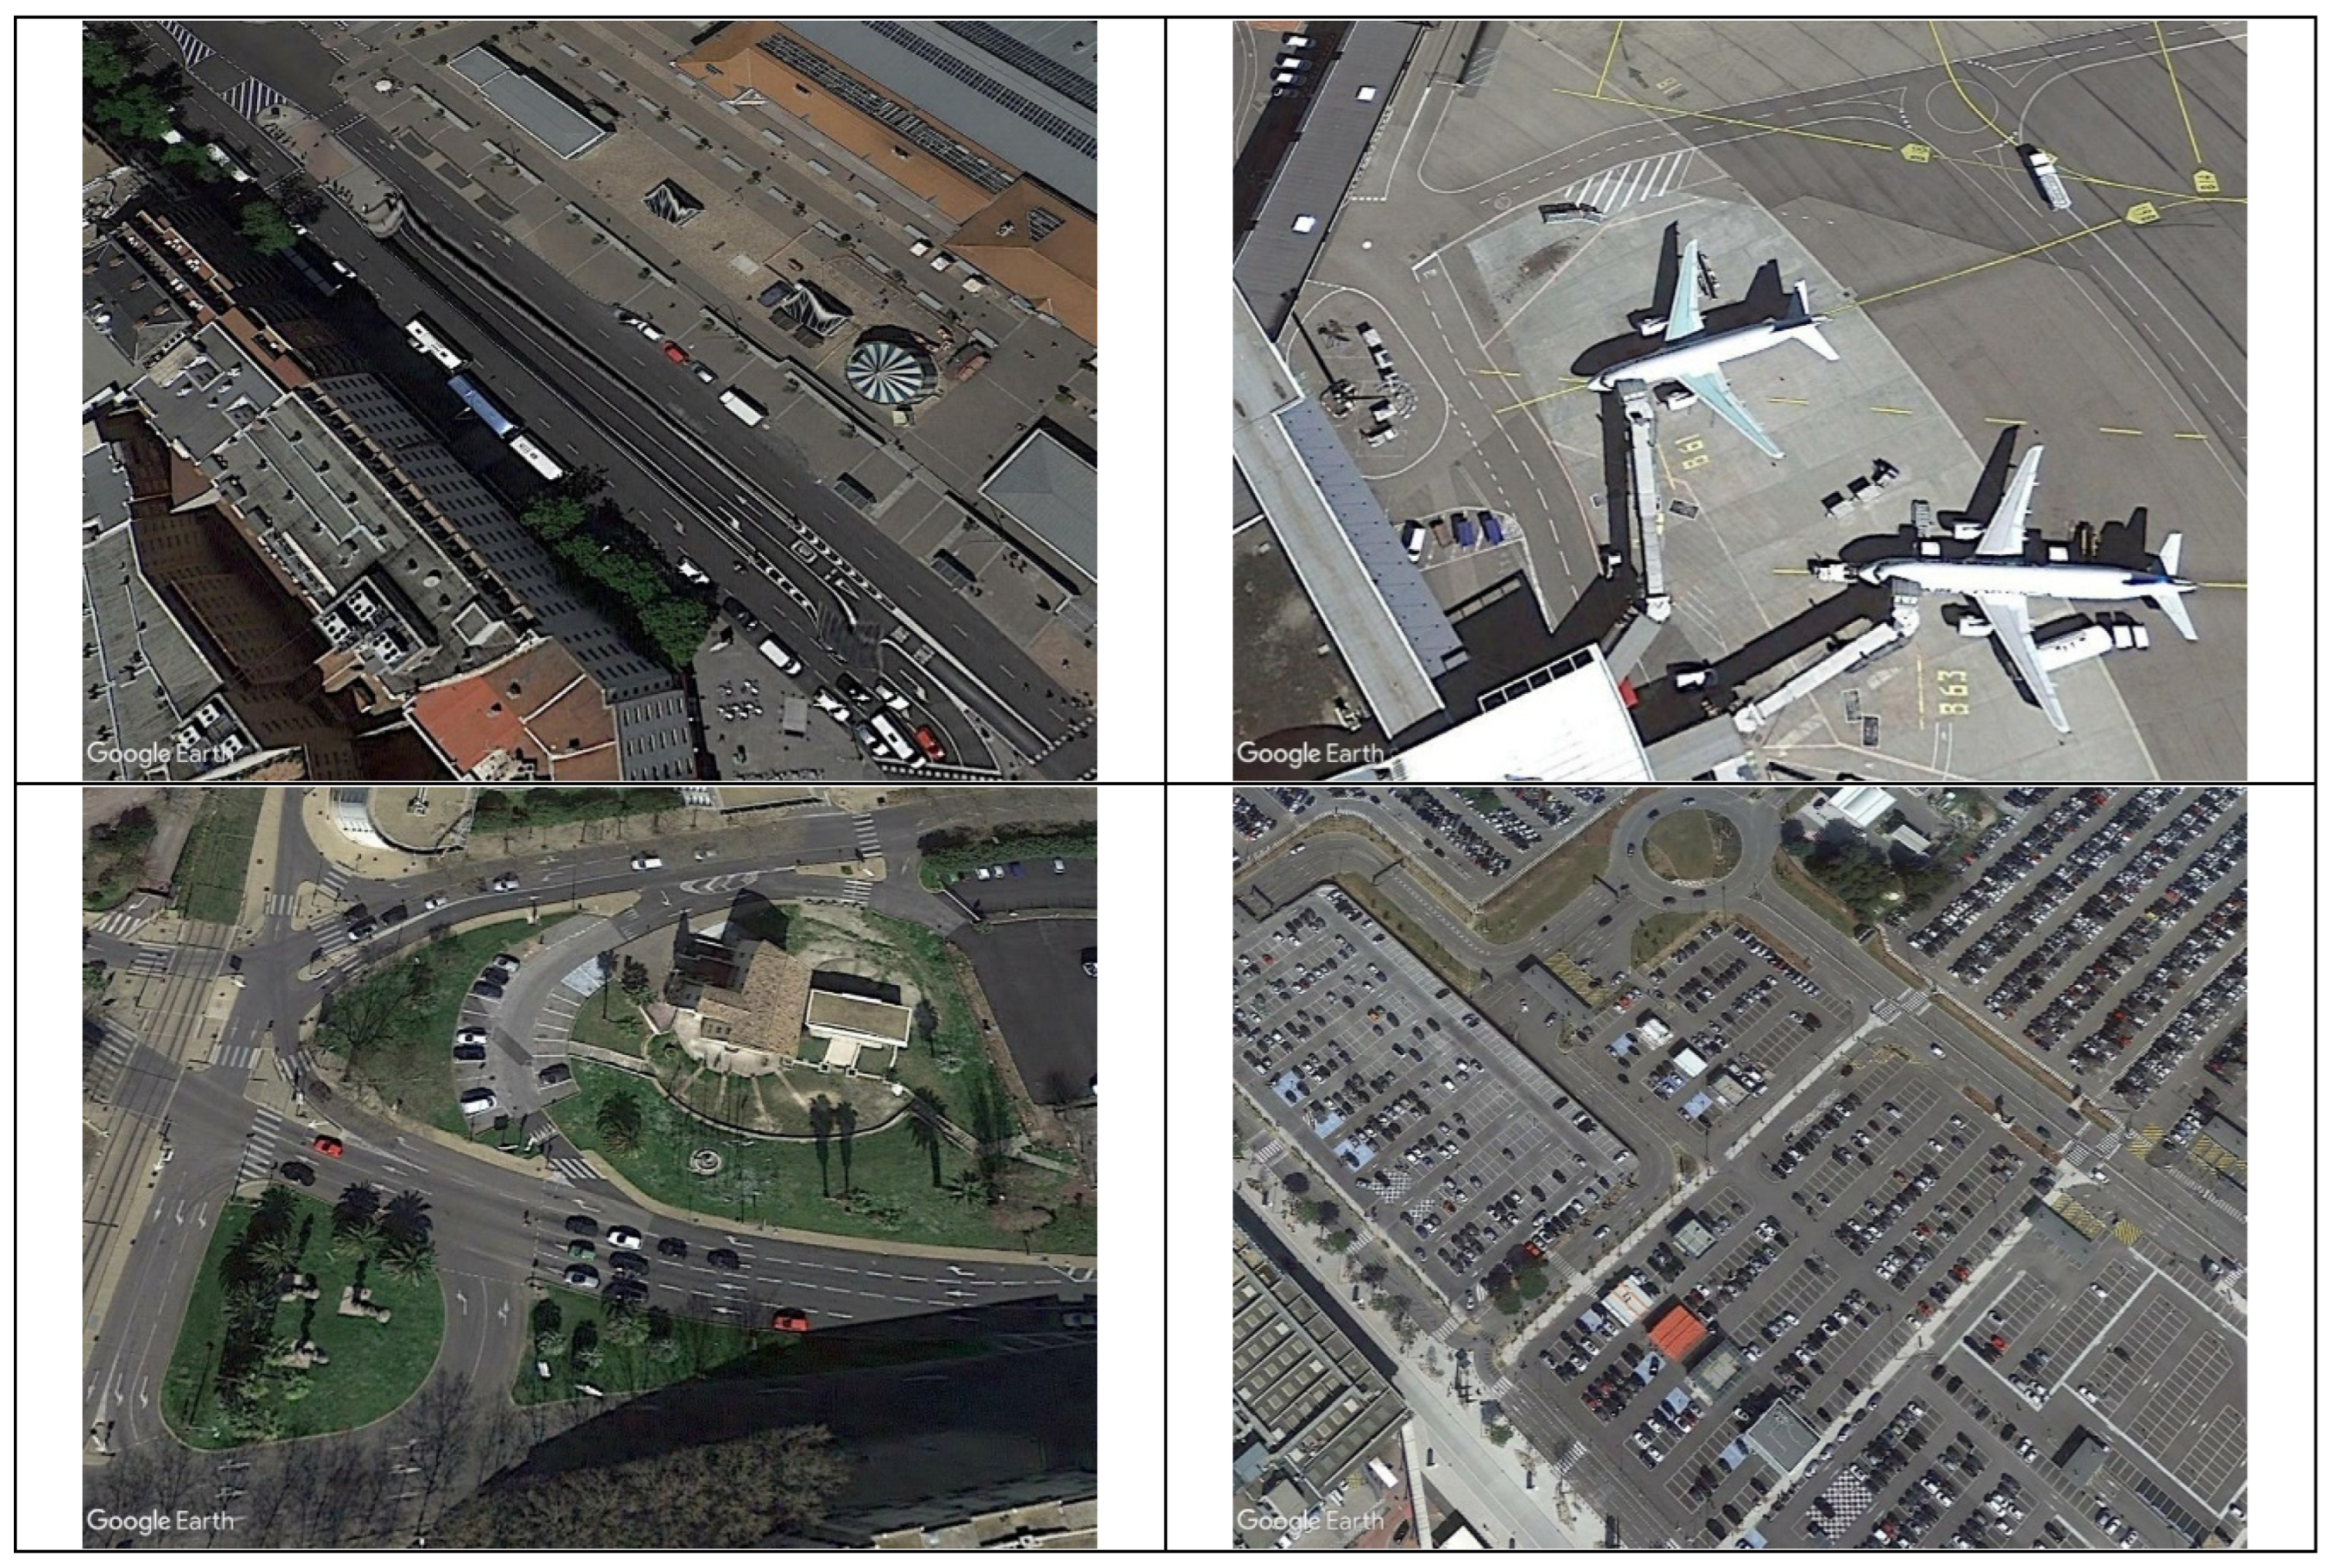
Figure 6.
Distribution of the Number of Objects.
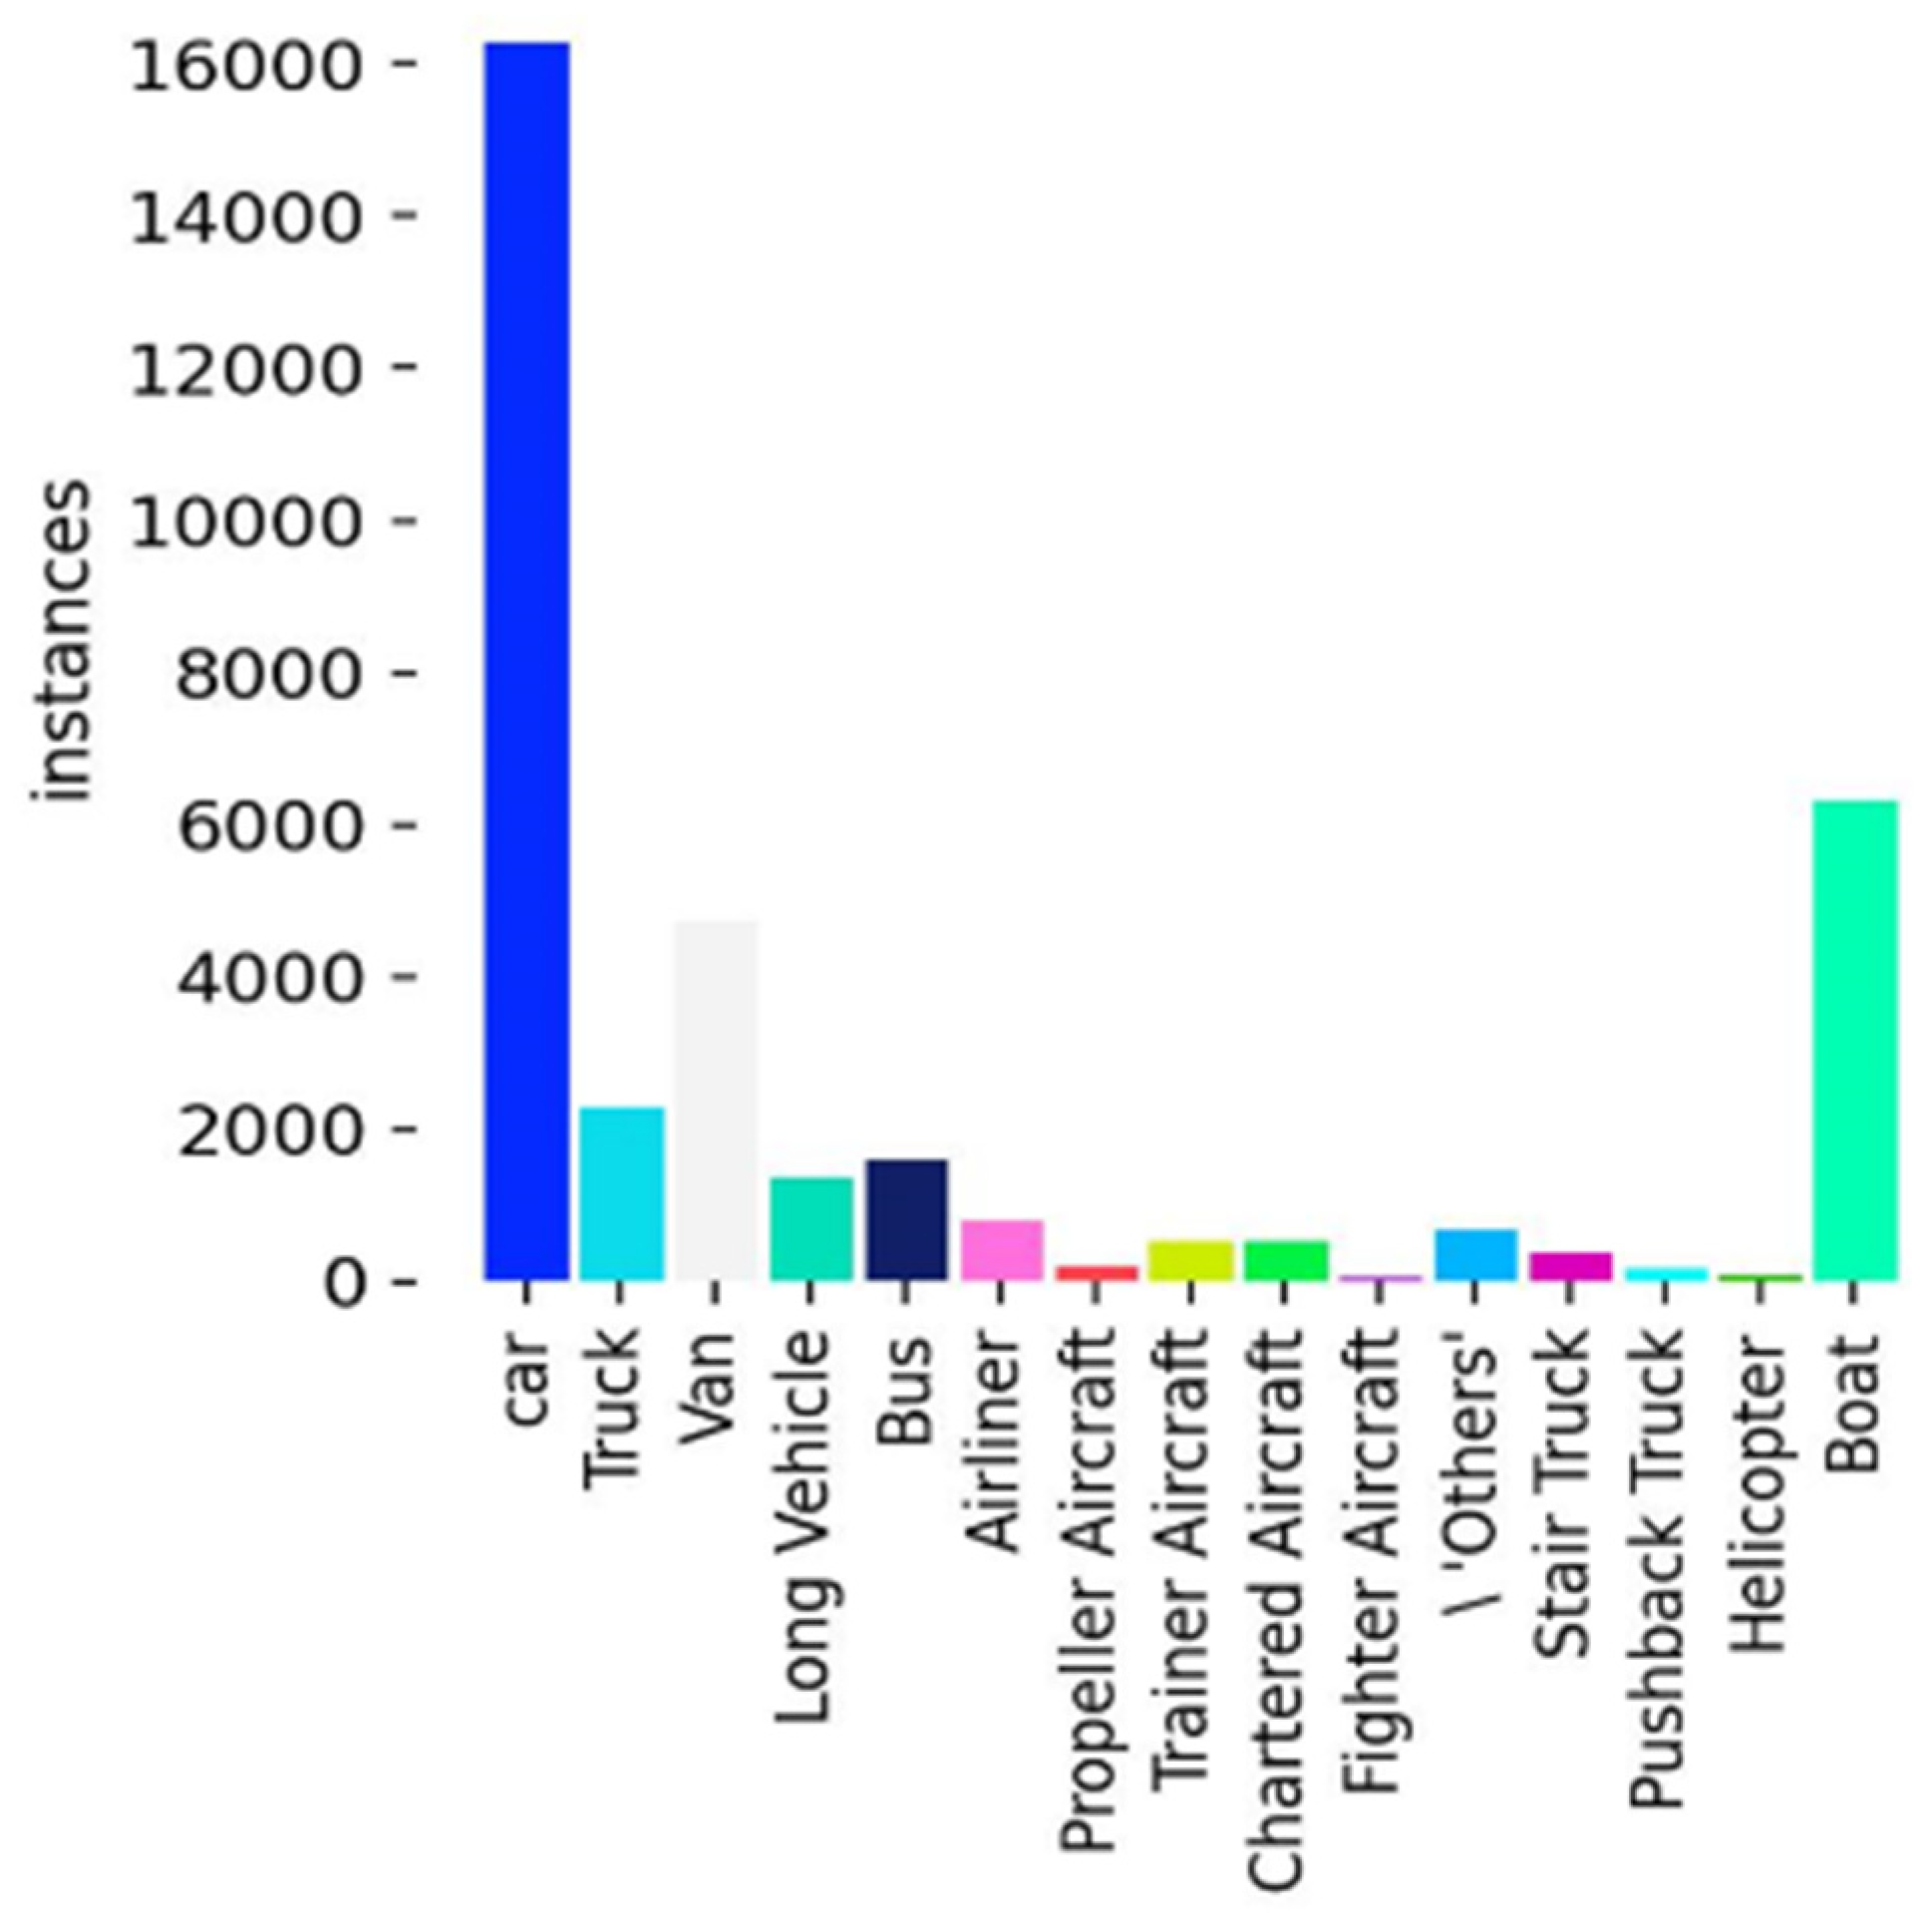
Figure 7.
Distribution of Object Bounding Box Centers.
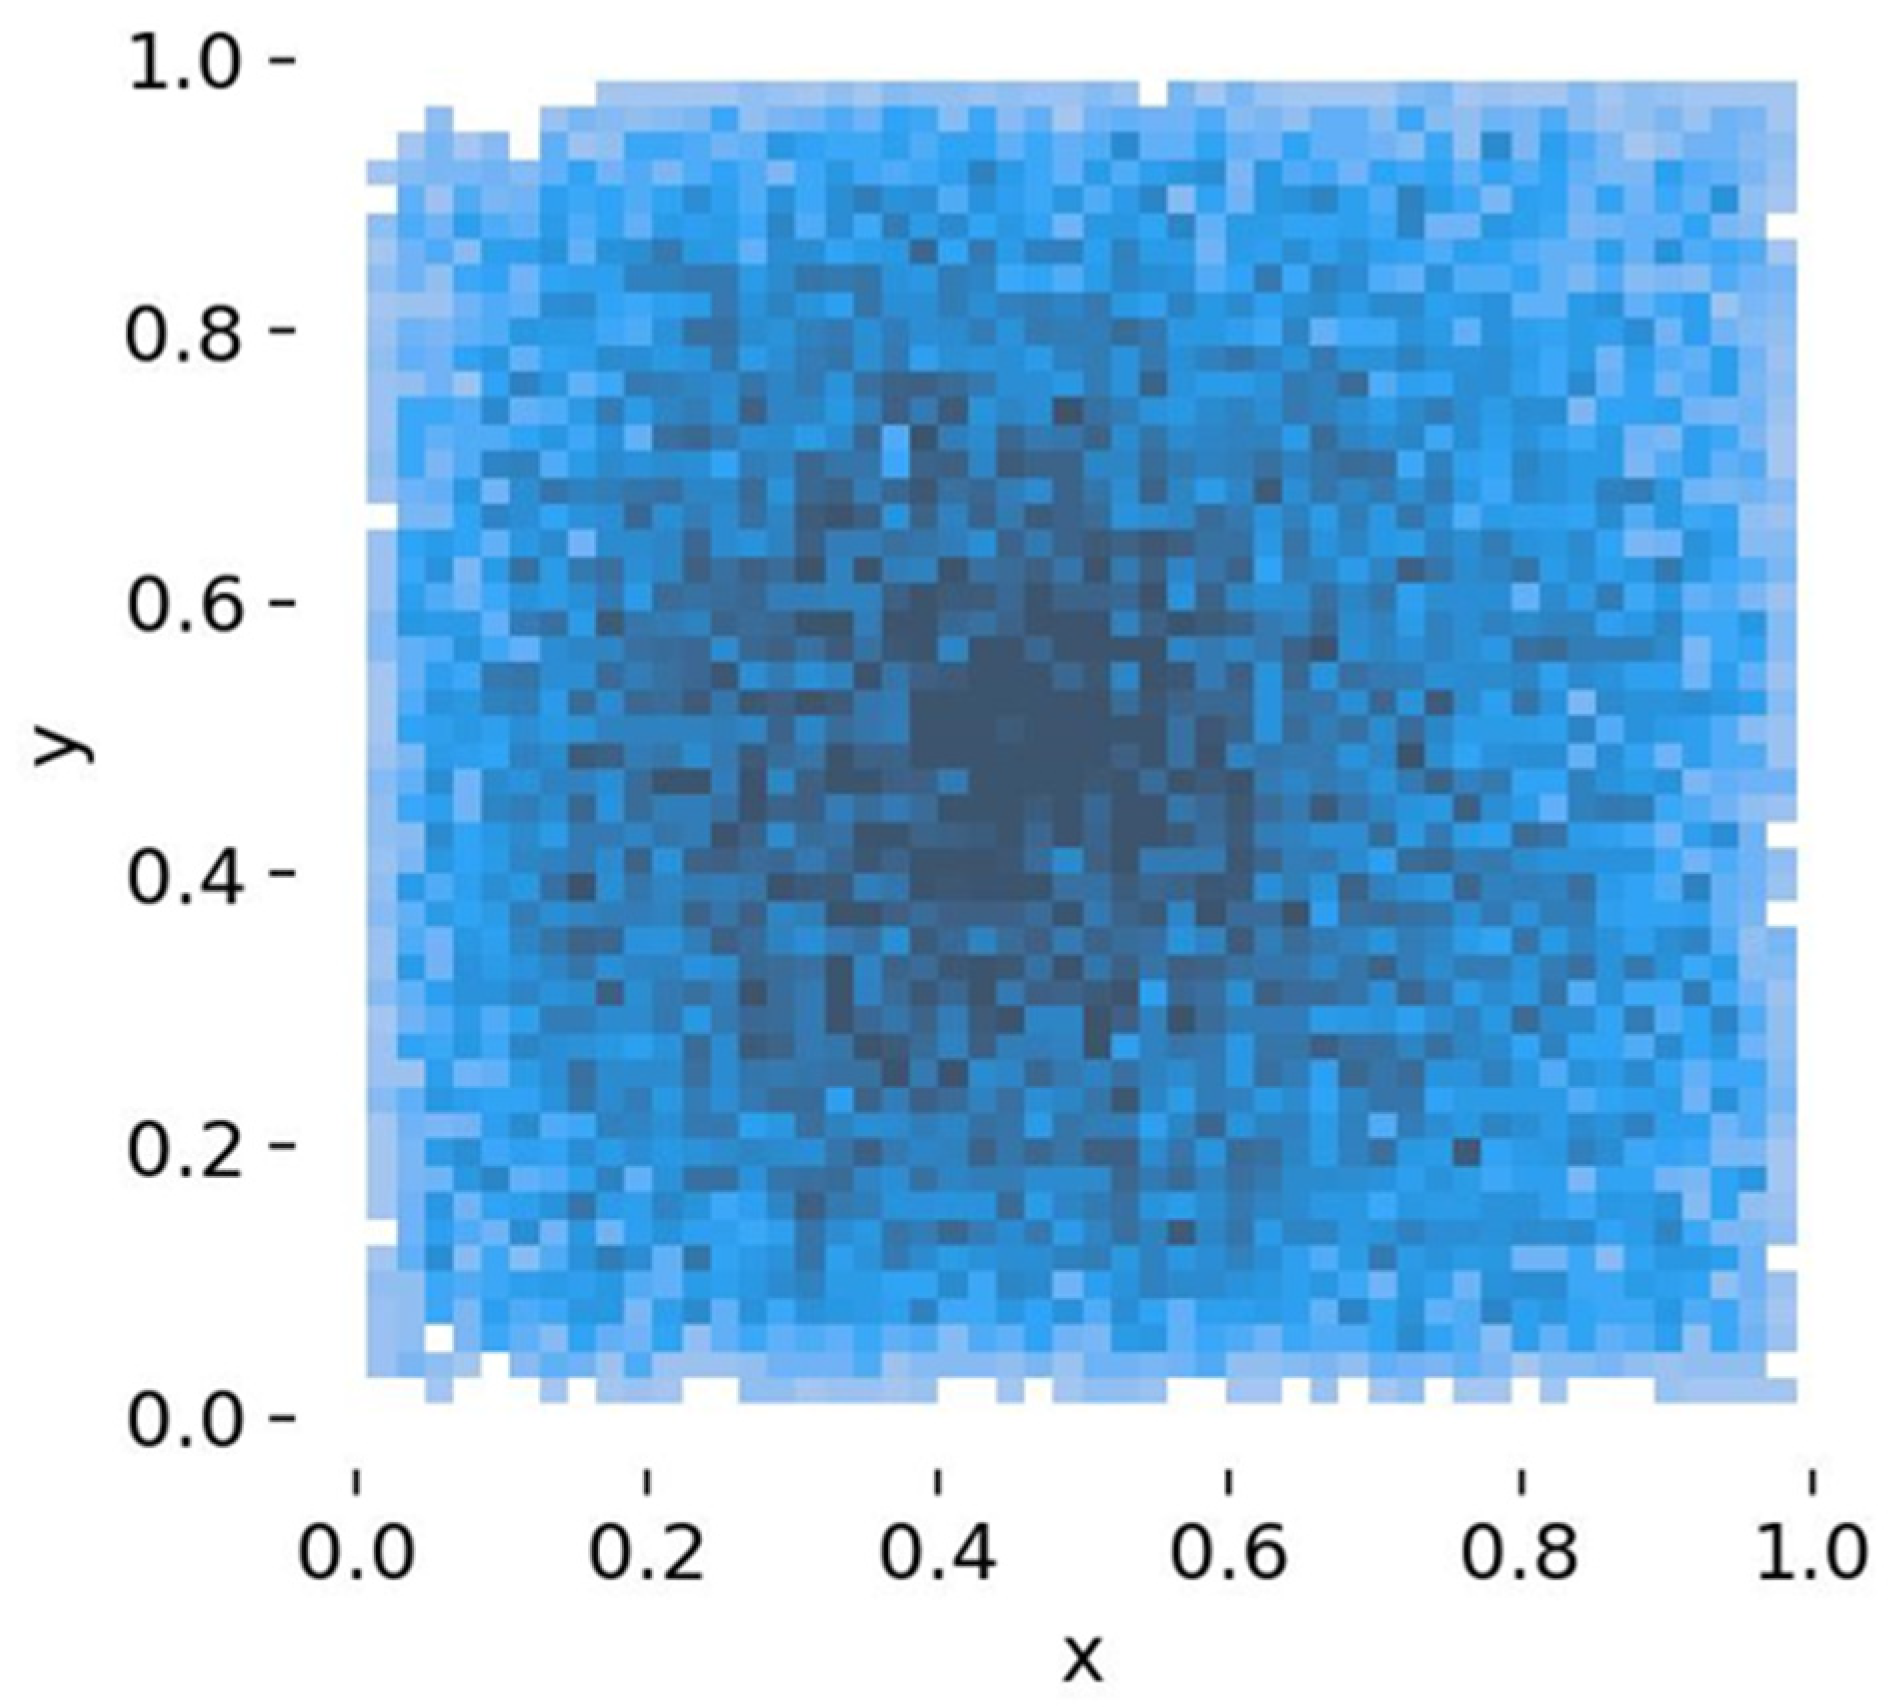
Figure 8.
Distribution of Object Widths and Heights.
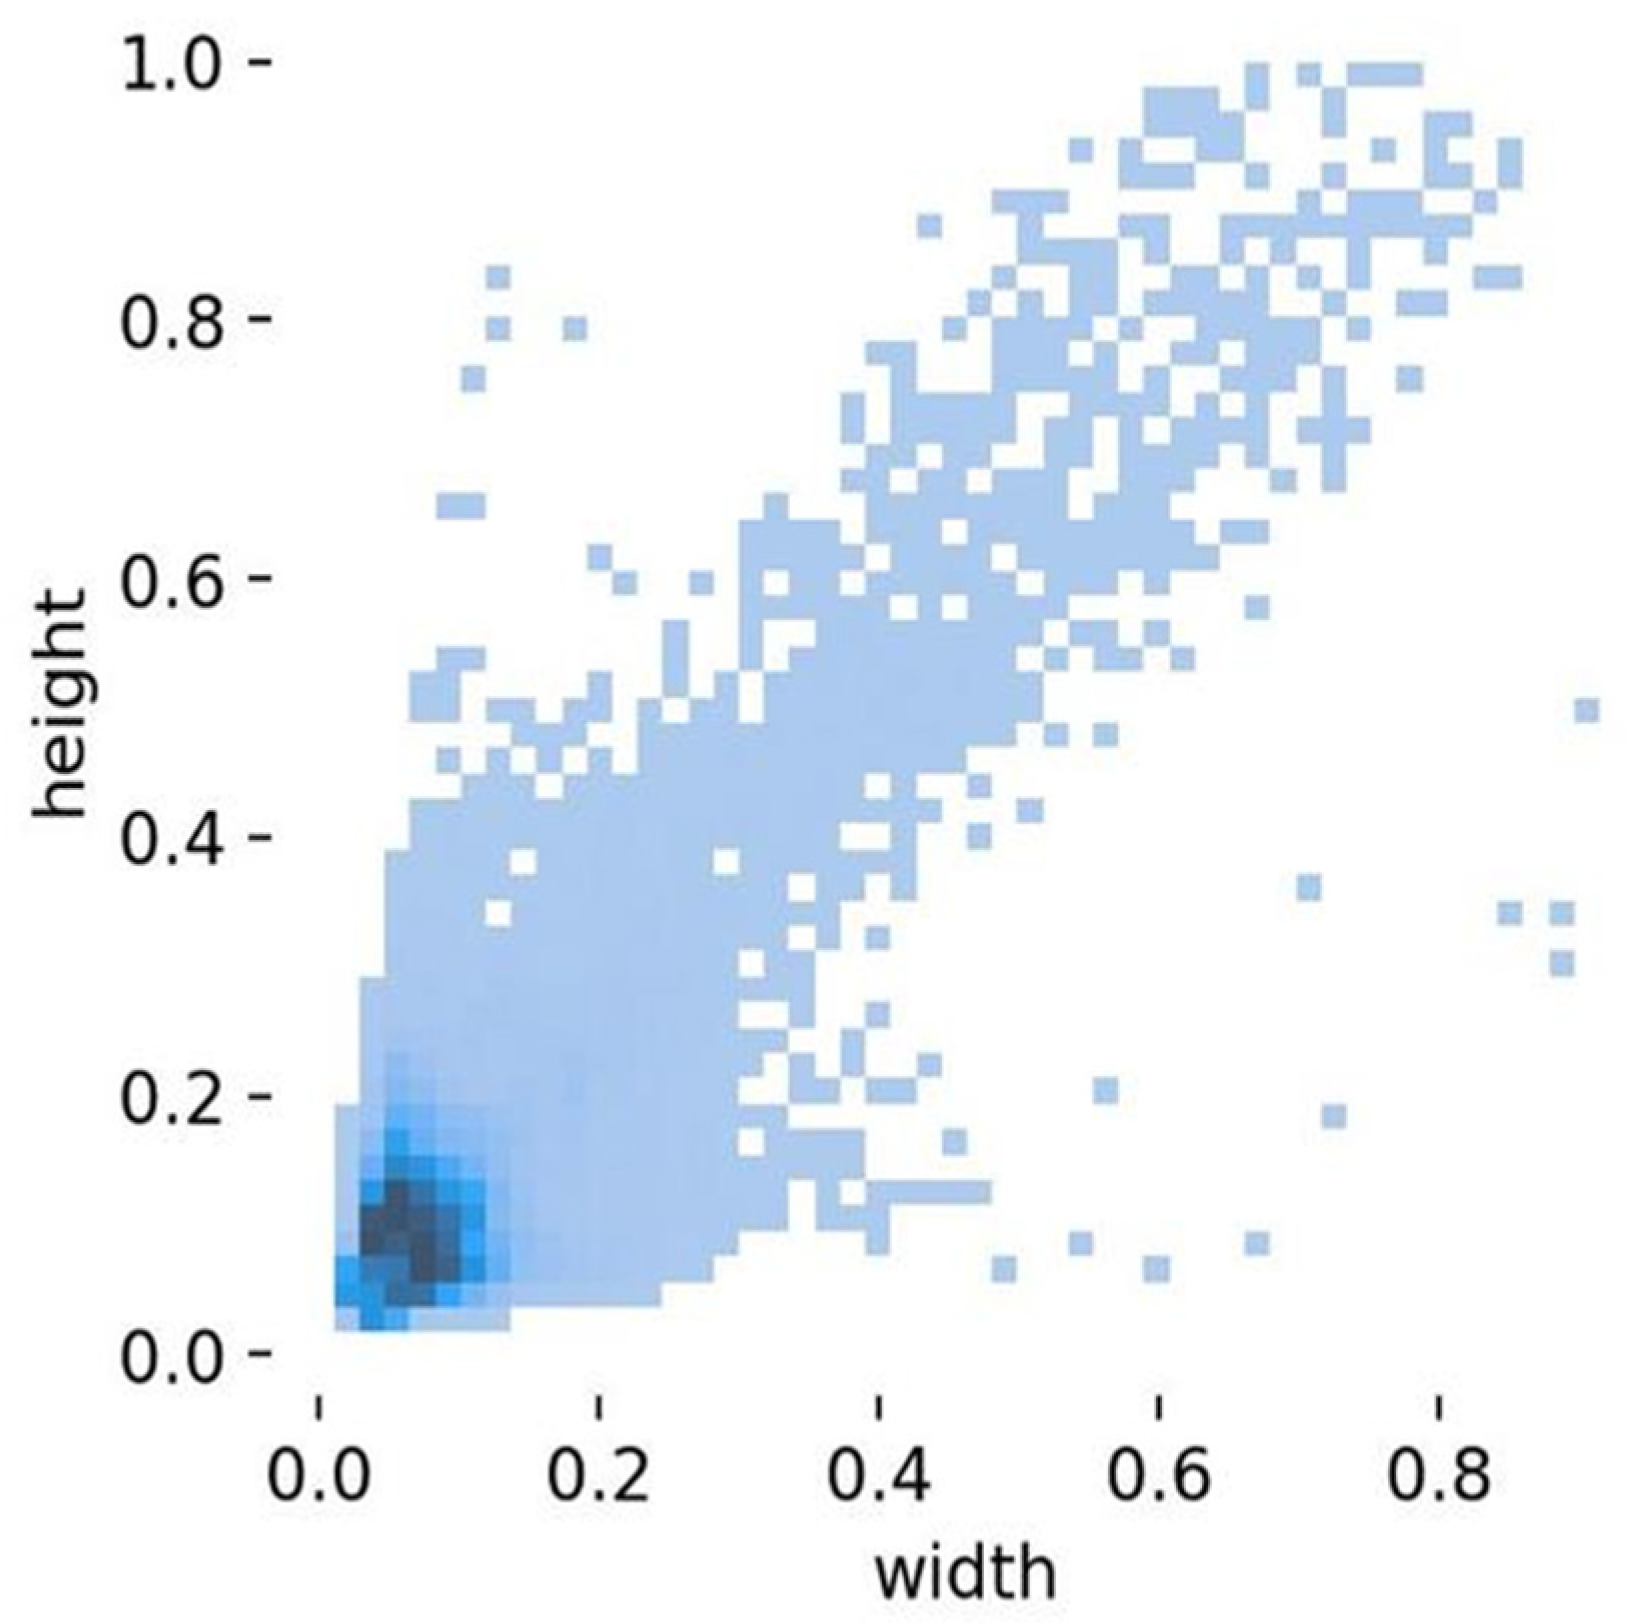
Figure 9.
Comparison of Heatmap Effects. (a) Network focus areas and attention levels in the original model detection. (b) Network focus areas and attention levels in the detection of the model after the introduction of the AFGCAttention mechanism.
Figure 9.
Comparison of Heatmap Effects. (a) Network focus areas and attention levels in the original model detection. (b) Network focus areas and attention levels in the detection of the model after the introduction of the AFGCAttention mechanism.
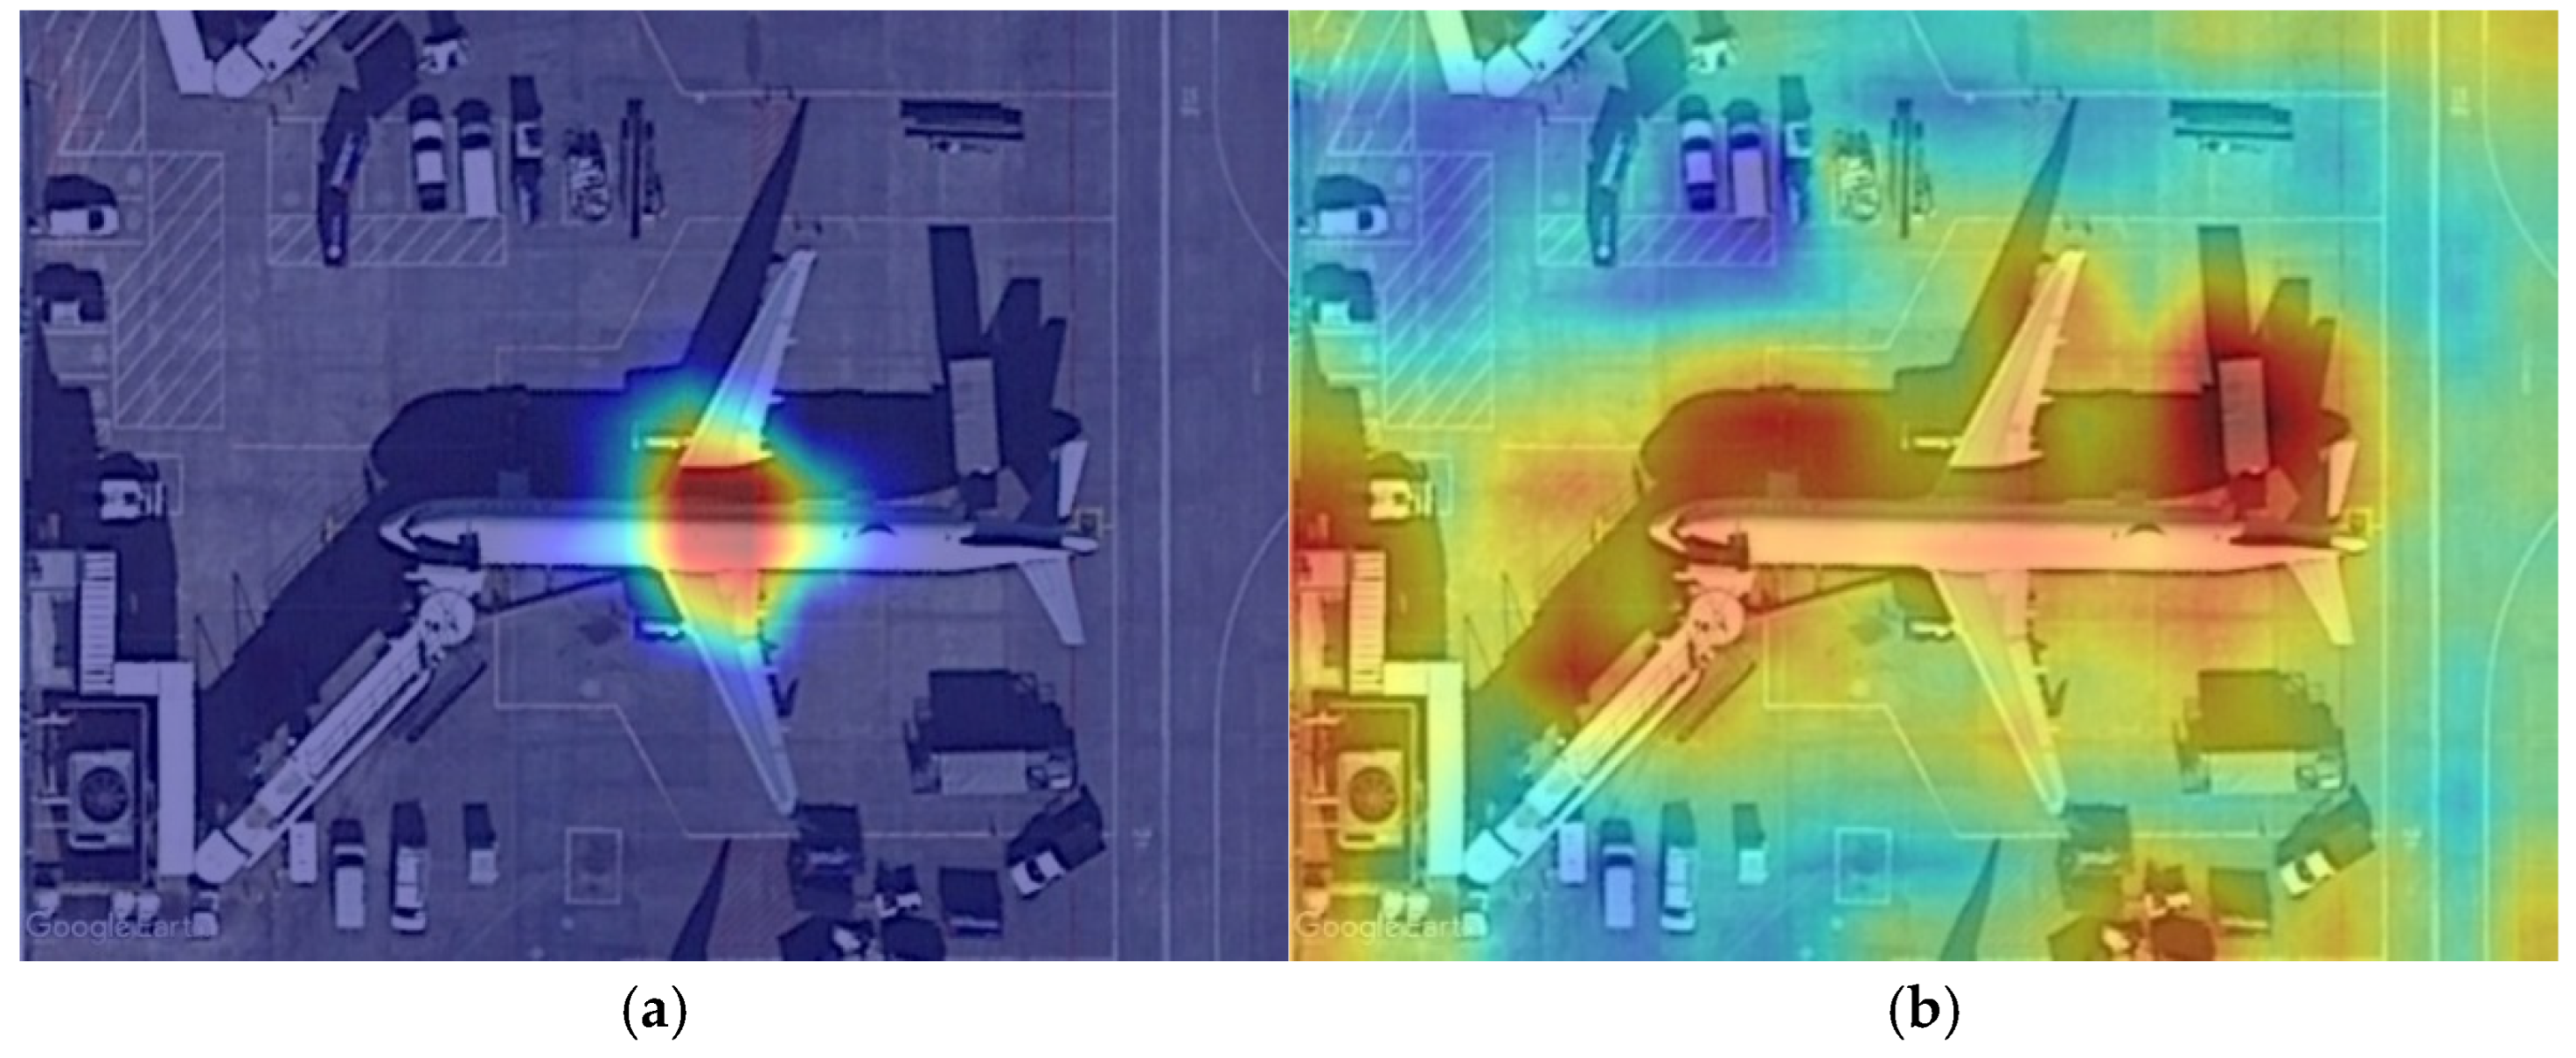
Figure 10.
Comparison of Detection Performance Across Different Algorithms.
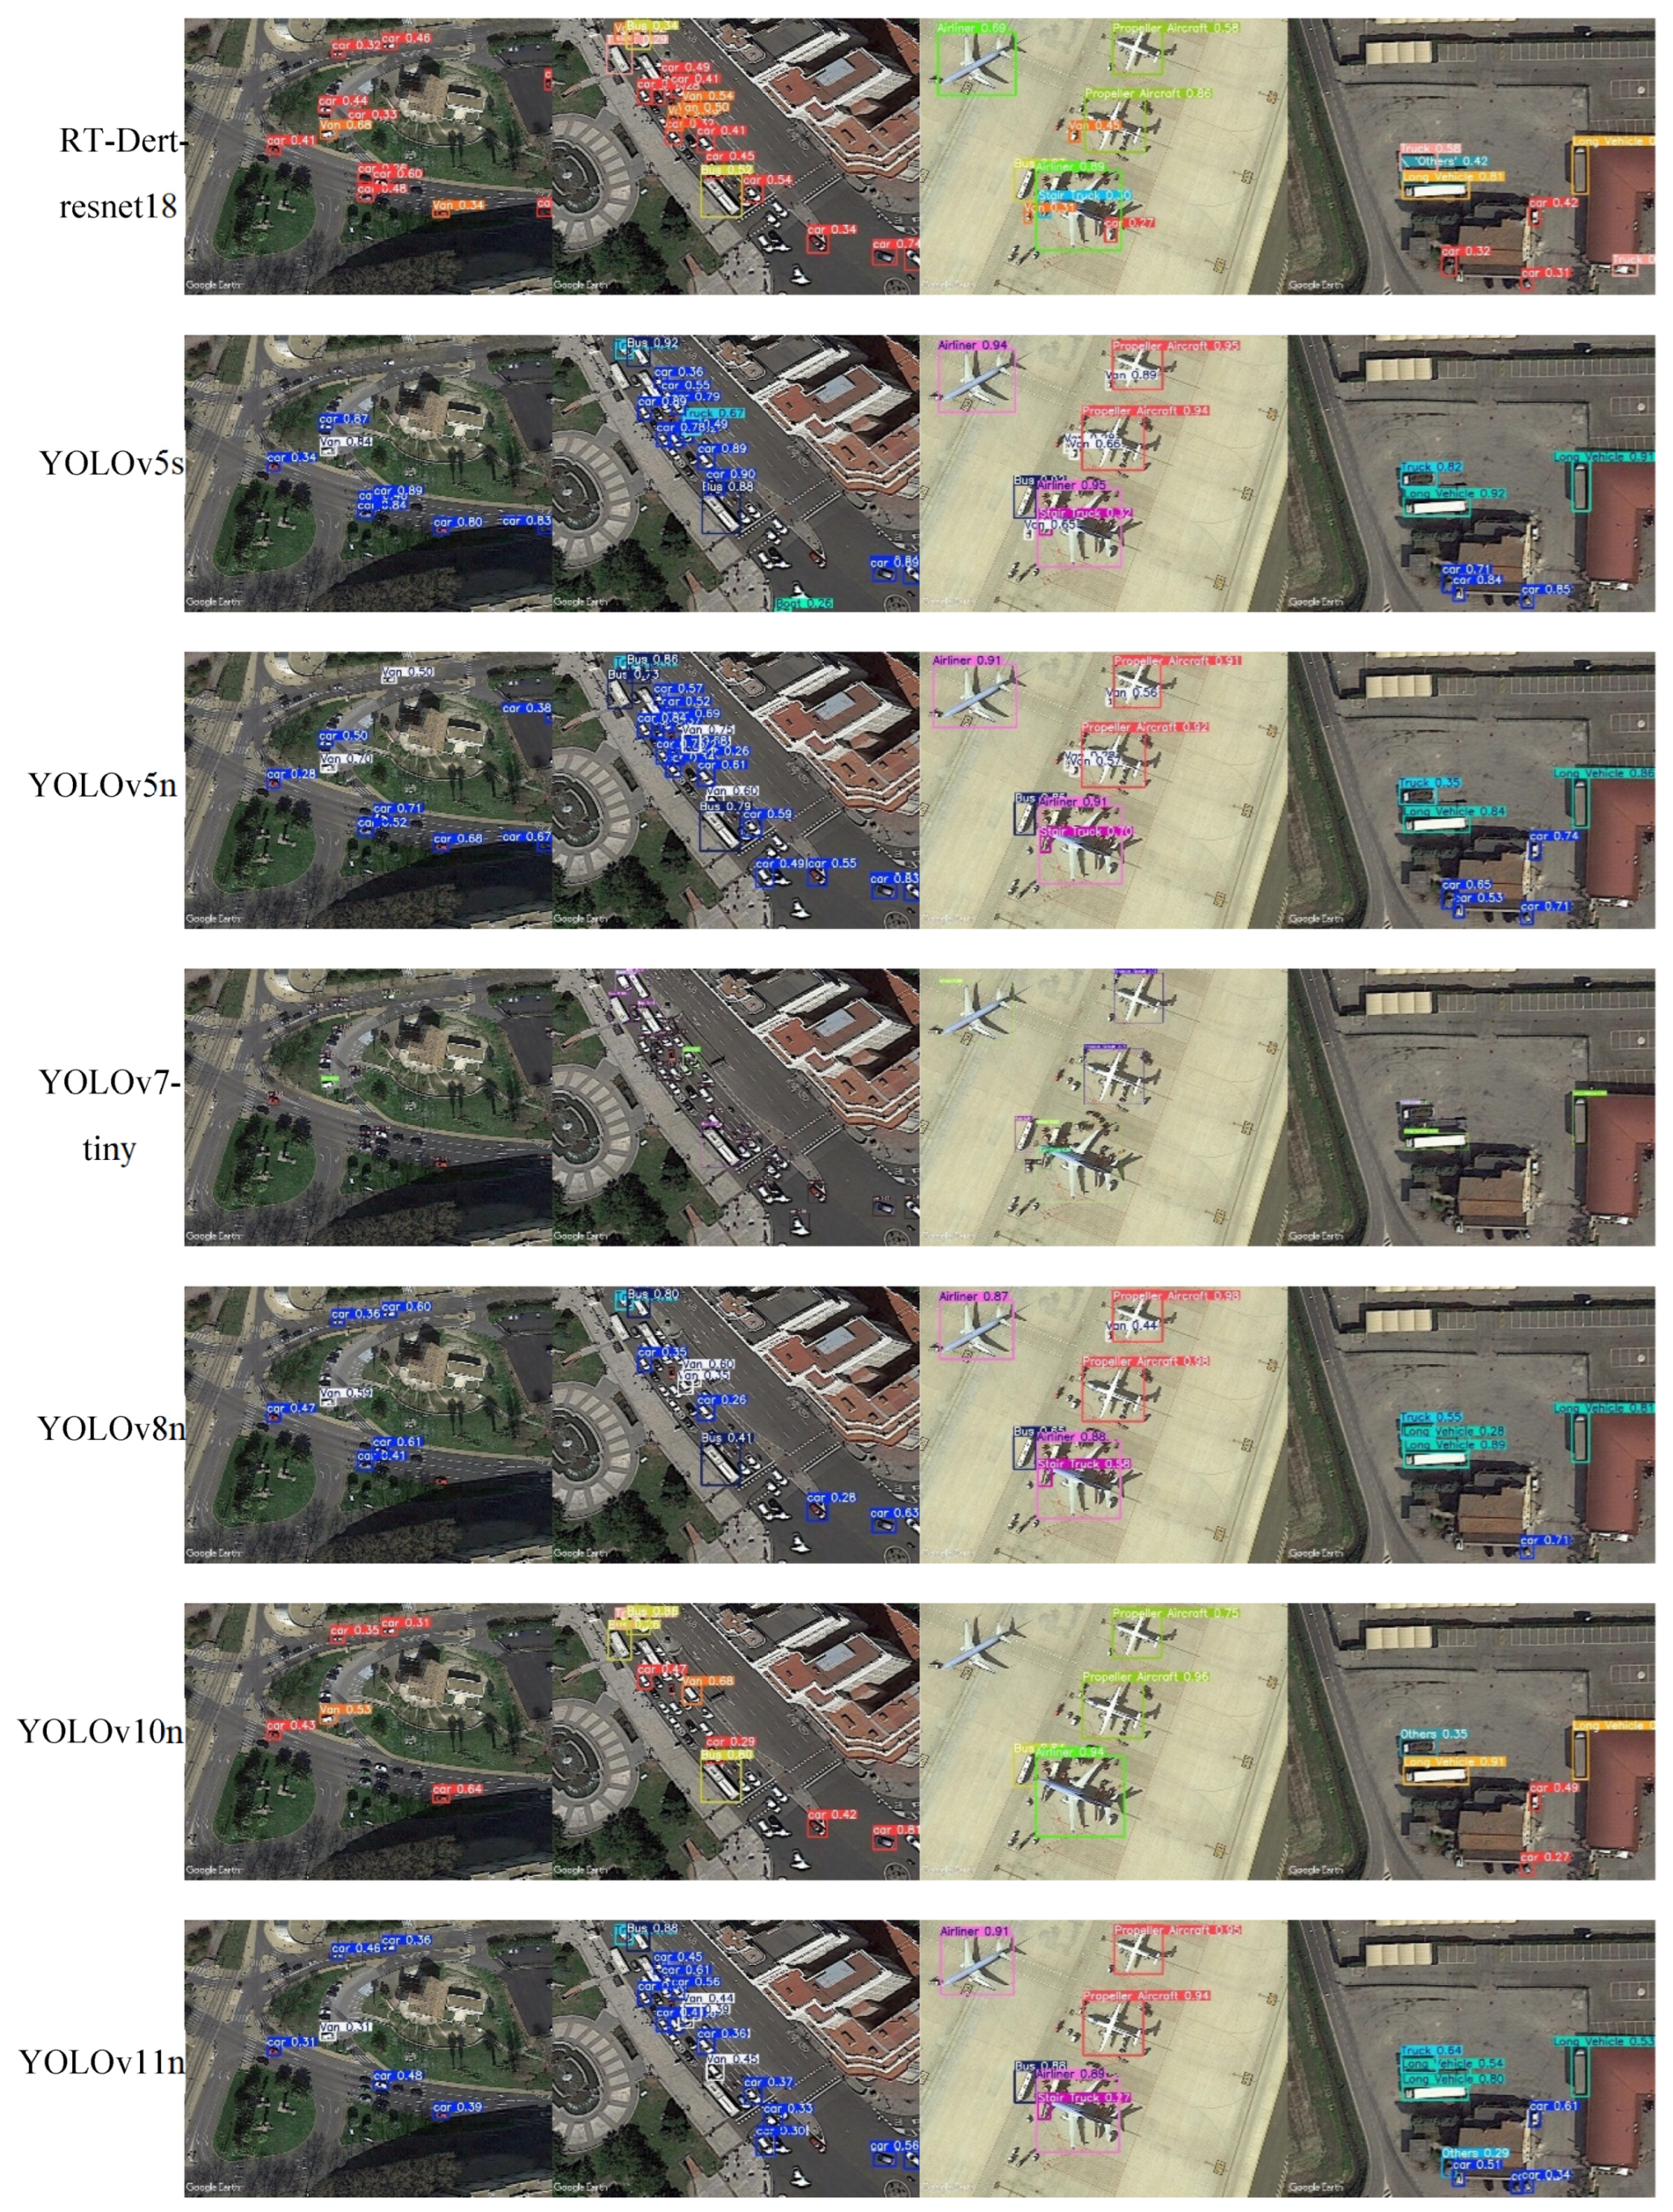
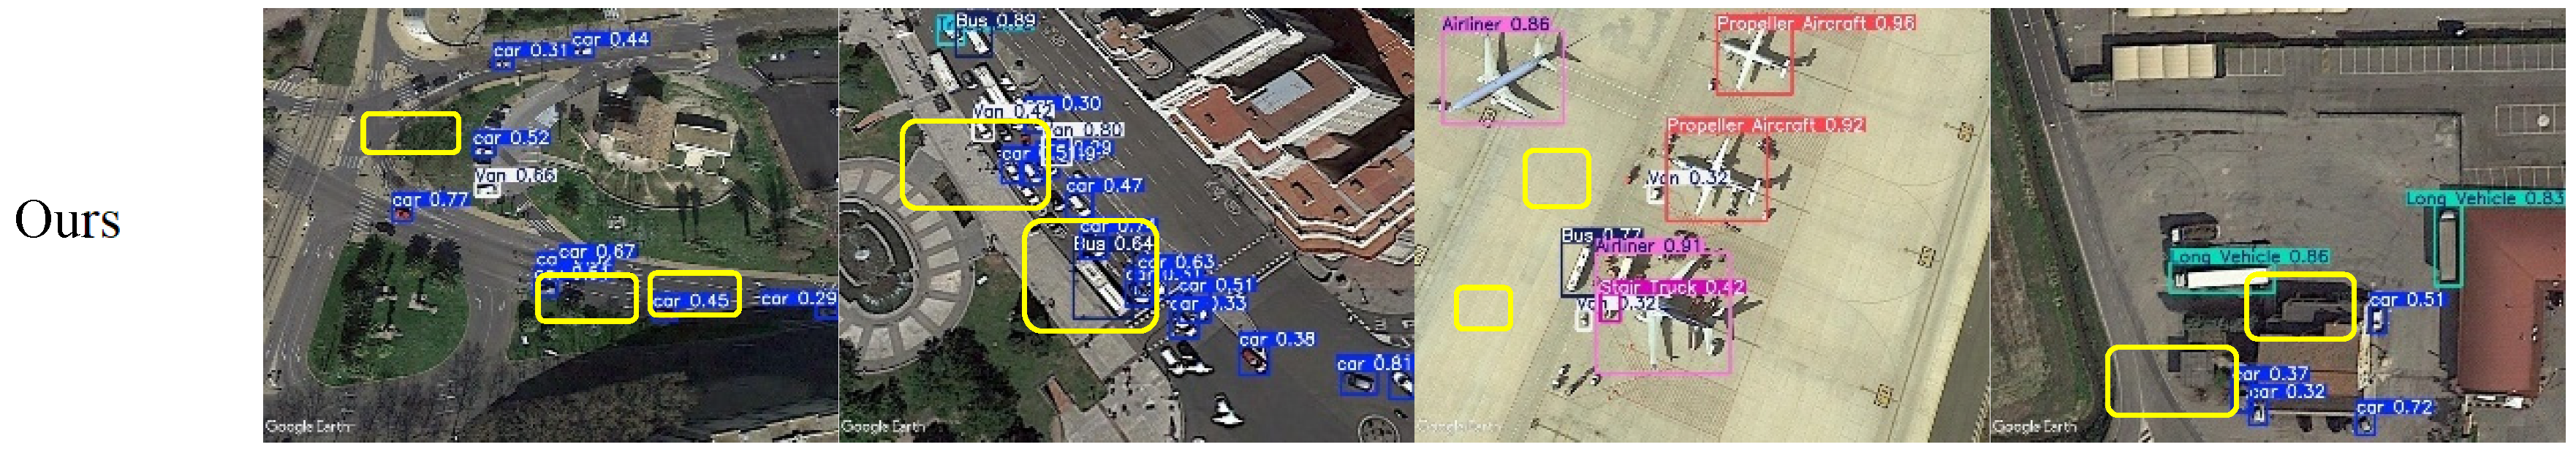
Figure 11.
Precision-Recall (P-R) Curve. (a) YOLOv8n algorithm. (b) The improved YOLOv8n algorithm.
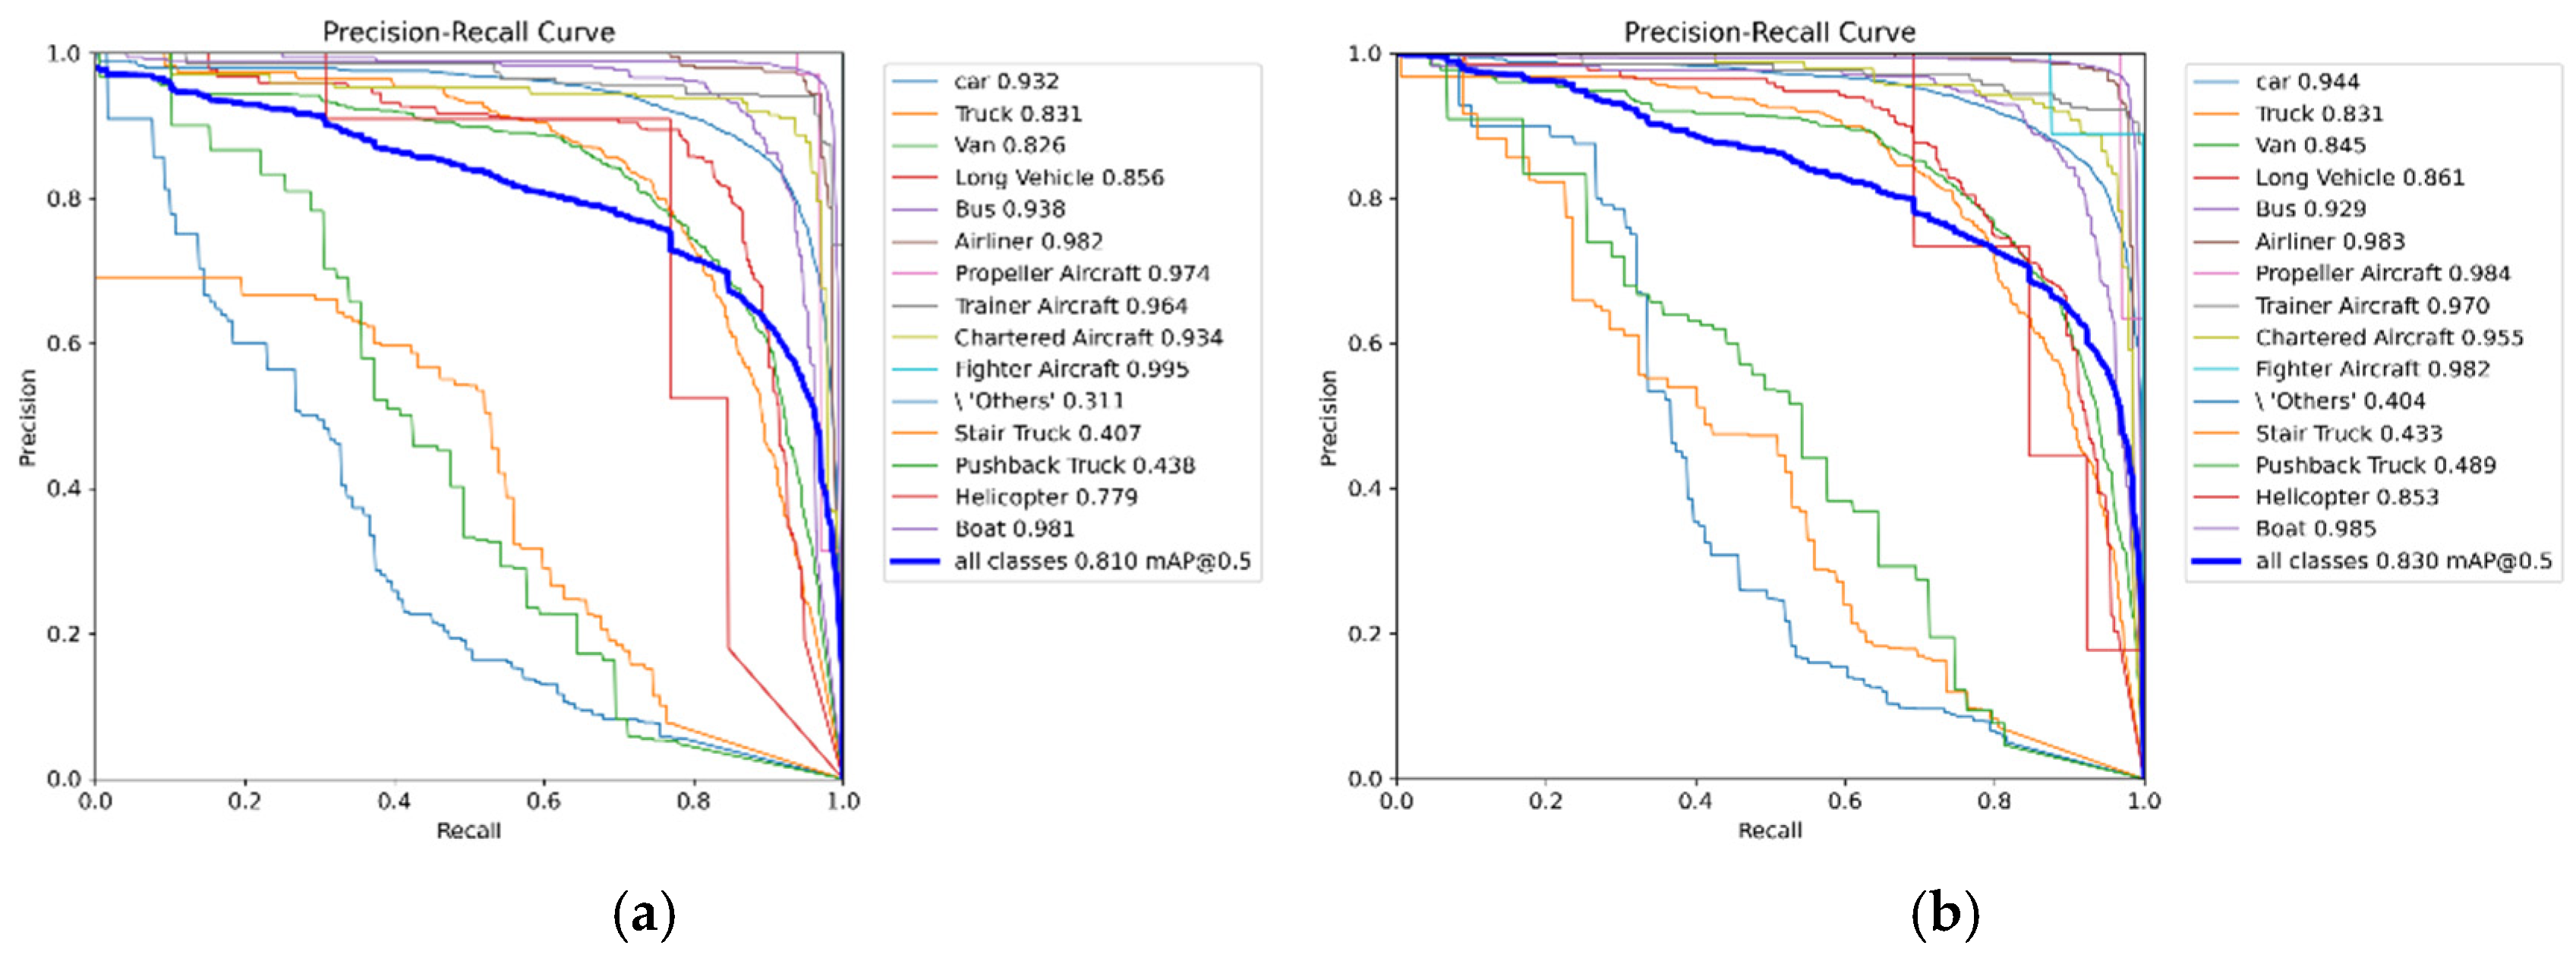
Figure 12.
Precision-Confidence Curve. (a) YOLOv8n algorithm. (b) The improved YOLOv8n algorithm.
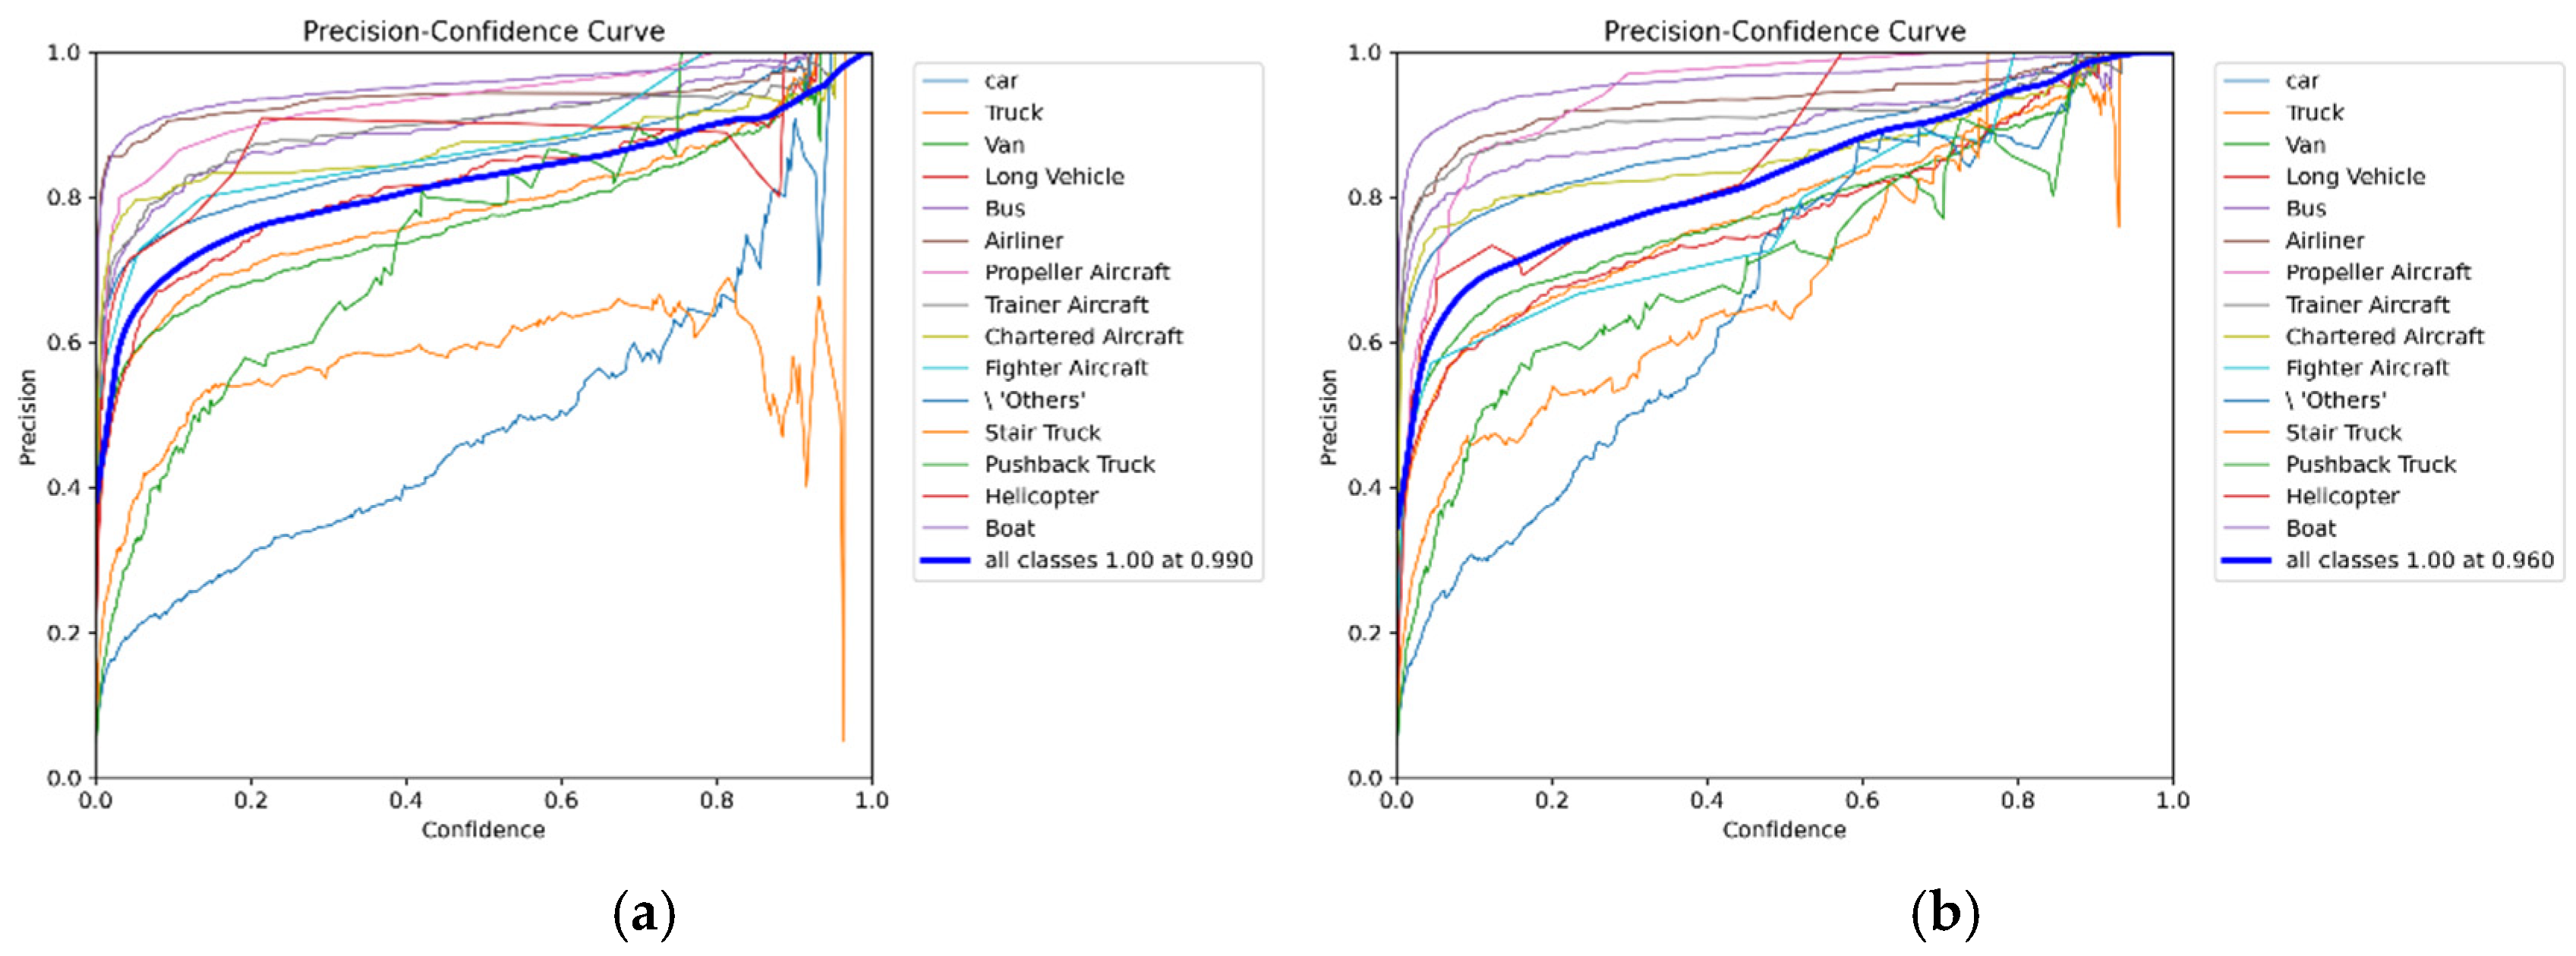

Table 1.
Algorithm Comparison Experiment Results.
| algorithm | Precision/% | Recall/% | mAP@0.5/% | mAP@0.5-0.95/% | FPS (f/s) | GFLOPS | Params (M) |
| SSD | 81.1 | 77.2 | 81.9 |  |
|
|
|
| Faster R-CNN | 64.5 | 81.3 | 76.7 | |
|
|
|
| YOLOv5s | 81.4 | 78.0 | 81.4 | 65.7 | 227.2 | 15.9 | 7.05 |
| YOLOv5n | 85.1 | 74.9 | 81.0 | 63.5 | 454.5 | 4.2 | 1.77 |
| YOLOv7-tiny | 74.6 | 78.1 | 79.2 | 61.8 | 344.8 | 13.1 | 6.04 |
| YOLOv8n | 80.0 | 79.4 | 81.0 | 66.5 | 357.1 | 8.1 | 3.00 |
| YOLOv10n | 73.8 | 70.0 | 76.1 | 59.3 | 123.4 | 8.4 | 2.73 |
| YOLOv11n | 72.7 | 78.2 | 78.9 | 62.7 | 94.3 | 6.3 | 2.58 |
| RT-Detr-resnet18 | 72.9 | 73.9 | 74.7 | 59.7 | 59.1 | 78.1 | 25.47 |
| Ours | 85.0 | 75.3 | 83.0 | 66.9 | 111.1 | 8.3 | 3.24 |
Table 2.
Comparison of Various Algorithms in Terms of Precision (P).
| 算法 类别 |
SSD | Faster R-CNN |
YOLOv5s | YOLOv5n | YOLOv7-tiny | YOLOv8n | YOLOv10n | YOLOv11n | RT-Detr- resnet18 |
Ours |
| car | 83.2 | 55.6 | 86.1 | 87.4 | 78.0 | 83.6 | 83.9 | 81.4 | 77.9 | 88.7 |
| Truck | 70.5 | 61.7 | 77.2 | 81.3 | 69.1 | 75.2 | 73.3 | 75.6 | 71.8 | 81.0 |
| Van | 77.7 | 57.1 | 78.0 | 79.2 | 70.7 | 73.3 | 77.0 | 69.7 | 76.4 | 79.0 |
| Long Vehicle | 73.4 | 57.2 | 76.3 | 84.0 | 69.2 | 81.5 | 71.7 | 67.3 | 60.3 | 77.7 |
| Bus | 83.7 | 68.7 | 90.8 | 88.6 | 81.3 | 88.8 | 85.9 | 83.9 | 76.1 | 90.3 |
| Airliner | 91.2 | 80.8 | 95.7 | 93.4 | 89.1 | 94.0 | 91.3 | 90.5 | 86.2 | 94.1 |
| Propeller Aircraft | 90.9 | 75.6 | 94.1 | 95.1 | 96.7 | 93.0 | 89.7 | 81.9 | 83.1 | 98.7 |
| Trainer Aircraft | 87.3 | 68.0 | 93.3 | 93.6 | 86.1 | 89.7 | 85.6 | 87.1 | 72.4 | 92.2 |
| Chartered Aircraft | 79.6 | 81.1 | 87.3 | 88.4 | 80.5 | 84.3 | 85.7 | 79.5 | 75.2 | 85.7 |
| Fighter Aircraft | 100.0 | 85.7 | 79.1 | 84.2 | 82.0 | 84.3 | 67.8 | 60.2 | 75.8 | 80.3 |
| Others | 56.8 | 41.8 | 55.3 | 54.9 | 32.3 | 38.2 | 35.2 | 36.2 | 37.2 | 78.5 |
| Stair Truck | 71.1 | 39.1 | 65.2 | 69.9 | 54.1 | 58.2 | 67.2 | 60.1 | 58.2 | 66.1 |
| Pushback Truck | 64.7 | 35.9 | 65.1 | 81.7 | 64.4 | 69.8 | 39.4 | 47.6 | 59.1 | 72.4 |
| Helicopter | 100.0 | 90.0 | 82.6 | 98.8 | 74.3 | 90.5 | 59.0 | 75.8 | 100.0 | 92.7 |
| Boat | 87.1 | 69.5 | 94.4 | 96.4 | 91.7 | 95.0 | 94.4 | 94.3 | 83.4 | 97.1 |
Table 3.
Presents a comparison of various algorithms based on Average Precision (AP).
| 算法 类别 |
SSD | Faster R-CNN |
YOLOv5s | YOLOv5n | YOLOv7-tiny | YOLOv8n | YOLOv10n | YOLOv11n | RT-Detr- resnet18 |
Ours |
| car | 91.2 | 84.5 | 92.2 | 93.5 | 94.4 | 93.2 | 92.7 | 94.3 | 91.1 | 94.4 |
| Truck | 77.1 | 74.8 | 82.5 | 81.0 | 82.6 | 83.1 | 81.1 | 83.6 | 74.9 | 83.1 |
| Van | 83.7 | 77.8 | 81.5 | 82.1 | 84.6 | 82.6 | 80.9 | 83.9 | 76.5 | 84.5 |
| Long Vehicle | 75.3 | 74.2 | 85.8 | 86.6 | 80.6 | 85.6 | 79.5 | 77.6 | 74.3 | 86.1 |
| Bus | 88.9 | 86.5 | 94.3 | 92.8 | 91.0 | 93.8 | 88.8 | 90.4 | 84.1 | 92.9 |
| Airliner | 97.9 | 98.2 | 97.8 | 97.9 | 97.7 | 98.2 | 96.9 | 98.3 | 95.2 | 98.3 |
| Propeller Aircraft | 94.9 | 94.1 | 97.1 | 99.1 | 96.3 | 97.4 | 90.8 | 94.6 | 93.5 | 98.4 |
| Trainer Aircraft | 95.2 | 91.8 | 98.2 | 98.1 | 96.7 | 96.4 | 95.5 | 96.1 | 92.3 | 97.0 |
| Chartered Aircraft | 96.1 | 96.4 | 93.7 | 94.2 | 94.8 | 93.4 | 93.7 | 95.1 | 89.2 | 95.5 |
| Fighter Aircraft | 100.0 | 97.0 | 95.5 | 98.2 | 99.5 | 99.5 | 87.3 | 89.3 | 96.7 | 98.2 |
| Others | 39.2 | 31.5 | 29.7 | 32.2 | 24.6 | 31.1 | 20.5 | 24.5 | 25.3 | 40.4 |
| Stair Truck | 52.5 | 45.1 | 48.9 | 45.1 | 38.3 | 40.7 | 44.0 | 48.5 | 40.7 | 43.3 |
| Pushback Truck | 42.7 | 26.1 | 34.2 | 32.5 | 26.3 | 43.8 | 23.0 | 39.2 | 30.8 | 48.9 |
| Helicopter | 100.0 | 81.8 | 92.1 | 84.0 | 82.5 | 77.9 | 69.3 | 70.3 | 59.3 | 85.3 |
| Boat | 94.6 | 91.0 | 98.1 | 98.5 | 98.2 | 98.1 | 97.3 | 98.2 | 96.0 | 98.5 |
Table 4.
Ablation Study Results.
| number | Experiment | Precision/% | Recall/% | mAP@0.5/% | FPS (f/s) | GFLOPS | Params (M) |
| 1 | YOLOv8n | 80.0 | 79.4 | 81.0 | 357.1 | 8.1 | 3.00 |
| 2 | YOLOv8n+AFGCAttention | 76.1 | 79.9 | 82.2 | 123.4 | 8.1 | 3.07 |
| 3 | YOLOv8n+AFGCAttention+CARAFE | 78.3 | 78.9 | 82.2 | 131.5 | 8.4 | 3.21 |
| 4 | YOLOv8n+AFGCAttention+CARAFE+C2f-DCNV2-MPCA | 84.0 | 77.0 | 82.7 | 126.5 | 8.3 | 3.24 |
| 5 | YOLOv8n+AFGCAttention+CARAFE+C2f-DCNV2-MPCA+GIoU | 85.0 | 75.3 | 83.0 | 111.1 | 8.3 | 3.24 |
Disclaimer/Publisher’s Note: The statements, opinions and data contained in all publications are solely those of the individual author(s) and contributor(s) and not of MDPI and/or the editor(s). MDPI and/or the editor(s) disclaim responsibility for any injury to people or property resulting from any ideas, methods, instructions or products referred to in the content. |
© 2024 by the authors. Licensee MDPI, Basel, Switzerland. This article is an open access article distributed under the terms and conditions of the Creative Commons Attribution (CC BY) license (https://creativecommons.org/licenses/by/4.0/).
Copyright: This open access article is published under a Creative Commons CC BY 4.0 license, which permit the free download, distribution, and reuse, provided that the author and preprint are cited in any reuse.


