
Submitted:
20 November 2024
Posted:
22 November 2024
Read the latest preprint version here
Abstract
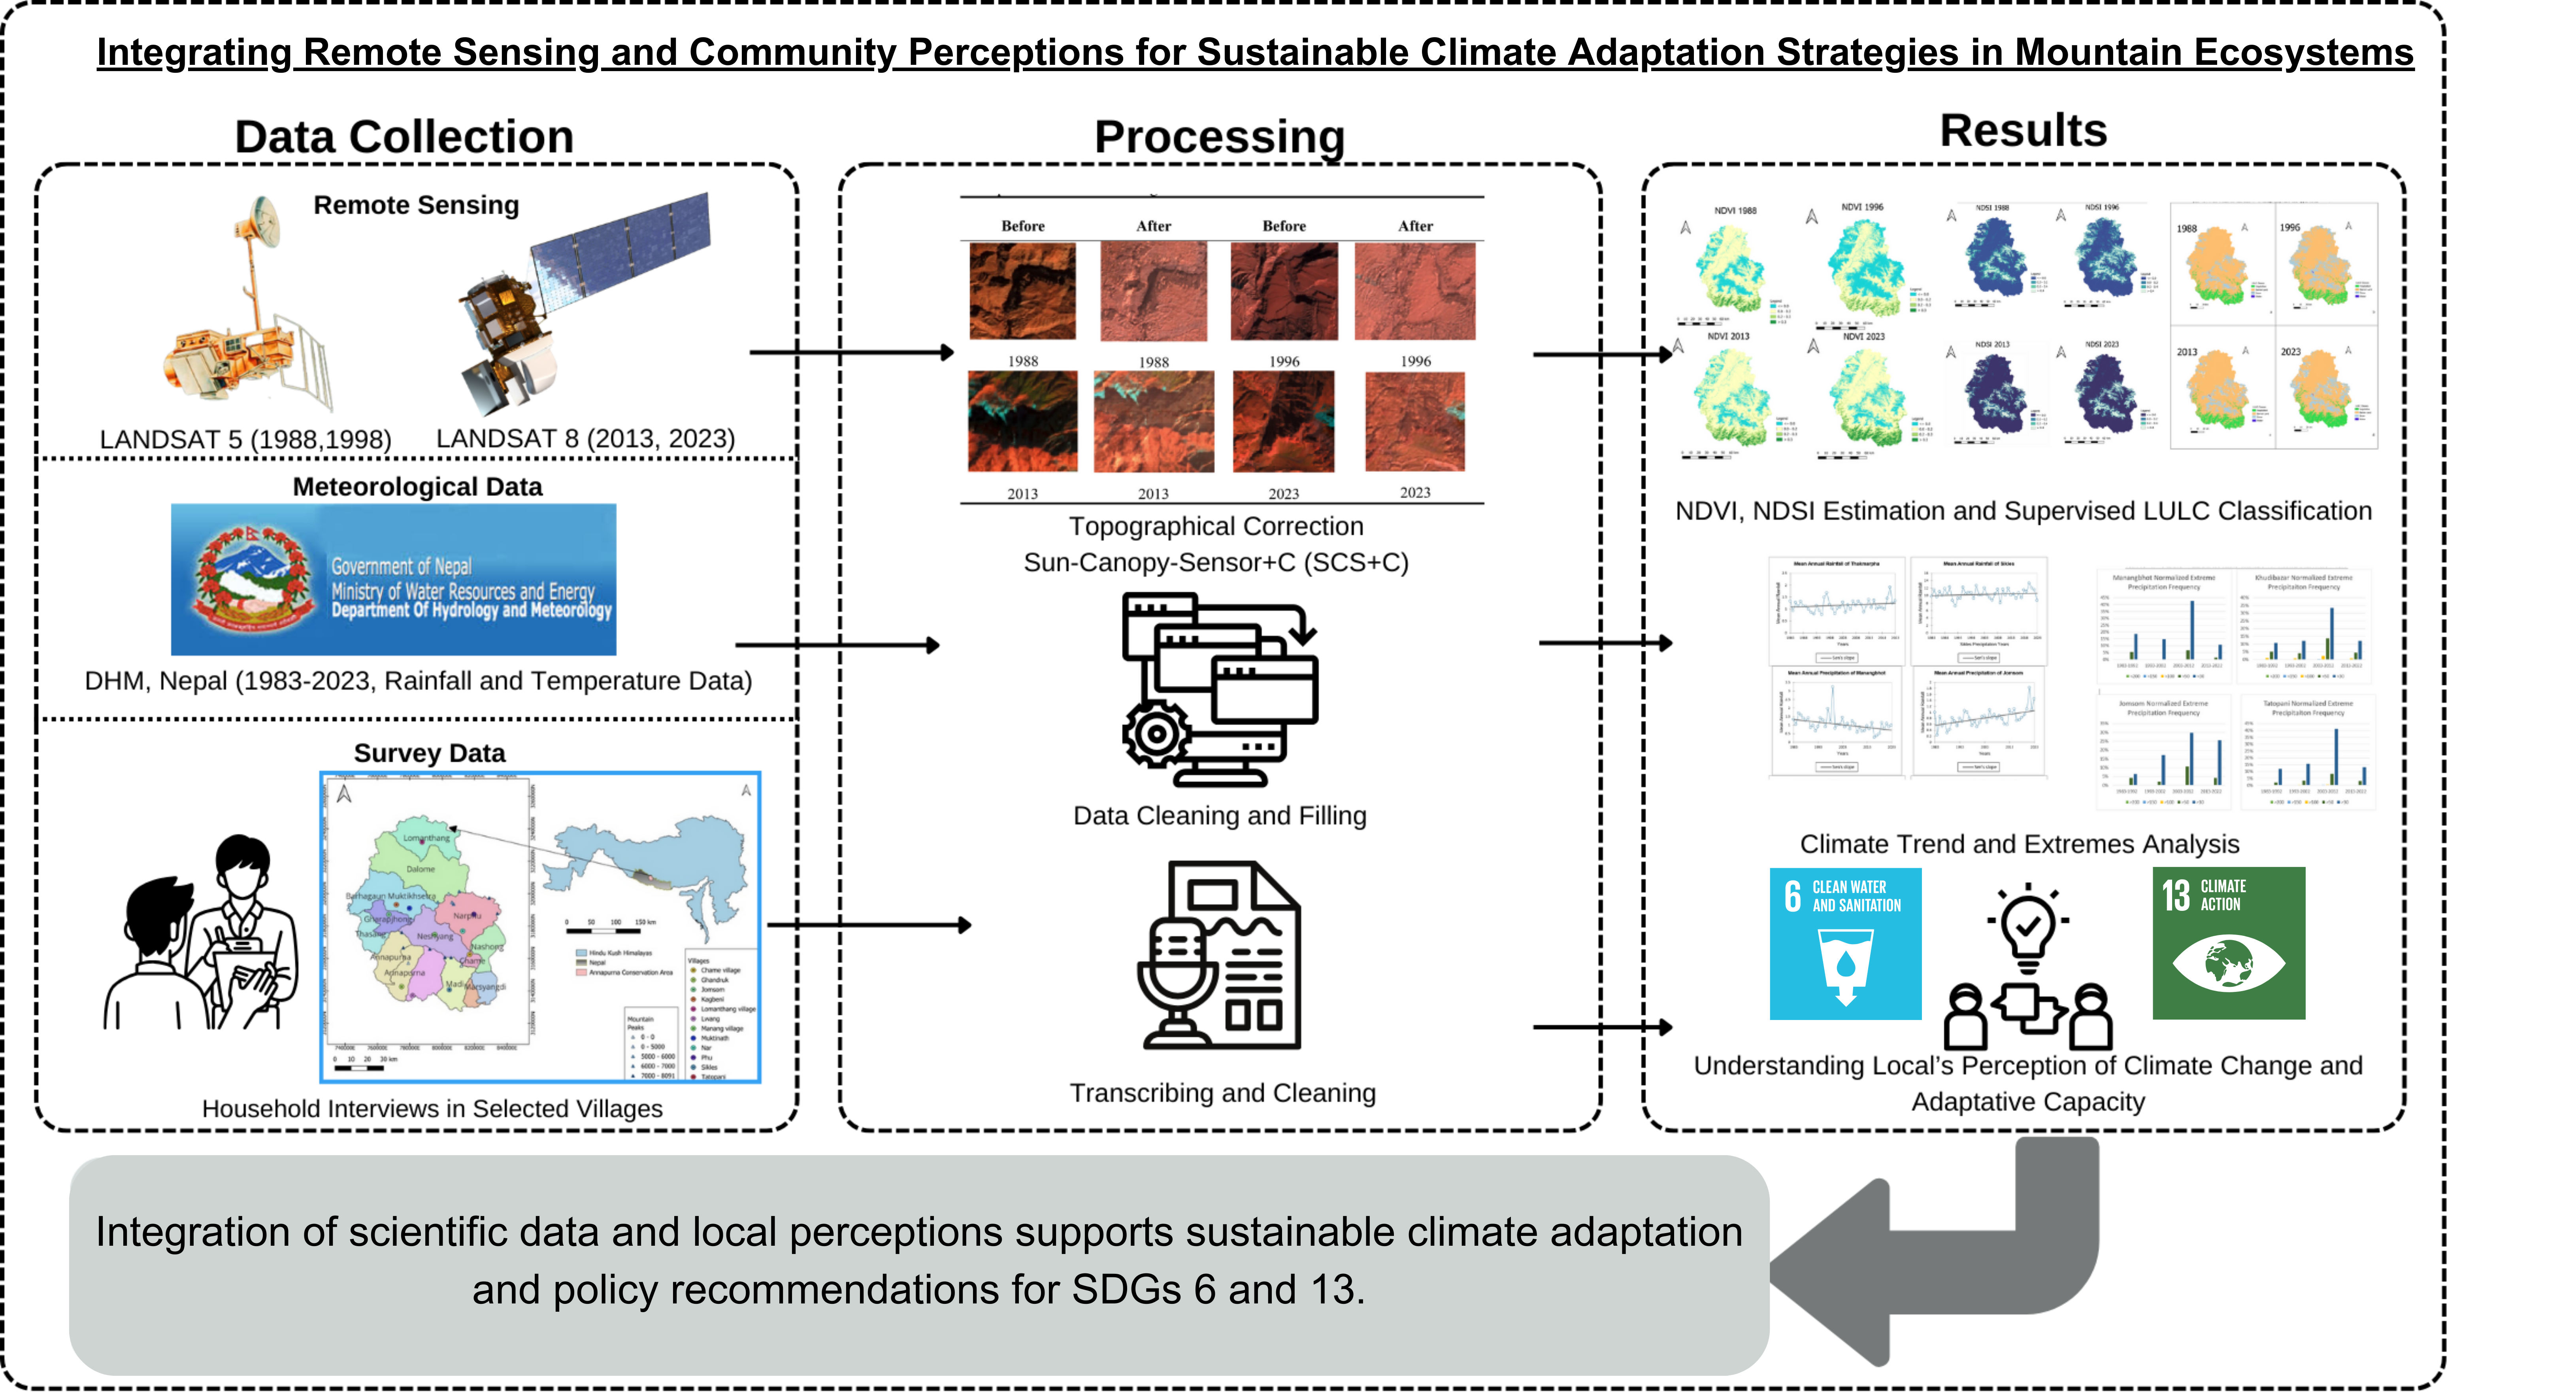
Mountain ecosystems, including Nepal’s Annapurna Conservation Area (ACA), are particularly vulnerable to climate change, affecting biodiversity, water resources, and community livelihoods. This study integrates remote sensing data, meteorological records, and local community insights over 35 years (1988–2023) to assess land use and land cover (LULC) changes and climate resilience strategies. Analysis of vegetation health (NDVI) and snow cover (NDSI) alongside community perceptions reveals a 13% increase in vegetation, reduced barren land, and notable adaptation practices, including water conservation and climate-adjusted agriculture. Findings highlight the importance of blending scientific data with local knowledge to drive sustainable resource management policies, contributing to SDGs 6 and 13. Policy recommendations emphasize the need for adaptive water management, resilient agricultural practices, and participatory conservation to support sustainable development in vulnerable mountain ecosystems.
Keywords:
Climate Change Adaptation
; Remote Sensing
; Land Use and Land Cover (LULC)
; Mountain Ecosystems
; Vegetation Health
; Snow Cover
; Community Perceptions
; Sustainable Resource Management
; Annapurna Conservation Area (ACA)
; SDG 6 (Clean Water and Sanitation)
; SDG 13 (Climate Action)
1. Introduction
Mountain ecosystems are among the most sensitive environments to climate change, acting as critical indicators of global environmental shifts due to their complex topography and climatic diversity [1] . They serve as vital "water towers" for the planet, supplying freshwater to billions of people and supporting rich biodiversity [2,3,4]. The Annapurna Conservation Area (ACA) in Nepal, the country's largest protected area, exemplifies these characteristics by encompassing ecosystems ranging from subtropical lowlands to high-altitude alpine regions [5].
Recent studies have documented accelerated glacier melt, shifting vegetation patterns, and increased frequency of extreme weather events in mountainous regions and call for mountain specific conservation and adaptation policies [4,6,7]. In the ACA, such climatic changes pose significant threats to its rich biodiversity, including endangered species like the snow leopard and red panda. Furthermore, these changes affect the livelihoods of local communities who rely on the region's natural resources and have historically adapted to its diverse climatic conditions [5,7,8].
While existing research has examined aspects of climate change impacts in the ACA—such as land use and land cover (LULC) changes, vegetation health, and meteorological trends—these studies often analyze these factors in isolation [9,10]. There is a critical need for an integrated approach that combines remote sensing data with community perceptions to develop sustainable climate adaptation strategies.
Objectives of the Study
This study aims to fill this gap by providing a comprehensive analysis of LULC changes and climate resilience in the ACA over a 35-year period (1988–2023). By integrating high-resolution Landsat satellite imagery, detailed meteorological data, and extensive community surveys, the research seeks to:
- Detect Patterns of LULC Changes: Utilize satellite imagery to analyze shifts in vegetation, snow cover, barren land, and water bodies.
- Assess Vegetation Health and Snow Cover Trends: Employ the Normalized Difference Vegetation Index (NDVI) and Normalized Difference Snow Index (NDSI) to monitor environmental changes.
- Analyze Climate Variability: Examine temperature and precipitation trends using meteorological data.
- Understand Community Perceptions and Adaptive Strategies: Gather insights from local residents on climate change impacts and their responses.
By synthesizing these diverse data sources, the study aims to inform sustainable resource management and policy interventions, enhancing climate resilience in this vulnerable region. This research supports the United Nations Sustainable Development Goals (SDGs), particularly SDG 6 (Clean Water and Sanitation) and SDG 13 (Climate Action), by offering actionable insights into climate adaptation in mountain ecosystems.
2. Materials and Methods
2.1. Study Area
The Annapurna Conservation Area (ACA) is located in central Nepal, stretching from 28°13' N to 29°19' N latitude and 83°29' E to 84°53' E longitude (Figure 1). Encompassing an area of 7,629 square kilometers, the ACA exhibits a diverse range of ecosystems, from subtropical lowlands at elevations of about 1,000 meters to alpine regions exceeding 8,000 meters [5]. The region is characterized by significant climatic variation and supports a wide array of flora and fauna, including several endangered species. Figure 1 illustrates the geographical extent of the Annapurna Conservation Area (ACA), highlighting selected villages that represent the diverse ecological and climatic conditions within the study region.
2.2. Data Collection
2.2.1. Remote Sensing and GIS Analysis
Satellite Imagery Acquisition: Landsat satellite imagery from 1988 to 2023 was utilized to detect LULC changes in the ACA. Landsat Collection 2 Level-2 images were acquired from the United States Geological Survey (USGS) Earth Resources Observation and Science (EROS) Center Science Processing Architecture (ESPA) on-demand interface, which provides data preprocessed for atmospheric correction using the Landsat Ecosystem Disturbance Adaptive Processing System (LEDAPS) algorithm.
Table 1 outlines the key specifications of the Landsat satellite imagery utilized for this study, including acquisition dates, sensor types, and cloud cover. To ensure consistency, images were selected from the winter dry season months of November and December, minimizing the effects of cloud cover and seasonal vegetation changes.
Topographic Correction: Given the mountainous terrain of the ACA, topographic effects were minimized using the Sun-Canopy-Sensor plus C (SCS+C) correction method [11]. This method accounts for the influence of terrain on illumination conditions, improving the accuracy of subsequent analyses[12]. Equation 1 shows the SCS+C correction formula used to mitigate topographic influence and enhance the accuracy of reflectance in the Landsat images.
The method utilizes the solar zenith angle (θ), the terrain's slope (α), and the solar incidence angle (i) to normalize the reflectance values () from the uncorrected reflectance (L).
Land Cover Classification
Supervised classification was performed using the Maximum Likelihood algorithm. Training samples were selected for four major LULC classes: Vegetation, Snow Cover, Barren Land, and Water Bodies. Classification accuracy was assessed using confusion matrices and overall accuracy metrics.
Calculation of Indices
The Normalized Difference Vegetation Index (NDVI) and Normalized Difference Snow Index (NDSI) were calculated to assess changes in vegetation health and snow cover, respectively, using Equations (2) and (3), where B represents the band number:
For Landsat 5 TM:
For Landsat 8 OLI:
2.2.2. Meteorological Data
Temperature and precipitation data were obtained from the Department of Hydrology and Meteorology (DHM) of Nepal for six meteorological stations within the ACA (Table 2). Data spanning from 1983 to 2023 were collected, allowing for a comprehensive analysis of climatic trends.
2.2.3. Community Surveys
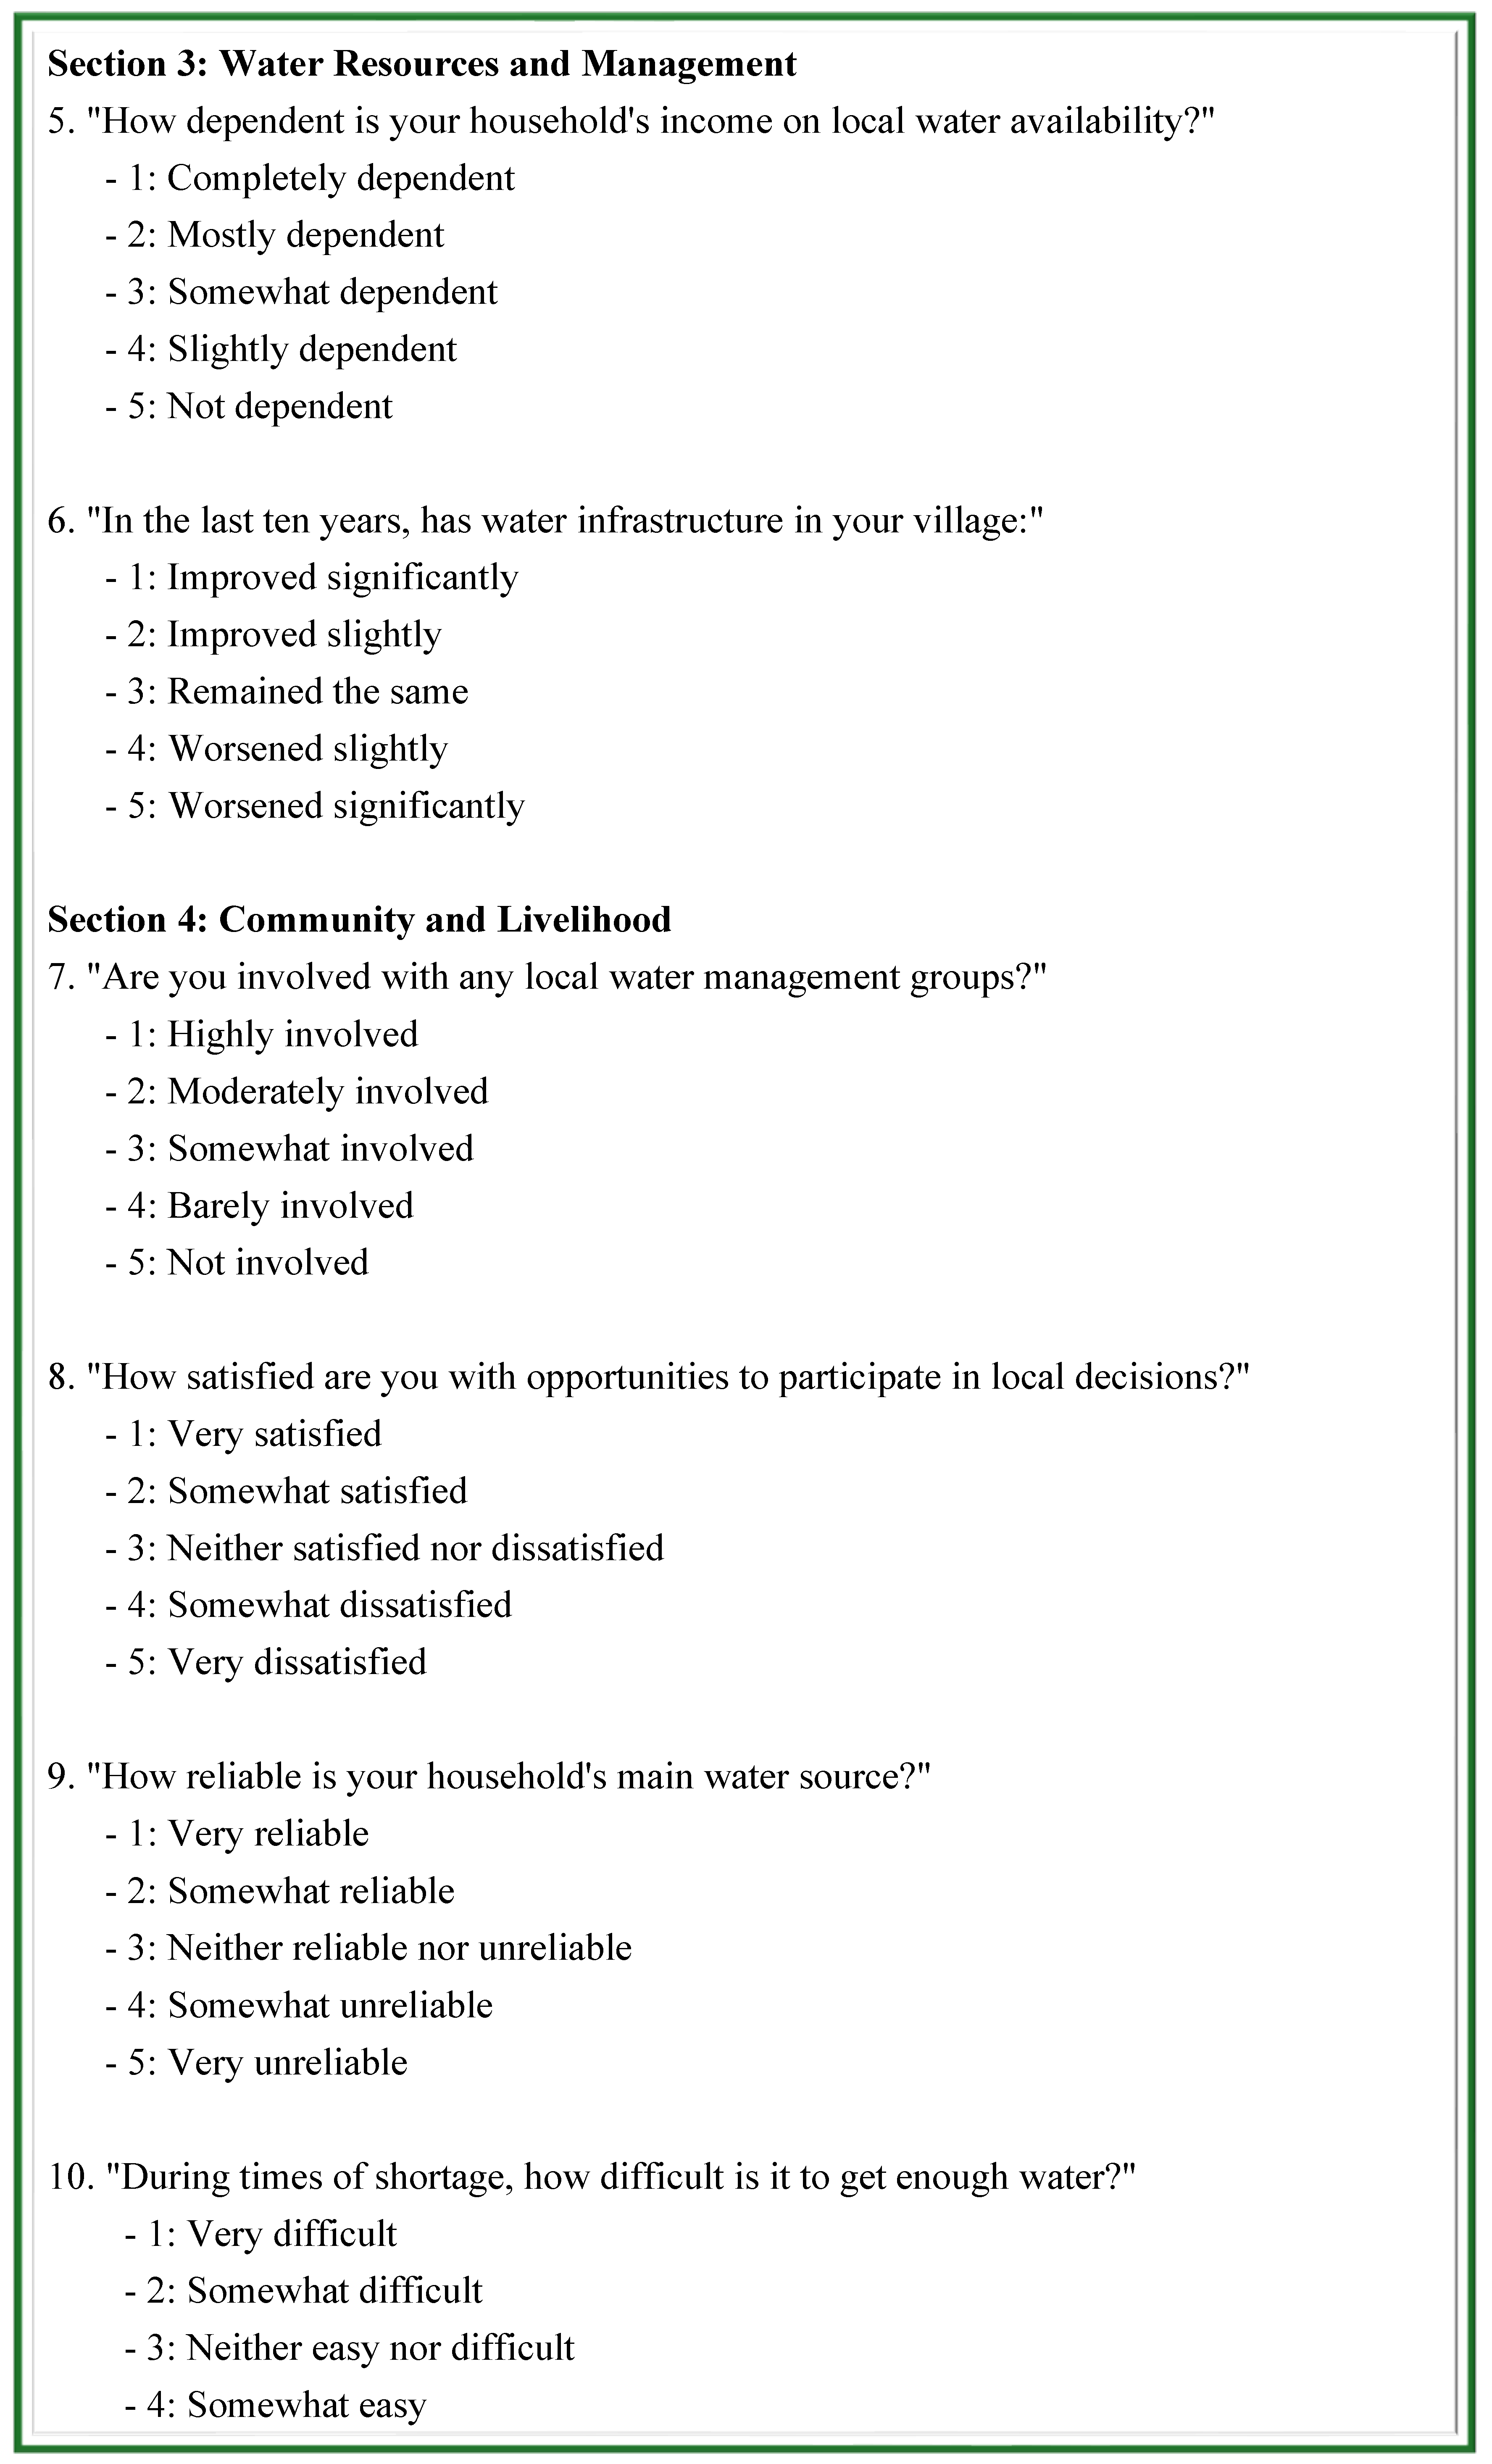
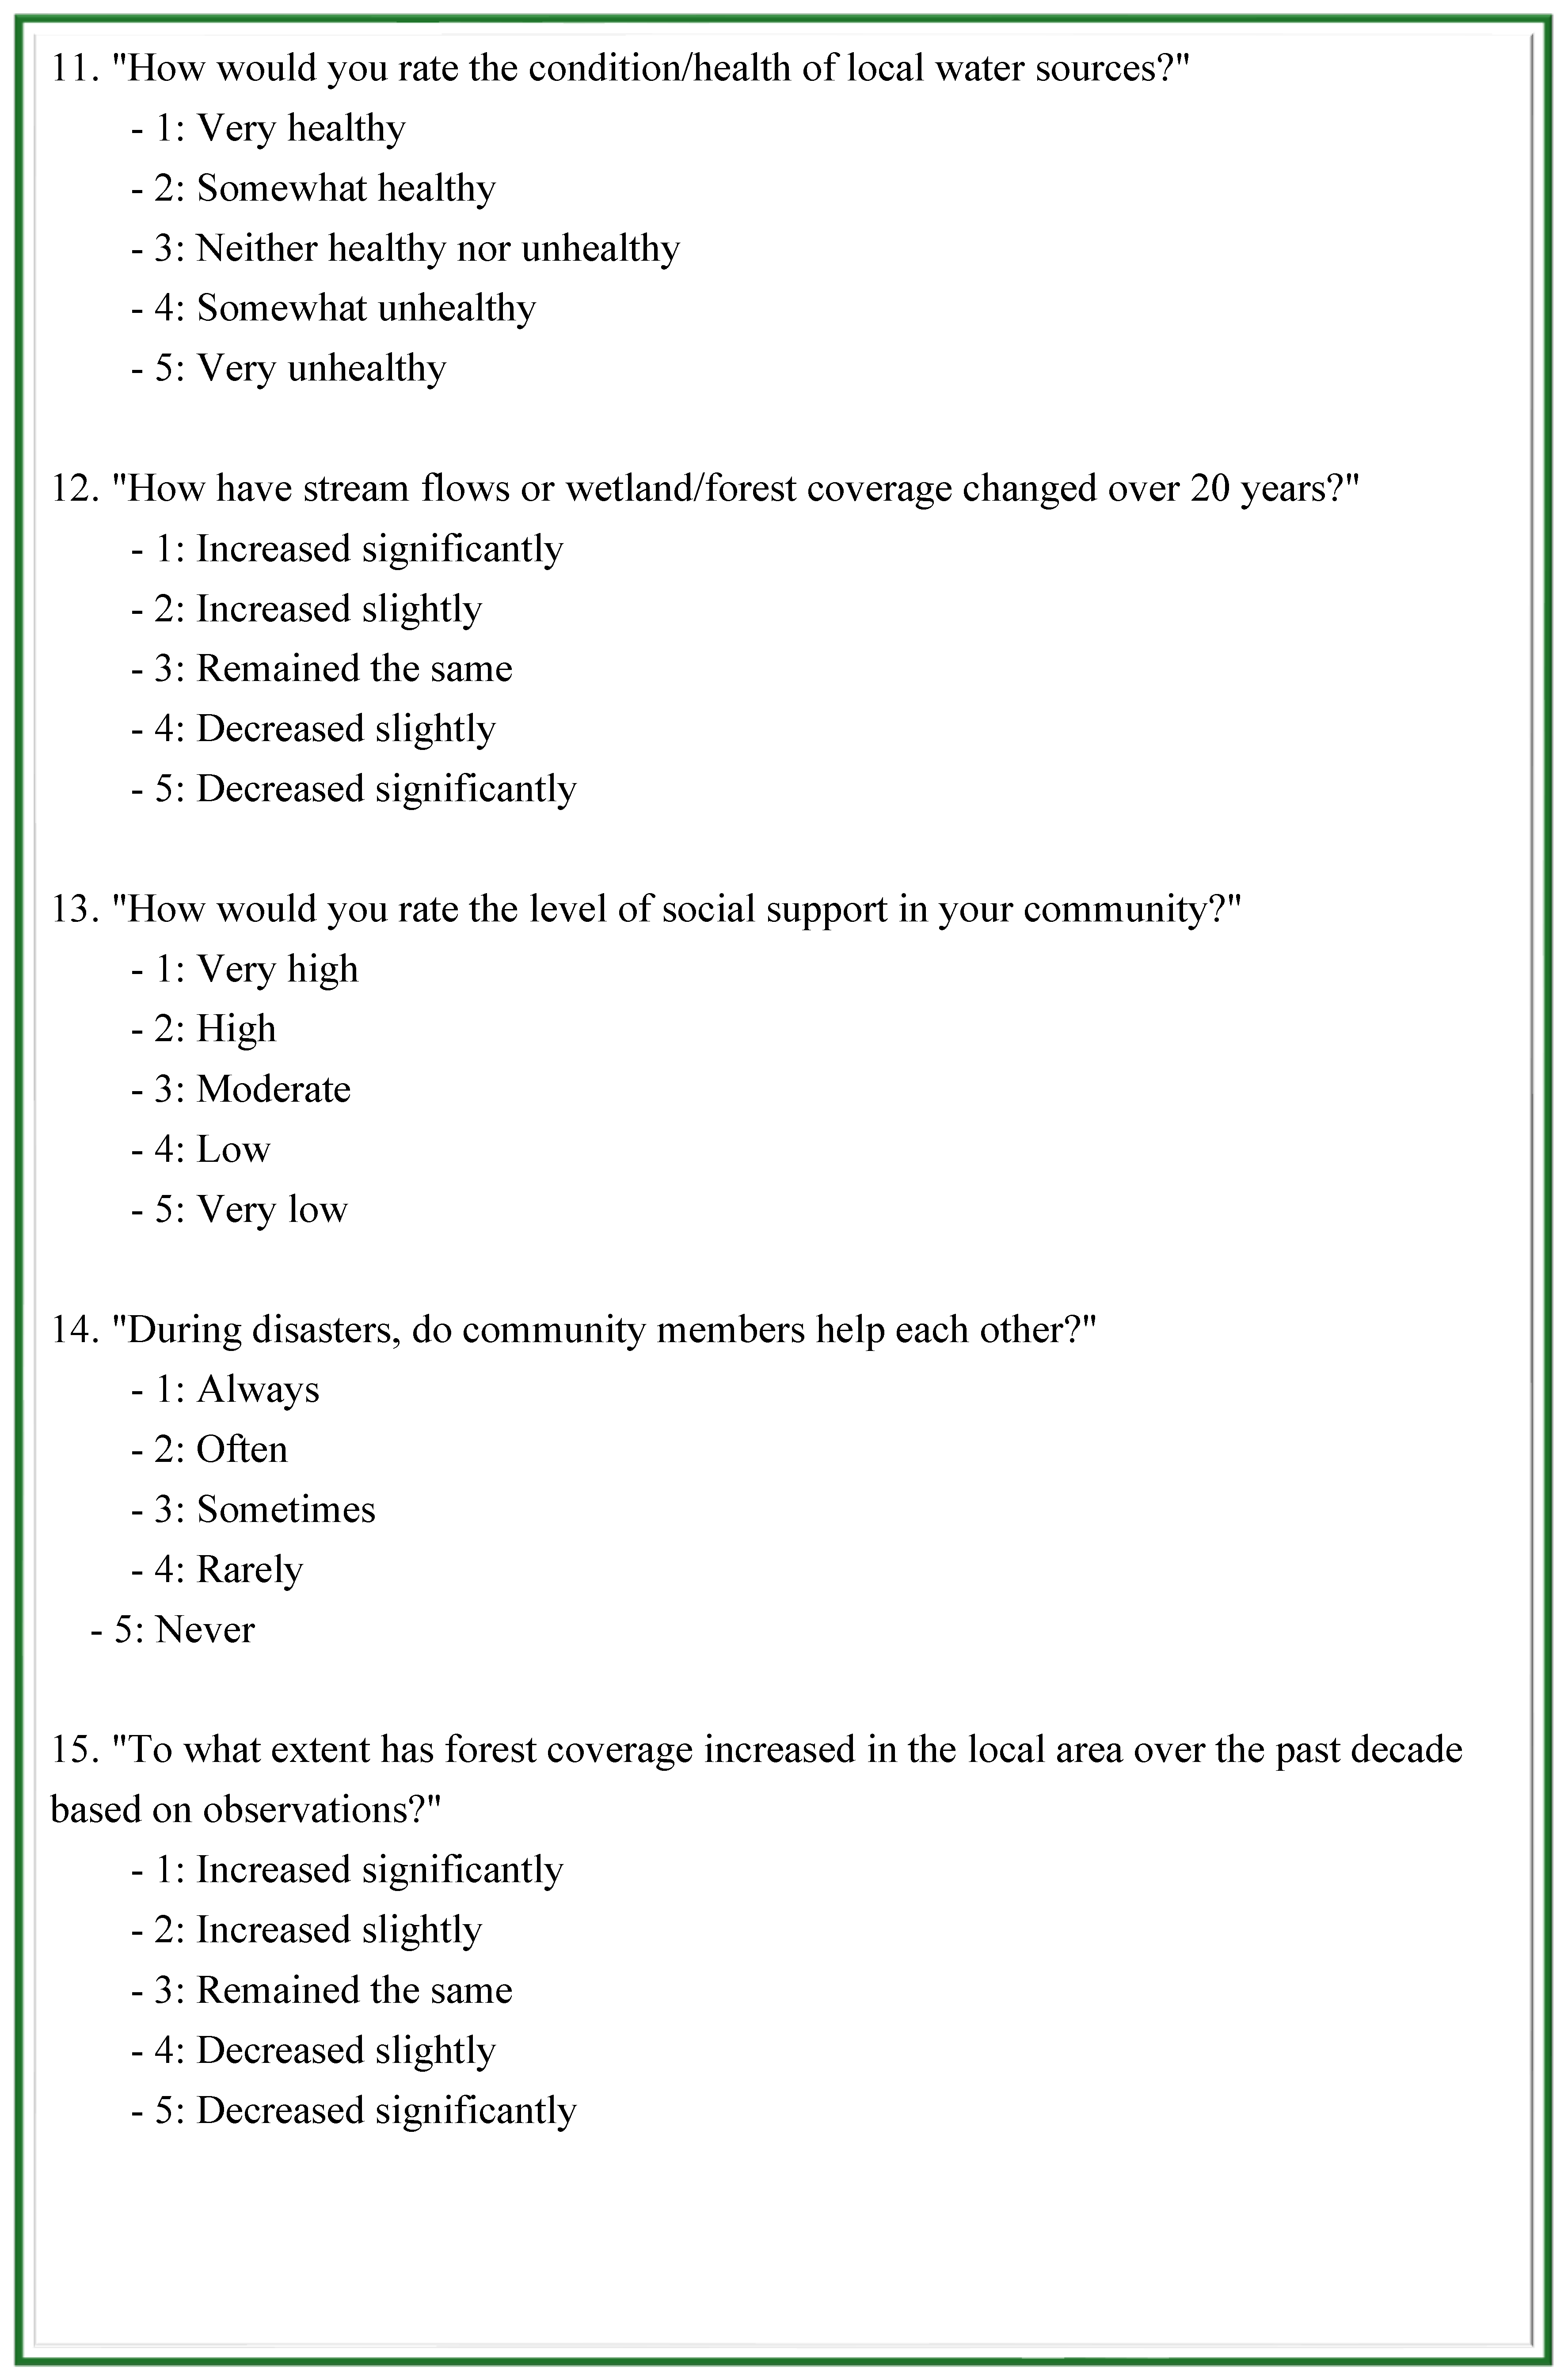
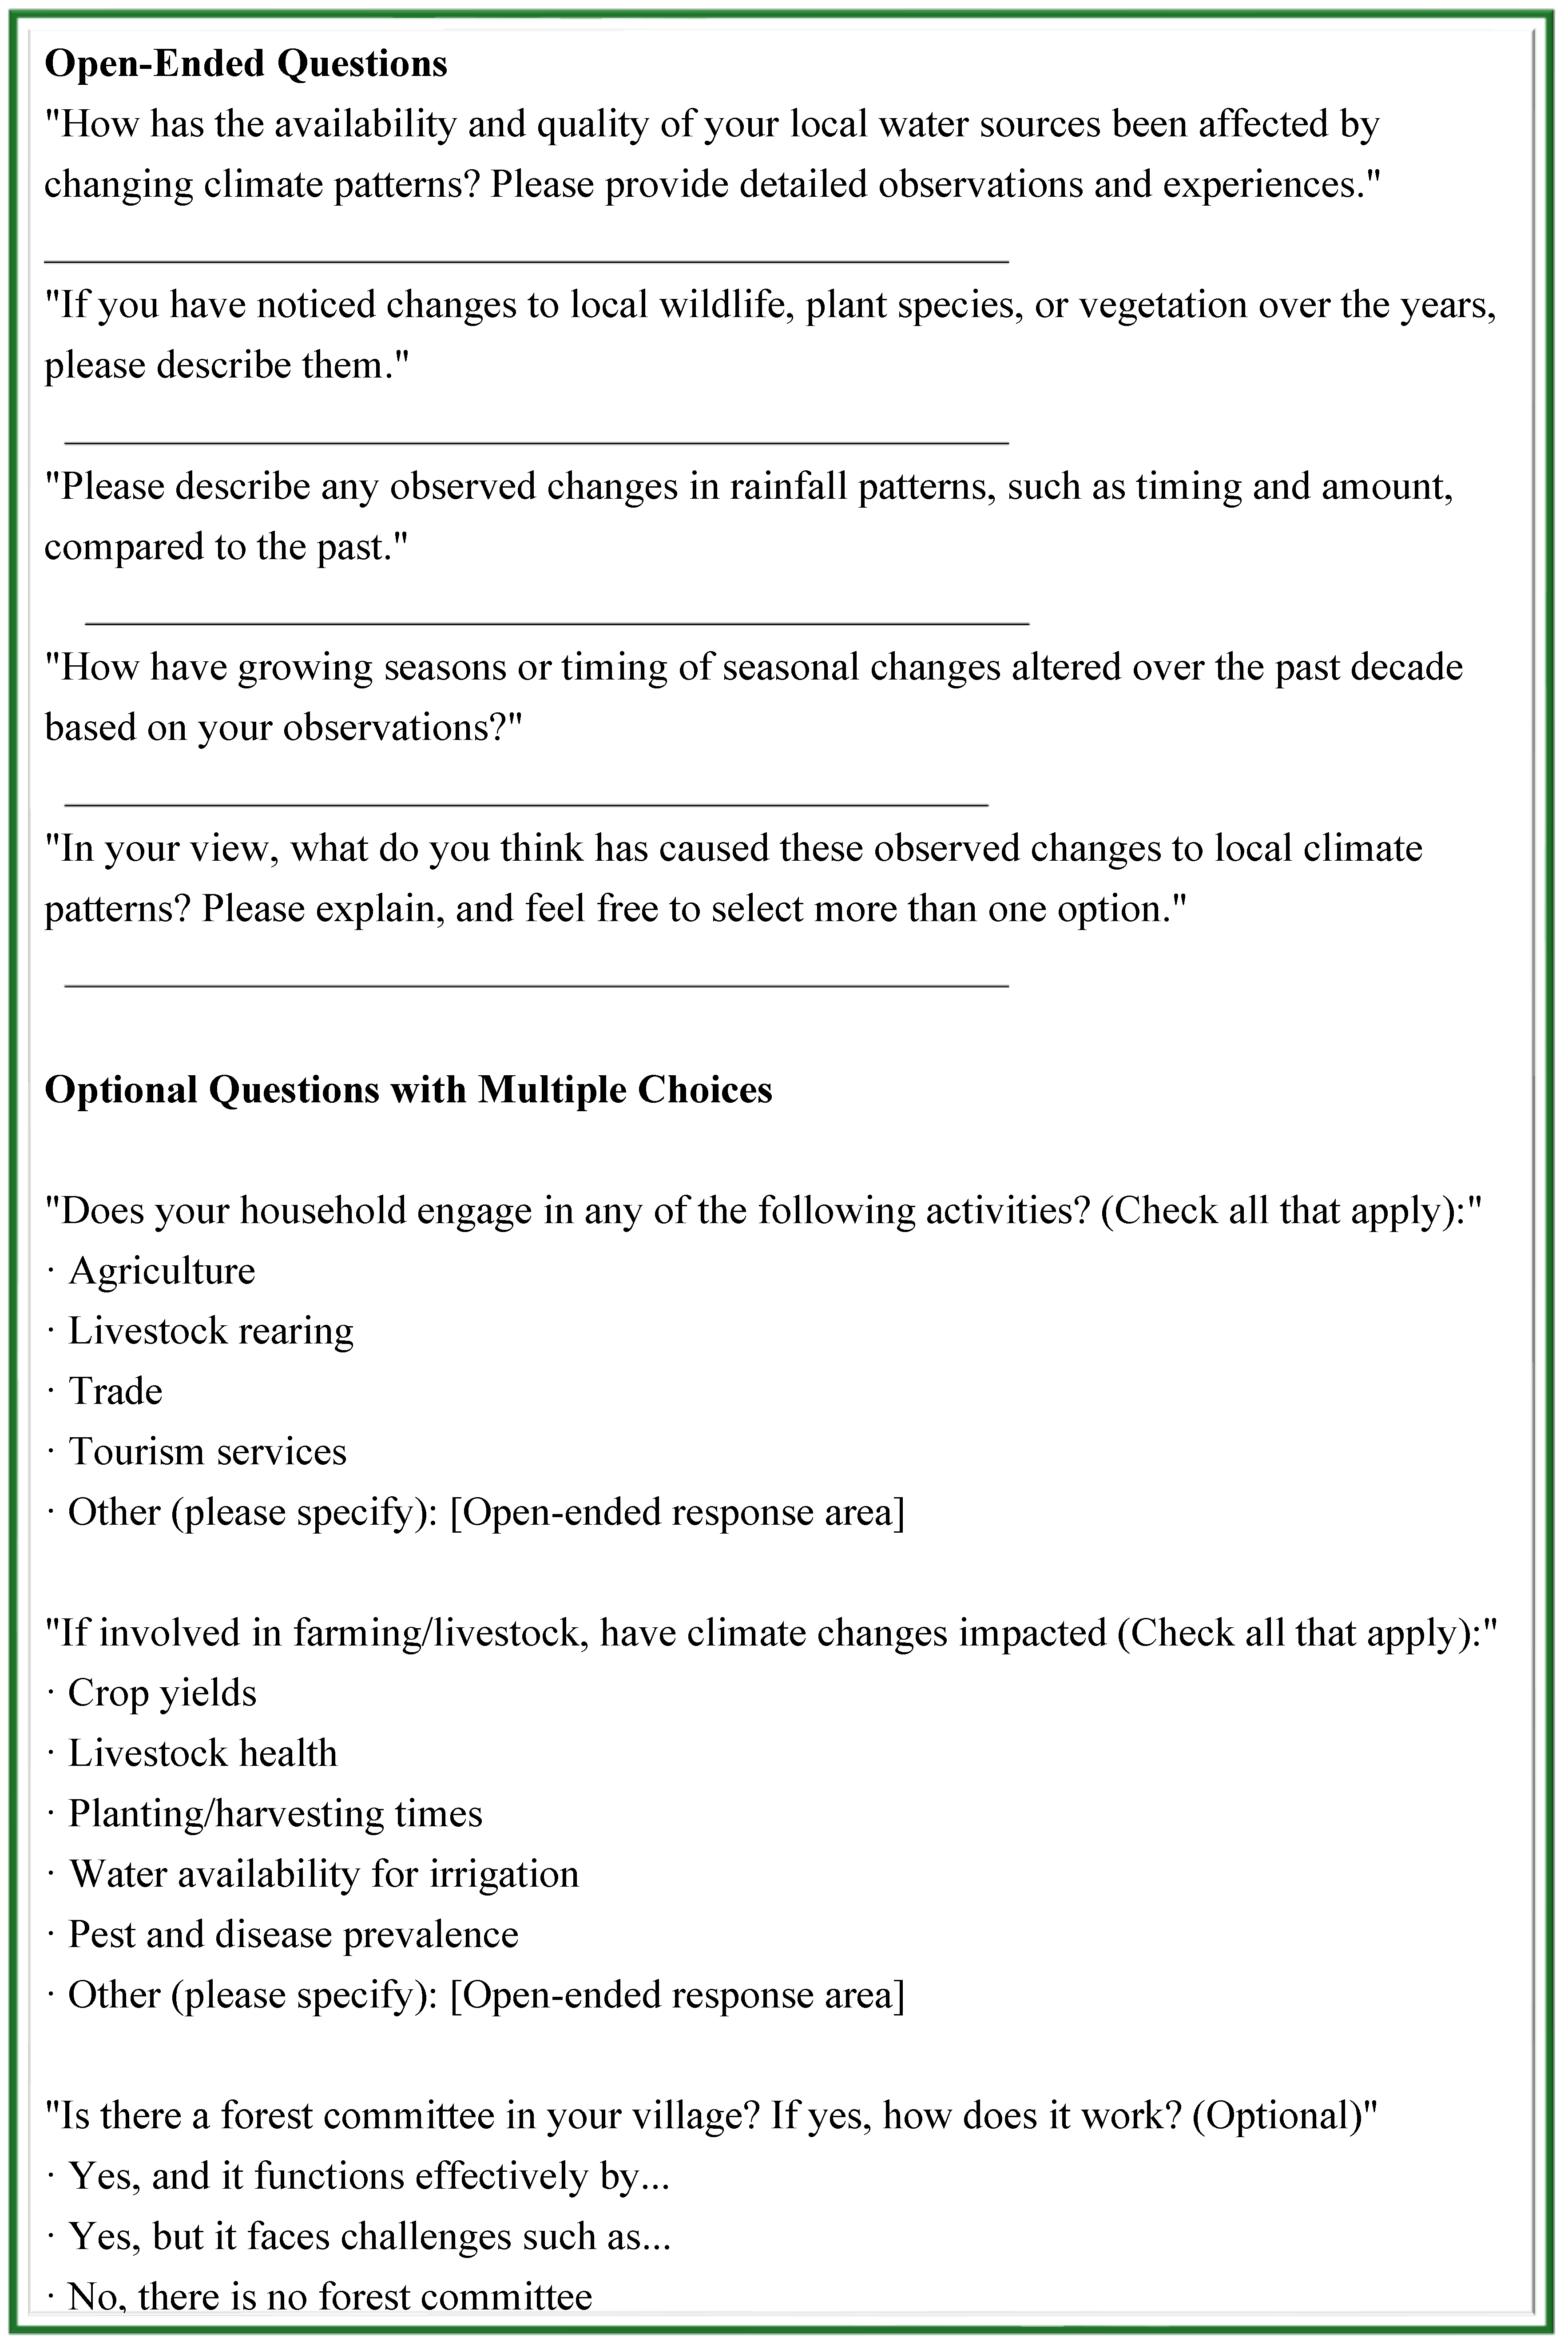
Structured interviews were conducted with residents from 11 villages within the ACA to understand local perceptions of climate change and adaptive strategies. A total of 110 respondents were surveyed, representing diverse demographics and occupations. The villages were selected to include wide range of ecosystem and climatic conditions within the ACA region.
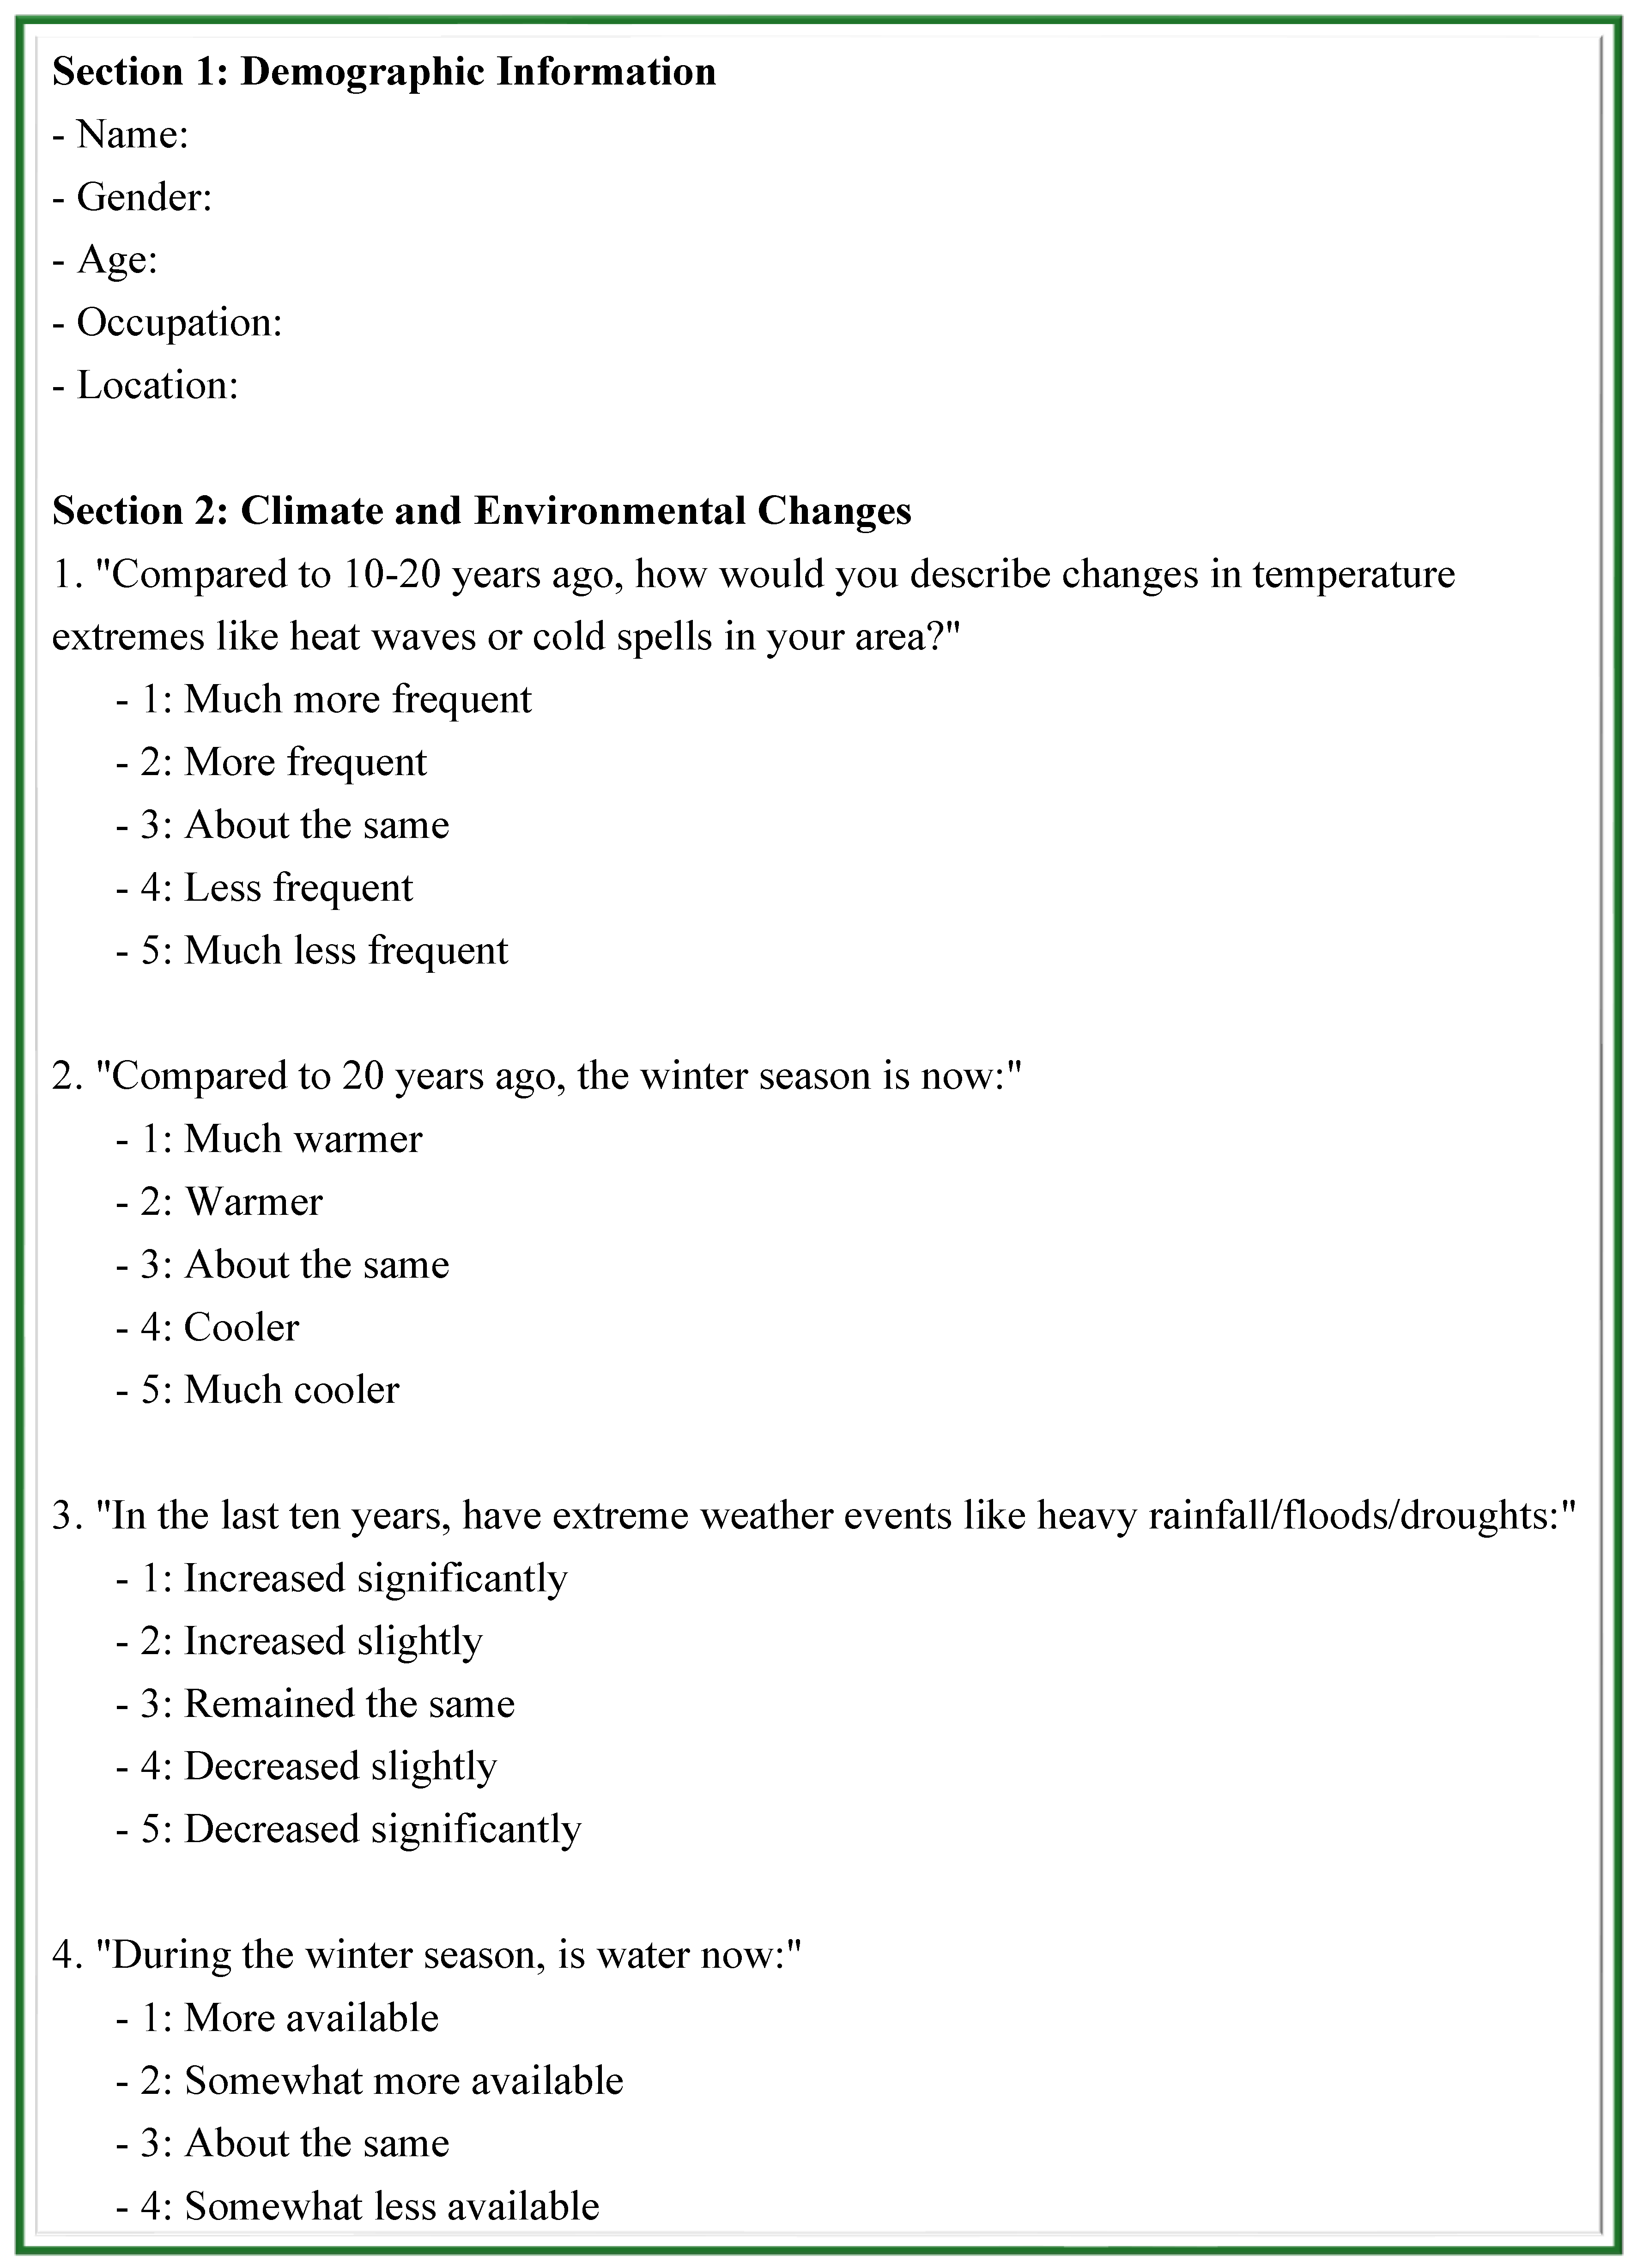
The survey questionnaire included sections on:
- Observed climatic changes (temperature, precipitation, snowfall).
- Impacts on water resources and agriculture.
- Adaptive measures undertaken by the community.
- Awareness of government policies and support mechanisms.
2.3. Data Analysis
2.3.1. LULC Change Analysis
The classified images were analyzed to detect changes in land cover over time. Area statistics for each LULC class were calculated, and change detection was performed to quantify transitions between classes. Classification accuracy was evaluated, and any misclassifications were corrected by refining training samples and reclassifying.
2.3.2. NDVI and NDSI Analysis
Spatial and temporal variations in NDVI and NDSI were assessed. Mean, maximum, and minimum values were calculated for each year.
2.3.3. Climate Data Analysis
Temperature and precipitation trends were analyzed Mann-Kendall trend tests (Equation 4) and Sen-Slope Estimators. Anomalies and deviations from long-term averages were identified to assess climate variability and trends. Seasonal and annual variations were also examined to understand the impact on water resources and ecosystems.
2.3.4. Community Survey Analysis
Survey responses were coded and entered into a database for quantitative analysis. Descriptive statistics were used to summarize the data. Qualitative responses were analyzed thematically to identify common perceptions and adaptive strategies.
2.4. Ethical Considerations
Informed consent was sought from all participants, ensuring confidentiality and adherence to ethical guidelines for research involving human subjects. The study was conducted following all applicable guidelines and with the approval of the Department of National Parks and Wildlife Conservation (DNPWC) and Annapurna Conservation Area Project (ACAP), ensuring that the study's design and execution complied with national conservation laws and respected the ecological and cultural integrity of the area.
3. Results
In this section, we present the findings from the analysis of satellite imagery, meteorological data, and community surveys conducted in the Annapurna Conservation Area (ACA) over the 35-year period from 1988 to 2023.
3.1. Land Use and Land Cover (LULC) Changes
The supervised classification of Landsat images for the years 1988, 1996, 2013, and 2023 revealed significant changes in the distribution of land cover classes as shown in Figure 2. Table 3 provides a quantitative analysis of changes in LULC classes over the study period, revealing key trends such as the expansion of vegetation cover and reductions in barren land.
- Increase in Vegetation Cover: Vegetation cover increased by approximately 13%, from 35% of the total area in 1988 to 48% in 2023.
- Fluctuations in Snow Cover: Snow cover showed significant variability, peaking in 1996 and decreasing in subsequent years.
- Reduction in Barren Land: Barren land decreased from 40% in 1988 to 30% in 2023, indicating land reclamation and afforestation efforts.
- Minor Changes in Water Bodies: The area covered by water bodies remained relatively stable, with slight increases and decreases over the years.
3.2. Vegetation Health and Snow Cover Trends
The Normalized Difference Vegetation Index (NDVI) was calculated to assess vegetation health.
NDVI values show a clear upward trend, indicating improved vegetation health over the study period. NDVI values increased significantly, with the highest values observed in 2023 (up to +0.98) compared to the lowest in 1988 (up to +0.46) as shown in Table 4. Areas with high NDVI values expanded over time. This expansion could be attributed to multiple factors, including successful conservation efforts leading to afforestation and natural regrowth, as well as climate-induced changes such as warming temperatures and loss of snow cover, allowing vegetation to establish in previously snow-covered or barren areas. The upward shift of vegetation zones due to warming temperatures may have contributed to increased NDVI values at higher elevations, reflecting changes in ecosystem composition.
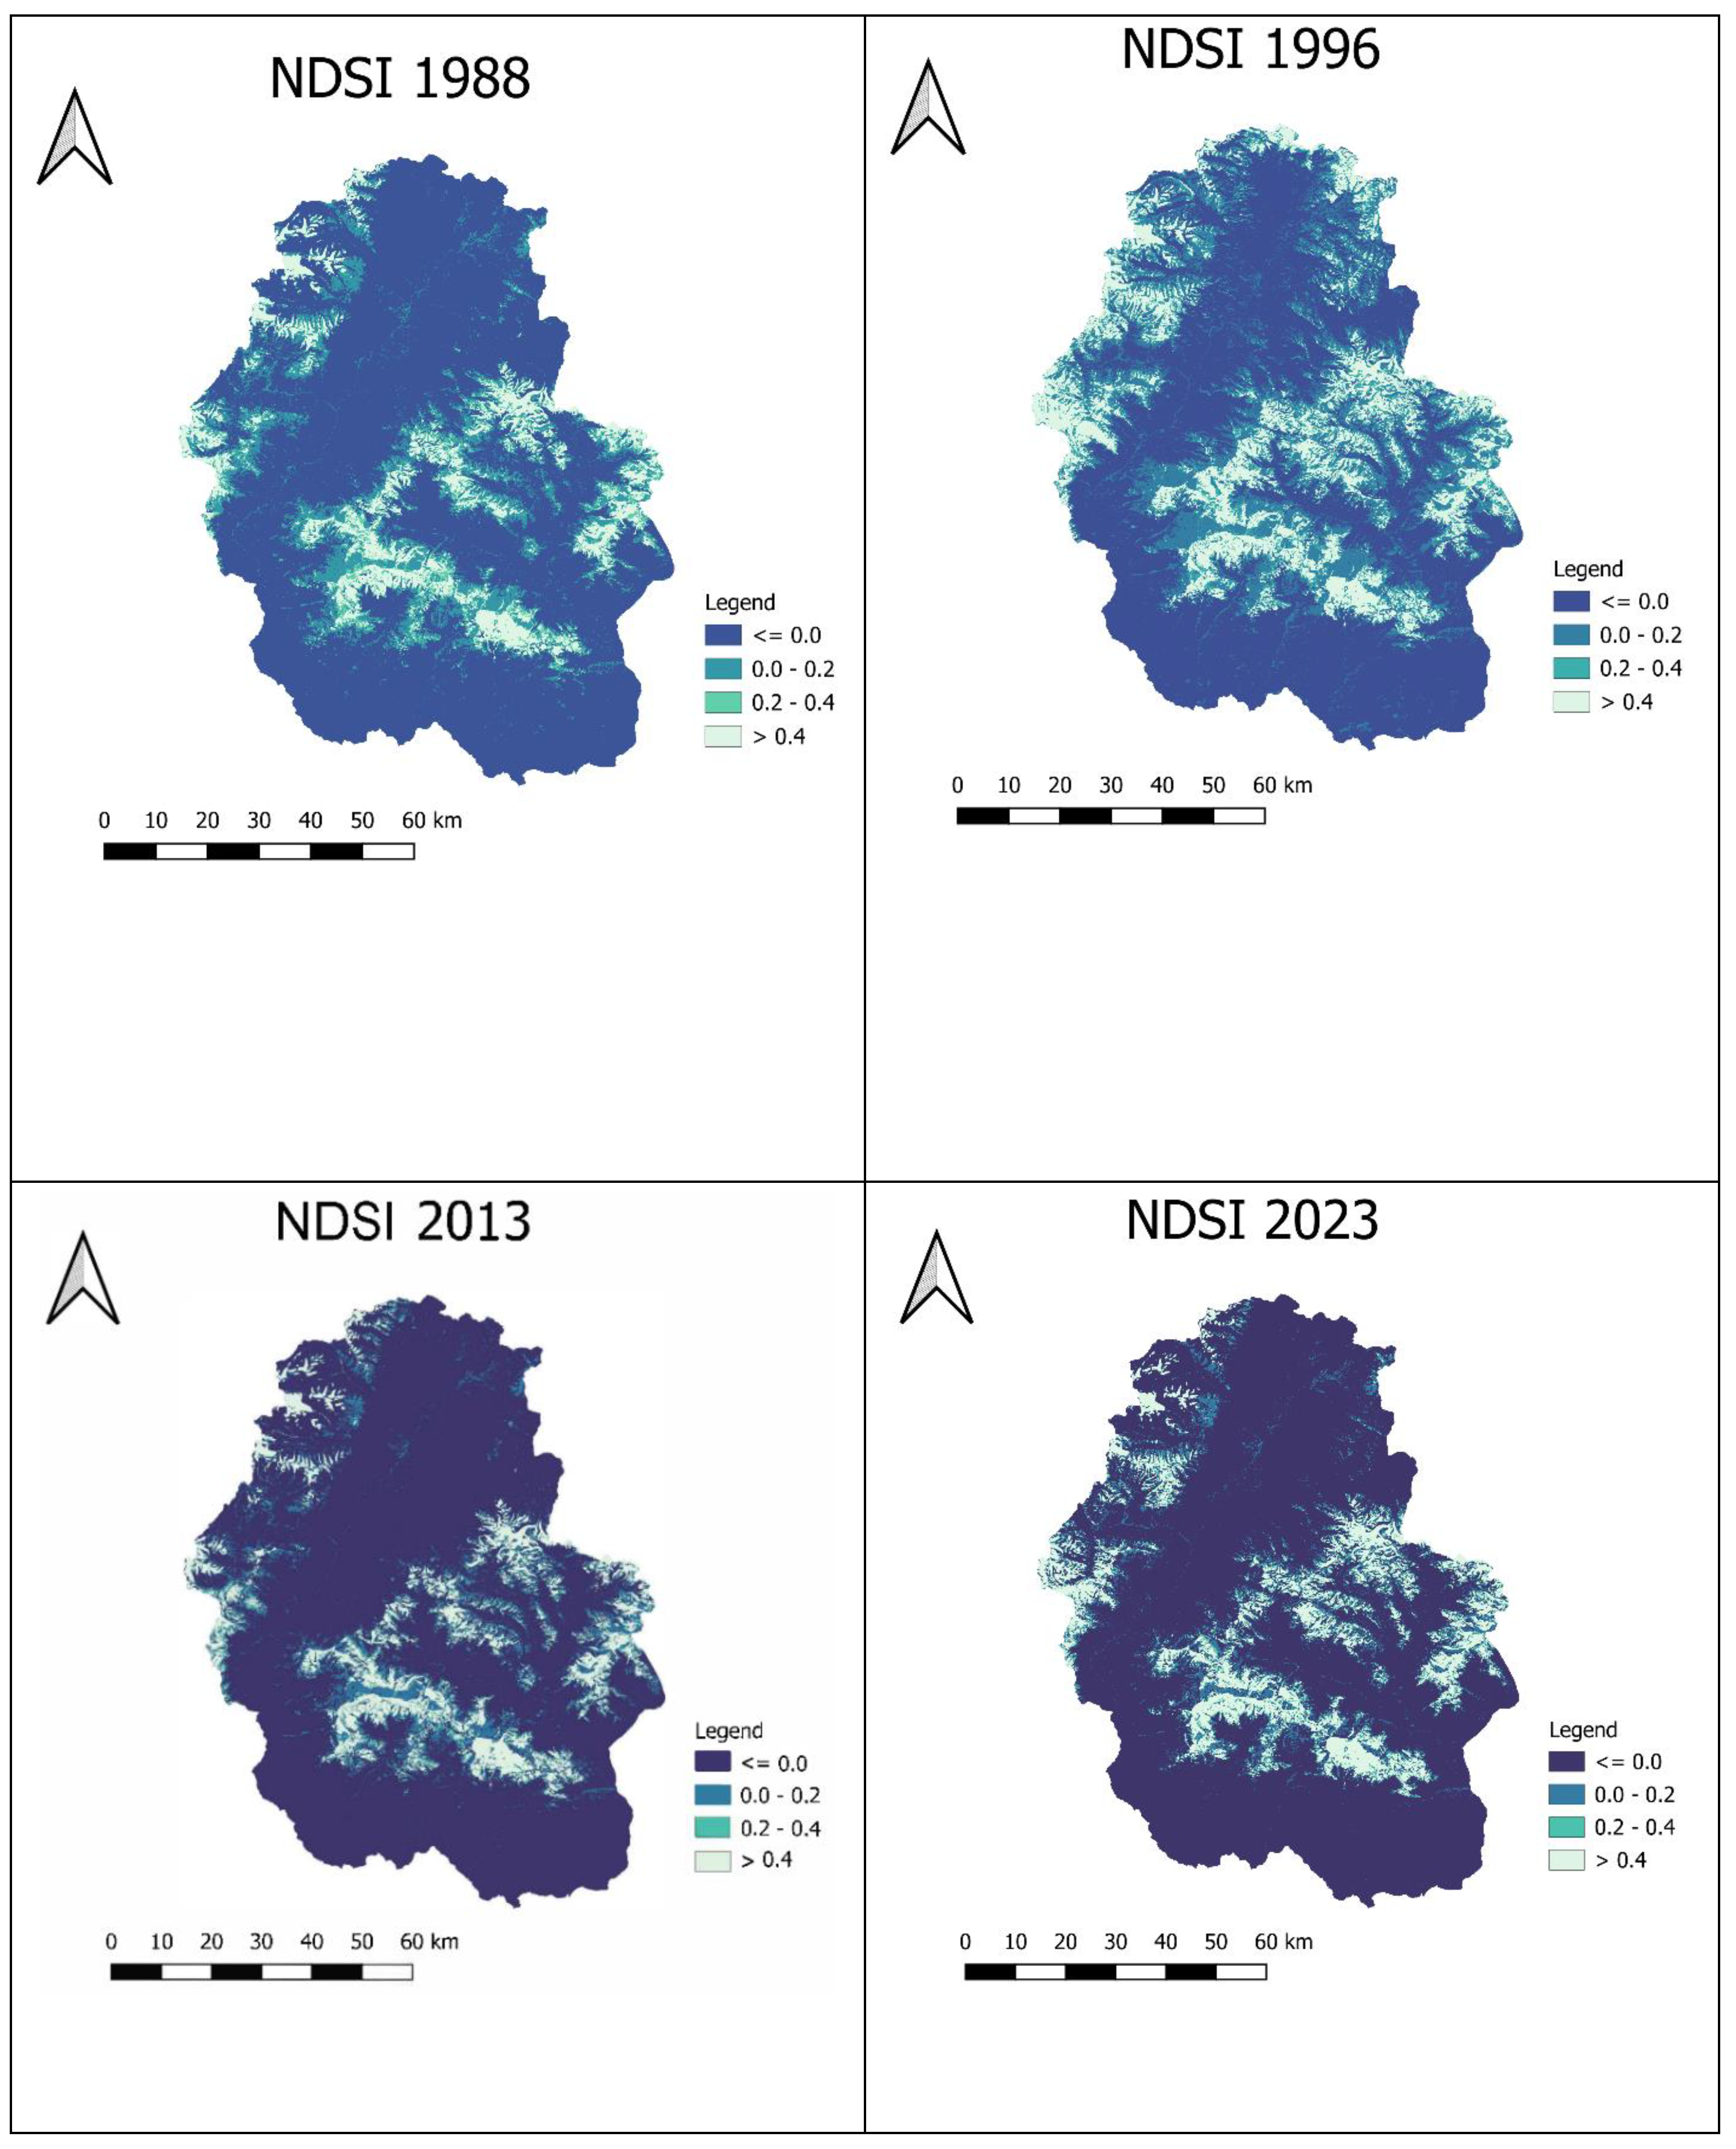
For NDSI, the values in 2023 and 2013 averaged -0.109 and -0.094, respectively, suggesting a lower range of snow cover. The earlier years, 1996 and 1988, showed average values of 0.176 and 0.157, respectively, more than that of later years. For details, check Appendix A. Table 4 presents the minimum, maximum, and average NDVI and NDSI values.
3.3. Climate Variability Analysis
3.3.1. Temperature Trends
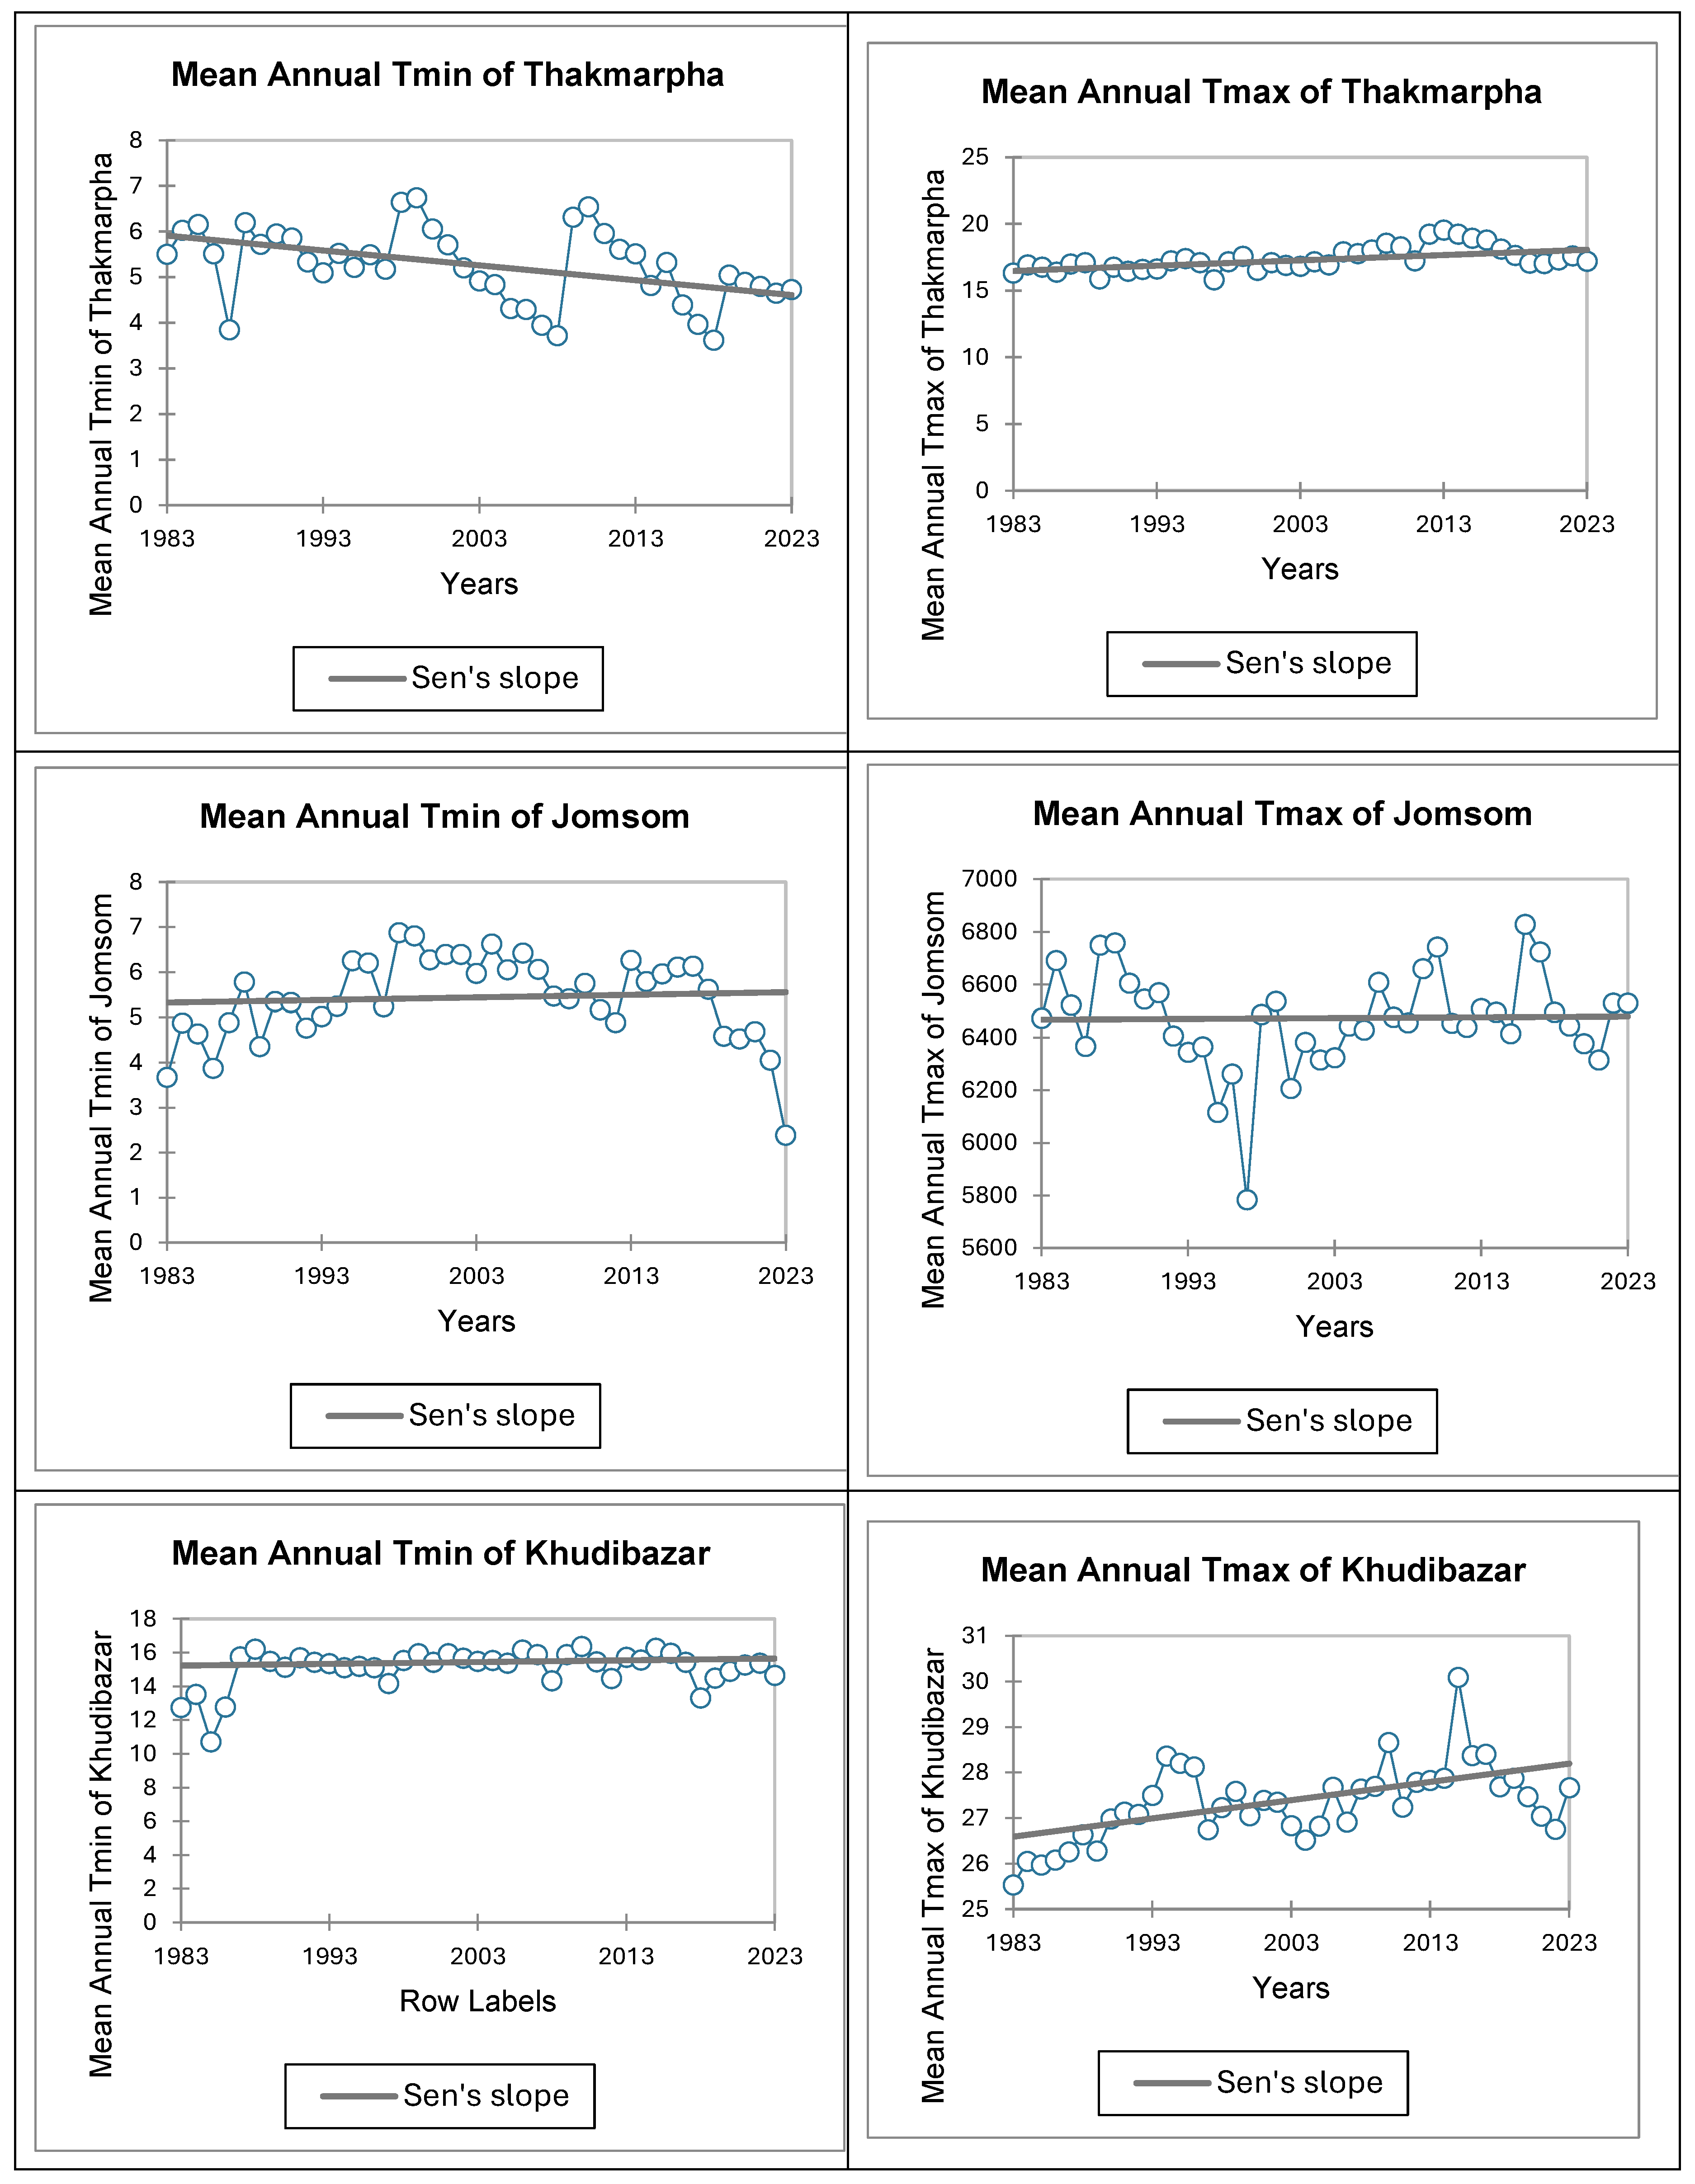
Temperature data from the meteorological stations were analyzed to identify trends in maximum (Tmax) and minimum (Tmin) temperatures. Figure 3 visualizes the annual mean maximum (Tmax) and minimum (Tmin) temperatures from 1983 to 2023, capturing long-term climatic trends and variability across the ACA.
Figure 3.
Annual mean Tmax and Tmin for Thakmarpha, Jomsom, and Khudi Bazar.
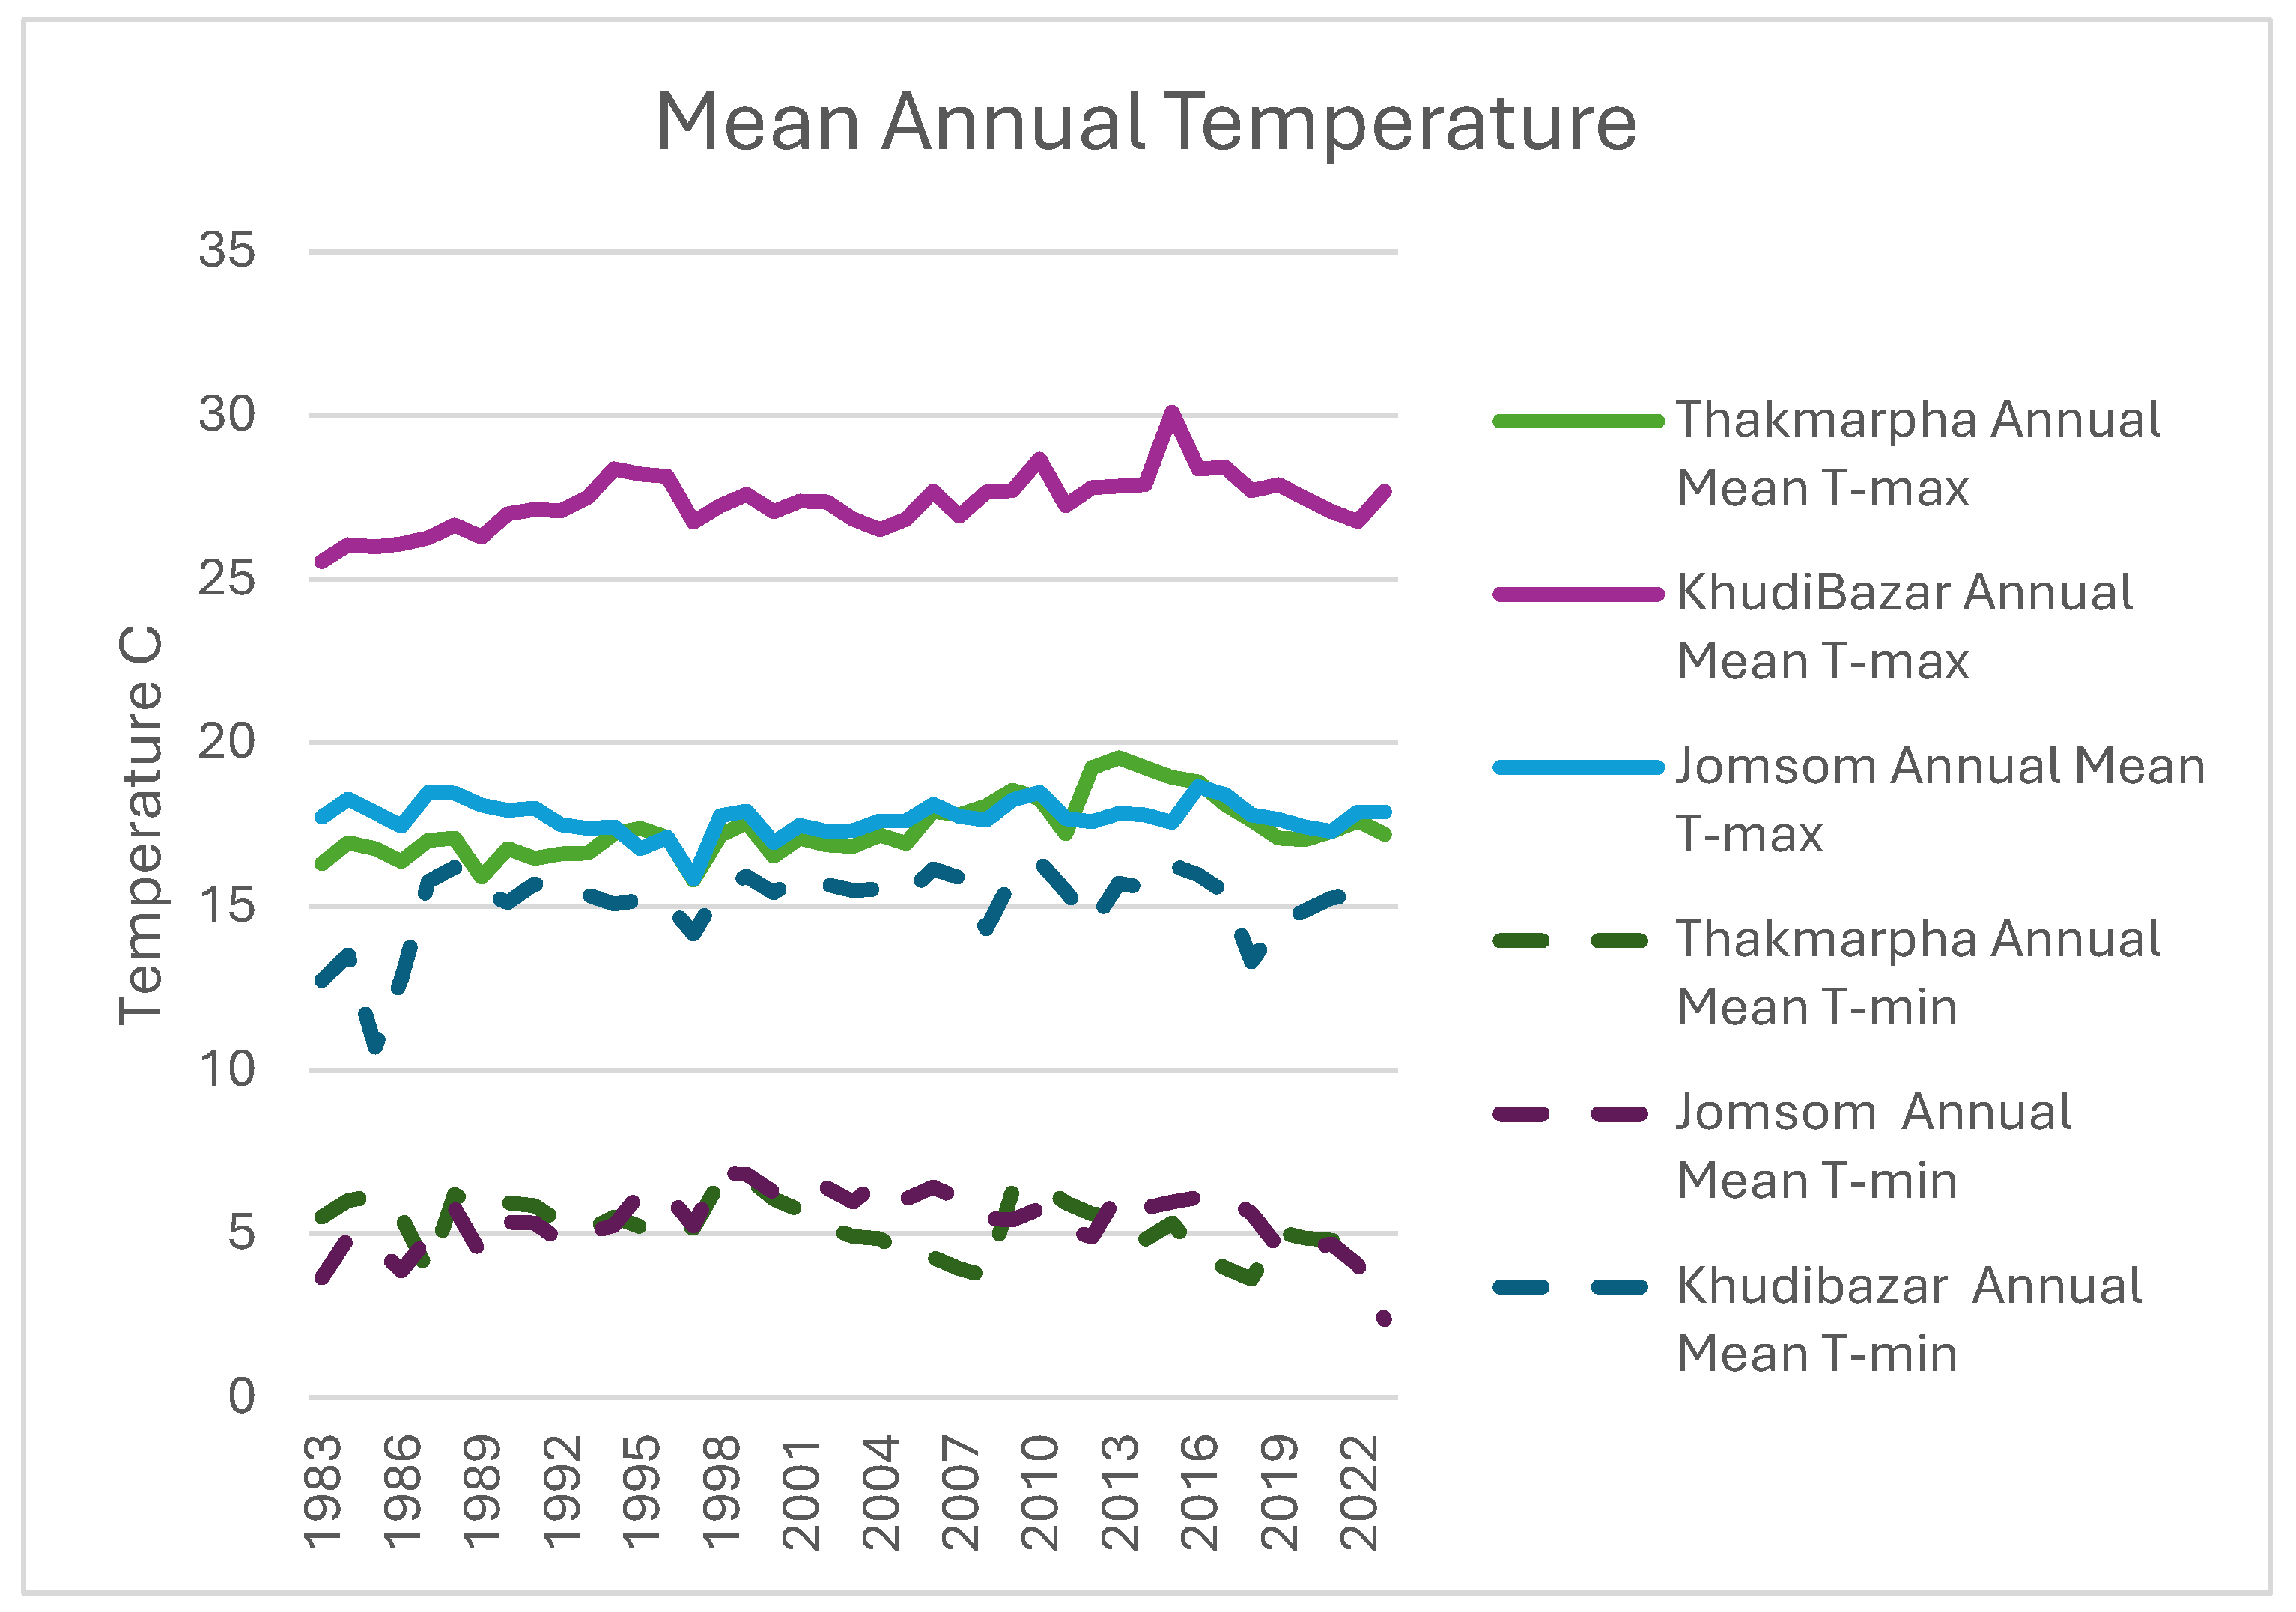
- Warming Trend in Tmax: All stations showed a positive trend in Tmax. Thakmarpha and Khudi Bazar exhibited statistically significant increases (p < 0.001).
- Mixed Trends in Tmin: Thakmarpha showed a significant negative trend in Tmin (p = 0.001), while Jomsom and Khudi Bazar had positive but non-significant trends. Table 5 presents the results of the Mann-Kendall trend test for temperature data, indicating statistically significant trends in maximum and minimum temperatures. Check Appendix B for trend graphs.
3.3.2. Precipitation Trends
Similar to the temperature data, annual precipitation data were analyzed for trends using the Mann-Kendall test. Error! Reference source not found. shows the annual precipitation trends for the stations.
Figure 4.
Annual precipitation for Thakmarpha, Jomsom, Khudi Bazar, Sikles, Manang Bhot, and Tatopani.
Figure 4.
Annual precipitation for Thakmarpha, Jomsom, Khudi Bazar, Sikles, Manang Bhot, and Tatopani.
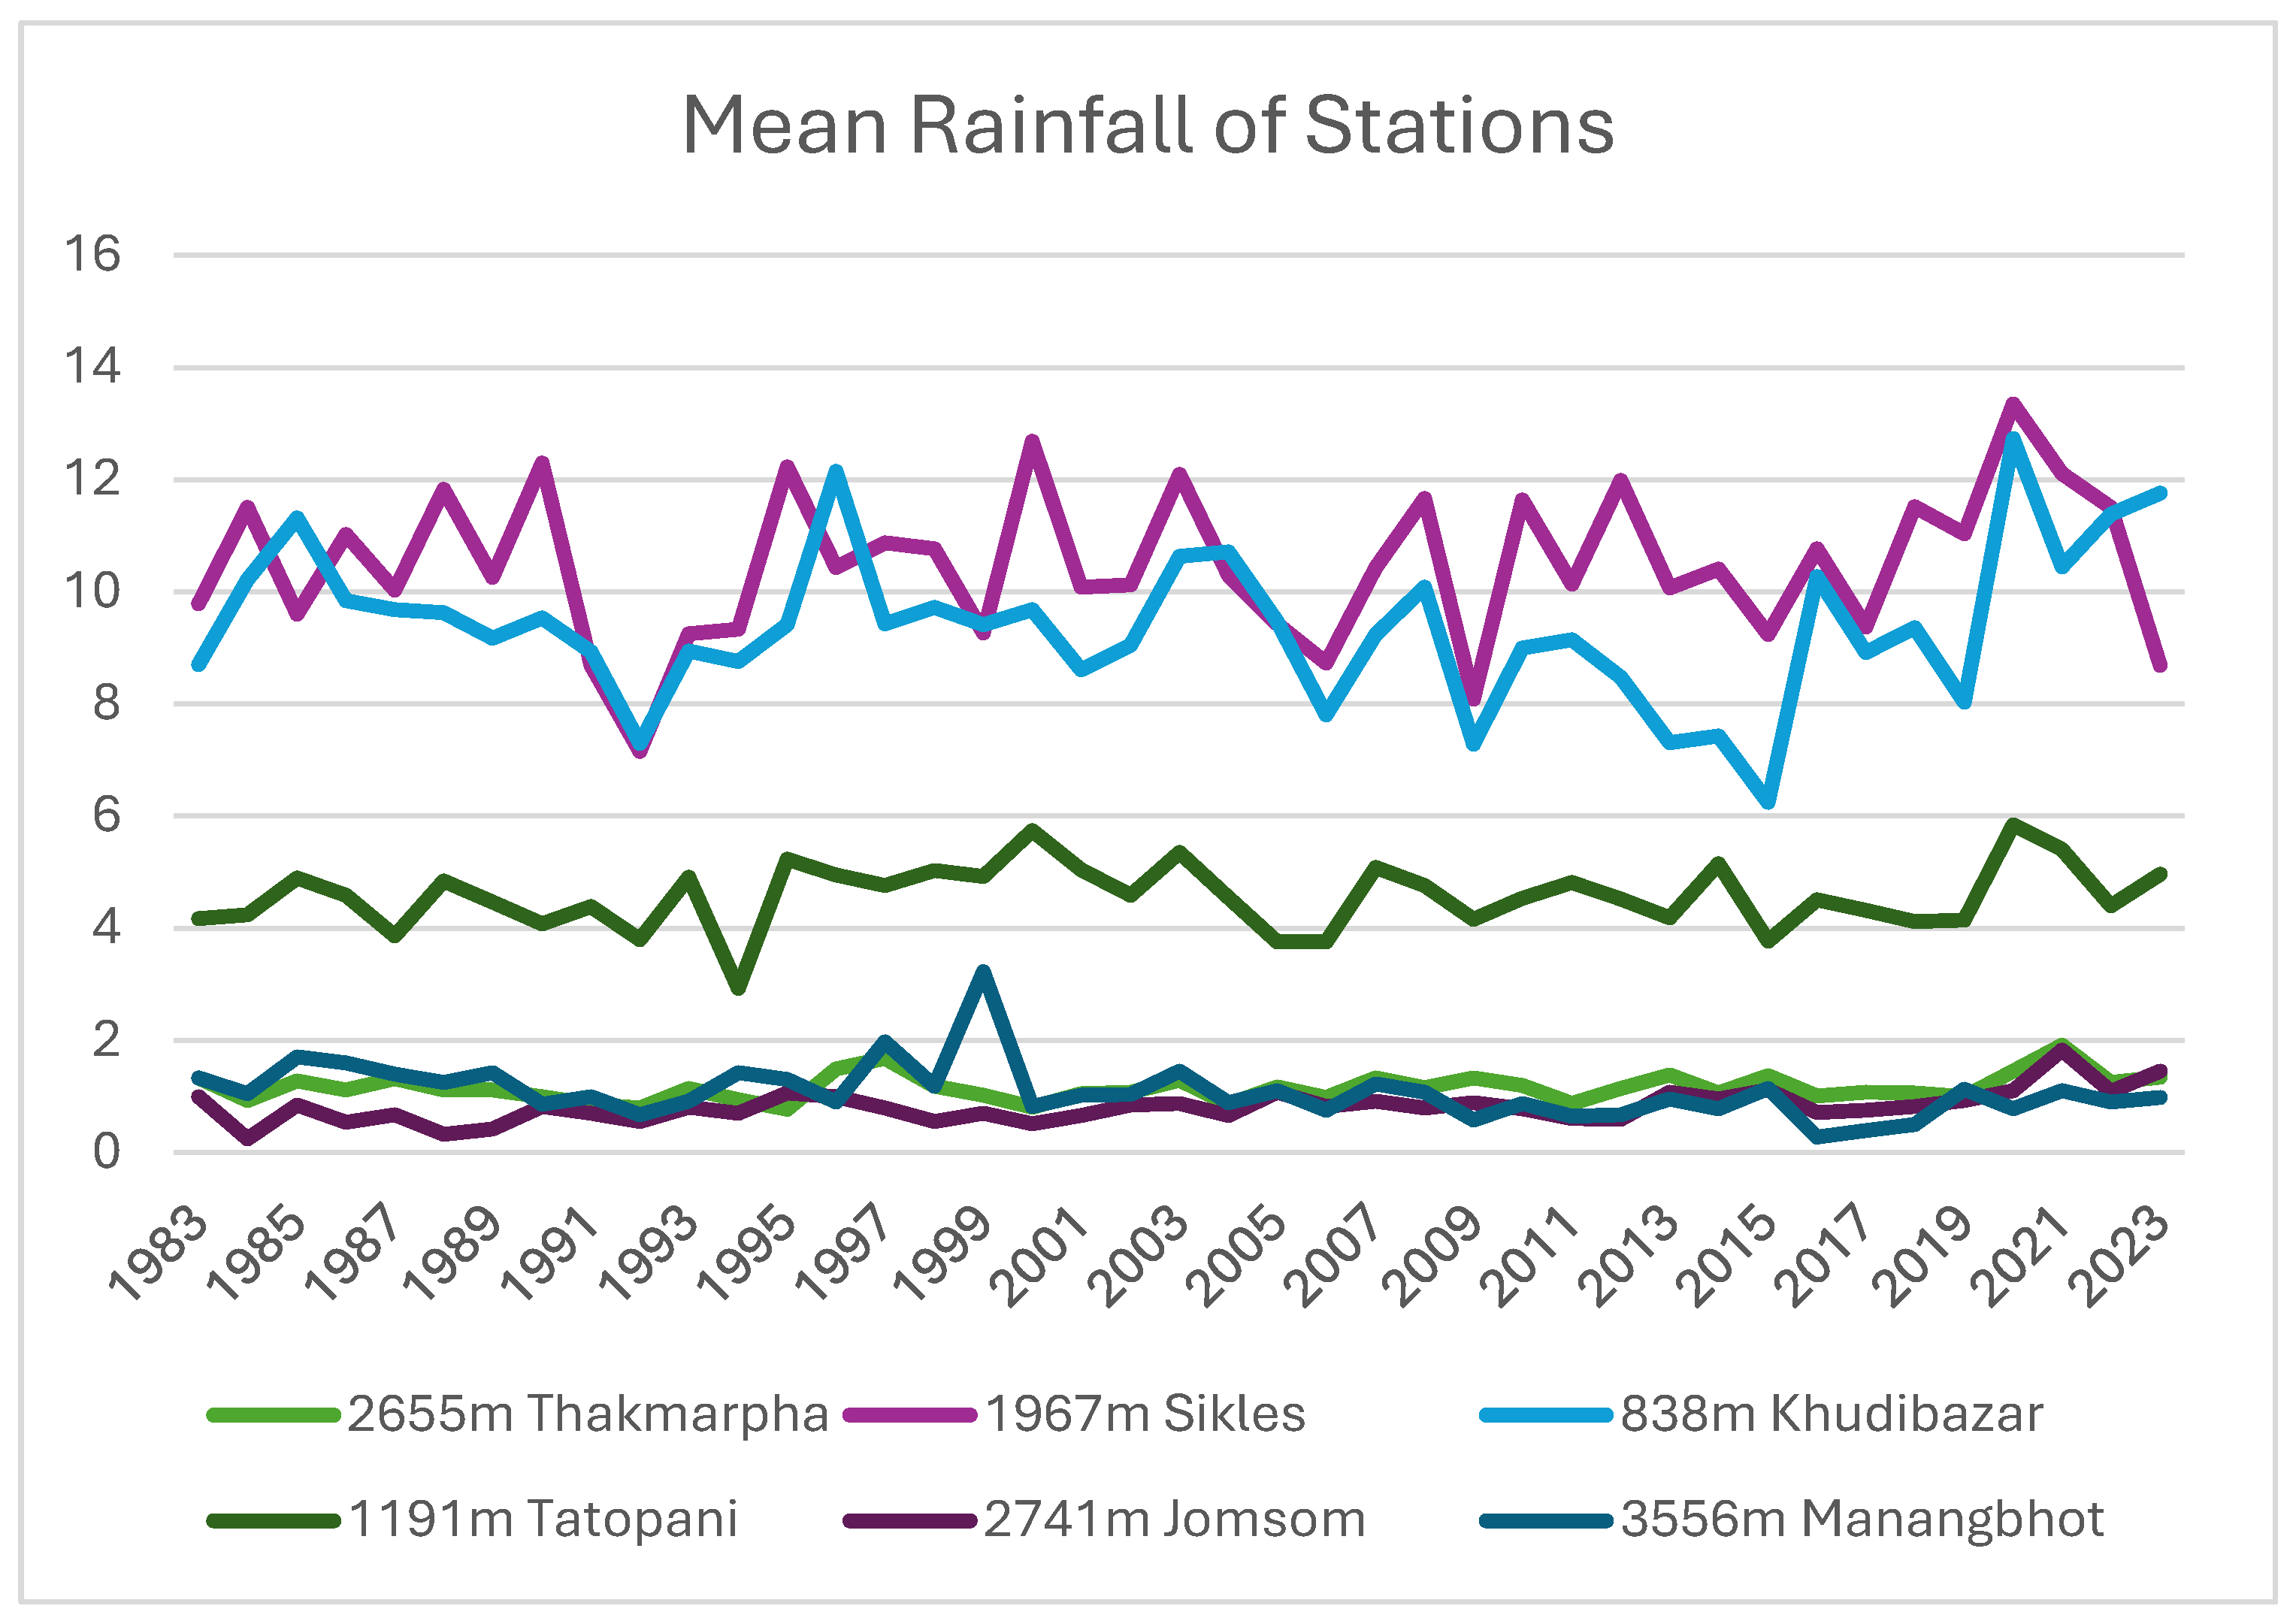
- Positive Trends: Thakmarpha and Jomsom exhibited positive trends in precipitation, with Jomsom's trend being statistically significant (p < 0.001).
- Negative Trends: Khudi Bazar showed a negative but non-significant trend. Manang Bhot displayed a significant negative trend (p = 0.001).
- Variability: Precipitation patterns were highly variable, with anomalies such as droughts and extreme rainfall events. Table 6 provides the Mann-Kendall test results for precipitation.
3.3.3. Extreme Precipitation Frequency
The frequency of extreme precipitation events in the Annapurna region has exhibited notable changes over the past four decades. An analysis of the data reveals that days with significant rainfall have generally increased across all stations. Figure 5 illustrates the normalized frequency of extreme precipitation events over the past four decades, emphasizing changes in rainfall patterns that influence flood risk and water resource management.
Figure 5.
Normalized extreme precipitation frequency across stations.
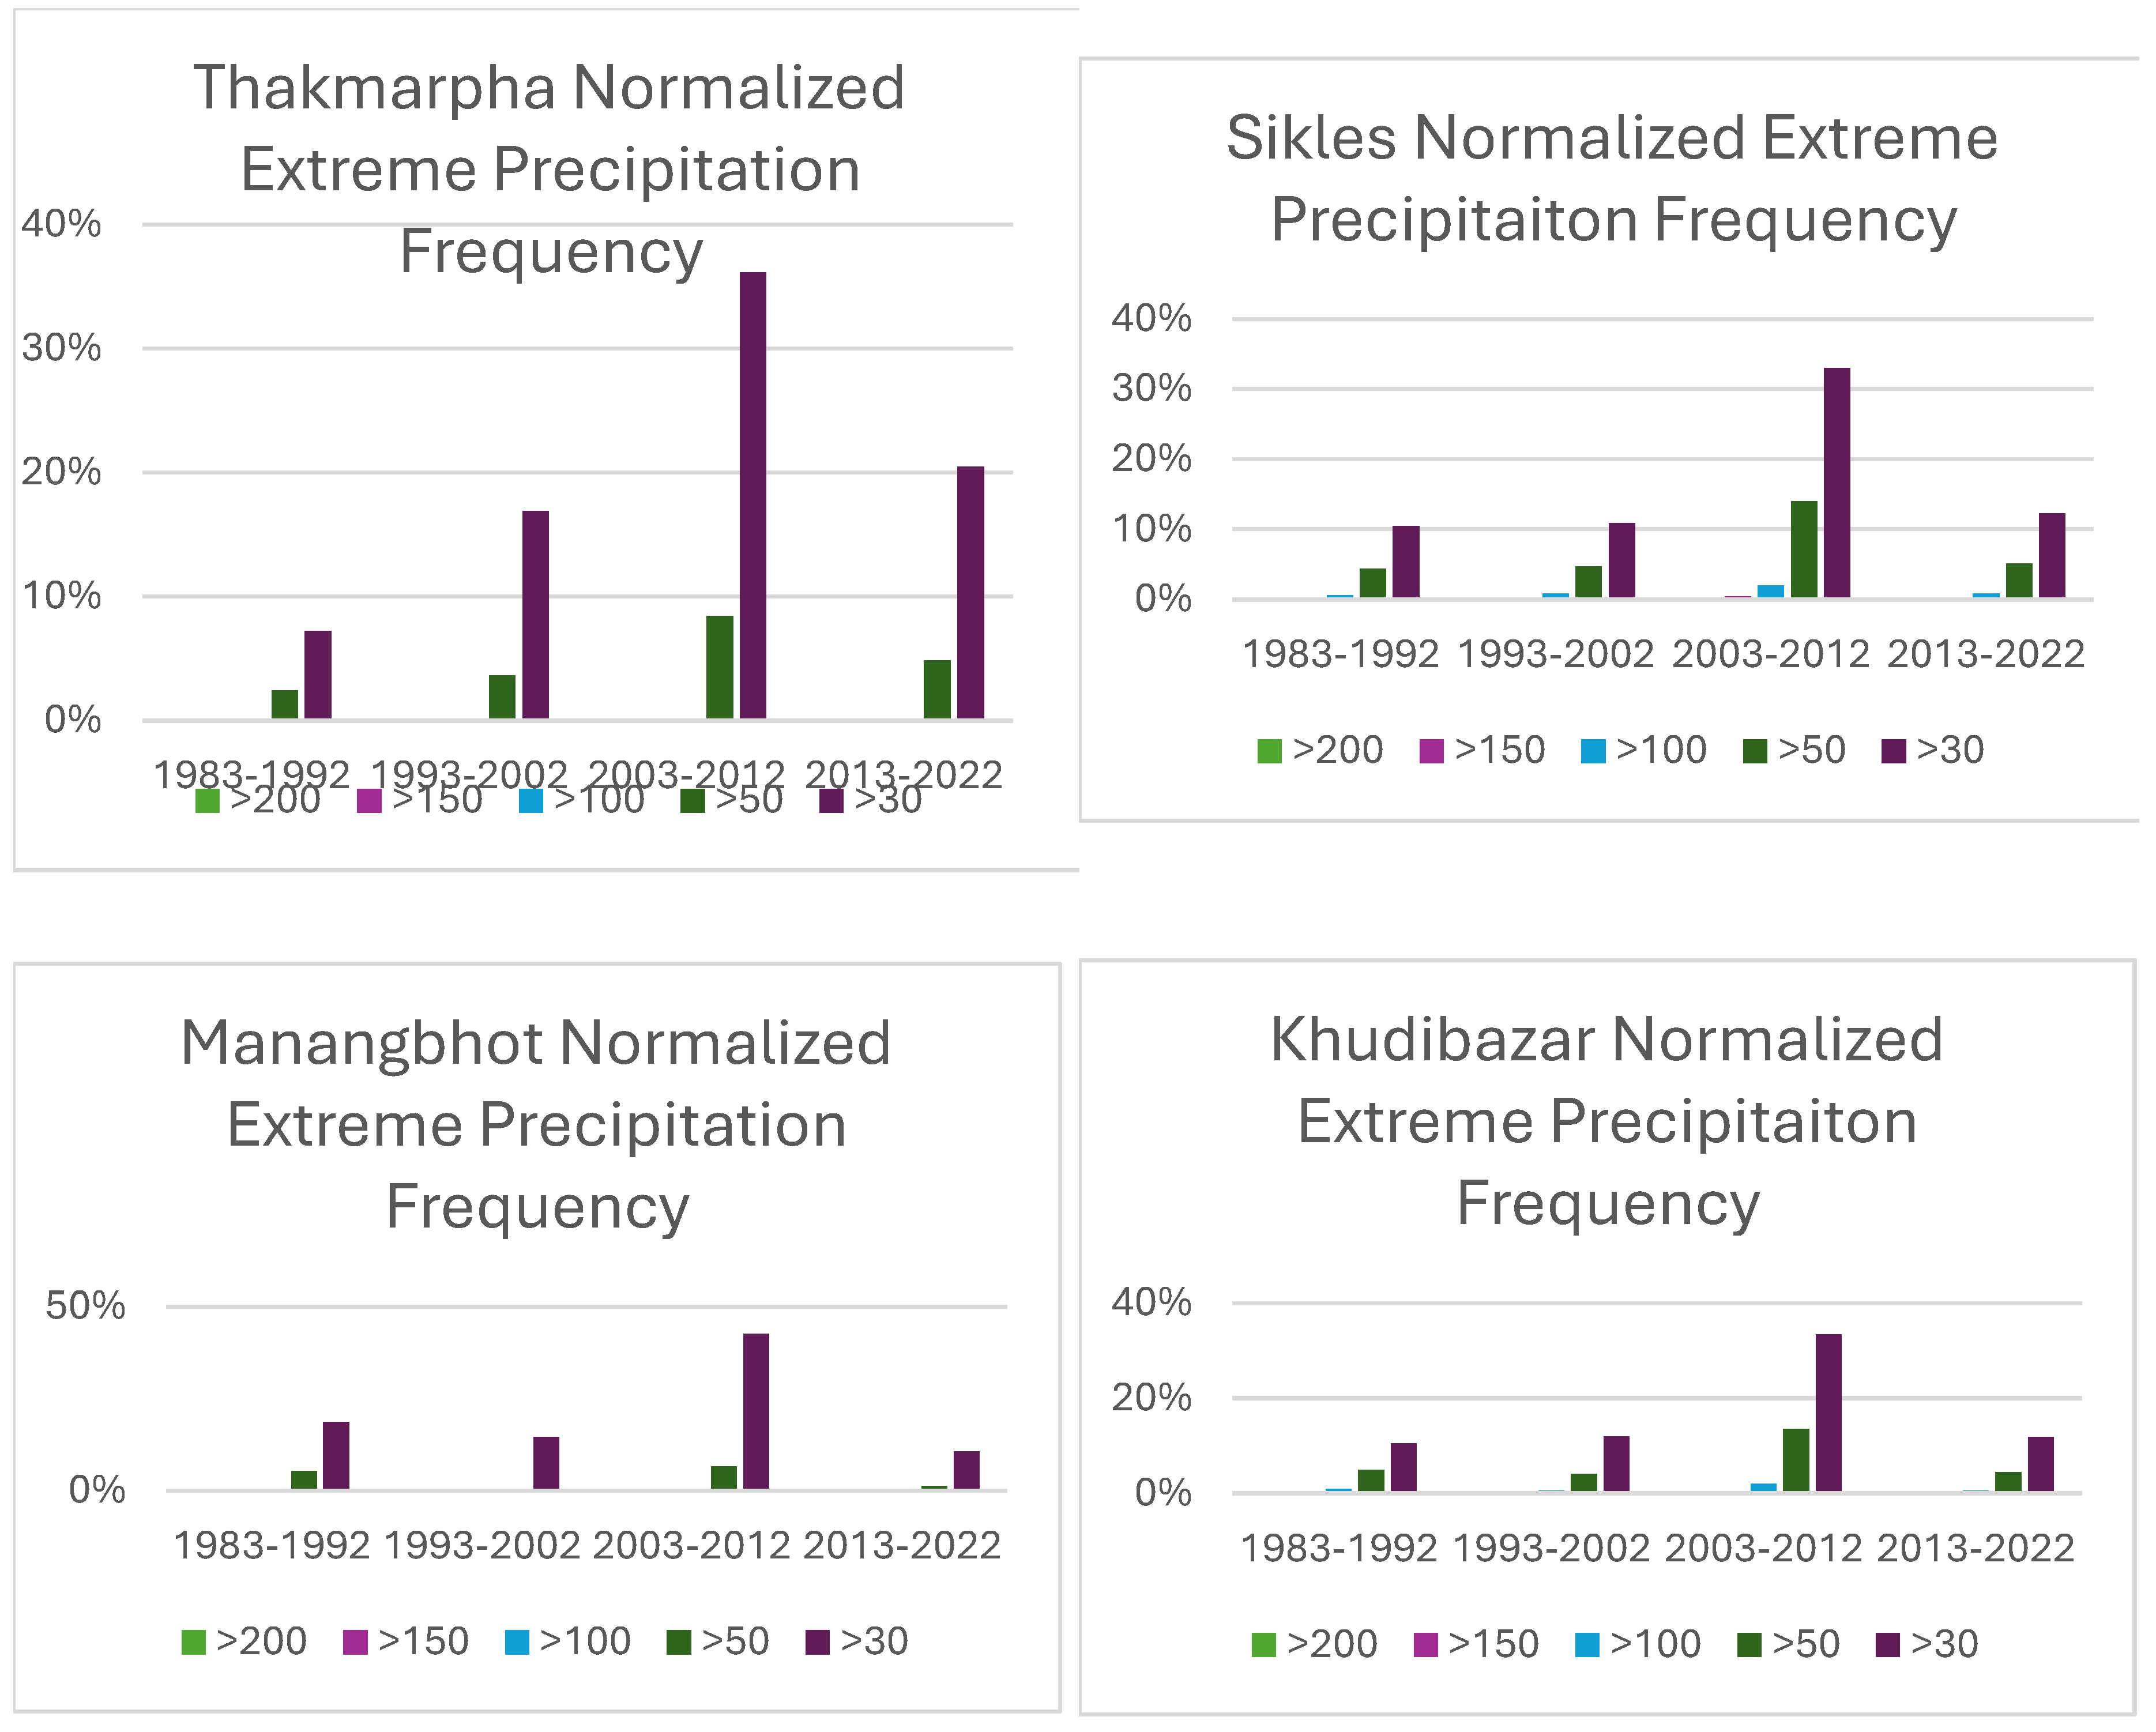
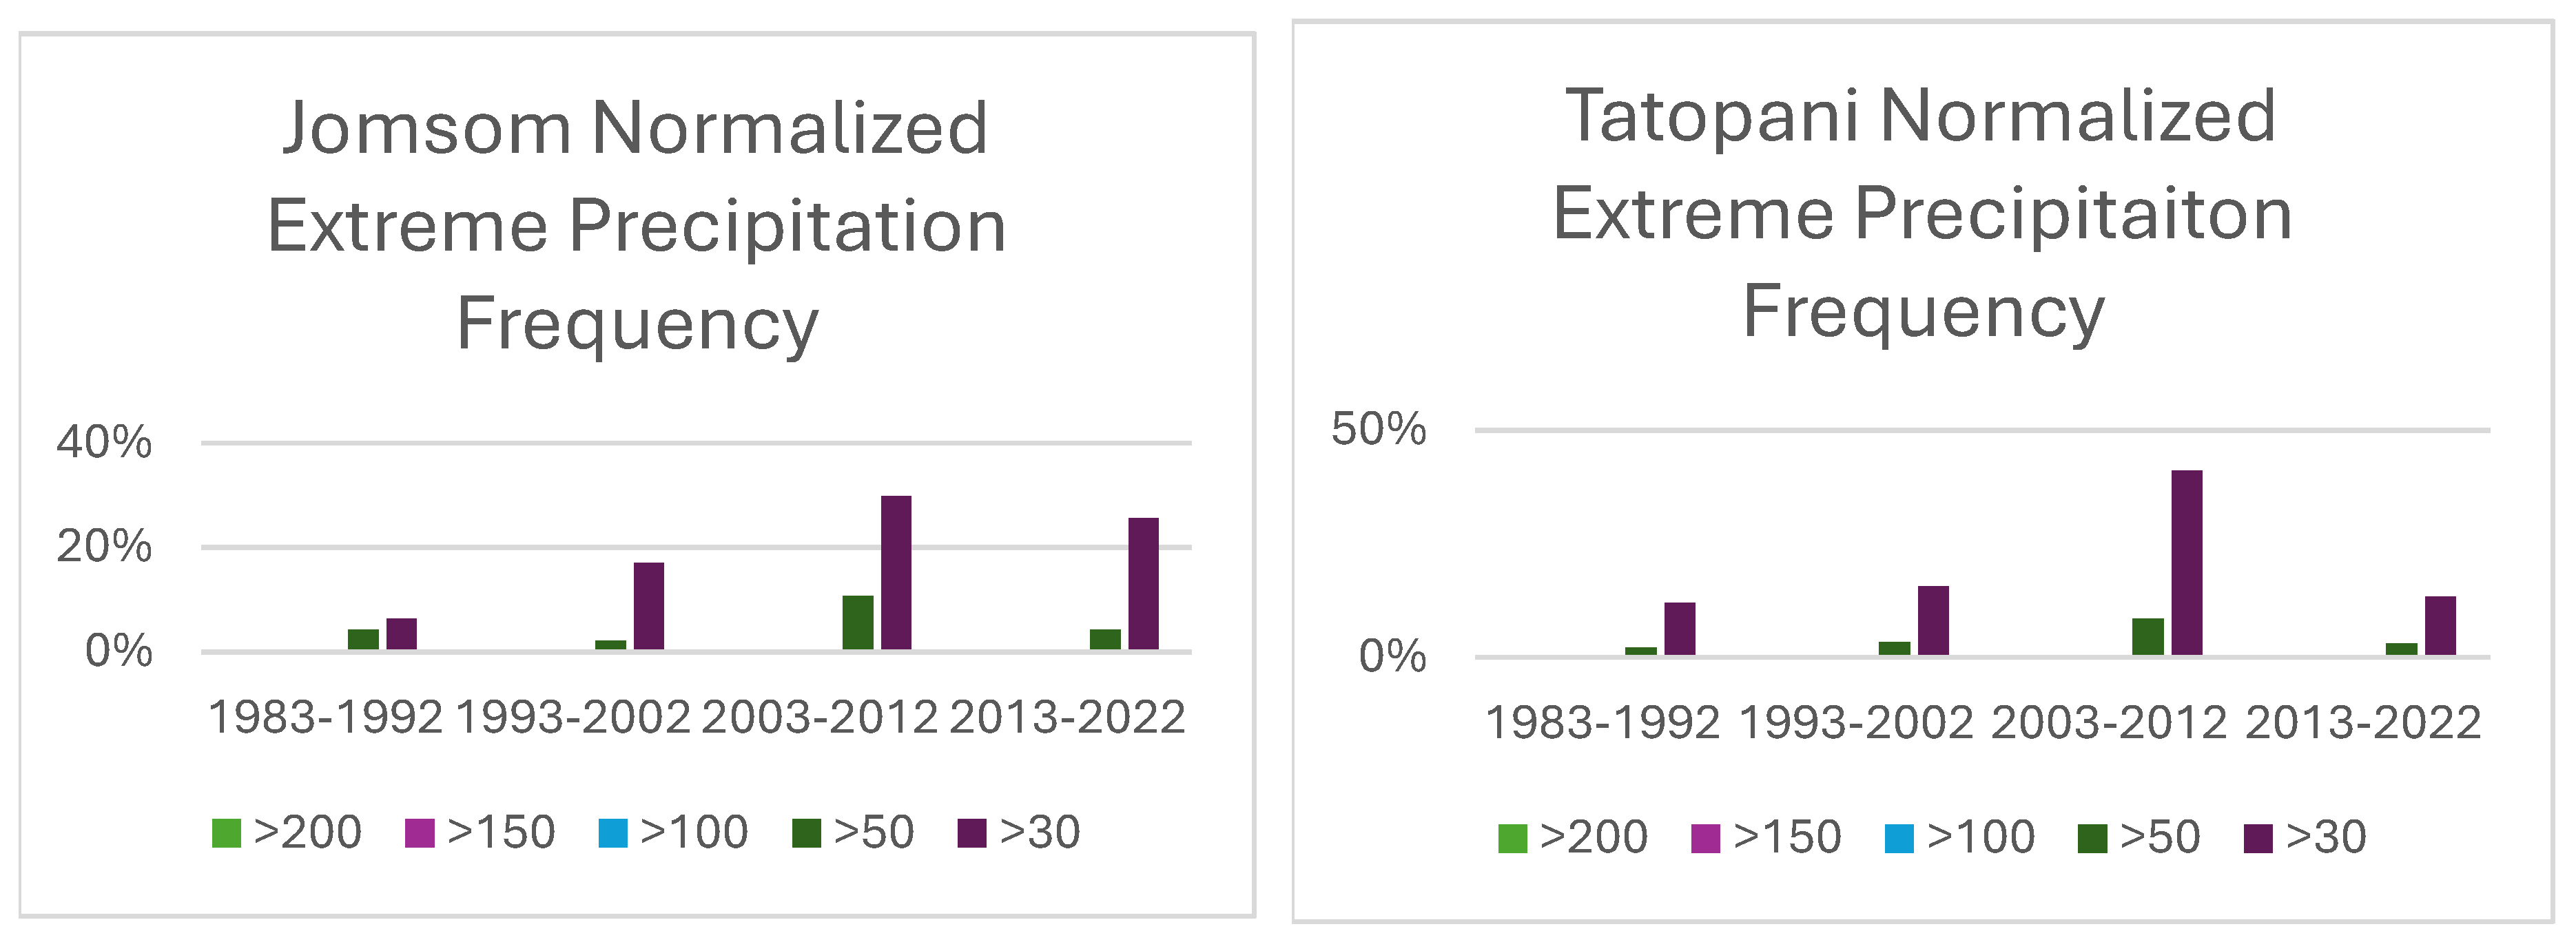
Increase in Moderate Extreme Events: The percentage of days with rainfall exceeding 30 mm increased substantially over the decades. In 1983–1992, this percentage ranged from 6% to 12%, rising to 33% to 43% in 2003–2012. Days with rainfall over 50 mm also increased, from 2%–5% in 1983–1992 to 8%–14% in 2003–2012. Despite the increase in moderate extremes, occurrences of rainfall exceeding 100 mm remain relatively rare, with only a slight rise from 0%–1% in 1983–1992 to 2% in 2003–2012. The most recent decade (2013–2022) suggests a stabilization or slight decline in the frequency of these extreme events compared to the previous decade. The percentage of days with rainfall over 30 mm and 50 mm has not shown the same rate of increase as observed earlier.
The increase in moderate extreme precipitation events aligns with global climate change projections, which suggest an intensification of the hydrological cycle due to warming temperatures. The stabilization or slight decline in the most recent decade could indicate a shift in precipitation patterns or natural variability in extreme weather events, warranting further investigation.
3.3.4. Decadal Changes in Precipitation Patterns
An analysis of rainfall patterns across the Annapurna region reveals significant changes over the decades, with notable differences between higher elevation and lower elevation stations.
Figure 6.
Decadal changes in precipitation pattern in given station.
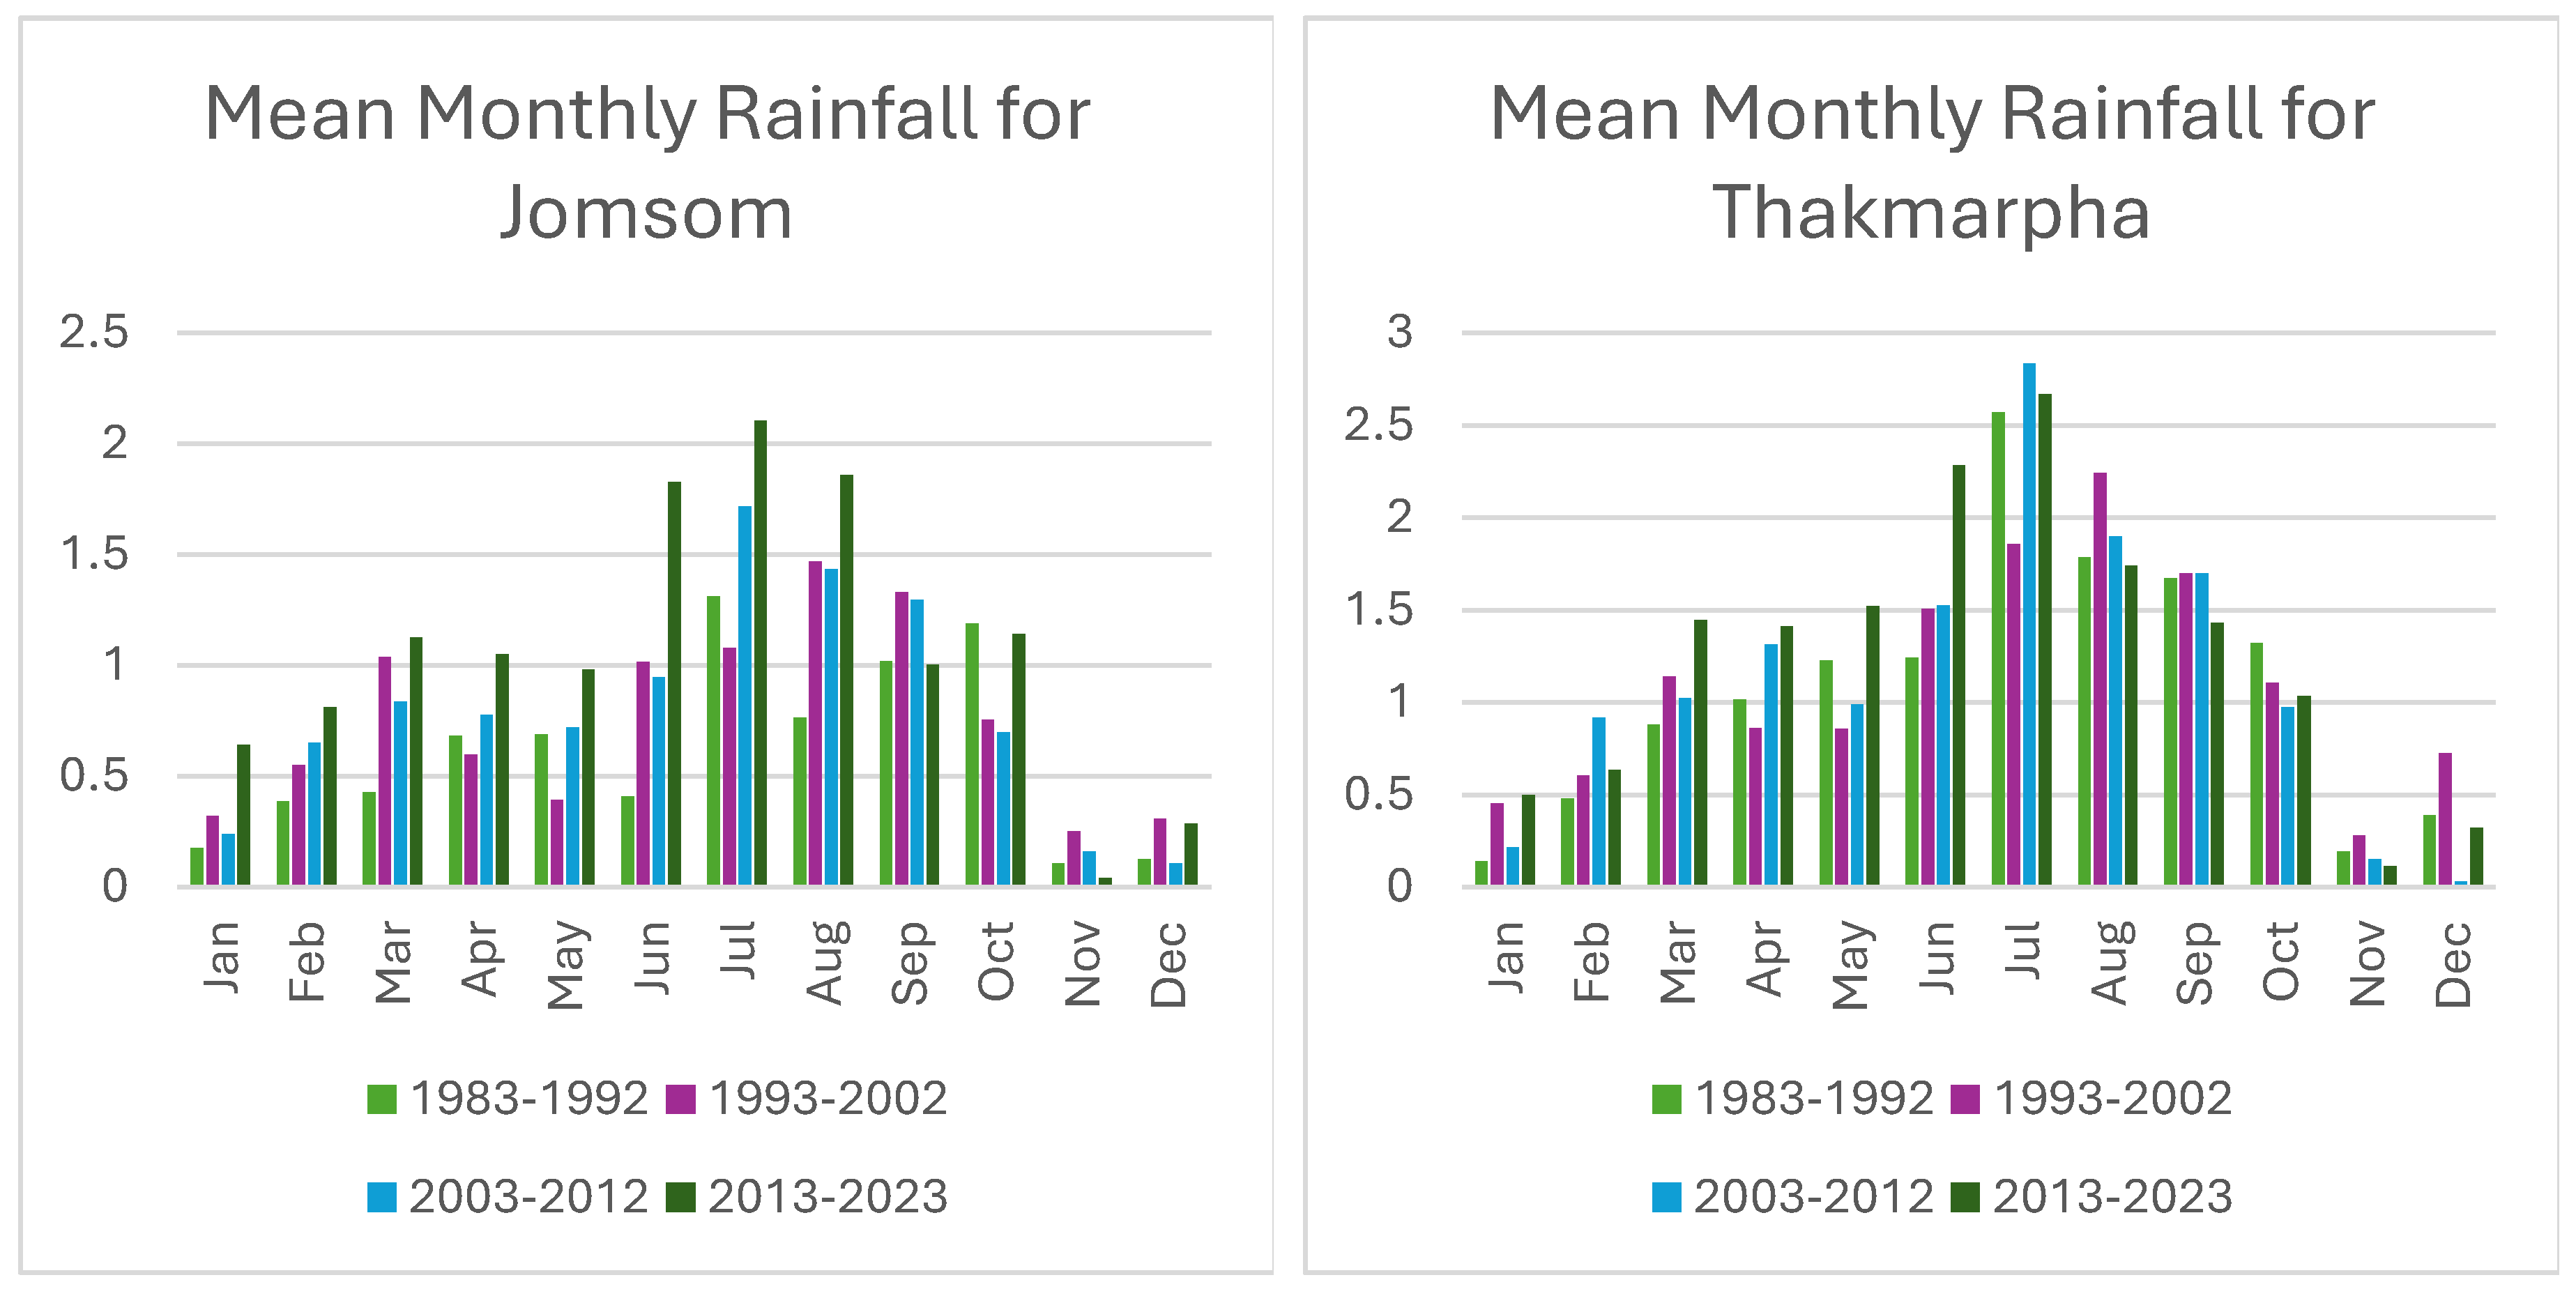
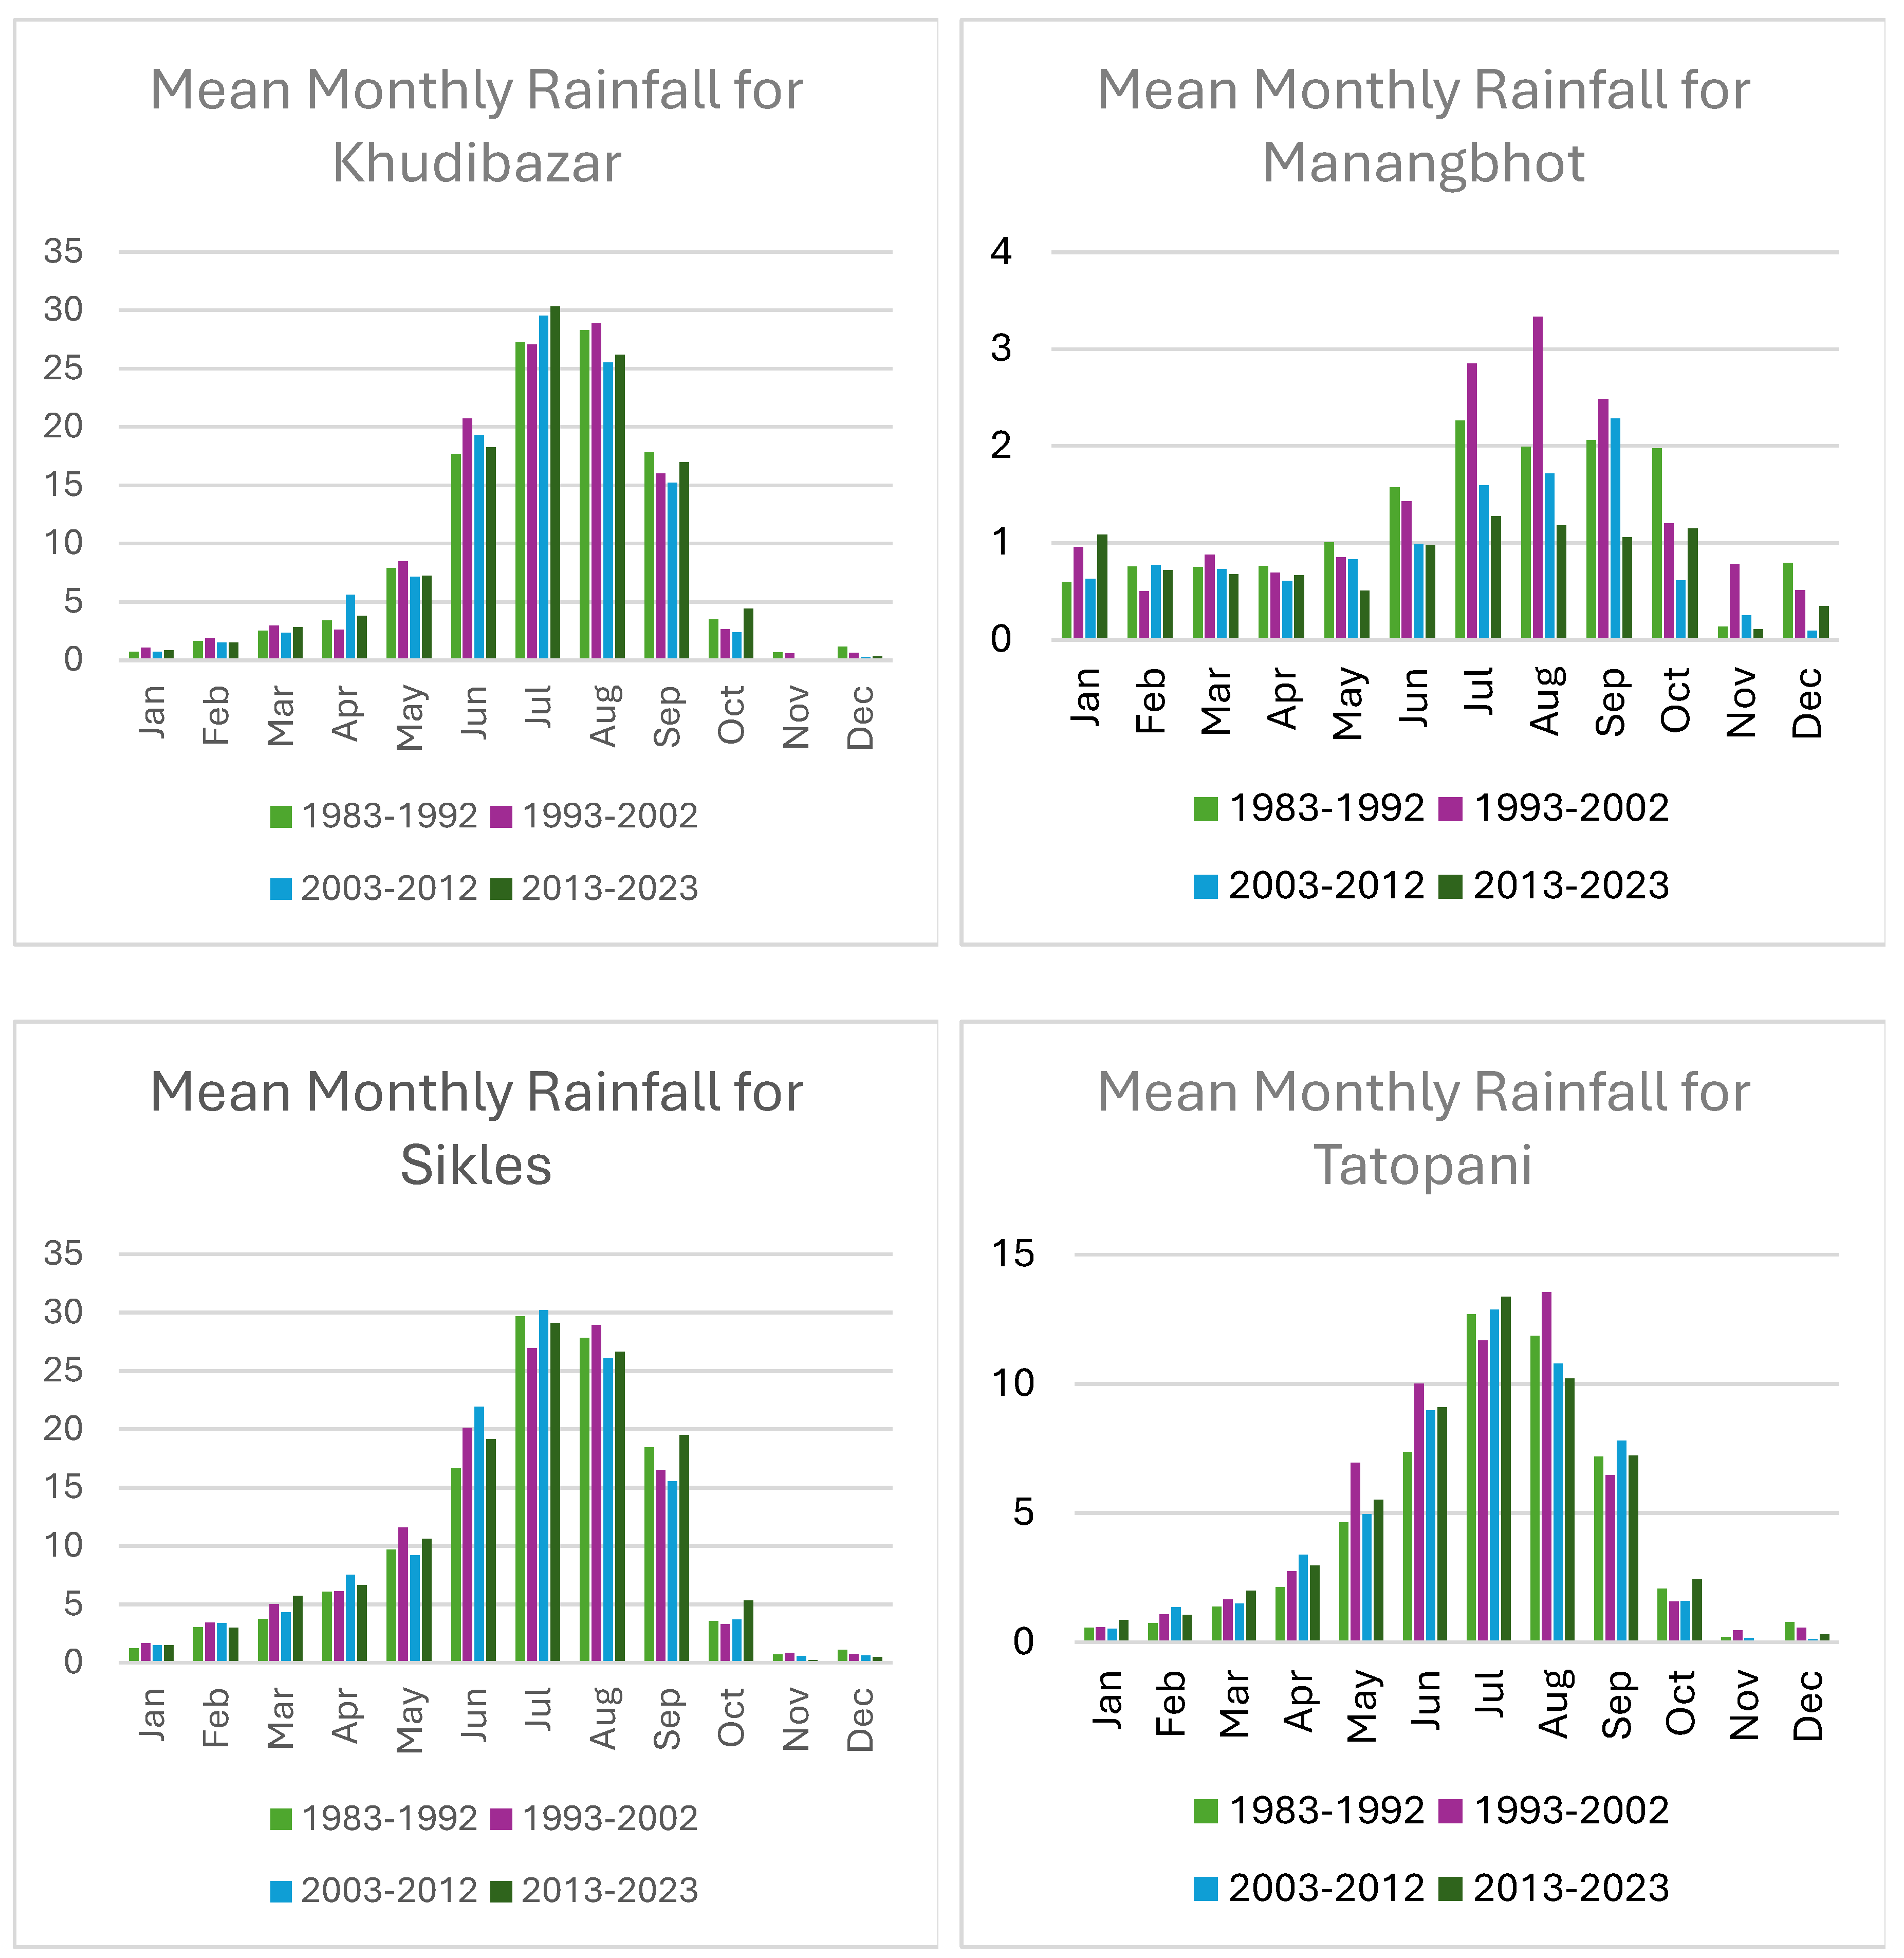
Higher elevation stations such as Thakmarpha, Manang Bhot, and Jomsom exhibited a consistent increase in mean monthly rainfall during the monsoon months (July and August). Thakmarpha's July rainfall rose from 2.57 mm in 1983–1992 to 2.67 mm in 2013–2023. Jomsom's July rainfall increased from 1.31 mm to 2.10 mm over the same period. The persistent rise in mid-summer precipitation at higher elevations suggests increased moisture availability, potentially impacting glacier melt and river flow regimes.
Lower elevation stations like Sikles, Tatopani, and Khudi Bazar showed substantial increases in rainfall during the monsoon months. Sikles recorded July rainfall increases from 29.71 mm in 1983–1992 to 30.30 mm in 2013–2023. Khudi Bazar's July rainfall rose from 27.25 mm to 30.30 mm over the same period. The trend towards more intense precipitation events at lower elevations reflects broader climatic changes, where increased temperatures and altered atmospheric dynamics contribute to heavier rainfall events.
The changes in precipitation patterns, particularly the increase in extreme events, have significant implications for water resource management, flood risk, and agricultural practices. These patterns are consistent with projections that climate change will lead to more variable and intense precipitation, especially in mountainous regions.
3.4. Community Perceptions and Adaptive Strategies
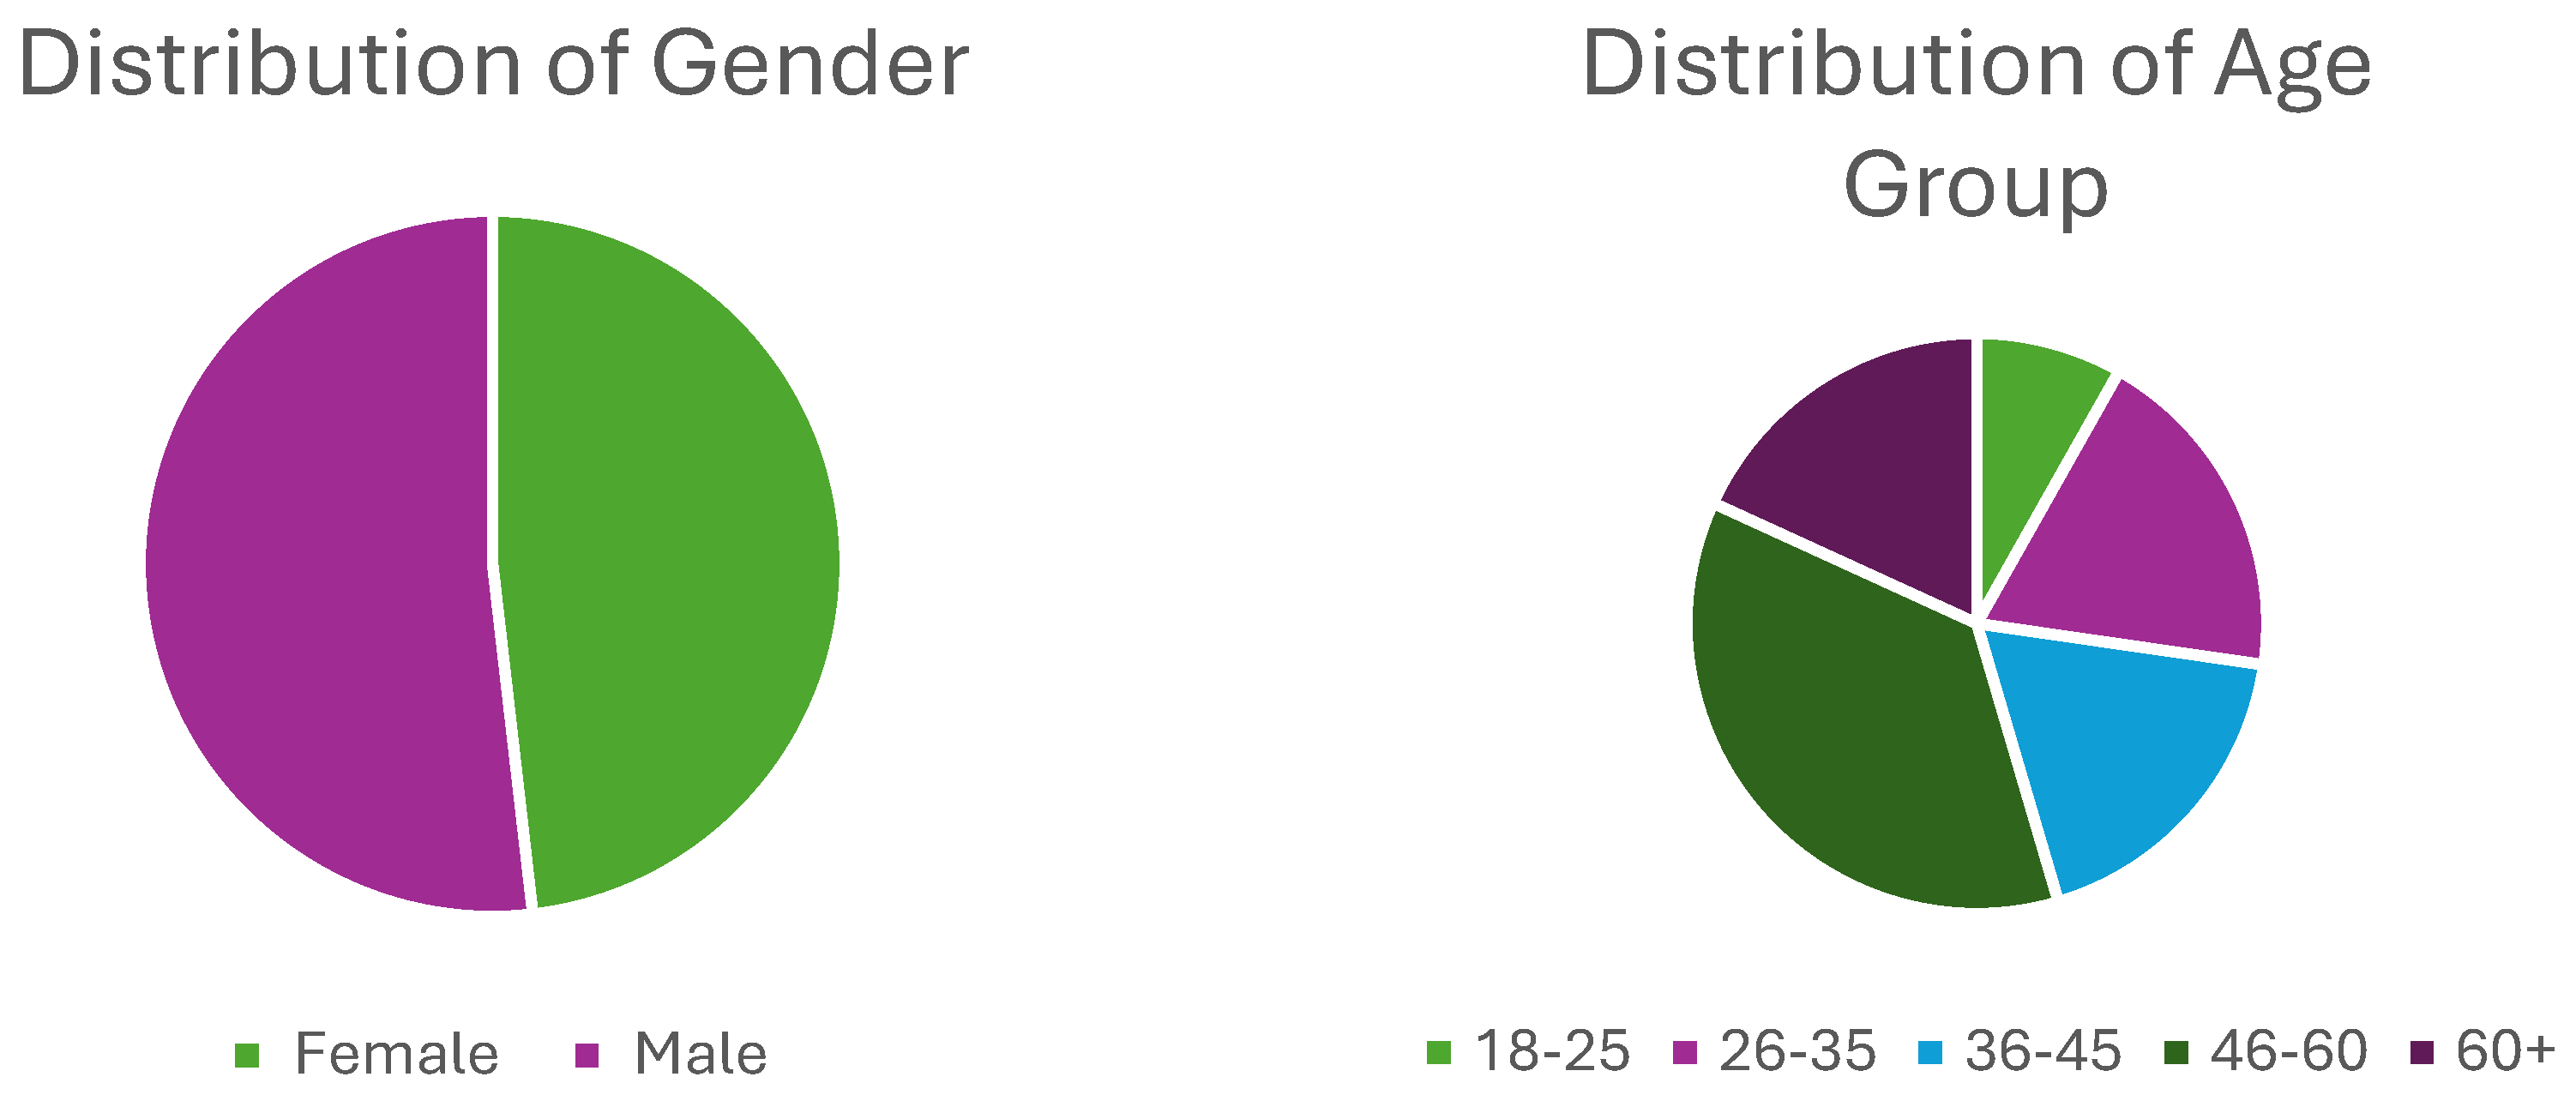
3.4.1. Demographic Overview
The survey data collected from various individuals in different occupations and locations provides a rich dataset for understanding the perceptions and impacts of climate change on local communities. The respondents come from various age groups, occupations, and locations. The diversity in demographics allows for a comprehensive analysis of how climate change impacts vary across different population segments. The survey indicates a relatively balanced gender distribution among the respondents, with a near-even split between female and male participants. The age distribution of survey participants covers a diverse range, ensuring a broad perspective encompassing the views of younger and older community members. Notably, there is a predominance of respondents in the middle age brackets, which may reflect these age groups' active engagement and availability. Appendix C includes the questionnaire.
Figure 7.
Demographic Overview of the Respondents.
Perception of Climate Change
Surveys conducted in 11 villages within the ACA indicate a high level of awareness regarding climate change among residents. A significant majority (85%) reported noticeable changes in climatic patterns, particularly a decrease in snowfall and alterations in precipitation. Approximately 70% of respondents noted changes in water availability, which they attributed to these climatic shifts. Residents observed that these changes directly impacted their agricultural practices, with shifts in crop types and growing seasons becoming necessary to adapt to the new conditions.
Figure 8.
Responses for Changes in Temperature Extremes.
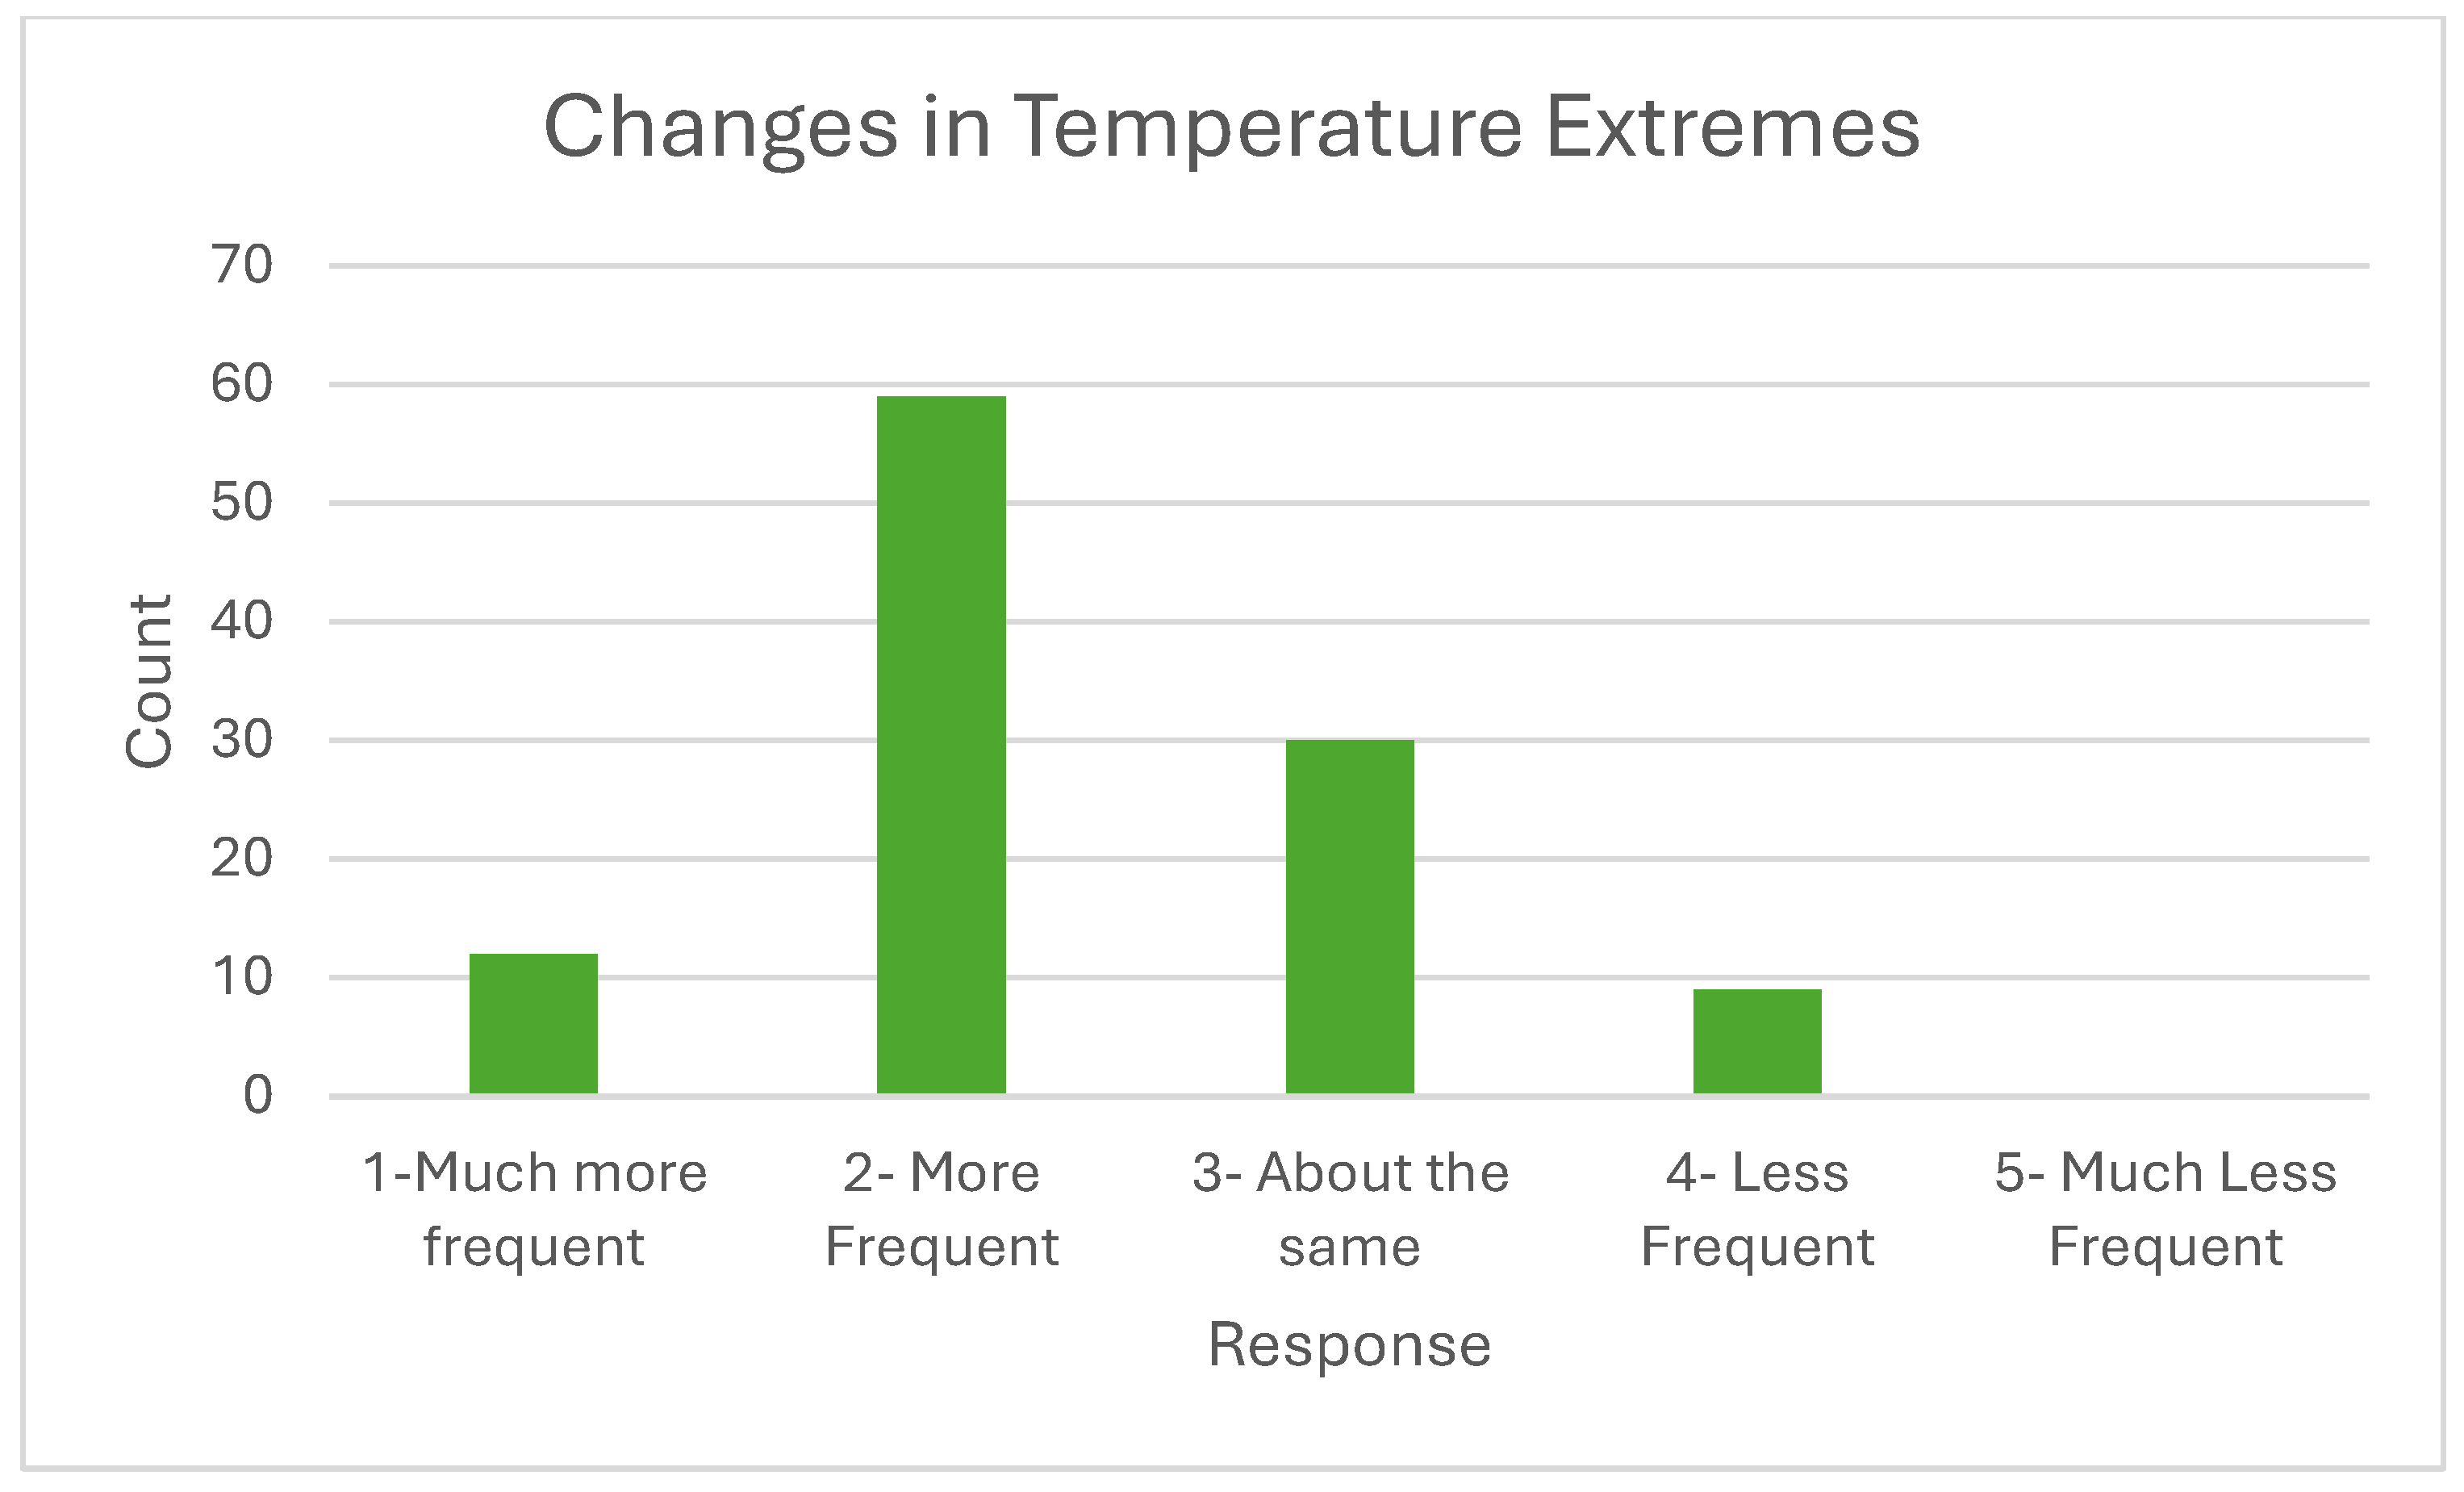
Temperature Extremes and Weather Patterns
The community's perception of climate change is notably well-informed, with a majority acknowledging its impacts on local ecosystems and livelihoods. Survey respondents have observed significant changes in local weather patterns, including more pronounced and frequent extreme weather events.
A significant number of respondents have observed changes in temperature extremes, with some noting that water now freezes less often, indicating milder winters. Rainfall patterns have been described as unpredictable, and several individuals have reported less snowfall, which aligns with the concerns about shorter winter seasons.
Water Availability and Infrastructure
The survey results present an encouraging trend in water availability and infrastructure within the community. Contrary to the challenges often faced in many regions, our data shows a marked improvement in access to water resources. Currently, all surveyed households report having access to piped water, a significant development compared to just a few years prior when such amenities were limited to a fraction of the population. It aligns with the 2023 Joint Monitoring Program (JMP), National Water, Sanitation and Hygiene (NWASH) data, which is also on a positive trend in achieving SDG 6 [13].
Figure 9.
Responses on Water Availability and Infrastructure.
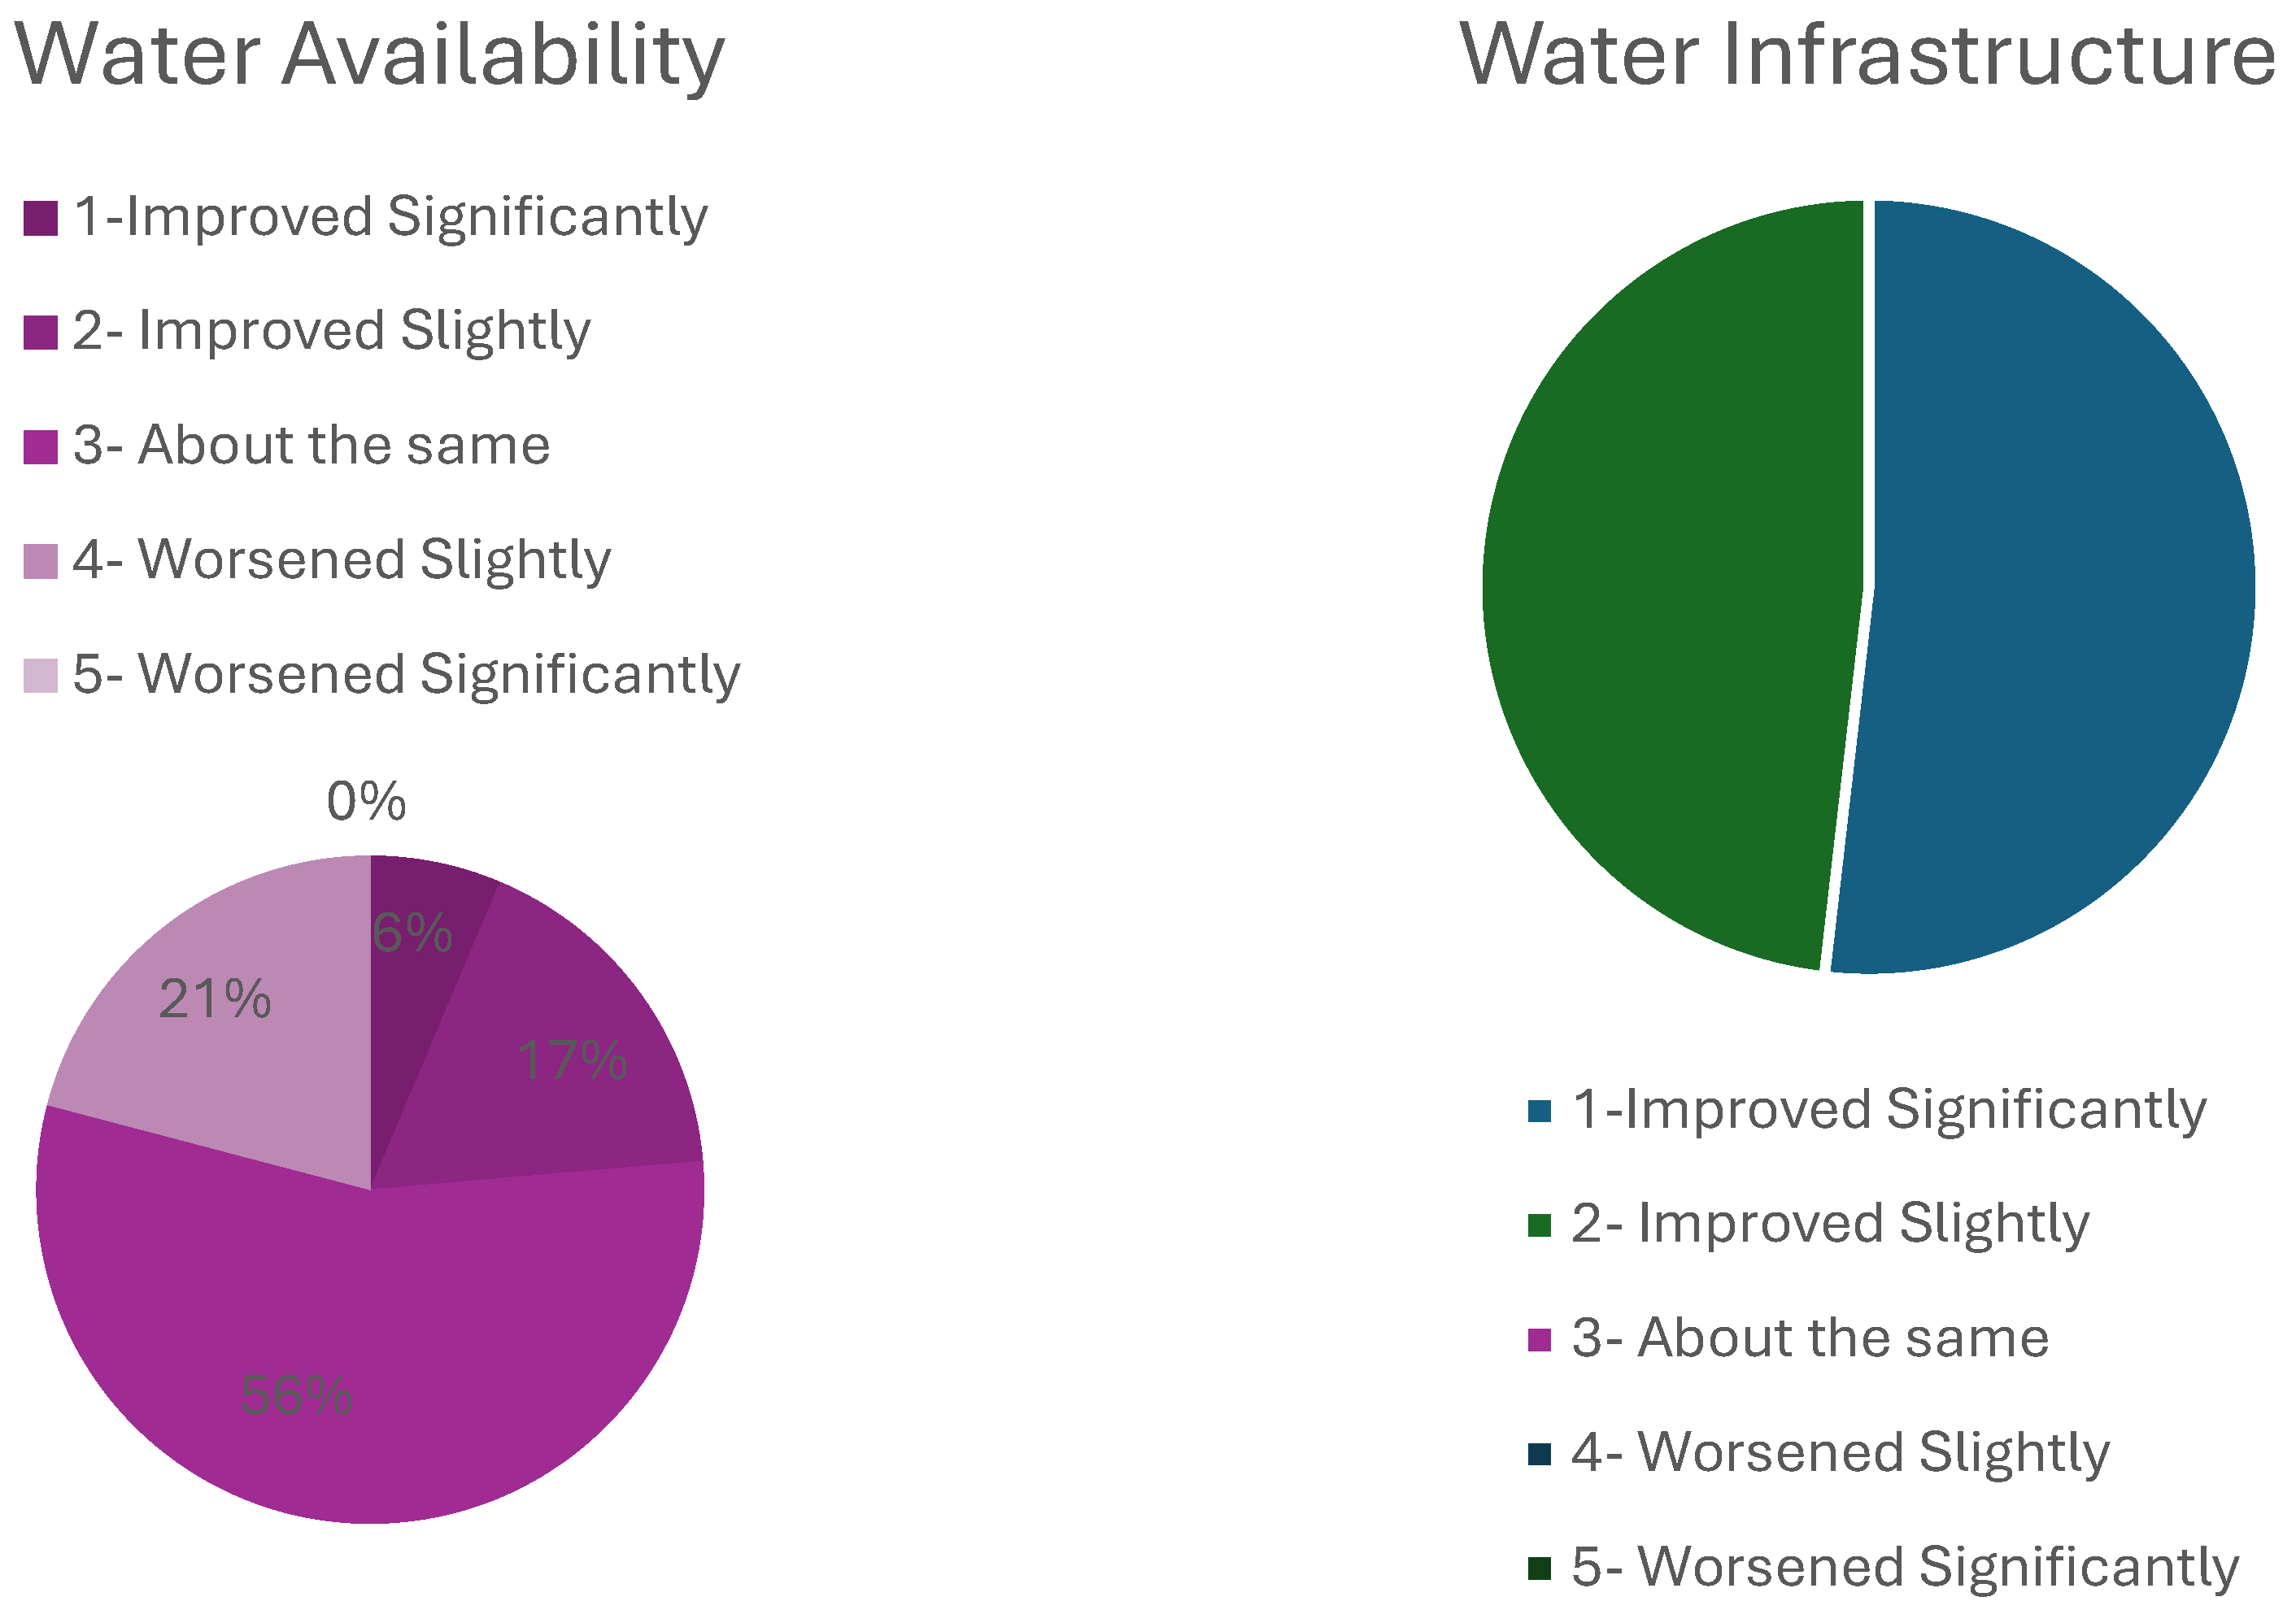
This progress in water infrastructure is a testament to successful policy implementation and investment in the community's essential services. The upgrade has likely contributed to the community's well-being, as reliable access to clean water is a cornerstone of public health, economic development, and environmental sustainability. This positive shift also reflects a growing recognition of the importance of water security in the face of climate change, prompting proactive measures to ensure resilience and adaptability in water management systems.
The improved infrastructure sets a solid foundation for future initiatives to manage water resources sustainably. It is also a crucial step toward achieving related Sustainable Development Goals (SDGs), particularly SDG 6, which calls for clean water and sanitation for all. The survey's findings can thus be a springboard for discussions on maintaining and furthering these gains, ensuring that water security remains a priority in policy planning and community development efforts.
Community Involvement and Social Support
Figure 10.
Responses on Social Support and Involvement.
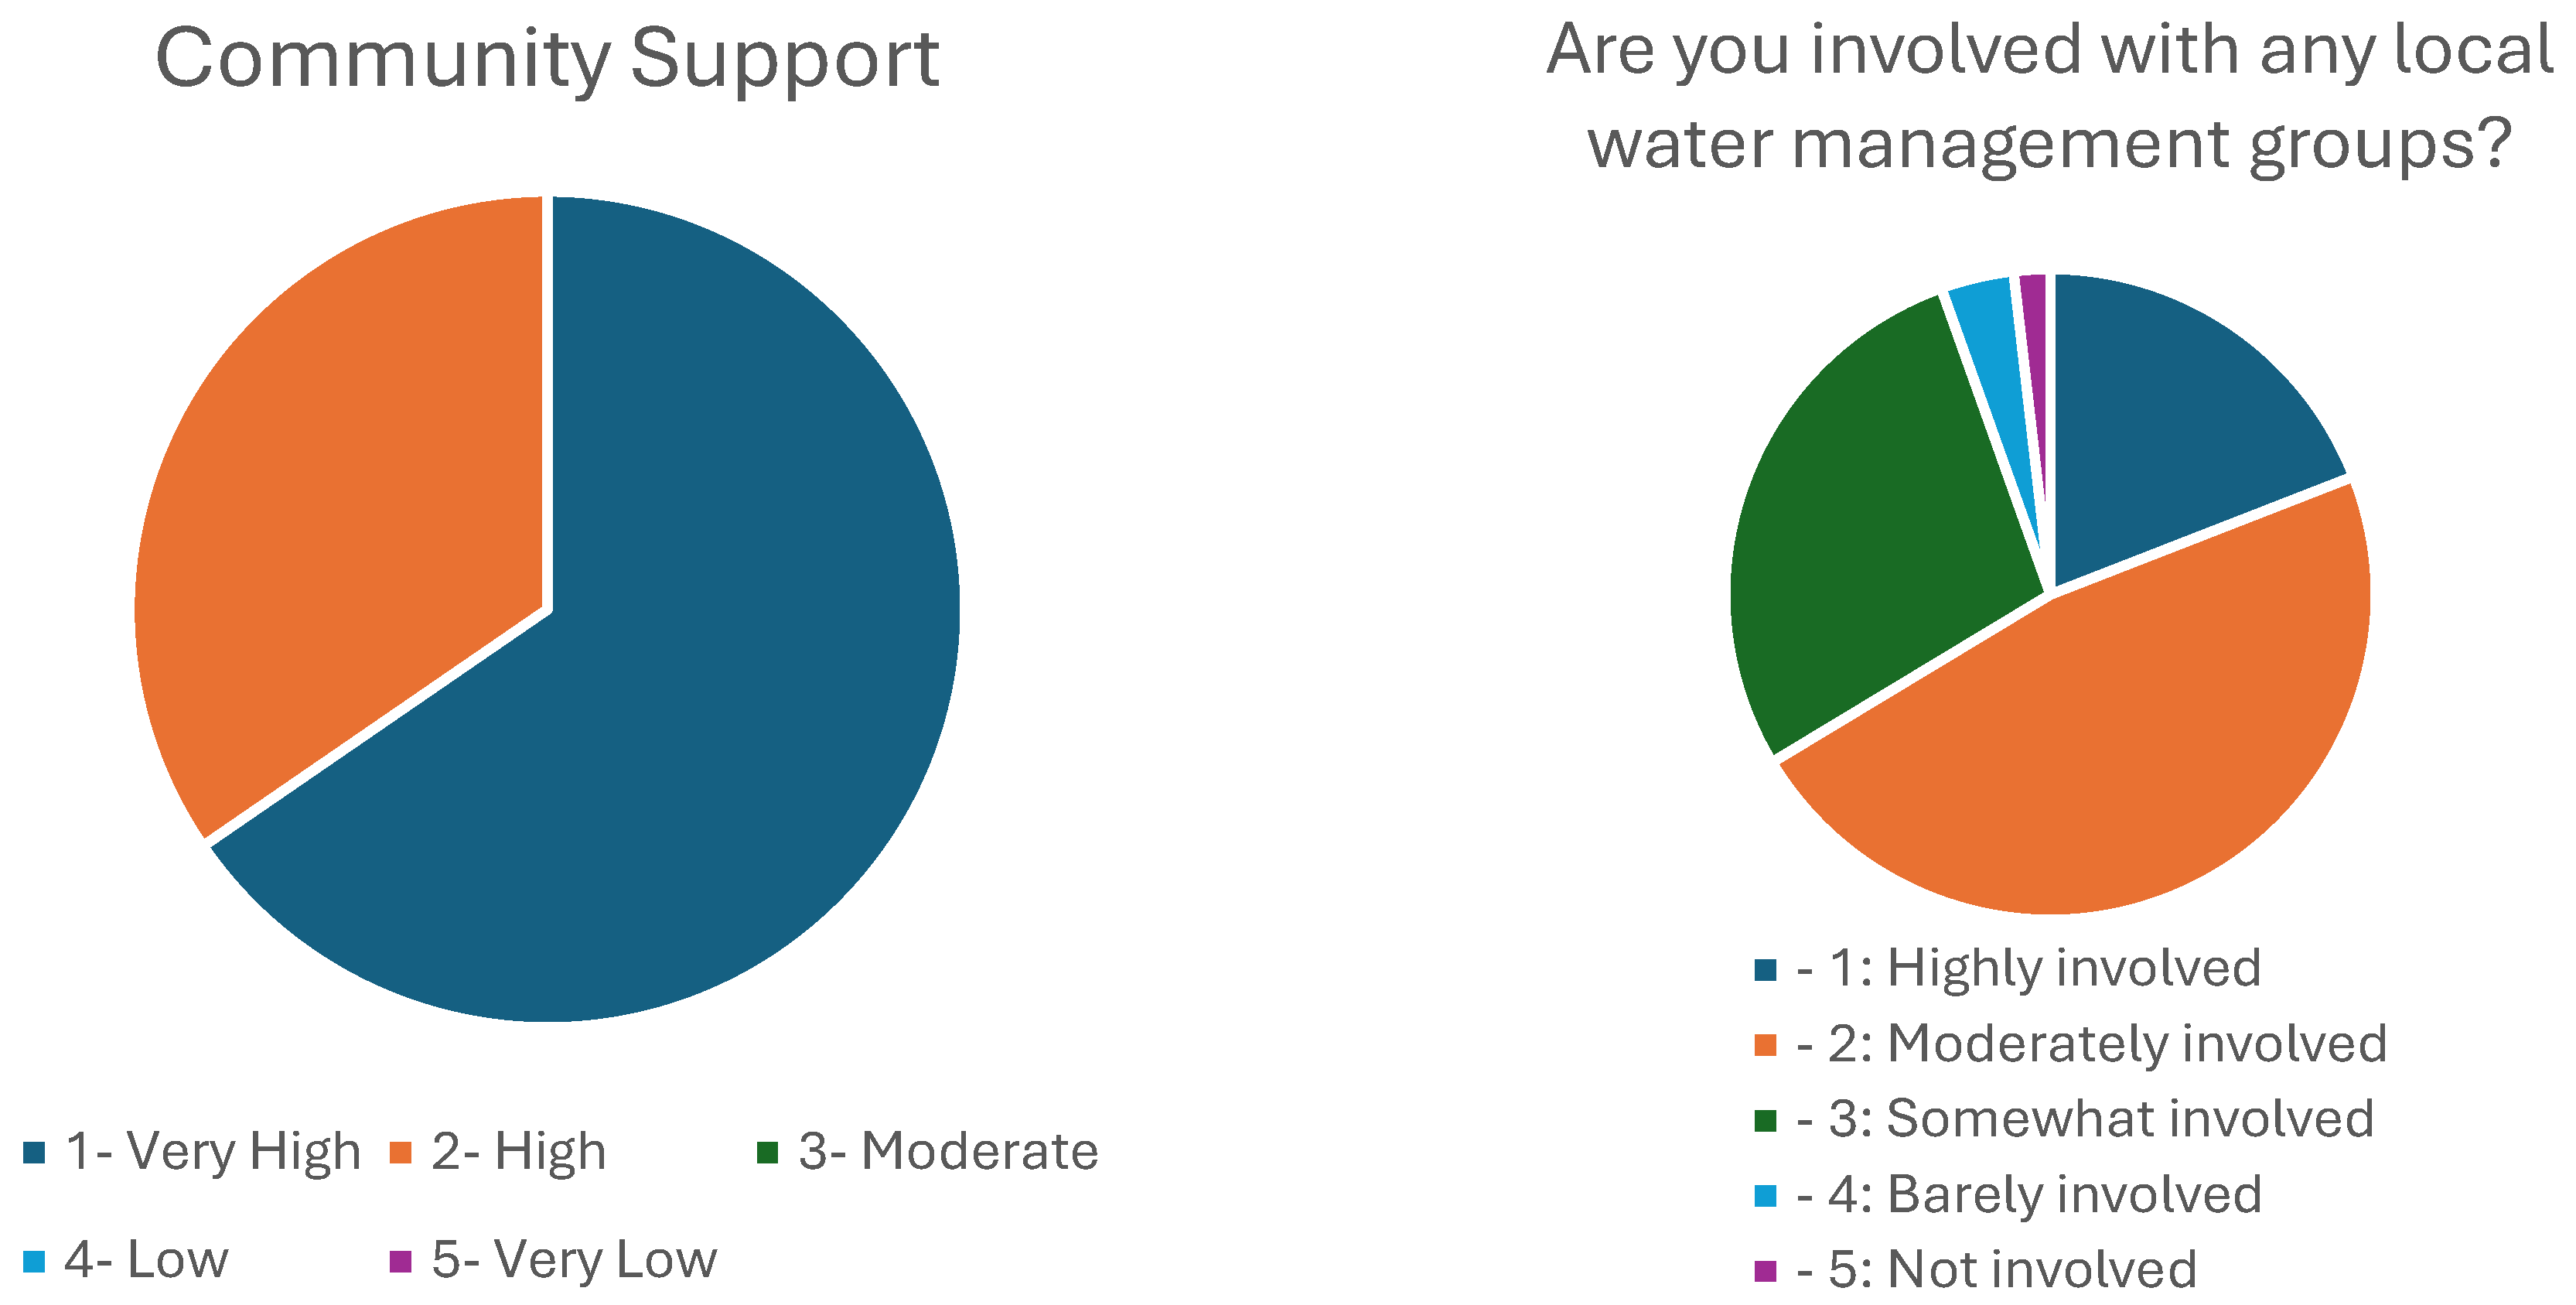
Community engagement in local water management groups is mixed, with a significant number of respondents indicating moderate to high levels of involvement. This engagement suggests a community that is somewhat active and potentially receptive to initiatives for improving local resilience to climate change. On the other hand, a portion of the population is less involved, which may reflect barriers to participation or differing priorities. Understanding the factors that drive or hinder community involvement can inform strategies to foster more significant collective action in response to environmental challenges.
Open-Ended Responses
Open-ended responses highlight specific incidents, such as floods and landslides, directly impacting businesses and agriculture. Concerns about the changing climate patterns affecting the availability and quality of water sources are evident, with some respondents attributing these changes to climate change, deforestation, and natural variations. The survey data analysis reveals a community experiencing and observing tangible environmental changes due to climate change. There is a clear indication of altered weather patterns, water scarcity issues, and shifts in agricultural practices. Despite these challenges, the community's solid social support network and involvement in local environmental management suggest a capacity for resilience and adaptation. The data underscores the need for continued monitoring, community engagement, and adaptive strategies to mitigate the impacts of climate change on these vulnerable mountain communities.
4. Discussion
4.1. Climatic and Environmental Changes in the ACA
The Annapurna Conservation Area (ACA) has undergone significant climatic and environmental changes over the past 35 years. The observed warming trends, particularly the increase in maximum temperatures, align with global patterns of climate change affecting mountainous regions. This warming has contributed to the reduction of snow cover, as indicated by decreasing NDSI values. The diminishing snow cover not only impacts the region's hydrology by altering the timing and quantity of snowmelt but also affects local ecosystems that rely on cold temperatures and snowpack for survival.
Changes in precipitation patterns were also evident, with an increase in both the frequency and intensity of extreme precipitation events. The rise in moderate extreme events, such as days with rainfall exceeding 30 mm, poses risks of flooding and landslides, which are significant concerns in mountainous terrains like the ACA. This was particularly evident in the recent impacts of flooding, as the region continues to recover from the severe floods in Kagbeni, while residents of Chame recount their struggles and hardships due to flood-related damages The decadal analysis showed that lower elevation areas experienced more pronounced increases in rainfall, which could exacerbate these risks and impact agricultural activities and infrastructure.
The increase in vegetation cover and NDVI values suggests a greening of the ACA. While this may be partly attributed to successful conservation efforts and natural regrowth due to reduced deforestation and afforestation initiatives from the conservation effort, it may also result from climate-induced changes. Warming temperatures can extend the growing season and allow vegetation to expand into higher elevations and previously barren areas. This shift in vegetation zones can have complex effects on local biodiversity, potentially benefiting some species while disadvantaging others adapted to specific climatic conditions.
4.2. Implications for Ecosystems and Biodiversity
The upward shift of vegetation zones may lead to habitat changes for alpine and sub-alpine species. Species that are adapted to colder environments may find their habitats shrinking, potentially leading to a loss of biodiversity. Additionally, the encroachment of woody vegetation into grasslands and alpine meadows can alter ecosystem dynamics, affecting not only plant communities but also the wildlife that depends on them.
The reduction in snow cover has implications for water availability, as snowpack acts as a natural reservoir, slowly releasing water during warmer months. Changes in snowmelt patterns can affect streamflow regimes, impacting both aquatic ecosystems and the availability of water for agricultural and domestic use. Furthermore, the increase in extreme precipitation events can lead to soil erosion and sedimentation in waterways, affecting water quality and aquatic habitats.
4.3. Community Perceptions and Adaptive Responses
The perceptions of local communities align with the environmental changes observed through remote sensing and meteorological data. Residents reported warmer temperatures, reduced snowfall, unpredictable rainfall, and the emergence of new agricultural pests. These changes have direct impacts on their livelihoods, particularly in agriculture, which is sensitive to climatic variations.
Communities have adopted various adaptive strategies to cope with these challenges. Adjustments in agricultural practices include changing planting schedules, introducing climate-resilient crop varieties, and increasing the use of pest control measures. Water conservation techniques, such as rainwater harvesting and the use of efficient irrigation systems, have been implemented to address water scarcity and manage variability in water supply.
Participation in local environmental initiatives and conservation programs reflects a proactive approach by communities to address environmental changes. However, respondents expressed the need for greater support from governmental and non-governmental organizations. Enhanced technical assistance, access to climate-resilient agricultural inputs, and infrastructure development were identified as critical areas where external support could strengthen community resilience.
4.4. Integrating Remote Sensing and Community Insights for Sustainable Adaptation
The integration of remote sensing data with community perceptions provides a comprehensive understanding of the impacts of climate change in the ACA. Remote sensing offers objective, large-scale insights into environmental changes over time, while community perceptions provide context-specific information on how these changes affect local livelihoods and well-being.
This integrated approach is valuable for developing sustainable climate adaptation strategies. By combining scientific data with local knowledge, policymakers and resource managers can design interventions that are both evidence-based and tailored to the needs of the communities. Such strategies are more likely to be effective and sustainable in the long term.
For instance, understanding the specific ways in which climate change affects water availability can inform the development of adaptive water management practices that address both supply and demand aspects. Similarly, insights into changes in vegetation cover and land use can guide conservation efforts that balance ecological integrity with the socio-economic needs of local populations.
4.5. Implications for Sustainability and Policy Recommendations
The findings of this study have important implications for sustainability in mountain ecosystems like the ACA. The observed environmental changes highlight the need for adaptive management practices that enhance the resilience of both ecosystems and communities. The integration of our findings with the United Nations Sustainable Development Goals (SDGs) provides a framework for assessing the broader impact of climate adaptation strategies in the Annapurna Conservation Area (ACA). Table 7 outlines how our study's outcomes align with specific targets under SDGs 6 (Clean Water and Sanitation) and 13 (Climate Action), along with tailored recommendations to enhance sustainability efforts.
Strengthening Conservation Efforts: Continued support for conservation initiatives is essential. Efforts should focus on preserving biodiversity, protecting critical habitats, and promoting sustainable land use practices. Conservation strategies should consider the potential impacts of climate change on species distributions and ecosystem functions.
Adaptive Water Resource Management: Given the changes in precipitation patterns and snow cover, adaptive water management strategies are crucial. Implementing efficient irrigation systems, promoting water conservation, and developing infrastructure for water storage can help mitigate water scarcity and support agricultural productivity.
Community Engagement and Support: Enhancing the capacity of local communities to adapt to climate change is vital. Providing technical assistance, access to climate-resilient agricultural inputs, and support for infrastructure development can empower communities to implement effective adaptation measures.
Integrating Scientific and Local Knowledge: Developing platforms for collaboration between scientists, policymakers, and local communities can facilitate the integration of scientific data with local insights. Participatory research and decision-making processes ensure that adaptation strategies are relevant and culturally appropriate.
Policy Development: Policymakers should consider the findings of this study in the development of climate adaptation policies. Supporting research and monitoring efforts, investing in infrastructure, and creating enabling environments for community-led initiatives are key components of effective policy responses.
4.6. Limitations and Future Research Directions
While this study provides valuable insights, certain limitations should be acknowledged. The reliance on Landsat imagery, with its spatial and temporal resolution constraints, may affect the precision of land cover analyses. Gaps in meteorological data, particularly in remote areas, can limit the accuracy of climate trend assessments. Additionally, community surveys, while informative, may not capture the full diversity of experiences and may be subject to response biases.
Future research should focus on enhancing data quality and coverage. Utilizing higher-resolution satellite imagery and expanding meteorological monitoring networks can improve the accuracy of environmental assessments. Longitudinal studies involving more extensive community engagement can provide deeper insights into the socio-economic impacts of climate change and the effectiveness of adaptation strategies.
Exploring the interactions between climate change, land use dynamics, and ecosystem services is another important area for future research. Understanding these complex relationships can inform more holistic approaches to sustainability in mountain ecosystems.
The integration of remote sensing data and community perceptions offers a robust framework for assessing climate change impacts and informing sustainable adaptation strategies in mountain ecosystems. The findings of this study underscore the importance of holistic approaches that consider both environmental and socio-economic dimensions of sustainability.
By enhancing our understanding of the changes occurring in the ACA and how communities are responding, this research contributes to the development of adaptation strategies that are both effective and grounded in local realities. This approach aligns with the goals of sustainability by promoting the well-being of current and future generations while preserving the integrity of the ecosystem.
15. Conclusions
This study provides a comprehensive analysis of climatic and environmental changes in the Annapurna Conservation Area (ACA) over the past 35 years (1988–2023) by integrating remote sensing data, meteorological records, and community perceptions. The findings highlight significant trends in climate variability, land use and land cover changes, and community responses, offering valuable insights into the region's climate resilience.
The climatic analysis revealed a general warming trend in the ACA, with significant increases in maximum temperatures contributing to glacier retreat and reduced snow cover, as evidenced by decreasing NDSI values. Precipitation patterns have also changed, with an increase in moderate extreme precipitation events and variability in rainfall distribution. Higher elevation stations exhibited gradual increases in mean monthly rainfall during monsoon months, while lower elevation stations experienced more pronounced changes. These climatic shifts have critical implications for water resources, altering hydrological cycles and increasing flood risks, which pose challenges for water management and community livelihoods.
Land use and vegetation dynamics have also undergone notable changes. The expansion of vegetation cover, indicated by increased NDVI values, results from both successful conservation efforts and climate-induced changes such as warming temperatures and reduced snow cover. While the greening of the ACA enhances ecosystem services like carbon sequestration, it may also lead to the upward migration of vegetation zones, potentially resulting in the loss of alpine habitats and affecting biodiversity.
Community perceptions gathered through surveys align with the scientific data, with residents observing warmer temperatures, reduced snowfall, more intense rainfall events, and shifts in vegetation. These changes have impacted agricultural practices, necessitating adjustments in planting schedules and introducing new challenges such as pest infestations and increased vulnerability to extreme weather events. Communities are proactively adopting adaptive measures, including water conservation techniques, participation in environmental initiatives, and adjustments to agricultural practices. However, there is a clear need for greater government assistance, policy interventions, and infrastructure development to enhance community resilience.
The study underscores the necessity of developing integrated adaptation strategies that address climatic changes, ecosystem dynamics, and socio-economic factors. Effective water resource management, disaster risk reduction, and support for climate-resilient agriculture are essential components of enhancing climate resilience in the ACA. Policy implications include strengthening local governance structures, investing in resilient infrastructure, and promoting education and awareness programs to support sustainable adaptation.
While this research provides valuable insights, certain limitations should be acknowledged. Data gaps due to the limited availability and spatial distribution of meteorological stations may affect the precision of climatic trend analyses. The temporal and spatial resolution of Landsat imagery imposes constraints on detecting fine-scale changes. Additionally, community surveys may be subject to response biases, and the sample may not fully represent the entire population of the ACA. Future research should focus on establishing comprehensive monitoring programs, adopting interdisciplinary approaches, and developing models to project future climatic scenarios.
In conclusion, this study highlights the intricate interplay between climate change, environmental dynamics, and human systems in the ACA. The findings emphasize the urgency of adopting holistic and collaborative approaches to enhance climate resilience in vulnerable mountain ecosystems. By integrating scientific data with local knowledge, policymakers and stakeholders can develop effective strategies that support sustainable resource management, biodiversity conservation, and the well-being of local communities.
This research contributes to achieving the United Nations Sustainable Development Goals, particularly SDG 6 (Clean Water and Sanitation) and SDG 13 (Climate Action), by providing actionable insights into climate adaptation in mountain regions. It underscores the importance of protected areas like the ACA not only in preserving biodiversity and ecosystem services but also in supporting cultural and socio-economic well-being to promote sustainable livelihoods.
Supplementary Materials
The following supporting information can be downloaded at the website of this paper posted on Preprints.org, Figure S1. NDVI imagery of the study area in the years 1988, 1996, 2013, and 2023, Figure S1. NDSI imagery of the study area in the years 1988, 1996, 2013, and 2023 Figure S3. Man-Kendell trend test and sen-slope estimator chart for precipitation., Figure S3. Man-Kendell trend test and sen-slope estimator chart for Tmin and Tmax S5. Household survey questionnaire
Author Contributions
Conceptualization, Ankita Pokhrel and Ping Fang; methodology, Ankita Pokhrel; software, Ankita Pokhrel; validation, Ankita Pokhrel and Ping Fang; formal analysis, Ankita Pokhrel; investigation, Ankita Pokhrel; and Gaurav Bastola, resources, Ankita Pokhrel; and Gaurav Bastola, data curation, Ankita Pokhrel; and Gaurav Bastola, writing—original draft preparation, Ankita Pokhrel; writing—review and editing, Ping Fang; visualization, Ankita Pokhrel; supervision, Ping Fang; project administration, Ping Fang; funding acquisition, Ping Fang. All authors have read and agreed to the published version of the manuscript.
Funding
This study was supported by the Science and Technology Commission of Shanghai Municipality (23HC1400300).
Institutional Review Board Statement
Not Applicable
Informed Consent Statement
Informed consent was obtained from all subjects involved in the study.
Data Availability Statement
We encourage all authors of articles published in MDPI journals to share their research data. In this section, please provide details regarding where data supporting reported results can be found, including links to publicly archived datasets analyzed or generated during the study. Where no new data were created, or where data is unavailable due to privacy or ethical restrictions, a statement is still required. Suggested Data Availability Statements are available in section “MDPI Research Data Policies” at https://www.mdpi.com/ethics.
Acknowledgments
In this section, you can acknowledge any support given which is not covered by the author contribution or funding sections. This may include administrative and technical support, or donations in kind (e.g., materials used for experiments).
Conflicts of Interest
The authors declare no conflicts of interest. The funders had no role in the design of the study; in the collection, analyses, or interpretation of data; in the writing of the manuscript; or in the decision to publish the results.
Appendix A
Figure S1.
NDVI imagery of the study area in the years 1988, 1996, 2013, and 2023.
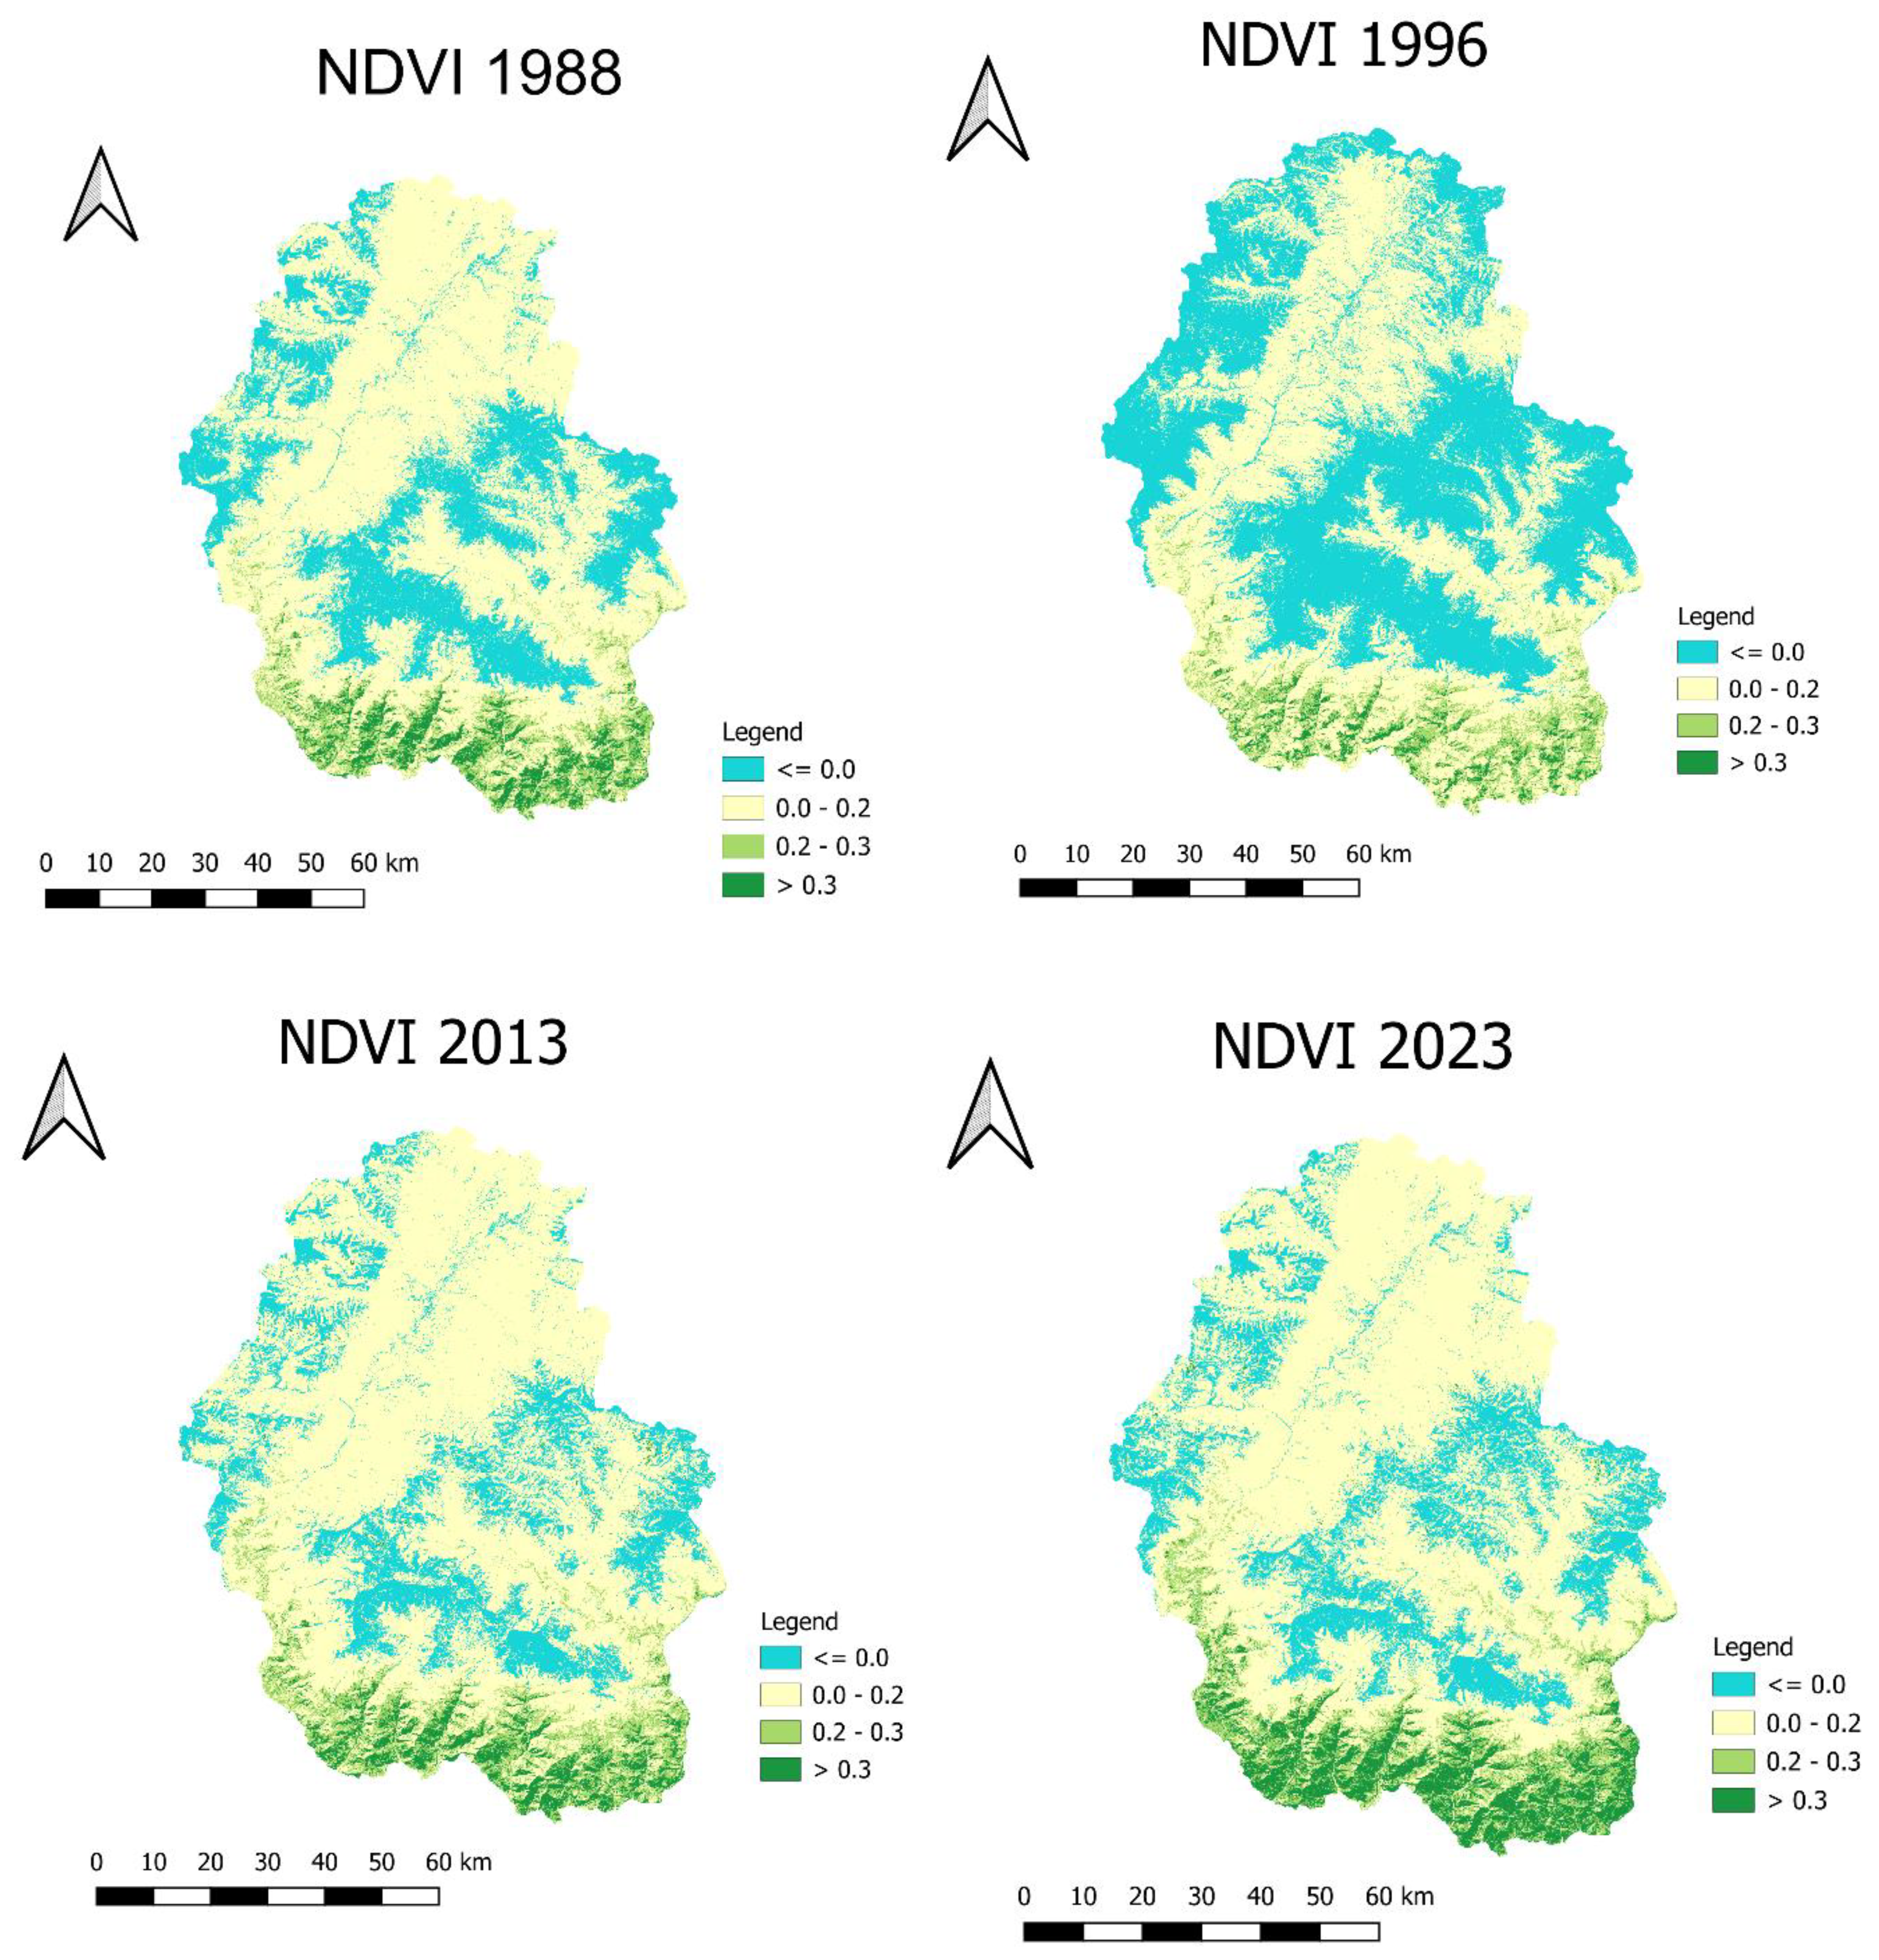
Figure S2.
NDSI imagery of the study area in the years 1988, 1996, 2013, and 2023.
Appendix B
Figure S3.
Man-Kendell trend test and sen-slope estimator chart for precipitation.
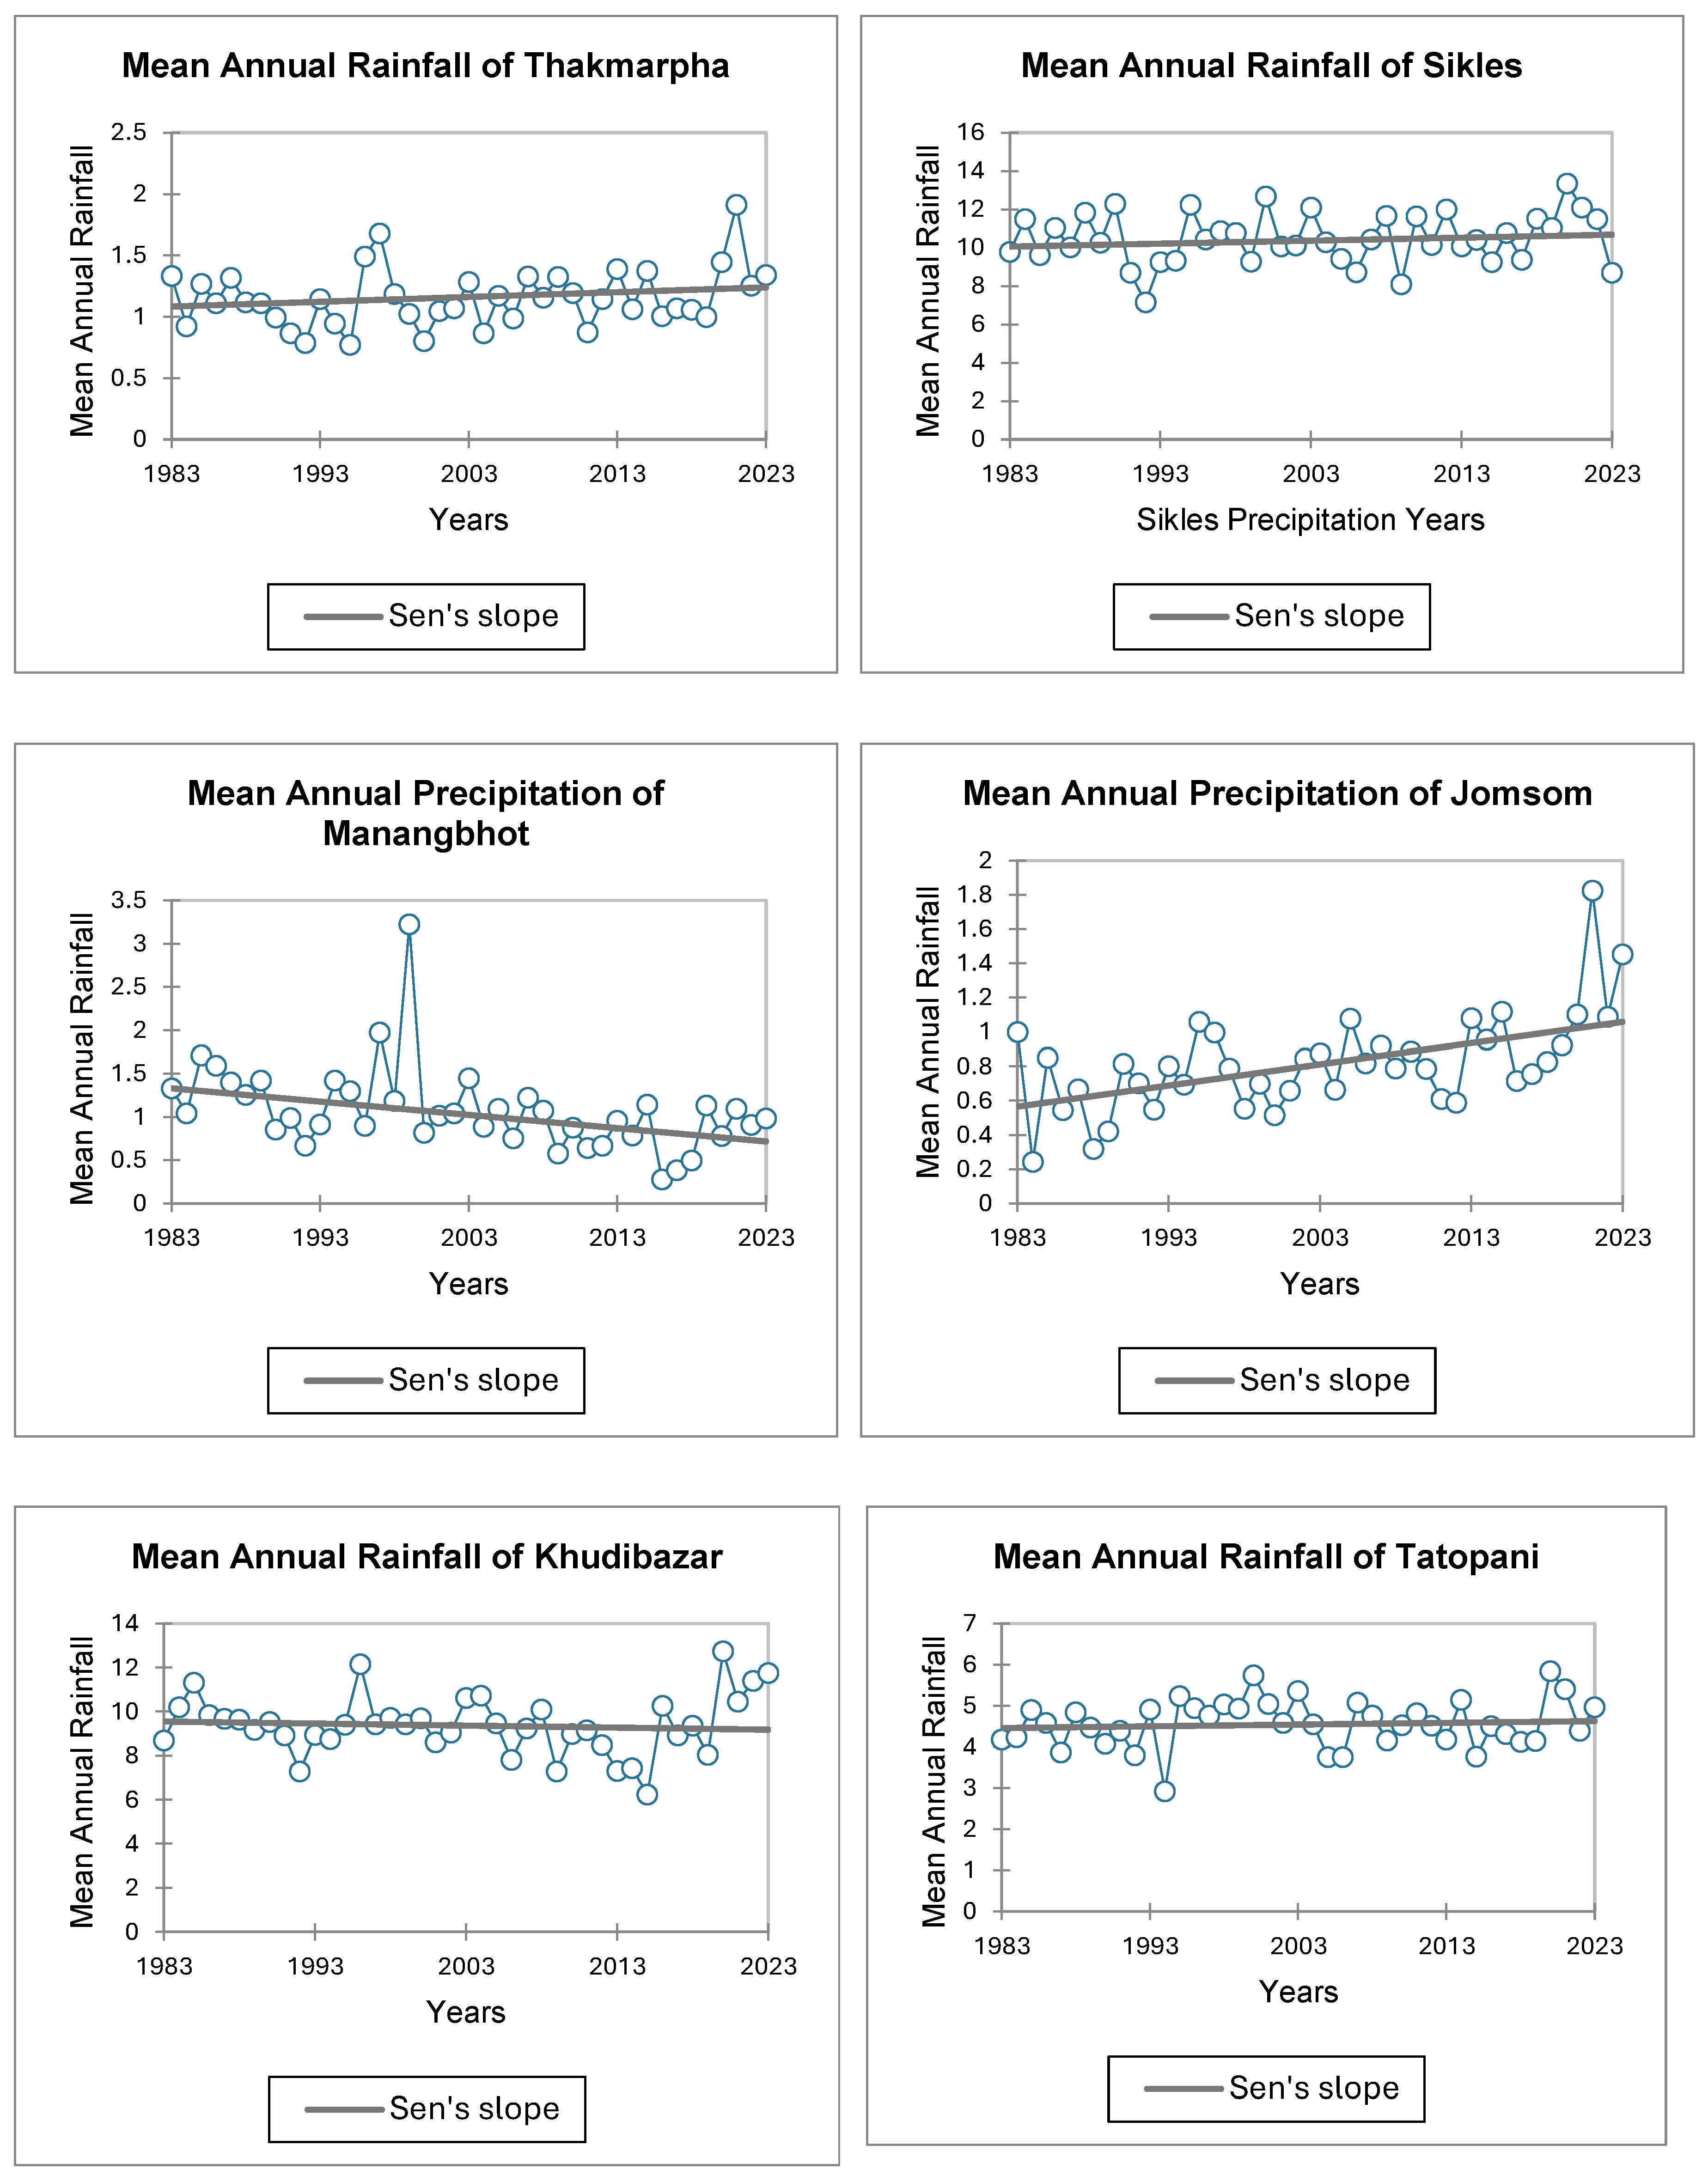
Figure S4.
Man-Kendell trend test and sen-slope estimator chart for Tmin and Tmax
Appendix C
S5. Household survey questionnaire
References
- Schirpke, U.; Kohler, M.; Leitinger, G.; Fontana, V.; Tasser, E.; Tappeiner, U. Future Impacts of Changing Land-Use and Climate on Ecosystem Services of Mountain Grassland and Their Resilience. Ecosystem Services 2017, 26, 79–94. [Google Scholar] [CrossRef] [PubMed]
- Lutz, A.F.; Immerzeel, W.W.; Siderius, C.; Wijngaard, R.R.; Nepal, S.; Shrestha, A.B.; Wester, P.; Biemans, H. South Asian Agriculture Increasingly Dependent on Meltwater and Groundwater. Nature Climate Change 2022, 12, 566–573. [Google Scholar] [CrossRef]
- Viviroli, D.; Dürr, H.H.; Messerli, B.; Meybeck, M.; Weingartner, R. Mountains of the World, Water Towers for Humanity: Typology, Mapping, and Global Significance. Water Resources Research 2007, 43, 7447–7447. [Google Scholar] [CrossRef]
- Immerzeel, W.W.; Lutz, A.F.; Andrade, M.; Bahl, A.; Biemans, H.; Bolch, T.; Hyde, S.; Brumby, S.; Davies, B.J.; Elmore, A.C.; et al. Importance and Vulnerability of the World’s Water Towers. Nature 2020, 577, 364–369. [Google Scholar] [CrossRef] [PubMed]
- NTNC National Trust for Nature Conservation. 2022.
- Telwala, Y.; Brook, B.W.; Manish, K.; Pandit, M.K. Climate-Induced Elevational Range Shifts and Increase in Plant Species Richness in a Himalayan Biodiversity Epicentre. PLOS ONE 2013, 8, e57103. [Google Scholar] [CrossRef] [PubMed]
- Kumar, P.; Patel, A.; Rai, J.; Kumar, P. Environmental Challenges and Concurrent Trend of Weather Extremes over Uttarakhand Himalaya. Theor Appl Climatol 2024, 155, 1217–1246. [Google Scholar] [CrossRef]
- Demberel, O.; Munkhbat, B.; Dorjsuren, B.; Callaghan, T.V.; Tsogoo, B.; Zemtsov, V.A.; Shaarav, O.; Gongor, E.; Jargalsaikhan, Z.; Ganhuyag, N.; et al. Relationship between Dynamics of Modern Glaciers of the Mt. Munkhkhairkhan (Mongolian Altai) and Climate. Water 2023, 15, 1921. [Google Scholar] [CrossRef]
- Shrestha, S.; Poudel, D.D.; Duex, T.W.; Yantis, R.B. Changing Climatic Conditions Affect Snow Cover in Annapurna Region of Nepal. Strategic Planning for Energy and the Environment 2023, 41, 215–240. [Google Scholar] [CrossRef]
- Bhatta, K.P.; Aryal, A.; Baral, H.; Khanal, S.; Acharya, A.K.; Phomphakdy, C.; Dorji, R. Forest Structure and Composition under Contrasting Precipitation Regimes in the High Mountains, Western Nepal. Sustainability 2021, 13, 7510. [Google Scholar] [CrossRef]
- Soenen, S.; Peddle, D.; Coburn, C. : : A Modified Sun-Canopy-Sensor Topographic Correction in Forested Terrain. Geoscience and Remote Sensing, IEEE Transactions on 2005, 43, 2148–2159. [Google Scholar] [CrossRef]
- Sola, I.; González-Audícana, M.; Álvarez-Mozos, J. Multi-Criteria Evaluation of Topographic Correction Methods. Remote Sensing of Environment 2016, 184, 247–262. [Google Scholar] [CrossRef]
- WHO/UNICEF Joint Monitoring Program for Water Supply, Sanitation and Hygiene (JMP) - Progress on Household Drinking Water, Sanitation and Hygiene 2000-2017. Available online: https://www.unwater.org/publications/who/unicef-joint-monitoring-program-water-supply-sanitation-and-hygiene-jmp-progress (accessed on 30 March 2024).
Figure 1.
Map of the study area showing the Annapurna Conservation Area and selected villages.
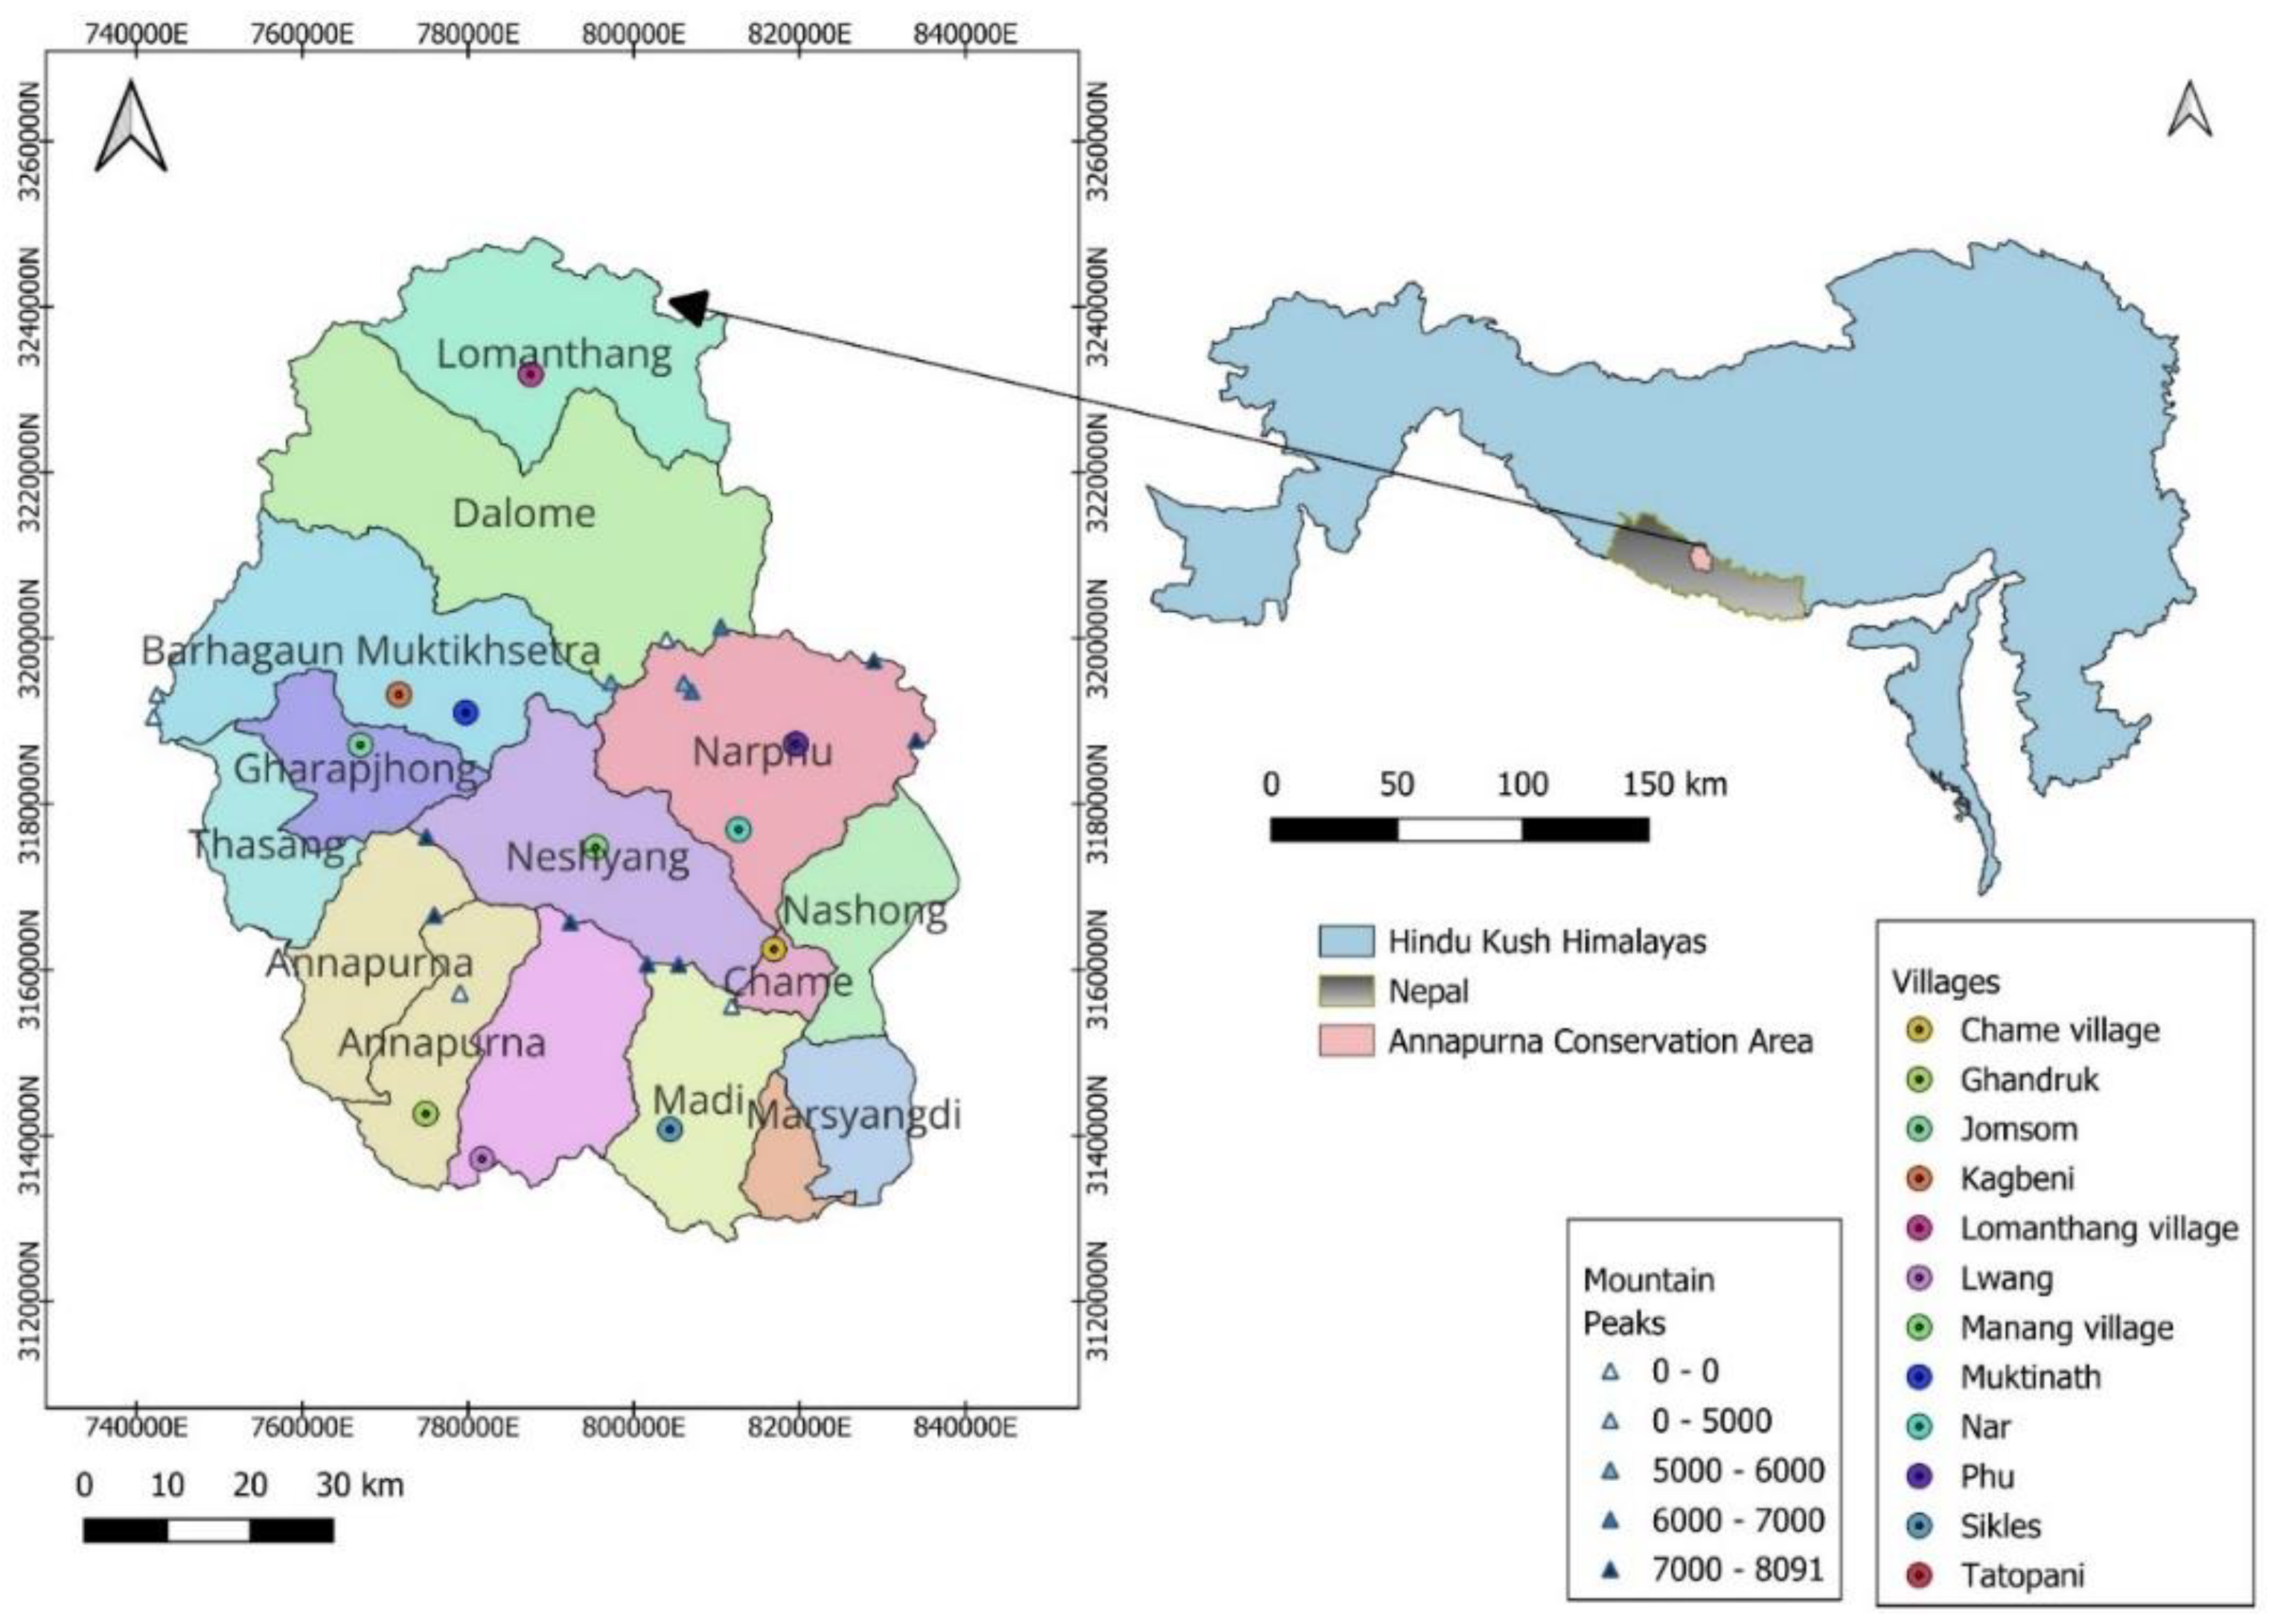
Figure 2.
LULC classification maps of the ACA for the years (a) 1988, (b) 1996, (c) 2013, and (d) 2023.
Figure 2.
LULC classification maps of the ACA for the years (a) 1988, (b) 1996, (c) 2013, and (d) 2023.
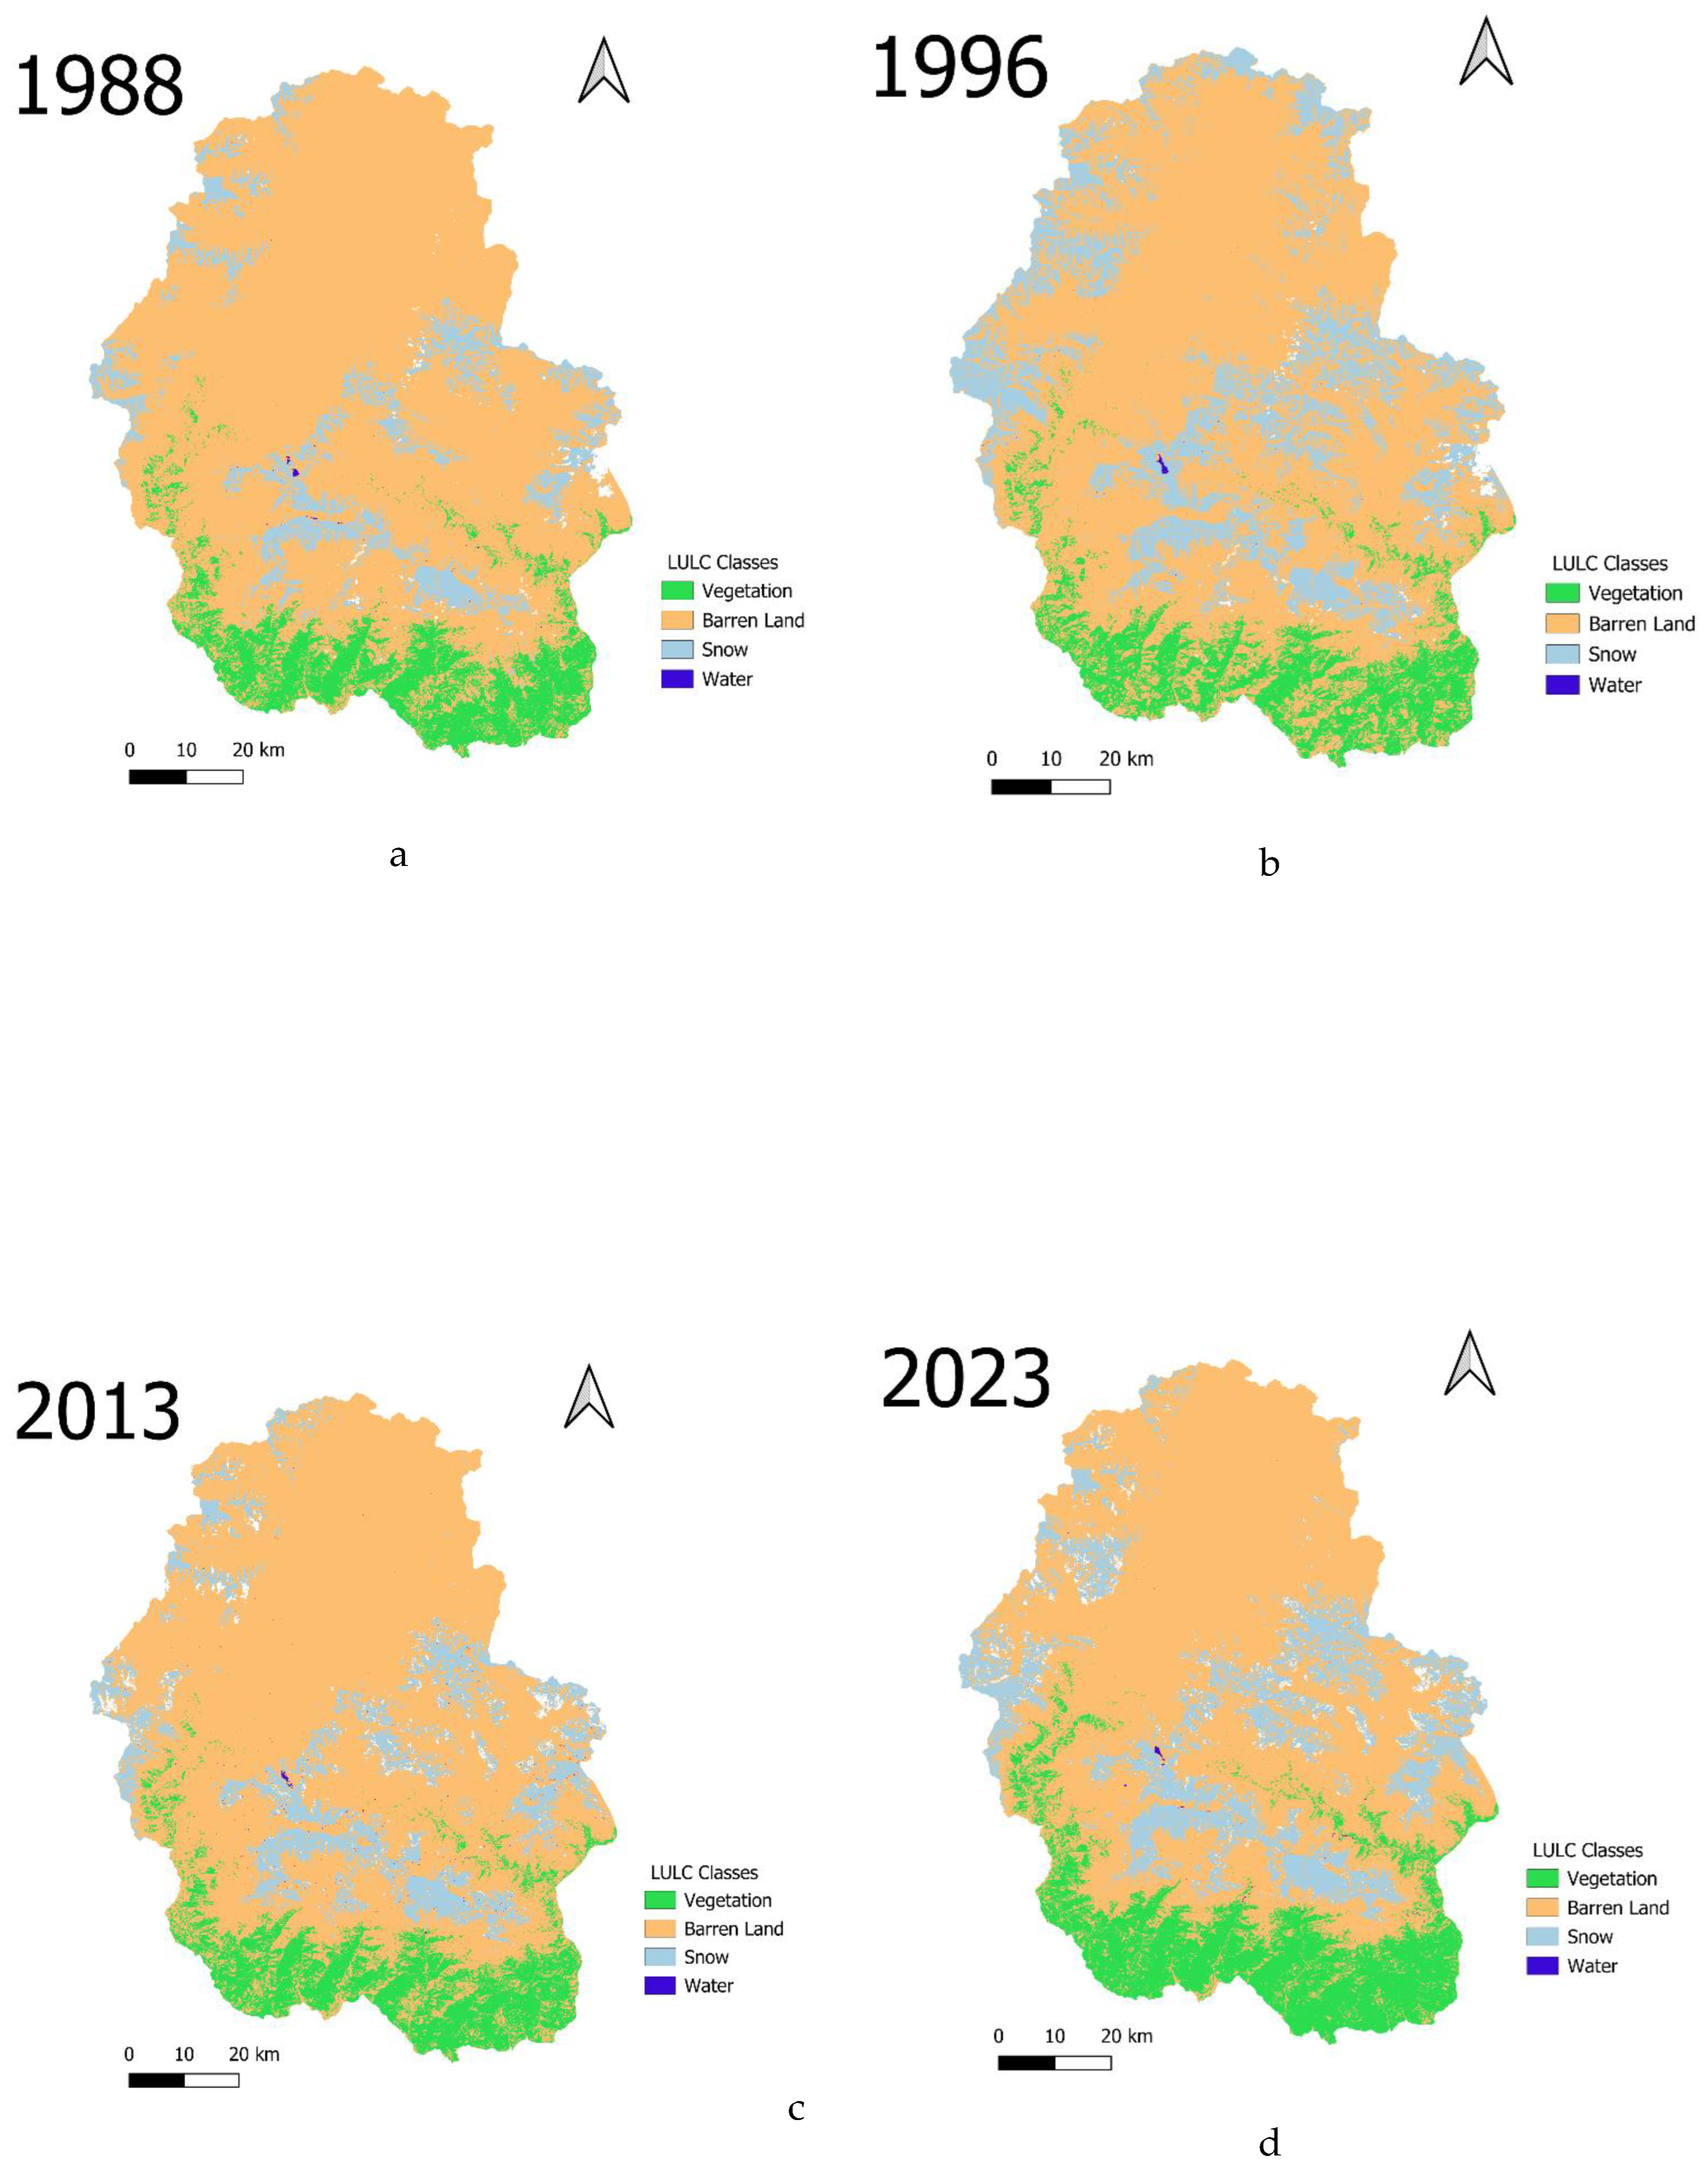

Table 1.
Landsat satellite imagery used in the study.
| Date | Satellite/Sensor | Scene (Path/Row) | Sun Azimuth (˚) | Sun Elevation | Cloud Coverage |
|---|---|---|---|---|---|
| 1988-11-20 | Landsat 5 TM | 142/40 | 149.43 | 35.21 | 2% |
| 1996-12-12 | Landsat 5 TM | 142/40 | 147.51 | 30.46 | 4% |
| 2013-12-27 | Landsat 8 OLI | 142/40 | 155.30 | 33.57 | 1% |
| 2023-11-21 | Landsat 8 OLI | 142/40 | 157.42 | 38.02 | 2% |
Table 2.
Meteorological Stations and Available Data.
| Station Index | Name | District | Latitude | Longitude | Elevation | Type of Station |
|---|---|---|---|---|---|---|
| 0601 | Jomsom | Mustang | 28.7840111 | 83.7298167 | 2741 | Temperature / Precipitation |
| 0604 | Thakmarpha | Mustang | 28.740909 | 83.681614 | 2655 | Temperature / Precipitation |
| 0802 | Khudi Bazar | Lamjung | 28.28220833 | 84.35640278 | 838 | Temperature / Precipitation |
| 0820 | Manang Bhot | Manang | 28.66627083 | 84.02257194 | 3556 | Precipitation |
| 0824 | Sikles | Kaski | 28.355852 | 84.102068 | 1967 | Precipitation |
| 0606 | Tatopani | Myagdi | 28.477492 | 83.6404158 | 1161 | Precipitation |
Table 3.
Area (in hectares) of different land cover classes from 1988 to 2023.
| Year | Class | Name | Area(ha) |
|---|---|---|---|
| 1988 | 1 | Vegetation | 57858.84 |
| 2 | Snow | 49583.25 | |
| 3 | Barren | 389018.9 | |
| 4 | Water | 207.72 | |
| 1996 | 1 | Vegetation | 54111.6 |
| 2 | Barren | 346648.9 | |
| 3 | Snow | 95991.75 | |
| 4 | Water | 177.21 | |
| 2013 | 1 | Vegetation | 57501.27 |
| 2 | Barren | 369110.8 | |
| 3 | Snow | 62364.6 | |
| 4 | Water | 473.94 | |
| 2023 | 1 | Vegetation | 77634.27 |
| 2 | Snow | 80323.38 | |
| 3 | Barren | 331252.8 | |
| 4 | Water | 222.93 |
Table 4.
NDVI and NDSI statistics from 1988 to 2023.
| Years | NDVI min. | NDVI max. | NDVI avg. | NDSI min. | NDSI max. | NDSI avg. |
|---|---|---|---|---|---|---|
| 1988 | -0.324 | 0.461 | 0.069 | -0.451 | 0.765 | 0.157 |
| 1996 | -0.270 | 0.440 | 0.085 | -0.440 | 0.791 | 0.176 |
| 2013 | -0.331 | 0.989 | 0.329 | -0.996 | 0.808 | -0.094 |
| 2023 | -0.304 | 0.983 | 0.340 | -0.995 | 0.776 | -0.109 |
Table 5.
Mann-Kendall trend test and sen-slope estimator results for temperature data.
| Stations | Tmax | Tmin | |
|---|---|---|---|
| Thakmarpha | p-value | <0.0001 | 0.001 |
| sen-slope | 0.040 | -0.033 | |
| Trend | Positive | Negative | |
| Jomsom | p-value | 0.866 | 0.745 |
| sen-slope | 0.001 | 0.006 | |
| Trend | Positive | Positive | |
| Khudibazar | p-value | <0.0001 | 0.328 |
| sen-slope | 0.040 | 0.010 | |
| Trend | Positive | Positive |
Table 6.
Mann-Kendall trend test and sen-slope estimator results for precipitation data.
| Stations | Precipitation | |
|---|---|---|
| Thakmarpha | p-value | 0.154 |
| sen-slope | 0.004 | |
| Trend | Positive | |
| Jomsom | p-value | 0.000 |
| sen-slope | 0.012 | |
| Trend | Positive | |
| Khudibazar | p-value | 0.661 |
| sen-slope | -0.009 | |
| Trend | Negative | |
| Sikles | p-value | 0.465 |
| sen-slope | 0.016 | |
| Trend | Positive | |
| Manang Bhot | p-value | 0.001 |
| sen-slope | -0.015 | |
| Trend | Negative | |
| Tatopani | p-value | 0.582 |
| sen-slope | 0.004 | |
| Trend | Positive |
Table 7.
Alignment of study findings with relevant United Nations Sustainable Development Goals (SDGs) 6 and 13. The colors represent the following: Green indicates good progress or positive outcomes with minor improvements needed, Orange denotes mixed results or moderate progress with significant room for enhancement, and Red reflects poor progress or major issues requiring immediate attention.
| Relevant SDG Target | Indicator | Assessment | Recommendation |
|---|---|---|---|
| 6.1 Achieve universal and equitable access to safe and affordable drinking water for all | Piped water access in surveyed households, higher than recent years |
 High rate of access to piped water, indicating effective infrastructure improvements; however, ongoing maintenance and further expansion to remote areas is necessary |
Continue infrastructure maintenance, expand piped water systems to underserved and remote areas, and monitor water quality regularly |
| 6.4 Substantially increase water-use efficiency and ensure sustainable water withdrawals | Water availability and seasonal trends |
 Survey data shows mixed trends in water availability, with some areas experiencing seasonal scarcity due to changing climate patterns |
Foster cross-sectoral cooperation for water management, implement efficient irrigation techniques, and explore rainwater harvesting initiatives |
| 6.6 By 2020, protect and restore water-related ecosystems, including mountains, forests, wetlands, rivers, aquifers and lakes | Increase in vegetation cover change analysis, Fluctuations in snow cover (1988-2023) from the LULC |
Positive ecosystem changes observed, attributed to conservation and reforestation efforts; snow cover fluctuations present challenges for hydrological cycles |
Continue and expand conservation and reforestation efforts, integrate adaptive measures for snow cover management to balance hydrological needs |
| 6.B Support and strengthen the participation of local communities in improving water and sanitation management | Involvement of locals in water management groups |
Moderate engagement observed; community-driven water management initiatives show potential but require more structured support |
Strengthen community participation in water governance through training, capacity building, and incentives for local leadership |
| 13.1 Strengthen resilience and adaptive capacity to climate-related hazards and natural disasters in all countries | Community engagement in adaptation |
High engagement among communities in adaptive measures, though limited by resource constraints |
Expand resources and technical support for community-driven adaptation strategies, including early warning systems for extreme weather events |
| 13.2 Integrate climate change measures into national policies, strategies and planning | Implementation of climate mitigation measures |
Strong climate policies exist, but gaps remain in integrating local actions due to resource constraints and inconsistent support. Community initiatives often lack sufficient policy backing and technical resources. |
Establish frameworks for effective collaboration between local communities and national governance structures, ensuring bottom-up communication channels will help reflect local needs in policy development and encourage broader community engagement in achieving national climate goals. |
| 13.3 Improve education, awareness-raising and human and institutional capacity on climate change mitigation, adaptation, impact reduction and early warning | Awareness and adaptation actions |
Moderate to high levels of climate awareness among surveyed populations; further outreach and resource allocation are needed |
Develop comprehensive climate education programs, offer community workshops on climate adaptation, and strengthen local knowledge-sharing networks |
Disclaimer/Publisher’s Note: The statements, opinions and data contained in all publications are solely those of the individual author(s) and contributor(s) and not of MDPI and/or the editor(s). MDPI and/or the editor(s) disclaim responsibility for any injury to people or property resulting from any ideas, methods, instructions or products referred to in the content. |
© 2024 by the authors. Licensee MDPI, Basel, Switzerland. This article is an open access article distributed under the terms and conditions of the Creative Commons Attribution (CC BY) license (http://creativecommons.org/licenses/by/4.0/).
Copyright: This open access article is published under a Creative Commons CC BY 4.0 license, which permit the free download, distribution, and reuse, provided that the author and preprint are cited in any reuse.


