
Submitted:
19 November 2024
Posted:
21 November 2024
You are already at the latest version
Abstract
This paper demonstrates use of an Excel-based tool called “Electric Vehicle Charging Infrastructure Financial Analysis Spreadsheet Tool” or “EVCI-FAST” developed to analyze public-private partnership approaches to deliver publicly-accessible EV charging infrastructure that would not be commercially viable without a government subsidy. We conduct a high-level screening analysis for a hypothetical bundle of publicly-accessible EV charging stations to assess the financial viability of delivery of electric vehicle charging infrastructure (EVCI) using alternative public-private partnership (P3) structures. The demonstration suggests that EVCI-FAST could assist public agencies in determining whether their budgetary resources are adequate to support a proposed P3 for an EVCI project. The demonstration suggests that EVCI-FAST could also help agencies decide which P3 structuring option would best meet their financial objectives. The results from analysis of the hypothetical project suggest that public agencies could benefit considerably from a P3 structure that uses a minimum revenue guarantee to reduce revenue risk for the private partner.
Keywords:
Financial viability analysis
; public-private partnerships
; minimum revenue guarantee
; electric vehicle charging infrastructure
; sustainable transportation
1. Introduction
Publicly funded programs provide financial support for publicly accessible electric vehicle (EV) charging infrastructure in locations where they may not be commercially viable without public support. Grants catalyze private sector investment and the collaboration between the public and private sectors is called a “public-private partnership” or “P3.”
In the U.S., the public sector provides grants to partially reimburse the private partner as certain costs are incurred. However, such “grant-based” payment arrangements may not ensure operational performance of the EV charging infrastructure and achievement of all the goals of the public agency. A contract that provides for cost reimbursements during the construction and installation phase leaves the private partner with less incentive to maintain performance standards during the operations phase and could increase the likelihood that the contractor will simply walk away if revenue from user charges is inadequate to generate profits or if it finds that it is too costly to achieve performance standards set under the contract.
These challenges could be addressed through innovative performance-based P3 contracting approaches [1,2]. Performance-based P3s involve long-term contractual arrangements between the public and private sectors, under which compensation for the private partner’s initial investment and on-going operations depends on achieving project goals in accordance with contractual performance requirements. The key difference relative to the “grant-based” reimbursement approach is that the private partner finances all or a large part of the upfront investment and is compensated for those investments only during the operations phase, through user charges and “availability payments” from the government. Government payments can be reduced or withheld by the public agency if performance standards are not met. So, the private partner has a much greater incentive to maintain performance standards during the entire operations phase.
A P3 contract for EV charging infrastructure does not necessitate that the public agency take on significant commercial risk. The private partner has the exclusive right to collect user fees from the EV charging infrastructure sites in order to help repay its investment and operations costs, thus taking on considerable revenue risk due to the high uncertainty of demand and revenue from charging fees. However, a transfer of all revenue risk may not be optimal from the public agency’s perspective, since investors are likely to consider the highly uncertain future charging revenues and set a larger risk premium that will increase their bid prices.
To reduce revenue risk for bidders, the public agency could provide a “minimum revenue guarantee,” which is a “floor” below which the public agency would make up any revenue shortfall with a government subsidy. To protect the public agency from high contingent liabilities, this floor could be set at a level such that the present value of the guaranteed revenue paid out by the government never exceeds a specified amount.
On the other hand, demand for use of the EV charging infrastructure may increase faster than anticipated and lead to a return on investment for the private partner that is higher than is reasonable. To guard against such “windfall profits” for the private partner on a publicly subsidized investment, the P3 agreement could include a revenue sharing mechanism to allow the public agency to share in revenues that exceed a certain threshold.
A financial viability analysis can help a public agency decide on the most advantageous P3 structure from the public agency’s perspective. The analysis can help the public agency understand the potential impacts of alternative P3 structuring options on its financial position. Our literature search found that, while there are analytical tools that can assist in conducting financial viability analysis of highway P3 projects [3,4,5,6] there are no publicly available tools to specifically help in assessing financial viability of a P3 for publicly accessible electric vehicle charging infrastructure (EVCI). We therefore developed an Electric Vehicle Charging Infrastructure Financial Analysis Spreadsheet Tool (EVCI-FAST) to assist in conducting a high-level screening analysis to assess the financial viability of delivering an EVCI project using a P3 [7]. This paper demonstrates use of EVCI-FAST for financial viability analysis of a hypothetical project.
2. Materials and Methods
EVCI-FAST helps in assessing the financial viability of an EVCI P3 project, including the potential range of public subsidies that may be required, as well as potential payments from the private partner to the public agency in cases where the EVCI project may be capable of generating surplus revenue. The flow chart in Figure 1 provides a visual overview of the tool. Model inputs and outputs are explained in more detail in the following sub-sections.
The detailed analytical process used by the tool to perform calculations is discussed in the user guide [7]. In brief, a project's financial feasibility is estimated based on model inputs such as initial costs, operating expenses, revenue projections, and other essential financial parameters. Key steps are:
- Revenue Estimation: The model estimates the project’s revenues based on assumptions about user demand, pricing, and demand growth.
- Cost Estimation: This involves estimating both initial capital expenditures (CapEx) and ongoing operational expenses (OpEx). Inputs are provided in current year dollars and the model uses escalation factors to project these costs to future years of the project’s life or P3 concession term.
- Cash Flow Analysis: The model then calculates detailed cash flows over the project's life cycle. This includes projected inflows from revenues and outflows from expenses.
- Discounted Cash Flow (DCF) Analysis: This step involves discounting the future cash flows to present value using a discount rate to account for the time value of money and risk associated with the cash flows. The Net Present Value (NPV) is then calculated to assess the overall value the project will add. If the NPV is negative, a government contribution would be needed to make the project viable financially.
- Financial Metrics: The model then calculates key financial metrics such as Internal Rate of Return (IRR) and payback period to provide additional measures of the project's financial performance.
2.1. Inputs-Constant Tab
The Inputs-Constant tab in EVCI-FAST is used to input values that do not change over the analysis time period but may be escalated in future years using escalation factors input into the model. Sections are provided for estimates of initial capital costs, demand, and revenues. In addition, the user inputs key financing assumptions such as the discount rate, escalation factors, and the number of operational years during which the P3 contract is active.
- Inputs for Capital Cost Estimates: Users may enter detailed information into the cells provided or may enter a total estimate. The user also enters Cost Allocation in the Capital Delivery Phase as percentages of the initial capital cost that are expended in each year of the implementation phase.
- Inputs for Revenue Estimates: Users can select a baseline, pessimistic, or optimistic scenario to develop a range. The Optimistic and Pessimistic scenarios will multiply revenues by a multiple that the user inputs for each scenario. The Baseline multiple is 1.00. The estimate of the share of charging that takes place during peak hours is entered as a percentage. Price per kWh paid by the user of the EV port during peak and non-peak hours is used along with Peak-Hour Charging Share to calculate a weighted average price. Alternatively, if peak versus non-peak hour charging price data is unavailable, a weighted average price per kWh may be input into the peak hour price cell with peak hour charging share input as 100%.
- Inputs to estimate Demand: EVCI-FAST uses a bottom-up approach to arrive at a value for total annual visits, based on user input of estimated average charge duration per EV (hours), occupancy per charger (average % per 24-hour period) and number of ports. Alternatively, users may conduct their own calculations and enter them in the User Override cell.
2.2. Inputs-Time Series Tab
The Inputs-Time Series tab has values that change over the analysis period. These include operation and maintenance costs (O&M), additional capital requirements such as equipment replacement, and annual revenues. All values are entered in nominal dollars (i.e., year-of-expenditure dollars). Next, sections are provided to input Government Support, and optionally to input Revenue Estimates (if the user has calculated revenues externally) and optional Revenue Structures such as Minimum Revenue Guarantee and Revenue Sharing.
- Input for Government Support: The user provides inputs for the maximum governmental reimbursement as a % of project costs that are eligible for reimbursement by the government.
- Input for Revenue Structures: Two optional Revenue Structures may be input as applicable. These are a Minimum Revenue Guarantee and a Revenue Sharing Strategy. If a minimum revenue guarantee (MRG) is in place, then the input will be a percentage of the base forecasted revenues for the project. For example, if the MRG is 60%, this means that if the project falls short of 60% of the base forecasted revenues, the agency will pay the difference between actual revenue and 60% of the base forecasted revenue. If a revenue sharing strategy is in place, the user inputs the percentage of revenue retained by the private developer. The threshold that triggers the revenue-sharing mechanism is also input as a percentage of the base forecasted revenues. This threshold would normally be 100% or more.
2.3. Model Outputs
The Outputs tab contains results for total costs, revenues, government support, operating income, and revenue structures as discussed below.
- In the Cost Estimate Output section, a summary of costs is provided for the implementation and O&M phases.
- The Revenue Estimate Outputs show revenues from charging activity, fees and subscriptions, and any other revenues, if applicable.
- In the Government Support Output section, government subsidies under grant-based and performance based P3s are provided. For a grant-based P3, the outputs are simply the calculated subsidy amounts over the implementation and operation periods and the NPV of these subsidies. For a performance-based P3, the NPV of Availability Payments is calculated as the difference between the NPV of Total Revenues and the NPV of Total Eligible Costs. Then this value is distributed equally over the operational years and multiplied by the future value factor. If the NPV of the Availability Payments as a proportion of the NPV of Total Costs is smaller than the Allowable Federal Coverage % (input by the user in the Input – Time Series Tab), then the full availability payment will be reimbursed by the Federal Government. If it is greater than the Allowable Federal Coverage %, then the remaining portion is the Non-Federally Reimbursed Amount. This amount would need to be subsidized by another source such as the public agency partnering on the project if the project is to be financially viable.
- Operating Income is simply revenues minus costs during the operational phase of the project.
- Results of any Optional Revenue Structures are provided annually over the scenario timeframe.
2.4. Discounted Cash Flow Analysis
The Discounted Cash Flow Analysis tab includes discounted cash flow, net present value, internal rate of return, and discounted payback period for the project. A Discounted Cash Flow (DCF) table is present for a grant-based, performance-based, and MRG approach. The discount factor is calculated as 1/(1+r) ^n (where “r” is the discount rate and “n” is the period).
- Net Present Value (NPV): The discount factor is multiplied by the Free Cash Flows to calculate Discounted Cash Flows (i.e., present values (PV) of future cash flows), which are summed to get the NPV. Typically, if NPV ≥ 0, then the project is financially viable.
- Internal Rate of Return (IRR): The IRR is the annual rate of return that an investment is expected to generate. In the performance-based P3 approach, due to the way availability payments are calculated (i.e., using a discount rate exactly equal to the required internal rate of return), the NPV will be zero and IRR will be equal to the input discount rate.
- Payback Period: The Discounted Payback Period is the amount of time required to recoup the investment. If Cumulative Discounted Cash Flows are not ≥ 0, then the payback period is not within the period of analysis.
- Subsidy Adjustment: For a grant-based approach, there is an additional output called Optimal Subsidy Adjustment. If the NPV of the project is negative, even with grants provided at the maximum allowable %, then the additional subsidy that will be required for financial viability (i.e., for NPV ≥ 0) will be shown here. If the NPV is positive, the value shown here indicates the amount of payment to the private partner beyond what it would need to meet its target rate of return.
2.5. Outcomes Dashboard
The Outcomes Dashboard tab contains statistics and charts summarizing key financial data relevant to the EVCI Project. This is segmented into Key Project Data, Grant-Based P3 data, Performance-Based P3 data, and Minimum Revenue Guarantee data. Charts showing results for annual values of costs, revenues, cash flows, and operating income are provided.
2.6. Prototypical Project and Alternative P3 Approaches
The analysis in this paper used EVCI-FAST to demonstrate P3 financial viability evaluation for a hypothetical bundle of charging stations with a total of eighty ports which are anticipated to be in use an average of 25% of the time. Total initial capital costs are estimated at $11,500,000 and O&M costs in the first operational year (in base year dollars) is estimated at $250,000 for energy costs and $200,000 for other O&M costs. There are no rehabilitation costs during the 5-year term of the P3 concession.
The public agency has estimated a “best guess” revenue forecast (baseline forecast), and it expects that user demand and revenue will be highly uncertain. The optimistic revenue scenario is estimated at 50% above the base “best guess” forecast. The pessimistic scenario is estimated at 50% below the base forecast. The required internal rate of return for private investment is estimated at 10% and the term length of the P3 agreement is anticipated to be 5 operational years.
Alternative P3 structures to be evaluated are: (1) A grant-based P3 structure typical of a Federal-aid project under which the private partner retains all revenue and is reimbursed a portion of eligible project costs at a pre-determined percentage level throughout the implementation and operations phases (after subtracting revenue receipts); (2) A hybrid availability payment/ revenue risk (AP/RR) P3 structure with government-funded availability payments beginning after the start of the operations phase; and (3) A minimum revenue guarantee (MRG) structure with government contributions made only when revenues are below that needed for financial viability.
To estimate the maximum government support that might be needed under each P3 structure, EVCI-FAST was run for the pessimistic revenue scenario for each P3 structure.
2.7. Common Inputs for All Alternatives
For all three alternatives, cost inputs were as follows:
- •
- $11,500,000 in the User-Override for Initial Capital Costs in the Inputs – Constant tab. Assuming a pessimistic demand scenario, a lower bound of $250,000 was input for energy cost and $200,000 for other O&M costs, for the first operational year, under Operation Cost in the Inputs – Time Series tab. Escalation in the Inputs – Constant tab was input as 14.3% for energy costs, incorporating inflation and the 11.5% demand growth assumption (see below), and 2.5% for inflation for other O&M costs.
- •
- To estimate user demand, model inputs were as follows:
- ○
- Estimated Charge Duration per EV (hrs.) = 0.5
- ○
- Estimated Occupancy per Port = 25%
- ○
- Number of EV Ports = 80
- ○
- Annual Demand Growth Rate Assumption = 11.5%
- •
- Other inputs were as follows:
- ○
- Average Price per kWh = $0.36; escalation = 2.5% (Inputs – Constant Tab)
- ○
- Optimistic Revenue Multiple 1.5 (Inputs – Constant Tab)
- ○
- Pessimistic Revenue Multiple 0.5 (Inputs – Constant Tab)
- ○
- Discount rates for all P3 structures = 10% (Inputs – Constant Tab)
- ○
- Term Length = 5 operational years (Inputs – Constant Tab)
- ○
- Proportion of Revenue Above Revenue Sharing Cap Retained by the Private Developer = 50% (Inputs – Time Series Tab)
2.8. Alternative-Specific Inputs
As explained above, the purpose of the analysis was to estimate the potential impact on the public partner’s financial position from each alternative P3 structure. The pessimistic revenue scenario would have the maximum financial impact on the agency. So, the pessimistic scenario was the scenario of primary interest. The three P3 structures were therefore tested with the pessimistic scenario, as follows:
- •
- Grant-based P3 Alternative: The P3 structure scenario was set at Grant-Based (Inputs – Constant tab). In the same tab, the Revenue Scenario Selector was set at Pessimistic. Grant-based cost reimbursement was set at 80% which is typical of Federal-aid projects. This was input for every year throughout the concession period (including both implementation and operations phases) in the Inputs – Time Series tab.
- •
- Performance-based P3 Alternative: The P3 structure scenario was set at Performance-Based (Inputs – Constant tab). In the same tab, the Revenue Scenario Selector was set at Pessimistic. In the Inputs – Time Series tab, revenue sharing strategy inputs were input as follows:
- ○
- Threshold for Revenues Triggering the Upside Revenue Sharing Mechanism: 60% of baseline forecasted revenues (i.e., 120% of the pessimistic revenue forecast which was used in calculating required availability payments).
- ○
- Proportion of Revenue above the Revenue Cap the Private Developer Will Collect = 50%
- •
- Minimum Revenue Guarantee P3 Alternative: The P3 structure scenario was set at Minimum Revenue Guarantee (Inputs – Constant tab). In the same tab, the Revenue Scenario Selector was set at Pessimistic. In the Inputs – Time Series tab, revenue structure inputs were input as follows:
- ○
- Minimum Revenue Guarantee Private Sector is Eligible to Receive from Agency: 90% of forecasted baseline revenues
- ○
- Threshold for Revenues Triggering the Upside Revenue Sharing Mechanism: 100% of forecasted baseline revenues
- ○
- Proportion of Revenue above the Revenue Cap the Private Developer Will Collect = 50%
Three more model runs were then made for the Minimum Revenue Guarantee alternative, to test revenue scenarios where actual revenue may be higher. We changed the Pessimistic multiplier from 0.5 to 0.7 to reflect actual revenues at 70% of the baseline forecast, and to 0.9 to reflect actual revenues at 90% of the baseline forecast. The third revenue scenario setting was at Baseline, i.e., 100% of baseline forecast. The purpose of these additional model runs was to analyze the financial impact on the public agency if actual revenues exceed 50% of baseline forecast. Also, for these runs, the energy cost component of annual O&M costs in the first year of operations were escalated in proportion to the increase in demand, i.e., to $350,000 for the run with 70% of baseline revenue, $450,000 for the run with 90% of baseline revenue, and $500,000 for the Baseline scenario with 100% of baseline forecast revenue.
3. Results
Figure 2 and the first three columns of Table 1 show results from model runs for the three P3 structures under a pessimistic revenue scenario, i.e., 50% of baseline revenue. The financial contributions by the public sector are presented in the NPV of Government Contribution row. The results suggest that, because the government’s share of eligible costs was pre-determined at a rate of 80% of eligible costs, government contributions would be higher under the grant-based P3, leading to a return on private investment exceeding 35%. On the other hand, government contributions would be much lower under the AP/RR and MRG alternatives, just adequate to meet the “hurdle” private rate of return of 10% which is required to ensure financial viability.
Figure 3 and the last three columns in Table 1 show results for the MRG structure under scenarios where the actual revenue receipts equal to 70%, 90% and 100% of baseline forecast revenues. Operating costs also increase, due to more energy usage as demand increases above the pessimistic scenario, while total income to the private partner from revenues and government contributions stay at 90% of the baseline revenue forecast, i.e., the MRG amount, under scenarios where actual revenues equal 70% and 90% of baseline forecast. This causes the private rate of return to fall below 10%, suggesting that, to ensure financial viability as actual demand increases above the pessimistic level, there will need to be additional government contributions to compensate the private partner for operating cost increases arising from an increase in demand as demand increases from the pessimistic level up to the MRG forecast level.
Table 2 presents the dollar contributions the public partner will need to make for each year of the concession term in year of expenditure (i.e., nominal) dollars. Results are first presented for the three P3 structures under the pessimistic revenue scenario (with revenues at 50% below baseline). The grant-based P3s structure involves large upfront government contributions in the implementation phase (pre-determined as 80% of eligible costs), but during operations, no government contributions are needed because revenues exceed O&M costs. The profile of needed government contributions is roughly the same for AP/RR and MRG alternatives – the MRG alternative requires government contributions that are slightly lower than AP/RR in the first 3 years of operation but slightly higher than AP/RR in the last 2 years.
Next, Table 2 presents results for MRG structure with actual revenues at 70%, 90% and 100% of baseline revenues. The results clearly show the drop in government contributions as revenues increase.
4. Discussion
The analysis for the hypothetical EVCI project evaluated in this paper suggests that the grant-based P3 approach has the greatest risk of resulting in higher rates of return for the private partner as a result of government payments above the level needed for financial viability. Also, as explained earlier, the public agency may have little leverage to ensure that performance standards are met during the operations phase, since user revenues may exceed operational costs and the private partner will not be reliant on the public partner for any financial support. (For example, even though a bundle of charging ports brings in revenues that exceed O&M costs, a specific charging port in a bundle may be located in an area where it does not bring in sufficient revenue to make up for costs to bring it up to standards, reducing the private partner’s incentive to make the repairs needed to bring it up to standards.)
The performance-based P3 structure is a hybrid availability payment / revenue-risk (AP/RR) structure. This approach allows the public agency to determine in advance the amount of government financial support needed to ensure that rates of return to the private partner do not exceed a reasonable rate of return. Governmental payments only start after operations begin, so that the public agency will be in a better position to enforce operational performance standards through performance deductions from its scheduled availability payments if the standards are not met.
As with the AP/RR structure, the MRG structure can be set up in such a way that government payments begin only after operations start. The MRG level can be set, by model iteration, to ensure that the private partner’s desired “hurdle” rate of return (required to attract its investment in the project) is achieved. If the pessimistic revenue scenario does materialize, the approach is likely to place similar demands on the public agency’s budget compared to the AP/RR structure. However, a benefit of this approach is that the public agency will need to make much lower financial contributions if actual revenues exceed the pessimistic projections.
Supplementary Materials
The following supporting information can be downloaded at: www.mdpi.com/xxx/s1. The EVCI-FAST Excel spreadsheet and user guide may be downloaded at: https://www.fhwa.dot.gov/ipd/p3/toolkit/analytical_tools/evci_fast/ .
Author Contributions
Conceptualization, methodology, validation, formal analysis, investigation, resources, data curation, original draft preparation, review and editing, and visualization, Patrick DeCorla-Souza and Mahir Hossain. Software programming, Mahir Hossain. Both authors have read and agreed to the published version of the manuscript.
Funding
This research received no external funding. It was entirely funded by the Federal Highway Administration (FHWA), who is Patrick DeCorla-Souza’s employer.
Data Availability Statement
The EVCI-FAST Excel spreadsheet and user guide may be downloaded at: https://www.fhwa.dot.gov/ipd/p3/toolkit/analytical_tools/evci_fast/ .
Acknowledgments
This document was created by both FHWA and a contractor. The views and opinions expressed in this document are the authors’ and do not necessarily reflect those of FHWA or the U.S. Department of Transportation (USDOT). The contents do not necessarily reflect the official policy of the USDOT. Except for the statutes and regulations cited, the contents of this document do not have the force and effect of law and are not meant to bind the States or the public in any way. This document is intended only to provide information regarding existing requirements under the law or agency policies. The work performed by Mahir Hossain was done under Contract Number: 693JJ322A000016, Task Order: 693JJ323F00086N.
Conflicts of Interest
The authors declare no conflicts of interest. The FHWA had no role in the design of the study; in the collection, analyses, or interpretation of data; in the writing of the manuscript; or in the decision to publish the results.
References
- Federal Highway Administration. State of the Practice of Public-Private Partnerships for Electric Vehicle Charging Infrastructure. FHWA. 2024. https://www.fhwa.dot.gov/ipd/pdfs/p3/state_of_the_practice_of_p3s_for_ev_charging_infrastructure.pdf.
- Federal Highway Administration. Structuring Options for Performance-Based Contracts under the NEVI Program: A Discussion Paper. FHWA. 2024. https://www.fhwa.dot.gov/ipd/pdfs/p3/structuring_options_for_ev_charging_infrastructure.pdf.
- Government of India (2010). PPP Toolkit for Improving PPP Decision-Making Processes. Government of India Ministry of Finance. 2010. https://ppp.worldbank.org/public-private-partnership/library/ppp-toolkit-improving-ppp-decision-making-process.
- PPIAF. Toolkit for Public-Private Partnerships in Roads and Highways. Public-Private Infrastructure Advisory Facility. 2009. https://www.ppiaf.org/sites/ppiaf.org/files/documents/toolkits/highwaystoolkit/index.html.
- Mladenovic, G and Queiroz, C. Enhancing the Financial Feasibility of PPP Projects with Hybrid Funding. Proceedings, International Conference on Traffic and Transport Engineering, Belgrade, Serbia, 27-28 September 2018, p. 592-599. https://www.academia.edu/90072235/Enhancing_the_Financial_Feasibility_of_PPP_Projects_with_Hybrid_Funding.
- DeCorla-Souza, Patrick. New Tool to Understand Value-for-Money Analysis Concepts in Evaluating Public-Private Partnership Options. Transportation Research Record: Journal of the Transportation Research Board. Issue 2450, pp 99-108. 2014.
- Federal Highway Administration (2024c). Toolkit for Public-Private Partnerships for Electric Vehicle Charging Infrastructure: EVCI-FAST User Guide. FHWA. 2024. https://www.fhwa.dot.gov/ipd/p3/toolkit/download/Toolkit%20for%20Public-Private%20Partnerships%20for%20Electric%20Vehicle%20Charging%20Infrastructure%20-%20FAST%20User%20Guide.pdf.
Figure 1.
Overview of EVCI-FAST. Source: FHWA [7].
Figure 1.
Overview of EVCI-FAST. Source: FHWA [7].
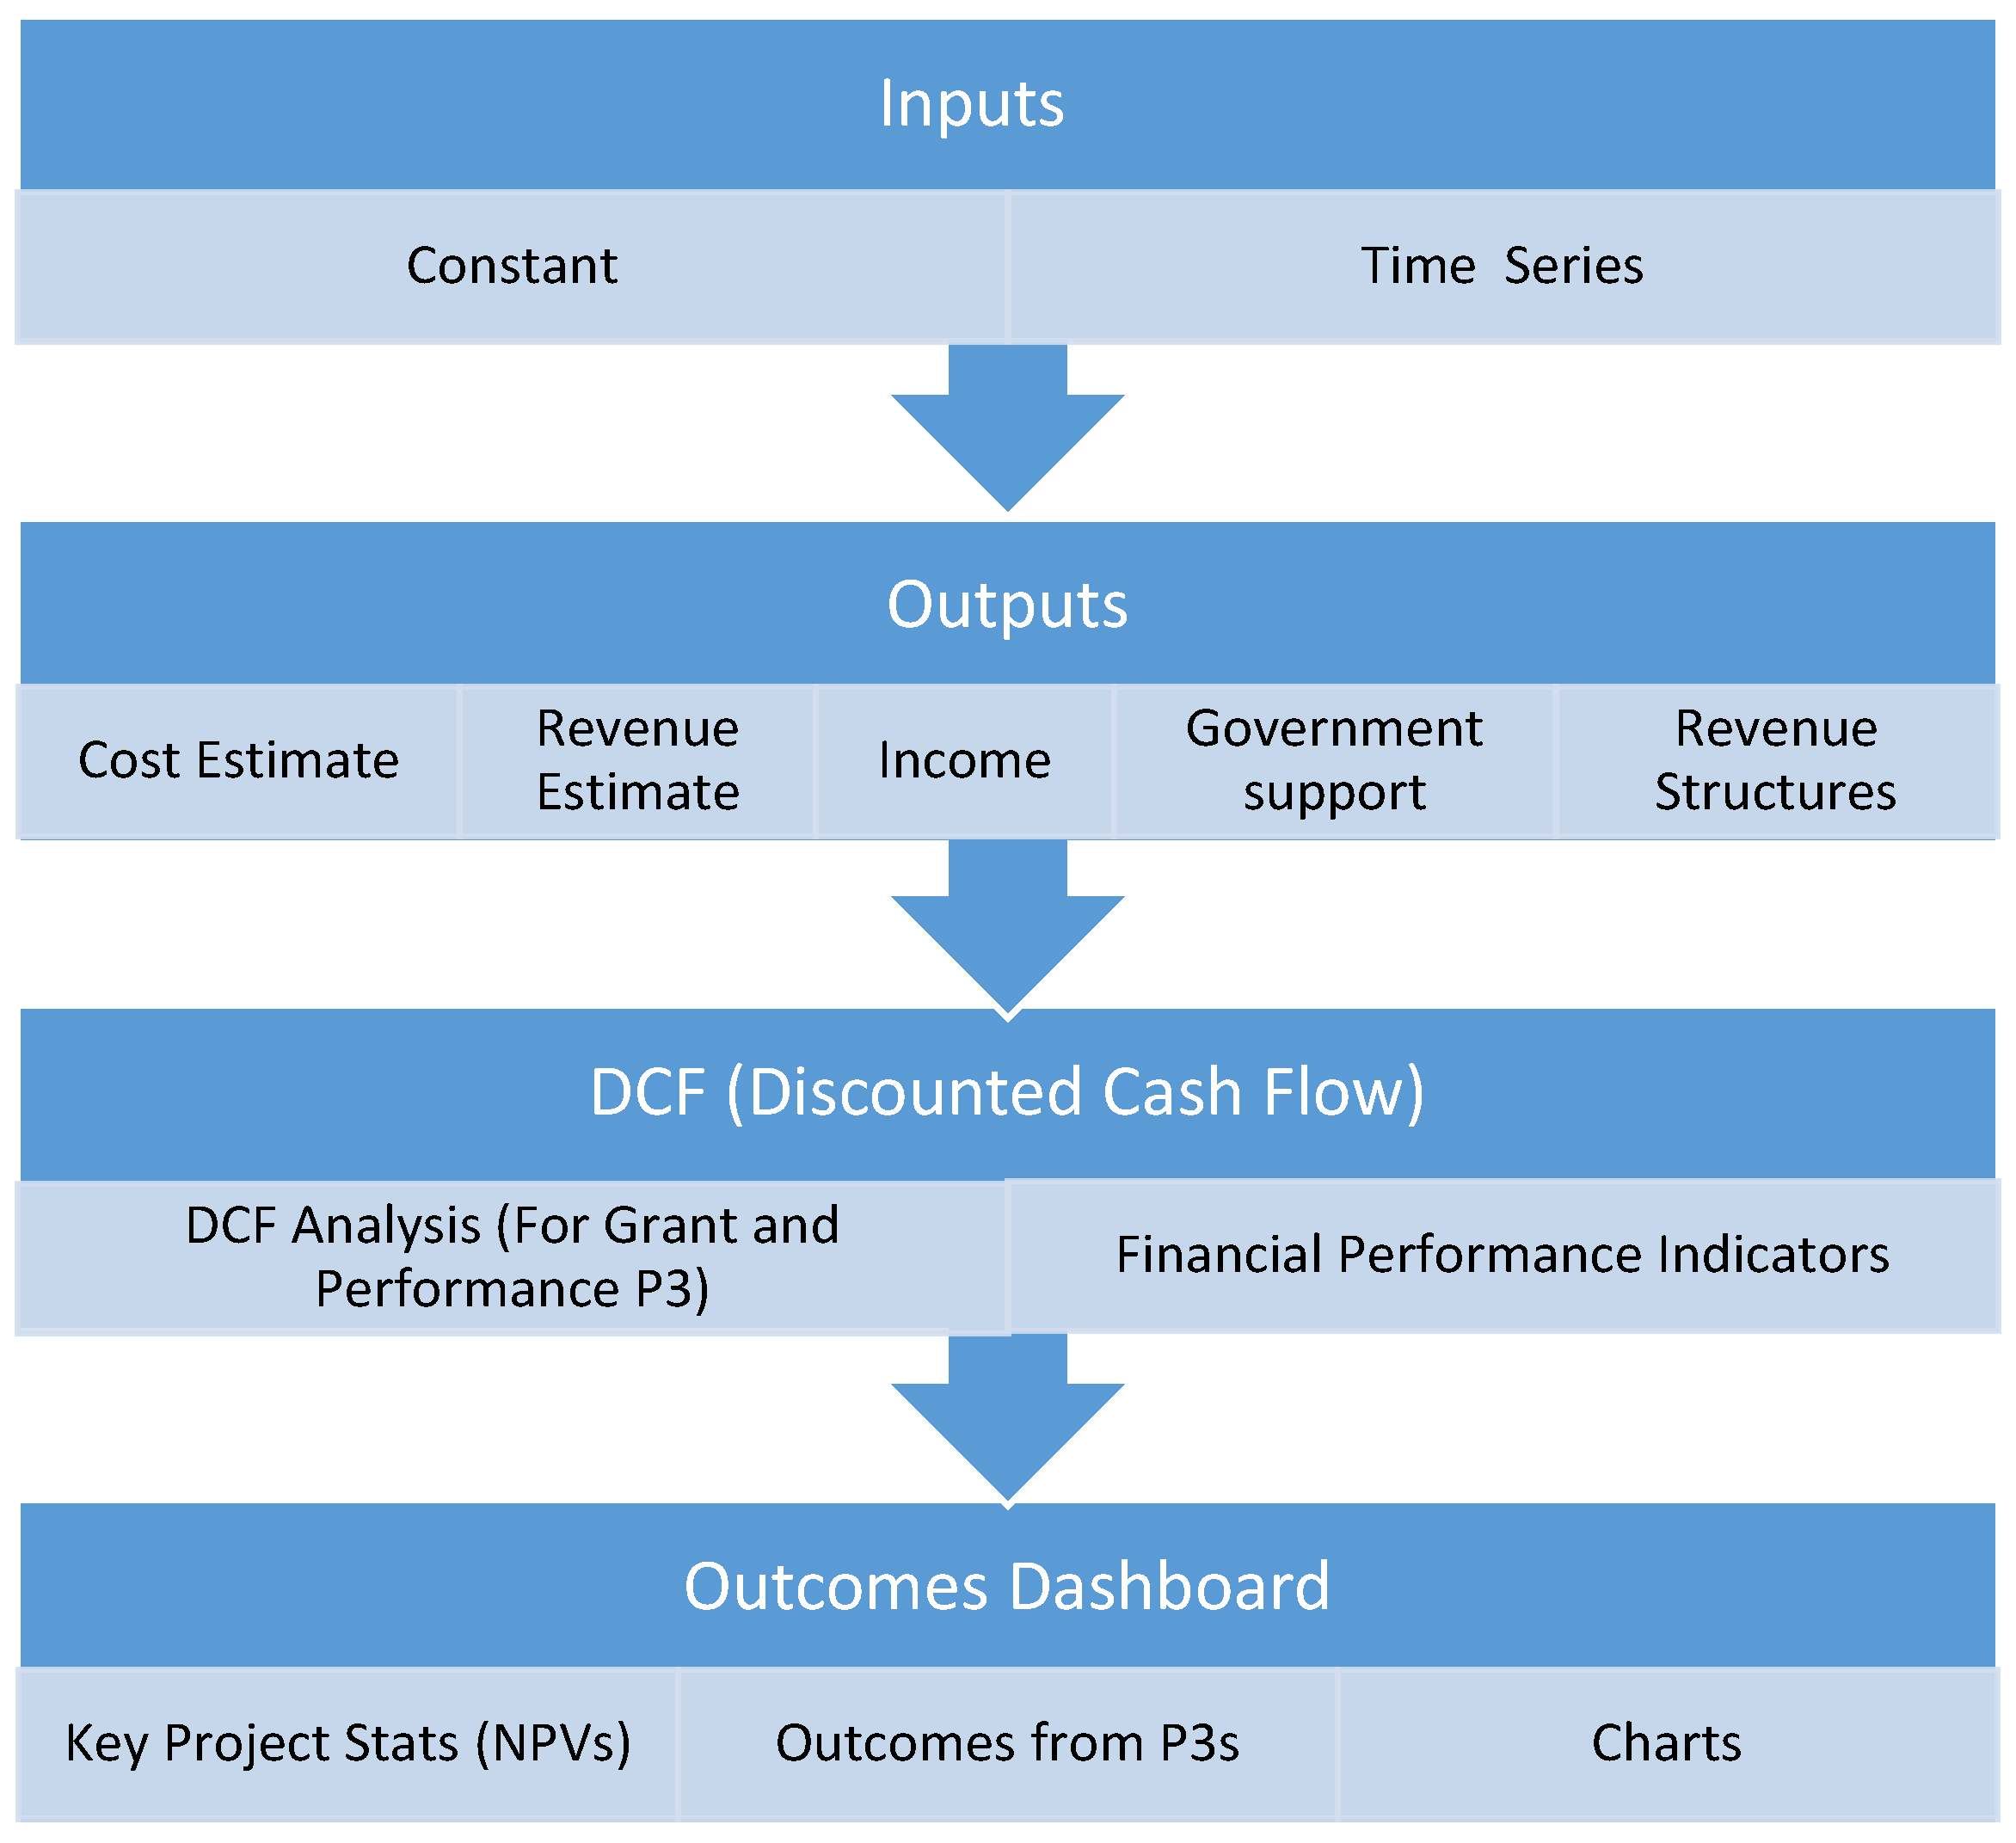
Figure 2.
Comparison of P3 Structures under a Pessimistic Revenue Scenario.
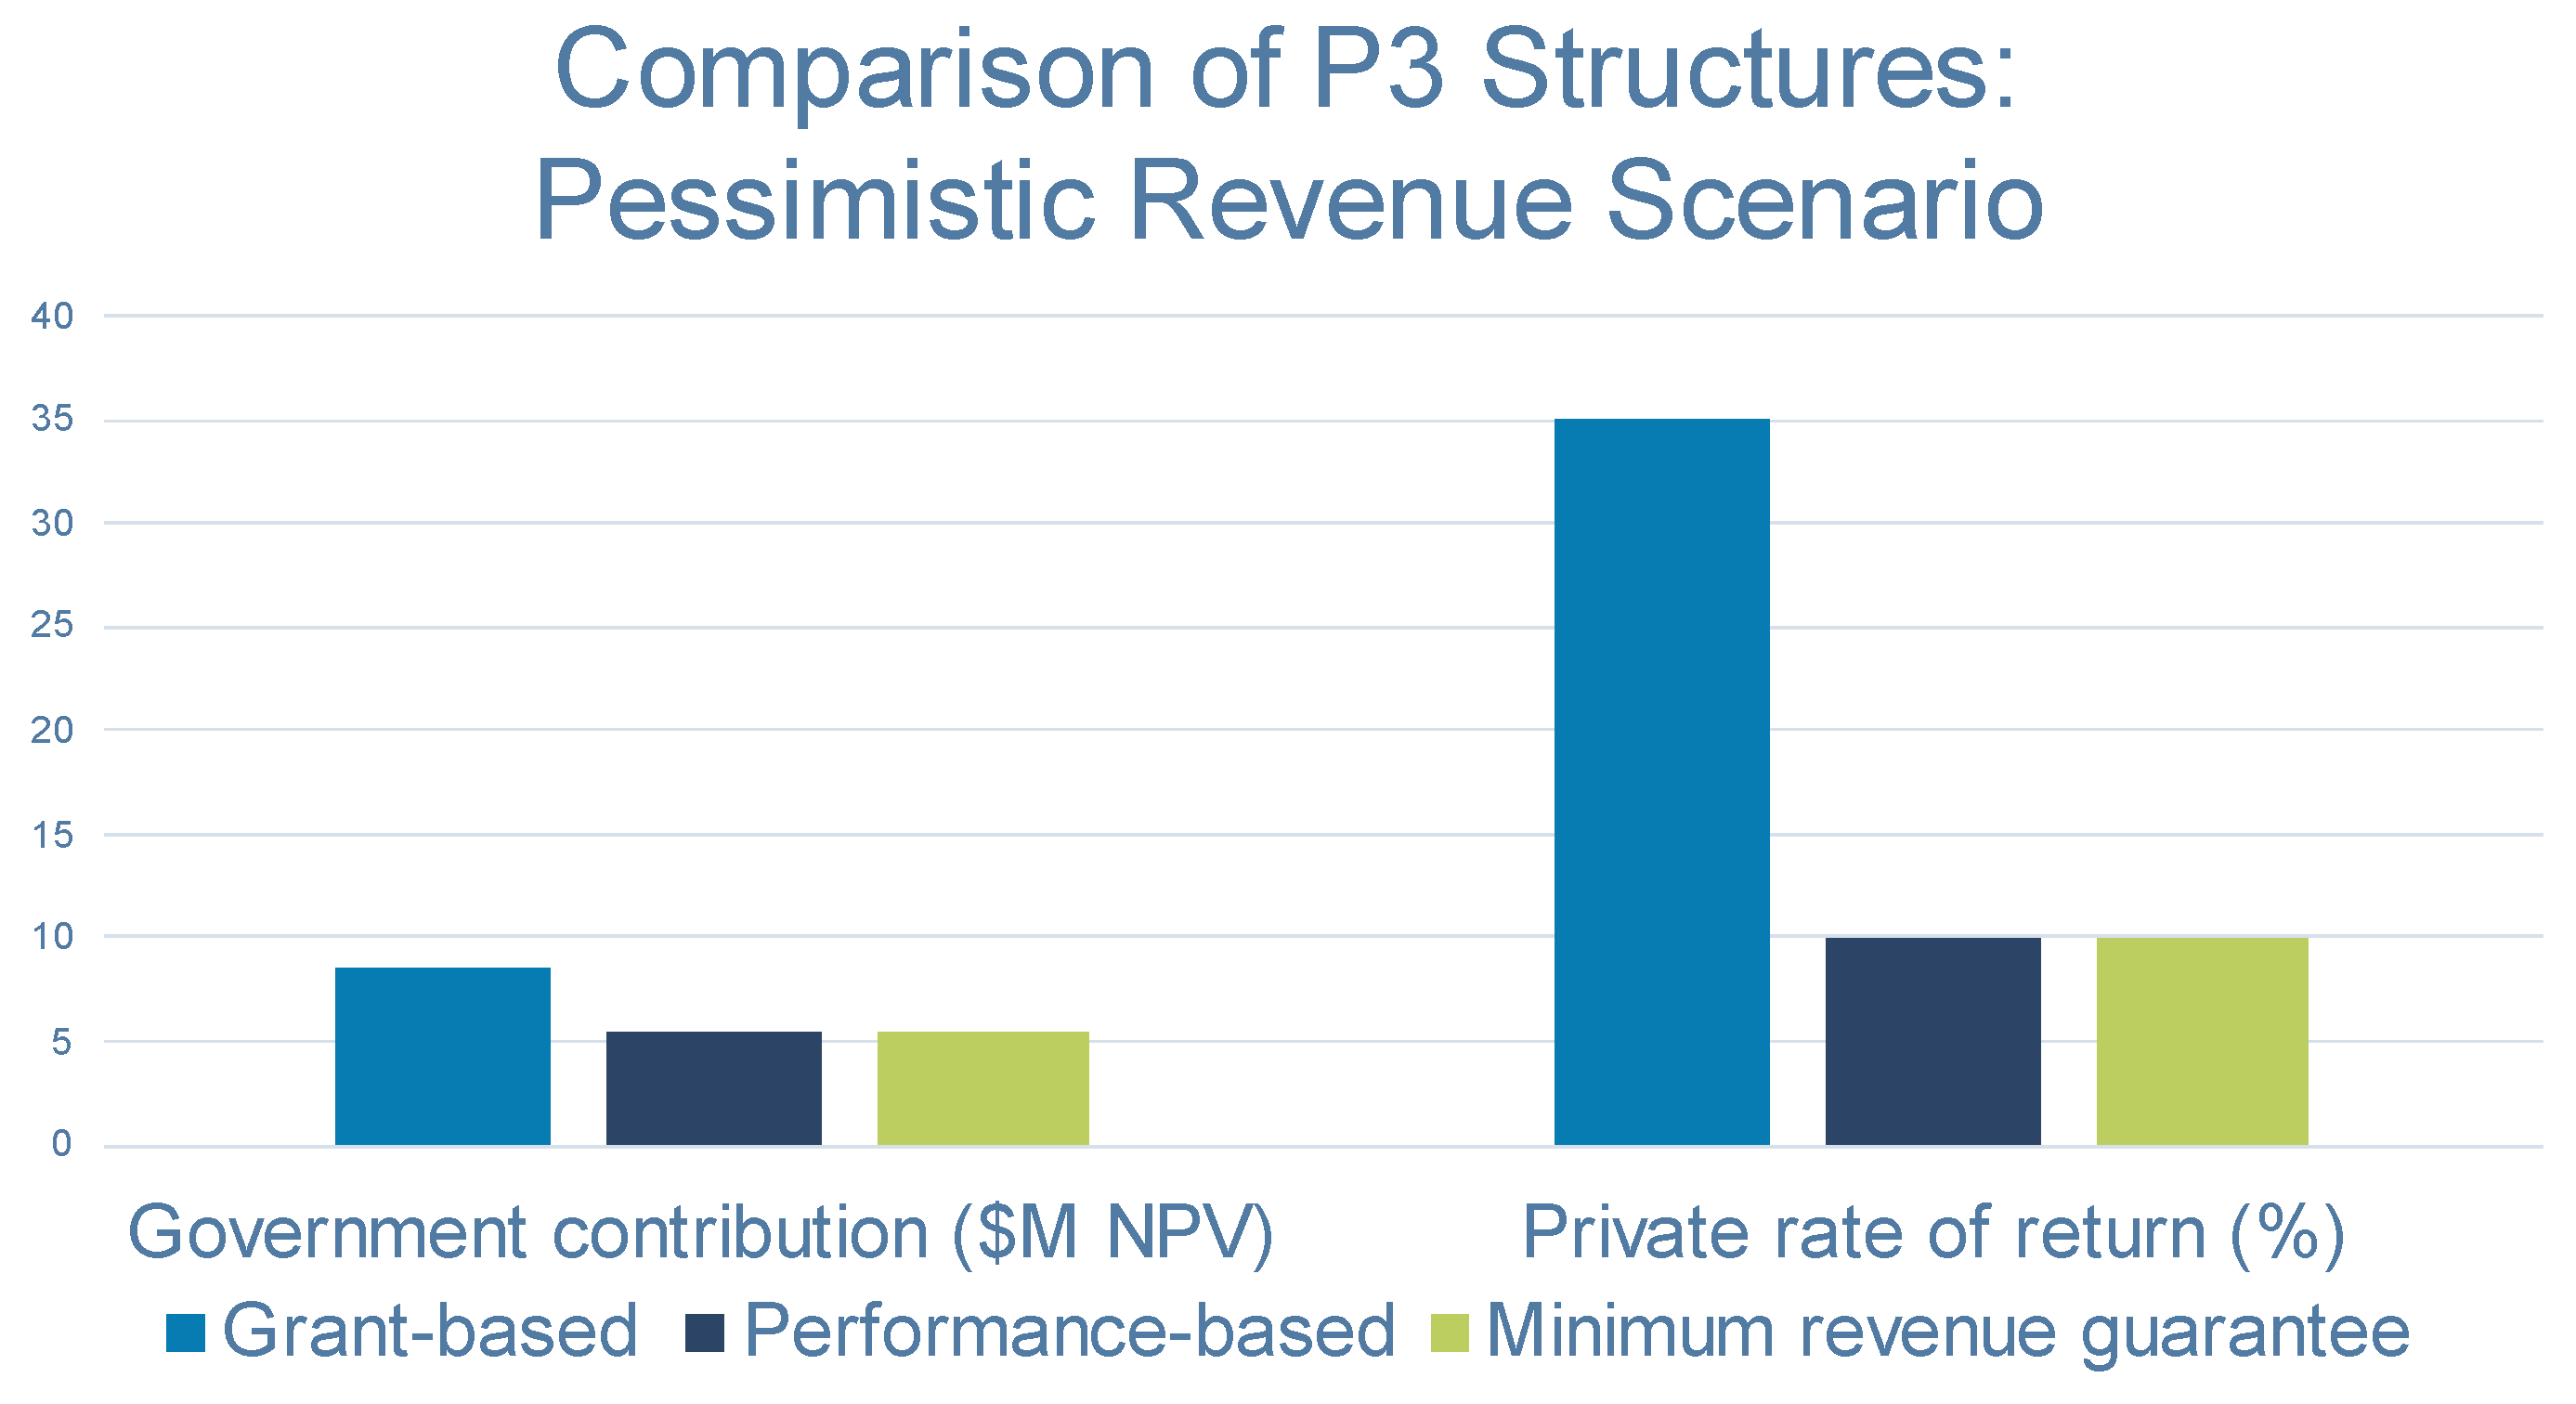
Figure 3.
Impacts of Different Actual Revenue Scenarios on Government Contributions and Private Rate of Return under MRG Structure.
Figure 3.
Impacts of Different Actual Revenue Scenarios on Government Contributions and Private Rate of Return under MRG Structure.
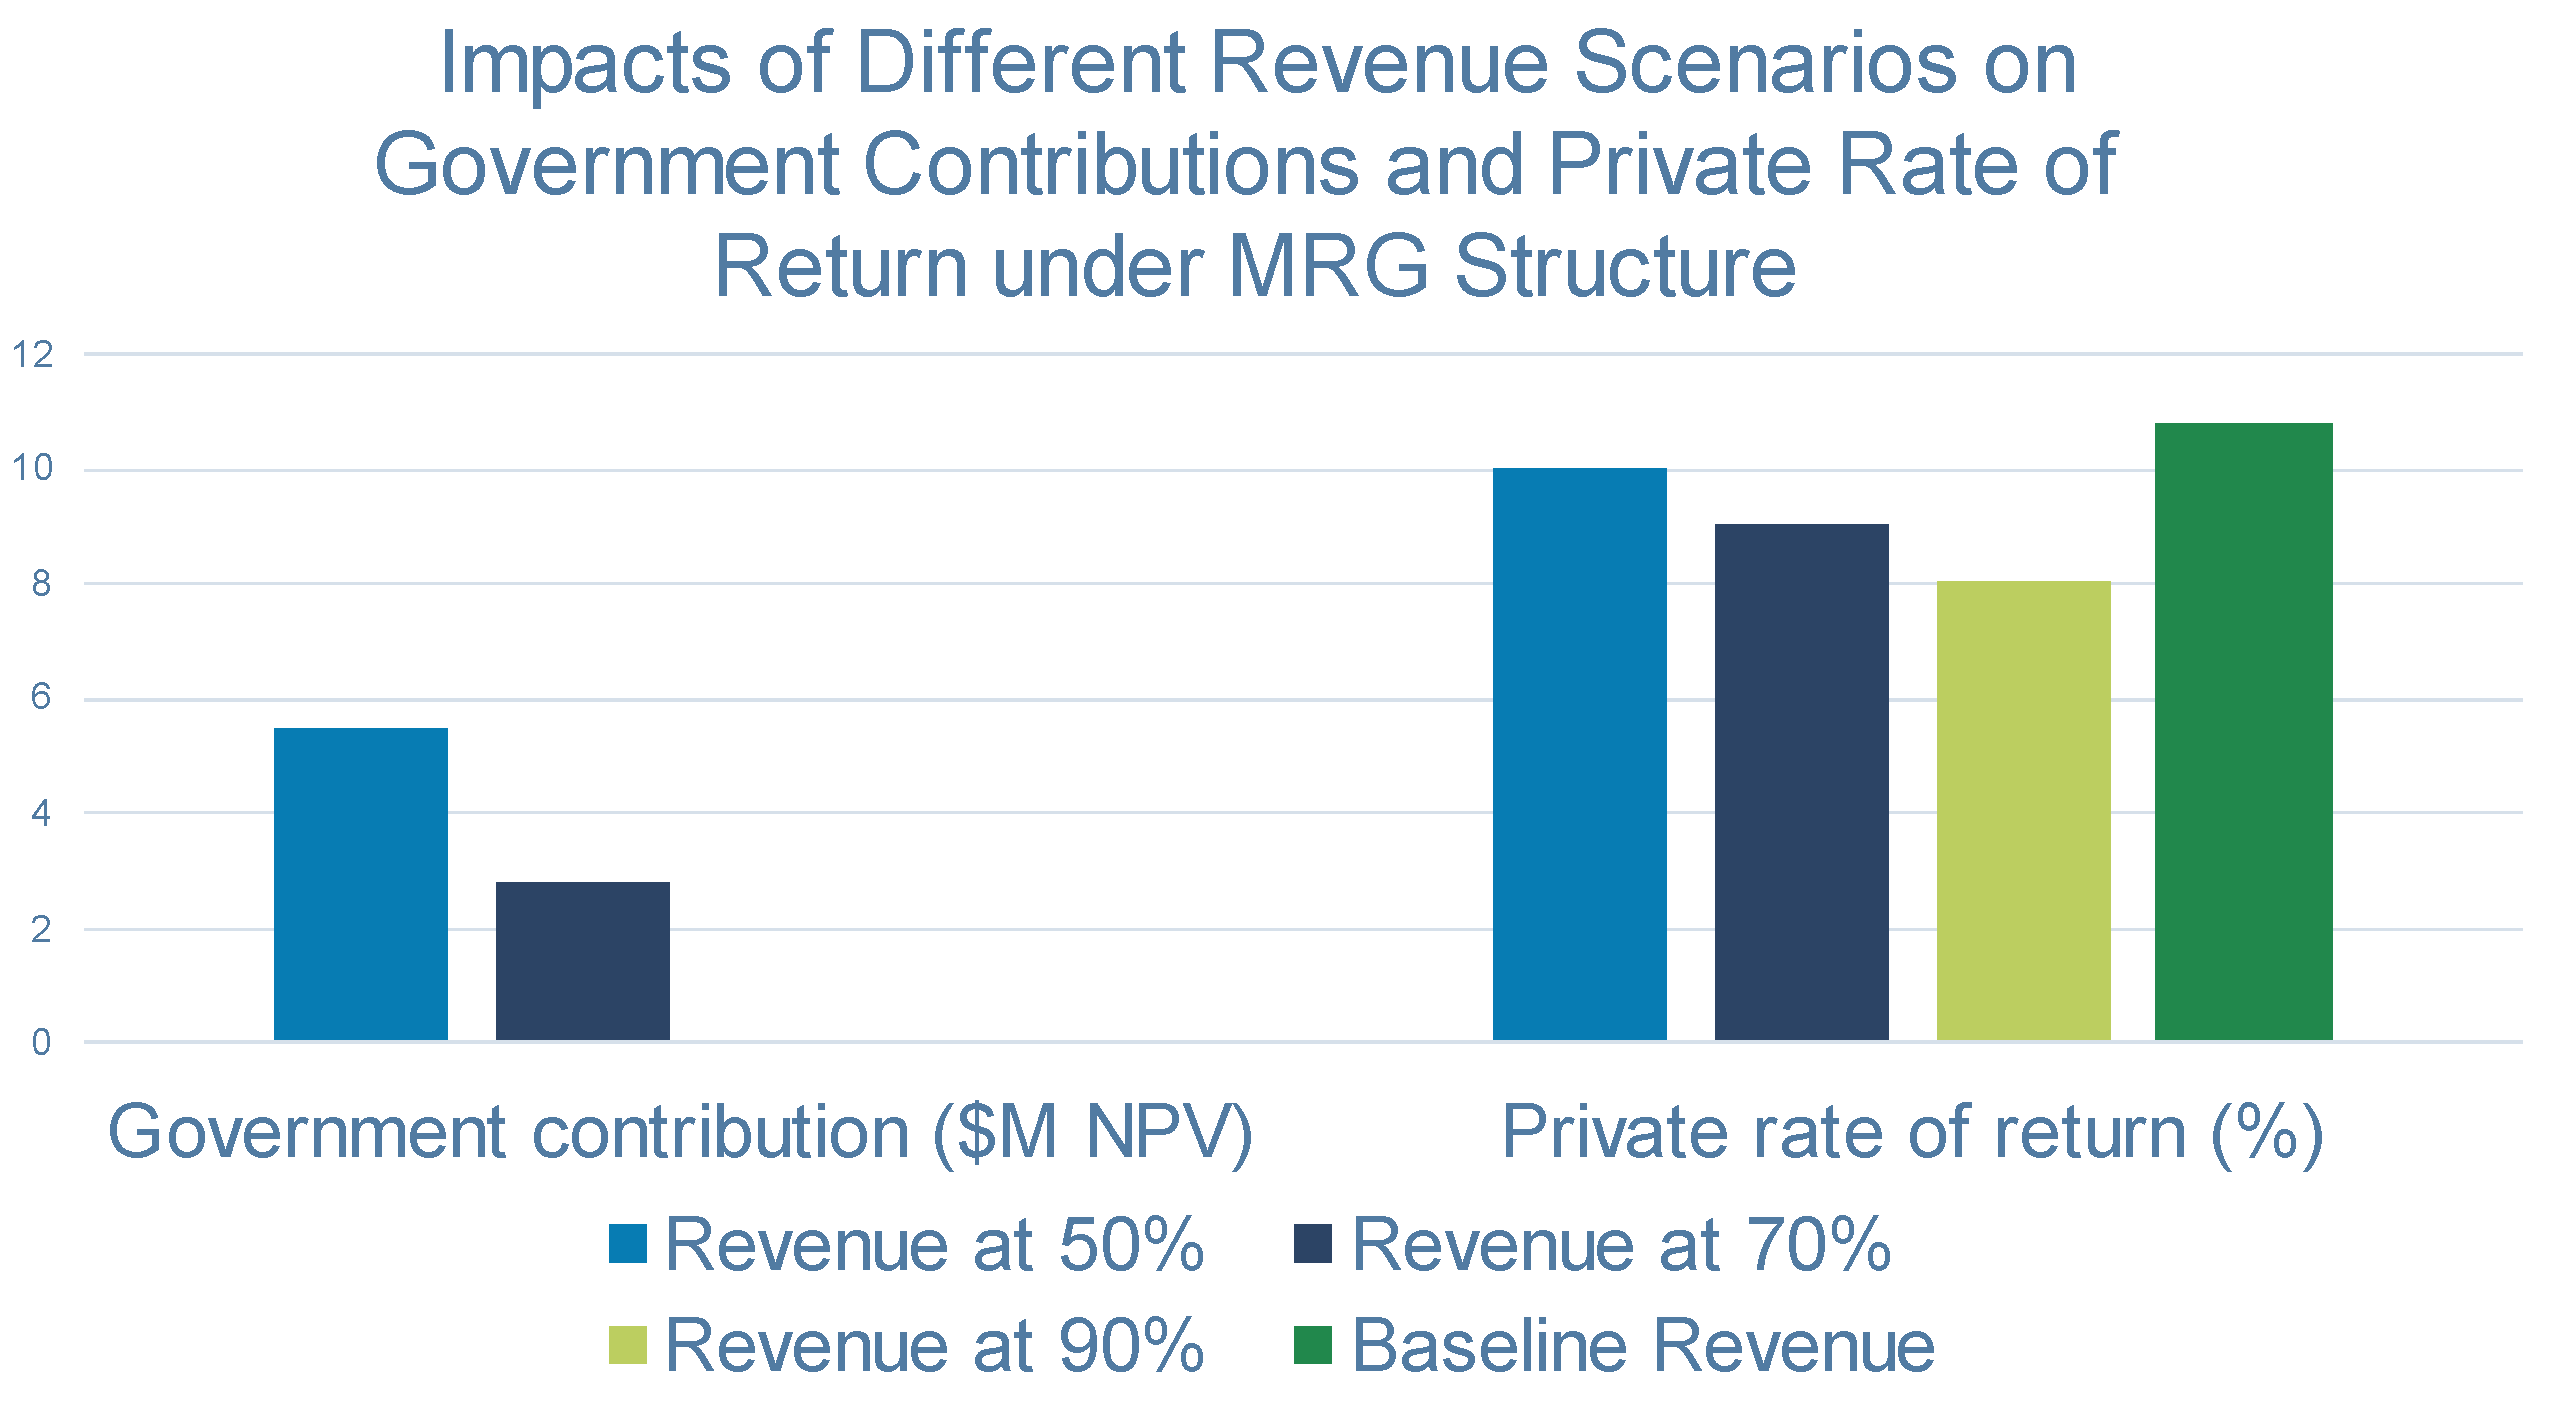

Table 1.
Model Results for Alternative P3 Structures.
| Pessimistic Revenue Scenario at 50% of Baseline Forecast | Alternative MRG Scenarios with MRG set at 90% of Baseline Revenue Forecast | |||||
|---|---|---|---|---|---|---|
| Key Metrics | Grant-Based P3 | Performance-Based P3 (AP/ RR*) | Minimum Revenue Guarantee (MRG) | Actual Revenue at 70% of baseline | Actual Revenue at 90% of baseline | Actual Revenue at 100% Baseline Revenue |
| Revenues (NPV) | $6,895,837 | $6,895,837 | $6,895,837 | $9,654,172 | $12,412,507 | $13,791,675 |
| Costs (Eligible) (NPV) | $12,410,777 | $12,410,777 | $12,410,777 | $12,816,975 | $13,223,172 | $13,426,271 |
| Returns to Agency (NPV) | $0 | $0 | $0 | $0 | $0 | $0 |
| NPV of Cash Flows | $3,076, 796 | $0 | $1,730 | -$404,467 | -$810,665 | $365,404 |
| NPV of Govt. Contribution | $8,591, 736 | $5,514,939 | $5,516,670 | $2,758,335 | $0 | $0 |
| Internal Rate of Return (IRR) | 35.41% | 10.00% | 10.00% | 9.05% | 8.06% | 10.84% |
| Subsidy above amount needed for viability (NPV) | $3,076, 796 | $0 | $1730 | $0 | $0 | $0 |
| NPV of Availability Payments / NPV of Total Eligible Costs | N.A. | 44% | N.A. | N.A. | N.A. | N.A. |
* AP/RR = Performance-based P3 structure with a hybrid availability payment / revenue-risk structure.
Table 2.
Maximum Government Subsidy Required for Financial Viability (Year of Expenditure dollars)1.
Table 2.
Maximum Government Subsidy Required for Financial Viability (Year of Expenditure dollars)1.
| P3 Structure | Year 0 | Year 1 | Year 2 | Year 3 | Year 4 | Year 5 | Year 6 | Year 7 |
|---|---|---|---|---|---|---|---|---|
| Pessimistic Revenue Scenario (50% of Baseline Forecast) | ||||||||
| Grant-Based P3 | $4,600,000 | $2,300,000 | $2,300,000 | $0 | $0 | $0 | $0 | $0 |
| Performance-Based P3 | - | - | - | $1,468,077 | $1,614,885 | $1,776,373 | $1,954,010 | $2,149,411 |
| Minimum Revenue Guarantee (MRG) | - | - | $1,358,433 | $1,552,519 | $1,774,335 | $2,027,843 | $2,317,571 | |
| MRG Structure with MRG at 90% of Baseline Revenue Forecast | ||||||||
| Actual Revenues at 70% of baseline | - | - | - | $679,216 | $776,260 | $887,168 | $1,013,922 | $1,158,786 |
| Actual Revenues at 90% of baseline | - | - | - | $0 | $0 | $0 | $0 | $0 |
| Actual Revenue at 100% of Baseline Revenues | - | - | - | $0 | $0 | $0 | $0 | $0 |
| 1 | 3 years of planning and construction followed by 5 years of operations. |
Disclaimer/Publisher’s Note: The statements, opinions and data contained in all publications are solely those of the individual author(s) and contributor(s) and not of MDPI and/or the editor(s). MDPI and/or the editor(s) disclaim responsibility for any injury to people or property resulting from any ideas, methods, instructions or products referred to in the content. |
© 2024 by the authors. Licensee MDPI, Basel, Switzerland. This article is an open access article distributed under the terms and conditions of the Creative Commons Attribution (CC BY) license (http://creativecommons.org/licenses/by/4.0/).
Copyright: This open access article is published under a Creative Commons CC BY 4.0 license, which permit the free download, distribution, and reuse, provided that the author and preprint are cited in any reuse.


