
Submitted:
21 November 2024
Posted:
22 November 2024
You are already at the latest version
Abstract
The expression of genes and engineered circuits can deeply vary when inserted into different genomic loci. This unpredictable performance of expression, termed context sensitivity, complicates strain development. Although the causes and mechanisms of context sensitivity are emerging, it is poorly known how to engineer circuits and synthetic pathways isolated from it. Using tools of synthetic biology for designing and inserting various reporter cassettes in the Escherichia coli genome and RT-qPCR for directly measuring gene expression, we first surveyed the genomic landscape for context sensitivity at 209 positions in cells grown in glucose or glycerol. Results showed deep variations in cassette expression with respect to position (up to 150-fold) and growth condition (up to a 1400-fold). We then demonstrated that this position-dependent expression variability is strongly reduced when the reporter cassette is insulated in an artificial protein-bound DNA loop. Finally, we measured expression of two loop-insulated genes at different genomic positions. Results showed that expression strongly depends on the relative orientation of the genes, promoter strength and positive supercoiling. We present a model suggesting that DNA looping is an important cause of context sensitivity and can be used for better controlling expression of engineered circuits.
Keywords:
Escherichia coli
; transcription
; regulation
; context sensitivity
; supercoiling
; epigenetic
; DNA loops
; lambda cI
1. Introduction
Synthetic biology is defined as the design and construction of new biological systems for useful purposes. Advances in this field have been hampered by the unpredictable performance of synthetic circuits and biosynthetic pathways once inserted into the genome. Recent bacterial studies have shown that, depending on the insertion site in the genome, a reporter gene expressed from a single promoter and flanked by transcriptional terminators produces different levels of transcript [1,2]. Although our understanding of this phenomenon termed context sensitivity is rapidly improving (see below), it is poorly known how to engineer circuits or synthetic pathways that are isolated from it.
Experimental and modeling studies showed that a major cause of context sensitivity is the supercoiling induced by expression of neighboring genes [3,4,5]. Importantly, transcription is a major determinant of the supercoiling landscape in bacterial genomes [6] and transcription and supercoiling are mutually influential (reviewed for instance in [7,8,9,10,11,12]). The interplay between both processes is nicely illustrated by the twin-supercoiled domain model of Liu and Wang [13]. This model, which is extensively supported by both single molecule studies and genome-wide analysis [6,14,15], posits that RNA polymerase creates negative supercoils upstream and positive supercoils downstream of the sequence it transcribes. These changes can smoothly decay from both sides of the gene of interest and affect the topology of up to 40 neighboring genes. A large core of data show that supercoiling impacts transcription initiation and elongation in different ways [12]. For example, accumulating positive supercoils downstream of transcription forks, a phenomenon termed positive supercoiling buildup (PSB), inhibits transcription initiation and slows down elongation, leading eventually to backtracking, stochastic bursts of expression and abortive transcription cycles [16]. On the other hand, the accumulation of negative supercoils upstream of the transcription complex generally promotes transcription initiation.
Two types of intermingled processes control genome supercoiling: supercoil removal and supercoil diffusion. Supercoil removal is carried out by topoisomerases. These enzymes maintain supercoiling homeostasis to keep the negatively supercoiled state needed for DNA operations. They reduce either positive or negative supercoils by binding DNA, cutting the phosphate backbone, either twisting or untwisting the strands before resealing the DNA [17,18]. During transcription, the gyrase, which is the only enzyme that reduces positive supercoiling in the model bacterium Escherichia coli [19], removes supercoils downstream of the transcribing RNA polymerase preventing PSB [16,20]. Conversely, Topo I removes the negative supercoils accumulating upstream from the transcription machinery [21].
The diffusion of transcription-induced supercoils is limited by barriers that topologically isolate DNA regions of 10–400 kb in size [22,23]. In other words, gene expression in a given topological region will not impact the topology and transcription in other regions. Several structures can operate as topological barriers. First, the actively transcribing RNA polymerase blocks supercoil dissipation and thus forms a topological barrier [13,24]. A similar activity has been assigned to proteins tightly bound to DNA (the bacteriophage λ O initiator protein, the transcription factors LacI and GalR and the Nucleoid Associated Proteins (NAPs) FIS) [25,26,27]. Second, during transcription, the RNA polymerase causes torsional stresses to the DNA fiber that self-wrap to form plectonemic structures [14,28,29]. At a larger scale, these dynamic structures organize to form topological barriers [22,23] possibly stabilized by the binding of NAPs like HU, IHF and FIS to the top or cross-over points of plectonemes [12,30,31]. Finally, supercoiling diffusion is prevented by proteins (NAPs, transcription factors…) forming DNA loops and other long-range 3D arrangements [26,32,33,34]. In a synthetic biology study, the expression of a gene carried by a plasmid-born, LacI-mediated DNA loop was shown to be insensitive to neighboring gene expression (e.g. isolated from context sensitivity) and to mainly depend on the promoter strength and its distance to the upstream barrier [35].
The E. coli study reported here showed that the context sensitivity strongly varies with position and growth condition all along the chromosome. It also demonstrated that a gene is efficiently isolated from context sensitivity when embedded in an artificial protein-mediated DNA loop. It finally showed that the expression of two genes whithin a DNA loop strongly depends on their relative orientation, promoter strength and positive supercoiling. Altogether, our findings enforce the importance of DNA looping and supercoiling in context sensitivity and will be of particular interest for Synthetic Biologists and the engineering of standardized genetic circuits.
2. Materials and Methods
Plasmid Construction
Plasmids and used primers are listed Table S1 and S2, respectively. To define the genomic landscape for context sensitivity we constructed a library of strains that had a single reporter cassette randomly inserted into different genomic locations. We modified vectors used for Tn10 mutagenesis [36] as illustrated in Figure S1. Briefly, pNKBOR plasmid was modified so that the RK6 gamma ori would not be incorporated into the genome. All cloning steps for constructs containing the RK6 gamma ori were done using DH5α-pir. A second IS101 site was inserted between the transposase and the kanamycin resistance gene resulting in pNK2. A synthetic DNA fragment (from IDT-DNA) was then ligated into the NotI site of pNK2 to make pBCJ827.4.
To add the DNA binding sites for lambda cI to each side of the reporter cassette a template vector was constructed for generating PCR products that would be used for lambda red integration. Initially, plasmid pTKIP was modified by swapping the kanamycin cassette with a pheomycin resistance cassette. pTKIP was digested with BamHI and the phleomycin resistance gene (obtained as synthetic fragment from IDT-DNA) was ligated into the corresponding site resulting in pBCJ879.2. Lambda cI boxes were added to the reporter cassette by PCR of pBCJ827.4 as oligo overhangs on primers A78F & A78R. pBCJ879.2 was then digested with KpnI and the emGFP reporter cassette was inserted using Simply Seamless DNA Assembly Kit (using manufacturer’s protocol) resulting in pBCJ932. To express emGFP from a strong promoter (p3) we used inverse PCR (primers A115F & A115R) of pBCJ932 resulting in pBCJ927.
To construct a strain of E. coli that had the lambda cI protein expressed from the inducible rhamnose promoter lambda red was used. This required the construction of a plasmid that could be used as a template for a PCR product. The lambda cI gene was purchased as a synthetic DNA fragment from IDT-DNA and inserted into the KpnI site of pBCJ879.2 resulting in plasmid pBCJ937.1.
To construct plasmid β5 carrying the GRS downstream emGFP, plasmid pBCJ927 was amplified by inverse PCR using primers N1F & N1R. A synthetic DNA fragment carrying the GRS flanked by 20bp homologous pads to insertion site (from IDT-DNA) was inserted into the plasmid pBCJ927 by ligation (T4 DNA Ligase, NEB) resulting in plasmid β5. Same approach was used for plasmids β9 and β16, using primers N2F & N2R and N3F & N3R respectively for inverse PCRs on plasmid pBCJ927.
To construct plasmid β7 carrying the neutral DNA downstream emGFP, plasmid pBCJ927 was amplified by inverse PCR using primers N1F and N1R. A neutral DNA product was obtained by amplifying a region from araD gene that was manually checked to ensure it didn’t contain any known sequence that would interfere with cellular mechanisms (enzyme restriction site, promoter like sequence, ribosome binding site). Primers N6F and N6R, containing overhangs, where used to insert the PCR product in the plasmid backbone by ligation.
To construct plasmid β23, primers N64F & N19R were used to amplify the mCherry gene from plasmid pMC48. Primer N64F binds at the beginning of mCherry and has an overhang that contains a random 44 bp sequence (as a replacement for p1 promoter) and a 20 bp sequence homologous to insertion site in backbone plasmid. Primer N19R binds at the end of the mCherry gene and carries a terminator and a 20 bp homologous sequence for insertion in backbone plasmid. Primers N64R & N22R were used to amplify the backbone plasmid from plasmid pBCJ927. The two PCR fragment were then ligated to get plasmid β23.
To construct plasmid β22 carrying emGFP with mutated p3 promoter, plasmid pBCJ927 was amplified by inverse PCR using primers N53F & N53R. These primers carry overhangs containing a replacement sequence for p3 and 20 bp homologous sequences to each other. The PCR fragment was ligated to itself resulting in plasmid β22.
The plasmid pMC48 was constructed by inserting a DNA fragment purchased from IDT-DNA encoding a gentamycin resistance gene into pJet2.1.
Strain Construction
Strains are listed Table S3 and used primers in Table S2. To engineer a strain that has the lambda cI gene expressed from the inducible rhamnose promoter, lambda red recombination was used. PCR of pBCJ937.1 with primers (A143R & A144R) generated a DNA fragment that was used to directly replace the rhaBAD genes with lambda cI and a pheomycin resistance marker using lambda red recombineering, resulting in strain BCJ952.4. The phleomycin resistance marker was subsequently removed by lambda red integration of a cassette carrying a neomycin resistance gene which was then excised from the loci resulting in α1.
Lambda red integration was used to construct a series of strains that have emGFP gene expressed by the weak p1 promoter flanked by lambda cI binding sites. PCR fragments were generated using pBCJ932 as template and a series of primers that targeted the cassette to different genomic locations. Lambda red genomic integrations were performed as described previously [37,38]. To construct strains (2 to 36) the PCR fragments were integrated into E. coli MG1655, and for strains (α2 to α23), the PCR fragments were integrated into α1.
We used lambda red to construct strains that have emGFP expressed from the strong p3 promoter flanked by lambda cI binding sites. Plasmid pBCJ927 was used as PCR template to construct strains (α28 to α36). To engineer strains α61 to α64 lambda red recombineering was used. PCR reactions using primers 150F-R, 164F-R, 249F-R & 250F-R were performed on plasmid ß5. These amplifications were then inserted in the target genomic loci using lambda red recombination.
To build strains α66 to α69 PCR reactions using primers 150F-R, 164F-R, 249F-R & 250F-R were performed on plasmid ß7. These amplifications were then inserted in the target genomic loci using lambda red recombineering .
To build strains α120 to α123 PCR reactions using primers 150F-R, 164F-R, 249F-R & 250F-R were performed on plasmid ß16. These amplifications were then inserted in the target genomic loci using lambda red recombineering .
To build strains α125 to α150 and α165 to α168, primers N19F, N21F, N23R, N39R, N43F, N46F, N65R were used to amplify mCherry from plasmid 48. When needed, these primers have an overhang containing a replacement sequence for the promoter part. These amplifications were then inserted in the target genomic loci using lambda red recombineering in strains α26 or α36.
To build strains α153 and α154 PCR reactions using primers 150F-R & 250F-R were performed on plasmid ß22. These amplifications were then inserted in the target genomic loci using lambda red recombineering.
To build strains α169 and α170, PCR reactions using primers N22R & N64R were performed on plasmid ß23. These amplifications were then inserted in the target genomic loci using lambda red recombineering.
To build strains α179 to α184, PCR reactions using primers listed in Table S2 were performed on plasmid ß5, amplifying only the GRS. The PCR product was then inserted in the target genomic loci in strains α129, α131, α149, α150, α167, or α168 using lambda red recombineering.
To build strains α240 to α242 expressing mutants of lambda-cI protein, a PCR product containing chloramphenicol resistance gene amplified from pMC48 using primers N88F-R was inserted in E. coli genome, truncating the lambda cI gene. A second PCR product (obtained from primer N84F ; N86F or N92F), containing the P158T, Y210H or S228R mutation was introduced in replacement of chloramphenicol resistance gene using lambda red recombineering. Colonies sensitive to chloramphenicol were selected. The sequence of the lambda cI mutants were verified by PCR and sequencing.
The primers and genetic constructs were designed using MacVector software and EcoCyc [39].
Cell Growth Conditions
Luria Broth (LB) was used for the routine growth of E. coli strains. M9 media with glycerol was used for the growth of strains for RNA extraction and qPCR measurements. M9 media is 6 g/L Na2HPO4 x 2H2O, 3 g/L KH2PO4, 0.5 g/L NaCl, 0.002 % Casamino acids, 2 mM MgSO4, 100 µM CaCl2 and 0.8 % glycerol as the carbon source. Antibiotics were added to the culture as needed at the following concentrations: spectinomycin (60 µg/mL), kanamycin (25 µg/mL genomic integrations, 50 µg/mL for plasmids), phleomycin (10 µg/mL), gentamicin (10 µg/mL), and ampicillin (100 µg/ml). Bacterial cultures were grown at 30°C or 37°C with 200 rpm agitation.
Molecular Biology Methods
For routine PCR amplification, Q5 and OneTaq DNA Polymerase was used per manufacturer’s supplied protocol (NEB®). PCR products were cleaned using Monarch DNA CleanUp Kit from NEB®, plasmids were purified using Monarch Plasmid Miniprep Kit, following manufacturer’s supplied protocols. PureLinkTM Genomic DNA Extraction Kit was used to extract genomic DNA (ThermoFisher®). Simply Seamless DNA Assembly Kit was used to assemble synthetic DNA fragments and clone, following manufacturer’s supplied instructions.
Electrocompetent cells were prepared using regular procedures. Briefly, bacterial strains were grown overnight in LB containing the appropriate antibiotics. This seed culture was then diluted 1:400 to inoculate 200 mL of LB containing antibiotics and IPTG if necessary, and grown at 30°C until reaching OD600 ∼ 0.5. Cell pellets were harvested by centrifugation at 3,900 g at 4°C for 6 minutes, and washed 2 times with an equal volume of ice cold 10 % glycerol and then resuspended in 2 mL 10 % glycerol.
Electroporations were performed on an Eppendorf 2510 using manufacturer-supplied protocols. Prior to electroporations performed for lambda red, all PCR fragments were digested with DpnI for 1-hour to remove template plasmid. 200 ng of purified DNA fragment containing the linear construct to be integrated was mixed with 50 µL electrocompetent cells in 0,1 cm electroporation cuvettes. Cells were electroporated at 1,8 kV and immediately resuspended in 1 mL LB, incubated shaking 200 rpm, 3 h at 30°C, and 100 µL was plated onto LB containing the antibiotics of interest and incubated at 30°C overnight. Genomic DNA was extracted from putative colonies, PCR was used to amplify the genomic region of the integration and all strains were confirmed by sequencing.
Routine agarose gel electrophoresis was conducted in RunOne Electrophoresis System (Embitec) using; Thermo Scientific Loading Dye, a 1 % or 2 % agarose gel, 1X TBE (Tris, Boric Acid, EDTA) buffer and run for 20 minutes at 100V. Gels were stained with Ethidium Bromide (Sigma) for RNA and Midori Green (Nippon Genetics) for DNA, before being visualized under UV light or using a G-box iChemi (Syngene).
RNA Isolation
Cells were inoculated to 300 µL M9 Glycerol media and grown overnight at 37°C. The following day, 10 mL of M9 Glycerol was inoculated with 200 µL of overnight culture. 10 mM Rhamnose was added to the cultures that required expression of lambda cI. The samples were grown until they reach OD600 ∼ 0.55 and harvested by centrifugation, 10 minutes at 3,900 g at 4°C. The pellets were snap frozen in dry ice/ethanol bath and stored at -80°C until RNA was extracted. To extract total RNA, cell pellets were transferred to ice and resuspended in 1 mL of Ribozol RNA Extraction Reagent (VWR). RNA extraction was performed according to the manufacturer’s supplied protocol. The final RNA pellets were resuspended in approximately 225 µL of water, depending upon pellet size. RNA was treated with DNase I (NEB) per company supplied protocol. RNA was then precipitated by adding of 20 µL sodium acetate and 500 µL of isopropanol. RNA was then pelleted at 21,130 g for 30 minutes, washed in 500 µL of 75 % ethanol, and resuspended in 80 µL of water. The integrity, quality and quantity of purified RNA was determined by agarose gel electrophoresis and nanodrop measurements.
Reverse-Transcription and Quantitative PCR (RT-qPCR)
Five hundred nanograms of RNA was used to perform Reverse Transcription using Protoscript II RT Kit according to the manufacturer’s supplied protocol (New England BioLabs®). While conducting this large RT-qPCR study, we discovered that there is a significant batch to batch variation in Reverse Transcriptase. To prevent this from impacting our datasets, all of the RT-qPCR reagents used during the entire study came from a single production batch. cDNA samples were purified using GeneJET PCR Purification Kit (Thermofisher®), and eluted in 50 µL final volume. cDNA samples were diluted 10 times, and qPCR was performed using SYBR Premix Ex Taq Kit (Takara) per manufacturer’s supplied protocol. Primers used to quantify expression for the different genes are in Table S2. Quantitative PCR was performed on Realplex2 Mastercycler from Eppendorf® using manufacturer’s supplied protocol and the following optimized parameters : 40 cycles with denaturation 5 seconds at 95°C, primer annealing for 30 seconds at 60°C, and extension at 72°C for 20 seconds. An external standard (a dilution series for the corresponding PCR product) was added to each qPCR plate. All samples were measured in duplicate on the plate. All measurements were the average of a minimum of three independent cultures. The standard error was less than 30 % for all averaged values.
Statistics and Data Analysis
Absolute quantification of gene targets were performed using absolute quantitation via a standard DNA curve. Data analysis was done with Microsoft Excel. To obtain the number of transcript per cell, we used the following formula :
Number of copies =
(X nanograms * Avogadro’s number) / (molecular weight * 1x10⁹)
X corresponds to the amount of amplicon got from qPCR, Avogrado’s number (6.0221x10²³) corresponds to the number of molecules per mole, molecular weight of emGFP is 233703.9, molecular weight of mCherry is 231269.38, multiplied by 1x10⁹ to get the number of molecules per nanogram of total RNA. This number is then divided by 10,000 to obtain the number of molecules per cell [40,41].
3. Results
3.1. Context Sensitivity of Transcription in Glucose and Glycerol All Along the E. coli Chromosome
To obtain a global view of context sensitivity within the E. coli chromosome, we undertook a transposon mutagenesis approach to randomly insert a transcription reporter cassette throughout the genome. This reporter cassette has expression of emGFP driven by a weak promoter (p1) and has transcriptional terminators both upstream and downstream of emGFP to prevent unwanted transcriptional read-through from flanking genomic regions (Figure 1, top insert). We confirmed that emGFP transcription is indeed derived from the weak promoter and not from read-through transcription using RT-qPCR (Figure S2). The genomic locations for the transposon insertion sites were determined by sequencing. The final library consists of 209 strains that harbor the emGFP reporter cassette at unique locations covering the entire genome. Given that genome architecture and expression strongly depend on growth conditions [9,11], we investigated how changes in position and growth condition impact context sensitivity. To that goal, transcription of the emGFP reporter cassette was assessed by RT-qPCR in cells grown in media containing either glucose or glycerol as sole carbon source.
The plotting of transcription data with respect to the genomic location showed a large difference in expression in regards to both position and nutritional condition (Figure 1, main panel). Position affects expression up to 161-fold in glucose and 102-fold in glycerol although the averaged expression levels for each set are similar (0.0713 transcripts per cell (TPC) in glucose and 0.0707 TPC in glycerol). Nutritional conditions impact expression either negatively or positively at nearly all positions about 4-fold in average and up to ~1400-fold. This nutritional effect is in agreement with a previous study carried out at a few genomic positions [42].
To determine whether the expression variability in the library is biased by mutagenic effects caused by transposon insertion, we next inserted our reporter cassette at positions rationally curated to be non-mutagenic (e.g. between transcription units and known regulatory features) (Figure S3). Eight positions in the Ori region and 17 in the Ter region were thus selected (Figure 1, bottom plots). The insertion density in the 100 kb long Ter region was intentionally rather high (evry 5.7 kb in average) to evaluate how context sensitivity responds at a fine scale. The expression data at non-mutagenic sites appeared to be in the range of the genome-wide results: the mean TPC value in glucose and glycerol were 0.043 +/- 0.019 and 0.117 +/- 0.082, respectively and the expression variability was up to 3-fold in glucose and 5.2-fold in glycerol. Moreover, the carbon source impacts variability up to 7-fold. It is inferred from this analysis that the expression variability in the library is not due to mutagenic effects and that expression variability is obvious even at close positions.
Collectively, our findings confirm the importance of context sensitivity on expression and suggest that context sensitivity strongly depends on the genome architecture and genomique expression pattern imposed by carbon sources. They also show that changes in context sensitivity are obvious even at very close (2-3 kb apart) positions. It is interesting to note here that we were unable to identify any correlation between expression patterns and the organization of the E. coli genome in six macrodomains and two replichores.
3.2. Transcription in a Protein-Bound DNA Loop Is Protected Against Context Sensitivity
Concidering that supercoiling is a major cause of context sensitivity and that supercoiling diffusion is prevented by DNA looping [25,32,33,34,35], we decided to evaluate the impact of looping on context sensitivity. To insulate our reporter cassette within a small loop in vivo, we used the lambda cI protein. This protein is known to efficiently bind specific DNA sequences (OR and OL) and self-dimerize to form a protein-bound DNA loop in vivo [43,44,45,46]. To express lambda cI, we engineered a strain that has in its genome the corresponding gene under the transcriptional control of the rhamnose inducible promoter. We confirmed that this strain expressed lambda cI in the presence of rhamnose using Western blot analysis (Figure S4). To allow emGFP insulation in a loop, the reporter cassette was flanked by the lambda cI binding sites (Figure 1 and 2). The impact of looping on emGFP transcription was then investigated in 16 of the non-mutagenic insertion sites (eight in the Ori region and eight in the Ter region). The corresponding strains were constructed by transferring the reporter cassettes into the lambda cI expressing strain (α1). Transcription of emGFP was then quantified by RT-qPCR for strains grown in a medium containing glycerol as carbon source and rhamnose as inducer of DNA-loop formation.
In condition of loop formation, emGFP transcription averages at 0.05 TPC (sd 0.01 TPC) and ranged between 0.03 to 0.06 for both the Ori and Ter regions (Figure 2). In comparison with the un-looped configuration, the mean expression level decreased 3.9-fold and expression variability (highest TPC / lowest TPC) decreased 5-fold. Moreover, and depending on the position, loop formation is associated with either an increase or decrease expression level compared to the un-looped constructs. This data shows that incorporation of our reporter cassette within a DNA loop homogenizes p1 expression levels and significantly reduces the transcription variability found in the un-looped configuration.
To further characterize the impact that DNA looping has on expression, we quantified a series of reporter constructs in which the weak p1 promoter was replaced by the strong p3 promoter (Figure 3a and b). The promoter swapping was carried out in four strains (two harboring the cassette at the Ori region and two at the Ter region) (loci highlighted by stars in Figure 1 and 2). These insertion sites were selected based on results obtained with the p1 promoter. Sites 2,185,490 and 2,244,773 were selected because loop formation strongly increased expression (> 5-fold). The insertion site 4,158,229 was selected because loop induction strongly decreased expression (> 5-fold) and site 4,046,827 was chosen because the loop did not appear to have a significant impact on expression. Expression levels for the p3 constructs were quantified for cells grown in glycerol with or without rhamnose (e.g. without or with a DNA loop, respectively). In the un-looped version, we obtained an average of 0.64 TPC and a range from 0.423 to 0.85 TPC (Figure 3a). This data shows that the p3 promoter strength is on average 8-fold stronger than p1 and that strong promoters are less sensitive to the genomic context than weak promoters (the context sensitivity impacts 2-fold p3 and 66-fold p1). In the looped constructs, the activity of the p3 promoter is mostly constant (0.40 to 0.44 TPC), a value again 8-fold higher that with p1 in the same configuration (Figure 3b). Collectively, our results show that transcription of a gene embedded in a protein-bound DNA loop is effectively protected from context sensitivity and may reach a homogeneous level at any chromosomal positions. This insulation likely results from the ability of protein-mediated DNA loops to operate as topological barriers that prevent local supercoiling to interfere with gene expression within the loop.
3.3. Reducing the Positive Supercoiling Buildup (PSB) in DNA Loops Increases Expression Levels
Transcription and supercoiling are mutually influential and supercoils generated between two topological barriers (e.g. in a protein-mediated DNA loop) cannot escape the insulated region (see above). Hence, the supercoiling generated during emGFP transcription in the looped constructs may affect its expression. For highly expressed genes, such interference reduces gene expression. Chong et al. showed that this inhibition is caused by PSB generated by the transcribing RNA polymerase and can be alleviated by the gyrase which relaxes PSB [16]. To investigate the role of PSB on p3-driven emGFP expression in looped constructs, we used a DNA sequence of the Mu-prophage that E. coli DNA gyrase recognizes efficiently to relax supercoiling [47]. This sequence, named GRS, was inserted upstream or downstream of emGFP (Figure 3d, e) and the synthetic constructs were introduced into the four genomic loci highlited Figure 2. As control, an isogenic strain containing downstream of the reporter cassette a neutral DNA (n-DNA) segment similar in size (~250 bp) to the GRS sequence was constructed (Figure 3c). Results showed that insertion of a ~250 bp neutral sequence within the original loop does not significantly change emGFP transcription whilst this transcription is increased from 20 to 60% in variants containing the GRS either upstream or downstream from the reporter gene. Overall, these results suggest that reduction of PSB accumulation inside loops increases gene expression.
3.4. Transcription Levels for Two Genes Within a DNA Loop Strongly Depends on Their Relative Orientation and Promoter Strength
Gene expression in natural genomes depends on intragenic regulatory determinants (promoter sequence, binding of transcription factors to operators…) and on combinatorial effects of intergenic mechanisms linked to the genome layout (spatial arrangement and orientation of genes) and including PSB and transcriptional interference [3,48,49]. The level to which intergenic signals contribute to gene expression control is still unclear. To investigate this issue, we used our synthetic biology approach to test the mutual impact that two transcribed genes have on their expression in looped constructs. To that goal, we inserted in the cassette containing emGFP under p3 and the lambda cI binding sites (Figure 3a and b), a second reporter gene (mCherry) in three different configurations (Figure 4, top panel): (a) Tandem, transcription is co-oriented; (b) Convergent, the two genes transcribe into each other; (c) Divergent, transcription proceeds away from each other. These constructs have mCherry expressed from the weak p1 or a strong (p10) promoter. Both genes are directly followed by a strong terminator to prevent read-through transcription and transcription fork collisions. The constructs were then inserted into two different genomic locations (Ori and Ter regions) in the strain expressing lambda cI (α1) and analyzed in condition of loop formation.
When compared to the original p3-emGFP loop construct (about 0.4 TPC, Figure 3b), the insertion of p1-mCherry doubled emGFP expression in the tandem and convergent constructs while it had no effect on the divergent configuration (Figure 4 diagrams a-c and p1 bargraphs). In these constructs, expression of mCherry from the weak p1 promoter was very low. To define how a strong promoter within the DNA loop impacts expression, we swapped the weak p1 promoter of mCherry with the strong p10 promoter and quantified expression for both genes (Figure 4 diagrams a-c and p10 bargraphs). Comparing the emGFP expression profiles for the p1 and p10 constructs we see that the use of a strong promoter for mCherry doubles emGFP expression levels for the tandem and divergently oriented genes and slightly decreases expression in the convergent (Figure 4 p1 and p10 bargraphs). The p1 to p10 swapping increases mCherry expression and this expression in the convergent orientation is 2-fold lower compared to the tandem and divergent configurations.
Overall, our results show that both the relative gene orientation and promoter strength impact gene expression in a DNA-loop. Interestingly, the strongest phenotypes were found to depend on gene orientation in constructs containing a weak and a strong promoter. As compared to the tandem orientation, the activity of the weak promoter in these constructs decreases ~5-fold in the convergent configuration and ~25-fold in divergent constructs while the activity of the strong promoter is only reduced 2-fold in the divergent configuration. In the presence of two strong promoters, gene orientation impacts expression less drastically (2- to 4-fold). We inferred from this that intergenic mechanisms play important role in gene regulation in topologically insulated DNA sequences.
3.5. PSB Strongly Impacts Expression Levels for Both Genes Within a DNA Loop
To test the contribution of PSB in gene regulation by intergenic mechanisms, GRS was inserted between the highly transcribed p3-emGFP and p10-mCherry (Figure 4, diagrams d-f) and mRNA levels were compared to the isogenic constructs lacking GRS (Figure 4, compare bargraphs P10 and P10 (GRS)). Insertion of GRS increased emGFP expression in all orientations (3 to 7-fold) and increased mCherry expression (2-3 fold) in the tandem and convergent configurations, while having no effect on mCherry expression in the divergent construct. This result suggests that PSB is an important determinant of gene regulation by intergenic mechanisms in loops containing two highly expressed genes. The tandem oriented construct with the GRS produced the highest expression levels for both genes.
3.6. DNA Loop Formation Is Required For Isolating Transcription from the Genomic Context
Lambda cI is a highly characterized DNA-loop forming protein. The capacity of this protein to tether distant regions is provided by its ability to bind to DNA operators and to self-oligomerize. In the tetrameric form, lambda cI binds operator sequences named OL and OR. The interaction between the two tetramers forms an octamer and this results in the formation of a DNA loop [43,44,45,46]. To confirm that DNA loop formation and not solely DNA binding is required for transcriptionally isolating gene expression from the genomic context, we engineered 3 strains, each expressing a different mutant of lambda cI protein (P158T; Y210H; S228R). These mutants have been well-characterized previously [50]. Two mutations impact the oligomerization ability of lambda cI (P158T; S228R) and the third reduces the capacity of lambda cI to bind adjacent operator sites (Y210H). Briefly, these mutations allow lambda cI to bind DNA but prevent the formation of DNA loops.
The (p3-emGFP)-GRS-(p10-mCherry) construct was inserted into strains expressing each of the 3 lambda cI mutants. The results show that expression levels for both emGFP and mCherry are similar in cells lacking the lambda cI protein and in strains producing a mutated form (Figure S5). These results confirm that the formation of a DNA loop is required for transcriptional insulation of the cassette from context sensitivity.
4. Discussion
Our work investigates the cause of context sensitivity using a synthetic biology approach. As a first step, we obtained an overview of the genomic landscape for this phenomena using 209 strains that harbor the emGFP reporter cassette at unique locations covering the entire genome. Previously, different groups have taken similar approaches, where they quantitated expression levels of a reporter gene that was placed at different genomic locations. These studies generally quantitated expression levels for strains grown in a single growth condition, providing a static snapshot of expression variability. In our study, we evaluated the reporter library in two growth conditions where it has been previously shown that the nucleoid architecture is drastically different. This gave us the unprecedented opportunity to obtain a dynamic view of how two different chromosomal conformations influence the expression of the exact same reporter construct genome-wide. Additionally, previous studies often used strong promoters to drive expression of the reporter gene. We demonstrated that a gene expressed from a weak promoter is more sensitive to the influence of its genomic context and used such a promoter for our genome-wide study. Other studies have used fluorescence to track transcriptional responses. Though this is an easy way to obtain expression data, we believe that by quantitating the protein end-product, results could be misleading due to other factors that influence final protein levels (post-transcriptional regulation, translational and post-translational regulation, and maturation of the fluorophore). For this reason, we used RT-qPCR to determine expression levels, one of the most accurate methods for mRNA quantification.
Results confirmed that genomic position has a dramatic influence on gene expression and showed that this position effect significantly differs when the genome architecture is modified by using different carbon sources (Figure 1). The two different growth conditions we used have previously been shown to result in different replication rates and Ori/Ter ratios [51]. This generates a higher relative copy number for genes close to the Ori region versus the Ter region (gene dosage effect) which is expected to result in higher levels of transcription at Ori [52]. Our data from the transposon library does not show this global transcriptional skew. It is possible that the Ori/Ter ratio is clause to one under our growth conditions as we isolated total RNA at a (high) cell density (OD600 = 0.5) where DNA replication is ceasing. We therefore concude that the genome-wide variation in expression found here mainly depends on context sensitivity rather than on a side effect of a replication-driven gene dosage.
The fine-tune mapping in the Ter region demonstrates that even when two genomic insertion sites are close together on the genome, they can be impacted quite differently by context sensitivity (Figure 1, bottom left panel). This result is consistent with a previously study [2]. In this region, we also detected a higher difference in expression and variability in glycerol compared to glucose (Figure 1, bottom left panel). Within this region, two operons are strongly induced in glycerol. Given that increases in the local concentration of RNA polymerase have been proposed to be a basic principle of transcriptional control [53], it is possible that operon inductions in the Ter region result in a local increase in RNA polymerase concentration and causes a higher basal expression level in the region. Broad regions of high transcriptional capacity centered on ribosomal RNA operon and core metabolic genes have been detected previously [2].
To understand the impact that topological domains have on context sensitivity, we used lambda cI protein to incorporate the emGFP reporter cassette within a DNA loop (Figure 2). We found that the emGFP expression level is homogenized when incorporated within a loop, significantly reducing strain-to-strain variability. The control experiments using lambda cI mutants demonstrate that this effect depends on DNA loop formation. In agreement with previous findings [26,32,33,34,35], we propose that the loop-induced protection from context variability results from the ability of protein-mediated DNA loops to operate as topological barriers that prevent local supercoiling to interfere with gene expression within the loop. The use of DNA loops can thus be extremely beneficial for Synthetic Biology projects as it increases the predictable performance of synthetic circuits and biosynthetic pathways once inserted into the genome.
We found that in the looped configuration, the expression of strong promoters is often lower than in the un-looped version. We showed that this is due to PSB accumulation by introducing a GRS site inside the loops (Figure 3). This insertion increased emGFP expression up to 700% compared to the same construct without GRS. These observations suggest that PSB is an important determinant of context sensitivity and that GRS is a potent tool to improve gene expression within a loop.
To further characterize expression within a protein-bound DNA loop we introduced in different relative orientations a second gene expressed by a weak or a strong promoter (Figure 4). The tandem gene orientation gave the highest expression levels for both reporter genes. According to the twin-supercoiled domain model, we would expect the positive supercoils produced during transcription of the upstream emGFP gene to be countered by the negative supercoils induced by transcription of the downstream mCherry gene. This decrease of topological constraints in the intergenic region could be beneficial for the expression of both genes. For emGFP, it would reduce the negative effects of PSB. For mCherry, it would facilitate the recruitment of the RNA polymerase at the promoter and/or its transition to the open complex.
In the convergent orientation, the transcribing RNA polymerases are expected to increase PSB in the intergenic region and impede expression of both genes. Consistently, when comparing data from the weak and strong promoter for mCherry, we foung that an increase of mCherry expression results in a decrease of emGFP expression. Moreover, the expression of both genes is strongly simulated when PBS is reduced by inserting GRS in the intergenic region. Interestingly, in the absence of GRS, a ~0,2 TPC increase of mCherry results in ~0,16 TPC decrease of emGFP. This observation suggests that a limited quantity of PSB is tolerated between these two genes and that the total transcripts for this configuration is partitioned between the two genes based upon relative promoter strength. In a recent work, Bryant et al. also observed the mutual negative impact of convergent transcriptional units in the E. coli chromosome [1]. Overall, these observations strongly suggest that expression of convergent genes impede each other.
We additionally observed that when mCherry is expressed by weak promoter, its transcription is extremely low in both the convergent and divergent looped constructs. This suggests that weak promoters are very sensitive to genomic context and can be “overwhelmed” by transcription derived from strong promoters.
To systematiquely test the impact that PSB has on loops containing two highly expressed genes, a GRS site was inserted between them in tandem, convergent and divergent configuration (Figure 4). GRS had a positive impact on emGFP expression for all three configurations (3.5-fold increase in tandem, 7-fold in convergent, 2.5-fold in divergent). It also significantly improved expression of mCherry in the tandem (3-fold) and convergent constructs (2-fold) but only had a moderate impact on levels for the divergent configuration. For emGFP, the expression trend is tandem > convergent > divergent. This pattern is different than what was observed previously [3]. We believe that the difference can be explained by the fact that the latter study was carried out on a small plasmid rather than on the large chromosome and/or that, in the plasmid study supercoils can diffuse all along a ~5 kb long sequence while they are trapped in a 2.5 kb chromosomal topological domain in our study. All together, our work suggests that tandem organization is the optimal configuration for high gene expression. Studies made on natural organization of genes on the bacterial chromosome corroborate this inference [54,55,56].
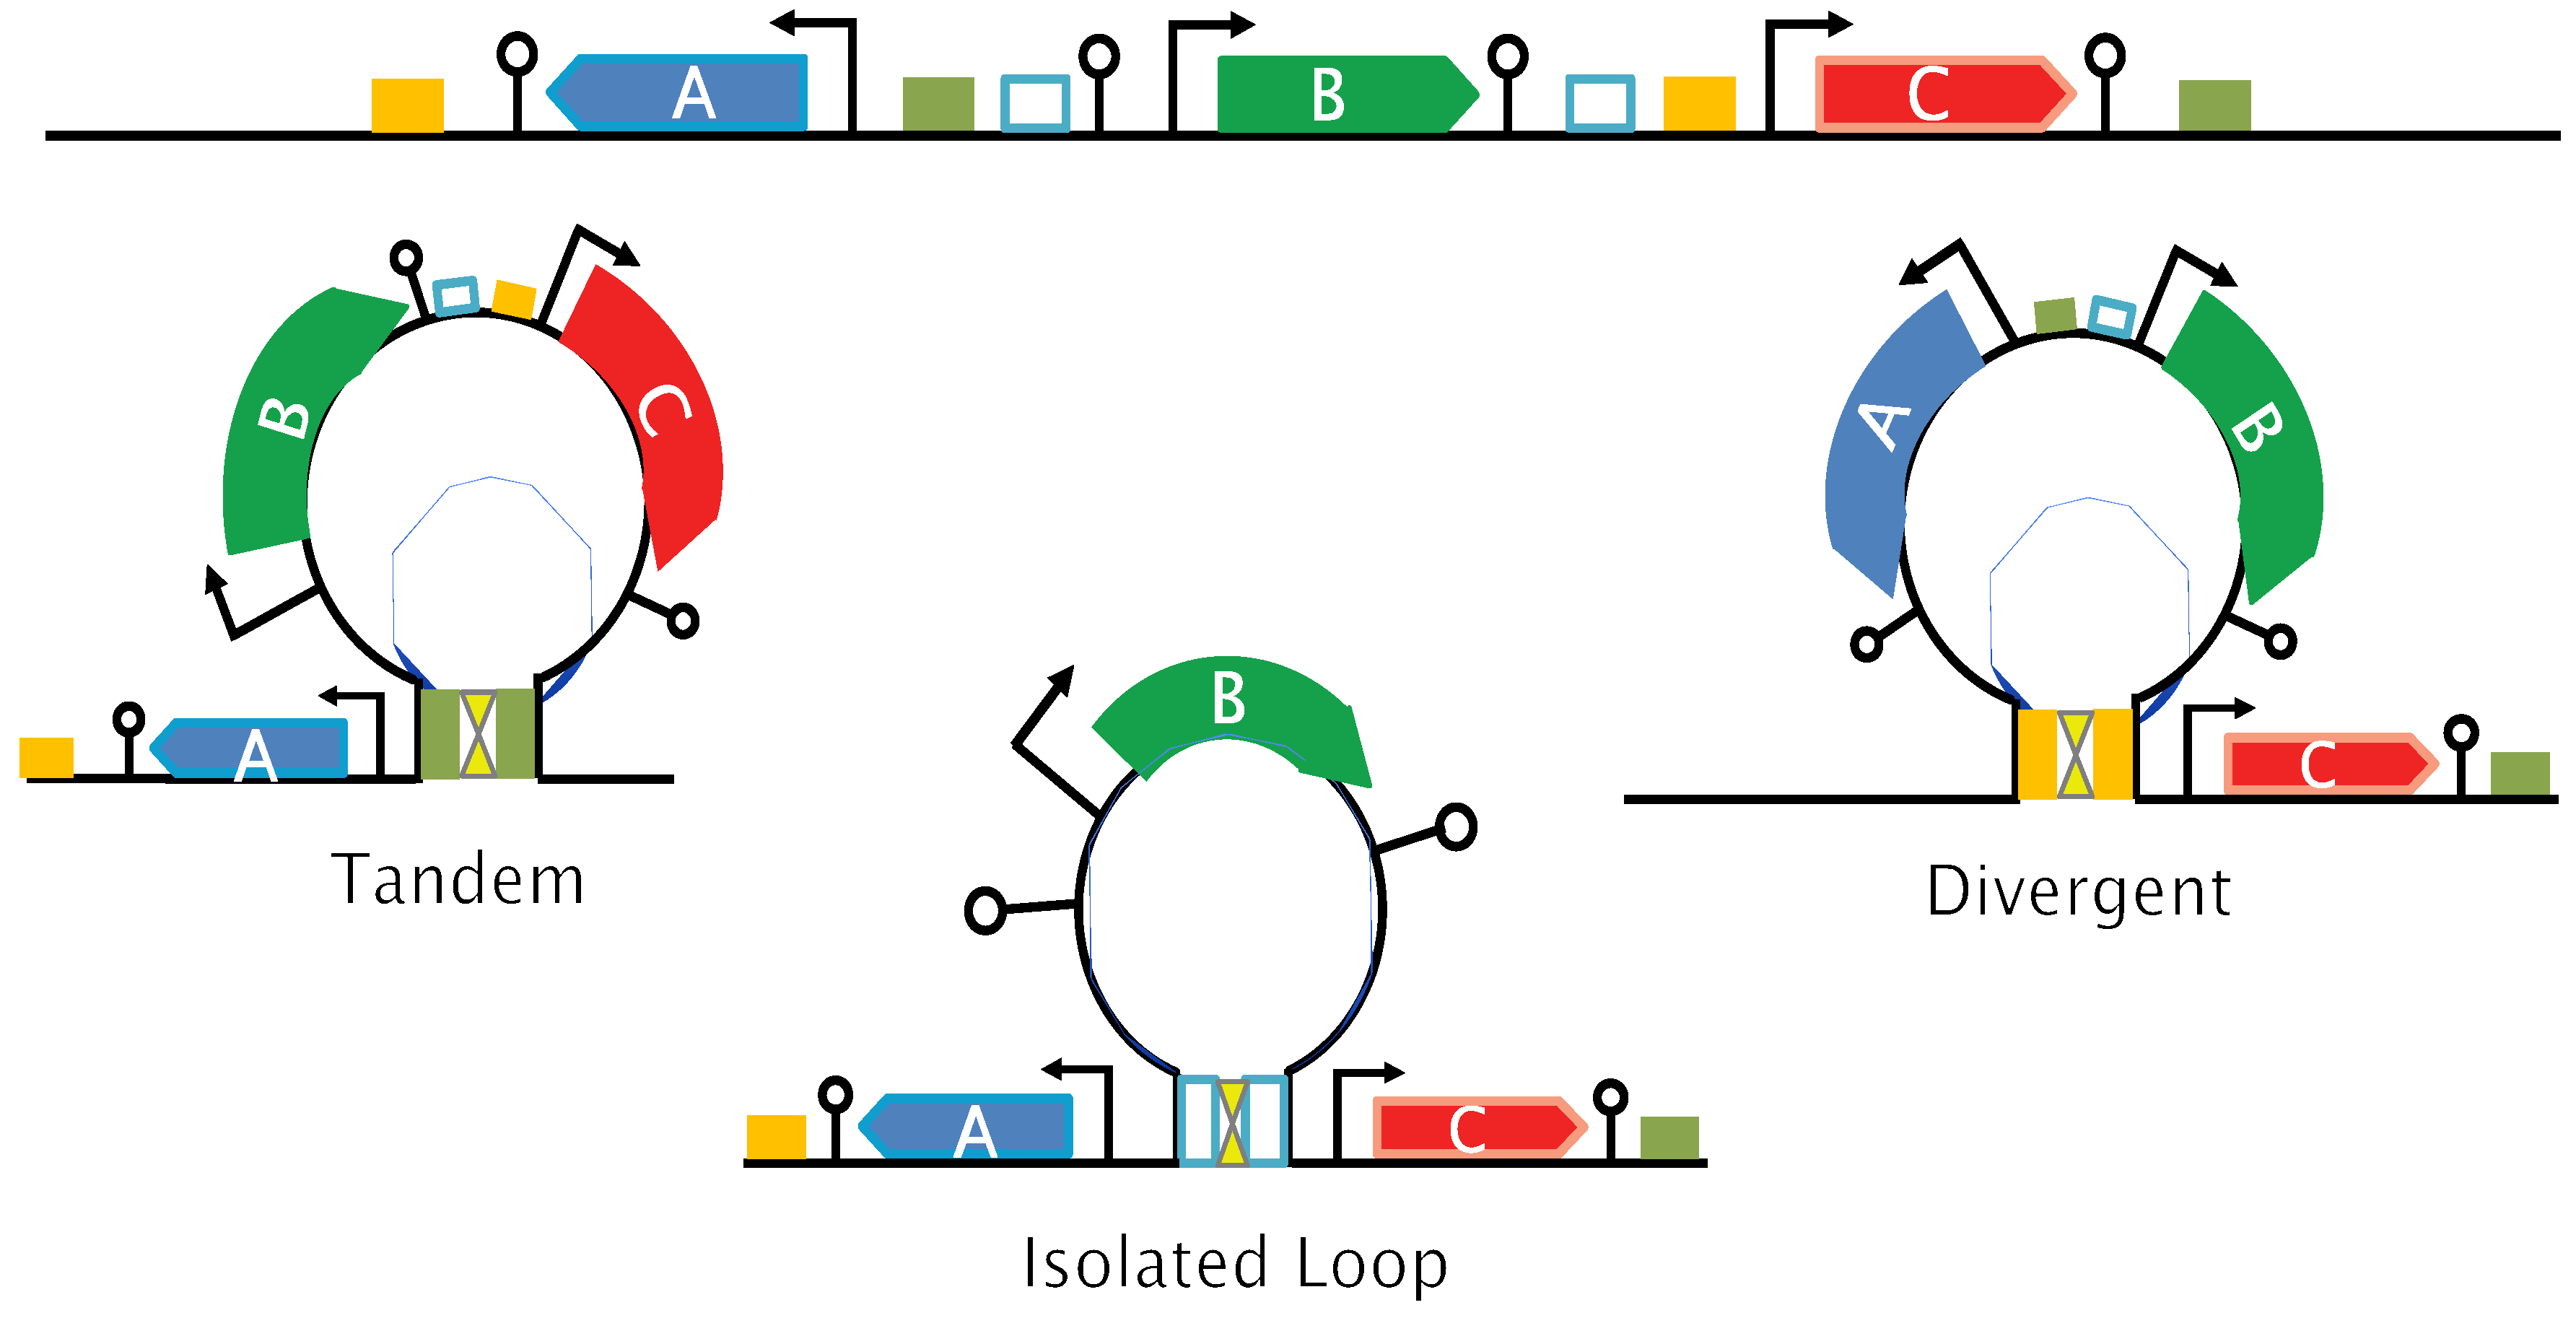
The results reported here has permitted us to formulate a comprehensive model that sheds light on how context sensitivity impacts promoter activity. This model is based on a dynamic epigenetic mechanism involving topological barriers like protein-bound DNA loops, genome architecture and transcriptionally induced PSB (Figure 5). By quantifying the impact that two chromosomal conformations have on context sensitivity, we demonstrated the genome-wide scale of this epigenetic model. It has been well-documented that the genome architecture and looping profile change dynamically with growth phase, carbon source and environmental stress in respond to changes in the level and activity of different proteins like NAPs. We propose that such changes at a local scale cause genes to be embedded between different topological barriers and to be transcribed in different gene layout contexts, thus epigenetically impacting their expression. This model explains how the expession of hundreds of genes can be modulated within less than two minutes after environmental changes. It may additionally be enforced by post-translational modifications (phosphorylation, acetylation, etc.) which are highly dynamic and have been shown to modulate the DNA binding of proteins. Our epigenetic model tightly correlates with the findings from L. Serrano’s lab [57]. In this work they have reported that a large part of transcriptional regulation is determined by non-canonical factors such as DNA supercoiling and genome organization. The diagram of a simplified genomic region that contains sequences allowing several proteins to create different DNA loops illustrates how clues controling these proteins and loop formation would result in the generation of several alternate topological barriers and local gene layouts that would produce very different levels for the “B” transcript (Figure 5). We are now applying these basic concepts to the design of complex genetic programs and synthetic genomes that we are currently engineering within our labs.
5. Conclusions
Our study suggests that the context sensitivity is due to inserting genes into uncharacterized DNA loops containing a variable number of transcription units. It is proposed to depend on several factors operating whithin the loops: the gene layout, transcription interference, promoter strength and DNA topology. It also depends on the genomic architecture dictated by carbon sources. We have additionally demonstrated that a gene can be effectively isolated from context sensitivity by incorporating it within a protein-bound DNA loop structure. The model we have proposed will lead to; (i) New fundamental discoveries and advances in Synthetic Biology, (ii) Identification of new targets for antimicrobial compounds, and (iii) The design/engineering of synthetic genomes. In a fundamental point of view, this work has highlighted some of the mechanisms that govern epigenetic transcription regulation in bacteria.
Supplementary Materials
The following supporting information can be downloaded at the website of this paper posted on Preprints.org, Figure S1 : Transposon vector;Figure S2 : The expression of p1-emGFP is not affected by transcriptional read-through; Figure S3 : Genetic maps showing the local genomic context of non-mutagenic insertion sites in the Ori and Ter regions; Figure S4 : Lambda cI expression upon rhamnose induction;Figure S5 : Transcription of emGFP and mCherry in various lambda cI contexts; Table S1 : List of plasmids; Table S2 : List of primers; Table S3 : List of strains
Author Contributions
“Conceptualization, B.C.J.; methodology, N.S. and B.C.J.; investigation, N.S. and B.C.J.; data curation, N.S., L.J. and B.C.J.; writing—original draft preparation, L.J. and B.C.J.; writing—review and editing, N.S., L.J. and B.C.J.; supervision, L.J. and B.C.J.; project administration, L.J. and B.C.J.; All authors have read and agreed to the published version of the manuscript.”
Funding
This research received no external funding
Data Availability Statement
Data is included in this published article (and its additional information files). Raw data for RT-qPCR will be made available upon reasonable request.
Acknowledgments
We thank Noemie Brisemeur, Elodie Roche, Hafez El Sayyed, Romaine Bodiniere, Jogelindo da Veiga Moreira, Morgane Champleboux and Marko Radojkovic for assistance with construction of strains and qPCR, and Efthymia Lioliou from Synovance for comments that greatly improved the manuscript. We thank Costas Bouyioukos for valuable discussions and interpretations of the data.
Conflicts of Interest
Brian Jester holds shares in Synovance and Synovance has submitted a patent application with respect to the genome engineering methods described in this paper.
References
- Bryant, J.A.; Sellars, L.E.; Busby, S.J.W.; Lee, D.J. Chromosome Position Effects on Gene Expression in Escherichia Coli K-12. Nucleic Acids Research 2014, 42, 11383–11392. [Google Scholar] [CrossRef] [PubMed]
- Scholz, S.A.; Diao, R.; Wolfe, M.B.; Fivenson, E.M.; Lin, X.N.; Freddolino, P.L. High-Resolution Mapping of the Escherichia Coli Chromosome Reveals Positions of High and Low Transcription. Cell Systems 2019, 8, 212–225.e9. [Google Scholar] [CrossRef] [PubMed]
- Yeung, E.; Dy, A.J.; Martin, K.B.; Ng, A.H.; Del Vecchio, D.; Beck, J.L.; Collins, J.J.; Murray, R.M. Biophysical Constraints Arising from Compositional Context in Synthetic Gene Networks. Cell Systems 2017, 5, 11–24.e12. [Google Scholar] [CrossRef] [PubMed]
- Kim, S.; Beltran, B.; Irnov, I.; Jacobs-Wagner, C. Long-Distance Cooperative and Antagonistic RNA Polymerase Dynamics via DNA Supercoiling. Cell 2019, 179, 106–119.e16. [Google Scholar] [CrossRef]
- Johnstone, C.P.; Galloway, K.E. Supercoiling-Mediated Feedback Rapidly Couples and Tunes Transcription. Cell Reports 2022, 41, 111492. [Google Scholar] [CrossRef]
- Visser, B.J.; Sharma, S.; Chen, P.J.; McMullin, A.B.; Bates, M.L.; Bates, D. Psoralen Mapping Reveals a Bacterial Genome Supercoiling Landscape Dominated by Transcription. Nucleic Acids Research 2022, 50, 4436–4449. [Google Scholar] [CrossRef]
- Deng, S.; Stein, R.A.; Higgins, N.P. Organization of Supercoil Domains and Their Reorganization by Transcription. Molecular Microbiology 2005, 57, 1511–1521. [Google Scholar] [CrossRef]
- Dorman, C.J. DNA Supercoiling and Transcription in Bacteria: A Two-Way Street. BMC Mol and Cell Biol 2019, 20, 26. [Google Scholar] [CrossRef]
- Verma, S.C.; Qian, Z.; Adhya, S.L. Architecture of the Escherichia Coli Nucleoid. PLoS Genet 2019, 15, e1008456. [Google Scholar] [CrossRef]
- Killian, J.L.; Ma, J.; Wang, M.D. CHAPTER 3. RNA Polymerase as a Torsional Motor. In Chemical Biology; Landick, R., Strick, T., Wang, J., Eds.; Royal Society of Chemistry: Cambridge, 2021; pp. 46–71. ISBN 978-1-78801-365-9. [Google Scholar]
- Le Berre, D.; Reverchon, S.; Muskhelishvili, G.; Nasser, W. Relationship between the Chromosome Structural Dynamics and Gene Expression—A Chicken and Egg Dilemma? Microorganisms 2022, 10, 846. [Google Scholar] [CrossRef]
- Hustmyer, C.M.; Landick, R. Bacterial Chromatin Proteins, Transcription, and DNA Topology: Inseparable Partners in the Control of Gene Expression. Molecular Microbiology 2024, 122, 81–112. [Google Scholar] [CrossRef] [PubMed]
- Liu, L.F.; Wang, J.C. Supercoiling of the DNA Template during Transcription. Proc. Natl. Acad. Sci. U.S.A. 1987, 84, 7024–7027. [Google Scholar] [CrossRef] [PubMed]
- Ma, J.; Bai, L.; Wang, M.D. Transcription Under Torsion. Science 2013, 340, 1580–1583. [Google Scholar] [CrossRef] [PubMed]
- Janissen, R.; Barth, R.; Polinder, M.; van der Torre, J.; Dekker, C. Single-Molecule Visualization of Twin-Supercoiled Domains Generated during Transcription. Nucleic Acids Research 2023, gkad1181. [Google Scholar] [CrossRef] [PubMed]
- Chong, S.; Chen, C.; Ge, H.; Xie, X.S. Mechanism of Transcriptional Bursting in Bacteria. Cell 2014, 158, 314–326. [Google Scholar] [CrossRef] [PubMed]
- Champoux, J.J. DNA Topoisomerases: Structure, Function, and Mechanism. Annu. Rev. Biochem. 2001, 70, 369–413. [Google Scholar] [CrossRef] [PubMed]
- Chen, S.H.; Chan, N.-L.; Hsieh, T. New Mechanistic and Functional Insights into DNA Topoisomerases. Annu. Rev. Biochem. 2013, 82, 139–170. [Google Scholar] [CrossRef]
- Gellert, M.; Mizuuchi, K.; O’Dea, M.H.; Nash, H.A. DNA Gyrase: An Enzyme That Introduces Superhelical Turns into DNA. Proc. Natl. Acad. Sci. U.S.A. 1976, 73, 3872–3876. [Google Scholar] [CrossRef]
- Palma, C.S.D.; Kandavalli, V.; Bahrudeen, M.N.M.; Minoia, M.; Chauhan, V.; Dash, S.; Ribeiro, A.S. Dissecting the in Vivo Dynamics of Transcription Locking Due to Positive Supercoiling Buildup. Biochimica et Biophysica Acta (BBA) - Gene Regulatory Mechanisms 2020, 1863, 194515. [Google Scholar] [CrossRef]
- Zechiedrich, E.L.; Khodursky, A.B.; Bachellier, S.; Schneider, R.; Chen, D.; Lilley, D.M.J.; Cozzarelli, N.R. Roles of Topoisomerases in Maintaining Steady-State DNA Supercoiling in Escherichia Coli. Journal of Biological Chemistry 2000, 275, 8103–8113. [Google Scholar] [CrossRef]
- Sinden, R.R.; Pettijohn, D.E. Chromosomes in Living Escherichia Coli Cells Are Segregated into Domains of Supercoiling. Proc. Natl. Acad. Sci. U.S.A. 1981, 78, 224–228. [Google Scholar] [CrossRef] [PubMed]
- Postow, L.; Hardy, C.D.; Arsuaga, J.; Cozzarelli, N.R. Topological Domain Structure of the Escherichia Coli Chromosome. Genes Dev. 2004, 18, 1766–1779. [Google Scholar] [CrossRef] [PubMed]
- Deng, S.; Stein, R.A.; Higgins, N.P. Transcription-Induced Barriers to Supercoil Diffusion in the Salmonella Typhimurium Chromosome. Proc. Natl. Acad. Sci. U.S.A. 2004, 101, 3398–3403. [Google Scholar] [CrossRef] [PubMed]
- Leng, F.; McMacken, R. Potent Stimulation of Transcription-Coupled DNA Supercoiling by Sequence-Specific DNA-Binding Proteins. Proc. Natl. Acad. Sci. U.S.A. 2002, 99, 9139–9144. [Google Scholar] [CrossRef] [PubMed]
- Leng, F.; Chen, B.; Dunlap, D.D. Dividing a Supercoiled DNA Molecule into Two Independent Topological Domains. Proc. Natl. Acad. Sci. U.S.A. 2011, 108, 19973–19978. [Google Scholar] [CrossRef]
- Dages, S.; Zhi, X.; Leng, F. Fis Protein Forms DNA Topological Barriers to Confine Transcription-coupled DNA Supercoiling in Escherichia Coli. FEBS Letters 2020, 594, 791–798. [Google Scholar] [CrossRef]
- Strick, T.R.; Allemand, J.-F.; Bensimon, D.; Bensimon, A.; Croquette, V. The Elasticity of a Single Supercoiled DNA Molecule. Science 1996, 271, 1835–1837. [Google Scholar] [CrossRef]
- Forth, S.; Deufel, C.; Sheinin, M.Y.; Daniels, B.; Sethna, J.P.; Wang, M.D. Abrupt Buckling Transition Observed during the Plectoneme Formation of Individual DNA Molecules. Phys. Rev. Lett. 2008, 100, 148301. [Google Scholar] [CrossRef]
- Berger, M.; Gerganova, V.; Berger, P.; Rapiteanu, R.; Lisicovas, V.; Dobrindt, U. Genes on a Wire: The Nucleoid-Associated Protein HU Insulates Transcription Units in Escherichia Coli. Sci Rep 2016, 6, 31512. [Google Scholar] [CrossRef]
- Watson, G.D.; Chan, E.W.; Leake, M.C.; Noy, A. Structural Interplay between DNA-Shape Protein Recognition and Supercoiling: The Case of IHF. Computational and Structural Biotechnology Journal 2022, 20, 5264–5274. [Google Scholar] [CrossRef]
- Fulcrand, G.; Dages, S.; Zhi, X.; Chapagain, P.; Gerstman, B.S.; Dunlap, D.; Leng, F. DNA Supercoiling, a Critical Signal Regulating the Basal Expression of the Lac Operon in Escherichia Coli. Sci Rep 2016, 6, 19243. [Google Scholar] [CrossRef] [PubMed]
- Yan, Y.; Ding, Y.; Leng, F.; Dunlap, D.; Finzi, L. Protein-Mediated Loops in Supercoiled DNA Create Large Topological Domains. Nucleic Acids Research 2018, 46, 4417–4424. [Google Scholar] [CrossRef] [PubMed]
- Japaridze, A.; Yang, W.; Dekker, C.; Nasser, W.; Muskhelishvili, G. DNA Sequence-Directed Cooperation between Nucleoid-Associated Proteins. iScience 2021, 24, 102408. [Google Scholar] [CrossRef] [PubMed]
- Boulas, I.; Bruno, L.; Rimsky, S.; Espeli, O.; Junier, I.; Rivoire, O. Assessing in Vivo the Impact of Gene Context on Transcription through DNA Supercoiling. Nucleic Acids Research 2023, 51, 9509–9521. [Google Scholar] [CrossRef] [PubMed]
- Rossignol, M.; Basset, A.; Espéli, O.; Boccard, F. NKBOR, a Mini-Tn10-Based Transposon for Random Insertion in the Chromosome of Gram-Negative Bacteria and the Rapid Recovery of Sequences Flanking the Insertion Sites in Escherichia Coli. Research in Microbiology 2001, 152, 481–485. [Google Scholar] [CrossRef]
- Kuhlman, T.E.; Cox, E.C. Site-Specific Chromosomal Integration of Large Synthetic Constructs. Nucleic Acids Research 2010, 38, e92–e92. [Google Scholar] [CrossRef]
- Kuhlman, T.E.; Cox, E.C. A Place for Everything: Chromosomal Integration of Large Constructs. Bioengineered Bugs 2010, 1, 298–301. [Google Scholar] [CrossRef]
- Keseler, I.M.; Mackie, A.; Santos-Zavaleta, A.; Billington, R.; Bonavides-Martínez, C.; Caspi, R.; Fulcher, C.; Gama-Castro, S.; Kothari, A.; Krummenacker, M.; et al. The EcoCyc Database: Reflecting New Knowledge about Escherichia Coli K-12. Nucleic Acids Res 2017, 45, D543–D550. [Google Scholar] [CrossRef]
- Calculations: Converting from Nanograms to Copy Number. Available online: https://eu.idtdna.com/pages/education/decoded/article/calculations-converting-from-nanograms-to-copy-number (accessed on 23 June 2020).
- Philips, R.M.& R. » How Many mRNAs Are in a Cell?
- Scholz, S.A.; Lindeboom, C.D.; Freddolino, P.L. Genetic Context Effects Can Override Canonical Cis Regulatory Elements in Escherichia Coli. Nucleic Acids Research 2022, 50, 10360–10375. [Google Scholar] [CrossRef]
- Révet, B.; Von Wilcken-Bergmann, B.; Bessert, H.; Barker, A.; Müller-Hill, B. Four Dimers of λ Repressor Bound to Two Suitably Spaced Pairs of λ Operators Form Octamers and DNA Loops over Large Distances. Current Biology 1999, 9, 151–154. [Google Scholar] [CrossRef]
- Dodd, I.B.; Perkins, A.J.; Tsemitsidis, D.; Egan, J.B. Octamerization of λ CI Repressor Is Needed for Effective Repression of PRM and Efficient Switching from Lysogeny. Genes Dev. 2001, 15, 3013–3022. [Google Scholar] [CrossRef] [PubMed]
- Dodd, I.B.; Shearwin, K.E.; Perkins, A.J.; Burr, T.; Hochschild, A.; Egan, J.B. Cooperativity in Long-Range Gene Regulation by the λ CI Repressor. Genes Dev. 2004, 18, 344–354. [Google Scholar] [CrossRef] [PubMed]
- Ding, Y.; Manzo, C.; Fulcrand, G.; Leng, F.; Dunlap, D.; Finzi, L. DNA Supercoiling: A Regulatory Signal for the λ Repressor. Proc. Natl. Acad. Sci. U.S.A. 2014, 111, 15402–15407. [Google Scholar] [CrossRef] [PubMed]
- Oram, M.; Pato, M.L. Mu-Like Prophage Strong Gyrase Site Sequences: Analysis of Properties Required for Promoting Efficient Mu DNA Replication. J Bacteriol 2004, 186, 4575–4584. [Google Scholar] [CrossRef] [PubMed]
- Meyer, S.; Reverchon, S.; Nasser, W.; Muskhelishvili, G. Chromosomal Organization of Transcription: In a Nutshell. Curr Genet 2018, 64, 555–565. [Google Scholar] [CrossRef]
- Nagy-Staron, A.; Tomasek, K.; Caruso Carter, C.; Sonnleitner, E.; Kavčič, B.; Paixão, T.; Guet, C.C. Local Genetic Context Shapes the Function of a Gene Regulatory Network. eLife 2021, 10, e65993. [Google Scholar] [CrossRef]
- Burz, D.S.; Ackers, G.K. Single-Site Mutations in the C-Terminal Domain of Bacteriophage.Lambda. cI Repressor Alter Cooperative Interactions between Dimers Adjacently Bound to OR. Biochemistry 1994, 33, 8406–8416. [Google Scholar] [CrossRef]
- Michelsen, O.; Teixeira de Mattos, M.J.; Jensen, P.R.; Hansen, F.G. Precise Determinations of C and D Periods by Flow Cytometry in Escherichia Coli K-12 and B/r. Microbiology 2003, 149, 1001–1010. [Google Scholar] [CrossRef]
- Chandler, M.G.; Pritchard, R.H. Effect of Gene Concentration and Relative Gene Dosage on Gene Output inEscherichia Coli. Molec. Gen. Genet. 1975, 138, 127–141. [Google Scholar] [CrossRef]
- Oehler, S.; Müller-Hill, B. High Local Concentration: A Fundamental Strategy of Life. Journal of Molecular Biology 2010, 395, 242–253. [Google Scholar] [CrossRef]
- Jeong, K.S.; Ahn, J.; Khodursky, A.B. Spatial Patterns of Transcriptional Activity in the Chromosome of Escherichia Coli. Genome Biol 2004, 5, R86. [Google Scholar] [CrossRef] [PubMed]
- Képès, F.; Jester, B.C.; Lepage, T.; Rafiei, N.; Rosu, B.; Junier, I. The Layout of a Bacterial Genome. FEBS Letters 2012, 586, 2043–2048. [Google Scholar] [CrossRef] [PubMed]
- Junier, I.; Rivoire, O. Conserved Units of Co-Expression in Bacterial Genomes: An Evolutionary Insight into Transcriptional Regulation. PLoS ONE 2016, 11, e0155740. [Google Scholar] [CrossRef] [PubMed]
- Yus, E.; Lloréns-Rico, V.; Martínez, S.; Gallo, C.; Eilers, H.; Blötz, C.; Stülke, J.; Lluch-Senar, M.; Serrano, L. Determination of the Gene Regulatory Network of a Genome-Reduced Bacterium Highlights Alternative Regulation Independent of Transcription Factors. Cell Systems 2019, 9, 143–158.e13. [Google Scholar] [CrossRef]
Figure 1.
Expression of the emGFP reporter cassette all along the E. coli genome. Tn10 mutagenesis was used to generate 209 strains containing a single copy of the emGFP cassette at different positions all along the chromosome. Each strain was grown in minimal media containing either glucose or glycerol as the sole carbon source and RT-qPCR was used to quantify cassette transcription. The transcription data are plotted as transcript per cell (TPC) on the y-axis to the respective genomic location on the x-axis in the top panel of the figure. The left and right plots at the bottom of the figure show expression maps for non-mutagenic insertions at the Ter and Ori region, respectively. Blue diamonds represent transcript levels for strains grown in glucose media and the red boxes are for glycerol media. The four stars represent the genomic loci used for further investigation (see below). Diagram representing the reporter cassette is in the upper left corner. The green arrowed box, bent arrow, lollipops and blue boxes stand for the emGFP open reading frame, p1 promoter, transcription terminators and the left and right lambda cI binding sites.
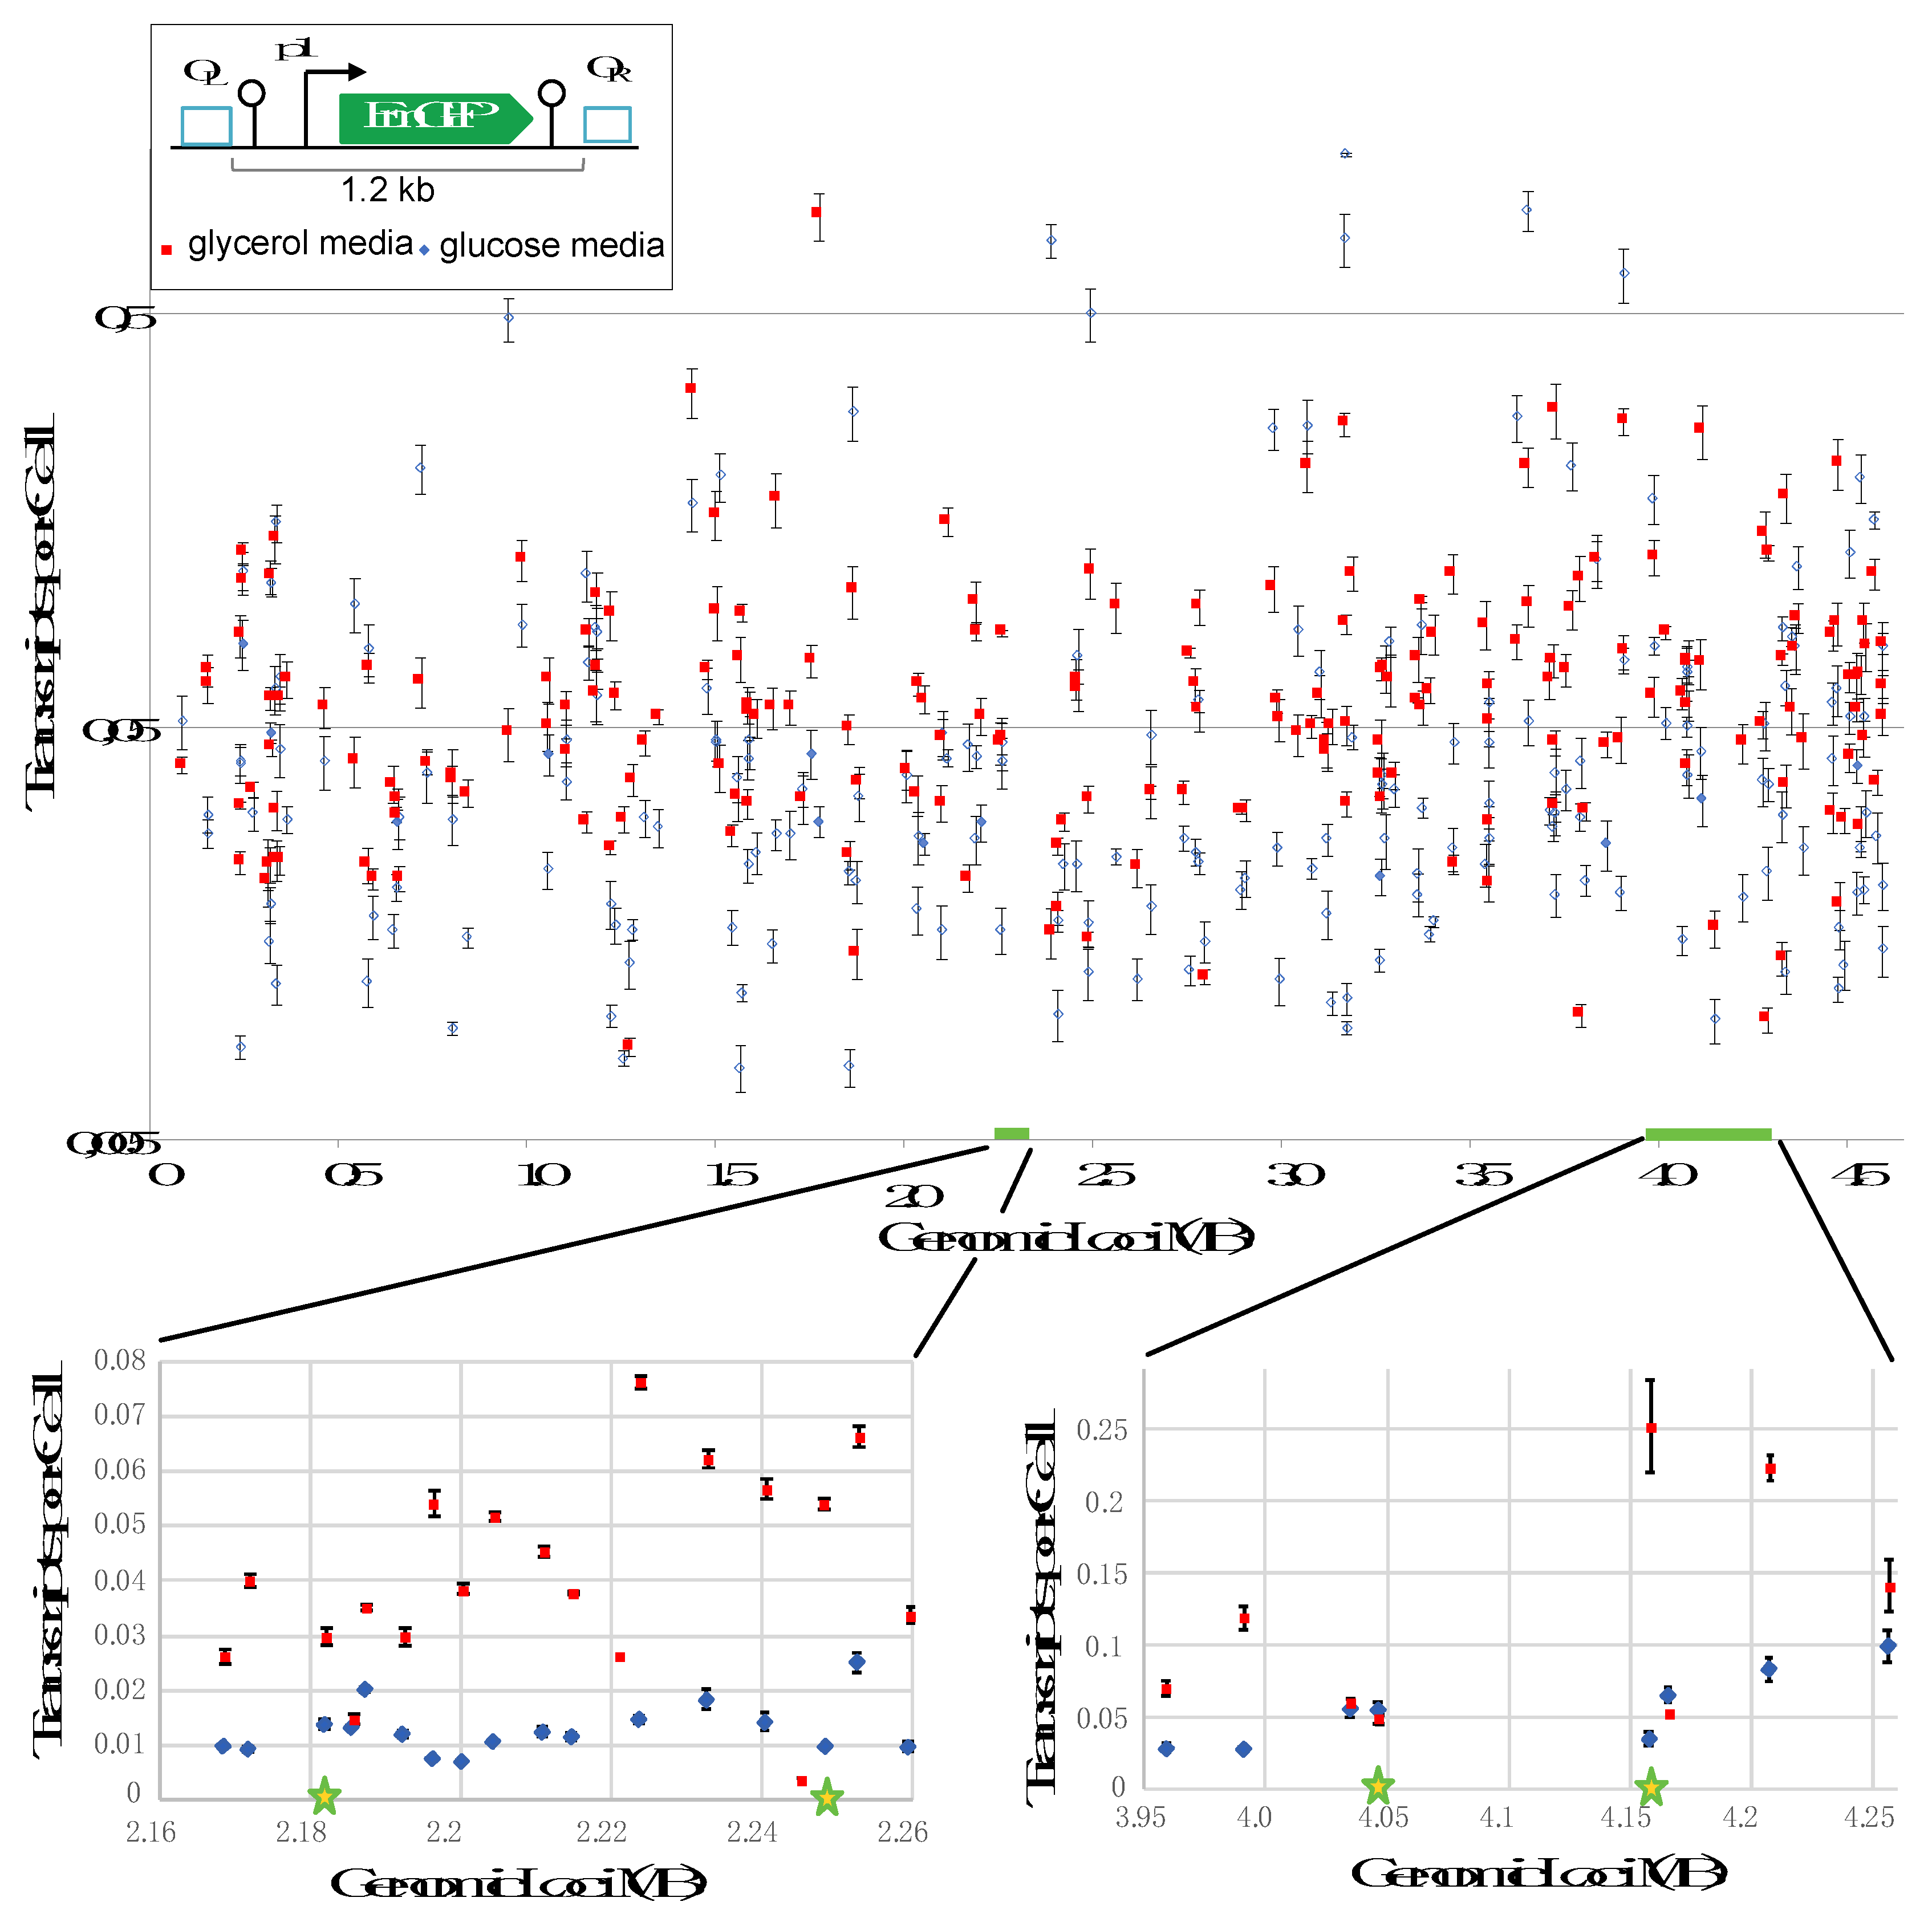
Figure 2.
The impact of DNA looping on gene expression. Expression levels were quantified by RT-qPCR for the different strains grown in media containing either glycerol (red square, no-loop) or glycerol and rhamnose (blue dots, loop). X-axis represents the genomic loci where the constructs have been inserted. Y-axis represents emGFP TPC. The four stars represent the genomic loci used for the next experiment. A diagram of the reporter construct is shown as in Figure 1. In the presence of lambda cI protein (yellow triangles) a DNA-loop is formed.
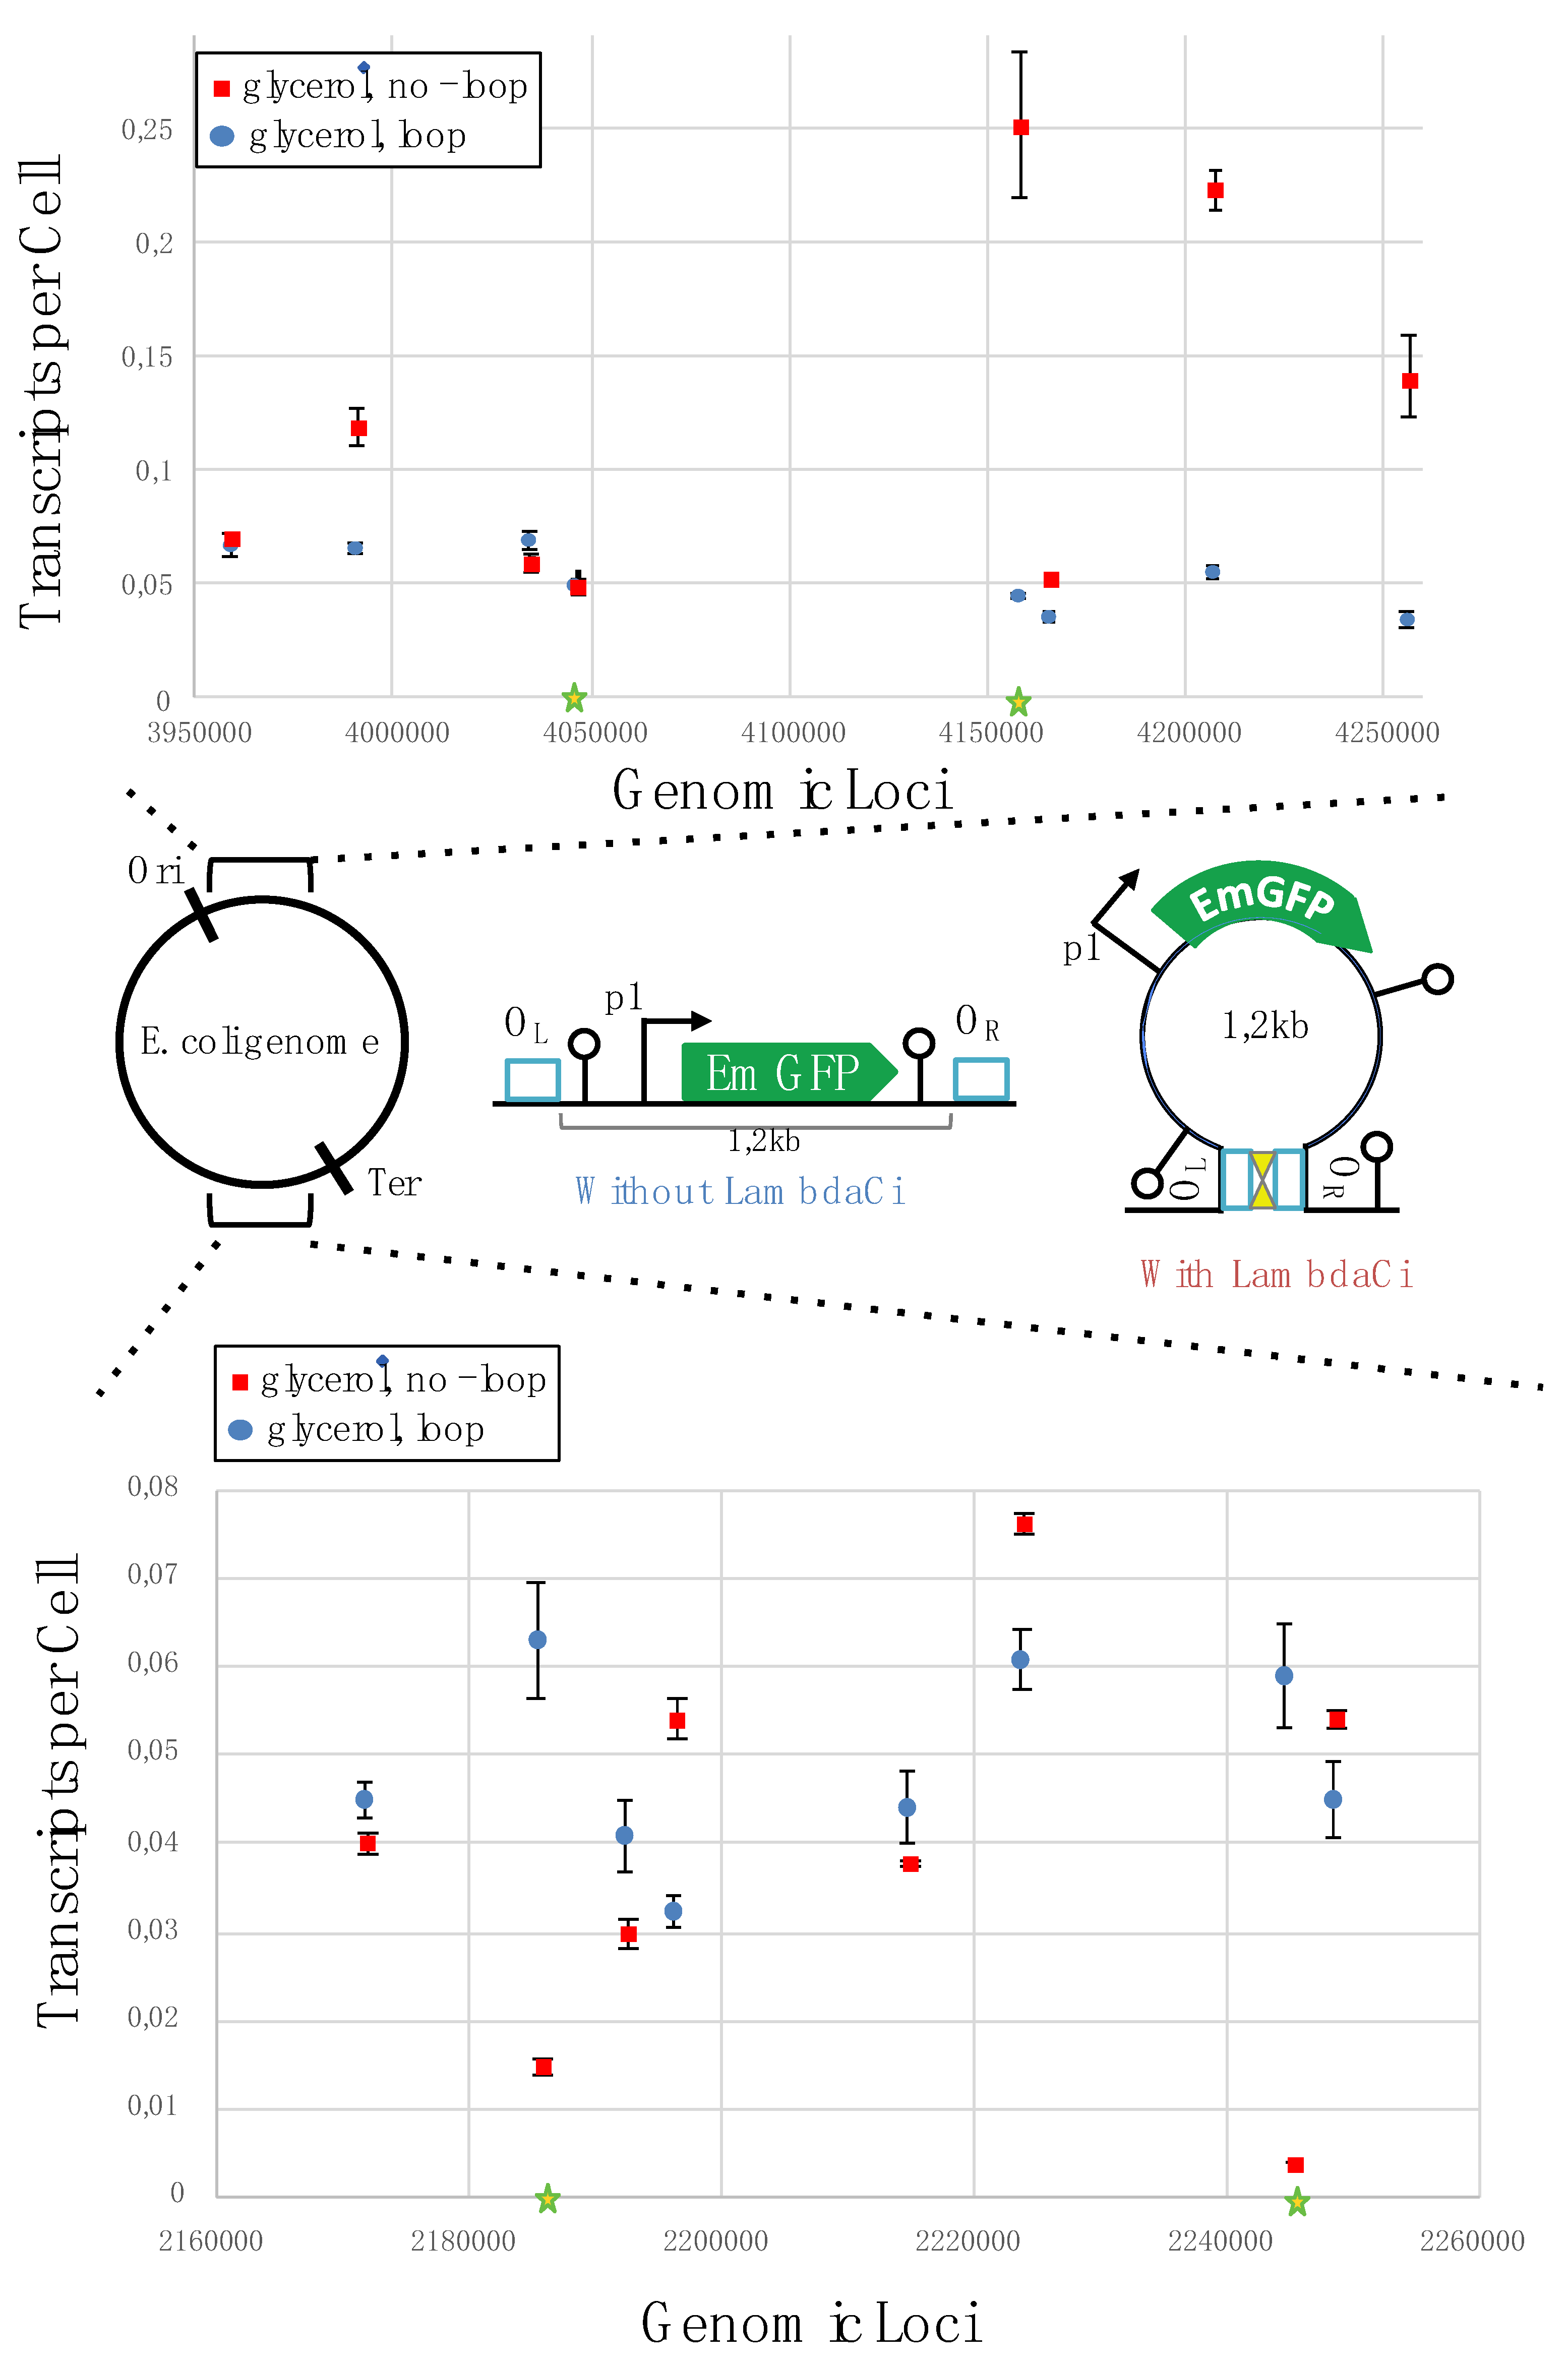
Figure 3.
emGFP expression from the strong p3 promoter in different loop contexts and at four unique genomic positions. Gene expression was quantified by RT-qPCR for the different strains grown in media containing glycerol and rhamnose. The loop contexts are diagrammed as in Figure 2 with the blue box standing for neutral DNA and the brown boxes, GRS: (a) un-looped configuration; (b) loop configuration; loops containing a neutral DNA sequence downstream of emGFP (c) or a GRS downstream (d) or upstream (e) from emGFP. In the histograms, the x-axis stands for the 4 genomic positions and y-axis, TPC.

Figure 4.
Expression of emGFP and mCherry within a DNA loop containing or not GRS. Expression levels were quantified by RT-qPCR for the different strains grown in media containing glycerol and rhamnose. X-axis identifies the two genomic regions where the constructs have been inserted and the y-axis represents the number of TPC. The constructs are diagrammed as in Figure 2 with the green and red arrows representing emGFP and mCherry genes, respectively. All constructs have emGFP under the control of a strong promoter (p3) and mCherry under control of a weak promoter (p1) or a strong promoter (p10). Tandem: genes transcribed in same orientation. Convergent: genes transcribed in convergent orientation. Divergent: genes transcribed in divergent orientation. p1 bargraphs: emGFP under control of p3 and mCherry under control of p1. p10 bargraphs: emGFP under control of p3 and mCherry under control of p10. p10 (GRS) bargraphs: emGFP under control of p3, presence of GRS in the intergenic region and mCherry under control of p10.
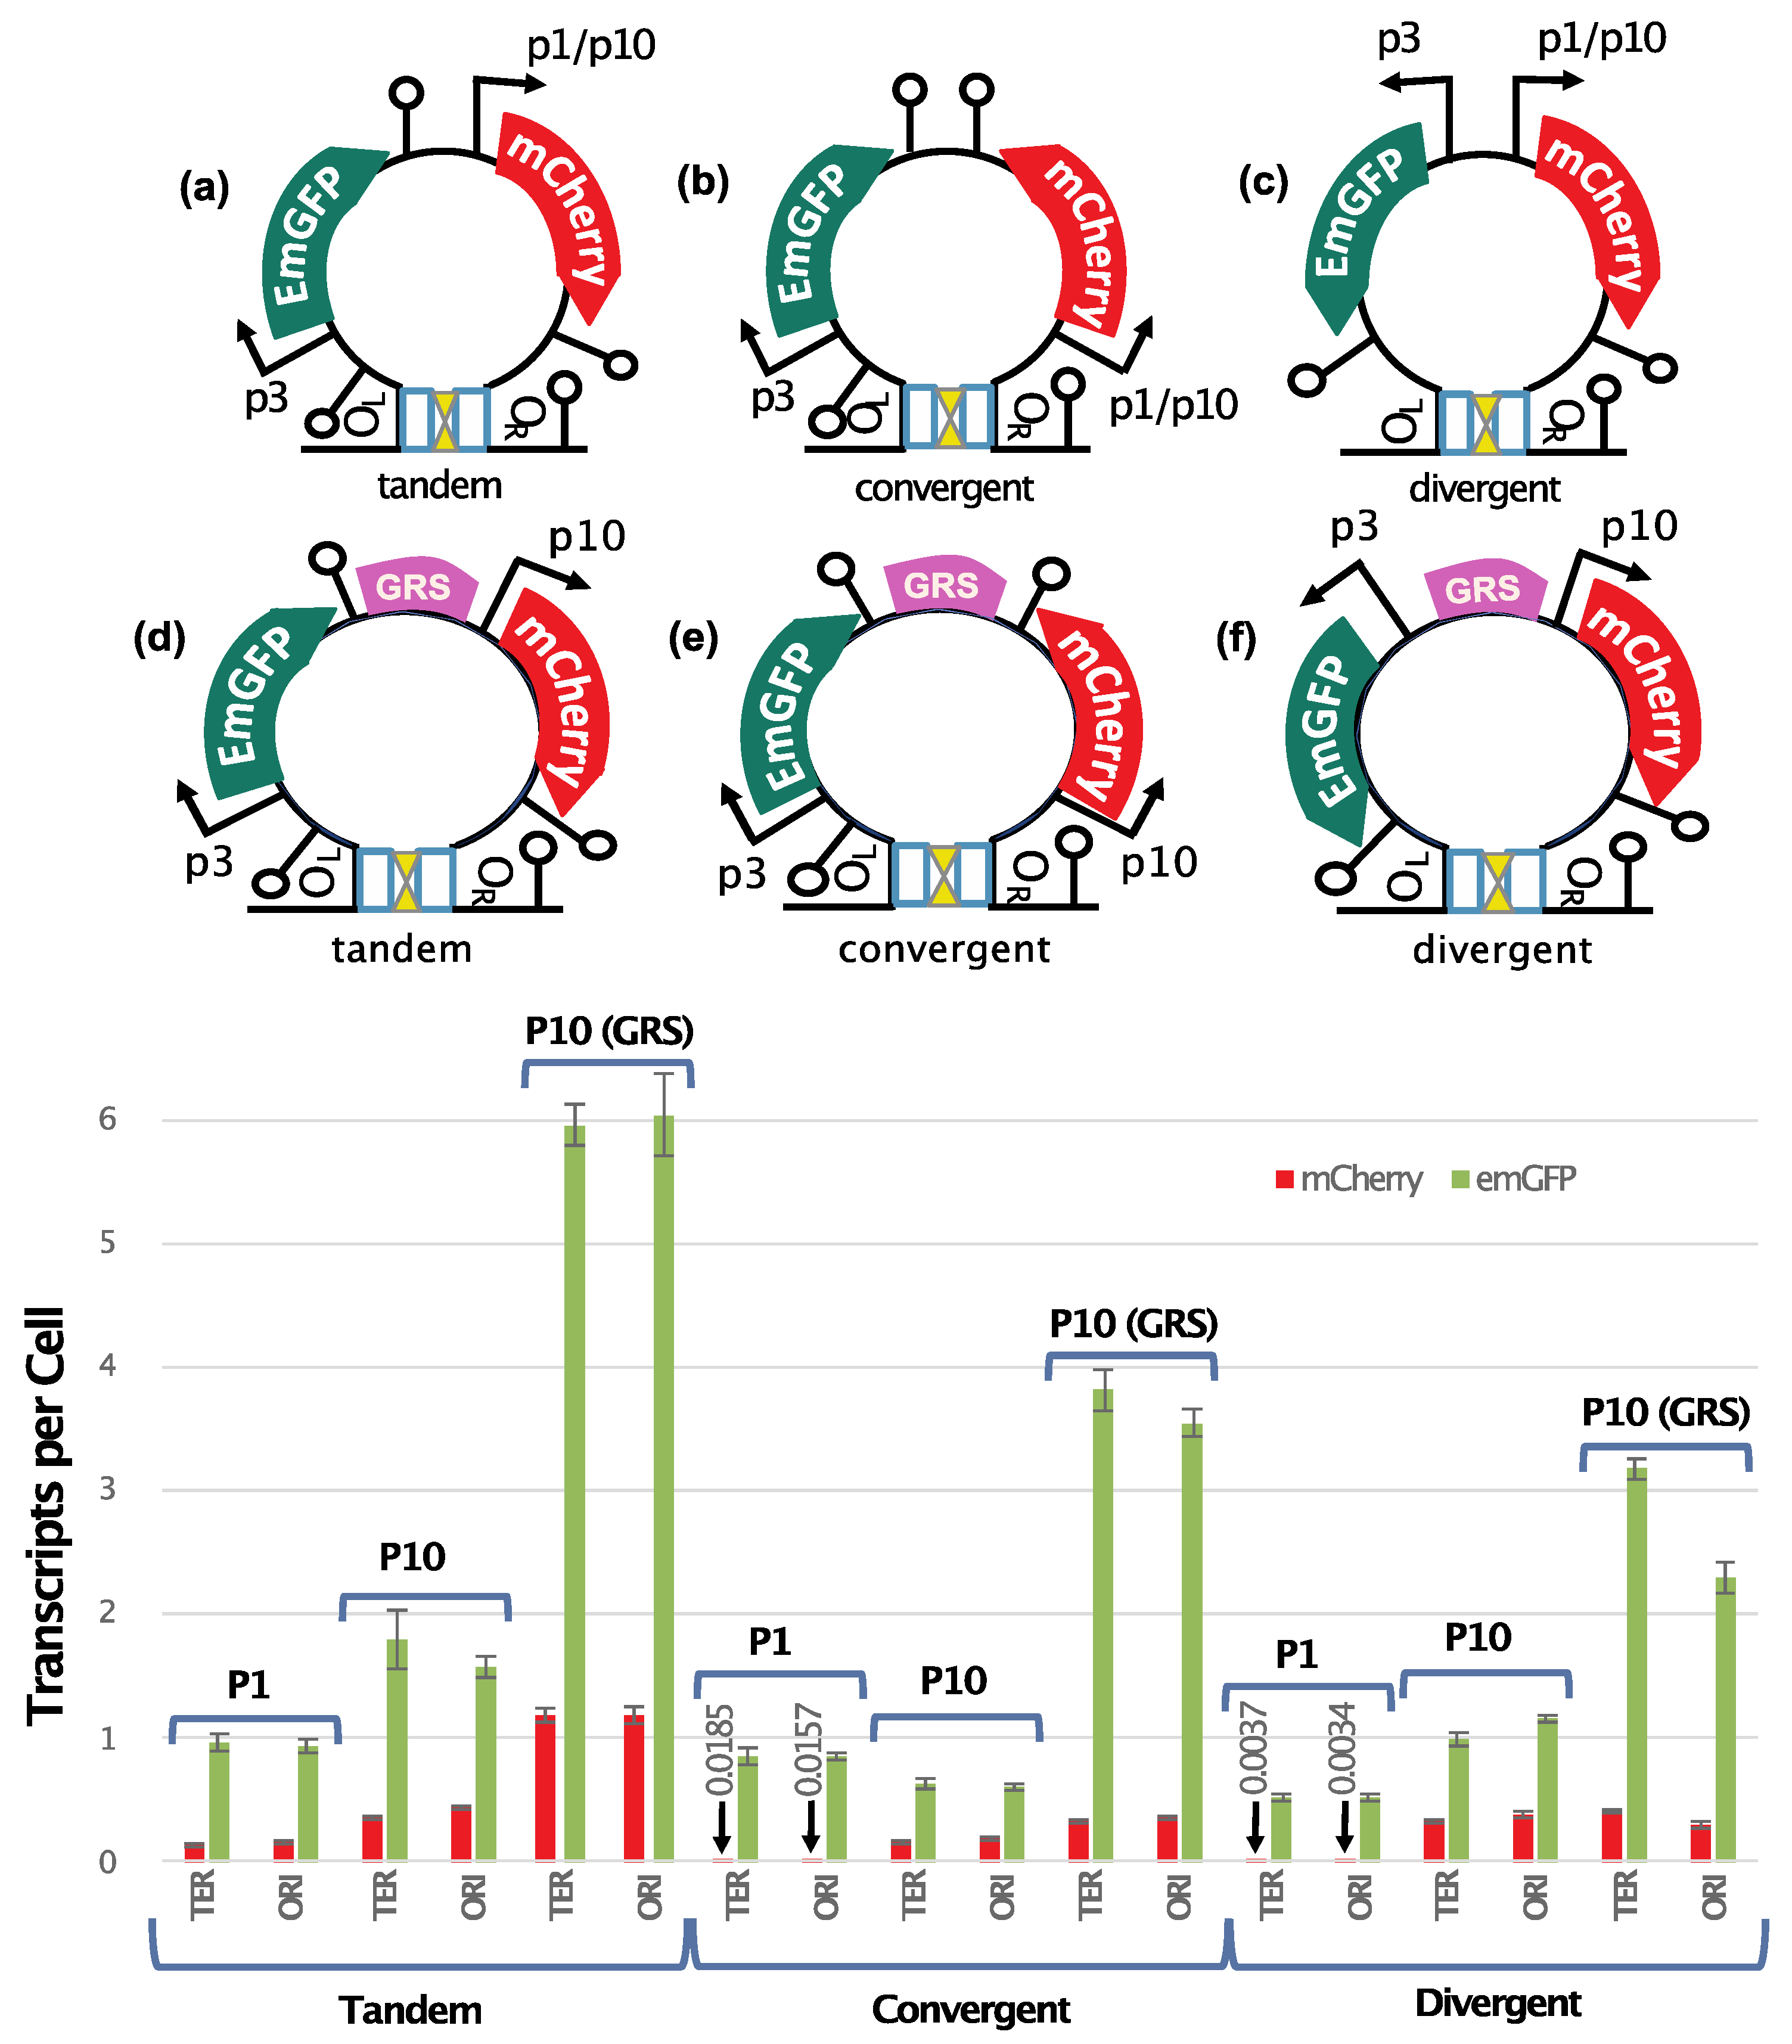
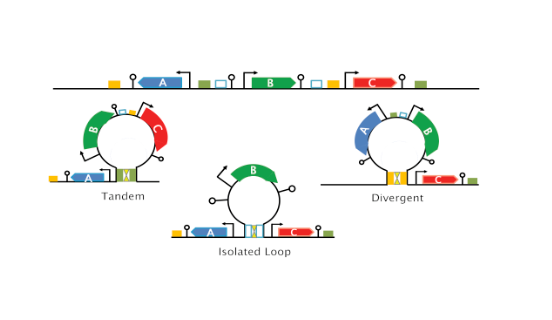
Figure 5.
Model of bacterial epigenetic regulation. This diagram illustrates how alternate DNA looping (through the action of different DNA binding proteins that bridge distant DNA regions) within a genomic domain would be expected to result in different transcript levels for the “B” gene.
Figure 5.
Model of bacterial epigenetic regulation. This diagram illustrates how alternate DNA looping (through the action of different DNA binding proteins that bridge distant DNA regions) within a genomic domain would be expected to result in different transcript levels for the “B” gene.
Disclaimer/Publisher’s Note: The statements, opinions and data contained in all publications are solely those of the individual author(s) and contributor(s) and not of MDPI and/or the editor(s). MDPI and/or the editor(s) disclaim responsibility for any injury to people or property resulting from any ideas, methods, instructions or products referred to in the content. |
© 2024 by the authors. Licensee MDPI, Basel, Switzerland. This article is an open access article distributed under the terms and conditions of the Creative Commons Attribution (CC BY) license (http://creativecommons.org/licenses/by/4.0/).
Copyright: This open access article is published under a Creative Commons CC BY 4.0 license, which permit the free download, distribution, and reuse, provided that the author and preprint are cited in any reuse.


